1. Introduction
In recent years, the correlation between energy and water has been investigated. These natural resources (energy and water) are essential for each other, for example, energy system conversion needs water, and electrical energy is necessary for water treatment or transport. This tie is named the energy–water nexus [
1,
2,
3,
4].
As is known, all natural resources (including water) are limited and are distributed in a non-uniform way around the world. For these reasons, the continuous growth of population and economic prosperity, if not carefully controlled, could be causes of conflicts and political instabilities in the future.
The latest FAO’s (Food and Agriculture Organization) report estimates that population increase will cause a proportional demand for food; in particular, the agricultural sector will withdraw more water [
5]. However, regarding the energy sector, over 1.3 billion people that live in Africa and East Asia do not use electricity [
6], World Energy Council said that BRICS country, as China and Brazil, will double energy consumption and underlined another interesting aspect that is Africa’s energy production will increase seven times the current value. The main concern is that developing countries will use conventional sources (oil, gas, or coal) to generate electricity, so the demand for water will rapidly increase [
7].
These studies underline that water is fundamental in every energy sector, for example, in the electrical power production, the cultivation of biomass, the processing of mineral resources, and the extraction of fossil fuels.
Water is a basic source for the irrigation of biofuels crops, and it is necessary for cooling and other systems connected to thermal power plants.
Accordingly, energy usage requires considerable amounts of water, with the risk that industrial processes could contaminate or damage the environment through the loss of pollutants and the release of large amounts of waste heat that alters the temperature in the surrounding environment.
The global water demand is expected to grow significantly in every water-dependent sector, proportionally with population growth. Hence, we shall consider possible future concerns related to the demand of water: pumping and treatment. If we analyze the cleaning and sanitizing processes, desalination represents the technological water process with the greatest energy consumption.
To desalinize in general means to remove salt [
8] from seawater or saline water, and the nearly inexhaustible sources are the oceans. The cost of seawater desalination is ten times that of other water treatment methods, so it is important to underline that desalination is a good choice if we do not have other possibilities. The International Desalination Association is studying possible innovative ways to reduce energy costs. Initially, their goal was a 20% energy reduction by last year, but the current economic conditions delayed the achievement of this goal.
The desalination process can be considered a valid solution in those areas characterized by limited fresh water and a significant availability of brackish water or seawater. Several works describe a possible integration of renewable energy systems and desalination plants. In particular, Rodrígues [
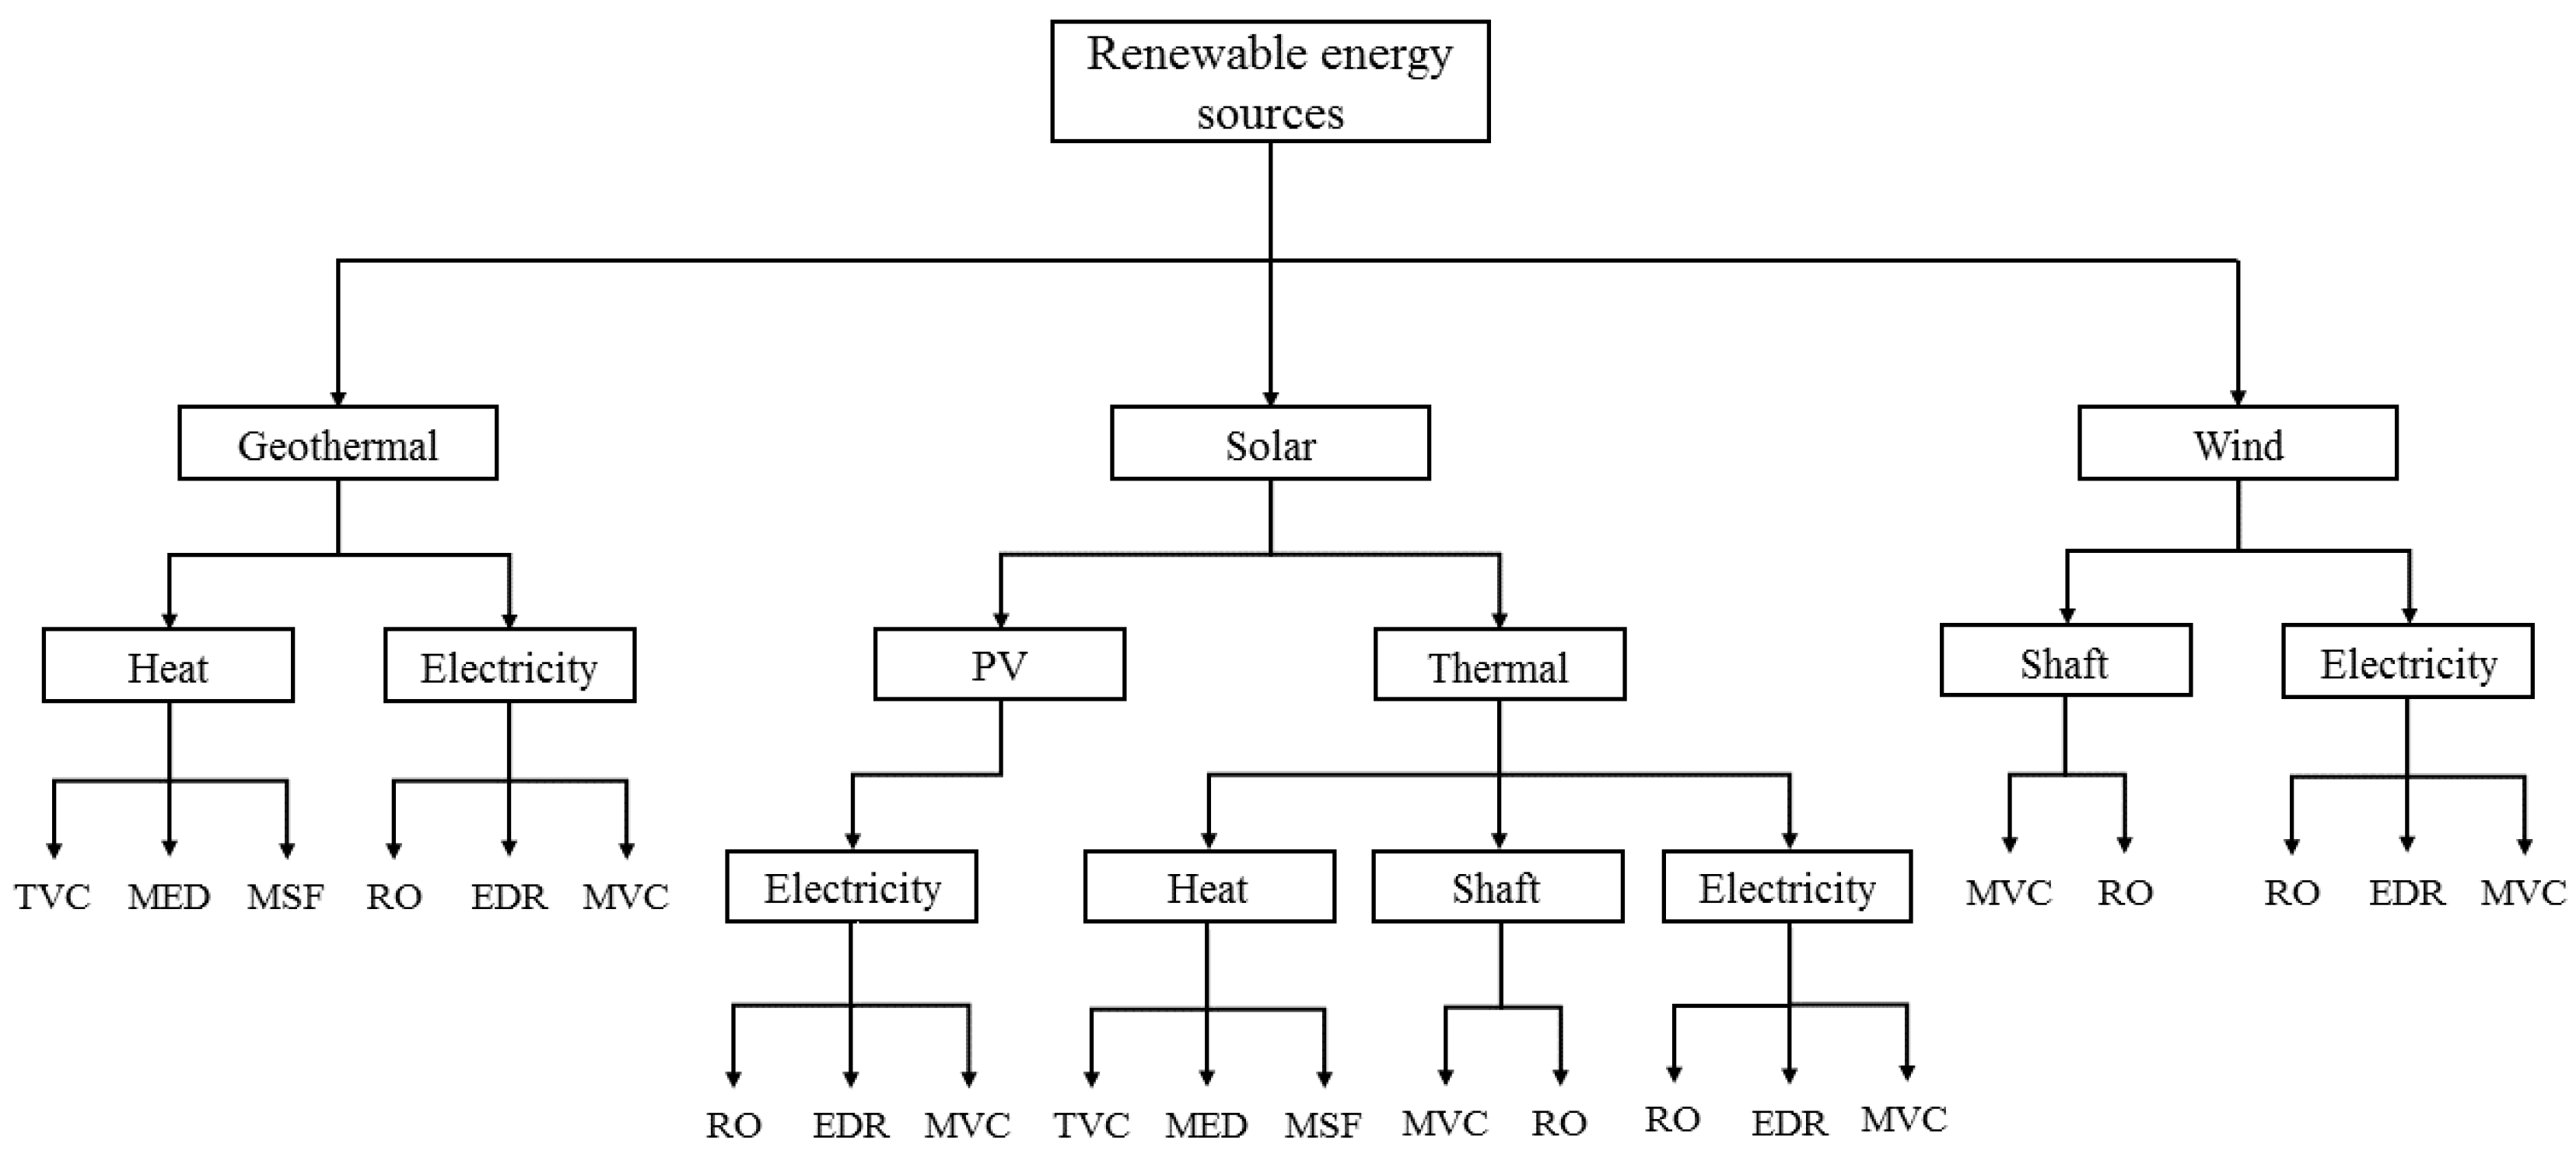
9] described the technologies currently used: multistage flash distillation (MSF), multieffect distillation (MED), thermal vapor compressors (TVC), mechanical vapor compression (MVC), reverse osmosis (RO), and electrodialysis reversal (EDR).
The operating parameters of MSF and MED are temperature and pressure, which decrease in various steps [
9].
RO uses a semipermeable membrane to separate water from the dissolved salts, thanks to the pressure gradient applied to the two sides of the membrane. In this way, only the electrical or shaft power is needed by the pumps to pressurize the hydraulic desalinating circuit.
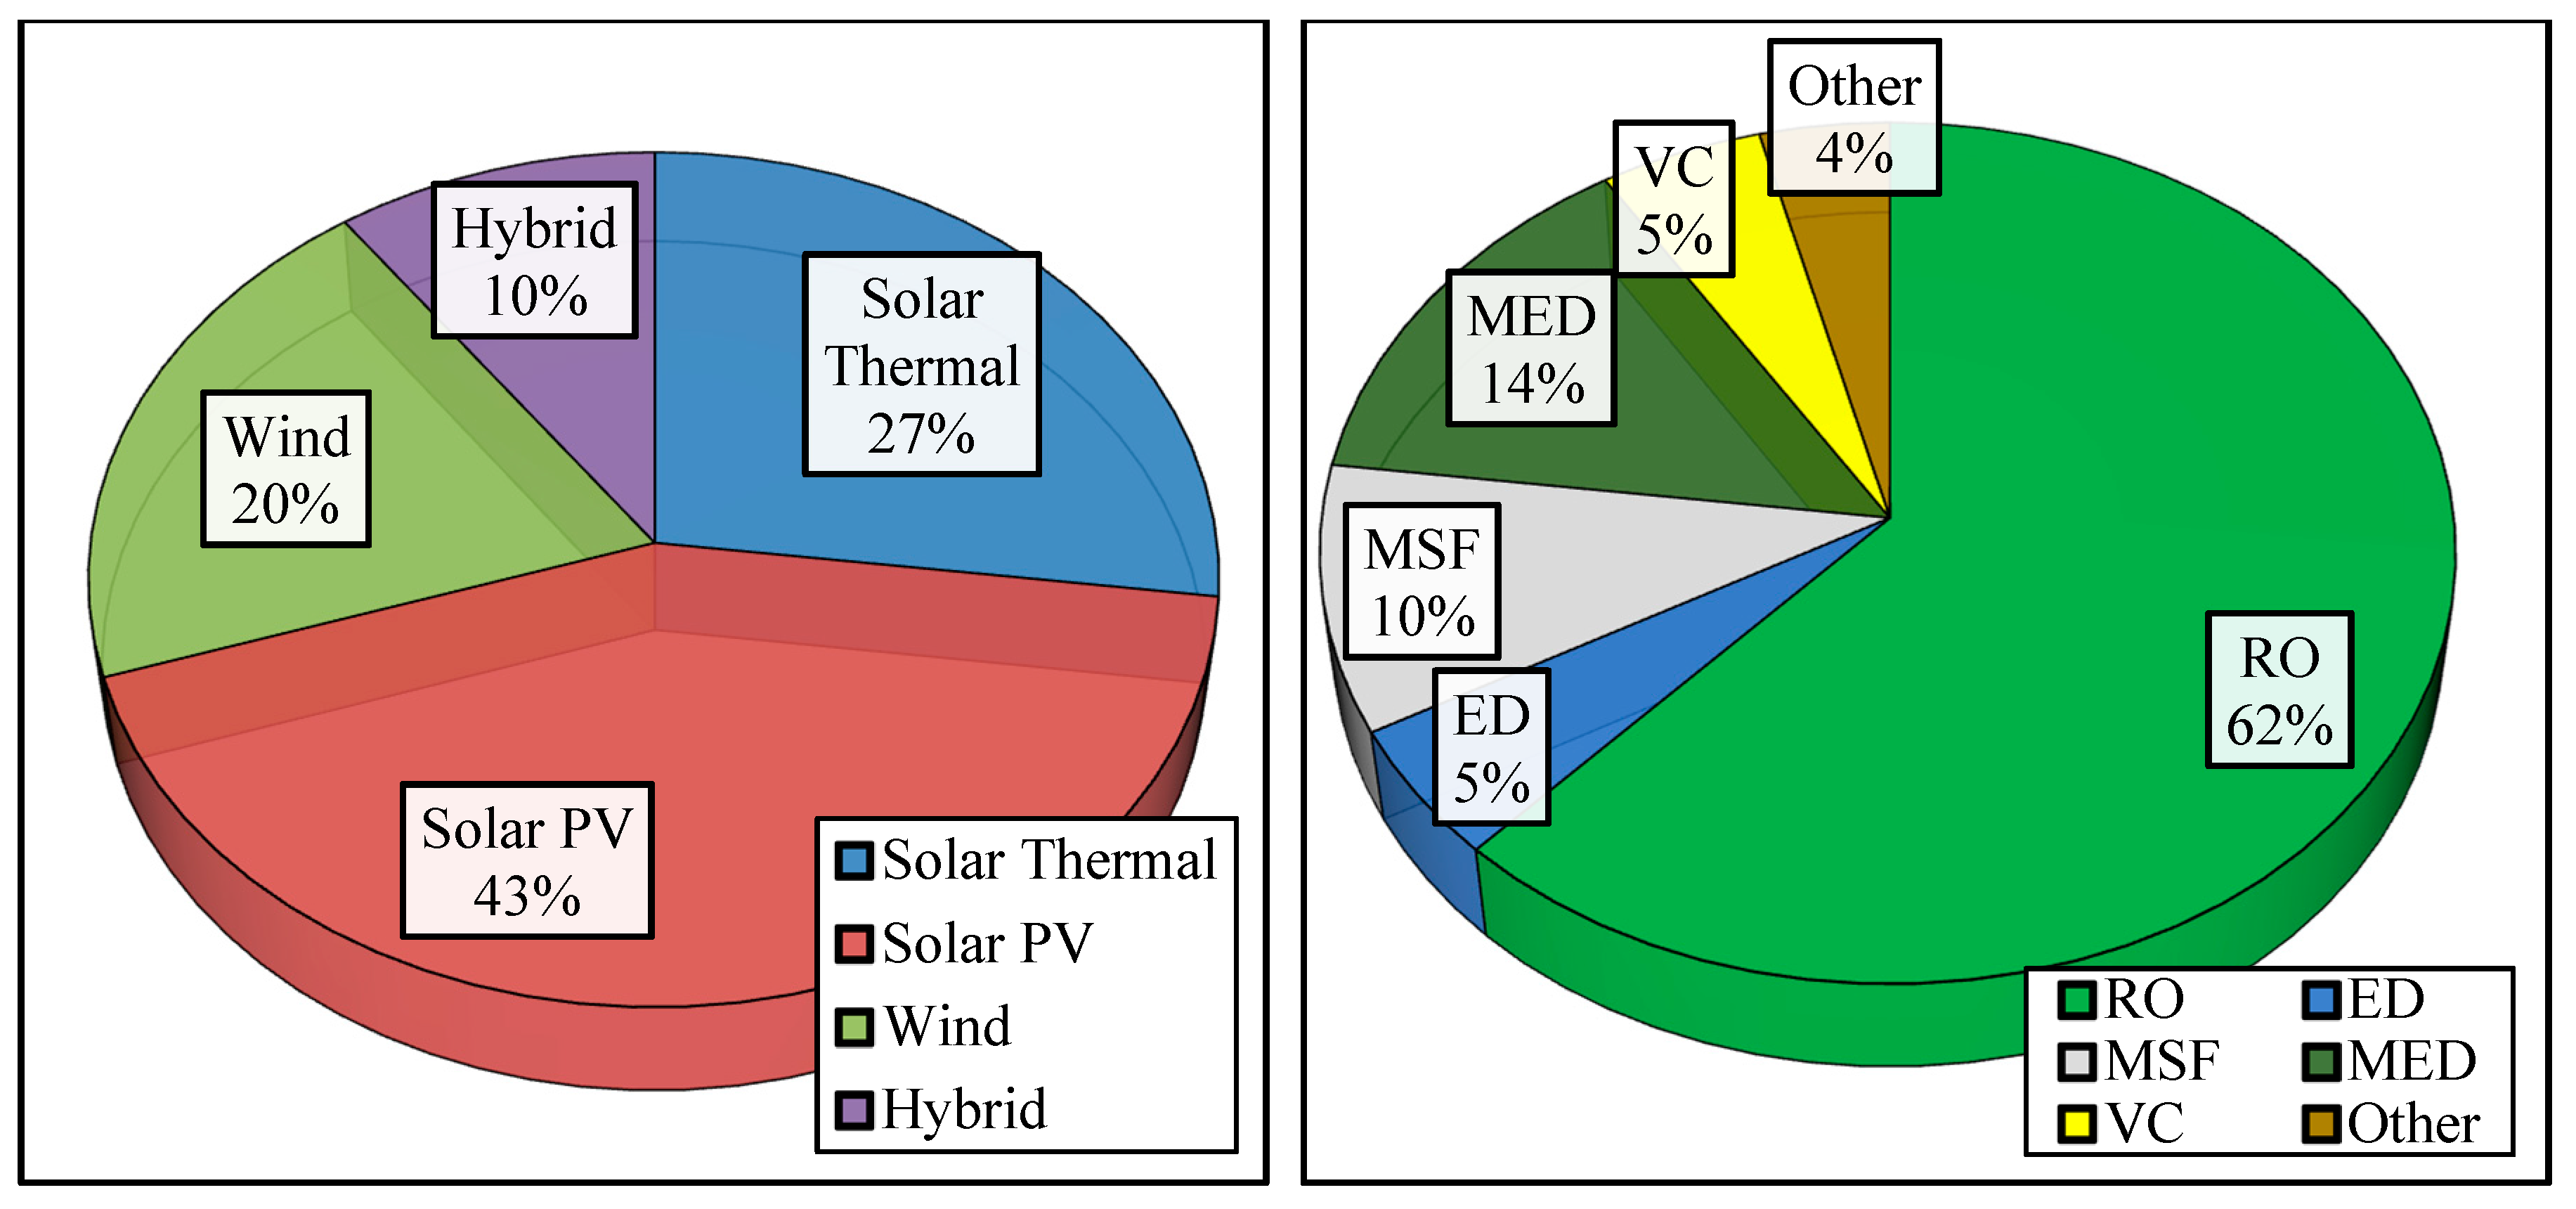
The main technologies currently used in desalination are MSF and RO, which represent respectively 44% and 42% of worldwide installed capacity. If we consider the technologies separately based on thermal processes and semipermeable membranes, the MSF is used more than 93% of the thermal production, while RO is used more than 88% of the membrane production [
9].
Recent research has investigated a possible integration between renewable energy sources and desalination technologies in order to produce fresh water in those arid areas where renewable energy resources are present. In this way, the environmental impact can be reduced. Among the renewable energy resources evaluated, we find wind, solar thermal, photovoltaic, and wave energy.
Alternative energy coupled with the desalination process can be divided into two classes: systems that use heat produced by RES (Renewable Energy Sources) and desalination processes that use electricity produced by the renewable energy system directly. These ideas are represented in
Figure 1 and
Figure 2.
The following section shows a brief summary of the possible integration between renewable sources and desalination technologies.
Solar thermal energy is the best choice for desalination; in fact, there are case studies and applications in the literature [
9], and we found two options: solar collectors and indirect solar desalination. The latter is made up of a normal desalination plant and solar thermal collectors. Pilot plants include as follows:
Gran Canaria, Spain: a 10 m3/day MSF plant driven by low-concentration solar collectors;
Al Azhar University in Gaza: a small experimental pilot plant, an MSF of four stages, driven by solar thermal collectors and PV cells to drive auxiliary equipment.
Photovoltaic technology can be coupled with RO and EDR systems. The main disadvantage is the high cost of photovoltaic modules. The extent of the cost depends on local characteristics (solar radiation of the site and the distance of the electricity grid).
Desalination plants with EDR driven by photovoltaic devices are more suitable than RO for brackish water desalination in far-off sites. There are many applications in Indonesia, Mexico, and Lampedusa.
Another possible solution is the use of biomass with desalination technologies based on thermal processes [
12,
13]. For example, Sahoo et al. [
14] suggested a poly-generation plant able to produce electricity, cooling/heating, and desalinated water using solar and biomass.
Wind power and the RO process is another solution for coastal or island areas with high wind potential. Kalogirou [
15] suggested another possibility of coupling between a RO desalinating unit and wind or geothermal sources. In particular, this research was developed by the Canary Islands Technological Institute. In this study, the possibility of directly coupling wind turbines with MVC and EDR desalinating units was investigated [
15].
As regards the geothermal source, this kind of energy can be exploited according to the temperature of the local geothermal source. The underground heat is usually extracted by using heat exchangers, realized with a special alloy in order to ensure a long durability and allow heat transfer. Low temperature geothermal resources (within a 100 m depth) can be used as a heat source for desalination technologies based on thermal processes. In the case of high temperature resources, a geothermal power plant can be realized, producing the mechanical power required by pumps in RO desalination units. Furthermore, special membranes have been developed to use the geothermal brines directly for desalination, with a working temperature of about 60 °C [
15].
Finally, sea wave is another interesting renewable resource usable in the desalination sector. As is known in the literature, oceans have several types of energy: thermal gradient, saline gradient, tides, and waves. Several systems, able to use waves or tides to produce electrical energy, are currently in development. In this way, it is possible to use the energy enclosed in the oceans in the desalination process. This source presents several advantages, including the availability of a more regular production compared to wind, the absence of soil consumption for energy converter installation, and the great energy potential, especially on small islands.
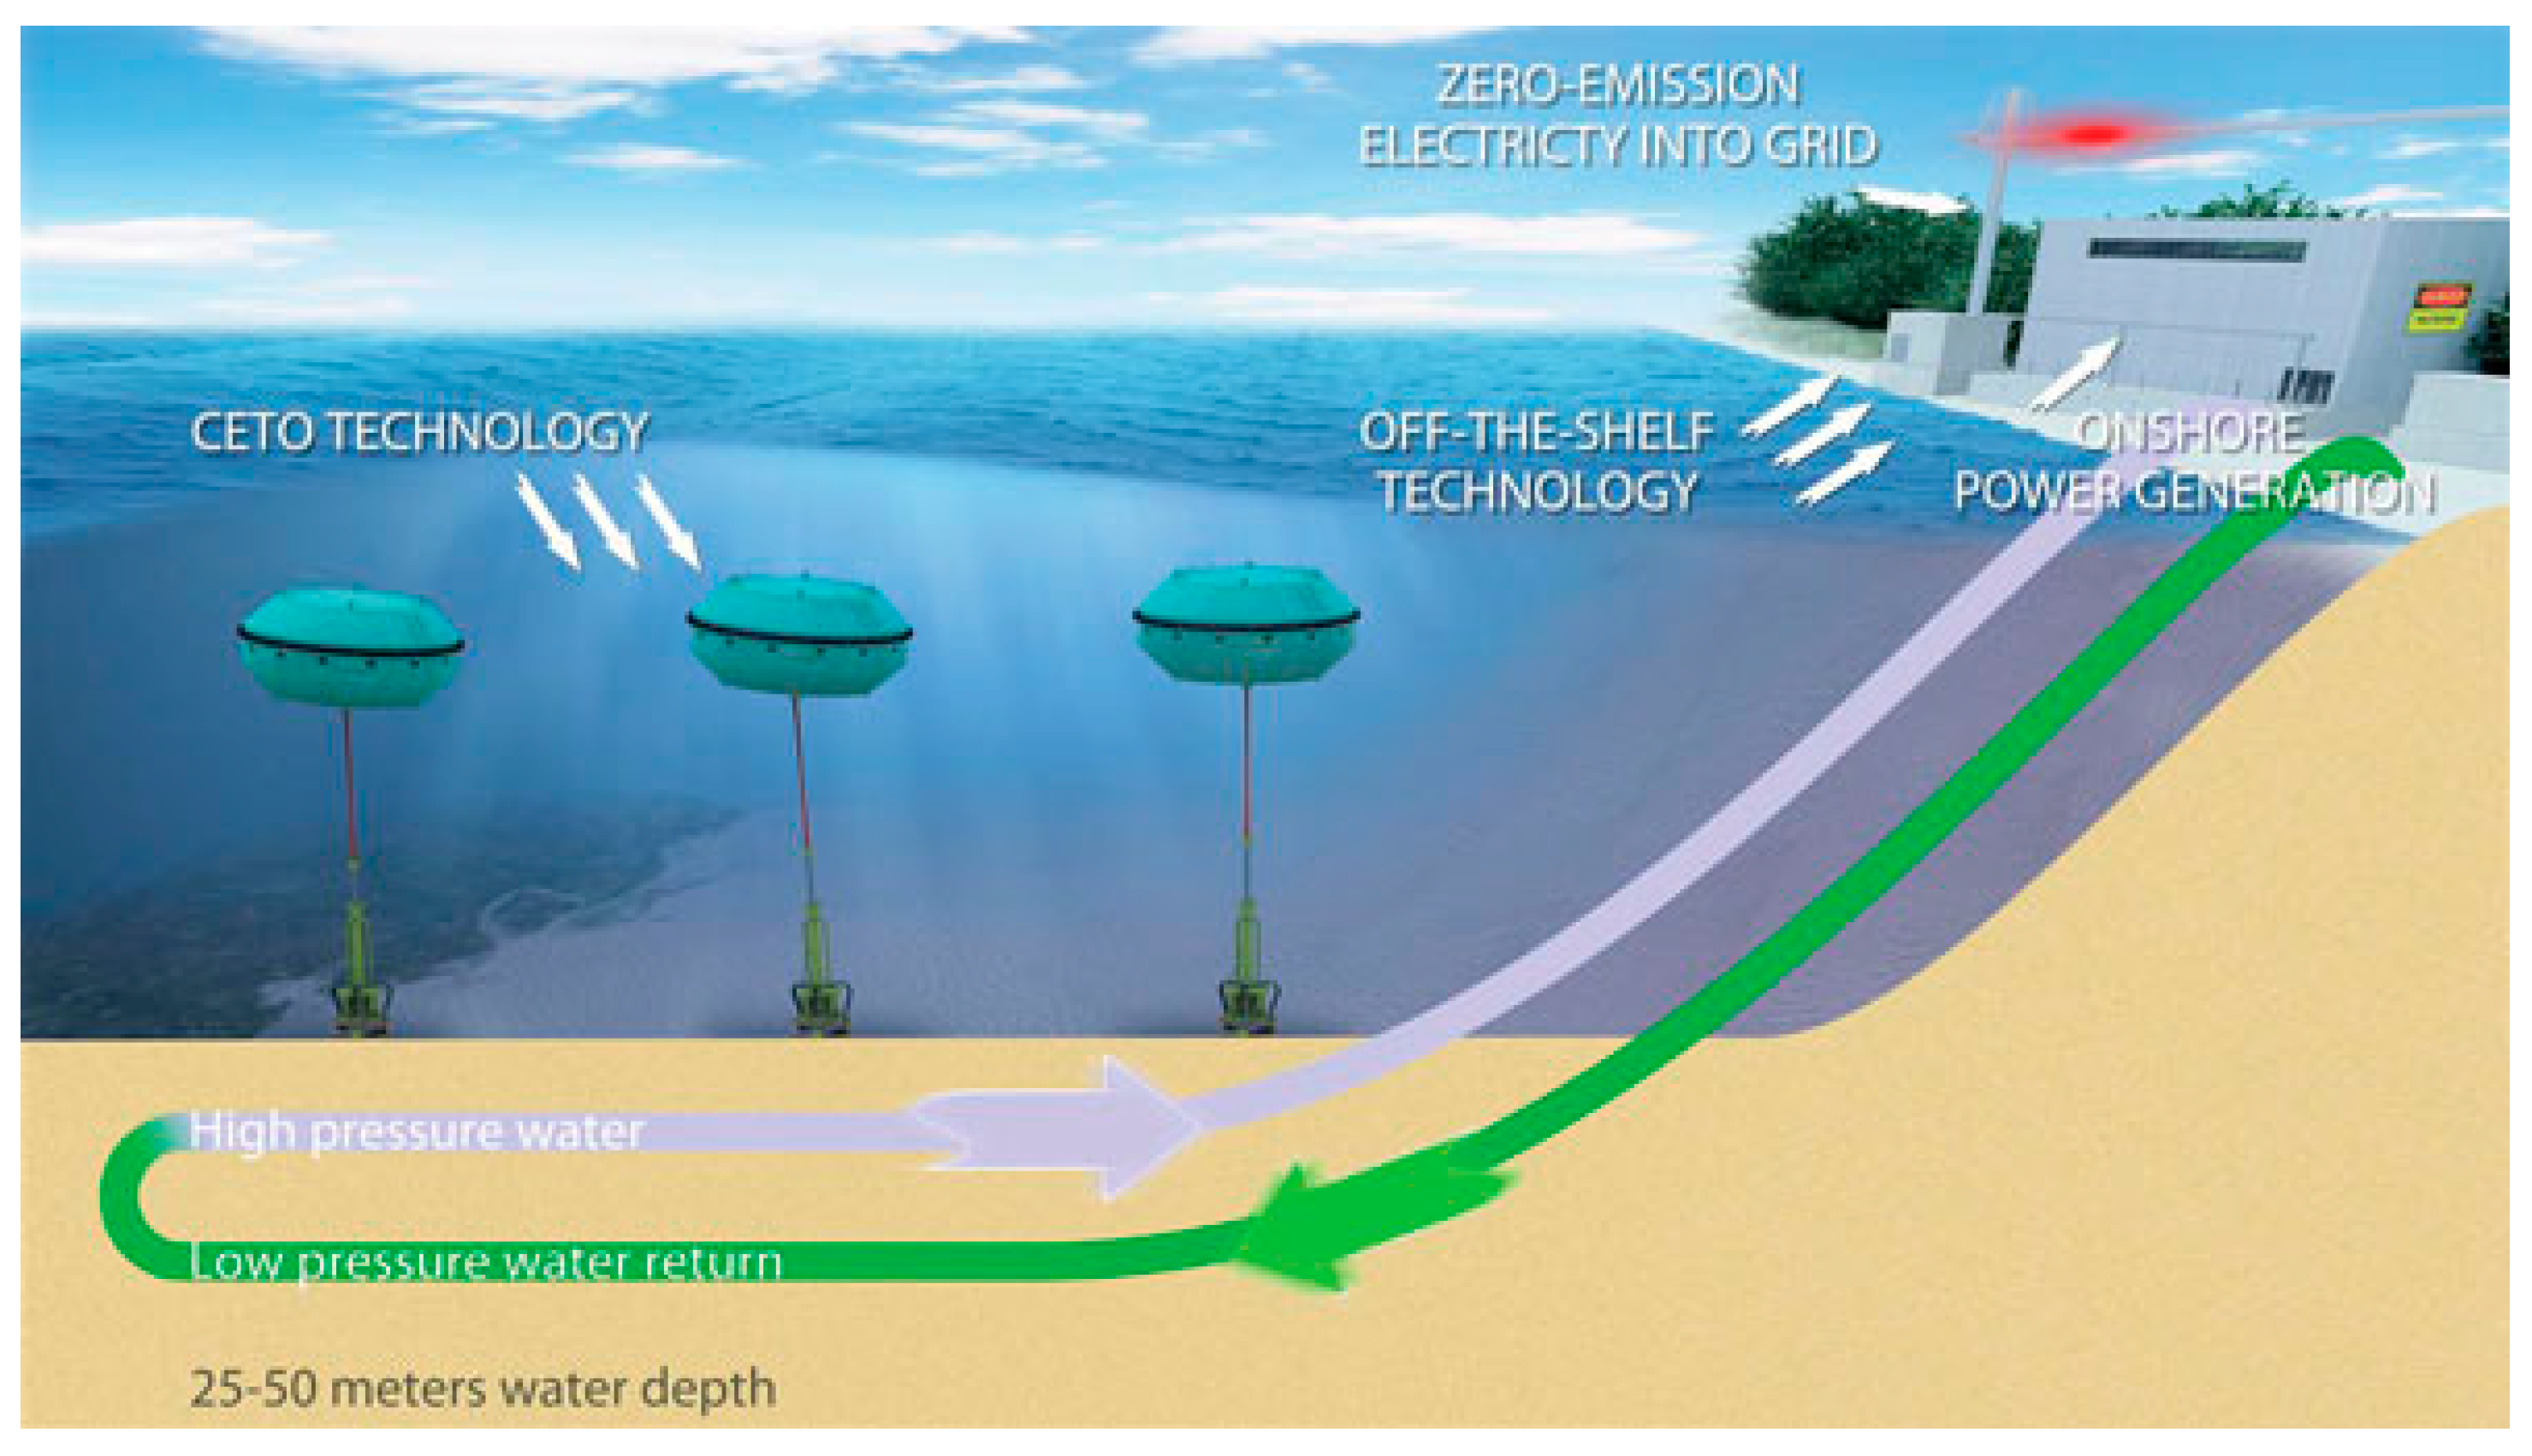
An example of a desalination pilot plant (DPP) based on wave source is currently installed on Garden Island, in the Western part of Australia. This system has been developed as a continuation of the Perth Project realized by Carnegie Wave Energy Limited. The first device is called
CETO, the same name of a primordial sea goddess in Greek mythology. This system uses several buoys in order to exploit the sea wave energy to pump the seawater into a RO desalination plant producing fresh water, with a production capacity of about 150 m
3/day.
Figure 3 illustrates the whole scheme [
16].
According to Mathioulakis et al. [
11], renewable energy systems that drive desalination processes are the optimum under specific conditions; in particular, logistic and geographical variables influence the choice. The authors underline the importance of local infrastructure (distance to electricity grid) and the energy cost that must be cheaper.
As mentioned above, the desalination process is the water treatment that requires the greatest energy demand; nevertheless, it appears as a valid solution in the region characterized by a limited presence of fresh water and the availability of brackish ater. The aim of this paper is to evaluate the coupling of this industrial process with renewable energy sources. In particular, we focus our attention on the Sicilian region.
Rizzuti et al. [
9] and Beccali et al. [
10] studied a possible application in Sicily. In fact, at the end of the twentieth century, the problem of drought had significantly affected Sicily, giving rise to the construction of a number of desalination plants for civil, agricultural, and industrial uses.
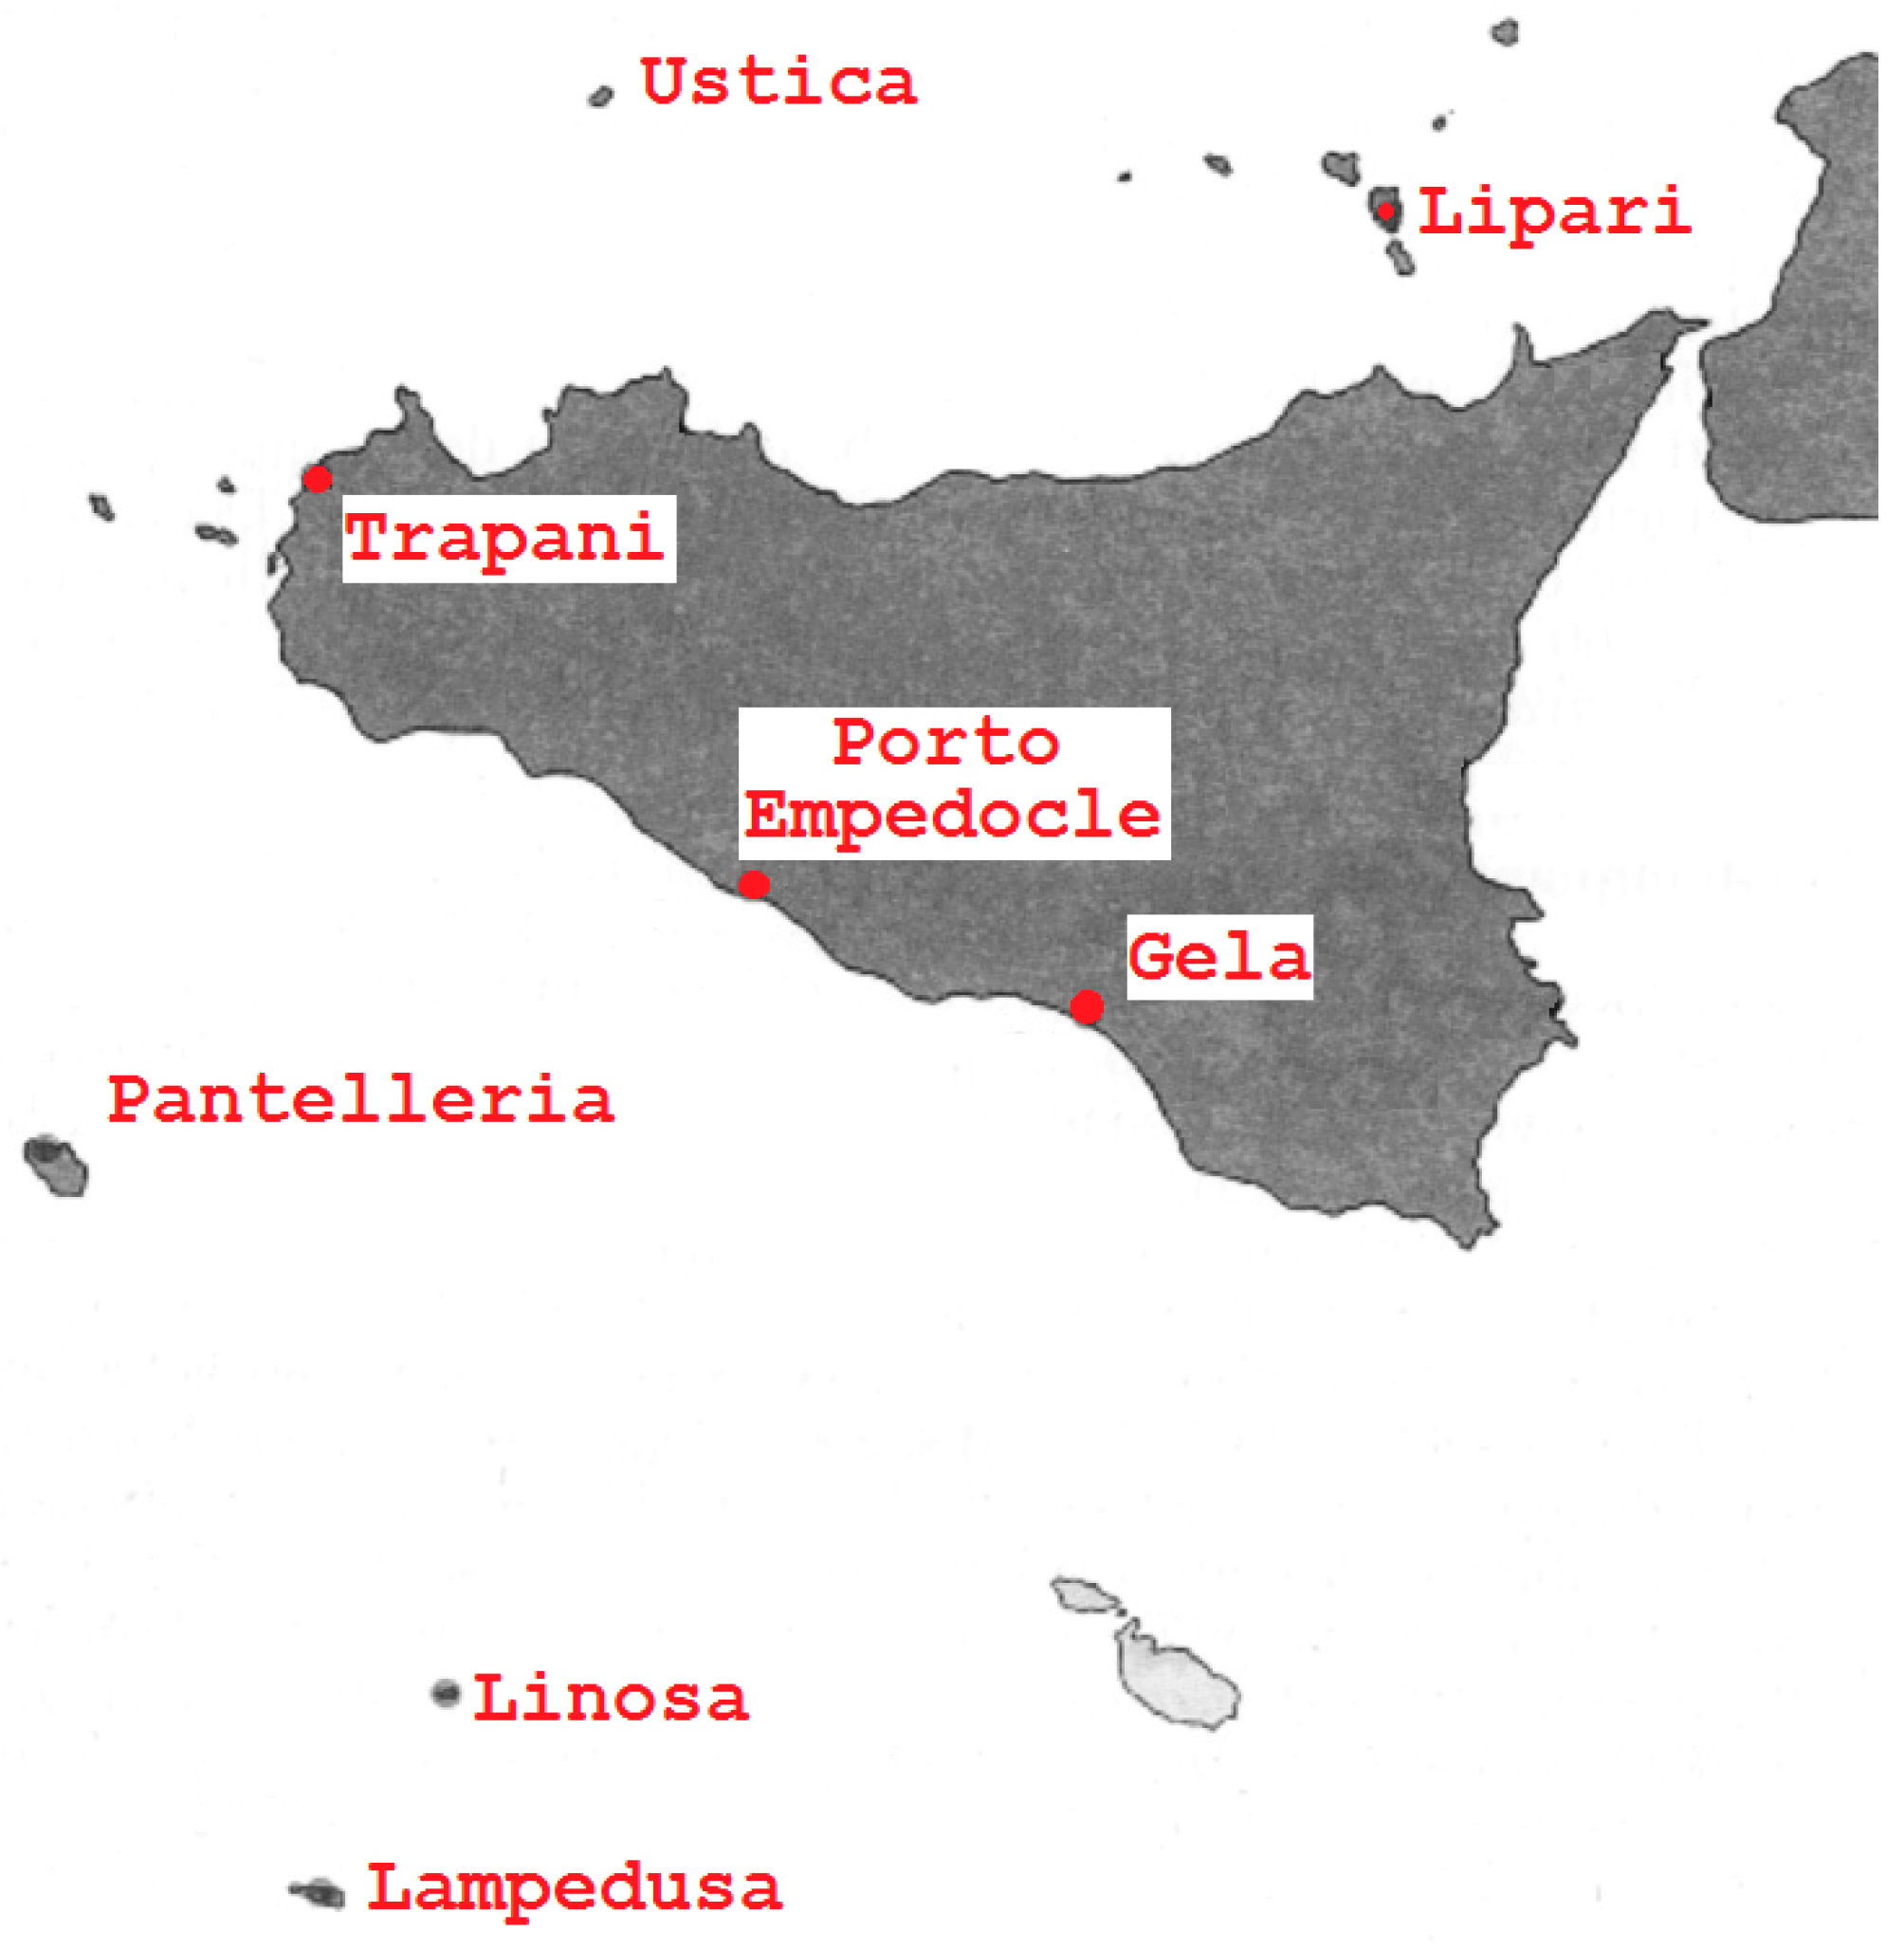
The problem of a limited presence of water affected the southern part of Sicily in particular due to the main direction of winds and mountain chains in the internal part of the island [
9]. In order to combat the reduction of fresh water, eight desalination plants were installed in Sicily and smaller islands. The first two plants started in Gela and Porto Empedocle in 1974. Other plants are currently installed in Trapani and on the smaller islands of Lampedusa, Linosa, Pantelleria, Ustica, and Lipari [
10].
The main aim of this paper is the presentation of a new sustainable application of wave energy to the desalination process. Firstly, we evaluate the sea wave energy potential in the Mediterranean Sea and fresh water production of desalination plants installed in Sicily and smaller islands. As a case study, we evaluate the installation of a wave farm, based on a prototype realized by Department of Energy of Palermo University, in order to satisfy the energetic demand of the desalination plants installed in Pantelleria, a small Sicilian island. An economic and environmental evaluation is then presented.
2. Sea Wave Energy Potential and Desalination Plant in Sicily
Sea waves are considered one of the most interesting renewable sources related to the oceans [
17]. It is believed that the wave energy sector will show significant development. Several studies have investigated the realization of wave energy converters (WECs), i.e., devices able to convert sea wave energy to a useful output. Different kinds of technologies have been investigated and tested [
18], but full scale devices, ready for commercialization, have not yet been realized [
19].
The research about wave energy systems started in countries surrounded by oceans, due to their higher energy potential. In Europe, several studies and installations of pilot plants have been concentrated along the Atlantic coasts, in countries such as the UK, Ireland, Norway, Spain, and Portugal [
20].
Obviously, the availability of the wave source is the first parameter used to choose the best sites useful for the development of WEC technology. However, higher sea wave energy potential is usually related to the presence of extreme wave conditions, which pose serious problems in design and development WEC systems, with an inevitable increase in cost. Considering that wave energy production is mainly related to the average wave climate at the site of installation, the oversizing of these WECs cannot be compensated by effective energy conversion.
On the other hand, accepting the lower energy potential of a calmer and semi-closed sea, such as the Mediterranean Sea, the design and development processes are simplified, thanks to the less powerful sea states during storms. In this way, the building and operative costs of WECs can be reduced [
21].
Several studies investigated sea wave energy potential in the Mediterranean Sea. For example, Iglesias et al. evaluated the energy potential along the Spanish coasts [
22], Guillou and Chapalain along the French coasts [
23], and Vicinanza et al. along the Italian coasts [
24].
Wave energy production can be a great opportunity for countries such as Italy that have a long coastline. Before the installation of a wave farm, a complete study of feasibility is required. These analyses are based on the temporal and spatial variability of the energy source, in order to properly size the wave converter and choose the best positioning for the wave farm, maximizing the energy production.
In the last decade, a large amount of information was collected by installing measuring buoys along the Italian coasts. In this way, wave atlases have been created, showing the distribution of the wave energy potential along the Italian coastline [
25].
However, time series obtained from wave buoys describe wave climate only locally and often present large data gaps caused by temporary malfunctions of the buoy or by maintenance operations. The main properties that characterize the sea states are the significant wave height, , and the peak period, . These parameters generally do not show significantly steep spatial gradients in the open ocean, but substantial spatial variations are observed in the enclosed sea.
The sea wave phenomenon is deeply related to the bathymetry in the area where the measuring buoy is installed: typically, a deeper seabed reduces the friction force between waves and seabed, thus preserving the wave energy. Conversely, in shallow water, the wave energy is strongly dissipated. For this reason, the measuring buoy is generally located offshore, several kilometers from the coast.
The fetch is another important parameter that deeply influences wave energy potential. This parameter represents the distance over which the wind mainly blows. Clearly, a large fetch is related to a more intense and regular wave climate, due to the greater distance over which the wind energy is transferred to sea wave.
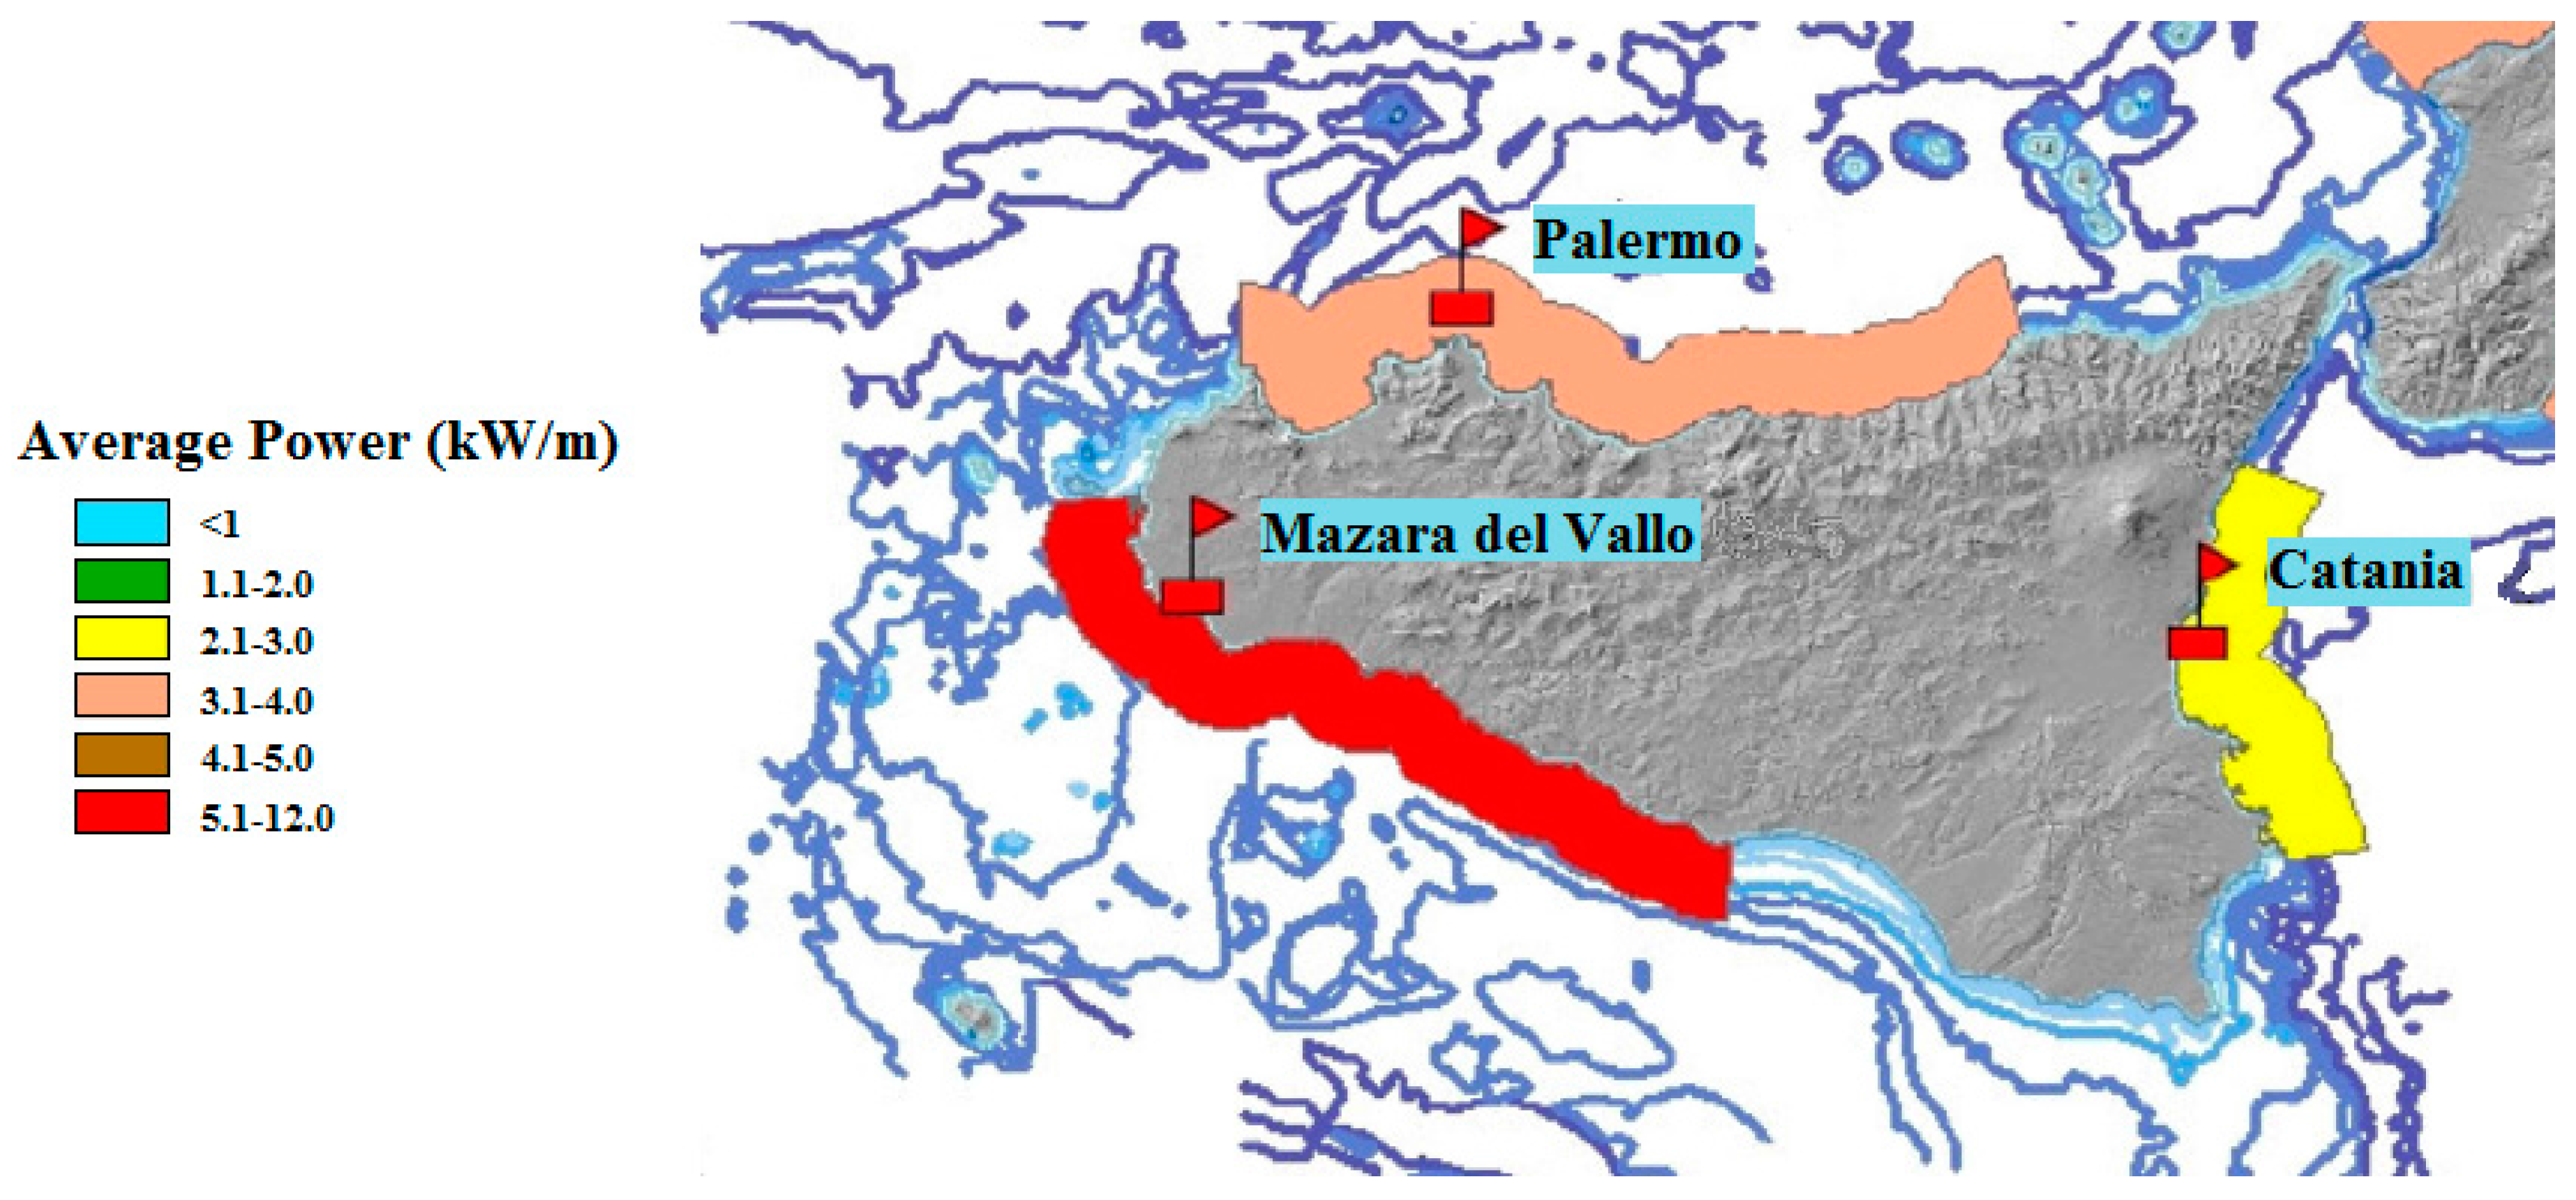
Focusing our attention on Sicily,
Figure 4 shows the wave energy potential along the Sicilian coasts. The red flags represent the measuring buoy.
In the figure, we can identify three main areas, each one characterized by a mean value of wave energy potential. In the northern part (Palermo), the wave energy potential ranges from 3.1 kW/m to 4 kW/m; in the eastern part (Catania), it ranges from 2.1 kW/m to 3 kW/m; finally, in the southwestern part (Mazara del Vallo), the wave potential is higher than 5.1 kW/m.
Using these data and applying a third generation wave model, wave power maps can be made. These charts are useful in determining the wave climate with great accuracy along the coasts. In this way, the individuation of the best sites for the wave exploitation is simplified, allowing the evaluation of electrical energy production after the sea wave energy converter is chosen.
A further instrument is the development of GIS technology (Geographic Information System), useful for the installation of a wave farm. In fact, this system overlaps with different kinds of data in a geographic map, such that all suitable sites for the installation of a wave farm, excluding protected areas, shipping lanes, fishing areas, etc., are individuated.
2.1. Methodology and Sicilian Wave Power Evaluation
In this paper, an in-depth analysis of the sea wave potential along the Sicilian coastline is carried out using a third generation ocean wave model and wave climate data, collected by measuring buoys similar to the DEIM Buoy [
26]. In particular, the wave atlas (the map that shows the wave energy potential) was produced from the enormous amount of data measured over a long period by several buoys of the “Rete Ondametrica Nazionale” (RON—National Wave Measuring Network). This project started in 1989 and at the beginning was composed of eight pitch-roll buoys, performing sampling every 3 h. In 2007, the measuring buoys were changed and other measuring points were added, bringing the number of measuring stations to 15 and performing the sampling every 30 min. In this way, the time resolution is improved, but the spatial resolution is still limited. The RON measures the typical wave parameters: significant wave height,
[m], average period,
[s], peak period,
[s], and average wave direction,
. Using some of the previous parameters, the wave power flux
in deep water can be evaluated using the following Equation (1) [
27]:
in which
is seawater density (equals to 1025 kg/m
3), and
represents the energetic period [s], equal to the peak period multiplied by a constant that depends on the shape of the wave spectrum (equal to 0.86 for a Pierson–Moskovitz spectrum and tending to 1 with the decrease in spectral width) [
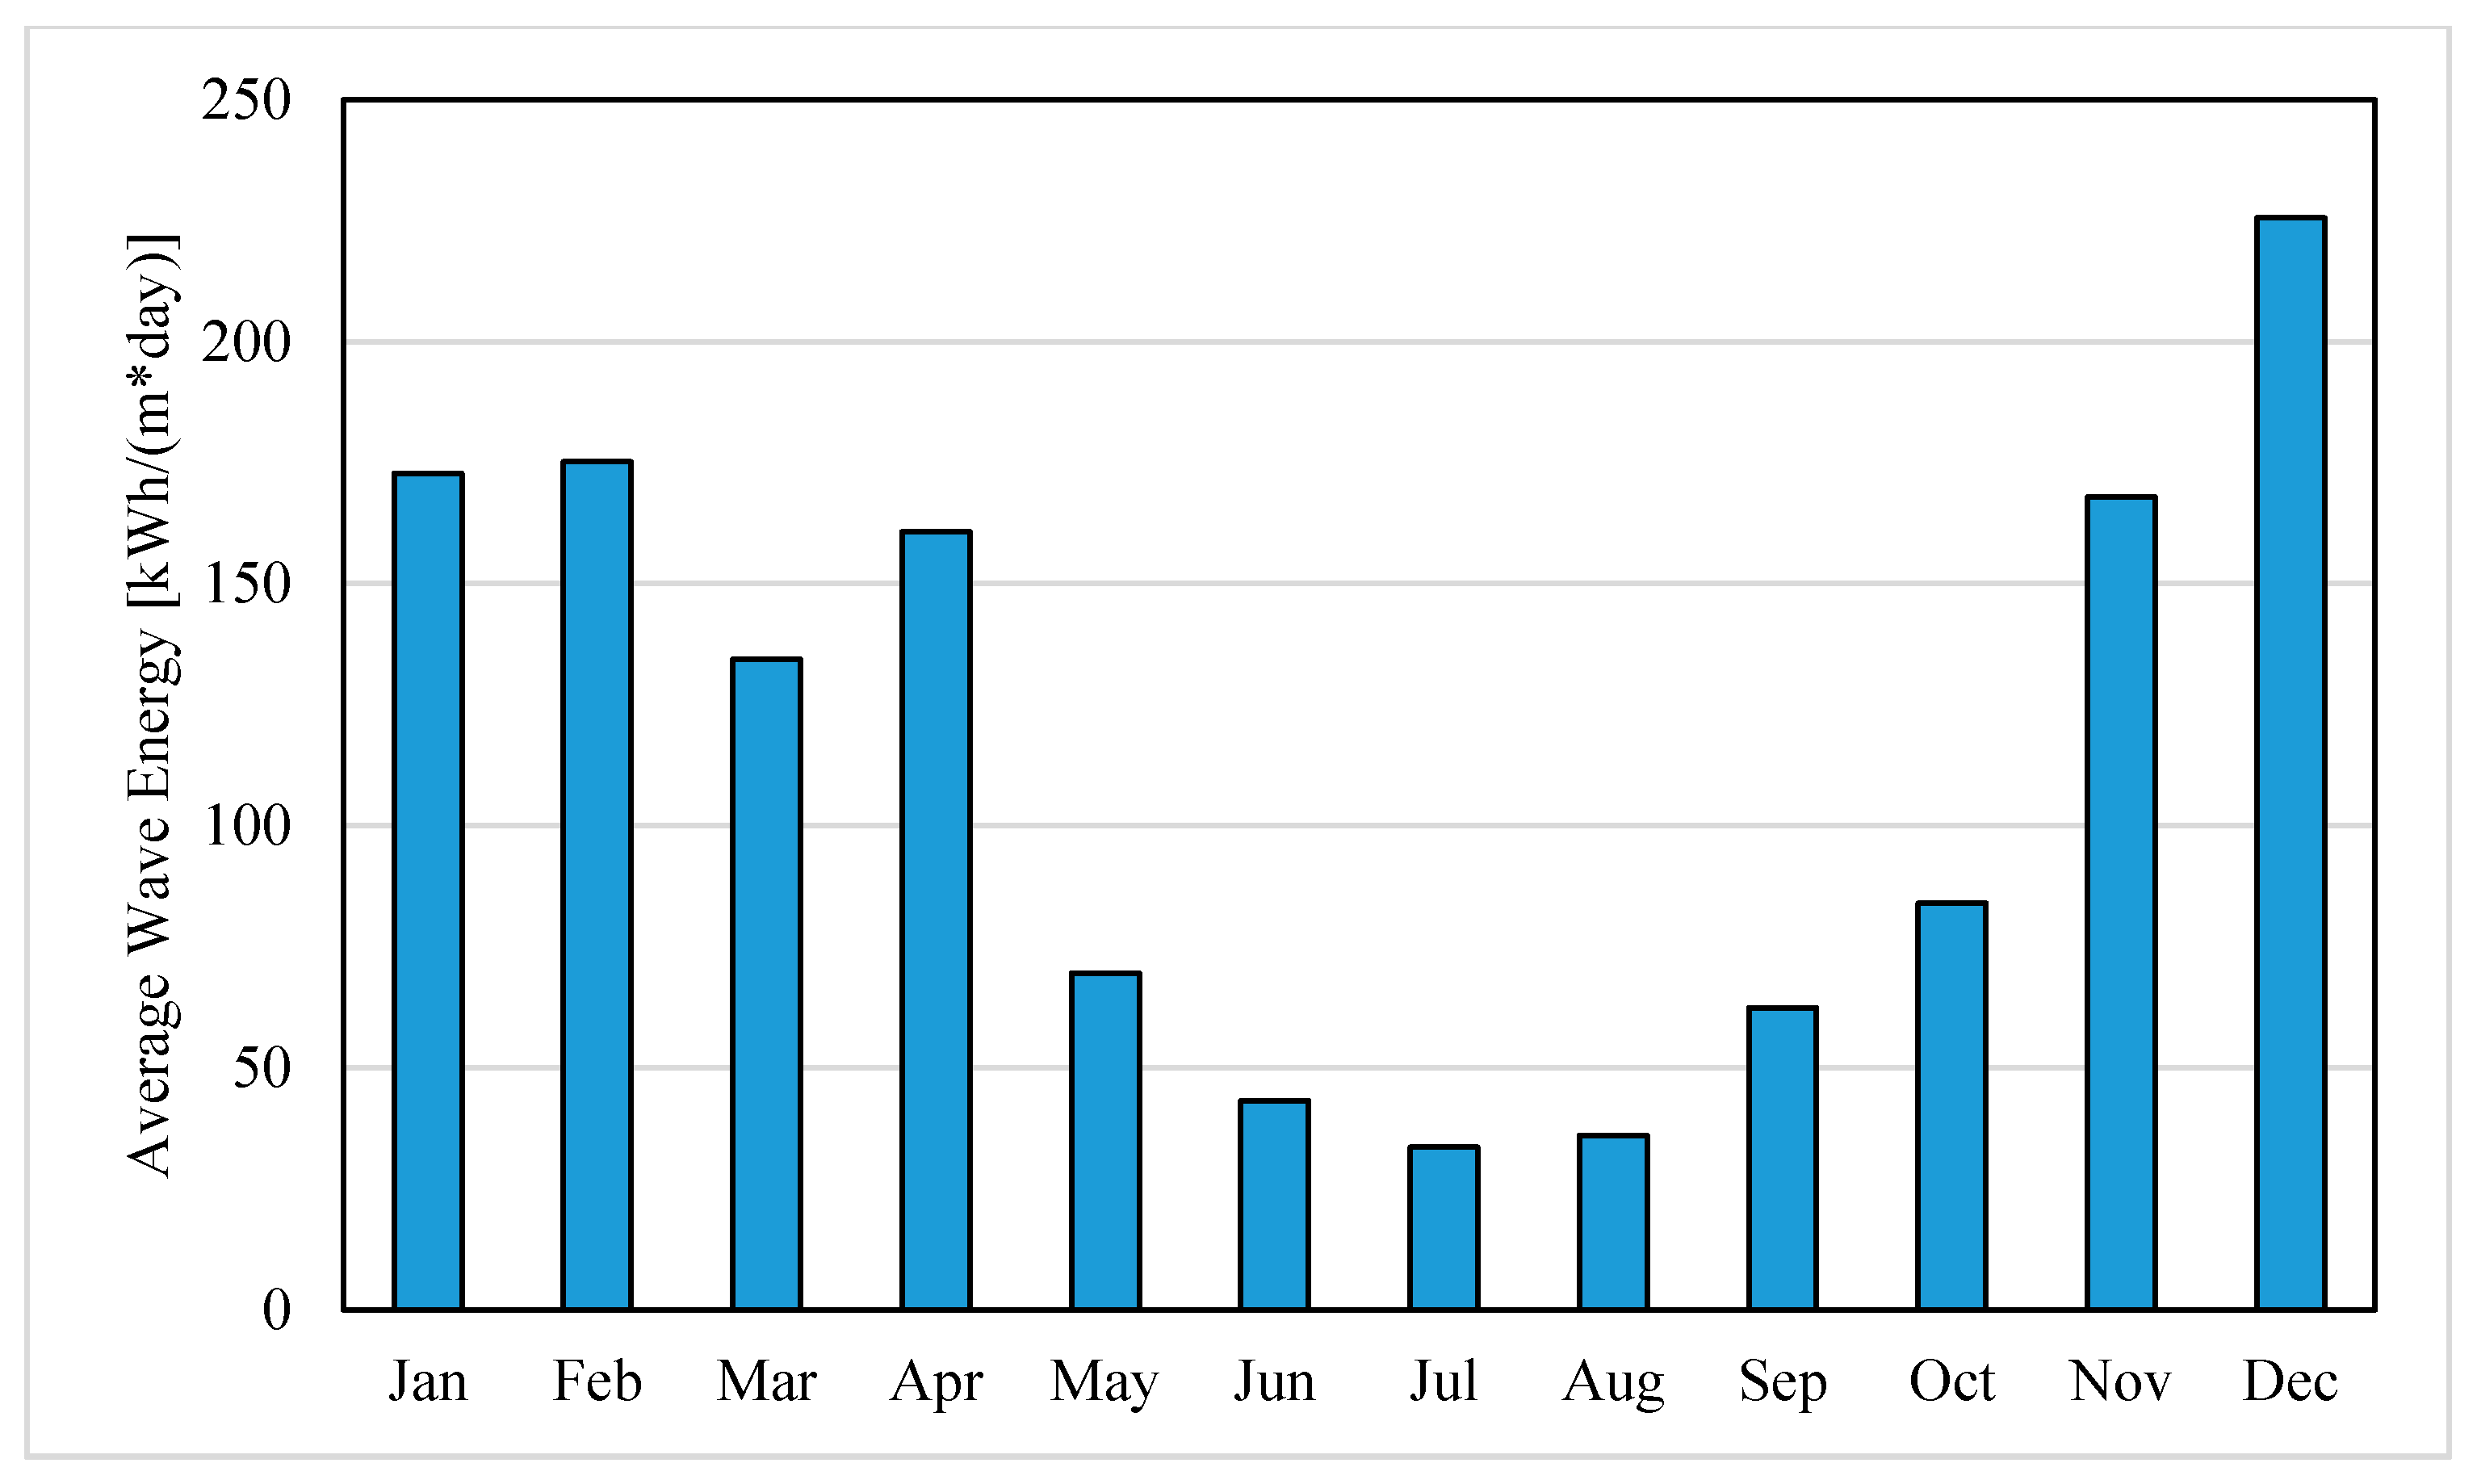
28]. Finally, the average wave energy can be obtained by summarizing all sea state wave energy (see
Figure 5).
2.2. Wave Energy Converter
Here, we present an innovative system able to produce electrical energy from sea waves. The device is currently in the development stage at the Department of Energy, Information Engineering and Mathematical Models (DEIM) of the University of Palermo [
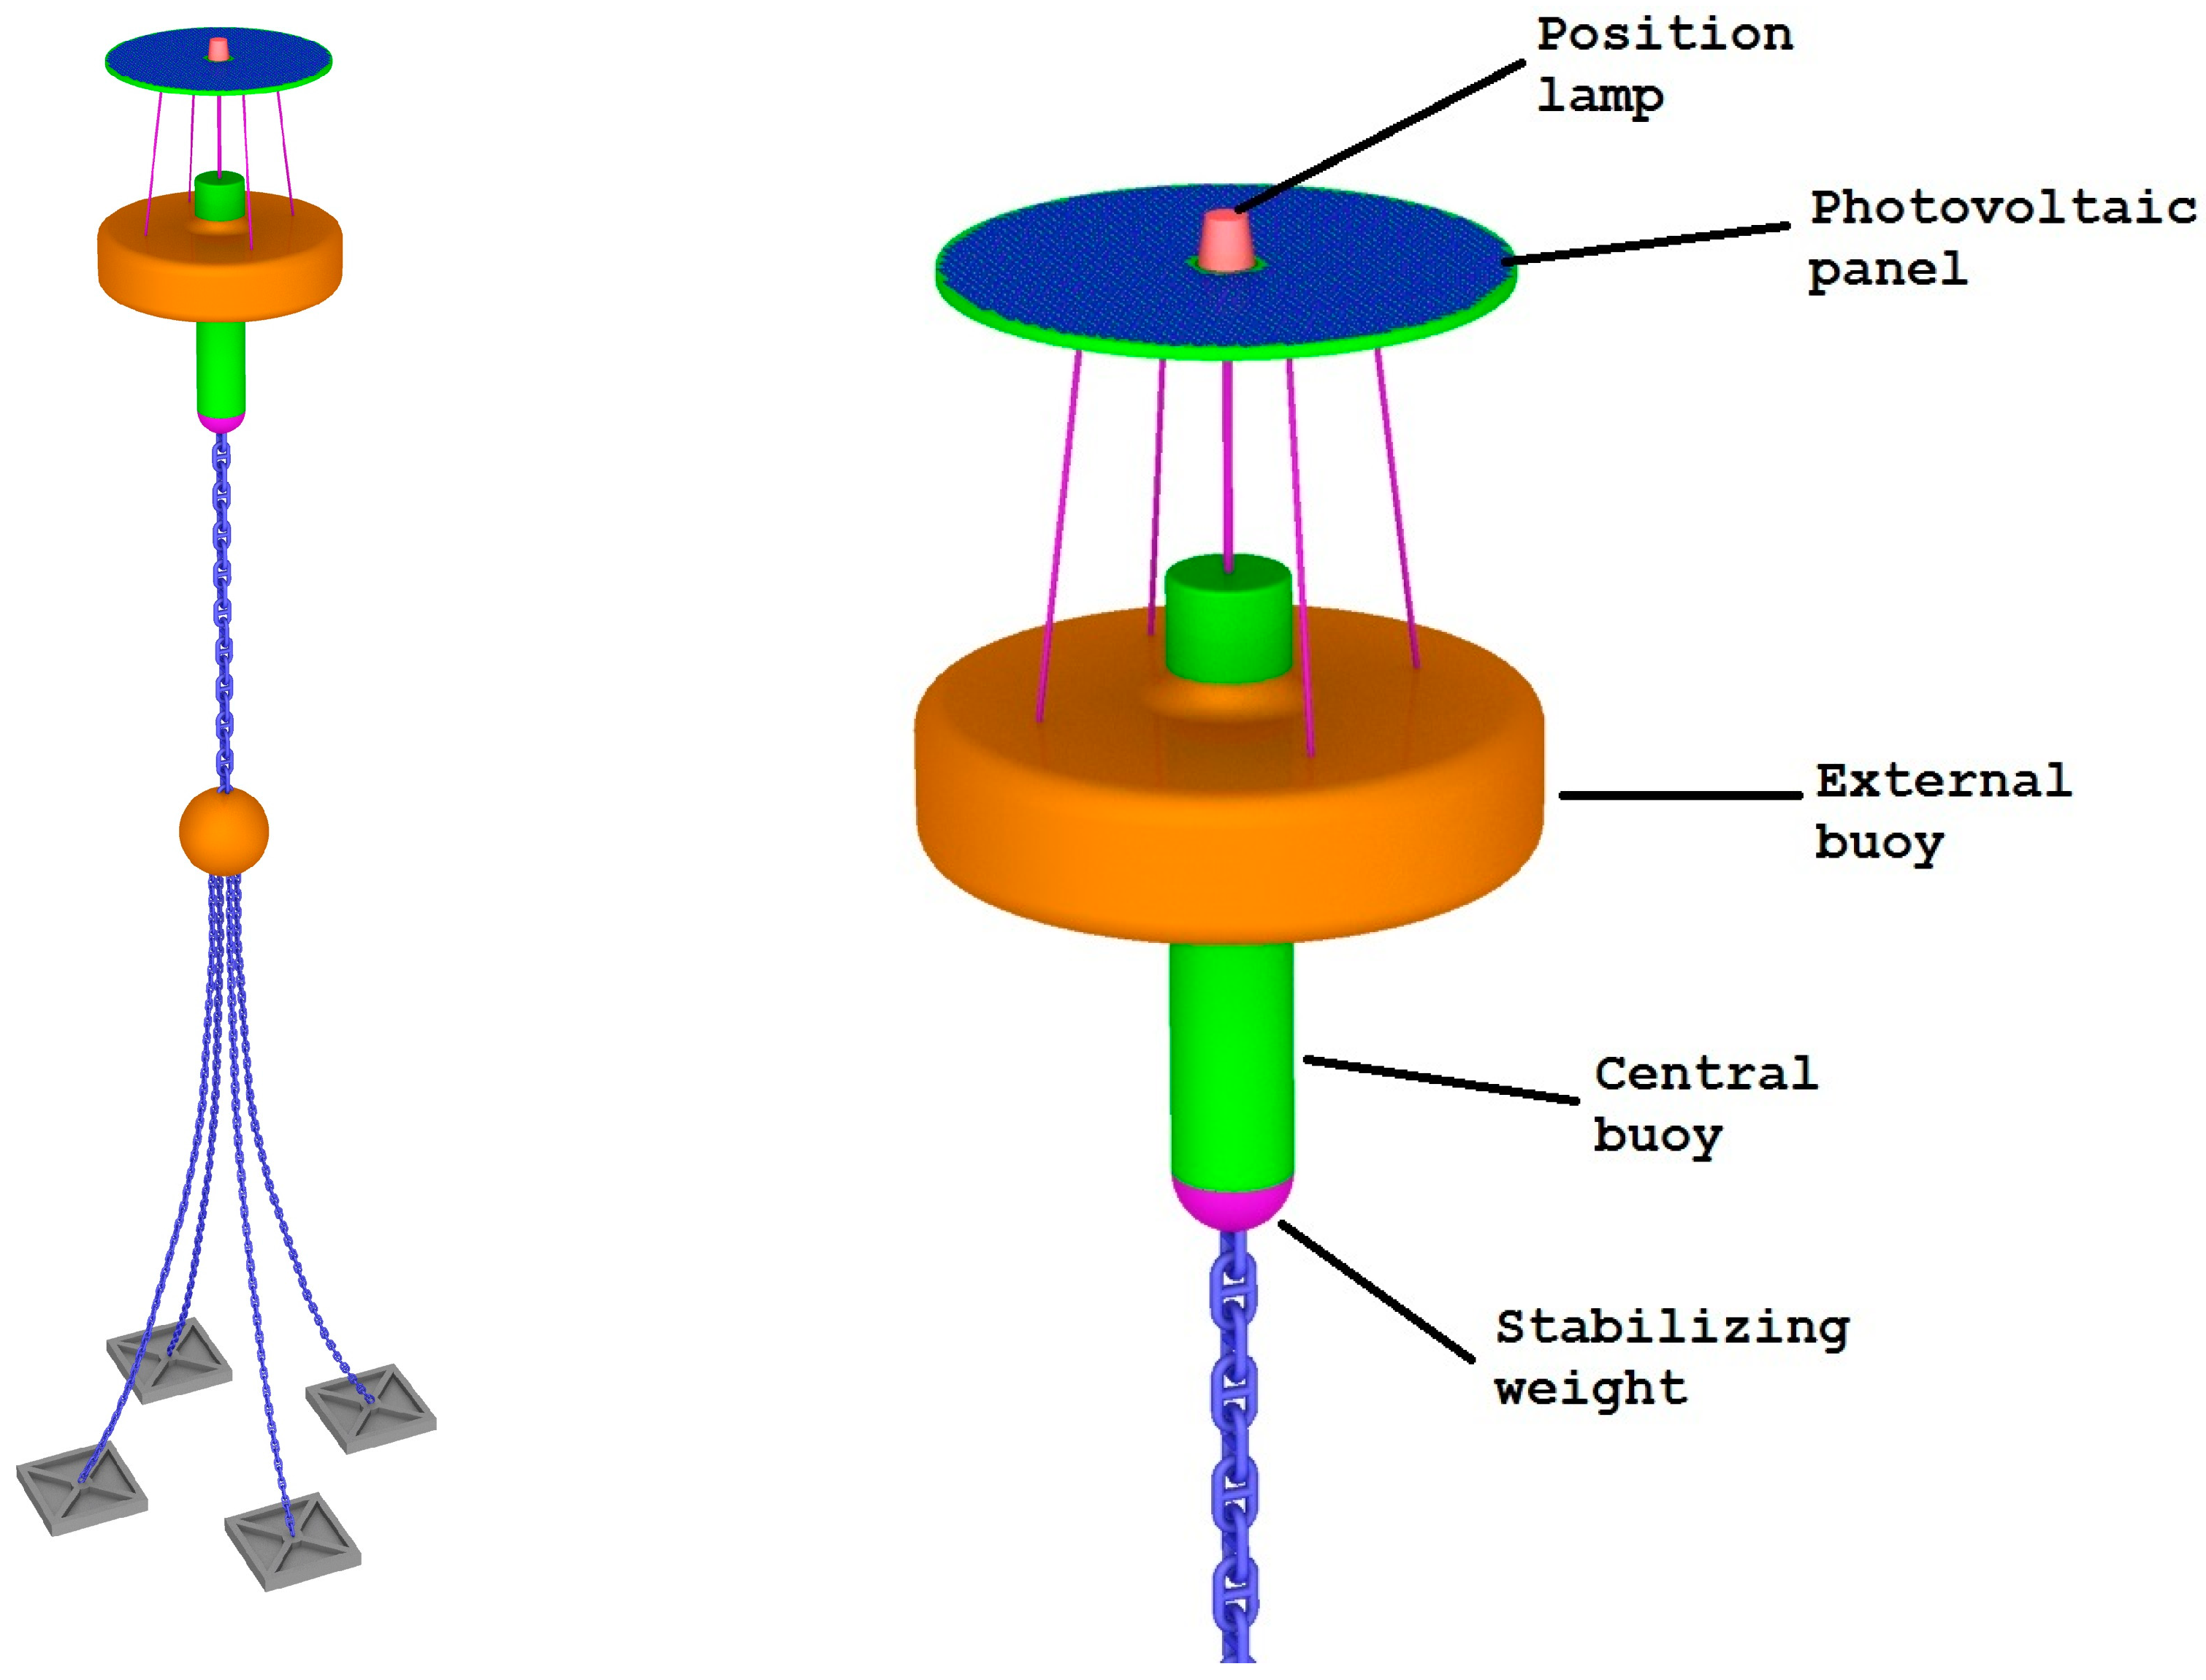
29]. This system can be classified as the point absorber (shown in
Figure 6), i.e., the device able to convert wave energy to electrical energy independently by the sea wave direction. The innovative aspect is linked to the use of linear generators that directly convert the mechanical energy of waves into electrical, without the use of intermediate devices or polluting fluids [
30]. Every point absorber is characterized by a rated power of 80 kW, consisting of eight linear generators of 10 kW each. All electrical devices are installed inside the central buoy, except for a photovoltaic panel (with a rated power of 8.8 kW), which is installed in the upper part of the external buoy.
The working stroke of the translators is about 4 m; in this way, the WEC will be able to exploit the most energetic sea states in the Mediterranean Sea. The wave motion is captured by the external buoy (yellow in the picture), which has an external diameter of 10 m.
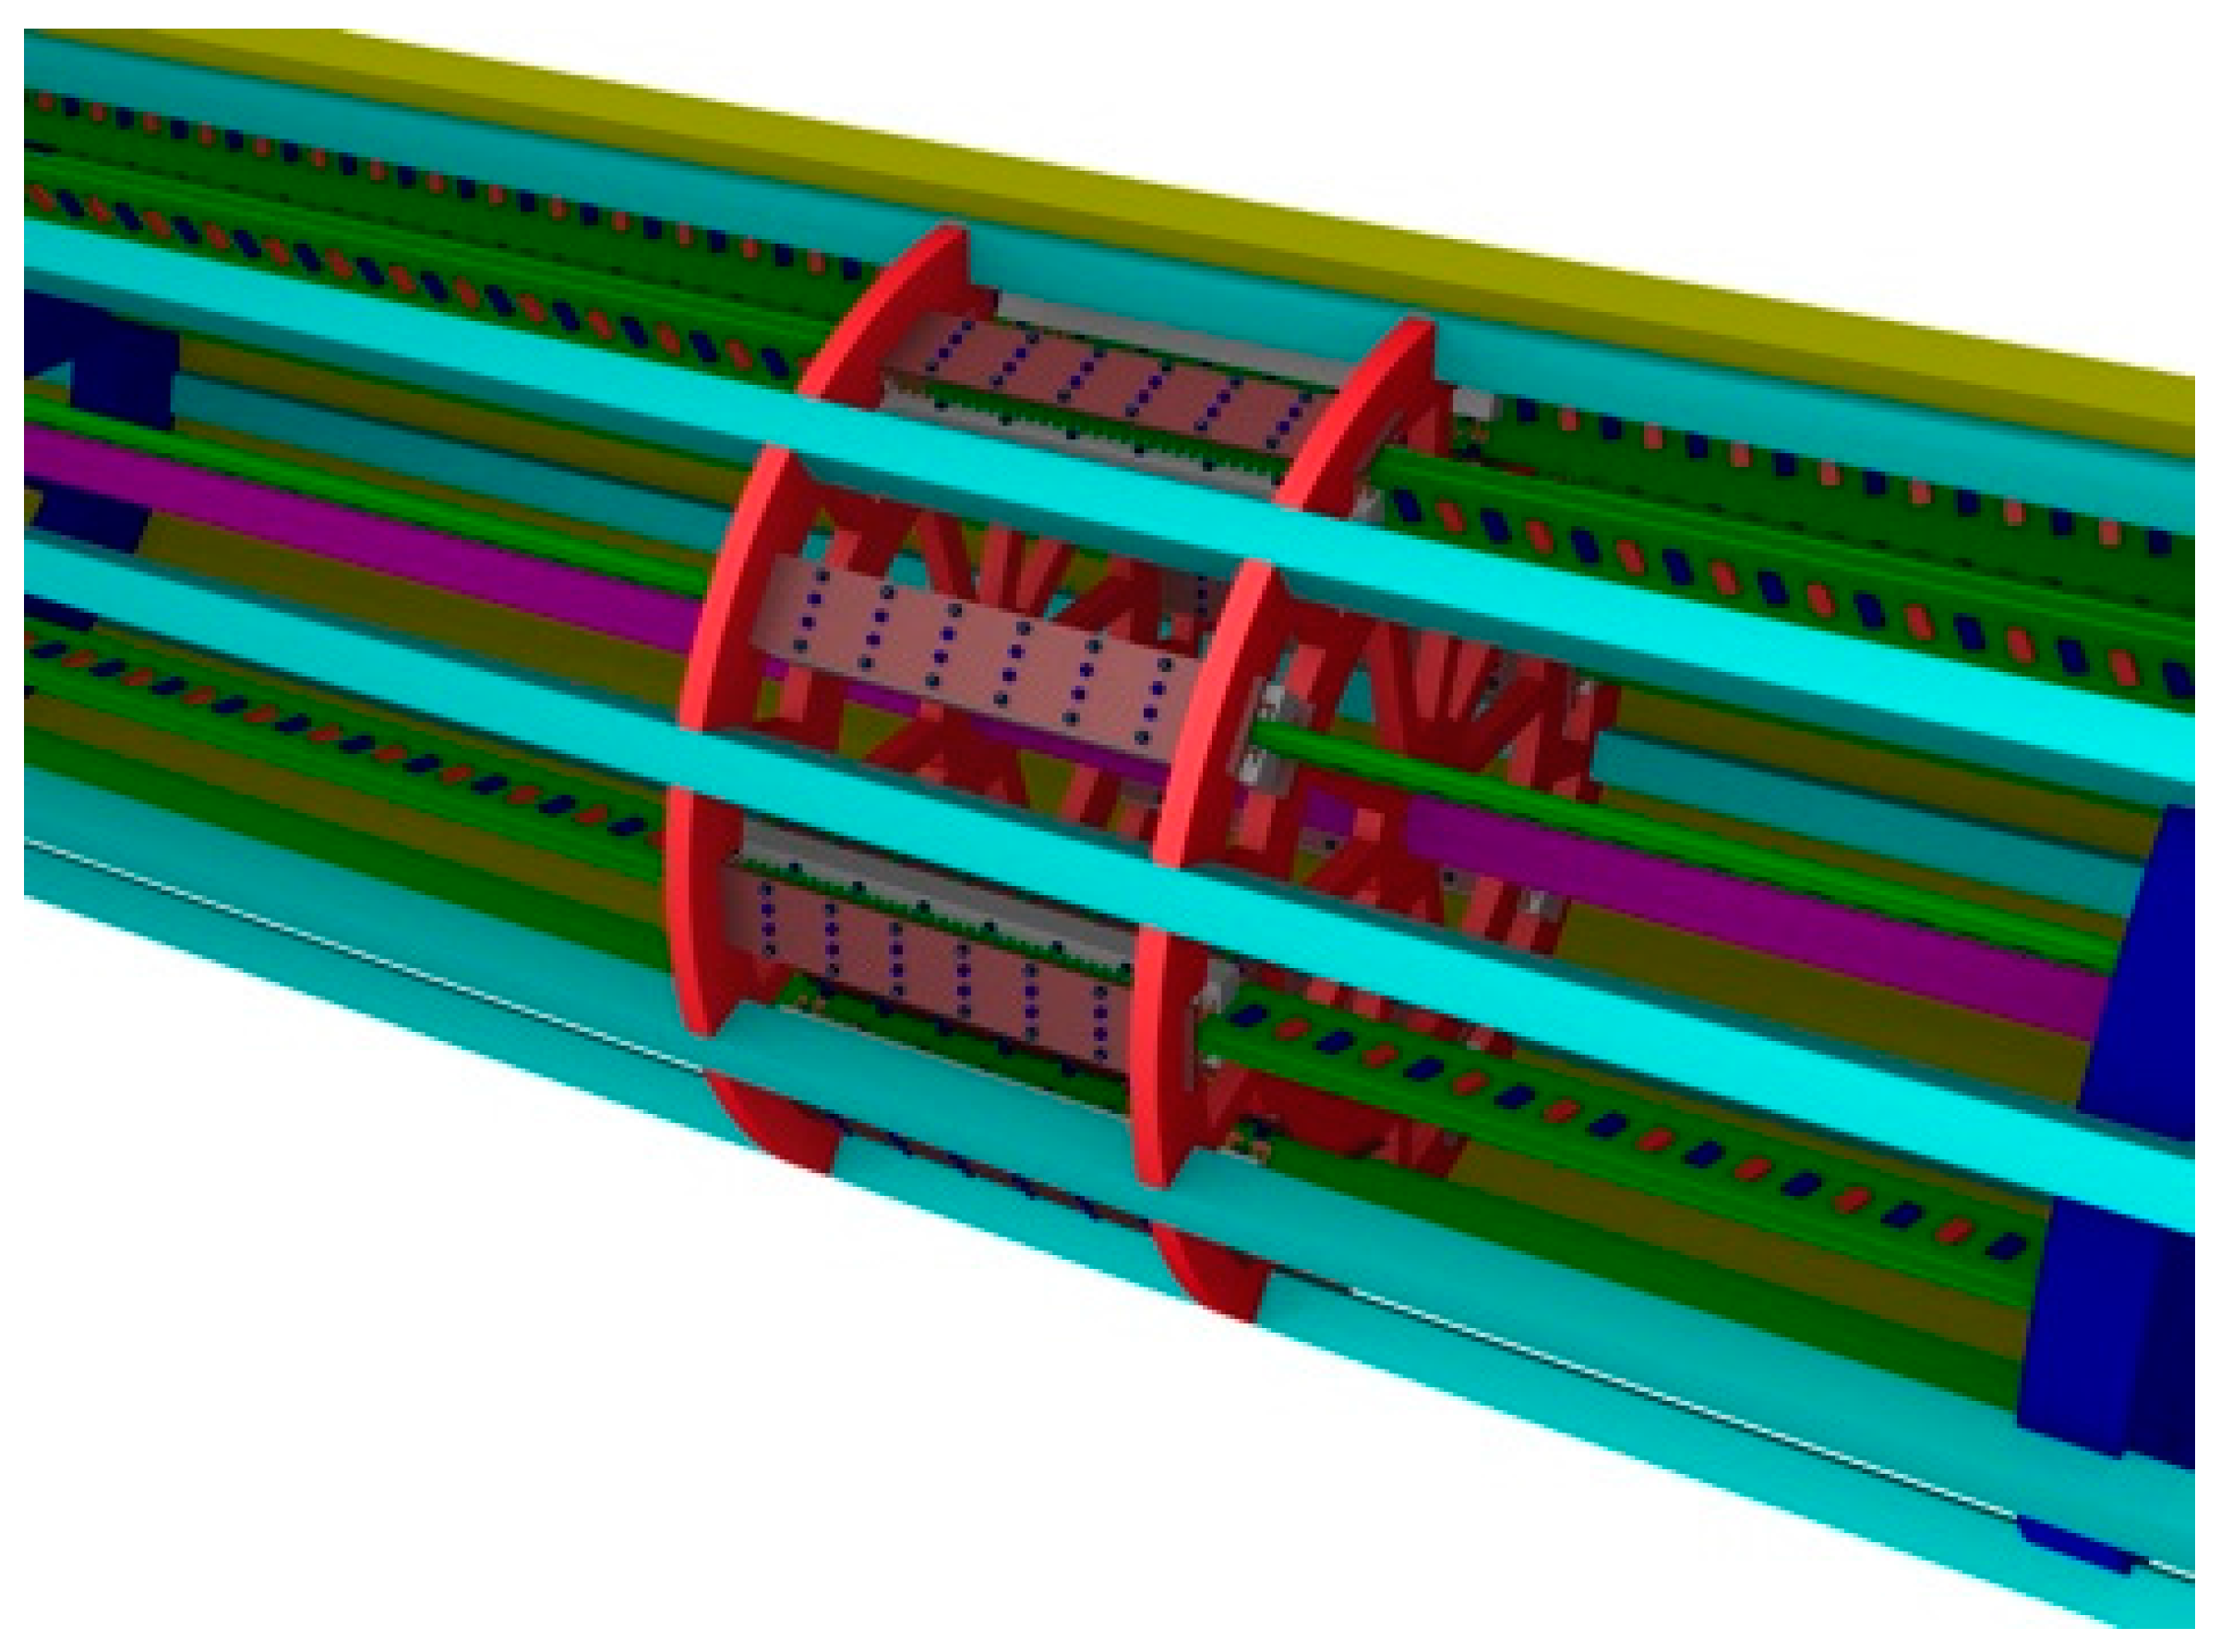
The permanent magnet generator (PMG) is defined as a bilateral generator with two stators. The material used is iron, and it is made by overlapping 126 sheets with thicknesses of 0.5 mm in order to minimize the eddy currents. The geometric dimensions of each single stator are 60 mm × 1945 mm × 65 mm. The PMG consists of 75 slots and 16 holes with a diameter of 10.5 mm. In particular, the slots have a width of about 12 mm, except for the first and last three slots, which have a width of about 8 mm. There are two tables of bakelite, each used for assembling the stator block.
Figure 7 shows the linear generators installed inside the central buoy.
Considering a single electrical machine, the translator has a length of about 6 m and is composed by a bakelite sheet, where the permanent magnets are installed. On each translator, 150 neodymium-iron-boron (Nd-Fe-B) permanent magnets are installed in pairs, alternating the magnetic poles along the motion’s direction of the translator. Each magnet has dimensions of 60 mm × 30 mm × 15 mm with a weight of 205 g and is covered by a protective nickel coating.
The coils, installed in the stators, are realized in enameled copper, with a diameter of about 1 mm. Each coil has a rectangular shape, with an average area of about 85 mm × 135 mm and a weight of about 2.2 kg. Each linear generator presents 144 coils, divided in two groups in the relative armature.
According to several tests on a small-scale prototype in the DEIM laboratory, in order to simply the following evaluation, the overall efficiency of this WEC was fixed to 50%.
2.3. Water Resource and Desalination Plant in Sicily
Since the end of the twentieth century, Sicily has suffered a chronic shortage of water. Several desalination plants have been installed in order to produce fresh water for agricultural, industrial, and civil uses [
31]. The problem of water scarcity is mitigated in the northern part of Sicily, thanks to the presence of mountain chains in the hinterland, but is emphasized in the southern part, where rainfalls have amounted to less than 400 mm/year [
32].
In Sicily, several problems in water provision are caused by inefficient and incomplete aqueduct networks connecting the water reserves to users.
The desalination process can certainly moderate the problem of chronic water debits in several areas of Sicily [
33].
Table 1 and
Figure 8 describe geographical sites and main technical data of all desalination plants installed in Sicily and smaller islands [
34].
As shown in
Table 1, different desalination technologies (RO, MED, MSF, and MVC) are currently used in Sicily and smaller islands in order to produce fresh water for about half a million people. All plants are owned by the Sicilian Regional Government. The first plants have been installed since the 1970s and are still operating (for example, the MSF units of Gela) [
24].
3. Case Study in Pantelleria: An Application of Wave Energy to Supply the Desalination Plants
The following case study considers the installation of a wave farm with the integration of solar photovoltaic in order to produce the electrical energy demanded by desalination plants installed in Pantelleria. An economic and environmental evaluation is presented.
In Pantelleria, the population usually ranges from a minimal value of about 7700 inhabitants during the winter season to 14,000 during the summer due to tourism. As mentioned above, in Pantelleria, the availability of fresh water is limited. In order to mitigate this problem, two desalination plants are installed. The first, located in Maggiuluvedi, is composed of two electrodialysis reversal (EDR) units (each one having a capacity of 135,000 m
3/year) and a reverse osmosis (RO) unit (with a capacity of 60,000 m
3/year). In particular, the EDR units were installed in 1975, with changes and developments over the years. The RO unit was installed in 1991. The plant is supplied with brackish water from the Valencia well, located in the middle of the town [
34]. The annual plant capacity is about 330,000 m
3/year of fresh water.
The second desalination plant is located in Sataria. It was installed in 1992 and is composed by two mechanical vapor compressor (MVC) units, each one with a capacity of 496,000 m
3/y. The total capacity of plant is equal to 992,000 m
3/y. The plant is supplied with seawater.
Table 2 reports main data about the desalination plants installed in Pantelleria.
In Pantelleria, like other small islands in the Mediterranean Sea, electrical energy production is almost completely based on fossil fuels [
35] and is usually supplied through ship or mainland. In order to reduce the emissions and dependence on fossil fuels, usually imported by countries characterized by political instability and conflicts, several projects have investigated the possibility of combining desalination processes with renewable energy sources.
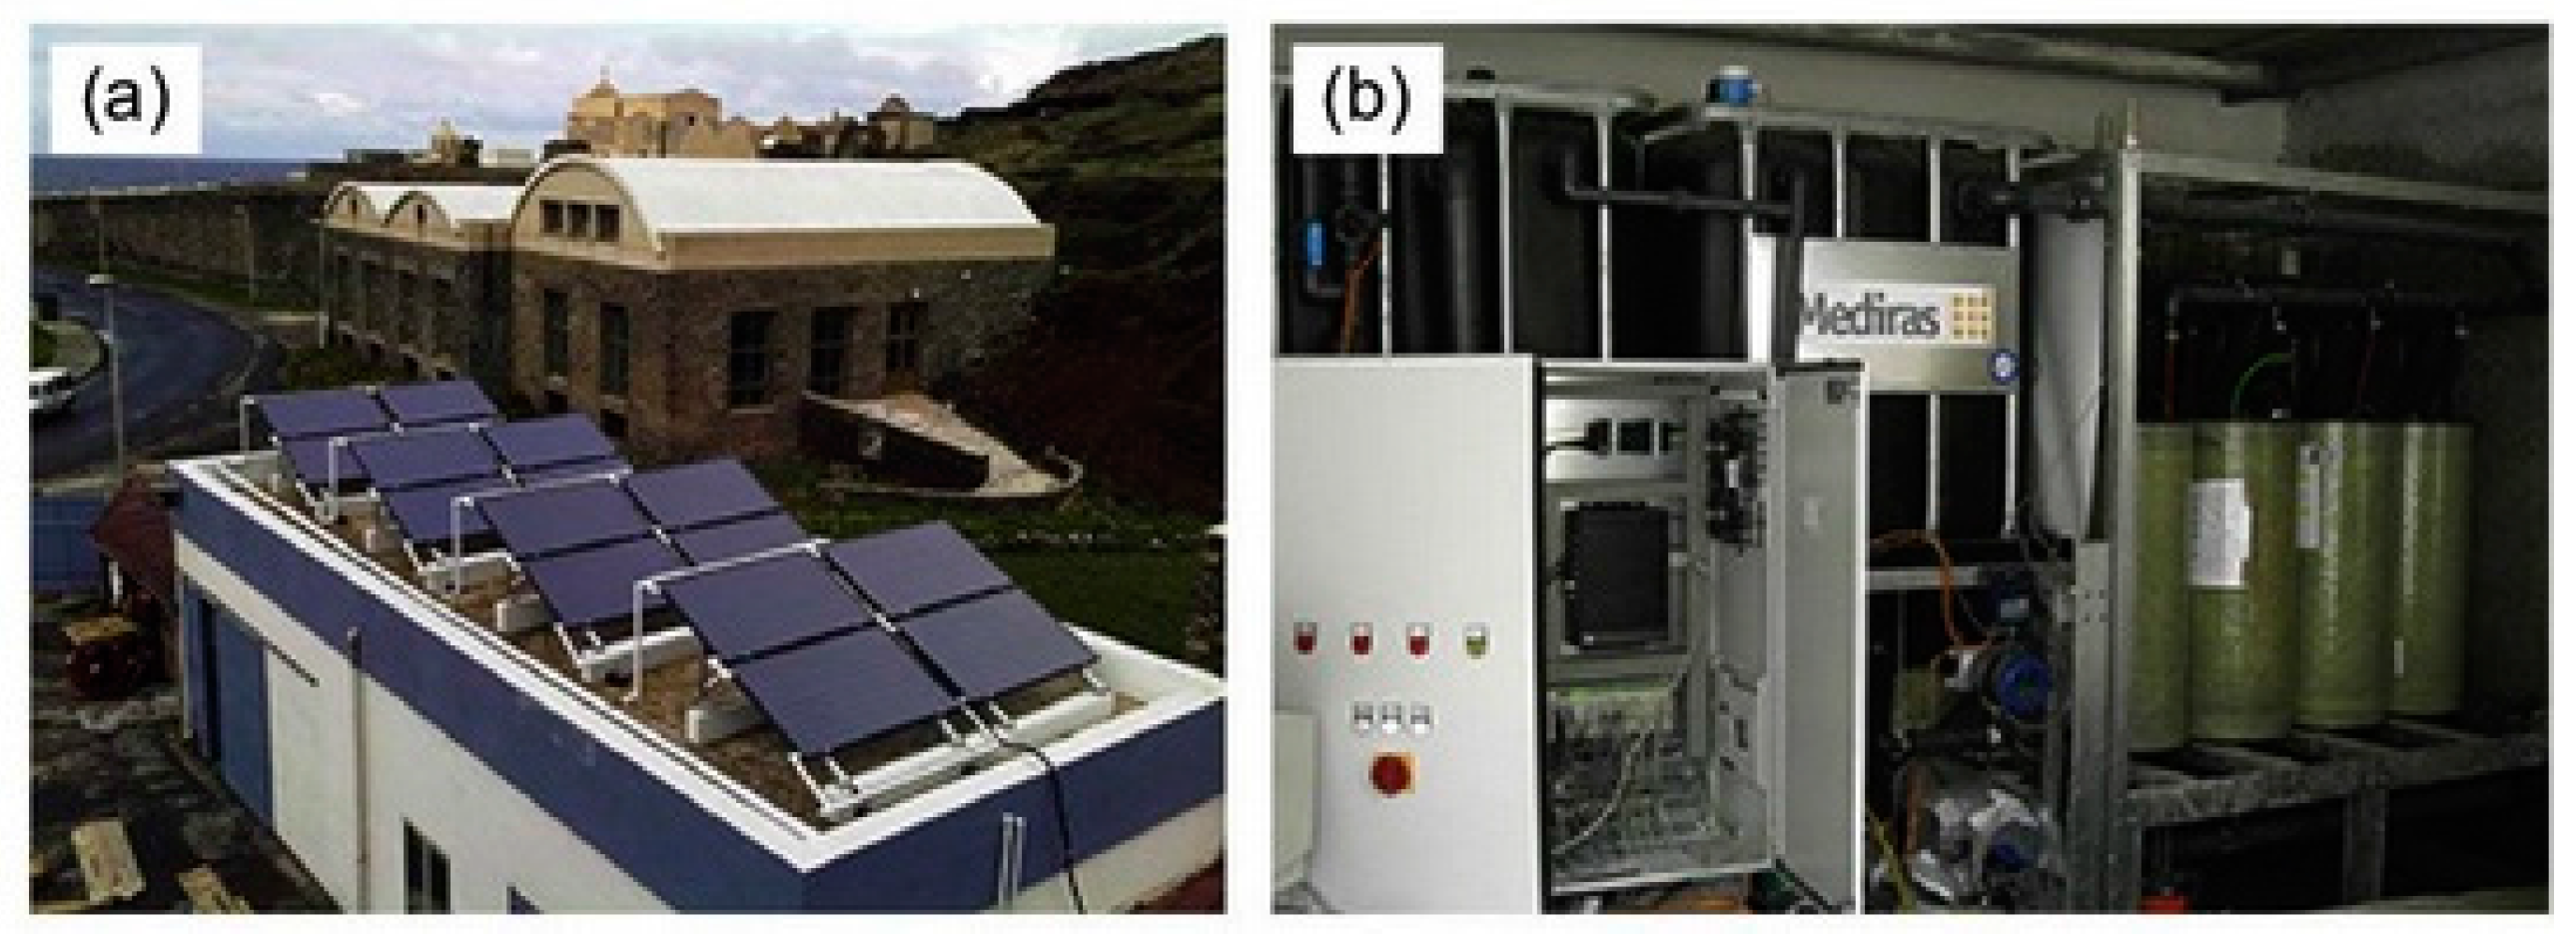
For example, the MEDIRAS project (see
Figure 9) uses membrane distillation technology. The prototype has a rated capacity of about 5 m
3/day. The heat required in the distillation process is obtained by using solar thermal panels (about 30%) and recovering the waste heat of the diesel generator plant (about 70%) [
36,
37].
Another pilot plant has been realized by PROTECNO S.r.l. and is based on four RO units. The plant has a rated capacity of about 11,100 m3/day (462.5 m3/h) and uses the seawater directly to produce fresh water. Three treatments have been realized: pretreatment in ultrafiltration, desalination in RO units, and re-mineralization.
These projects certainly allow for a reduction in fossil fuel consumption in the desalination process thanks to the integration of renewable sources. Another interesting solution is the coupling of the desalination process and sea wave sources. This system can be installed in several small islands in the Mediterranean Sea. In particular, as a case study, we focus our attention on Pantelleria Island.
Several studies have evaluated the wave energy potential around Pantelleria. In particular, according to ENEA (Ente per le Nuove tecnologie l’Energia e l’Ambiente) research, based on their own simulating software, the average annual wave potential is about 7 kW/m, a considerable value for the Mediterranean Sea. The theoretical annual energy production is estimated at about 60 MWh/m. The main direction of the wave front is northwest, with a significant height of about 4 m [
38].
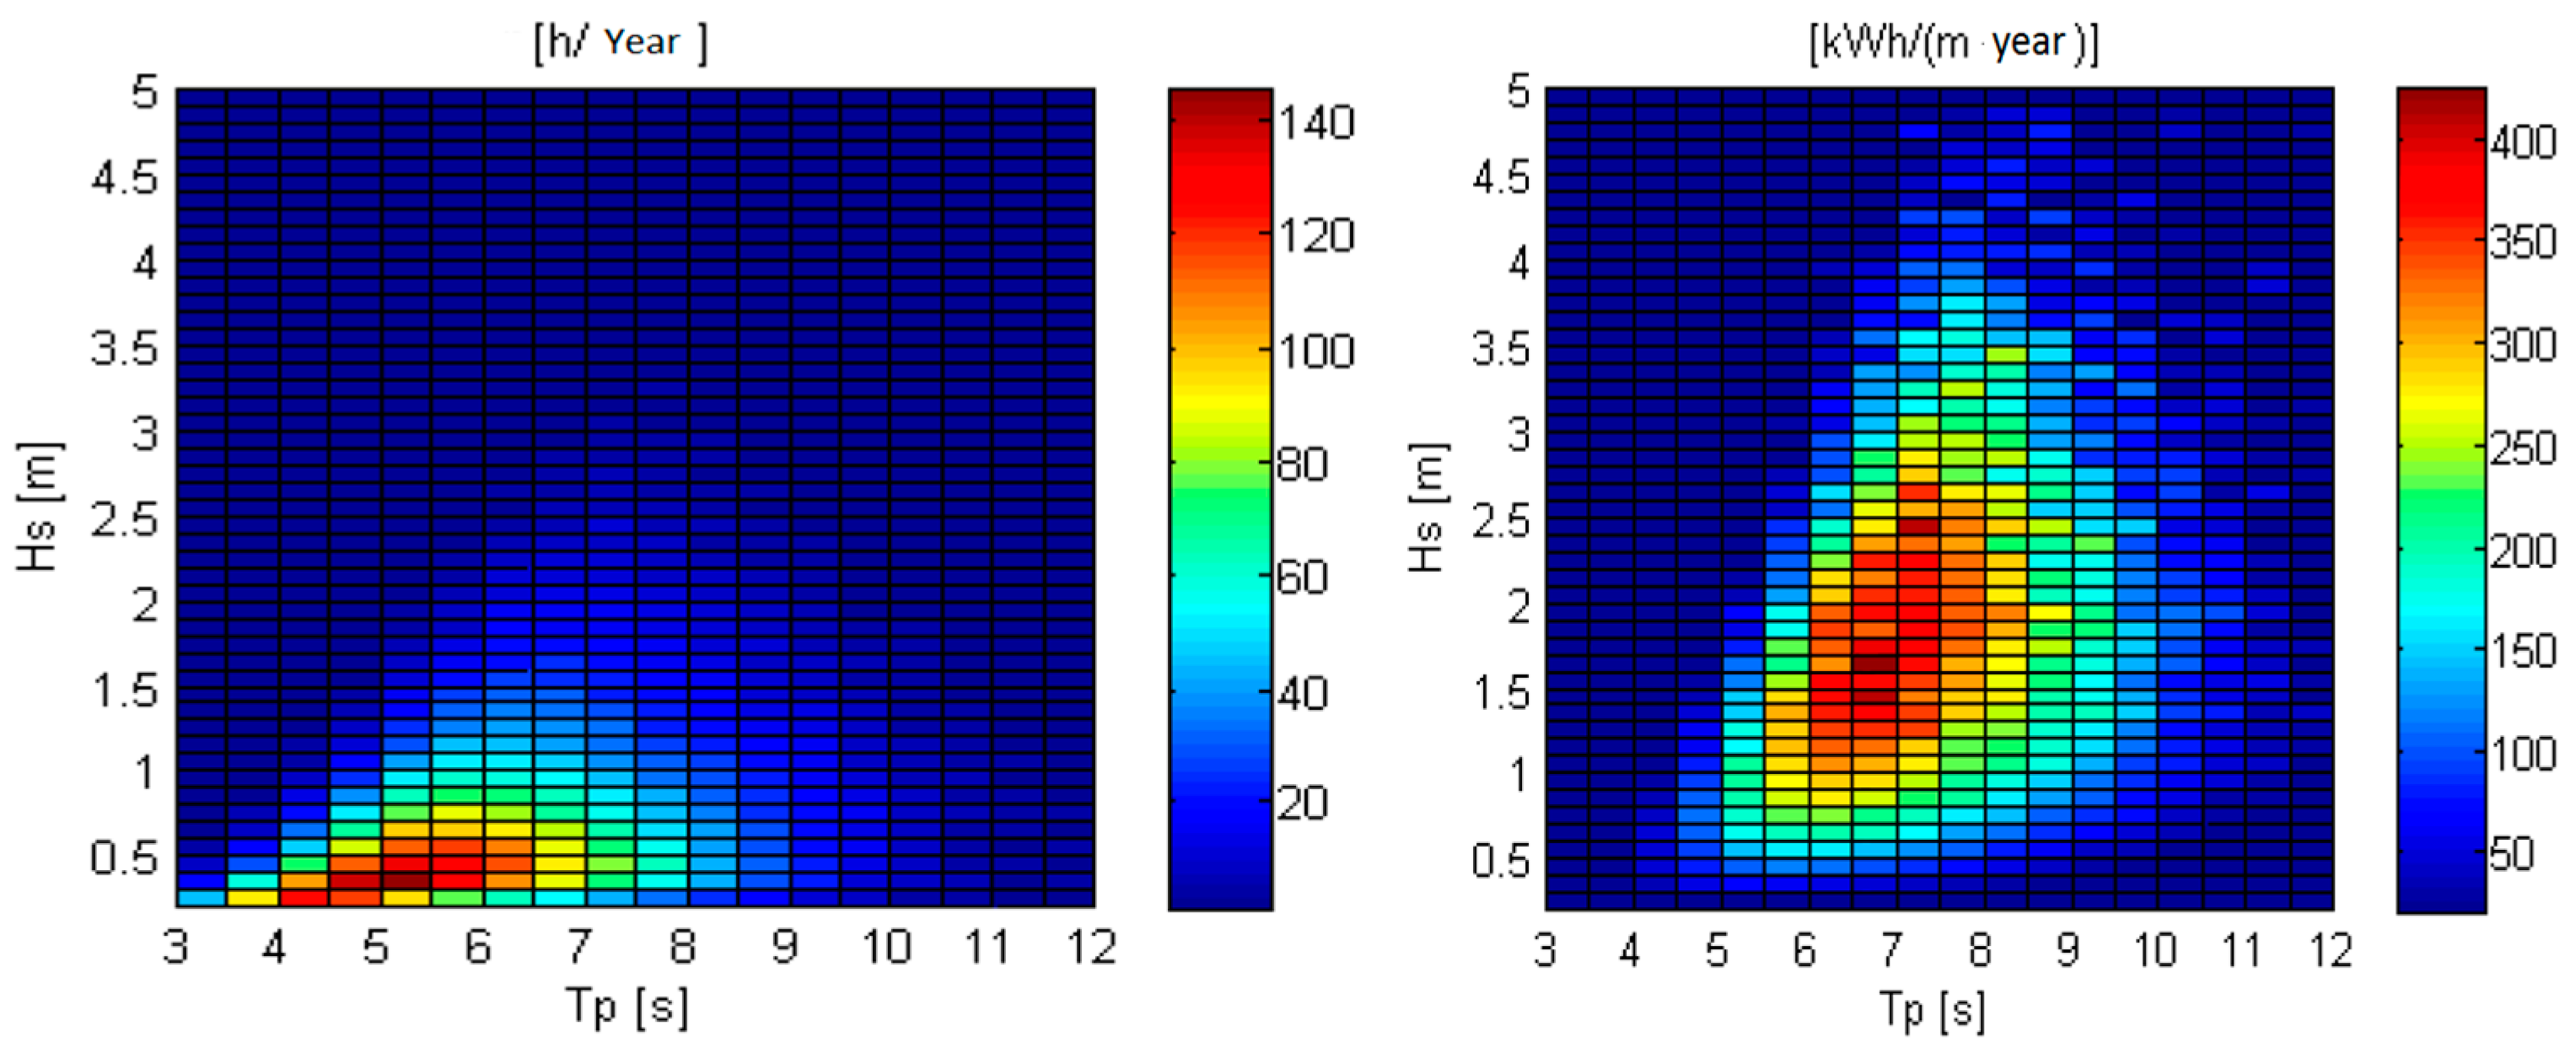
The “Politecnico di Torino” [
39] conducted an important study measuring the average power along Pantelleria’s coasts using a Nortek AWAC buoy installed 800 m from North-West Pantelleria Island.
Figure 10 shows the results of the Politecnico study. The maximum annual energy is connected to a significant wave height from 1 m to 3 m and a peak period from 5.5 s to 8.5 s. The Politecnico study confirms that the average annual wave power is equal to 7 kW/m [
39].
The Sea Wave Farm Based on DEIM Converter
As introduced before, in Pantelleria, the annual energy demand of desalination plants is about 15.7 GWh/year. Considering the DEIM sea wave converter proposed in
Section 2.2, we evaluate a wave farm [
40,
41] with photovoltaic integration in order to produce the equivalent energy demand of desalination plants. Here, the balance problem between the energy production of a wave farm and the instantaneous energy demand of desalination plants is neglected. Considering the wave condition around Pantelleria’s coasts, we determined that a single DEIM converter is able to produce about 323.6 MWh/year of electrical energy, of which 306.6 MWh/year is by sea wave and 17 MWh/year is by photovoltaic. Therefore, in order to satisfy the electrical energy demand of the desalination plants, the installation of a single wave farm composed of 51 DEIM converters is recommended. The total annual production is estimated to be equal to 16.5 GWh/year.
Considering the installation of WECs along the first three lines with a distance sufficient to avoid wave interferences, the wave farm covers an area of about 870 mm × 40 m.
Figure 11 shows the displacement of WECs at the wave farm.
Table 3 reassumes the main properties of the wave farm.
In other works, we present the installation costs and the operative and maintenance costs with more detail [
42]. Summing the item costs,
Table 4 reassumes the main costs used in this economic evaluation.
Multiplying the costs shown in the table for the rated power of the wave farm, the total cost of the construction of the wave farm and its maintenance costs are obtained.
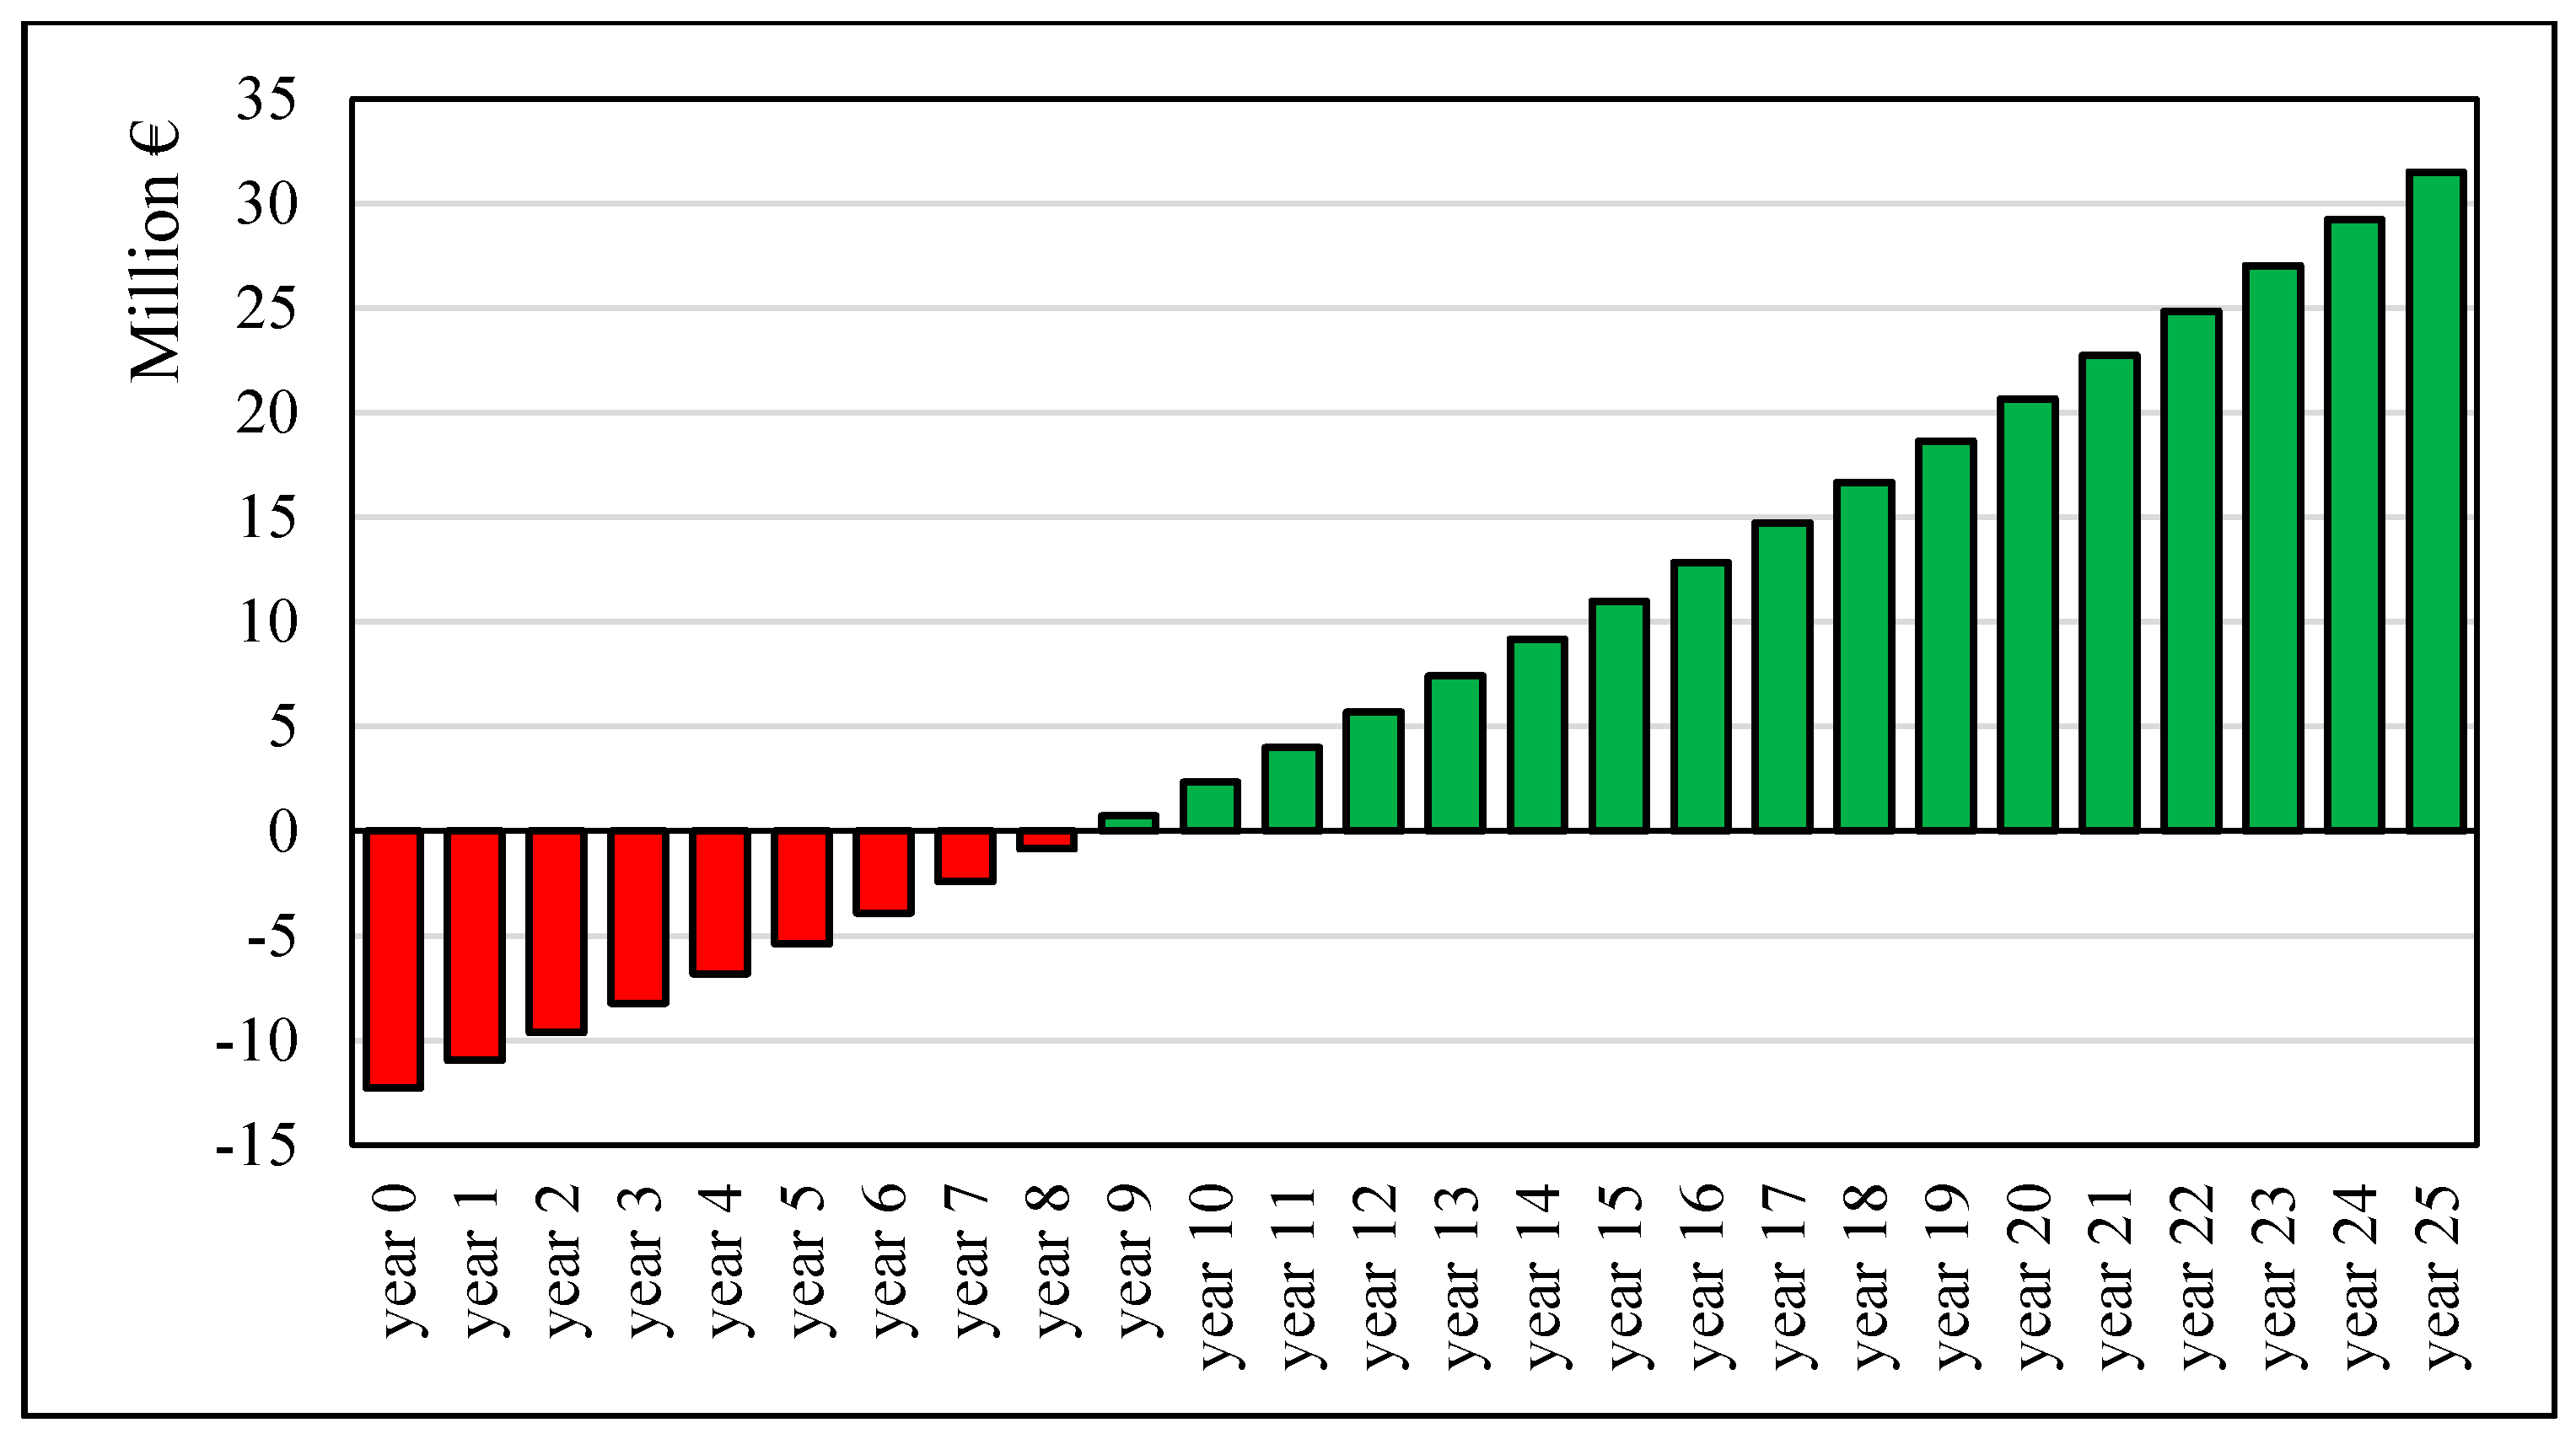
Figure 12 shows the discounted cash flow of investment for the wave energy farm, fixing the cost of electrical energy to 80 €/MWh, the discount rate to 0.75%, and the discount rate in energy systems to 3%. As shown in the graph, the breakeven time is about 8–9 years.
As regards the environmental aspects, in Pantelleria, the electrical energy is currently produced by diesel generators owned by the company SMEDE. According to the data reported in [
43], this power plant presents a fuel (diesel) consumption equal to 0.0843 kg/kWh; therefore, the installation of the wave farm was able to avoid the consumption of 1391 tons of diesel. Finally, considering the CO
2 emission factor of the SMEDE power plant (0.267 tons CO
2/MWh) [
43], 4406 tons/year of CO
2 emissions are avoided.


