Article

Study on Insulator Flashover Voltage Gradient Correction Considering Soluble Pollution Constituents

1
State Key Laboratory of Power Transmission Equipment & System Security and New Technology, Chongqing University, Shapingba District, Chongqing 400044, China
2
State Grid Chongqing Electric Power Co. Electric Power Research Institute, Yubei District, Chongqing 401121, China
*
Author to whom correspondence should be addressed.
Energies 2016, 9(11), 954; https://doi.org/10.3390/en9110954
Submission received: 11 September 2016 / Revised: 24 October 2016 / Accepted: 8 November 2016 / Published: 15 November 2016

Abstract

:
Natural polluted insulator surfaces are always coated with various kinds of soluble constituents, and those constituents affect flashover performance differentially. Currently, this fact is not considered either in laboratory experiments or field pollution degree measurements, causing the existing insulation selection method to be deficient. In this paper, a systematic study on insulator flashover voltage gradient correction involving different types of soluble pollution constituents is presented. Using a typical type glass insulator as the sample, its flashover tests, polluted by typical soluble chemicals (NaCl, NaNO3, KNO3, NH4NO3, MgSO4, Ca(NO3)2 and CaSO4), were carried out. Then, the flashover gradient correction was made by combining the flashover performance of each soluble constituent, the equivalent salt deposit density (ESDD) contribution of the seven constituents, and the saturation performance of CaSO4. The correction agreed with the flashover test results of insulator polluted by three types of soluble mixture. Research results indicate that the flashover gradient correction method proposed in this paper performs well in reducing the calculating error. It is recommended to carry out component measurements and flashover gradient correction to better select outdoor insulation configuration.

1. Introduction

External insulation equipment on transmission lines or in substations are frequently subjected to various kinds of contamination such as industry emissions, natural salt, dust, bird droppings, and other contaminants [1]. Due to pollution source features, geographical environment, and weather conditions, there is a great diversity of chemical constituents deposited on insulator surfaces during contamination [2].
Plenty of researches have been carried out so far to obtain the main constituents of insulator surface pollution. To sum up, insulator surface pollution is mainly made up of several conductive materials including NaCl, NaNO3, KCl, KNO3, Mg(NO3)2, MgSO4, NH4NO3, NH4Cl, (NH4)2SO4, Ca(NO3)2, CaSO4, and other contaminants, according to the research data in [3,4,5].
All these constituents must affect an insulator’s electrical properties differentially [6,7], which will probably bring errors to the flashover voltage calculation. Currently, insulator flashover voltage is commonly calculated using an empirical negative exponent formula as follows [8,9,10]:
U f = A × E S D D n
The main symbols of this paper were described in Table 1. In this formula, equivalent salt deposit density (ESDD) is derived from converting the pollution solution conductivity to the weight of NaCl, and A and n are obtained through laboratory tests using NaCl as the soluble pollution. So, the formula neglects the influence of other soluble constituents on flashover voltage, which causes deficiency.
In light of this, researches concerning different soluble constituents were carried out to further reveal insulator flashover voltage characteristics.
In literature [6], researchers studied the flashover performance of insulator polluted by different soluble materials, and proposed that, according to kinetic theory and permeation theory, a lower flashover voltage may be a function of the type of salt.
Researchers in [7] studied the dependence of flashover voltages on the chemical composition of the insulator surface contaminants, and put forward that the limiting flashover voltage of a contaminant containing several salt types may be computed from that of each salt type measured independently:
U L F O V = ( ρ E S D D i U L F O V i ) / ρ E S D D
In literature [11], researchers recommended that when calculating the critical flashover voltage and critical current, appropriate arc constants (A and n) should be selected for different chemical compositions of the pollutants.
Researchers in literature [12] showed the influence of pollution under 12 types of chemical constituents. It is proposed by the authors that in the case of simple salts and salts mixtures, the critical voltages are insensitive to the chemical nature of pollution. The critical currents are influenced by the chemical constitution of pollution for both polarities.
In literature [13], researchers studied the flashover performance of insulator string polluted by CaSO4 and NaCl, and reduced the flashover voltage calculation error through considering the slight solubility of CaSO4. It is concluded by the authors of the paper that the current ESDD method may fail to reflect specific effects of insulator contamination on its electrical property.
The above studies contributed towards the knowledge of pollution flashover principles and provide a theoretical basis for contamination constituents’ effects on the insulation property. However, during laboratory artificial tests, pollution degree measurements, as well as field insulation design, NaCl is still used as the only representation of a conductive constituent. Moreover, few of the previous works proposed a procedure for flashover voltage gradient correction that considers various characteristics of soluble constituents.
This paper presented a systematical research on insulator flashover voltage gradient correction considering soluble pollution constituents. Firstly, flashover tests of typical type insulator string polluted by NaCl, NaNO3, KNO3, NH4NO3, MgSO4, Ca(NO3)2, and CaSO4 were carried out, respectively. Then, with the flashover test data, the flashover gradient corrections basing on ESDD contribution of seven types of constituents and the saturation performance of CaSO4 were analyzed. The corrected flashover gradients agreed with insulator flashover test results under three types of soluble mixtures. This research is intended for contributing to the better design of outdoor insulation in field transmission lines.

2. Sample, Experimental Setups, and Procedure

2.1. Sample

The samples were typical type glass insulators. The technical parameters and profile of the sample are shown in Table 2.

2.2. Experimental Setups

The tests were carried out in a multifunction artificial climate chamber. The artificial climate chamber, with a diameter of 7.8 m and a height of 11.6 m, can simulate steam fog conditions. The power was supplied by a 500 kV/2000 kVA pollution test transformer, of which the maximum short current is 75 A and the frequency is 50 Hz. The test circuit is shown in Figure 1, where B is the voltage regulator, T is the test transformer, R0 is the protective resistance (10 kilo ohms), G is the wall bushing, D is the capacitive voltage divider (1000:1), E is the climate chamber, C is the leakage current measurement system, and S is the sample shown as an insulator string. The setups meet the requirements of pollution flashover test.

2.3. Test Procedure

2.3.1. Preparation

Before the tests, all the samples were carefully cleaned by Na2PO3 solution so that all traces of dirt and grease were removed. The samples were left to dry naturally indoors to avoid dust or other pollution, and the relative humidity surround was less than 70% RH (Relative Humidity).

2.3.2. Polluting

The dipping method was applied to pollute the sample. The pollution solution was made strictly referring to standards [14,15]. Firstly, the soluble constituent was added until the volume conductivity reached a predetermined value, and then kaolin was added to make the solution into clay suspension. The samples were carefully dipped into and then taken out of the pollution mixture to get a uniform pollution layer coated on the surface.
After each dipping procedure, three pieces of the sample were randomly selected and the average value of their ESDD and non-soluble deposit density (NSDD) was measured, as was the ESDD and NSDD of the soaked samples. Based on IEC standard, 300 mL deionized water was used to wipe off the contaminants when measuring the ESDD.
NaCl and the other six soluble constituents (KNO3, NH4NO3, NaNO3, Ca(NO3)2, CaSO4, and MgSO4) were used in this study to make the pollution solution.

2.3.3. Flashover Test

The polluted insulators were firstly precharged by a predicted voltage level and then wetted by steam fog. The fog was generated by a 1.5 t/h boiler, for which the rate was 0.05 ± 0.01 kg/h·m3. During the flashover test, the temperature in the chamber was maintained between 30 °C and 35 °C through control of the refrigeration system, and the atmospheric pressure was 98.6 kPa in all the experiments.
In the tests, up-and-down method was adopted to get a 50% withstand voltage U50. Each contaminated sample was subjected to at least 10 “valid” individual tests. The applied voltage level in each test was varied through up-and-down voltage. The voltage step was approximately 5% of the expected U50. The first “valid” individual test was selected as being the first one that yields a result different from the preceding ones. Only the individual test and at least 9 following individual tests were taken as useful tests to determine U50.
It is very important to obtain the predicted flashover voltage level for the first up-and-down evaluation. Firstly, a small voltage on the suspended samples was applied, and then the steam fog was opened; the wetting condition of the surface was judged by observing the surface water film situation as well as the variation of recorded leakage current waveform. When the surface water films were formed and connected with each other, or the leakage current reached a high value and then started decreasing, the insulator pollution surface was treated as wholly wetted. Then, the voltage was lifted until flashover. The final voltage value was taken as the predicted flashover voltage.
When testing, the polluted insulators were firstly precharged by a predicted flashover voltage level, and then the steam fog was opened. If flashover occurred, the voltage applied in the next test was set 5% lower; however, if the current recorded peaks had decreased to values permanently lower than 70% of the maximum peak [14], the withstand of the insulator was considered definitive and the test was stopped—in this case, the applied voltage was set 5% higher in the next test. The U50 and relative standard deviation error (σ) are calculated as follows:
U 50 = ( U i n i ) N
σ = ( i = 1 N ( U i U 50 ) 2 ) / ( N 1 ) / U 50 × 100 %
where Ui is an applied voltage level, ni is the number of tests carried out at the same applied voltage Ui, N is the total number of “valid” tests, and σ is the relative standard deviation.
In summary, the detail procedure of the up-and-down method is shown in Figure 2, and one example of data record was shown in Table 3.

3. Test Results and Analysis

The insulator flashover voltage gradient can be expressed by:
E L = U 50 / L
Test results are shown in Table 4, where it can be seen that:
(1)
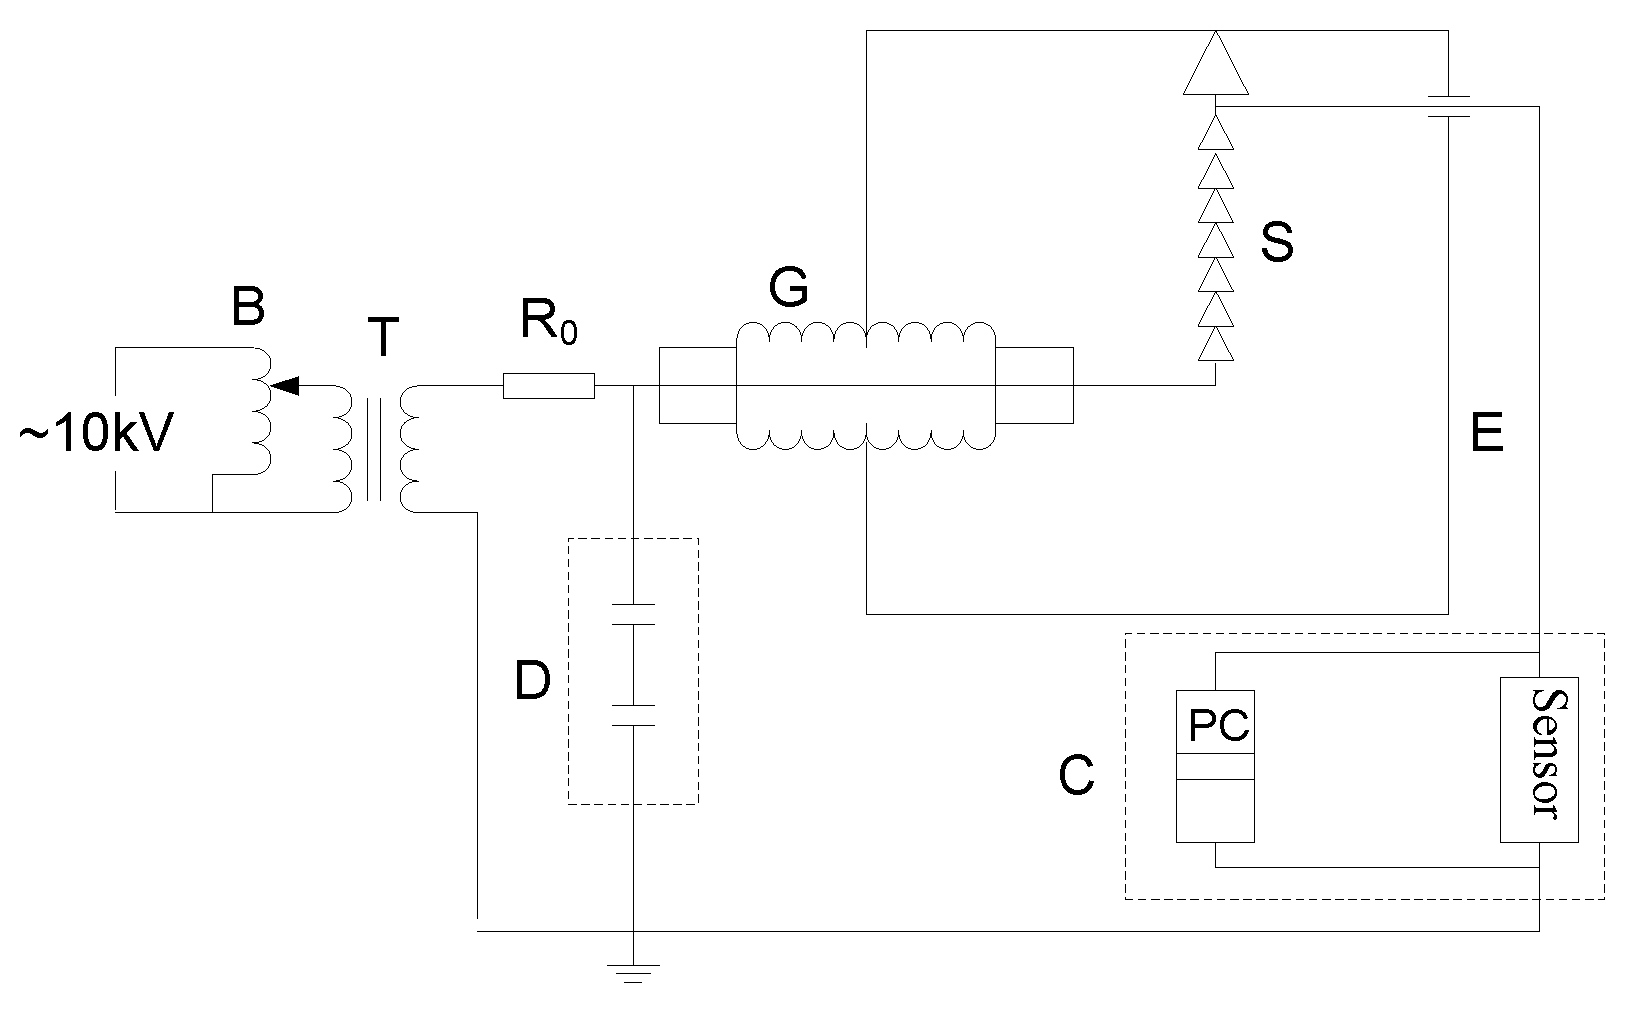
The relative errors were lower than 7%, so the dispersion degree of the data acquired by the test procedure is very small. Besides, NSDD was controlled narrowly within 0.08–0.12 mg/cm2 through the dipping method, which means that the effects of NSDD on flashover voltage can be neglected.
(2)
Insulator flashover performance is quite different under different soluble constituents. For example, when the constituent is NaNO3 and ESDD is 0.031 mg/cm2, insulator EL is 55.5 kV/m; however, when the soluble constituent is MgSO4 and ESDD increases to 0.049 mg/cm2, the EL increases to 57.3 kV/m. A higher ESDD value does not always mean a lower flashover voltage when the soluble constituent is different.
(3)
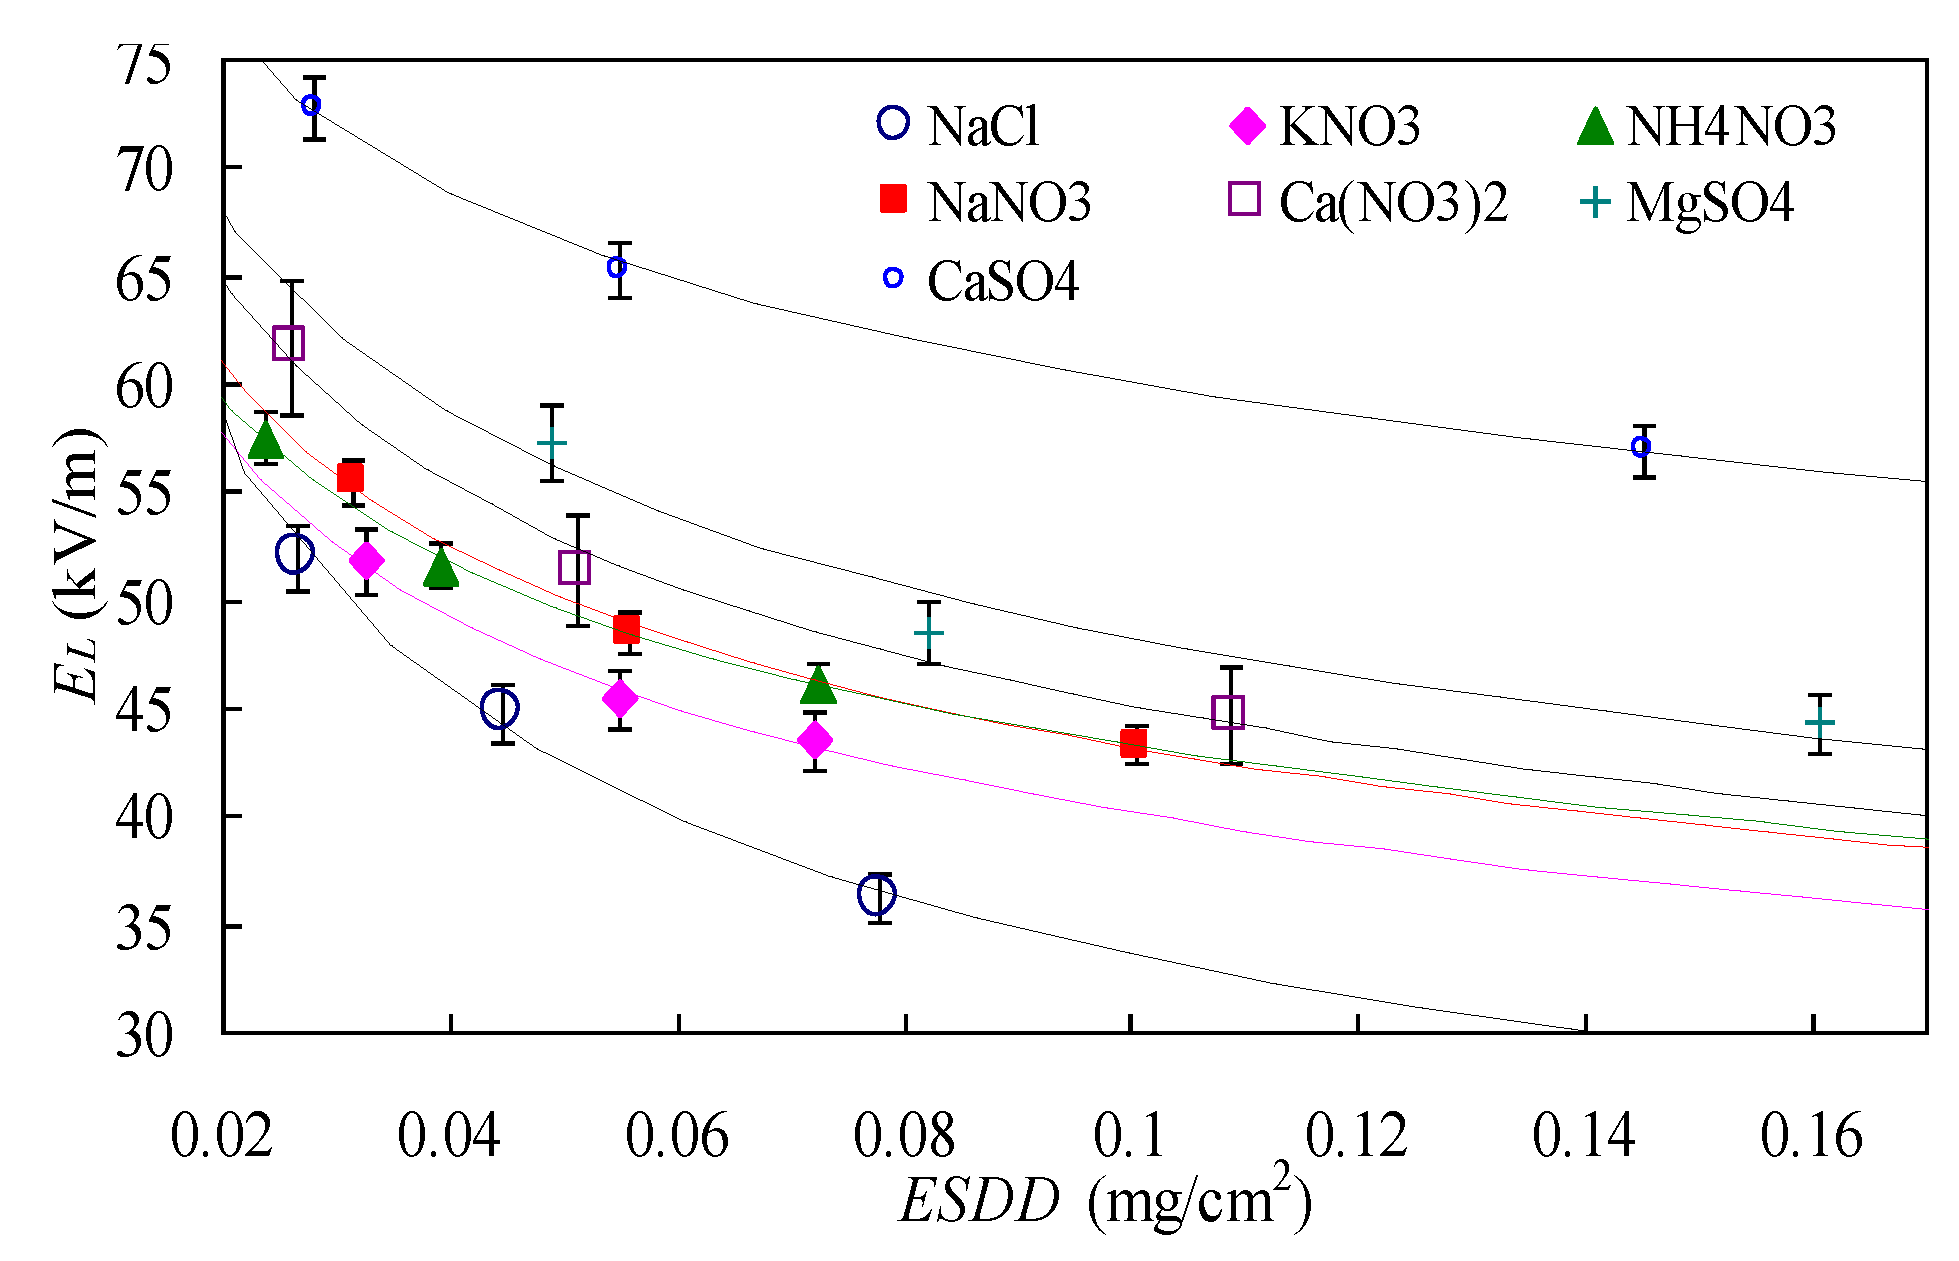
The negative exponent function in Equation (1) was used to fit the data in Table 2; the results are shown in Figure 3.
The curves fall into the 3% error bars of the data points, meaning the fit is good. It can be seen from the figure that different soluble constituent corresponds to different ELESDD variation trends. Given the same ESDD, the flashover gradient of slightly soluble salt CaSO4 is always the highest, and it decreases the most slowly with the increase of ESDD. The flashover gradient of NaCl is always the lowest, and it decreases the fastest with the increase of ESDD.
Fitting results of coefficients A and n are shown in Table 5.
For the seven kinds soluble constituents, the A value of the insulator sample varies within 15.5–36.2, n varies within 0.19–0.34. It indicates that different soluble constituent corresponds to very different EL-ESDD relationship, and A is also associated with pollution chemical type. In summary, consideration of chemical compositions is necessary when calculating insulator pollution flashover voltage.
Flashover tests of the insulator sample polluted by soluble constituents’ mixture were also carried out. The components and their weight percentage of the pollution mixtures were determined basically according to the data in [16,17,18]. In this study, three types of pollution mixtures were simulated, which represented a highway area, chemical plan area, and seaside, respectively. Test results are shown in Table 6.
It can be seen from Table 6 that under different types of pollution mixtures, the flashover performance varies. For example, when ESDD was about 0.081 mg/cm2, the EL under Type I pollution was 50.6 kV/cm, while that under Type II was 47.8 kV, a decrease of 6%.
Using the traditional method, which is only based on insulator flashover performance under NaCl (shown in Equation (1)), the flashover voltage gradient under pollution mixture was calculated. Calculation results and relative errors are shown in Table 7.
The relative errors are very high, meaning that the traditional flashover voltage calculation method leads to serious deviation in guiding external insulation design of field operating lines which are inevitably polluted by various kinds of constituents. A correction procedure should be proposed to consider the factors of soluble constituents and to optimize the flashover voltage calculation results.

4. Correction of Flashover Gradient Considering Soluble Pollution

4.1. Correction Based on Equivalent Salt Density Contribution Ratio

According to Equation (2) which was provided by literature [7], flashover voltage gradient under a salt mixture can be expressed by:
E L M = i = 1 m S D D i × E L i i = 1 m S D D i = ( i = 1 m S D D i × E L i ) / E S D D M
where ELM is the flashover voltage gradient under a pollution mixture composed of m kinds soluble constituents, kV/m; ESDDM stands for the measured equivalent salt deposit density (ESDD) of the mixture pollution solution; SDDi stands for equivalent salt deposit density contributed by soluble constituent i, mg/cm2; and ELi is the flashover voltage gradient corresponding to single soluble constituent i under ESDDM.
ELi can be obtained based on the fitting results in Table 5:
E L i = A i × E S D D M n i
So, if ESDDM and SDDi are determined, Equation (6) can be solved. For a certain pollution mixture, its ESDDM is directly the measured equivalent salt deposit density of the mixture solution. However, SDDi of each soluble constituent in the given pollution mixture is uncertain, because the existing chemical test techniques can only determine the ion component and weight of each chemical constituent in the soluble mixture [16,17,18].
Suppose βi is the weight percentage of soluble constituent i in the pollution mixture, αi is the contribution ratio of a certain weight of constituent i to equivalent salt deposit density, and WM is the total weight of the soluble mixture:
S D D i = α i × β i × W M
With Equation (8), Equation (6) can be simplified and rewritten as:
E L M = i = 1 m ( α i β i × A i × E S D D M n i ) i = 1 m α i β i = i = 1 m ( η i × A i × E S D D M n i ) η i = S D D i E S D D M = α i β i i = 1 m α i β i
where ηi stands for the ESDD percentage of soluble constituent i. It can be seen from Equation (9) that if αi and βi corresponding to each soluble constituent are determined, the flashover voltage gradient can be solved.
Equivalent salt density is basically derived from the conductivity of a certain solution, thus, soluble constituent conductivity tests were carried out. During the tests, the volume conductivity of each electrolyte solution under different concentrations was measured, and then the results were converted to the standard temperature (20 °C), as shown in Figure 4:
It can be seen that the volume conductivity presents an almost linear relationship with the increment of electrolyte concentration. It is known that ESDD is calculated based on the NaCl conductivity-weight relationship:
E S D D = S a V A
Sa can be calculated by volume conductivity, expressed as:
S a = ( 5.7 σ 20 ) 1.03
It can be seen that ESDD is almost linear with the volume conductivity. So, the contribution ratio of soluble constituents to ESDD can be obtained through comparing the conductivity curves’ slopes to the NaCl conductivity curve slope, as shown in Table 8.
With Table 8 and the weight percentage of each constituent given in 6, Equation (9) can be solved, as is shown in Table 9.
It can be seen from the table that when considering the equivalent salt density of each soluble constituent, the relative errors between calculated and tested values decreased a lot. Two of the errors were already within 7%, which is acceptable for the prospective of practical engineering.
However, when it comes to a Type III pollution mixture, the relative error is still not acceptable. For Type III pollution, the amount of CaSO4 makes up to 60%, and the ESDD reaches 0.251 mg/cm2. In this circumstance, a large amount of CaSO4 cannot be dissolved during the insulator wetting process, which means the ESDD contribution ratio of CaSO4 needs to be reconsidered, given its easy saturation feature.

4.2. Correction Based on Calcium Sulfate’s Slight Solubility

The contribution of CaSO4 to ESDD is different from other soluble constituents, of which the solubilities are much higher, and the volume conductivities are linear with concentration. CaSO4 is slightly soluble, with a solubility of about 2 g/L at 20 °C. The CaSO4 on the surface of an insulator cannot dissolve sufficiently during the actual insulator wetting process in a steam chamber.
Under normal circumstances, one standard suspension insulator unit can only be coated by approximately 20 mL water [13], and this volume is much smaller than the 300 mL water used when measuring the ESDD. This fact will not affect the contribution of good diffluent constituents, but does bring obvious error when hard-to-dissolve salt CaSO4 makes up a large part of the pollution mixture, because in this case a greater portion of the CaSO4 does not act as conductive electrolyte if the insulator surface is wetted by just 20 mL water.
Considering this, the conductivity performance of high concentration CaSO4 solution was measured, and then a comparison was made between the ESDD contribution of CaSO4 in 20 mL solution and in 300 mL solution, as shown in Figure 5.
It can be seen from Figure 4 that the ESDD contribution of CaSO4 is overrated, considering the limited volume of insulator surface water absorbed. The saturated ESDD contribution (ESDDS, as shown Figure 5) of CaSO4 is only equal to 0.038 mg/cm2 if the water volume is 20 mL, which is much lower than the ESDD contribution for a volume of 300 mL.
The ESDD contribution of CaSO4 under 300 mL solution (ESDDi300) can be calculated using the measured ESDDM, based on Equation (9):
E S D D i 300 = η i × E S D D M i = C a S O 4
Then, according to Figure 5, the corrected CaSO4 ESDD contribution, considering slight solubility and limited wetting amount, can be expressed as follows:
E S D D i 20 = { E S D D i 300 , E S D D i 300 < E S D D S E S D D s , E S D D i > E S D D S i = C a S O 4 , E S D D S = 0.038 m g / c m 2
where ESDDi20 is the corrected value, assuming the largest surface-coated volume of water is 20 mL.
The measured ESDD value of the pollution mixture should also be corrected to the 20 mL situation:
E S D D M * = E S D D E S D D i 300 + E S D D i 20 i = C a S O 4
Then, the ESDD percentage of each constituent should be modified:
η i * = { η i × E S D D M E S D D M * i C a S O 4 E S D D i 20 / E S D D M * i = C a S O 4
Considering the slight solubility of CaSO4, and using Equations (14) and (15) to correct the measured equivalent salt deposit density (ESDDM) and ESDD percentage (ηi) of each constituent, the results are as shown in Table 10.
It can be seen from the table that for the Type III pollution mixture, its actual equivalent salt deposit density and constituent ESDD percentage are changed obviously after correction. This is because the weight of CaSO4 in the Type III pollution mixture is much greater than those in the other two types.
As the table shows, for the Type III pollution mixture, its actual equivalent salt deposit density should be 0.164 mg/cm2, decreased by 34.6% compared to the measured value using 300 mL water; the ESDD percentage of CaSO4 should be 0.232, decreased by 54% compared to the measured value using 300 mL; and for other soluble constituents, their ESDD percentage increased a bit. This indicates that the traditional method of measuring ESDD will overrate the influence of slightly soluble constituents on flashover voltage.
Using the corrected data of Table 10 to correct the ELM value:
E L M * = i = 1 m ( η i * × A i × E S D D M * n i )
The corrected flashover voltage gradient values and corresponding relative errors are as shown in Table 11.
It can be seen obviously that the relative error for the Type III pollution mixture decreases from −20.4% to −4.4%, which means the correction, when considering the slight solubility of CaSO4, does lower the calculated error, making the flashover voltage gradient calculation more accurate and scientific.

5. Discussion

The flashover tests in a laboratory climate chamber cannot actually reflect the real flashover of a natural polluted insulator, making the voltage calculating error inevitable. However, through the correction process proposed in this paper, the error can be significantly reduced. It is important to calculate the ESDD contribution ratio of each soluble constituent when predicting flashover voltage of natural polluted insulator, because different soluble constituents on an insulator surface correspond to different flashover performances. Also, consideration of CaSO4 saturation performance is a necessary step due to CaSO4 always occupies the largest proportion of natural contaminants.
Currently, the effects of pollution constituents have been brought to the attention of relative research institutes. They conducted plenty of measurements on field insulator surface chemical components, and the most commonly used method is IC (ion chromatograph) analysis [4,16,17,
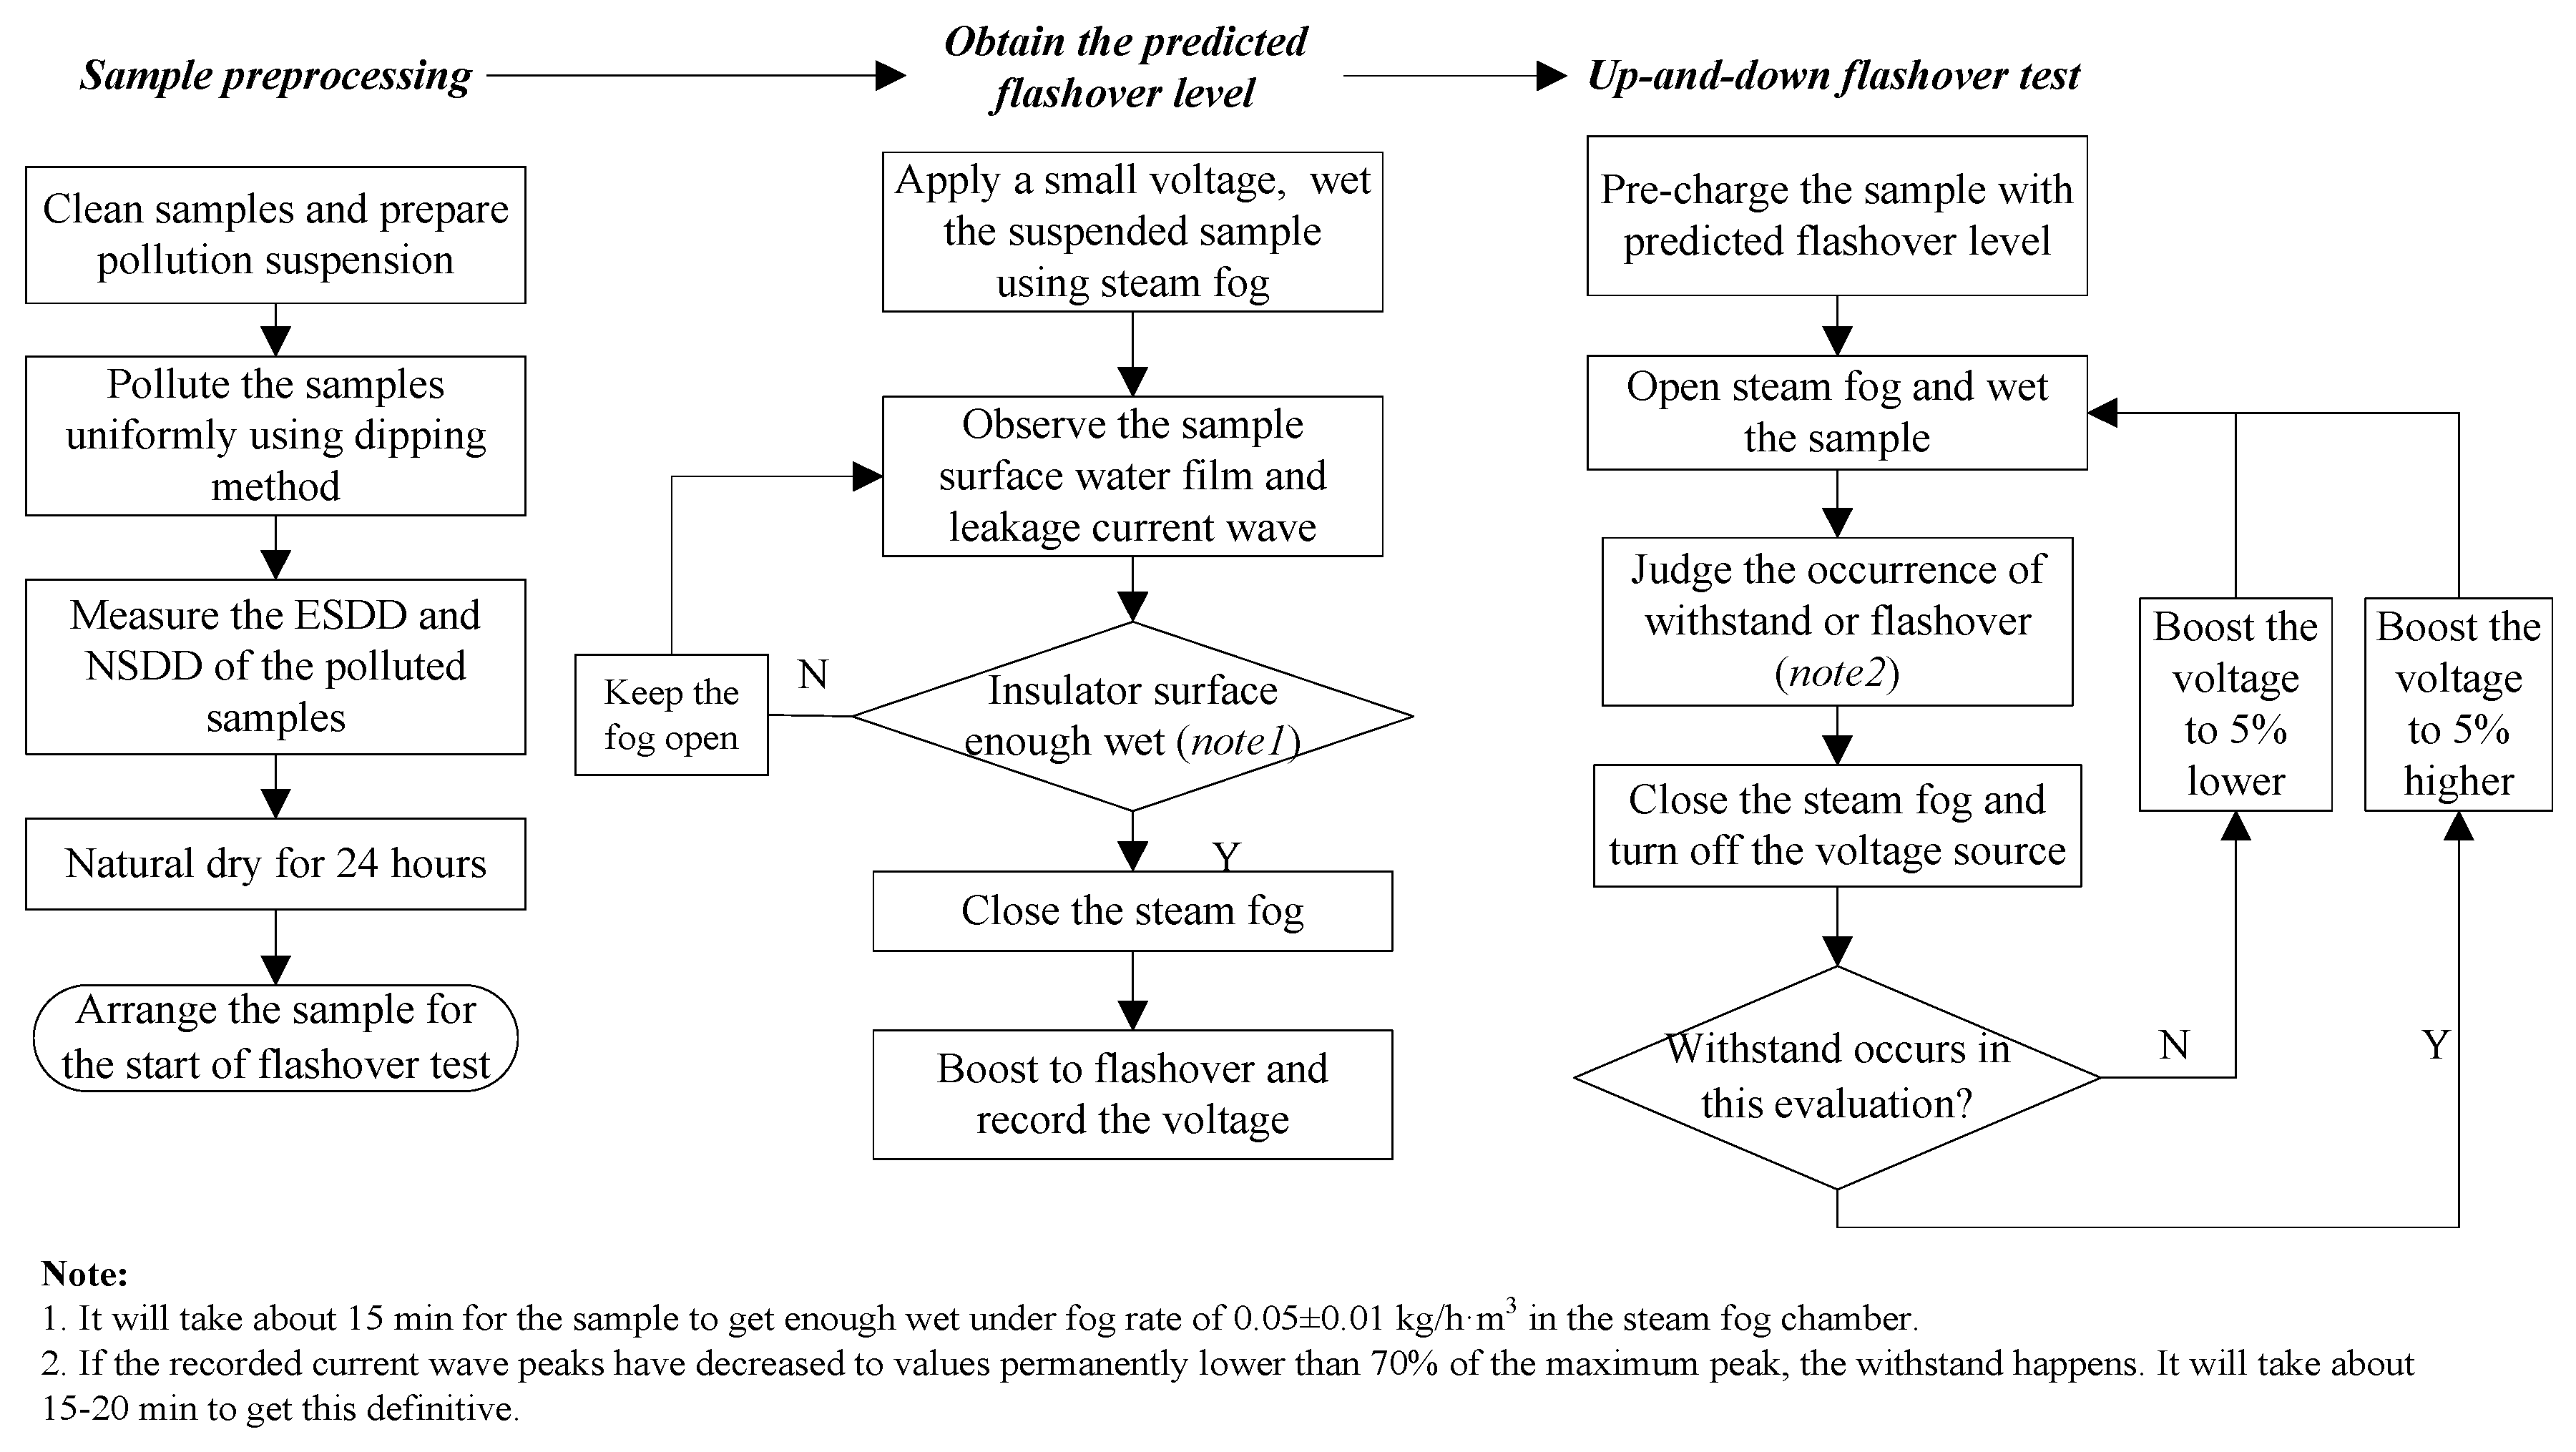
18]. This method provides accurate categorization of negative and positive ions, as well as their mass percentage in the pollution solution. Then, the soluble constituents and their weights in the pollution solution can be easily determined by pairing the ions. Based on this, the flashover gradient of an insulator under natural pollution conditions can be better determined through a systematical correction procedure shown in Figure 6.
This procedure remedies the deficiency of the traditional ESDD method by considering the soluble constituents of insulator surface contaminants, and it is easy to implement in engineering practice.

6. Conclusions

In this paper, a systematic study on insulator flashover gradient correction involving different soluble pollution constituents was presented, and the conclusions are as follows.
(1)
Insulator flashover performance is quite different with differently soluble constituents. A higher ESDD value does not always mean a lower flashover voltage when the soluble constituent is different.
(2)
For the seven kinds constituents with different solubilities presented in this paper, the A value of the insulator sample varies within 15.5–36.2 and n varies within 0.19–0.34. Different solubilities of constituents correspond to very different EL-ESDD relationships.
(3)
The proposed flashover gradient correction method, which considers a soluble constituent’s ESDD contribution and CaSO4 saturation characteristic, performs well for reducing the calculating error. It is recommended to carry out component measurements and flashover gradient correction to better select outdoor insulation configuration.

Acknowledgments

This work was supported by the Funds for Innovative Research Groups of China (51321063), Chongqing University Postgraduates’ Innovation Project (2015, No. CYB15031) and State Grid Corporation Science Project (SGTYHT/14-JS-188).

Author Contributions

The authors gratefully acknowledge the contributions as following: Xingliang Jiang and Zhijin Zhang conceived and designed the experiments; Dongdong Zhang, Zhongyi Yang and Jiayao Zhao performed the experiments; Dongdong Zhang and Zhongyi Yang analyzed the data; Yongfu Li contributed reagents; Dongdong Zhang wrote the paper.

Conflicts of Interest

The authors declare no conflict of interest. The founding sponsors had no role in the design of the study; in the collection, analyses, or interpretation of data; in the writing of the manuscript, and in the decision to publish the results.

References

  1. Pollution Classification and External Insulation Selection for Electric Power System; State Grid Standard Q/GDW152-2006; Electric Power Research Institute of State Grid: Shanghai, China, 2006. (In Chinese)
  2. Slama, E.A.; Hadi, H.; Flazi, S. Investigation on influence of salts mixture on the determination of flashover discharge constant. Part I: A preliminary study. In Proceedings of the Annual Report—Conference on Electrical Insulation and Dielectric Phenomena, Quebec City, QC, Canada, 26–29 October 2008; pp. 674–677.
  3. Wang, K.; Wang, J.; Yao, S.; Fang, C.; Zhao, L.; Wang, J. Natural Contamination Characteristics of Post Insulator in Shenzhen Area. High Volt. Eng. 2014, 40, 780–786. [Google Scholar]
  4. Li, H.Z.; Liu, G.; Li, L.C.; Tan, G.X.; Ruan, X.J.; Chen, R. Measurement and analysis of natural contamination ion composition using ion chromatograph analysis. High Volt. Eng. 2010, 36, 2154–2159. [Google Scholar]
  5. Ramos, G.; Campillo, M.T.; Naito, K. A study on the characteristics of various conductive contaminants accumulated on high voltage insulators. IEEE Trans. Power Deliv. 1993, 16, 1842–1850. [Google Scholar] [CrossRef]
  6. Williams, L.J.; Kim, J.H.; Kim, Y.B.; Arai, N.; Shimoda, O.; Holte, K.C. Contaminated insulators-chemical dependence of flashover voltages and salt migration. IEEE Trans. Power Appar. Syst. 1974, 93, 1572–1580. [Google Scholar] [CrossRef]
  7. Holte, K.C.; Kim, J.H.; Cheng, T.C.; Kim, Y.B.; Nitta, Y. Dependence of flashover voltage on the chemical composition of multi-component insulator surface contaminants. IEEE Trans. Power Appar. Syst. 1976, 95, 603–608. [Google Scholar] [CrossRef]
  8. Zhang, Z.; Jiang, X.; Sun, C.; Hu, J.; Huang, H. Study of the Influence of Test Methods on DC Pollution Flashover Voltage of Insulator Strings and its Flashover Process. IEEE Trans. Dielectr. Electr. Insul. 2010, 17, 1787–1795. [Google Scholar] [CrossRef]
  9. Farzaneh, M.; Farokhi, S.; Chisholm, W.A. Electrical Design of Overhead Power Transmission Lines, 1st ed.; McGraw-Hill Professional: New York, NY, USA, 2013. [Google Scholar]
  10. Jiang, X.; Shu, L.; Sun, C. Electric Power System and Iced Insulation; Chinese Electric Power Press: Beijing, China, 2009. (In Chinese) [Google Scholar]
  11. Ghosh, P.J.; Chatterjee, N. Polluted insulators flashover for AC voltage. IEEE Trans. Dielectr. Electr. Insul. 1995, 2, 128–136. [Google Scholar] [CrossRef]
  12. Slamal, M.A.; Beroual, A.; Hadi, H. Influence of Pollution Constituents on DC Flashover of High Voltage Insulators. IEEE Trans. Dielectr. Electr. Insul. 2013, 20, 401–408. [Google Scholar] [CrossRef]
  13. Zhang, Z.; Zhang, D.; Jiang, X.; Liu, X. Effects of pollution materials on the AC flashover performance of suspension insulators. IEEE Trans. Dielectr. Electr. Insul. 2015, 22, 1000–1008. [Google Scholar] [CrossRef]
  14. Artificial Pollution Tests on High Voltage Insulators to Be Used on AC Systems; IEC 60507; International Electrotechnical Commission (IEC): Geneva, Switzerland, 1991.
  15. Zhang, Z.; Liu, X.; Jiang, X.; Hu, J.; Gao, D.W. Study on AC Flashover Performance for Different Types of Porcelain and Glass Insulators with Non-Uniform Pollution. IEEE Trans. Power Deliv. 2013, 28, 1691–1698. [Google Scholar] [CrossRef]
  16. Song, Y.; Liu, G.; Li, H. Comparative analysis of natural contamination composition on insulators at highway area and highway-farmland area. High Volt. Appar. 2010, 46, 22–25. (In Chinese) [Google Scholar]
  17. Huang, Q.; Lu, G.; Li, L.; Huang, H.; Zhang, D.; Song, H. Analysis on contamination chemical composition of insulator in Guangzhou region transmission lines. High Volt. Appar. 2013, 49, 85–91. (In Chinese) [Google Scholar]
  18. Li, W. Chemical composition analysis of transmission line pollution. Guangdong Power Transm. Technol. 2010, 12, 53–55. (In Chinese) [Google Scholar]
Figure 1. Schematic diagram of the alternating current (AC) test circuit, B—the voltage regulator, T—the test transformer, R0—the protective resistance, G—the wall bushing, D—the capacitive voltage divider, E—the climate chamber, C—the leakage current measurement system, and S—the insulator string sample.
Energies 09 00954 g001
Figure 2. The diagram for the test procedure.
Energies 09 00954 g002
Figure 3. Fitting curves of each soluble constituent using nagative exponent function.
Energies 09 00954 g003
Figure 4. Different soluble constituent volume conductivity performance.
Energies 09 00954 g004
Figure 5. The ESDD contribution of CaSO4, considering different amounts of water.
Energies 09 00954 g005
Figure 6. Flashover voltage gradient correction procedure for natural polluted insulator.
Energies 09 00954 g006
Table 1. List of principal symbols and terms.
SymbolDescriptionUnit
Ufflashover voltagekV
ESDDequivalent salt deposit densitymg/cm2
Acoefficient related to the shape of the insulator, insulator surface material, air pressure, power source type, etc.N/A
ncharacteristic exponent characterizing the influence of ESDD on UfN/A
ia certain soluble chemical contained in insulator pollutionN/A
ULFOVΣlimiting flashover voltage of mixture electrolyte solutionkV
ULFOVithe limiting flashover voltage of single electrolyte solution of ikV
ρESDDΣthe ESDD of the mixture electrolyte solutionmg/cm2
ρESDDithe ESDD of single electrolyte solution of img/cm2
U5050% withstand voltagekV
ELflashover voltage gradientkV/m
Linsulator string’s creepagem
Vvolume of the suspension used to collect insulator pollutionmL
Athe area of insulator surfacecm2
Sasalinity of the collected suspensionkg/m3
σ20volume conductivity at a temperature of 20 °CS/m
ESDDMthe measured ESDD value of insulator surface pollution mixturemg/cm2
ηiESDD contribution percentage of soluble constituent i in mixtureN/A
Limiting flashover voltage: the lowest flashover voltage occurs during flashover tests.
Critical flashover voltage: the theoretical value of the applied voltage when flashover.
50% withstand voltage: a voltage value under which the withstand probability is 50%.
Table 2. Profile parameters of the insulator sample, h is the configuration height, l is the leakage distance, and d is the diameter of insulators.
MaterialProfileParameters (mm)
hdl
Glass Energies 09 00954 i001146280400
Table 3. Example for the valid data record.
SamplePollution TypeTest RecordsU/kV, (Flashover ○; Withstand ●)
3-unit LXY4-160 StringNaCl,
ESDD: 0.045 mg/cm2
NSDD: 0.107 mg/cm2
String 1Test No.1234
Records54.1 ○52.5 ○50.6 ●54.0 ○
String 2Test No.1234
Records51.2 ●53.7 ●56.4 ●60 ●
String 3Test No.1234
Records56.7 ○52.7 ●56.4 ●60.3 ●
String 4Test No.1234
Records52 ●55.1 ○53.4 ●
(1) For this example, 54.1 kV is the predicted value, and only the 11 bold voltage values are the valid data; (2) Each sample string was only subjected to 3–4 evaluations to avoid pollution loss by a long duration of fog wetting; (3) The 60 kV and 60.3 kV data points are the odd data which may be caused by pollution loss during wetting; (4) It is impossible to control voltage step to ±5% accurately. In actual tests the voltage step was basically 4%–6%.
Table 4. Test results of insulator strings polluted with different soluble constituents.
Soluble ConstituentFlashover ParametersTest Results
NaClESDD (mg/cm2)0.0270.0450.078
NSDD (mg/cm2)0.1320.1070.103
EL (kV/m)51.944.836.2
σ (%)5.23.83.4
KNO3ESDD (mg/cm2)0.0320.0550.072
NSDD (mg/cm2)0.0740.0780.087
EL (kV/m)51.845.443.5
σ (%)5.45.23.3
NH4NO3ESDD (mg/cm2)0.0240.0390.073
NSDD (mg/cm2)0.1230.1190.124
EL (kV/m)57.551.646.2
σ (%)4.34.64.9
NaNO3ESDD (mg/cm2)0.0310.0560.100
NSDD (mg/cm2)0.1050.0920.084
EL (kV/m)55.548.543.3
σ (%)4.73.64.4
Ca(NO3)2ESDD (mg/cm2)0.0260.0510.109
NSDD (mg/cm2)0.0900.0860.100
EL (kV/m)61.751.444.7
σ (%)4.73.33.2
MgSO4ESDD (mg/cm2)0.0490.0820.160
NSDD (mg/cm2)0.1420.1330.151
EL (kV/m)57.348.544.3
σ (%)4.74.83.2
CaSO4ESDD (mg/cm2)0.0550.1450.028
NSDD (mg/cm2)0.0920.0880.079
EL (kV/m)65.356.972.8
σ (%)5.15.65.3
Table 5. Fitting results of insulator flashover gradient with different soluble constituents
SaltELi = Ai × ESDD−ni
NaClNH4NO3KNO3Ca(NO3)2CaSO4MgSO4NaNO3
A15.527.423.826.936.229.526.4
n0.340.190.220.220.180.210.21
Table 6. Test results of insulator strings polluted with three types of soluble constituents mixture.
Pollution Mixture Based on Weight PercentageParametersTest Results
Type I: CaSO4 57.5%, NaCl 13.1%, KNO3 9%, NaNO3 8.7%, NH4NO3 6.4%, MgSO4 3.7%ESDD (mg/cm2)0.081
NSDD (mg/cm2)0.117
EL (kV/m)50.6
σ (%)5.1
Type II: CaSO4 54.3%, NaCl 10.3%, NaNO3 2.2%, KNO3 6.3%, Ca(NO3)2 20.7%, MgSO4 4.2%ESDD (mg/cm2)0.082
NSDD (mg/cm2)0.128
EL (kV/m)47.8
σ (%)4.7
Type III: CaSO4 59.4%, NaCl 13.6%, KNO3 9.5%, Ca(NO3)2 7.8%, MgSO4 7.9%ESDD (mg/cm2)0.251
NSDD (mg/cm2)0.112
EL (kV/m)32.8
σ (%)4.6
Table 7. Test results of insulator strings polluted with three types of soluble constituents mixture, EL* means the calculated value of flashover gradient.
Mixture TypeESDD (mg/cm2)Calculated Value
EL* (kV/m)
Relative Error Δ (%)
Type I0.08133.833.2
Type II0.08235.226.3
Type III0.25122.531.4
Δ = (ELEL*)/EL × 100%
Table 8. Equivalent salt deposit density (ESDD) contribution ratio of soluble constituents.
SaltNaClNH4NO3KNO3Ca(NO3)2CaSO4MgSO4NaNO3
αi1.0000.8850.7330.5500.4850.4620.784
Table 9. Flashover voltage gradient correction considering each constituent’s contribution to ESDD.
Mixture TypeESDD (mg/cm2)Calculated ELM Using Equation (9) (kV/m)Relative Error Δ (%)
Type I0.08149.91.5
Type II0.08251.0−7.0
Type III0.25139.5−20.4
Δ (%) = (ELELM)/EL × 100%
Table 10. Correction of measured equivalent salt deposit density and ESDD percentage of each soluble constituent.
Pollution TypeType IType IIType III
ESDDM correctionESDDMESDDM*ESDDMESDDM*ESDDMESDDM*
0.0810.0810.0820.0820.2510.164
ηi correctionηiηi*ηiηi*ηiηi*
CaSO40.4510.4510.4680.4680.5030.232
NaCl0.2120.2120.1830.1830.2370.363
KNO30.1070.1070.0820.0820.1220.186
NaNO30.1100.1100.0310.0310.0000.000
NH4NO30.0920.0920.0000.0000.0000.000
MgSO40.0280.0280.0340.0340.0640.097
Ca(NO3)20.0000.0000.2020.2020.0750.115
Table 11. Flashover voltage gradient correction, considering the slight solubility of CaSO4.
Pollution Mixture TypeESDD (mg/cm2)Calculated ELM* Use Equation (9) (kV/m)Relative Error Δ (%)
Type I0.08149.91.5
Type II0.08251.0−7.0
Type III0.25134.3−4.4
Δ = (ELELM*)/EL × 100%

