1. Introduction
The actual energy coverage of the grid-connected photovoltaic (PV) systems installed in urban contexts largely depends on the impact of the cost-benefit analysis. The economic evaluation plays a key role in the investment decision of householders, which has to be very accurate not only because the savings on the electricity bills due to the PV generation offset the costs related to the installation of PV systems. The economic outcome related to PV systems placed on multi-storeys buildings roofs implies the painstaking study of the interaction between the miscellaneous parameters closely linked to the morphological configurations of urban areas (building roof shape, number of floors and overshadowing effects of the surrounding buildings) and financial, economic and running factors (discount rate, inflation rate, price of the purchased electricity, price of the sold electricity, devices replacement and maintenance, insurance costs). Obviously, also the support mechanisms Feed-in tariff (FIT, net metering, tax credits, cash rebates, capital subsidies and renewable portfolio standards), which governments have enacted to promote PV dissemination and enforce the reduction of CO2 emission due to the use of fossil fuels, can significantly impact on the expected return on the investment and determine the PV technology success. The effectiveness of the promoting policies implemented by numerous countries has been widely analysed in literature.
Net metering, which is the simplest incentive for renewables, allows residential and commercial electric customers to feed generated PV electricity that they not use back into the grid [
1,
2,
3,
4,
5,
6,
7]. This allows customers to offset their electric consumption by the amount of energy that their PV systems generate. Using a specified meter that records the flow of electricity in both directions, consumers can benefit from the total amount of energy they produce, not just the electricity they consume locally. Unfortunately, due to the high costs of the PV electricity, net metering alone may be insufficient to put PV systems in competition with the other traditional energy production technologies [
8].
By means of renewable portfolio standards a government places an obligation on electricity supply companies to produce a specified fraction of their electricity from renewable energy sources [
3,
4,
5,
6,
9,
10,
11,
12]. The companies are required to acquire renewable energy certificates, also known as tradable green certificates, which are typically equivalent to 1 MWh of electricity created by a renewable resource. To better stimulate the PV development, countries have established targets, known as set-asides or carve-outs, which are provisions that require utilities companies to use a specific renewable source to account for a certain amount of generating capacity or a percentage of their retail electricity sales.
Tax credits are financial incentives based on a non-refundable personal income tax credit, which generally applies only to residential renewable energy systems [
1,
3,
4,
5,
6,
13]. Governments allow PV systems a credit equivalent to a fixed percentage of the installation price, which usually includes on-site preparation, equipment, labour cost, wiring and piping for connection to the grid. Some countries also adopted financial incentives in the form of cash rebates and capital subsidies, which are amounts of money paid to the PV system owners per watt-capacity of the installed PV field or to compensate a fixed percentage of the investment costs.
The FIT scheme provides a constant tariff guaranteed for electricity generated from PV and fed into the grid over a given period of time [
1,
2,
3,
4,
5,
7,
9,
10,
11,
12,
14,
15,
16,
17,
18,
19,
20,
21,
22,
23]. FIT payments may depend on the market price of electricity or not. In a fixed-price FIT, the total per-kWh payment is independent from the market price; in a premium-price FIT payment, the total payment is determined by adding a premium tariff, which can be constant or sliding, to the spot market electricity price. Despite FITs seem to be an effective incentive to boost PV technology growth, an optimal FIT must cover the PV project costs, plus an estimated profit, to reduce the investment risk and ensure a return to investors. The implementation of severe FIT de-escalation rates, justified by the PV device prices decrement observed over the last years, or even a PV support policy moratorium, may not guarantee a reliable economic return over the time and compromise the fulfilment of the electricity demand coverage that may be realistically obtained from renewable energy sources.
The FIT support, which was promoted in Italy since 2005 by means of some consecutive decrees named “Conto Energia”, was discontinued in July 2013. At present, PV systems are incentivised by tax credits that are granted for ten years. Such a new promotion policy has significantly modified the economic convenience of PV systems in Italy. Despite many pessimistic predictions, it seems that the new approach may yield greater advantages for domestic investors and, in turn, increase the amount of electrical consumption covered by the electricity generated by the PV systems installed in densely urbanised areas. With the aim of quantifying the energy effects of the change in the Italian PV support policy, the FIT and current tax credits schemes have been compared for the districts of three densely urbanised Italian cities that are fair representative of the Italian latitudes. The paper is organised as follows: the Italian FIT and tax credits schemes are discussed in
Section 2. In
Section 3, the methodology used for evaluating the viability of the investment is outlined and the case studies are described. The last sections show the results concerning the effectiveness of both the analysed PV policy schemes on the electricity coverage, also considering the effects of the solar energy shading and mismatch between electricity generation and consumption.
2. The Italian Support Policies for Photovoltaics
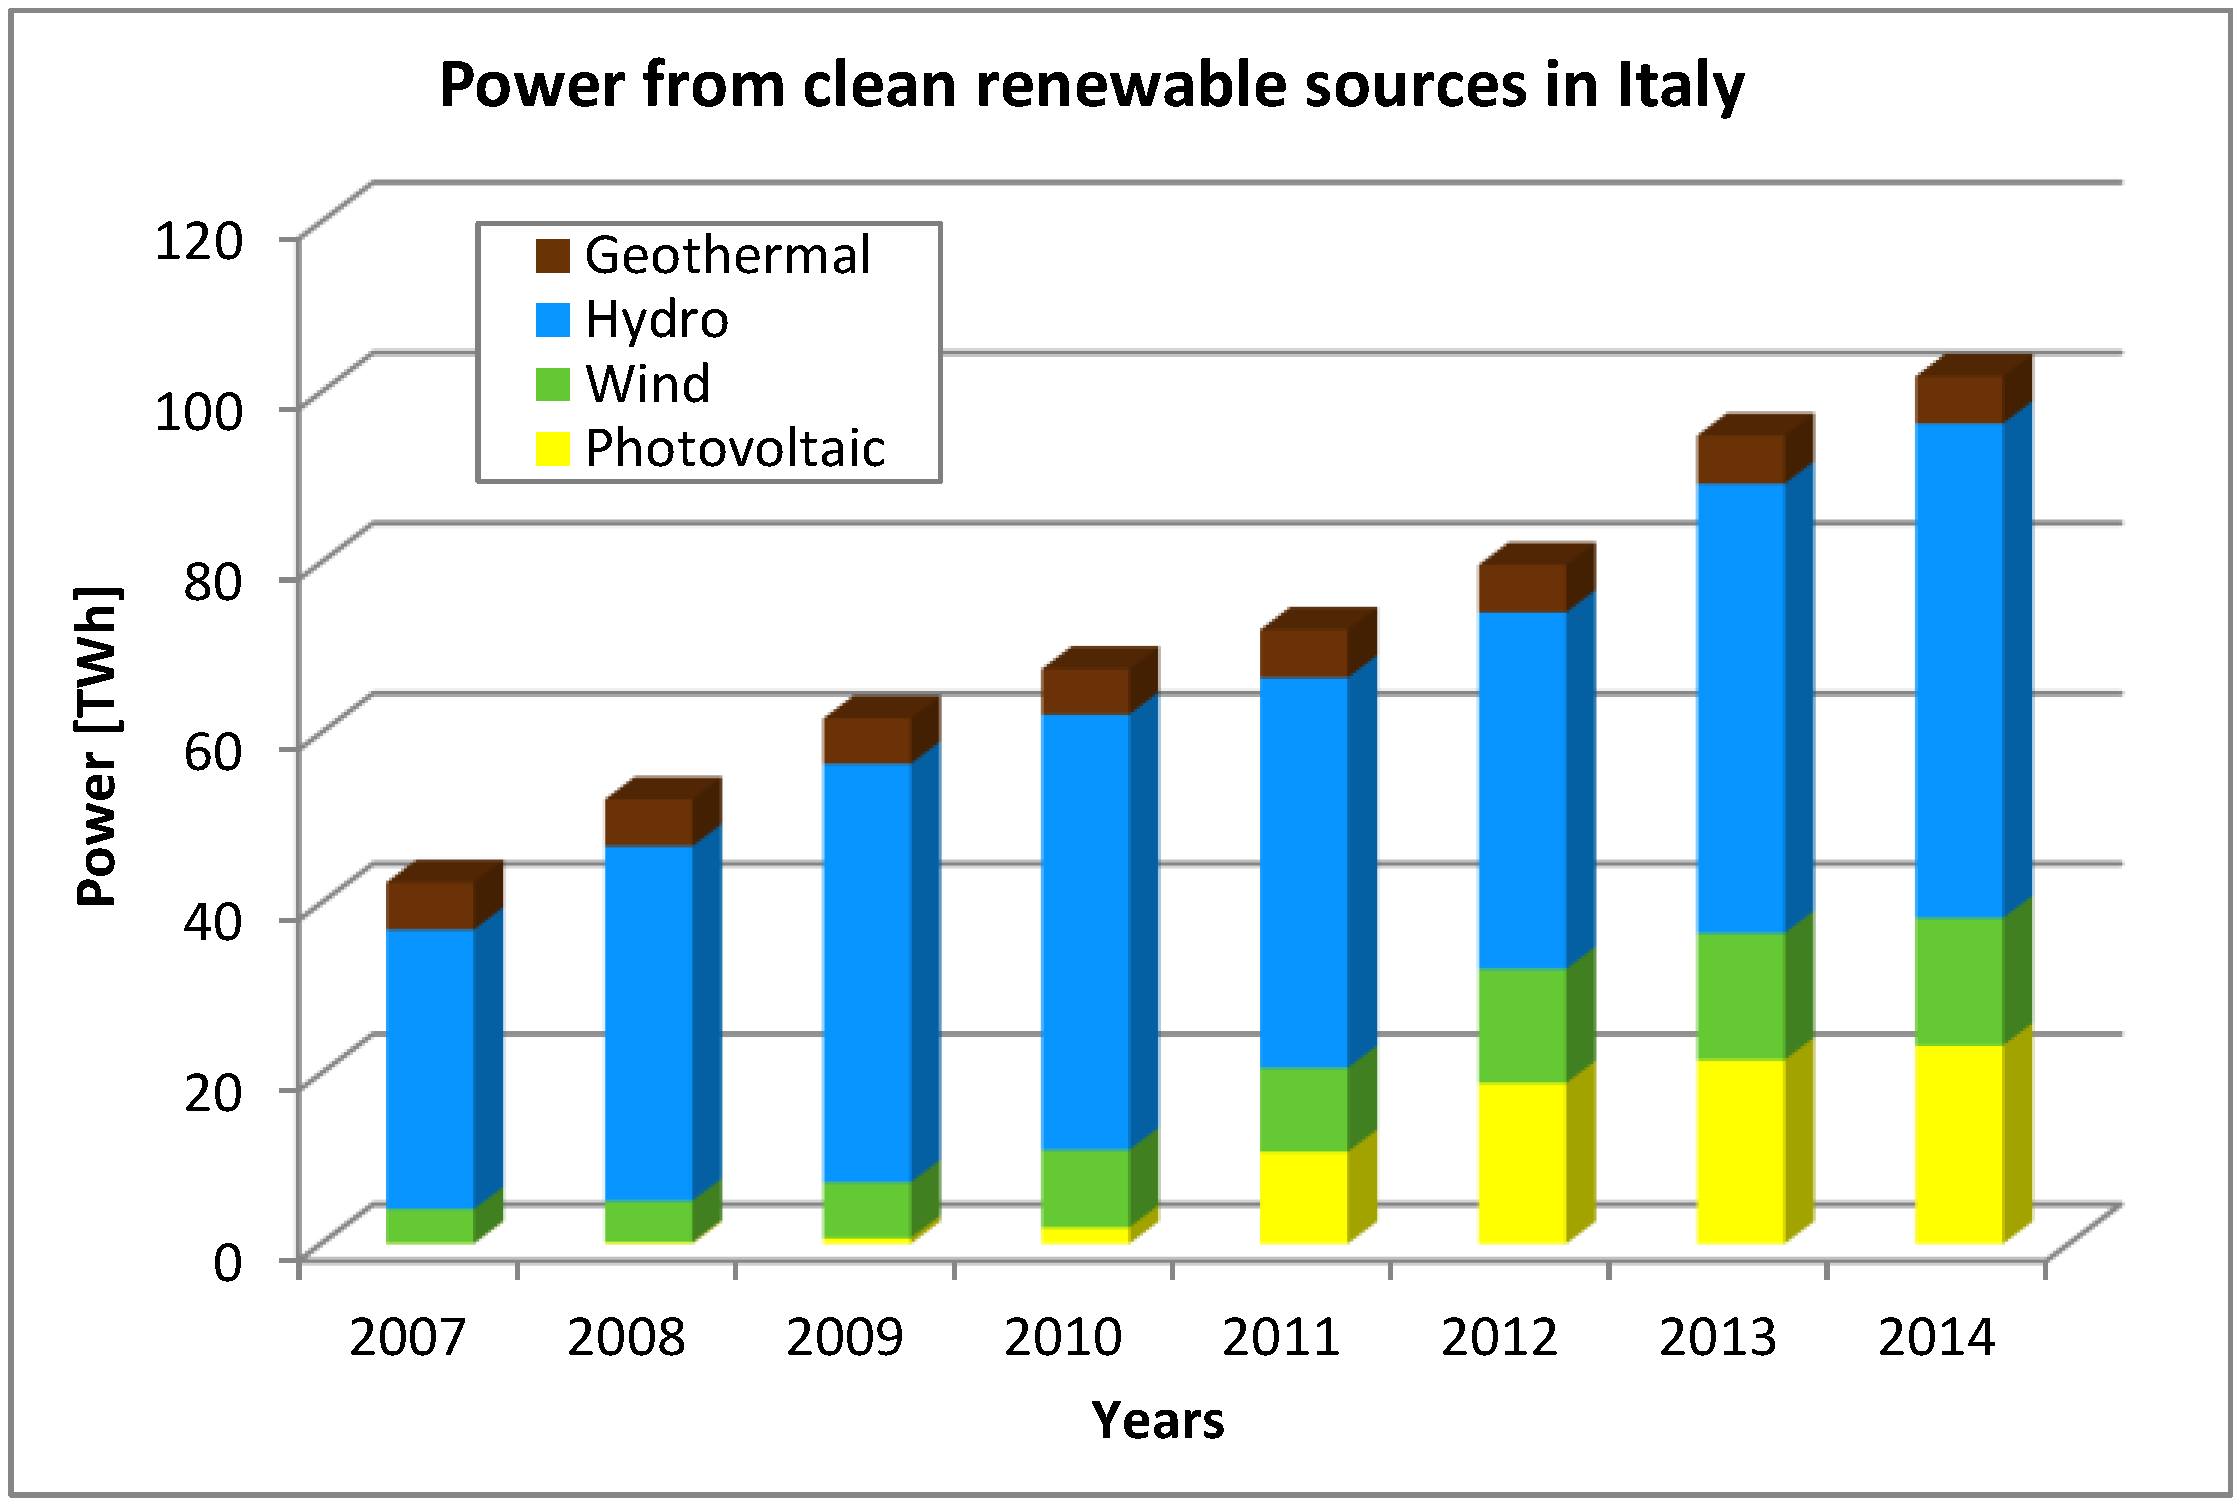
Over the last years the electricity produced by the clean sources of renewable energies has significantly risen in Italy. The power generated by PV systems, which was only 39 GWh in 2007, reached 23,299 GWh at the end of 2014 [
24,
25]. An increase was observed for hydropower and wind power that were 32,815 GWh and 4030 GWh in 2007, respectively, and became 58,067 GWh and 14,966 GWh in 2014. The generation of geothermal electricity, which has varied from 5569 to 5541 GWh during the same period of time, was almost constant.
Figure 1 depicts the variation of the electricity generated by clean renewable sources since 2007.
At the end of 2014 the clean renewable electricity, which has reached 38.08% of the power produced in Italy, was 2.40 times the value measured in 2007. It is easy to observe that PV systems have played a dominant role in increasing the clean renewable electricity generation. Such a result is the long-term effect of the effective promoting policies implemented some years ago, which enhanced the diffusion of PV systems in Italy.
The first PV promoting initiative dates back to 2000 when the Italian government issued the “Photovoltaic roofs” program [
26] that provided consistent financial supports—up to 75% of the investment costs—to install PV systems with a peak power in the range 1 to 20 kW. A maximum investment cost of 8005.08 €/kW was fixed for the PV systems with a nominal power up to 5 kW, whereas such a value was linearly decreased to 7230.40 €/kW for an installed power of 20 kW. The promoting initiative yielded the installation of PV systems for a global power of 27 MW in 2003. Unfortunately, the program had an important drawback as it did not reward the PV system energy efficiency and electricity production. Accordingly, many installed PV systems were out of order after few years because the producers thought it was not worth spending money to replace the damaged PV modules and inverters, whose cost was very high at that time.
In 2005, to put the European Union 2001/77/EC Directive [
27] into effect, the Italian government issued a decree, named 1st “Conto Energia” [
28,
29], that adopted a FIT scheme to incentivise the PV systems diffusion. A premium of 0.445 €/kWh was paid for the electricity generated by the PV systems with a peak power up to 20 kW and self-consumed by the producers; for the energy injected into the grid by the PV systems with a nominal power in the range 20 to 1000 kW a premium, varying from 0.460 to 0.490 €/kWh, was paid. In addition to the previous premiums, which had a duration of 20 years, a simplified purchase and resale arrangement was offered by the “Gestore Servizi Energetici” (GSE), which is the state-owned company that promotes and supports renewable energy sources in Italy, to pay the electricity fed into the grid. The electricity exported to the grid was paid at a guaranteed minimum price, which is updated annually by the Autorità per l’Energia Elettrica, il Gas e il Sistema Idrico (AEEG), Italian Regulatory Authority for electricity and gas, or at an average monthly price per hourly band, which is set on the Italian Power Exchange for the market area to which the PV system is connected. Such a purchase and resale arrangement is currently used. The net metering service, with a balancing period of 3 years, was alternatively proposed for the energy injected into the grid by the only PV systems with a peak power up to 20 kW. The 1st “Conto Energia” expired in March 2006 when the 500 MW target of PV installed power was reached.
In 2007 the 2nd “Conto Energia” [
30], which set a 1200 MW target of PV capacity to be installed at national level, was implemented. Besides simplified purchase and resale arrangements, the net metering service was alternatively proposed for the energy fed into the grid by the PV systems with a peak power up to 20 kW. Different premiums varying from 0.360 to 0.490 €/kWh, depending on the PV system peak power and the used installation typology, were additionally paid for the electricity generated in the next 20 years. The greatest premiums were paid for the PV systems that used building integrated photovoltaic (BIPV) devices to replace architectural elements such as roofs, facades, balustrades, bus shelters, acoustic barriers, windows and sun blind shutters. A premium de-escalation rate of 2%/year was fixed for the PV systems installed after 2008.
In 2009 the AEEG adopted a modified net metering service under which, besides the possibility of using the electricity injected into the grid to offset the electricity withdrawn from the grid for a period of 3 years, a compensatory contribution is paid to PV producers [
31]. The contribution, which also covers part of the charges incurred by the customer for withdrawing electricity from the grid, is calculated considering the amount of electricity exported or imported by the PV system at the various different hours of each day in a given calendar year and the corresponding hourly market price of the electricity.
In 2010 the Italian government implemented the 3rd “Conto Energia” [
32] that planned the installation of a number of regular PV systems (i.e., using a PV field made by joining commercial PV modules), innovative BIPV systems and concentrating PV (CPV) systems sufficient to reach a capacity of 3500 MW. Besides simplified purchase and resale arrangements for the energy injected into the grid by all kind of PV systems, the possibility of using the modified net metering service was optionally offered for the PV systems with a peak power up to 200 kW. For each PV system typology different premiums, varying with the peak power of the installed PV field, were additionally paid settled for the electricity produced in the next 20 years. The premiums ranged from 0.251 to 0.402 €/kWh for regular PV systems, from 0.370 to 0.440 €/kWh for BIPV systems and from 0.280 to 0.370 €/kWh for CPV systems.
At the beginning of the second semester 2011 the 4th “Conto Energia” [
33] was implemented. Both the modified net metering service and simplified purchase and resale arrangements were alternatively offered for the energy injected into the grid by all types of PV systems. The additional premiums settled for the electricity generated by regular PV systems varied from 0.133 to 0.387 €/kWh, depending on the installed peak power and the month of the year. The premiums paid for the electricity generated ranged from 0.345 to 0.427 €/kWh for BIPV systems and from 0.261 and 0.359 €/kWh for CPV systems, depending on the installed peak power and the current semester of the year. The premiums had twenty years duration. The 4th “Conto Energia” expired at the end of August 2012 when the global amount of incentives paid by the Italian government reached the fixed target value of 6 M€/year.
For the 5th “Conto Energia” [
34], which started as soon as the previous “Conto Energia” ceased, the target value of 6.7 M€/year for the global amount of the paid incentives was fixed. For each type of PV systems a different FIT was fixed for the electricity injected into the grid, depending on the peak power of the photovoltaic arrays and the current month. In addition, for the PV electricity self-consumed by producers in the next 20 years a premium was paid by the GSE.
Table 1 lists the values of the FIT and premiums for the regular PV systems installed on buildings, which had to be provided with the energy performance certification.
The values of the FITs ranged from 0.217 to 0.288 €/kWh for the BIPV systems and from 0.174 to 0.259 €/kWh for the CPV systems. The premiums varied from 0.135 to 0.186 €/kWh and from 0.092 to 0.157 €/kWh for the BIPV and CPV systems, respectively. In addition to the previous premiums, for the energy injected into the grid by all types of PV systems the simplified purchase and resale arrangements and modified net metering service were also offered as possible alternatives to the current FIT. The 5th “Conto Energia” had a short life, as it ceased on the first days of July 2013.
To support the future installation of PV systems the Italian government opportunely implemented a tax credit program [
35,
36,
37] that allows the owners or tenants of the building, on which the PV system is installed, to have ten annual tax refunds corresponding to a global benefit on the PV system costs equal to:
50% of the expenses incurred before the end of 2014;
40% of the expenses incurred during 2015;
36% of the expenses incurred after 2015.
The electricity injected into the grid is counted by the GSE considering the terms of the covenant with the PV producer, who can choose a simplified purchase and resale arrangement or the modified net metering service. Since the end of the 5th “Conto Energia”, the lack of PV incentives has diffused the idea that it was not worth installing new PV systems, because no money was paid by the government to the investors. Such an idea, which is shared by many PV investors who used to get the money regularly paid by the government, is clearly disproved by the results presented in this paper.
3. Methodology
The assessment of the PV electricity potential at urban scale has been investigated by many authors. Some Israeli (Jerusalem, Tel Aviv, Haifa, Beersheba, Eilat) and Slovakian (Bardejov) cities were analysed by Hofierca et al. [
38] and Vardimon [
39] respectively. Bergamasco et al. [
40] evaluated the PV energy collected by the available roof surface area in Turin (Italy). The Portuguese cities of Lisbon, Alcabideche and Oeiras were studied by Brito et al. [
41], Redweik et al. [
42], Santos et al. [
43] and Amado et al. [
44,
45]. Kodysh et al. [
46] presented a methodology for estimating solar potential on multiple building rooftops in Knoxville (TN, USA). A method to evaluate the adaptability of PV energy on urban façades was proposed and used by Esclapés et al. [
47] for a representative area of Madrid (Spain).
Klironomos et al. [
48] and Portolan dos Santos et al. [
49] evaluated the potential of building integrated photovoltaic (BIPV) systems in Oinofyta (Greece) and Florianopolis (Brazil) respectively. Some districts of State College (PA, USA) and Bombay (India) were analysed by Choi et al. [
50] and Singh et al [
51] respectively. The urban PV potential of Cottbus (Germany), Georgetown (Malaysia) and Tokyo (Japan) was assessed by Schwarz et al. [
52], Latif et al. [
53] and Stoll et al. [
54] respectively. Strzalka et al. [
55] used a modern district near Stuttgart (Germany) to evaluate the potential of PV energy and the local own consumption of electricity produced. An urban area of Valparaiso (Chile) constituting 366 houses was studied by Araya-Muñoz [
56]. Talavera et al. [
57] analysed the University of Jaén Campus (Spain).
In order to evaluate the effects of the two different support schemes on the level of coverage of the electricity consumption of rooftop PV systems, three case studies regarding the districts of cities representative of the urban morphologies and latitudes of southern, central and northern Italy, were investigated. A specific methodology [
58], which combines the analysis of the economic convenience of PV systems to a detailed rooftop architectural and energy suitability analysis, was adopted. Accordingly, the interaction between the number of floors and the roof shapes of the buildings was considered with the aim of inferring the specific sizes of the PV systems that can be installed by each building co-owner, the associated electricity generation and, in turn, the coverage of the electricity demand in the districts. Then, the economic analysis of the PV systems was performed by means of the net present value (NPV) assuming both the FITs and tax credits schemes and considering all costs (PV and electrical devices, maintenance and management, insurance, replacement of PV panels and inverters), all benefits (reduced electricity bills, sold PV electricity, FITs, premiums and tax credits) the decrease in the PV panel efficiency and the variation of the electricity price and inflation rate. Only the electricity produced by the economically advantageous PV systems was used to assess the coverage of the electricity consumption in the districts. Three different temporal scenarios were assumed:
At the end of the FIT scheme (June 2013);
At the beginning of the tax credits scheme (July 2013);
18 months after the beginning of the tax credits scheme (December 2014).
A sensitivity analysis was also carried out considering different levels of load mismatch and solar energy shading.
3.1. Case Studies
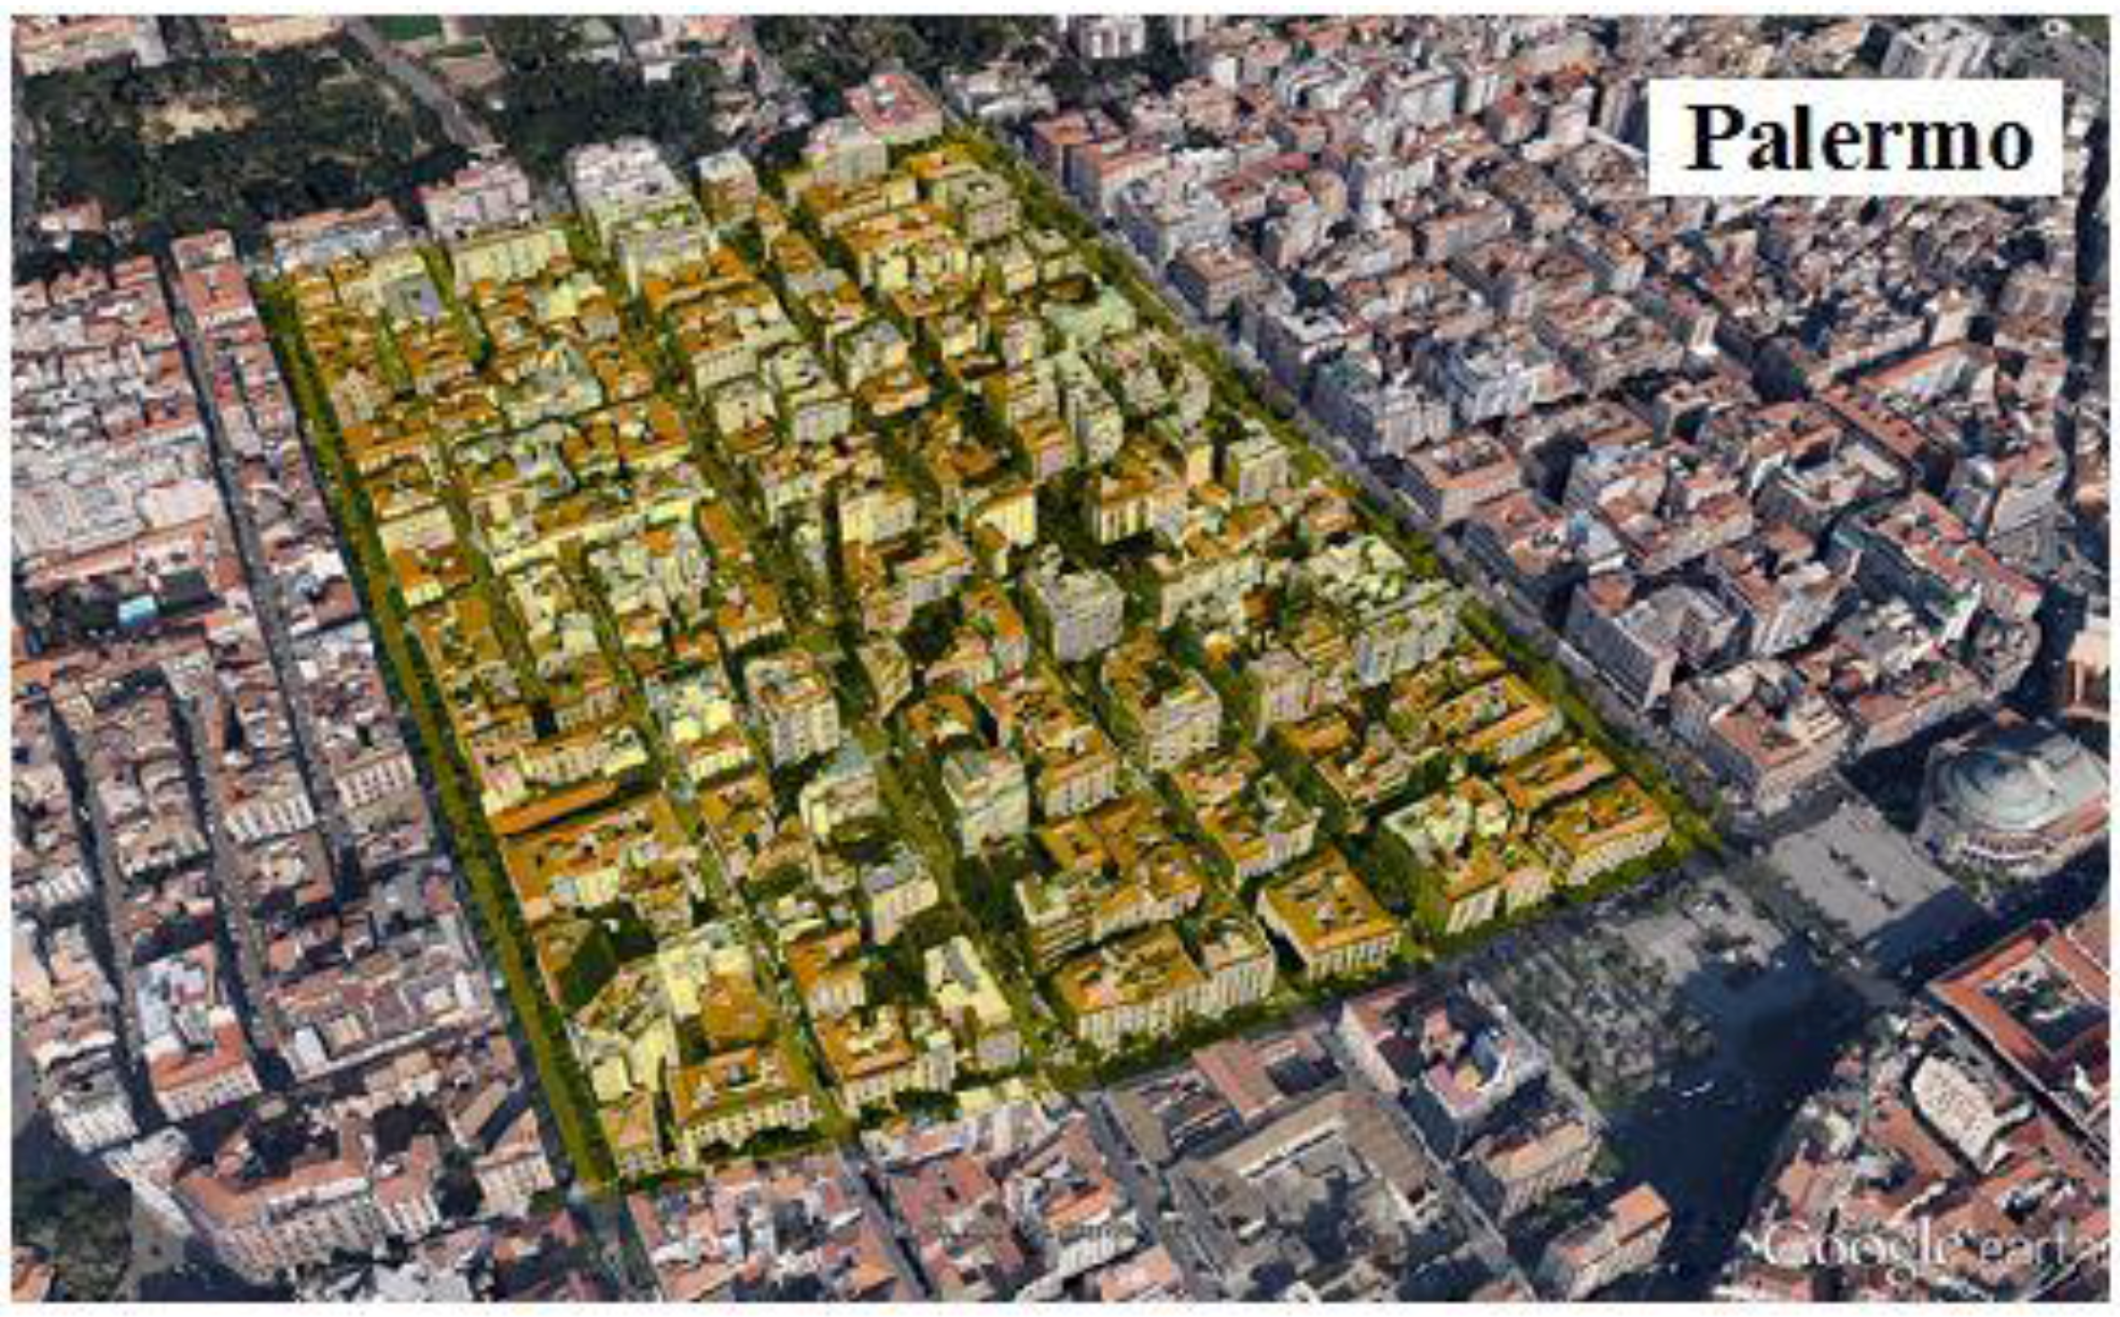
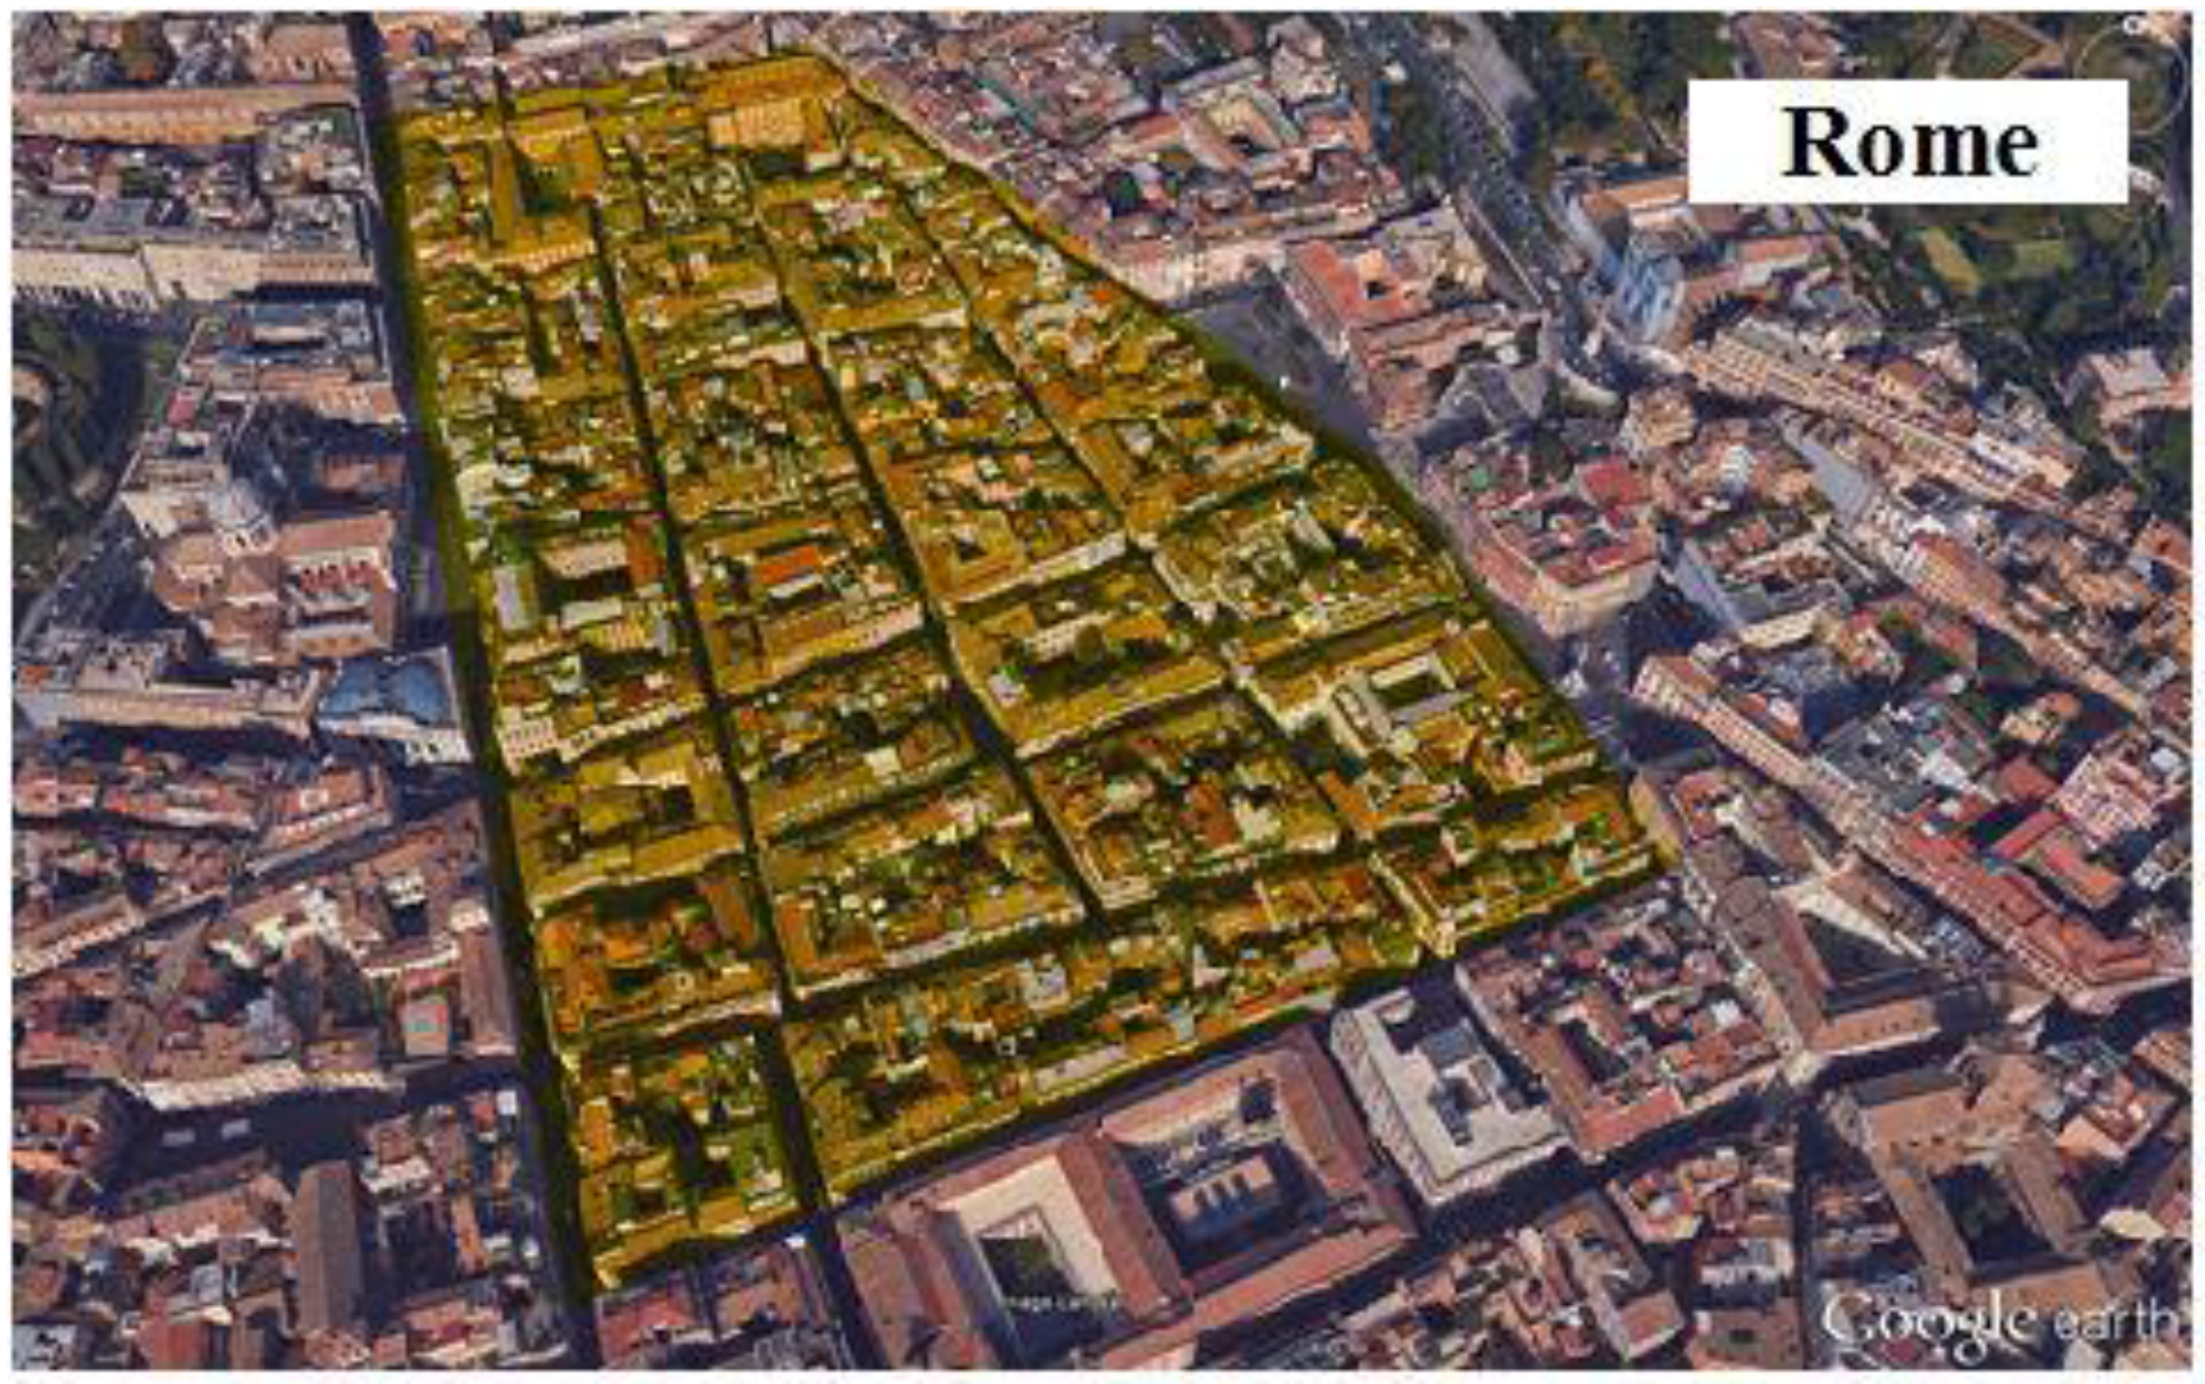
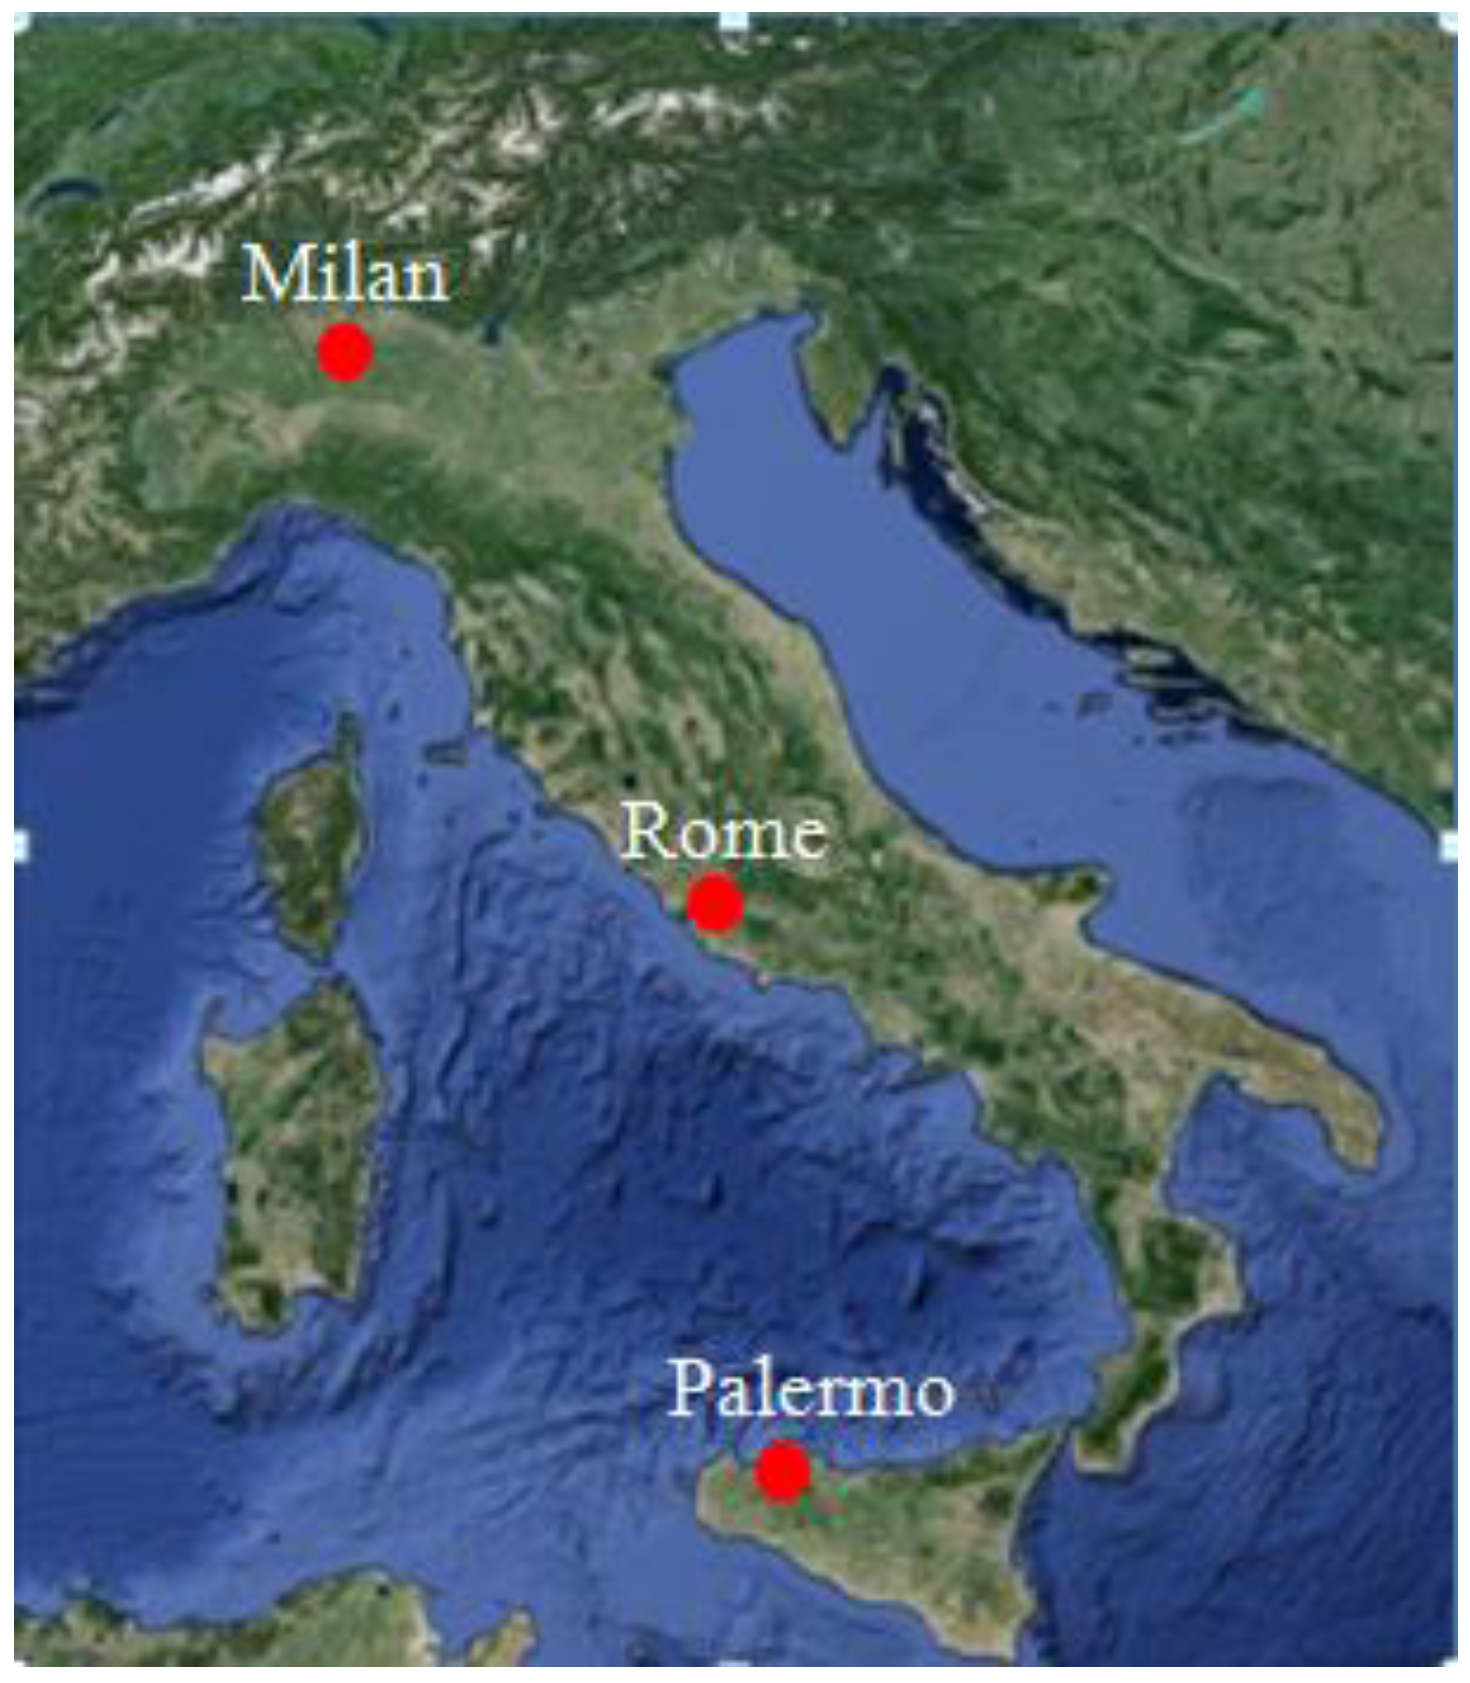
Three districts located in the Italian cities of Palermo (Latitude 38.0° N, Longitude 13.4° E), Rome (Latitude 41.0° N, Longitude 12.0° E) and Milan (Latitude 45.0° N, Longitude 9.0° E) were selected as case studies to assess the effects of the integration of PV systems in urban contexts; as it is shown in
Figure 2, the cities are fair representative of the Italian latitudes.
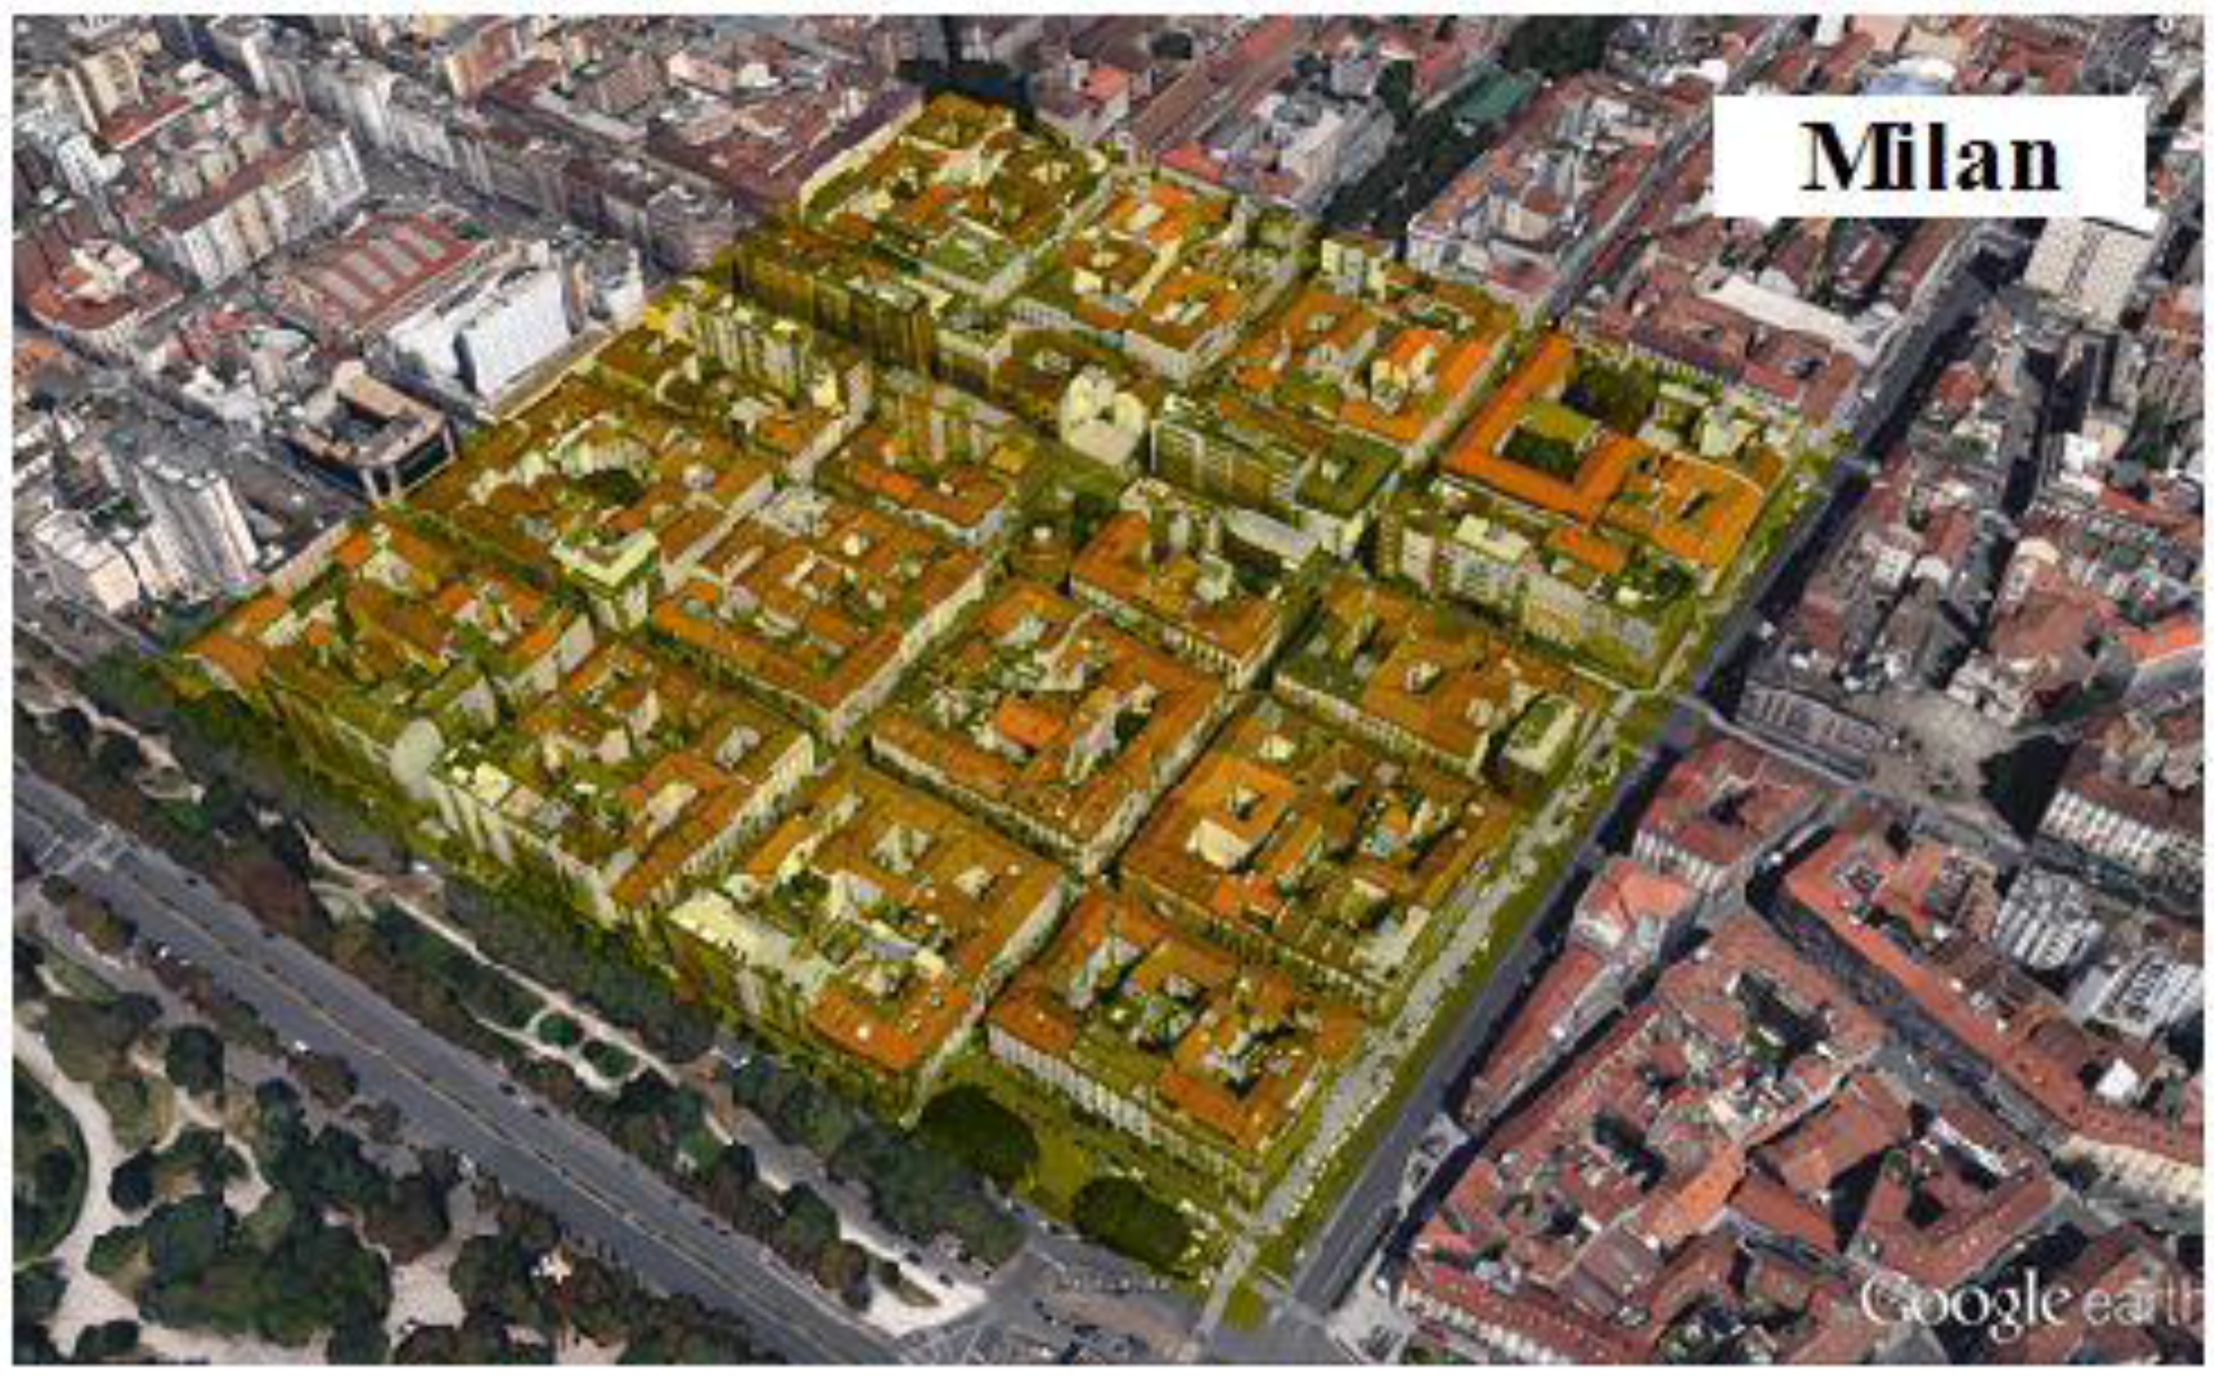
The analysed districts are shown in
Figure 3,
Figure 4 and
Figure 5. Each district, which was surveyed by means of Google Earth™ program is characterised by specific road alignments and orientations (Palermo: 117° East of South and 153° West of South; Rome: 107° East of South and 253° West of South; Milan: 147° East of South and 213° West of South).
The districts, which were measured using the images provided by Google Earth™, cover an area of 269,000 m2, 126,000 m2 and 154,000 m2 for Palermo, Rome and Milan, respectively; the corresponding surfaces occupied by the buildings measure 109,207 m2, 78,826 m2 and 99,817 m2.
3.2. Architectural Analysis
The size of the PV fields that can be installed on the rooftop of a building is affected by the surface available for each flat-owner. Accordingly, a reliable assessment of the PV systems that can be realistically installed involves the study of the relationships between the roof shapes the number of floors and the surface of the flats in the buildings. For this purpose, the slanted roofs were classified depending on their configuration (gable, hip and skillion) and the main orientations of the buildings in each district.
Table 2 shows the selected roof shapes, direction of slope and the areas of the classified roofs.
A different criterion of classification was used for flat roofs. Flat roofs were subdivided into five groups according to their surface and a building, whose roof area was very close to the average value of the group surfaces, was selected as representative of each group.
Table 3 lists the surface and the shape of the selected representative buildings along with the areas of the classified flat roofs.
Table 4 lists the roof areas of the districts and the other surfaces, such as terraces or balconies, which are too small for the PV array installation.
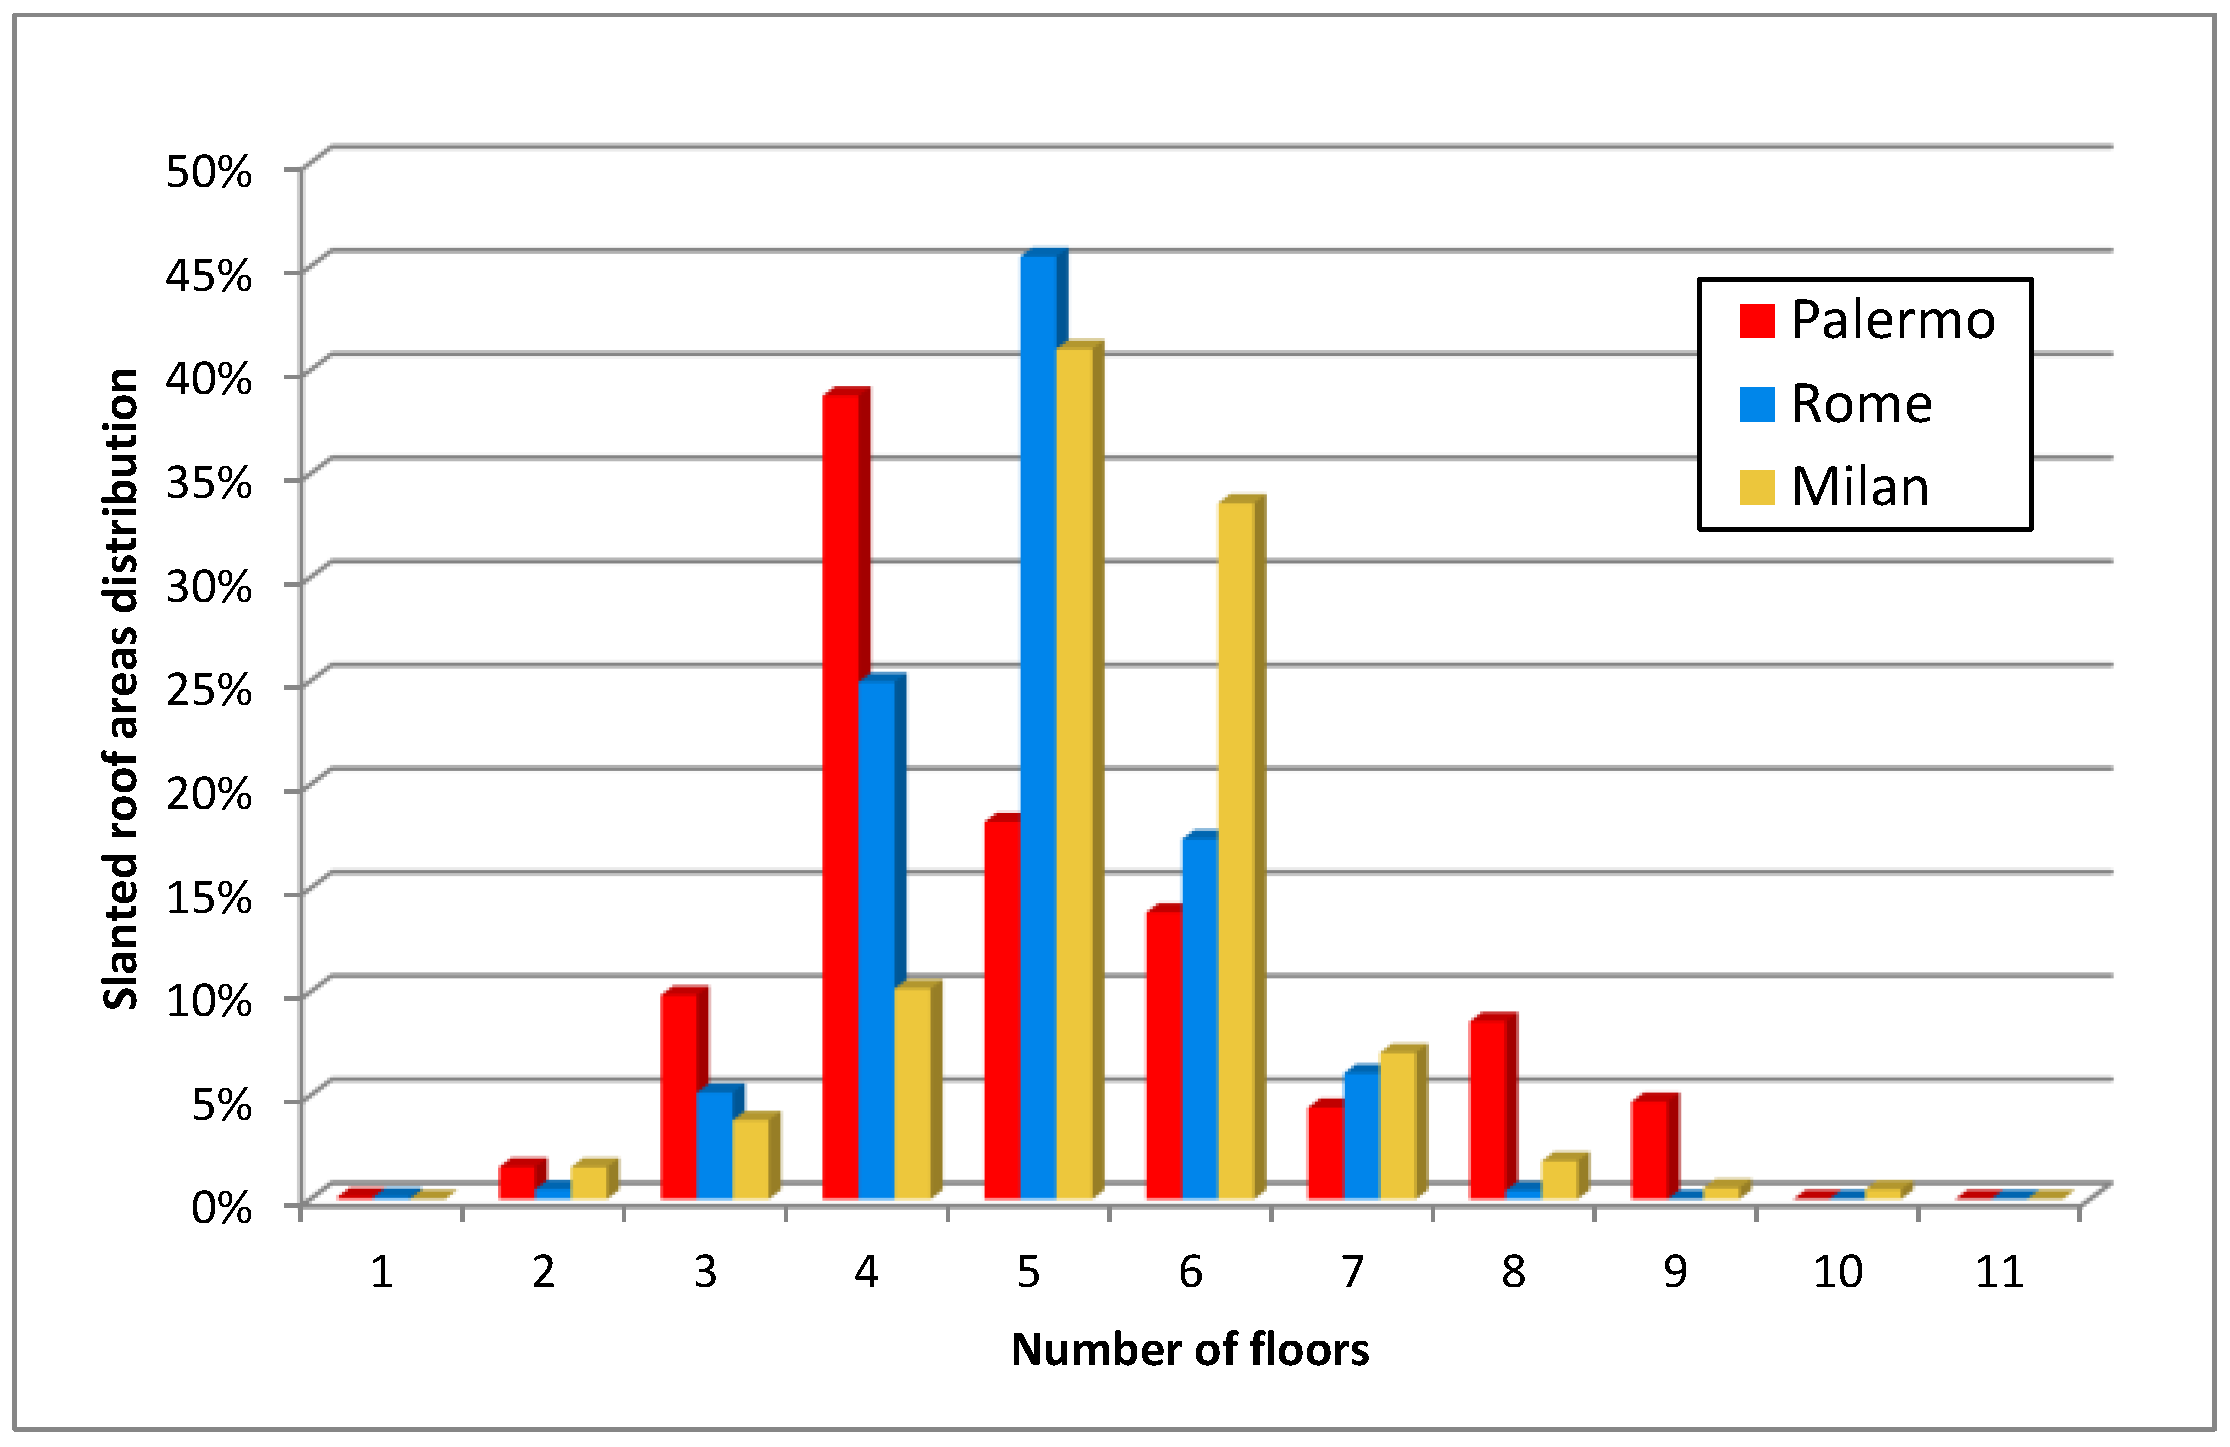
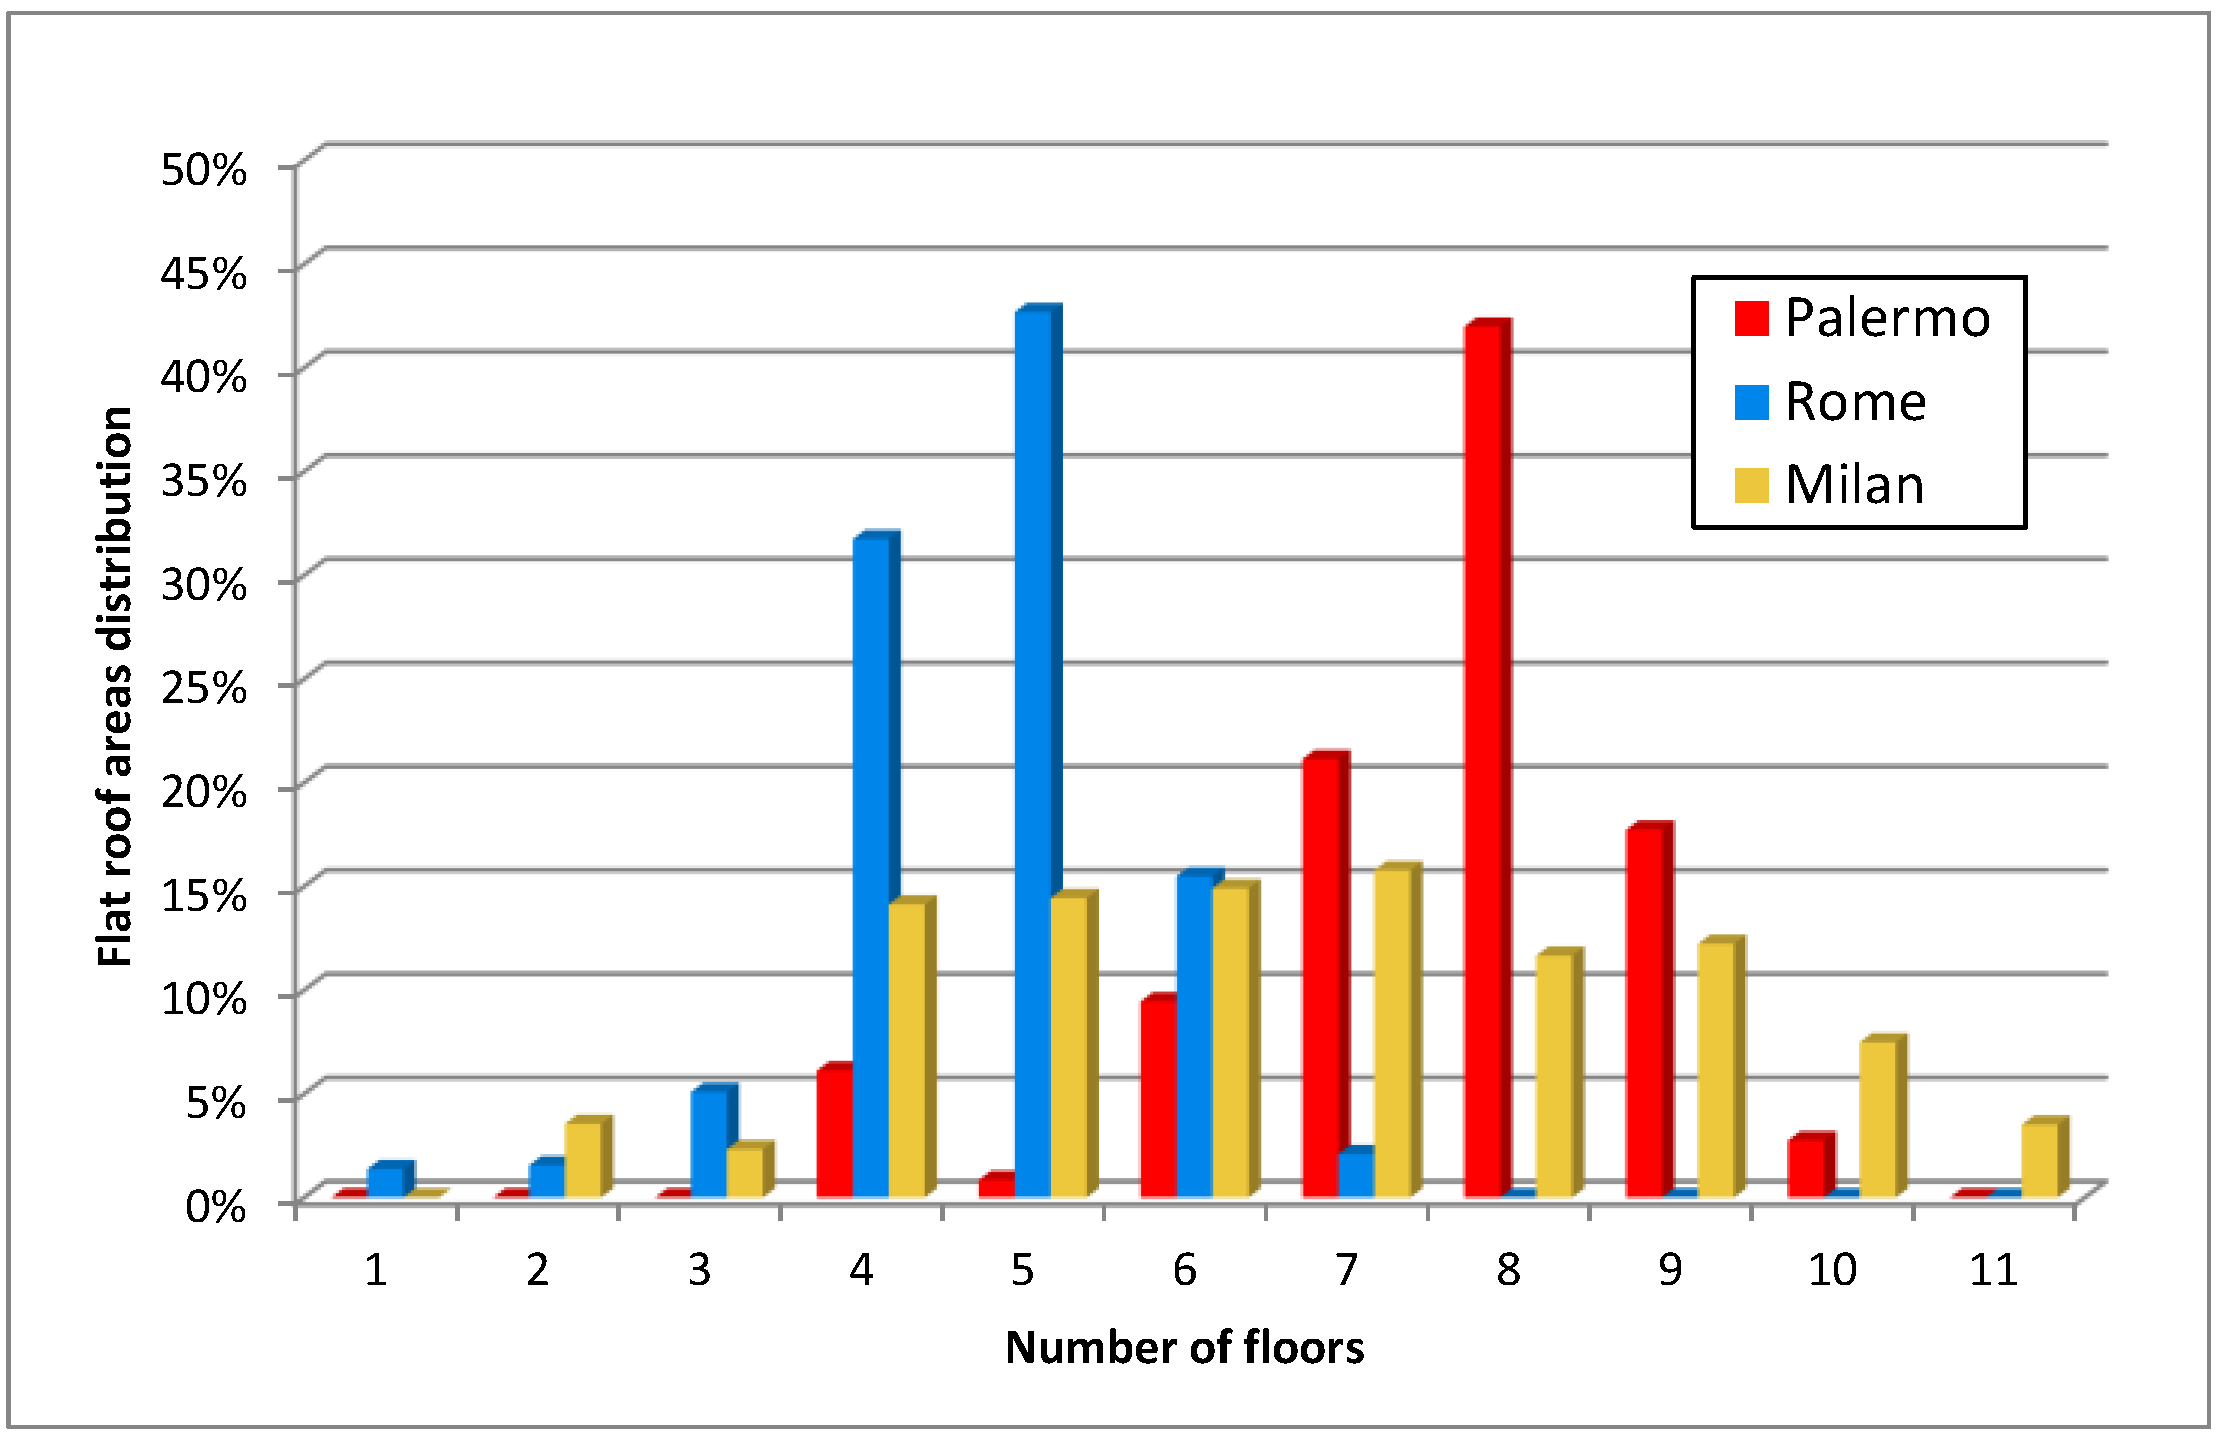
Each representative slanted and flat roof was connected to the respective number of building storeys. The percentage distributions of slanted and flat roofs, versus the number of floors, are shown in
Figure 6 and
Figure 7.
In the city of Palermo the majority of slanted roofs belong to four-storey buildings, whereas most of the flat roof surfaces cover eight-storey buildings. Most of the slanted and flat roofs in Rome belong to five-storey buildings. A regular distribution of flat roofs, with a maximum in correspondence of seven-storey buildings, is observed for Milan, whereas the majority of the slanted roofs cover five-storey buildings.
3.3. Electricity Production
The exact assessment of the PV electricity production of the districts is an arduous task. Actually, the electricity production is different for each building because the number and size of the PV arrays is affected by the shape of the building roof, whose area has to be parcelled out considering the number and surface of the flats in the building.
For calculations it was assumed that each flat had a standard surface of 162 m
2 and a fixed dimension (width or length) of 9 m. For each roof type, the roof surface was divided by the number of flats in order to establish the surface available for each co-owner and, in turn, the size of the PV array to be installed. Due to the presence of 21 roof-types and 11-storey buildings, 231 different types of PV systems had to be analysed. The PV fields were built with commercial PV panels Kyocera KD210GH-2PU that were located with the same pitch of the slanted roof surfaces (approximately 20° above the horizontal for the district of Rome, and 25° for Palermo and Milan) also considering a sufficient room for installation and maintenance. For the flat roofs it was assumed that the panels were oriented to the south with a pitch of 31°, which is the most efficient for the analysed cities. From calculations performed for the analysed districts, it was verified that, if the PV arrays were built selecting the two main building axes, a greater number of PV modules may be installed but a smaller amount of electricity would be produced. The distance between the rows of the PV array was set accordingly to the national electric standard [
59], which requires that no part of the PV modules is shaded between 10:00 a.m. and 2:00 p.m. on the winter solstice. Moreover, in designing the shapes of the PV arrays, it was geometrically verified that the shadows thrown by balustrades, elevator housings and other obstructions never cover any part of each PV panel from 10:00 a.m. to 2:00 p.m. on the winter solstice.
The electricity calculations were carried out by means of PVsyst 5.06 [
60] that determines the electricity produced by the PV systems considering the electrical characteristics of the PV panels and solar inverters issued by the manufacturers and using data of solar irradiance and air temperature that are specific to the given location and different for each day of the year. SMA Sunny Boy solar inverters [
61,
62] adequately sized for the number of panels of each PV array were used. Thee SMA Sunny Boy solar inverters use a maximum power point tracking method based on the Optitrac algorithm [
63].
The energy generated by each type of PV system was divided by the corresponding roof-type surface in order to get the per square meter value of the PV generation that is sensitive to the number of the building storeys. Such value was multiplied by the respective global roof type surface of the district that cover the same number of storeys and, finally, the results were added to calculate the global PV production of the district.
Table 5 lists the results of the PV electricity calculation.
With reference to the slanted and flat roof areas of the districts, the installed PV systems produce 91.03 kWh/m2 every year in Palermo, 81.89 kWh/m2 in Rome and 63.53 kWh/m2 in Milan. The differences in the values are obviously due to the different latitudes and urban morphologies of the analysed cities. Assuming a value of the yearly global horizontal solar irradiation of 1690 kWh/m2 for Palermo, 1549 kWh/m2 for Rome and 1255 kWh/m2 for Milan, the PV electricity is produced with values of the conversion efficiency varying from of 5.39%, 5.29% and 5.06% for the three cities, respectively. If the gross areas of the district are considered, the yearly PV production lowers to 33.18 kWh/m2, 38.27 kWh/m2 and 38.26 kWh/m2 for Palermo, Rome and Milan, respectively. The corresponding conversion efficiencies are equal to 1.96%, 2.47% and 3.05% for Palermo, Rome and Milan, respectively. Such anomalous values, which apparently contrast with the yearly global horizontal solar irradiation of the cities, are mainly due to the different percentages of flat roofs in the analysed districts (34.71% for Palermo, 23.10% for Rome and 12.12% for Milan), which resulted to be less energy efficient than the slanted roofs.
3.4. Coverage of the Electricity Demand
The level of integration of PV systems installed on buildings can be assessed by means of gross energy cover factor
CPV [
64,
65], which compares the electricity produced to the energy demands of the analysed districts:
in which
EPV represents the electricity produced by the totality of the installed PV systems and
DTotal is the electrical energy demand of the district.
DTotal can be derived by the information issued for the districts by the major local electricity transmission grid operators.
Table 6 lists the data officially issued by Terna [
66], main Italian electricity transmission grid operator, and Istat, Italian National Institute of Statistics [
67], which were used to calculate the yearly electricity consumption of a household living in a standard flat of 162 m
2.
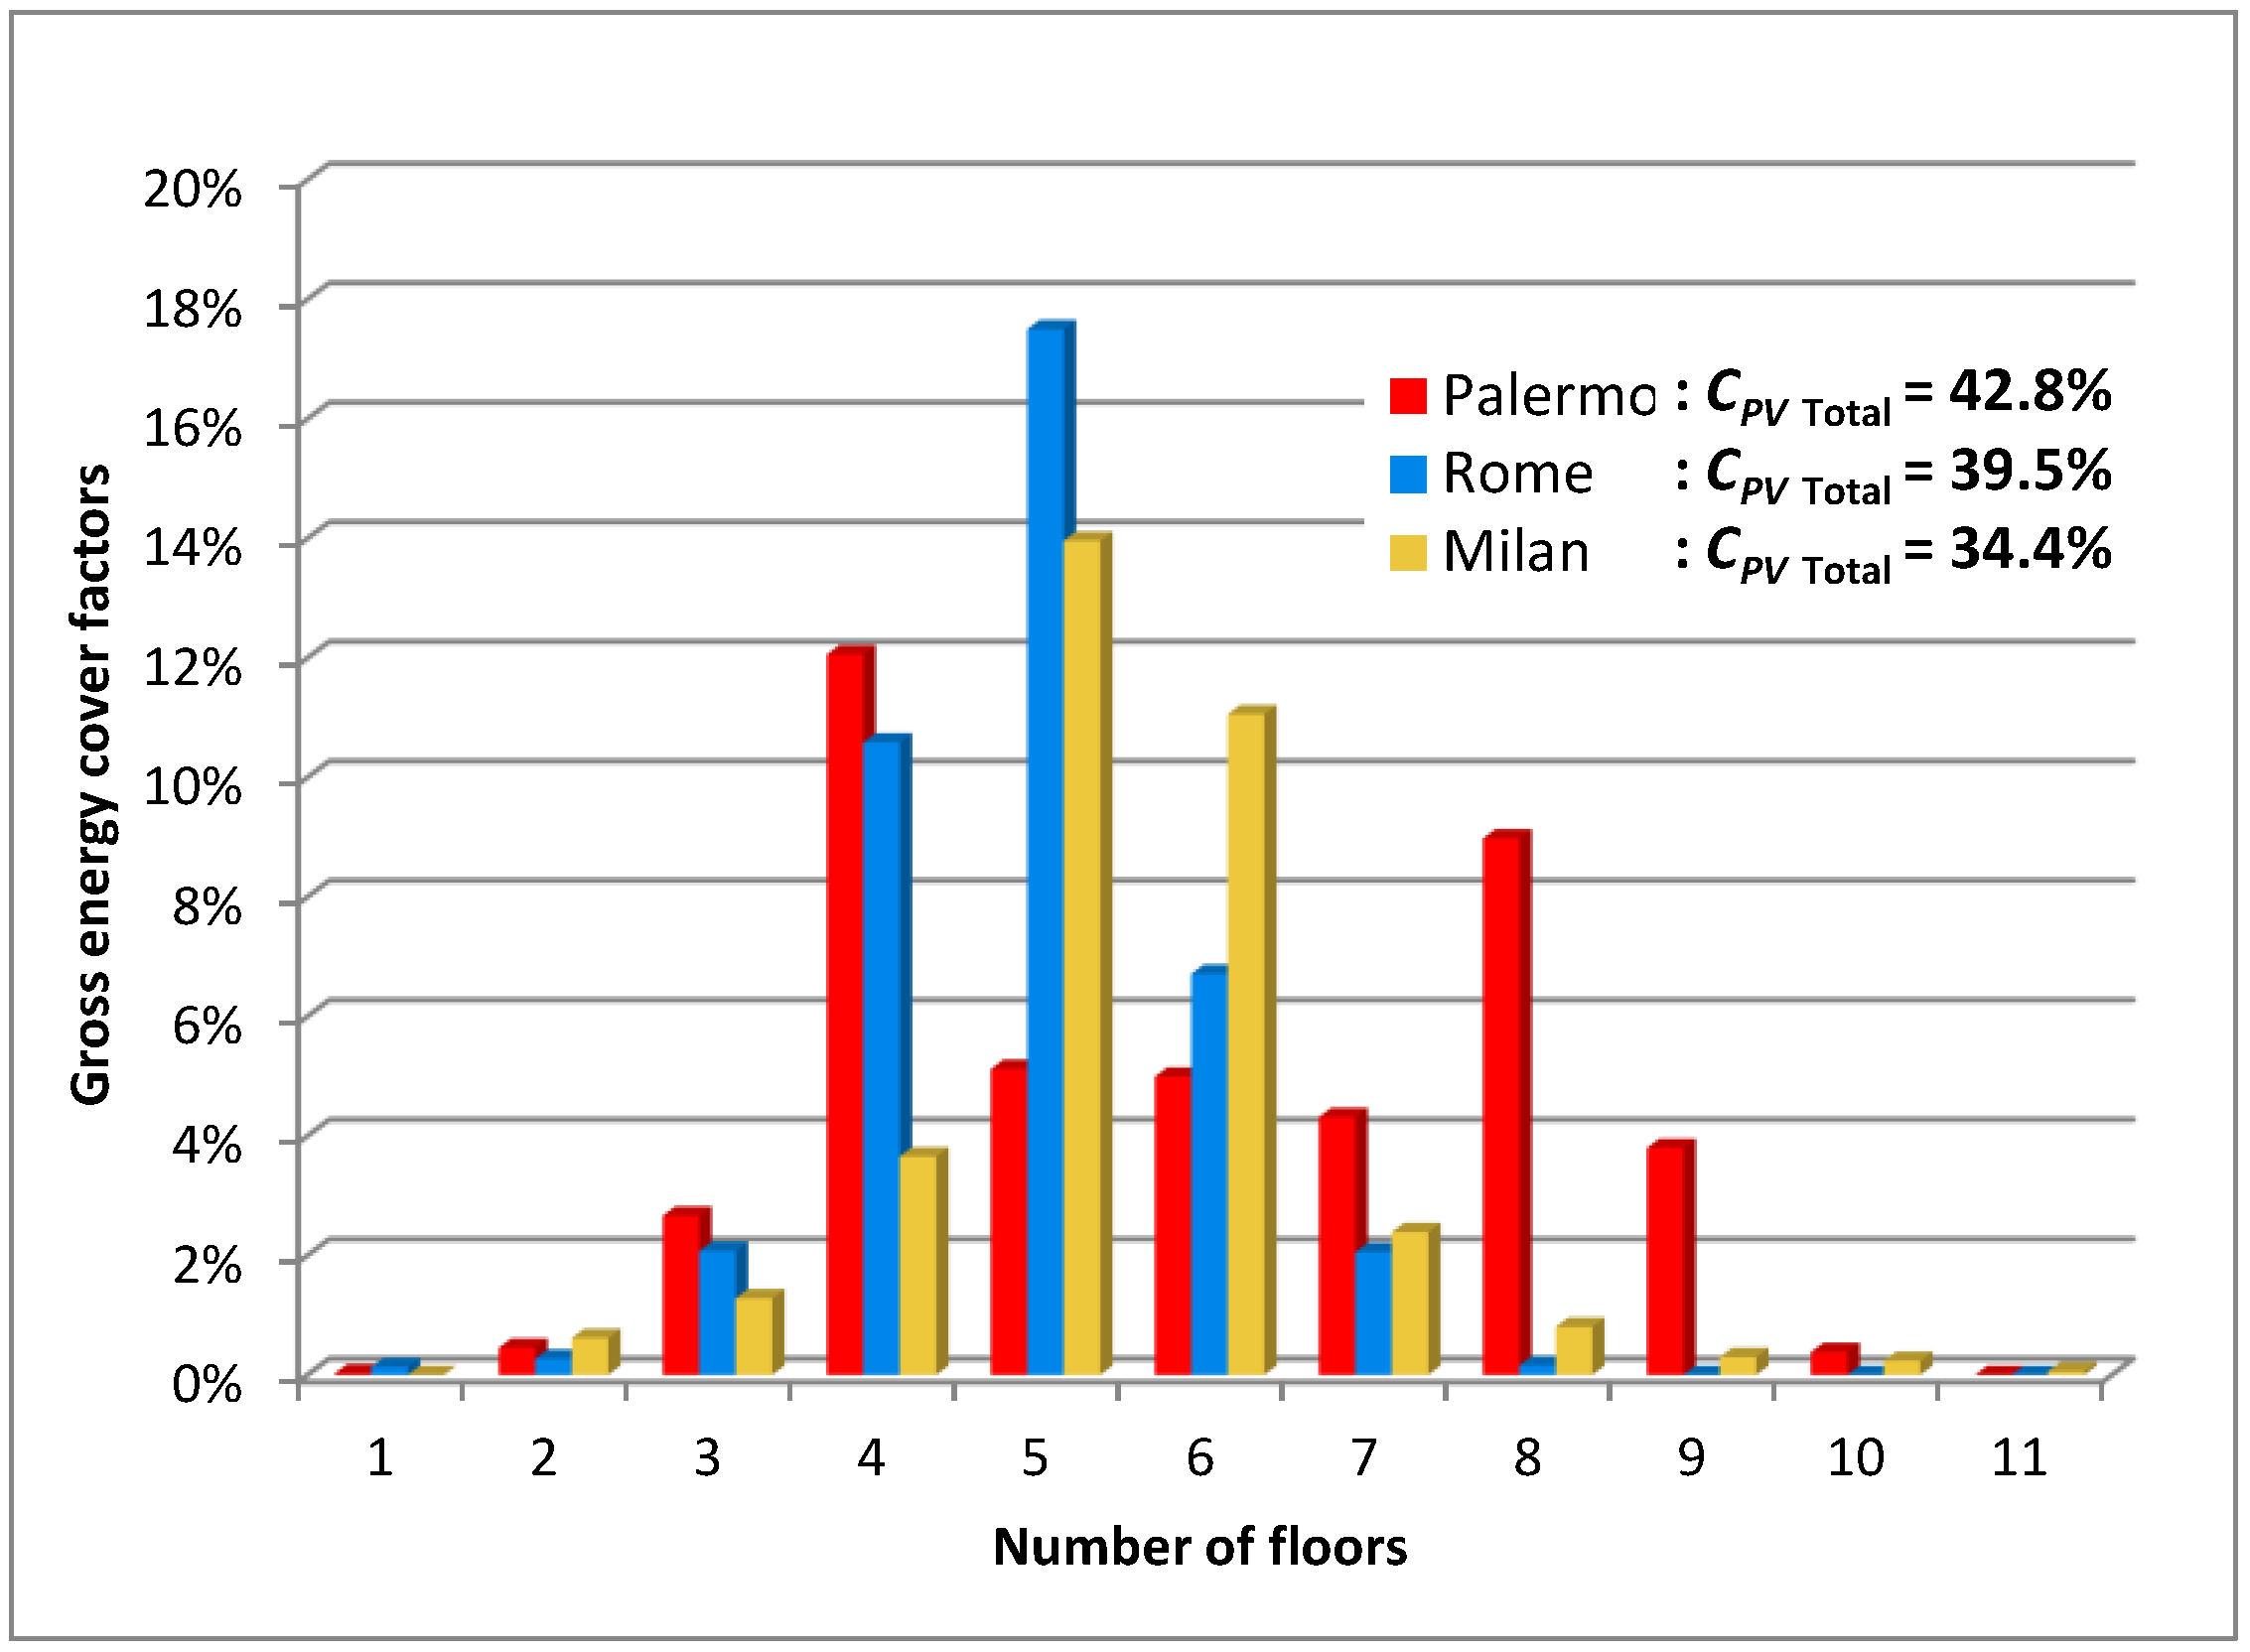
The results of the calculations of factor
CPV are depicted in
Figure 8.
The installed PV systems cover 42.8%, 39.5% and 34.4% of the domestic electrical consumptions of the analysed districts of Palermo, Rome and Milan, respectively. The energy production is mainly due to the roofs covering four-storey buildings in Palermo, and of five-storey buildings in Rome and Milan. Such figures represent the maximum values of the energy cover factor because the calculus of the PV electricity was performed without considering the lack of solar irradiance due to the shadowing of obstructions, which is quite likely in densely urbanised contexts. Moreover, a part of the PV generation may not be locally used and exported to the grid because it exceeds the electricity demand of the flat or because the instantaneous perfect correspondence between demand and generation is quite improbable. Obviously, the electricity consumed after sunset and before dawn will never be compensated by the energy produced by a PV system not equipped with batteries. To estimate night-time demands
Dnight it was assumed that the following appliances were working in the standard flat from dusk to dawn [
68,
69,
70,
71]:
Lamps: 85 W from Ti to 23:00 and from 07.00 to Tf;
Refrigerator: 90 W from Ti to 24:00 and from 00.00 to Tf;
Television + P.C.: 75 W from Ti to 23:00 and from 07.00 to Tf;
in which T
i was set one hour before sunset and T
f one hour after dawn in order to consider that the electricity generated by the PV systems is quite small at the beginning and at the end of the day; sunset and dawn on 15th of each month were considered. In
Table 7 the calculated values of day-time demand
Dday along with the values of
Dnight are listed.
The load mismatch, caused by the lack of simultaneity between generation and consumption, and its impact on the operation of the grid is a relevant topic in the assessment of PV systems [
72,
73,
74,
75,
76,
77,
78,
79,
80,
81,
82,
83,
84,
85,
86]. Due to the load mismatch, the grid managers are expected to provide the grid with a greater degree of flexibility and adopt smart energy management strategies. The presence of the load mismatch due to the incorrect habits in using the electrical appliances can cause the occurrence of disadvantageously purchasing electricity from the grid and/or wasting the unused PV energy. The effects of the load mismatch are even more evident if the time-of-using and real-time electricity pricing are considered [
87,
88]. Because the grid parity has not been completely reached in many countries, when almost all PV electricity is used by the PV system owner, the economic investment can be very convenient because the selling price is usually greater than the purchase price. Adversely, if only a very small part of the PV electricity is generated, and simultaneously used by the household appliances, the surplus would be sold off and it would be necessary to pay for some electricity imported from the grid later on. Moreover, because some duties must be also paid for both the purchased and sold electricity, the economic convenience may result very little.
Among the indicators proposed by some authors to consider the effect of the mismatch between generated and consumed electricity [
81,
83,
84,
85], the load match index, which represents the percentage of the electrical demand that is covered by the generation of all
NPV PV systems over the considered evaluation period
T, is used in this paper. Load match index γ
D can be calculated with the following equation:
in which
N is the number of samples in the considered evaluation period
T;
EPV,j(
i) and
Dj(
i) are the PV generation and the demand of the
j-th PV system during the generic
i-th time interval, respectively. When only the yearly data of the energy are available, load match index γ
D of the district may be approximated with the expression:
in which
is the PV generation of the
j-th PV system and
is the electrical demand of the flat powered by the
j-th PV system, over the year. When the PV generation is sufficient, the day-time energy demand can be covered by the PV electricity only if there is a perfect simultaneity between PV generation and local consumption. Obviously, if no energy storage is installed, the electricity
DNight consumed after sunset and before dawn can be compensated only by the grid. The portion of
DDay that is covered by the PV electricity mainly depends on the habits of the households in using the electrical appliances. A household, which does not intend to waste the energy produced by its PV system, may only try to reschedule the use of the domestic appliances in order to increase the household consumption during the PV generation. Modern building automation may provide more efficient solutions to manage the appliances that have the highest consumption. Smart control systems, able to forecast the solar potential and the PV generation up to 2 days, with hourly resolution, have been recently presented [
89].
It may be very difficult to settle realistic values of the energy demand that is satisfied by the electricity produced by each PV system of the district. This is the reason why, in this paper it was considered convenient to address the problem of the load mismatch by means of a sensitivity analysis based of the available yearly energy data. To reach that purpose it is useful to introduce the following utilization coefficient
cu:
where
DMatch,j and
DDay,j represent the amount of the matched yearly demand and the day-time yearly demand of the
j-th PV system, respectively. The electricity demand of a PV system can be split as:
where
DMism,j and
DNight,j are the amount of mismatched yearly demand and the night-time yearly demand of the
j-th PV system, respectively. Coefficient
cu varies from 0, when no PV electricity is used, to 1, when all PV electricity covers the day-time consumptions. By means of the above equations the load match index of the district can be related to utilization coefficient
cu:
Load match index is sensitive to the load mismatch and, if cu = 0, then = 0. The maximum value of the load match index can be less than 100% for two main reasons: (1) a PV system that has an undersized PV panel array will never cover the day-time electricity demand of the household; (2) even a PV system with an oversized PV panel array may not cover the household demand if some amount of the energy produced is not simultaneously consumed and no battery storage system is used.
3.5. Economic Analysis
Different measures of the economic value of an investment can be used depending on the peculiarities of the analysed problem [
90]. In the present paper the NPV, which is typically used when only one set of investments can be selected, is considered. The NPV considers the full cost of possible alternatives, including direct costs such as capital costs, operations and maintenance costs (O&M), as well as external costs, such as environmental costs. The NPV is calculated with the following formula:
where
Nt is the lifetime of the investment,
CFt is the cash flow related to the generic
t-th year,
C0 is the initial investment cost and
k is the discount rate, which is the index that represents the average expected return on the investor’s assets. The cash flow, which is defined as the movement of money into or out of a business, project or financial product, corresponds to the difference between all yearly disbursements (device replacements, operations, maintenance, servicing, insurance, finance costs, taxes, etc.) and benefits (revenues from the sold electricity, paid incentives, savings from the electricity bills, etc.).
The cash flows were calculated for 20 years, which is the duration for which FIT incentives provided in Italy. In
Table 8 the costs of the PV components are listed; costs were assumed from the market prices of components, considering the cost for labour, fitter wages and value added tax (VAT).
The profits are related to the gain for the avoided electricity bill cost, sold electricity and incentives. The electricity bills were calculated considering the difference between the bills corresponding to the electricity demand and those which are referred to the energy consumed while the PV systems are producing electricity. To calculate the bills, the electricity tariffs issued by the AEEG for domestic consumers with an electricity capacity of 3 kW were used [
91].
Table 9 lists the data issued for the third trimester of 2013 and the fourth trimester of 2014.
The economic analysis was performed also considering:
the yearly degradation rate in the efficiency of the PV panels, set equal to 0.7% of the nominal initial value [
91,
92,
93,
94,
95];
the yearly maintenance and management costs, estimated to be 1% of the investment cost [
1];
the replacement of 1% of the PV panels every year and of all inverters every ten years [
96,
97,
98];
the insurance costs, varying from 184.00 to 334.00 €, for PV systems with peak-power of 3 kWp and 18 kWp respectively;
the FIT and premium listed in
Table 1, for June 2013;
the tax credit rates indicated in paragraph 2;
a selling price of the PV electricity in Palermo of 0.103 €/kWh and 0.079 €/kWh, for July 2013 and December 2014, respectively [
99,
100];
a selling price of the PV electricity in Rome of 0.061 €/kWh and 0.062 €/kWh, for July 2013 and December 2014, respectively [
99,
100];
a selling price of the PV electricity in Milan of 0.062 €/kWh and 0.061 €/kWh, for July 2013 and December 2014, respectively [
99,
100];
the net gain in selling the exported PV electricity, evaluated charging an income tax of 38%, 41% and 43%, which was estimated on the basis of the average income of the inhabitants of Palermo, Rome and Milan, respectively [
101,
102,
103];
a VAT rate of 10%;
the yearly increase in the price of electricity of 3.302%, 3.291% and 2.885% for June 2013, July 2013 and December 2014, respectively, which were derived by the trend line calculated with the data issued by the AEEG for the previous 10 years [
90];
an average inflation rate of 1.983%, 1.972% and 1.706% for June 2013, July 2013 and December 2014, respectively, obtained from the data issued by the Italian National Institute of Statistics for the previous 10 years, which were used to time-discount the costs during that time [
104];
a net discount rate current value of 4.230%, 4.296% and 2.795% for June 2013, July 2013 and December 2014, respectively, assumed equal to the interest paid by Italian long term public securities, which may be considered by the homeowners as an investment with a similar risk [
105].
The NPV was calculated considering 16 slanted roof types and five flat roof types covering buildings with a number of storeys ranging from one to 11, which corresponds to 231 different calculations for each district. Considering that the calculus was repeated for each city and for various values of the utilization coefficient and percentage of shaded solar energy, the total calculated NPVs reach a number too large to be depicted in figures or tables. To illustrate the procedure, the data used to calculate the NPV of a PV system installed in Palermo in July 2013 on the roof type T2 of a building with two or five floors, assuming
cu = 0.4 and a percentage of shaded solar energy of 10%, are listed in
Table 10 and
Table 11.
With reference to the data listed in
Table 10, the PV system installed on the two-storey building presents a high installation cost, as the PV array can cover a large part of the available roof surface. Despite the revenues obtained from the exported electricity and the significant reduction in the electricity bills, such PV system has a negative NPV at the end of the evaluation period and therefore it is not considered economically viable. The array of the PV system installed on the five-storey building, whose data are listed in
Table 11, uses only a part of the building roof as such surface is shared with the other four co-owners. Despite the PV system does not cover the entire energy demand of the household it results economically effective, as the NPV is positive at the end of the 20th year. It is realistic to suppose that only the PV systems that were considered economically convenient by homeowners would be really installed on the buildings. For this reason, in order to evaluate the effective coverage of the electricity demand of the district, the results obtained from the energy assessment have to be coupled with the results of the economic analysis.
3.6. Results of the Energy and Economic Analysis
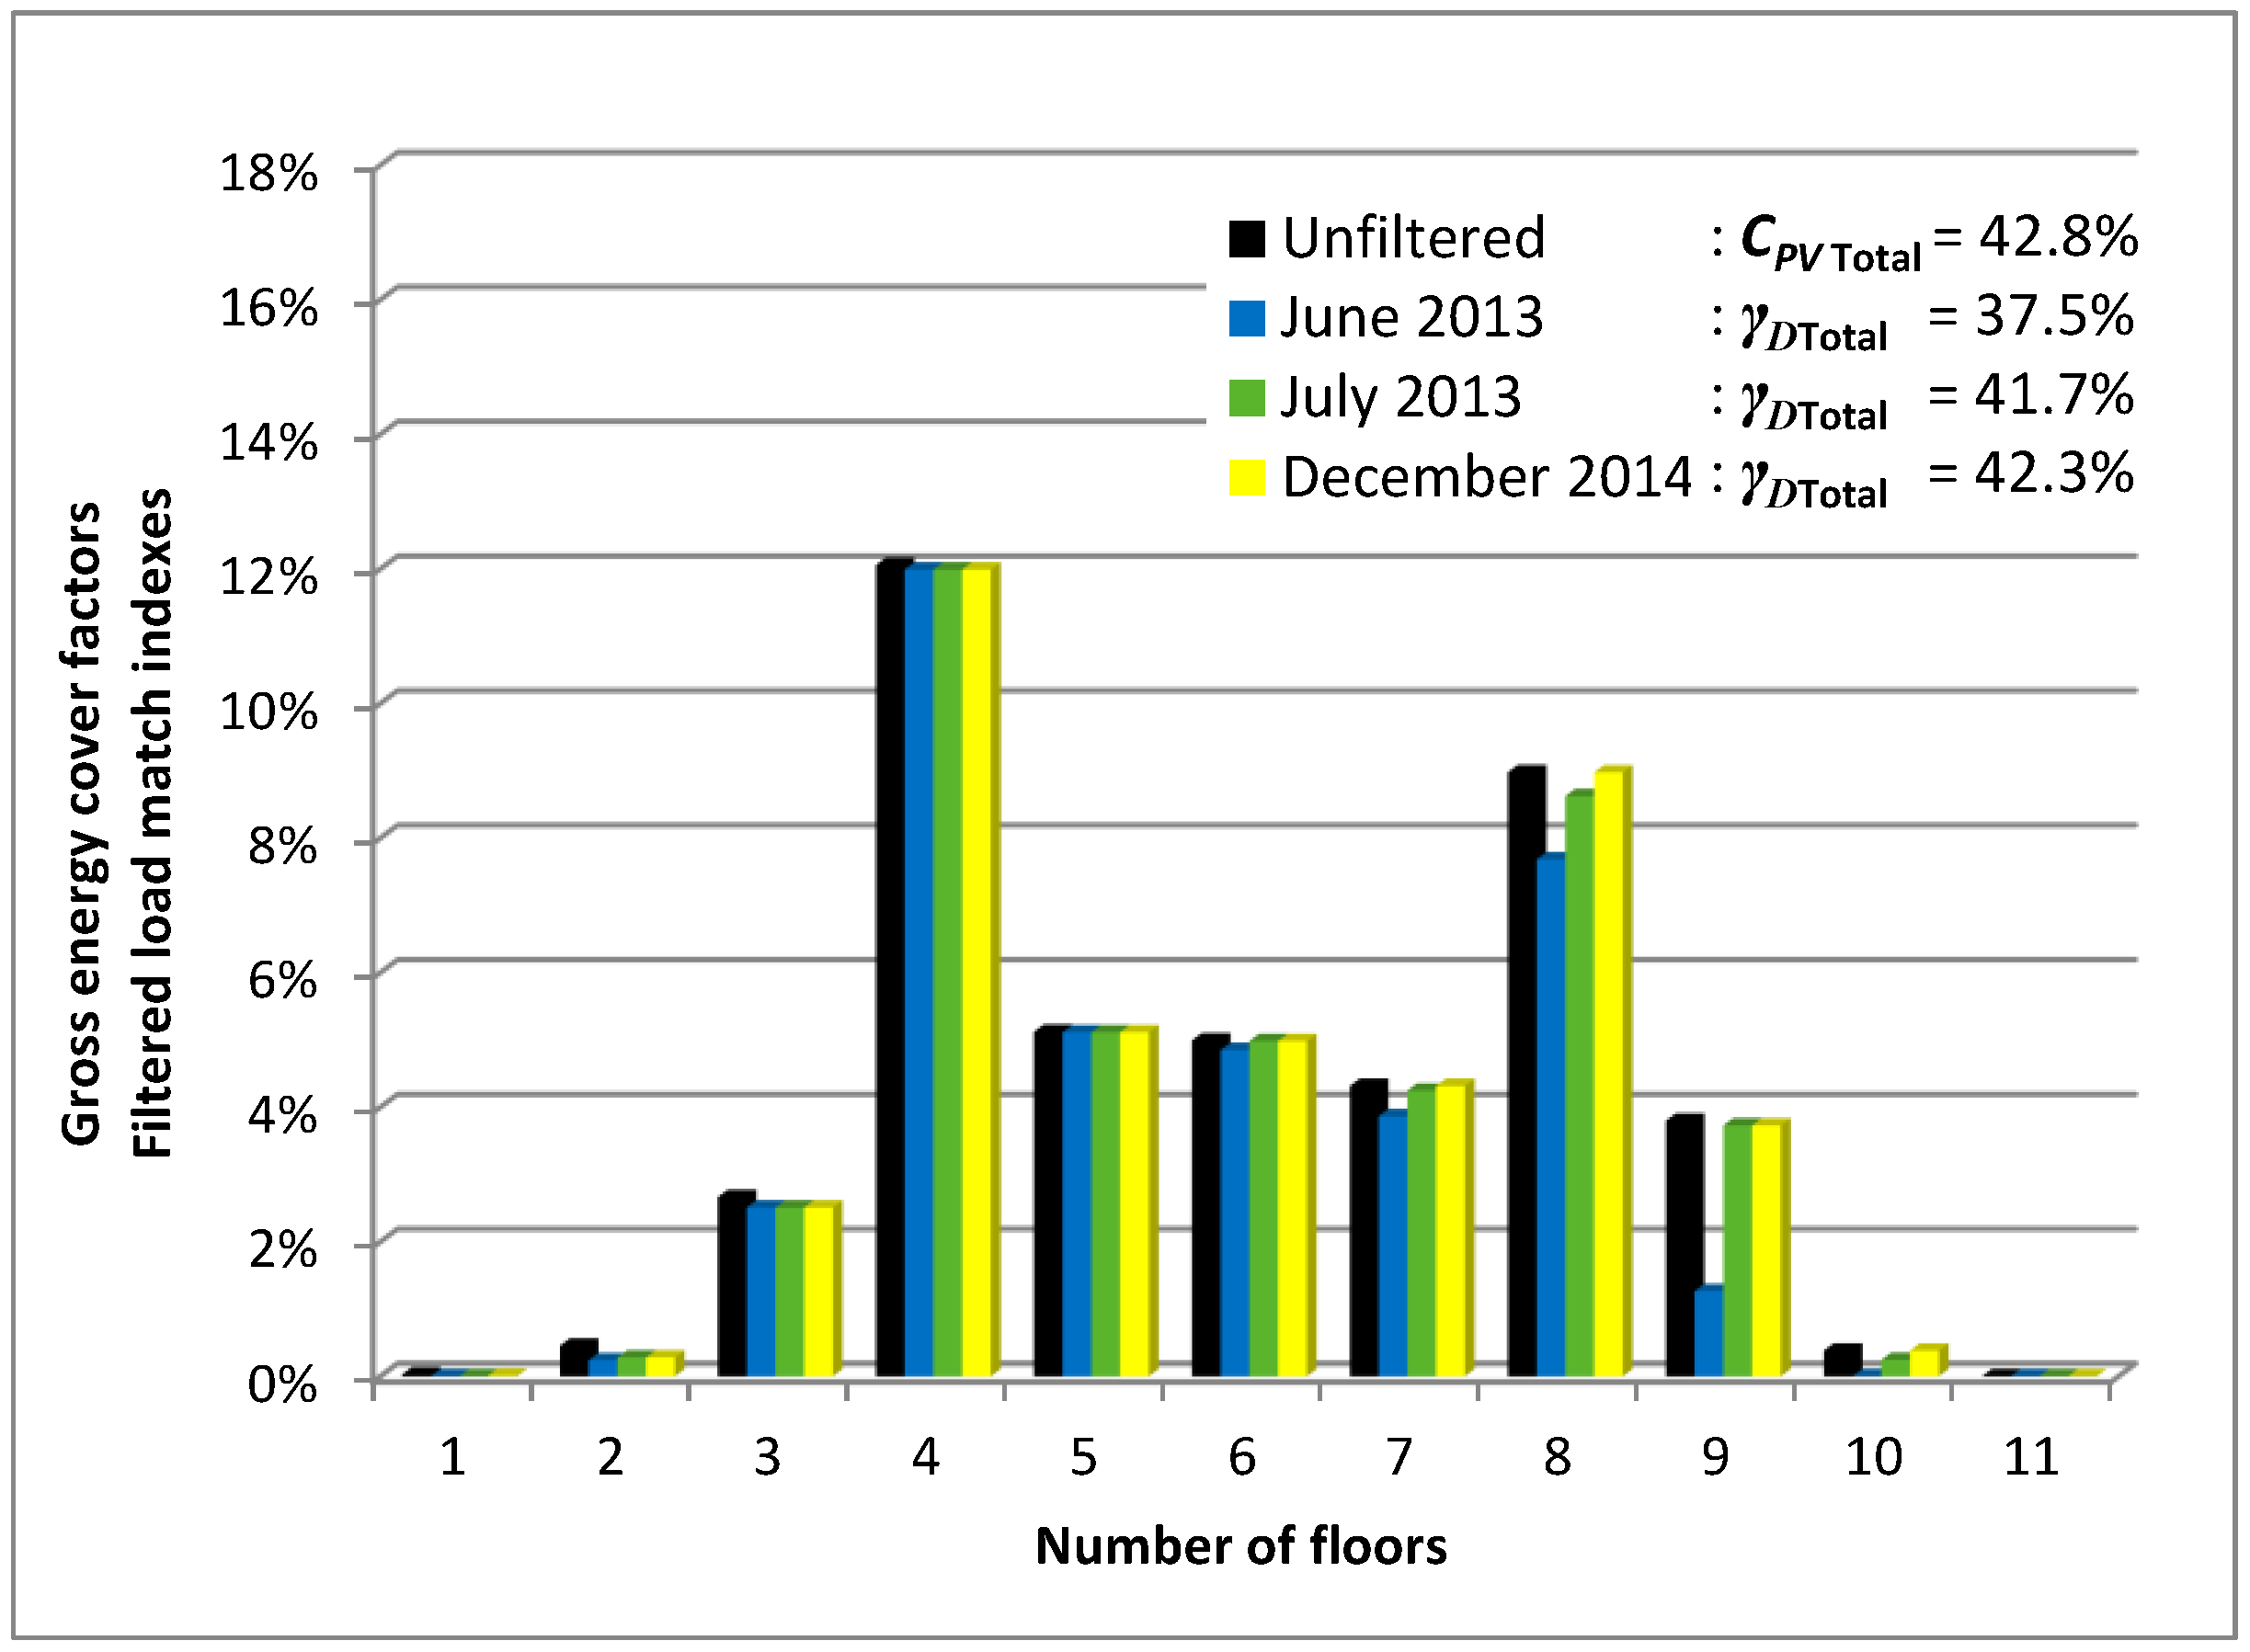
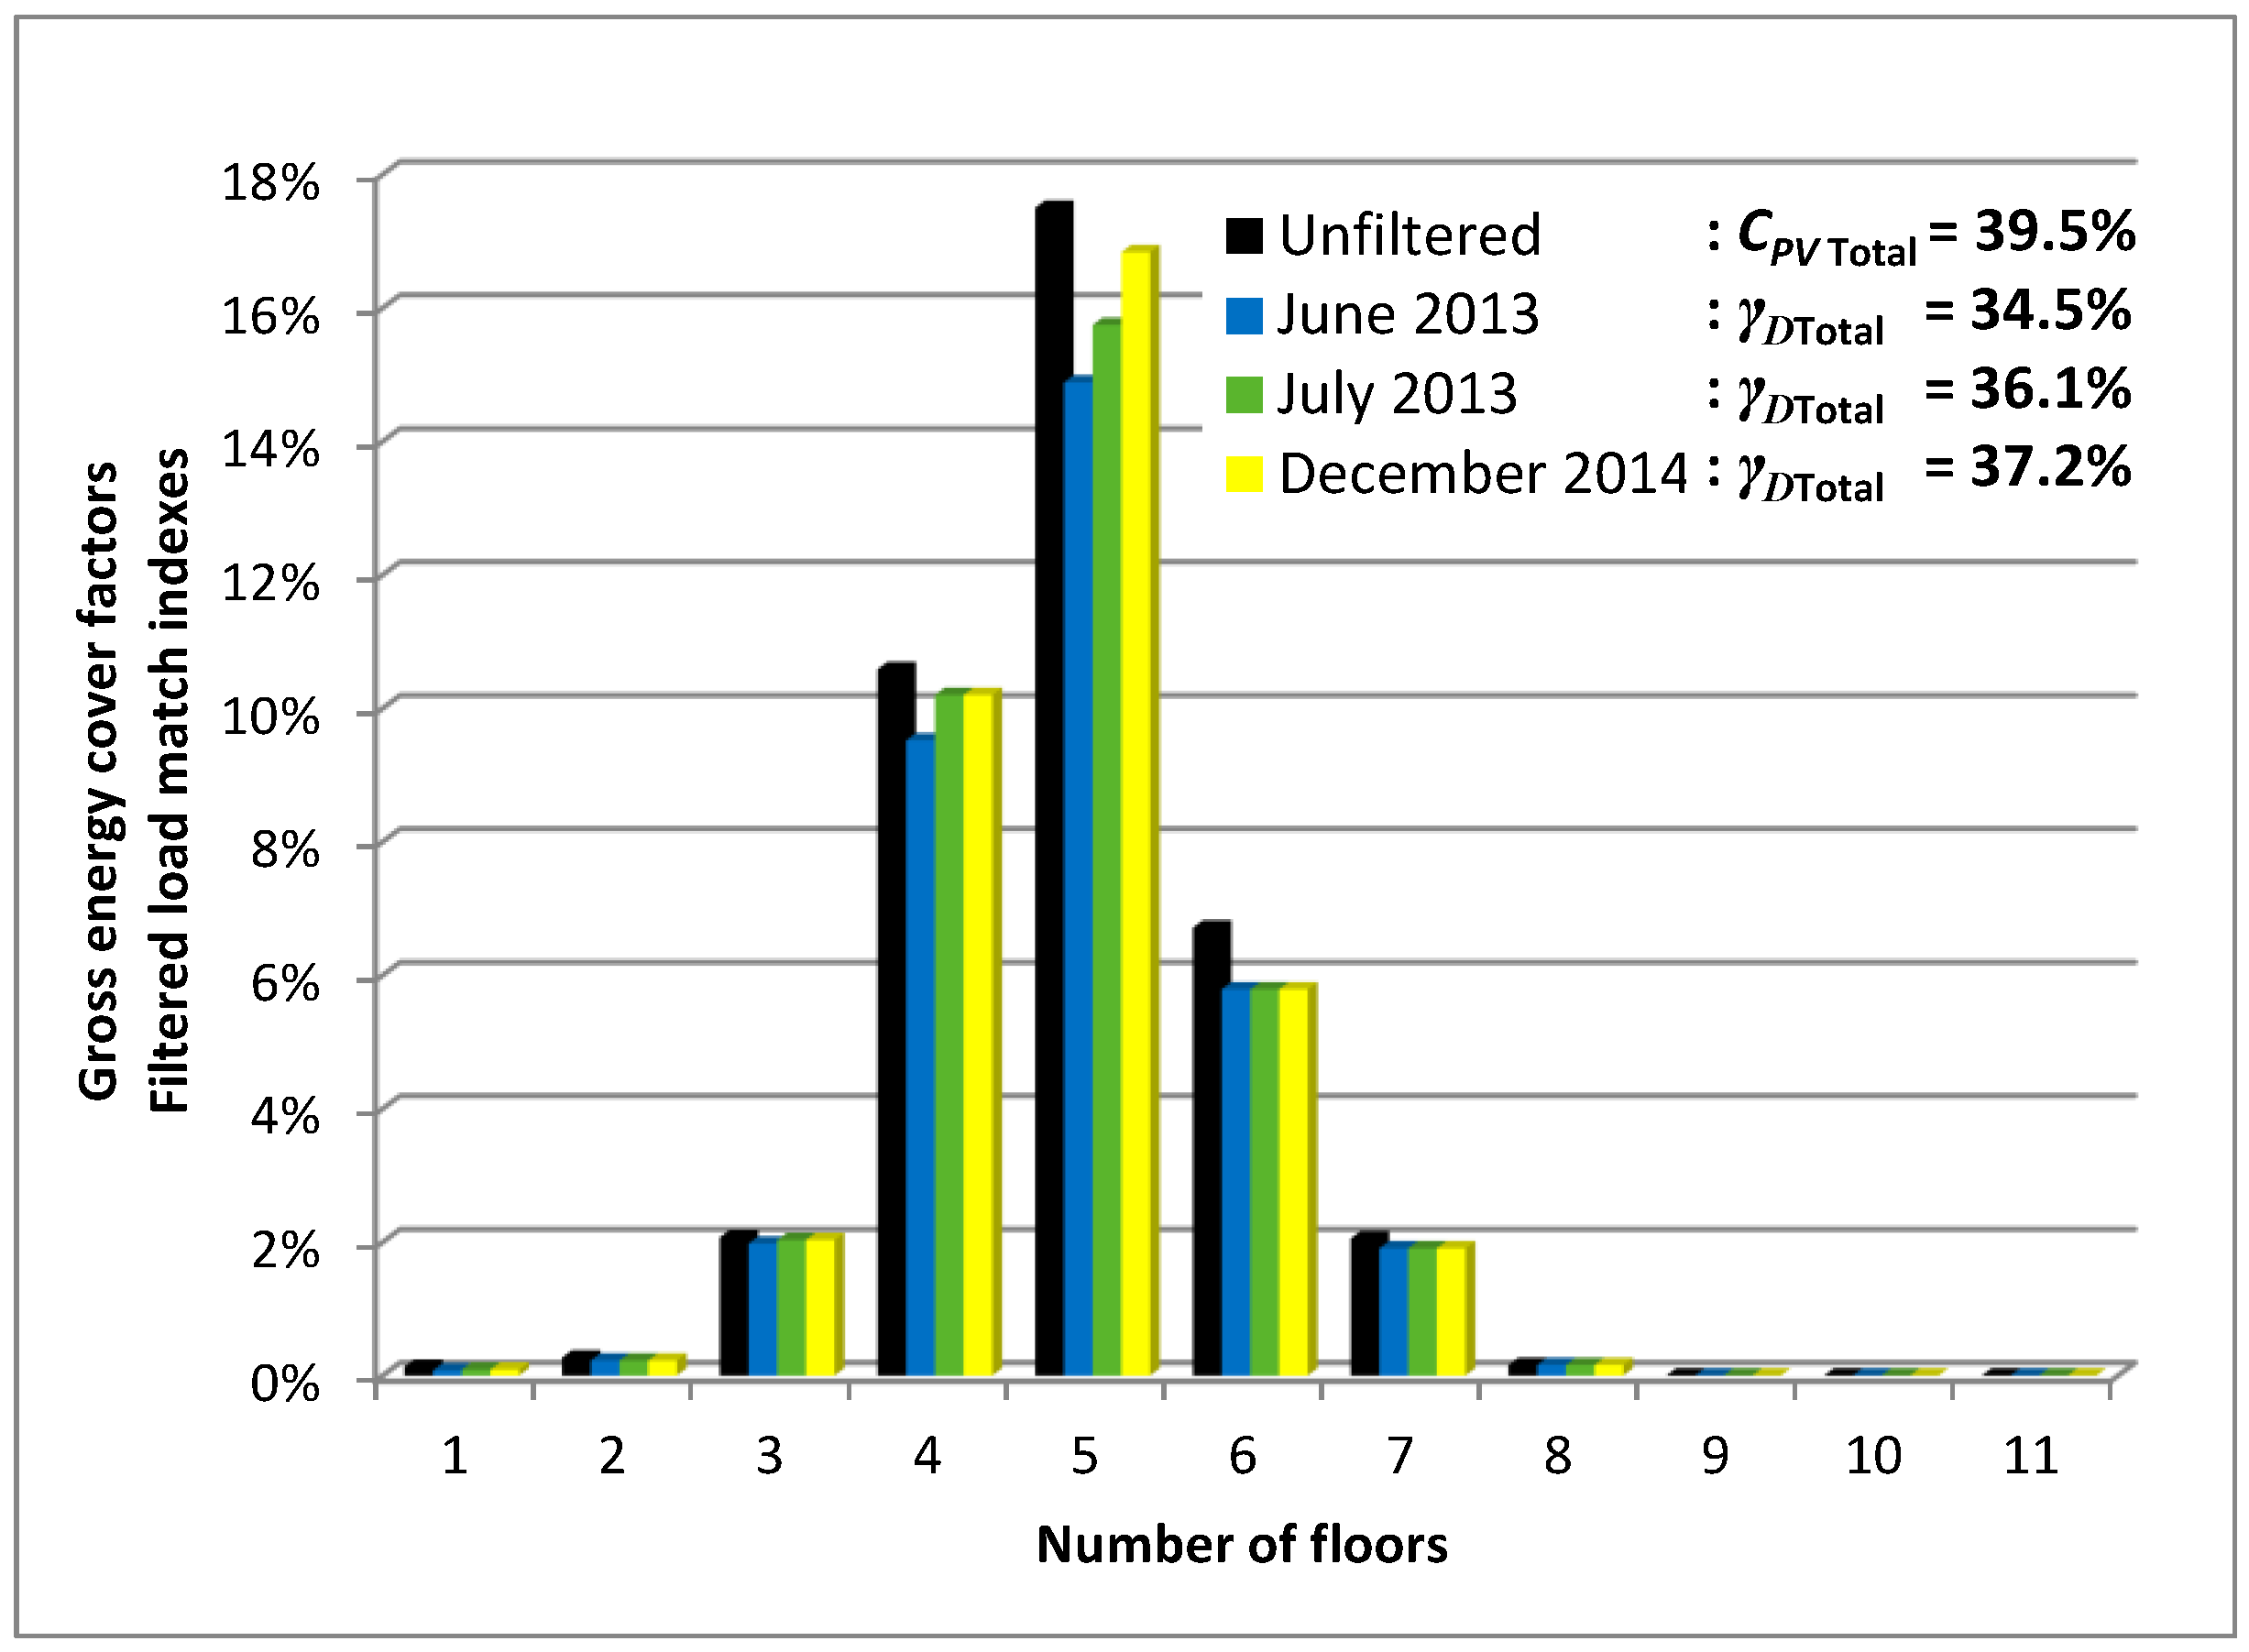
Assuming that only economically convenient PV systems were installed, the coverage of the electricity demand of the districts was calculated by filtering out the electricity generated by the PV systems that have negative values of the NPV. Moreover, to take into account the possible mismatch between PV generation and consumption, the coverage of the electricity demand was calculated using the load match indexes of the analysed districts.
Figure 9,
Figure 10 and
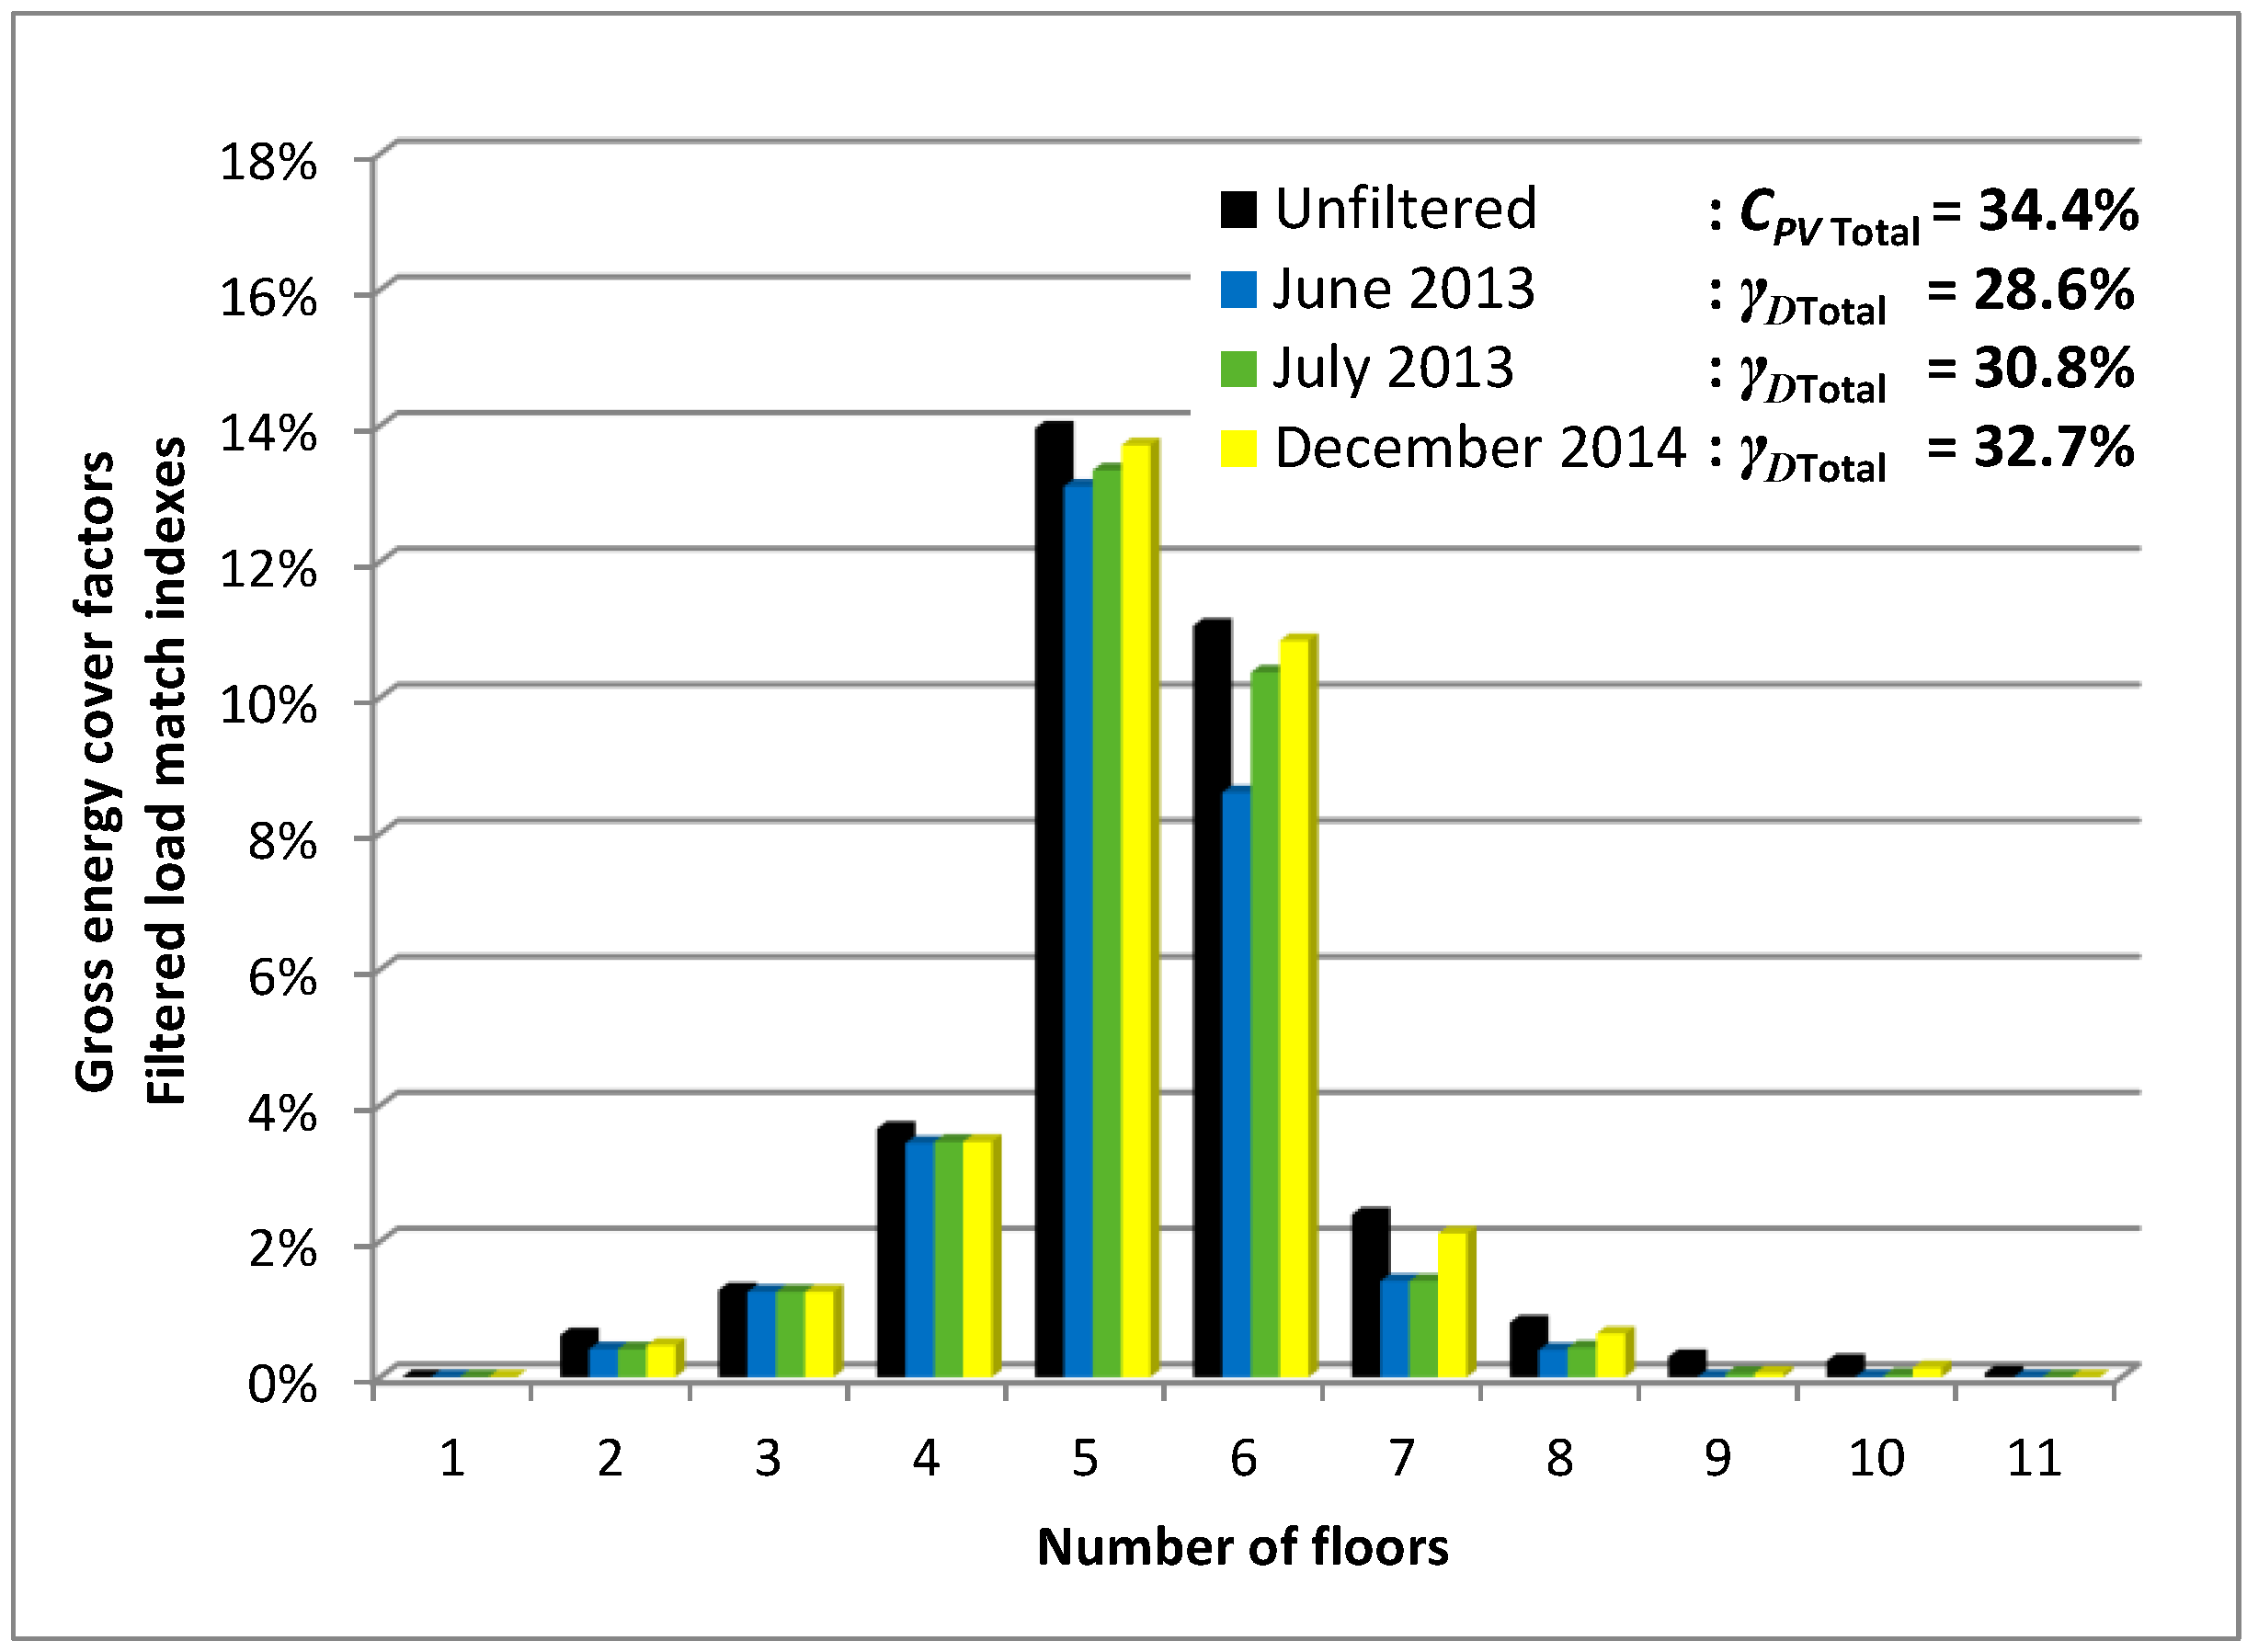
Figure 11 show the values of the load match indexes obtained after filtering out the contribution of the PV systems with a negative NPV. Such values are the maximum ones because they were calculated assuming
cu = 1 and omitting the shading effect of the obstructions. In the same figures the values of the gross energy cover factor calculated with Equation (1) are depicted.
The yearly filtered load match index for the district of Palermo is 37.5% in June 2013, which is the last month of the FIT scheme set by the 5th “Conto Energia”, and 41.7%, in July 2013, and 42.3%, in December 2014, when the tax credits scheme was in force. In June 2013, γD is 34.5% and 28.6% for the districts of Rome and Milan, respectively. The yearly filtered load match indexes for the district of Rome are equal to 36.1% and 37.2% in July 2013 and December 2014 respectively. In the same months, values of γD equal to 30.8% and 32.7% are respectively calculated for the district of Milan. The contribution of the PV systems installed on tall buildings is quite small and tends to fade according to the number of floors. As a consequence, it is likely that smaller values of the coverage of the domestic electricity demand will be reached in the districts more recently built, where tall buildings are generally more frequent due to the modern use of reinforced concrete.
As it was predictable, the data filtering reduces the energy coverage of all cities. The effects are more evident considering the data calculated in June 2013 and, in particular, for the PV systems installed on the buildings with a greater number of floors in Palermo. Adversely, the data filtering marginally modifies the values of the load match indexes evaluated in July 2013 and December 2014. The difference between such months is negligible despite the fact that the PV systems installed in July 2013 were incentivised with a tax credit of 50% whereas only a tax credit of 40% supported the PV systems installed in December 2014.
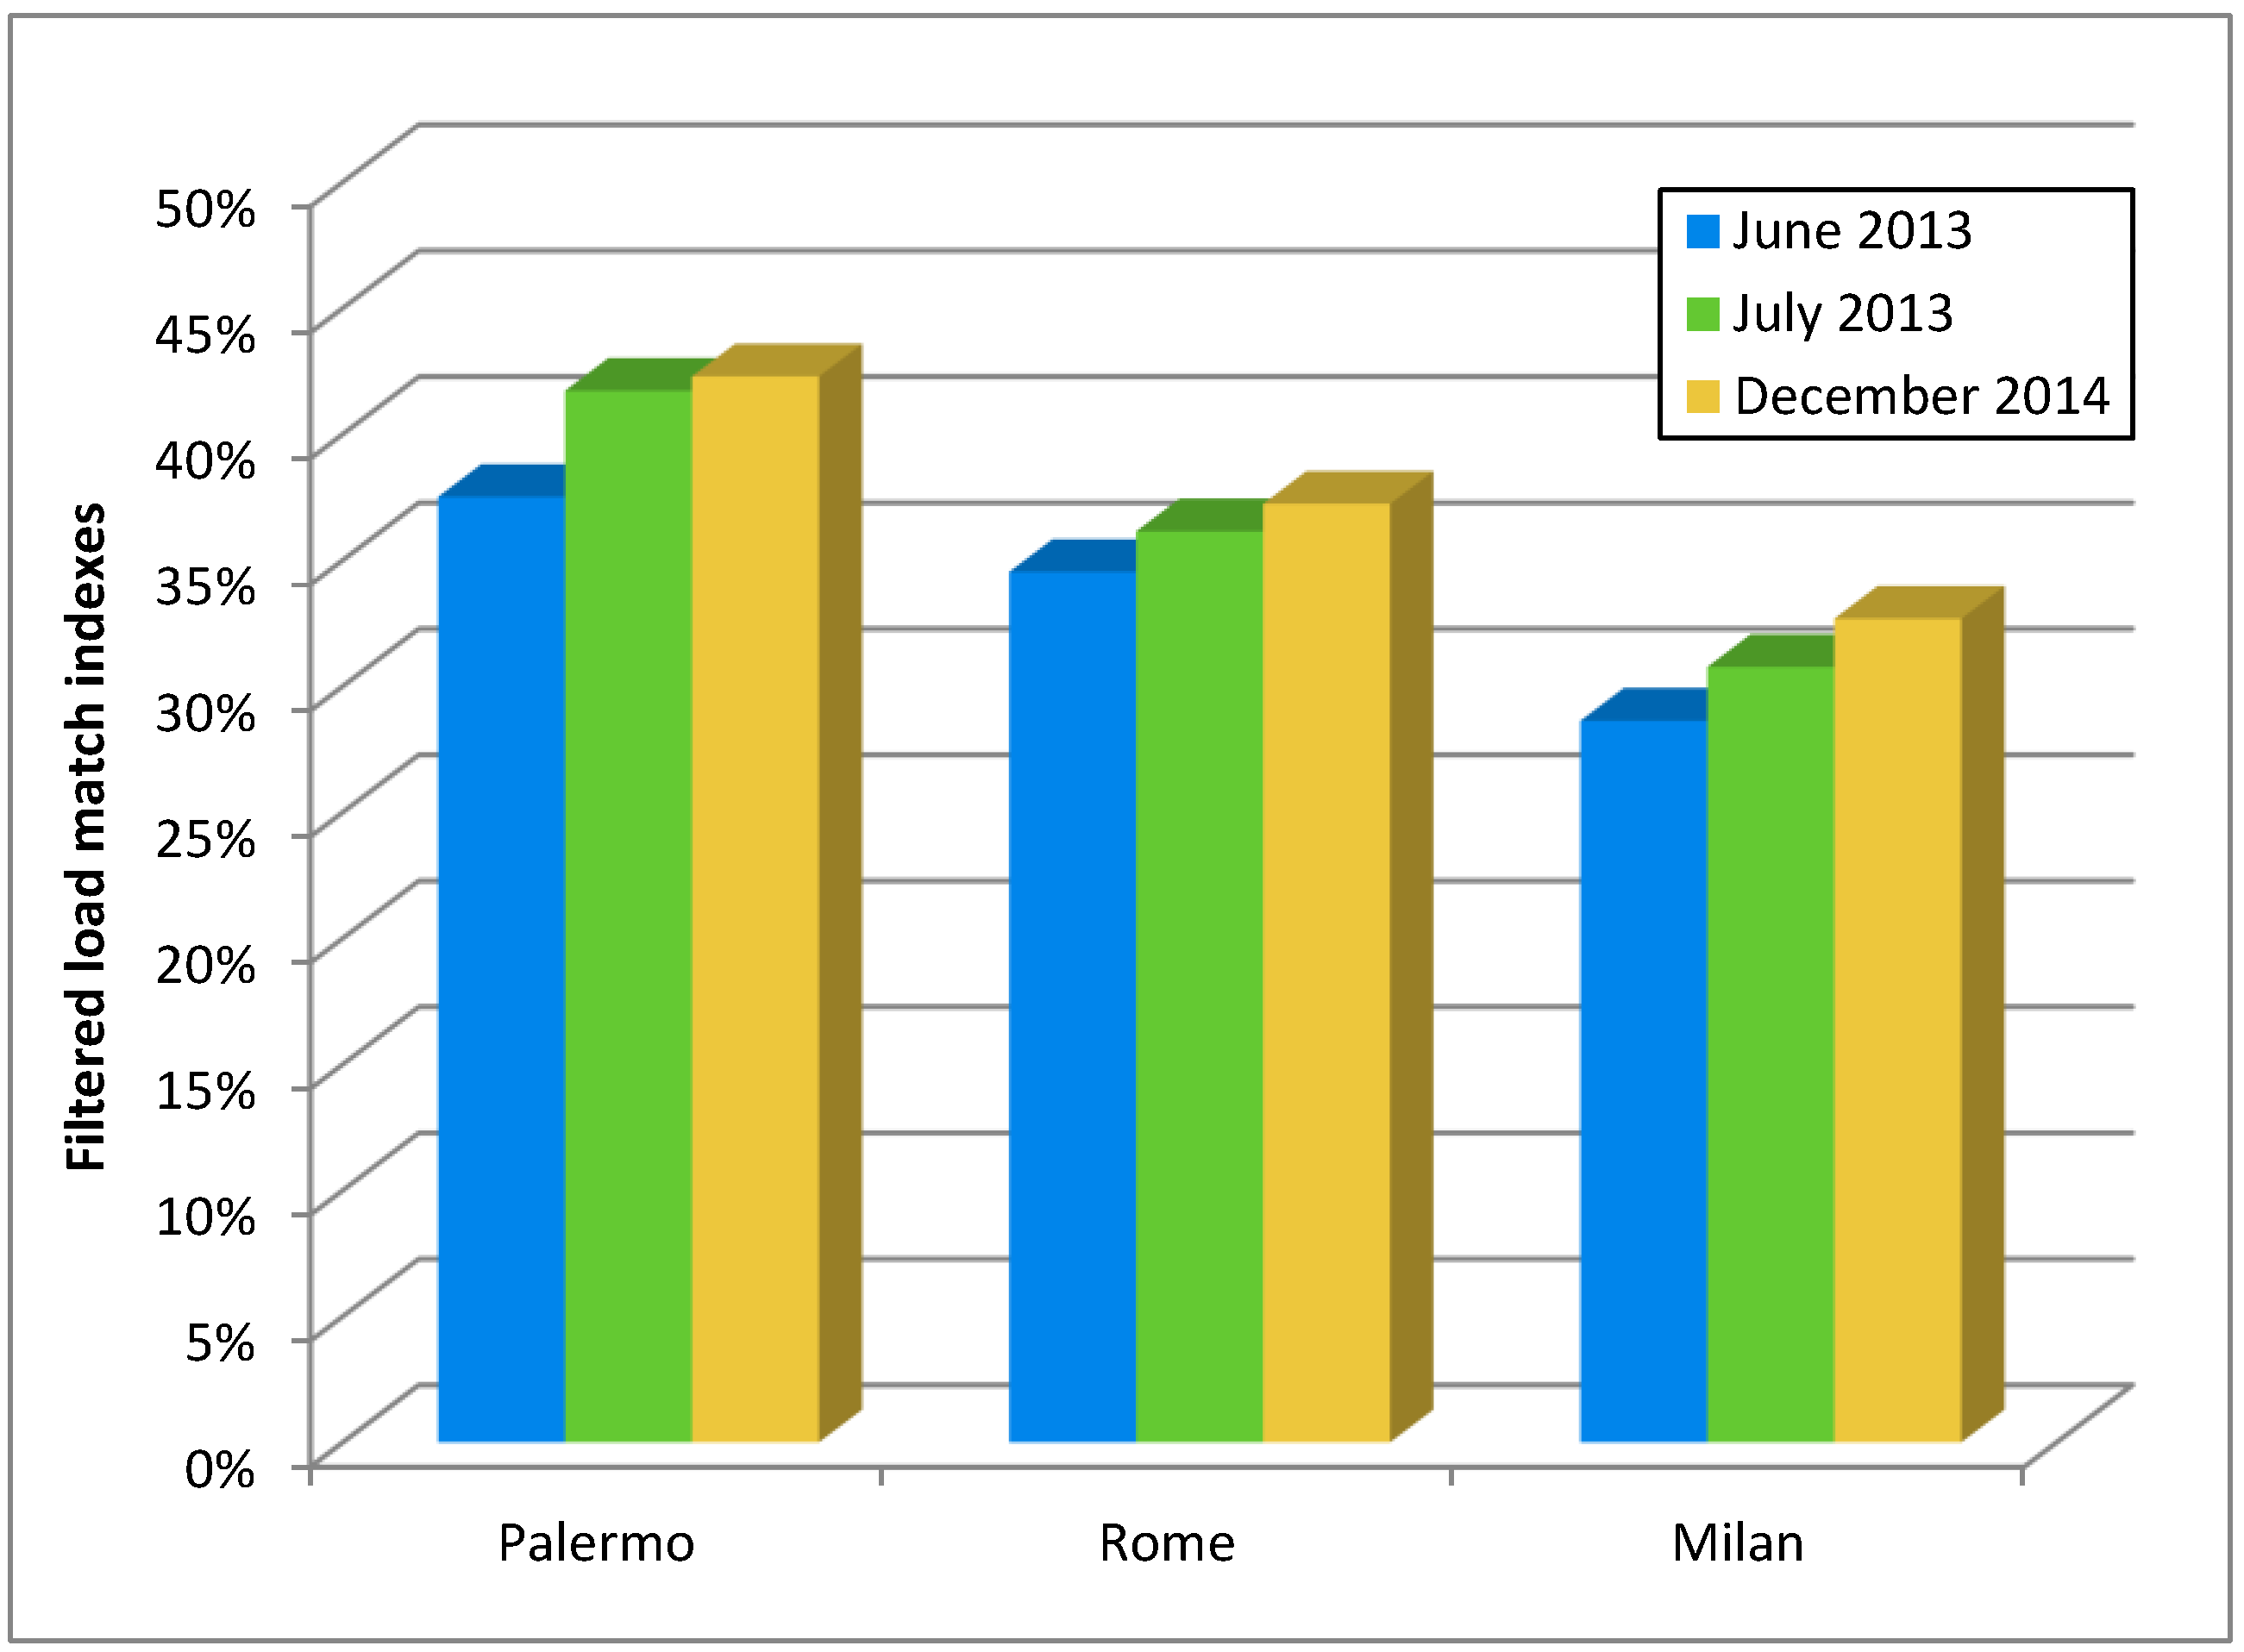
Figure 12 shows the global values of the filtered load match index before and after the change in the promoting policies.
In December 2014, the electricity demand coverage of the PV systems in Milan, which benefit from the tax credit scheme, is up to 14.3% higher than the coverage calculated in June 2013, when the FIT scheme was still in force. The analogous increase in the electricity demand coverage is equal to 7.8% in Rome and 12.8% in Palermo. The direct comparison between the load match indexes shows the great significance of the economic analysis in evaluating the effects of the two different support policies. The gains for the reduced electricity bills and the sold electricity apart, the level of the economic convenience of PV systems largely depends on the incentives. The established values of the FITs are less effective than the tax credit rates to compensate the disbursements of PV investments.
The FIT scheme, which has been in force in Italy over many years, provided a premium proportional to the generated energy. Despite the de-escalation rates, which were applied to ratchet down the tariffs over the time, such direct monetary incentive was considered an attractive and efficient instrument to achieve an acceptable energy and economic return. It was expected that the change in the Italian policies for photovoltaics could reduce the interest in installing PV systems and induce the investors to choose other opportunities. On the contrary, the present study shows that the new tax credit scheme, which only allows taxpayers to reduce the amount of tax that they owe to the government, is very effective in assuring the energy demand coverage and enhancing the PV diffusion in Italy. Moreover, it can be observed that the policy context can hold the PV systems dissemination more than the natural potential of the considered location. Although the morphological conditions of the urban context, along with the energy and economic parameters, are relevant contributing factors for a successful integration of PV systems on the building rooftops, the adopted supporting schemes are of crucial importance to household or professional investors, who obviously prefer to invest in projects that provide a satisfactory return.
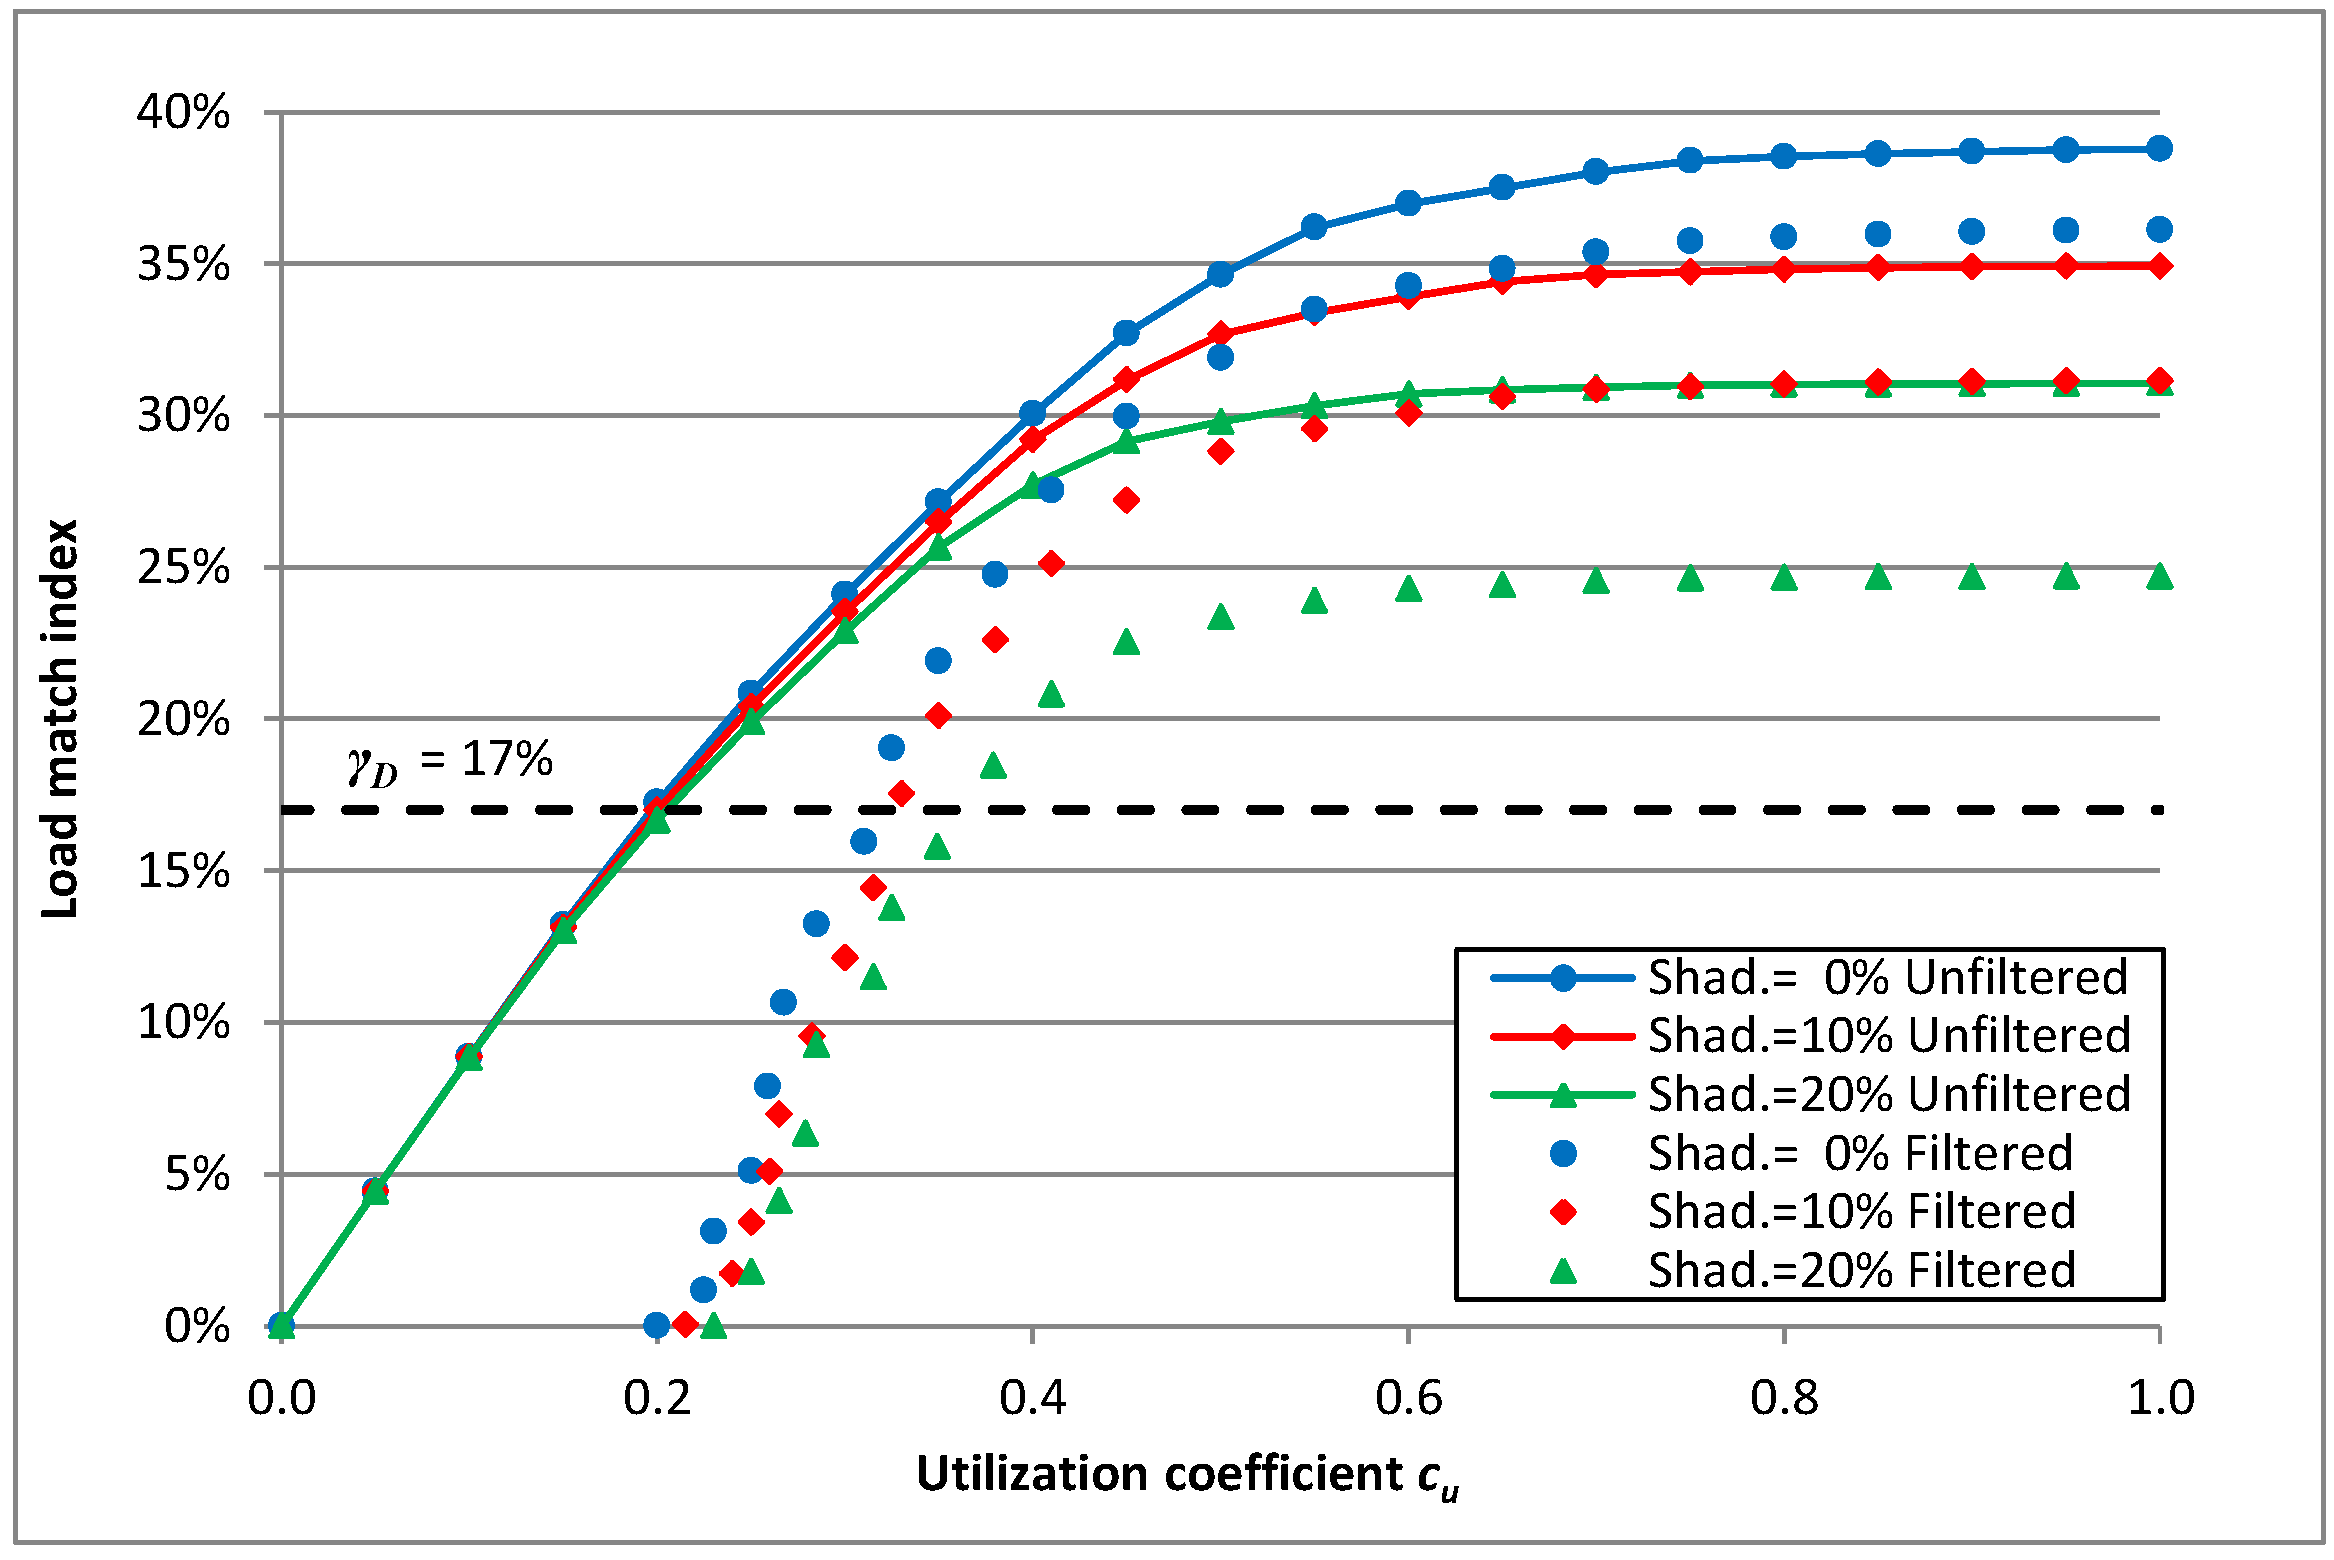
4. Sensitivity Analysis
The results presented in the previous section refer to a condition in which the available solar energy is completely harnessed by the producers, because no obstruction shadows the PV fields, and the electricity generated perfectly matches the energy demands of flats. Actually, such an ideal condition is quite far from the real operation of PV systems installed in densely urbanised districts in which, because both low and tall buildings are present, the PV arrays placed on the roofs of low buildings, which are the most effective in covering the electricity demand, may be very likely shadowed by the adjoining tall buildings. Moreover, the presence of an amount of mismatch between generation and consumption should be realistically considered because even the most meticulous householder may not be capable of using all the electricity generated by a PV system not equipped with batteries. The accurate assessment of the effects of both the PV array shadowing and the load mismatch would require a dynamic analysis of the PV systems based on numerous environmental and electrical parameters. It would be necessary to consider the instantaneous values of the solar irradiance, air temperature and velocity, which affect the current-voltage characteristics of the used PV panels, the value of the electrical load connected to the inverter, which influences the operation of the maximum power point tracking, and the shape, position and height of the surrounding buildings in order to check if the PV array may be shadowed by them. Moreover, because it is unlikely that the PV system results totally shadowed, the analysis of the electrical behaviour should consider the shading of each single PV panel, or even PV cells, because it is known that the global electrical performance of a PV array can be reduced by the malfunction of a single PV device. Even though the described analysis, which would require a large extent of reliable data and computations, was carried out considering the totality of the PV systems of the districts, the results would never have a general validity because some relevant information, such as the instantaneous values of the domestic electrical loads connected to each inverter, may be just supposed on the basis of hypothetical scenarios. In addition, the results would be valid only for the studied districts and such districts, even if selected to be representatives, are only a sample of the analysed cities.
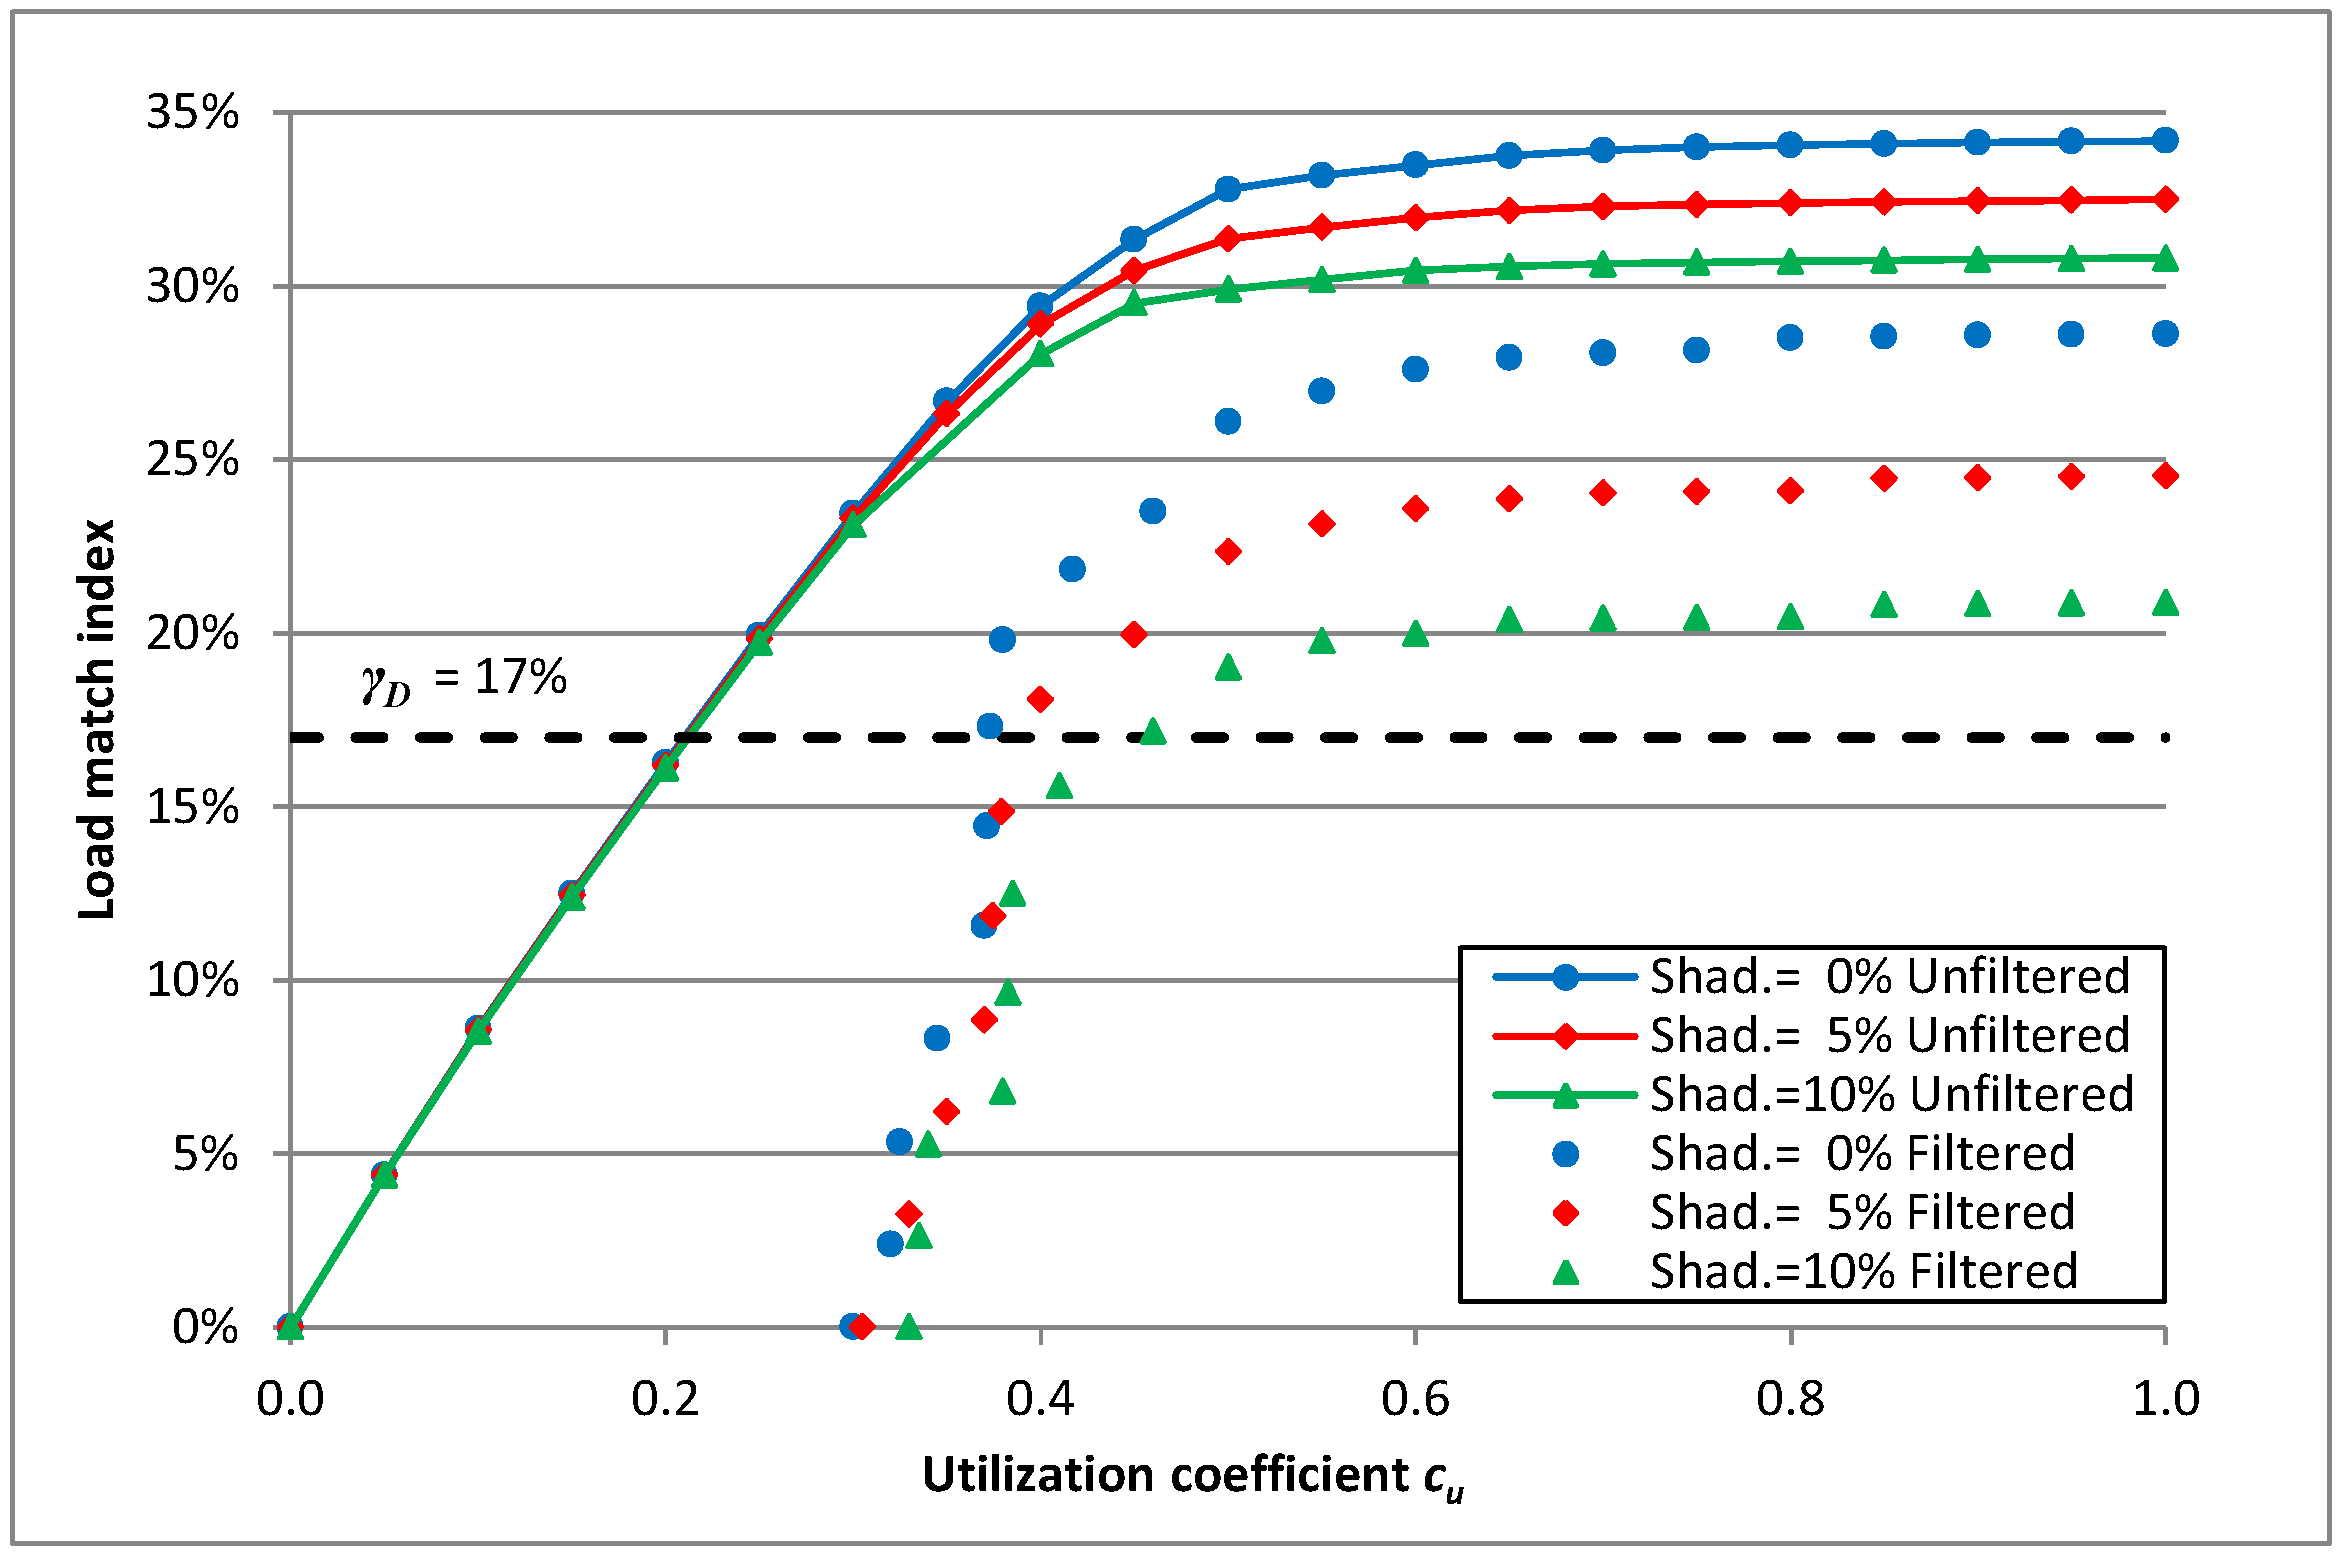
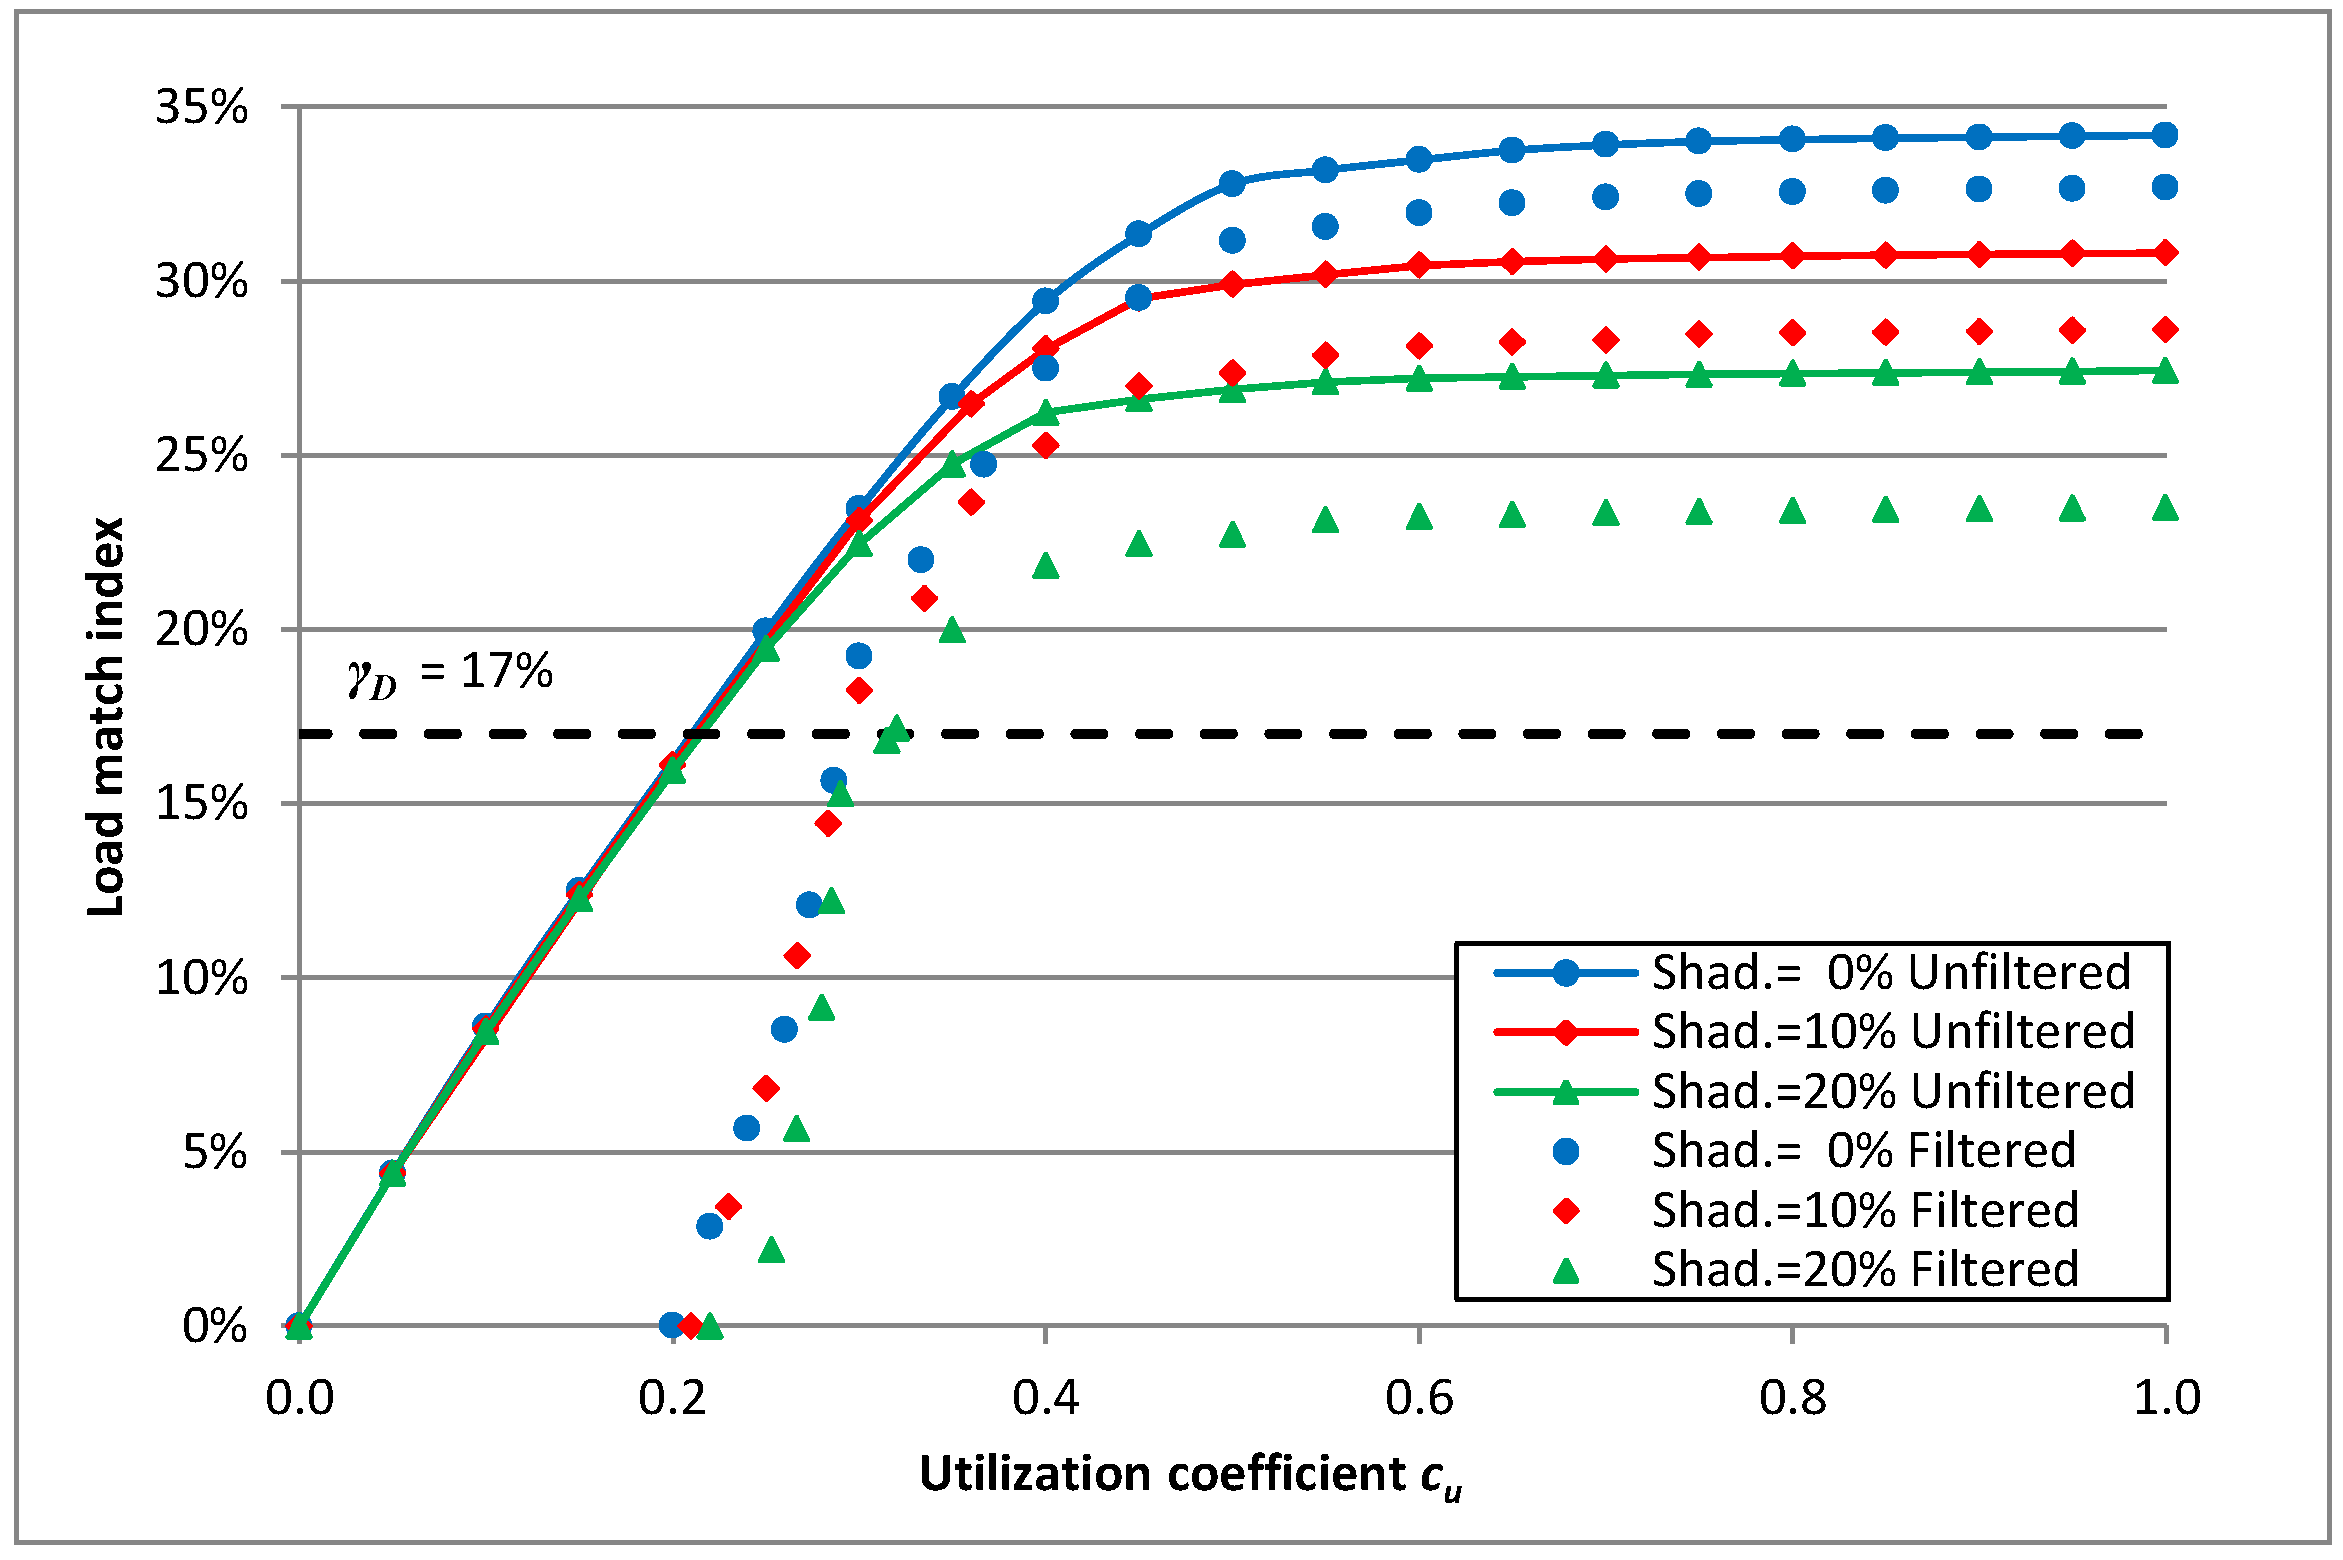
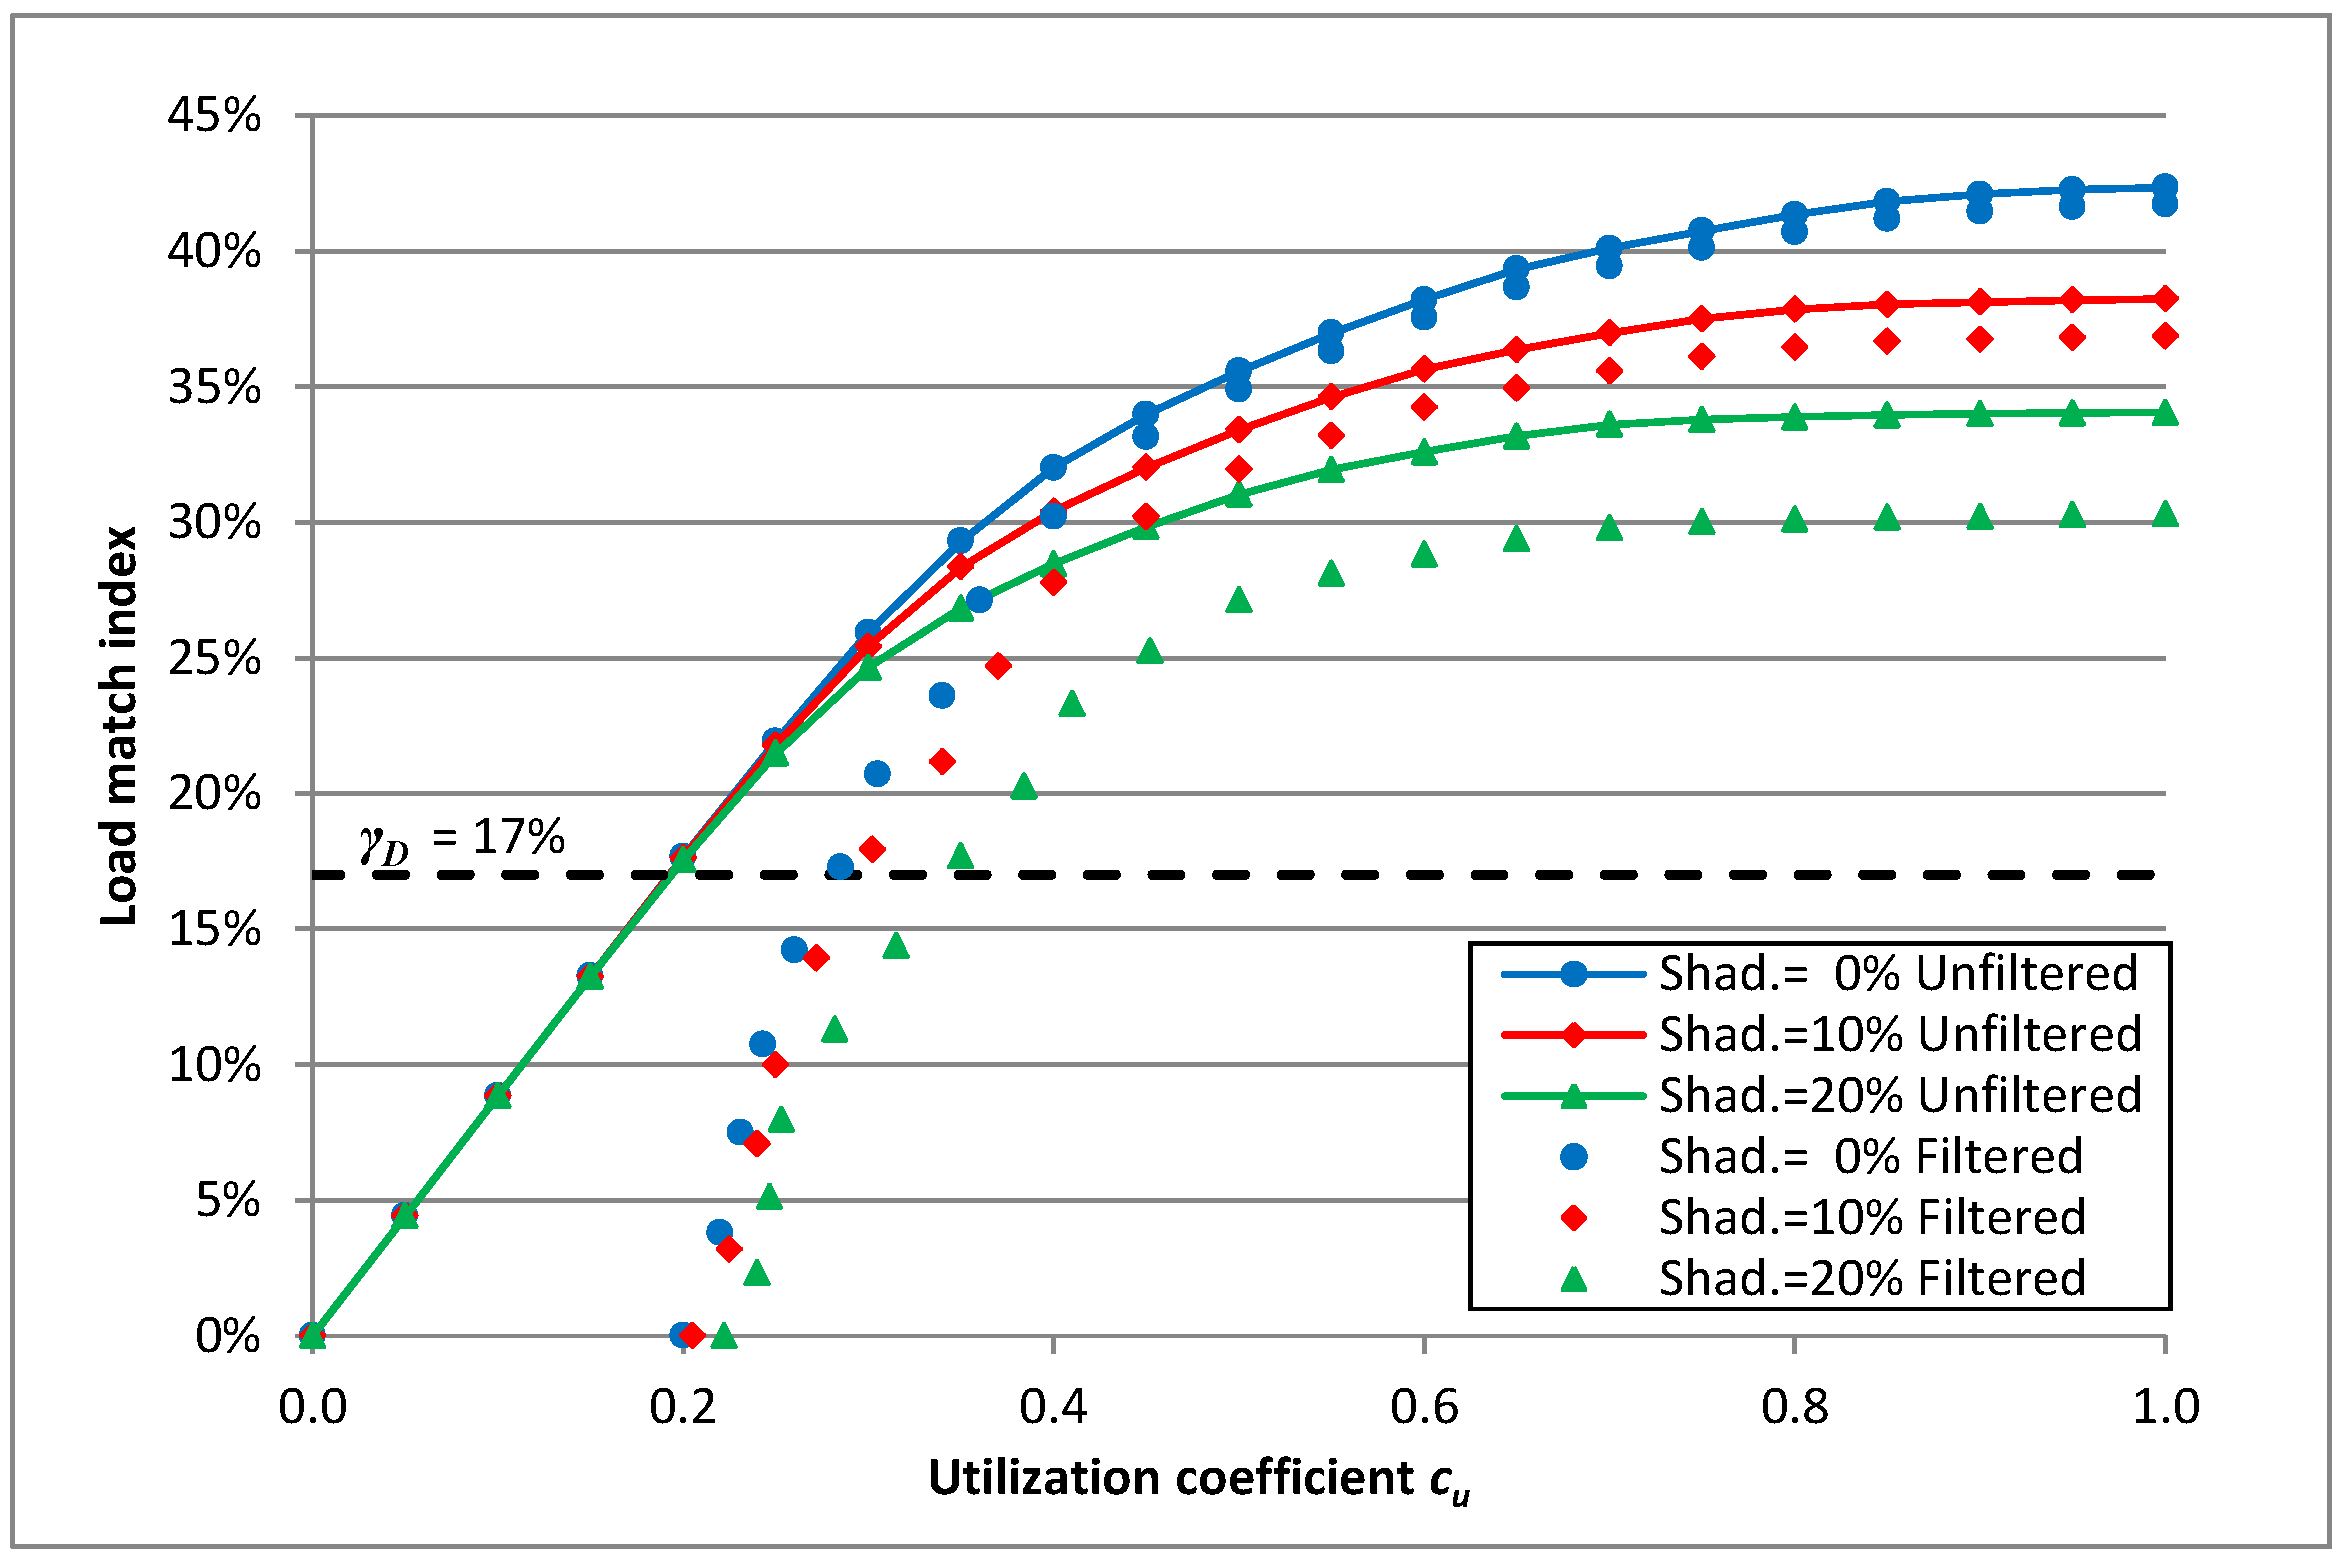
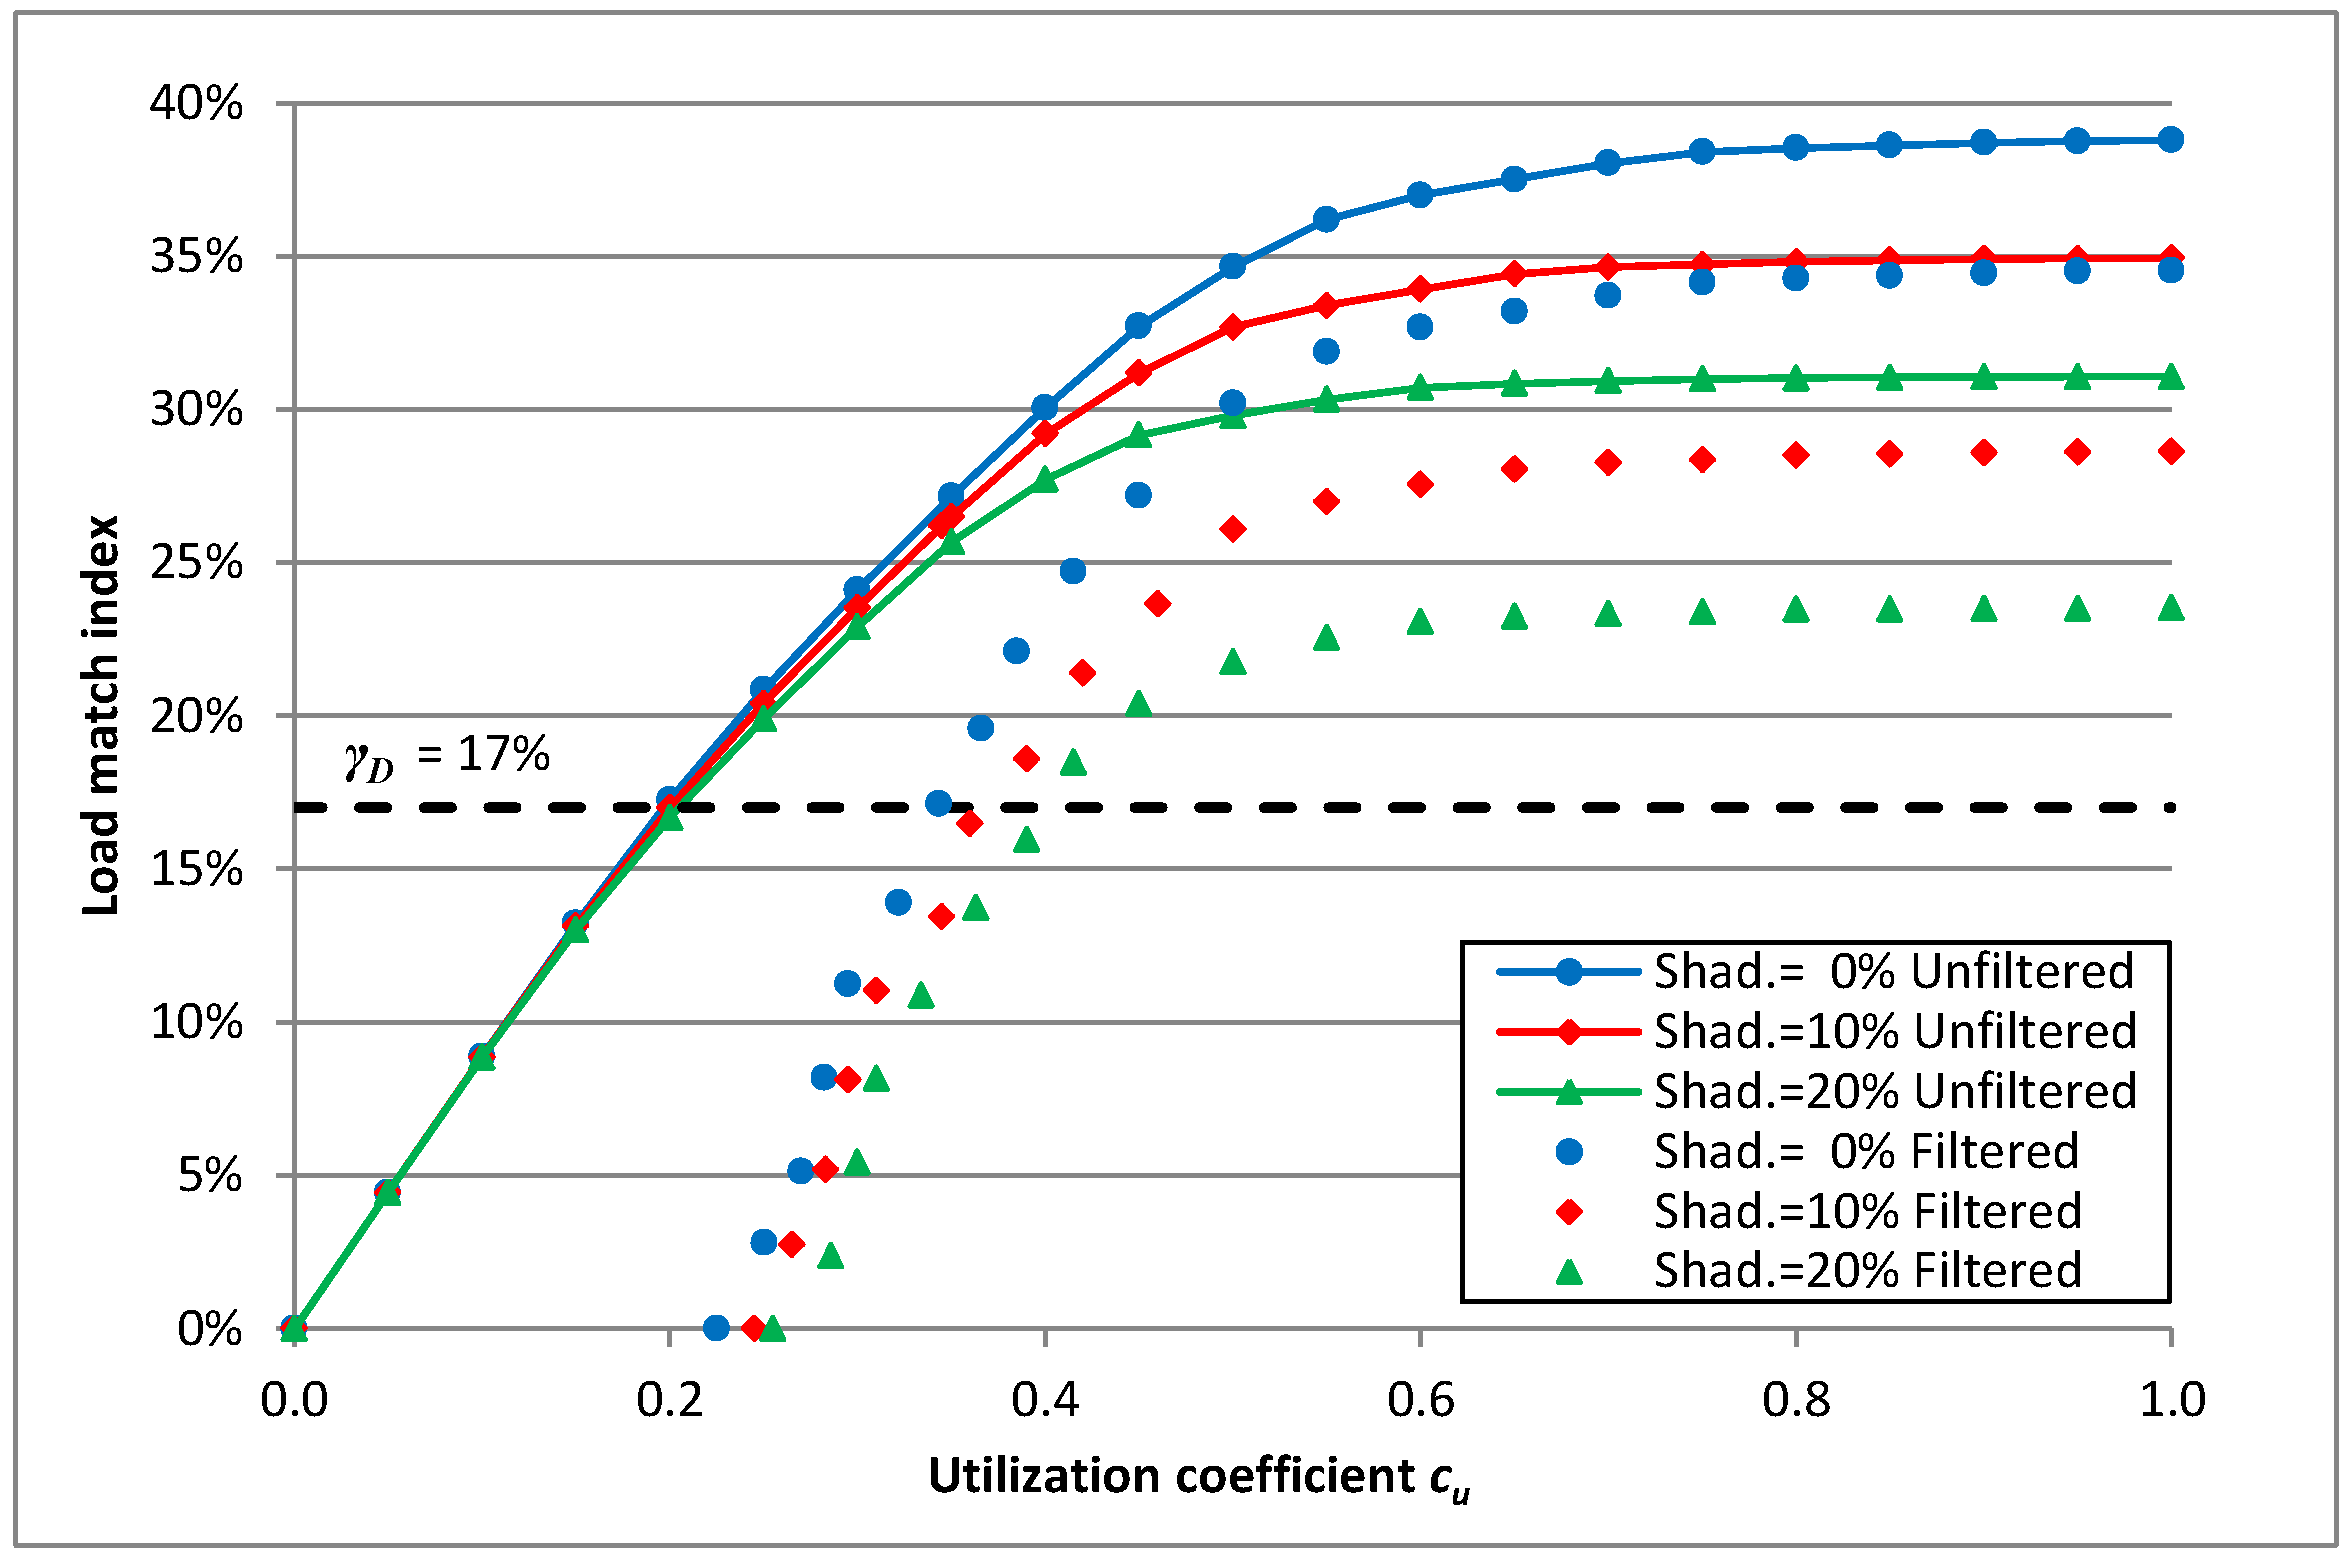
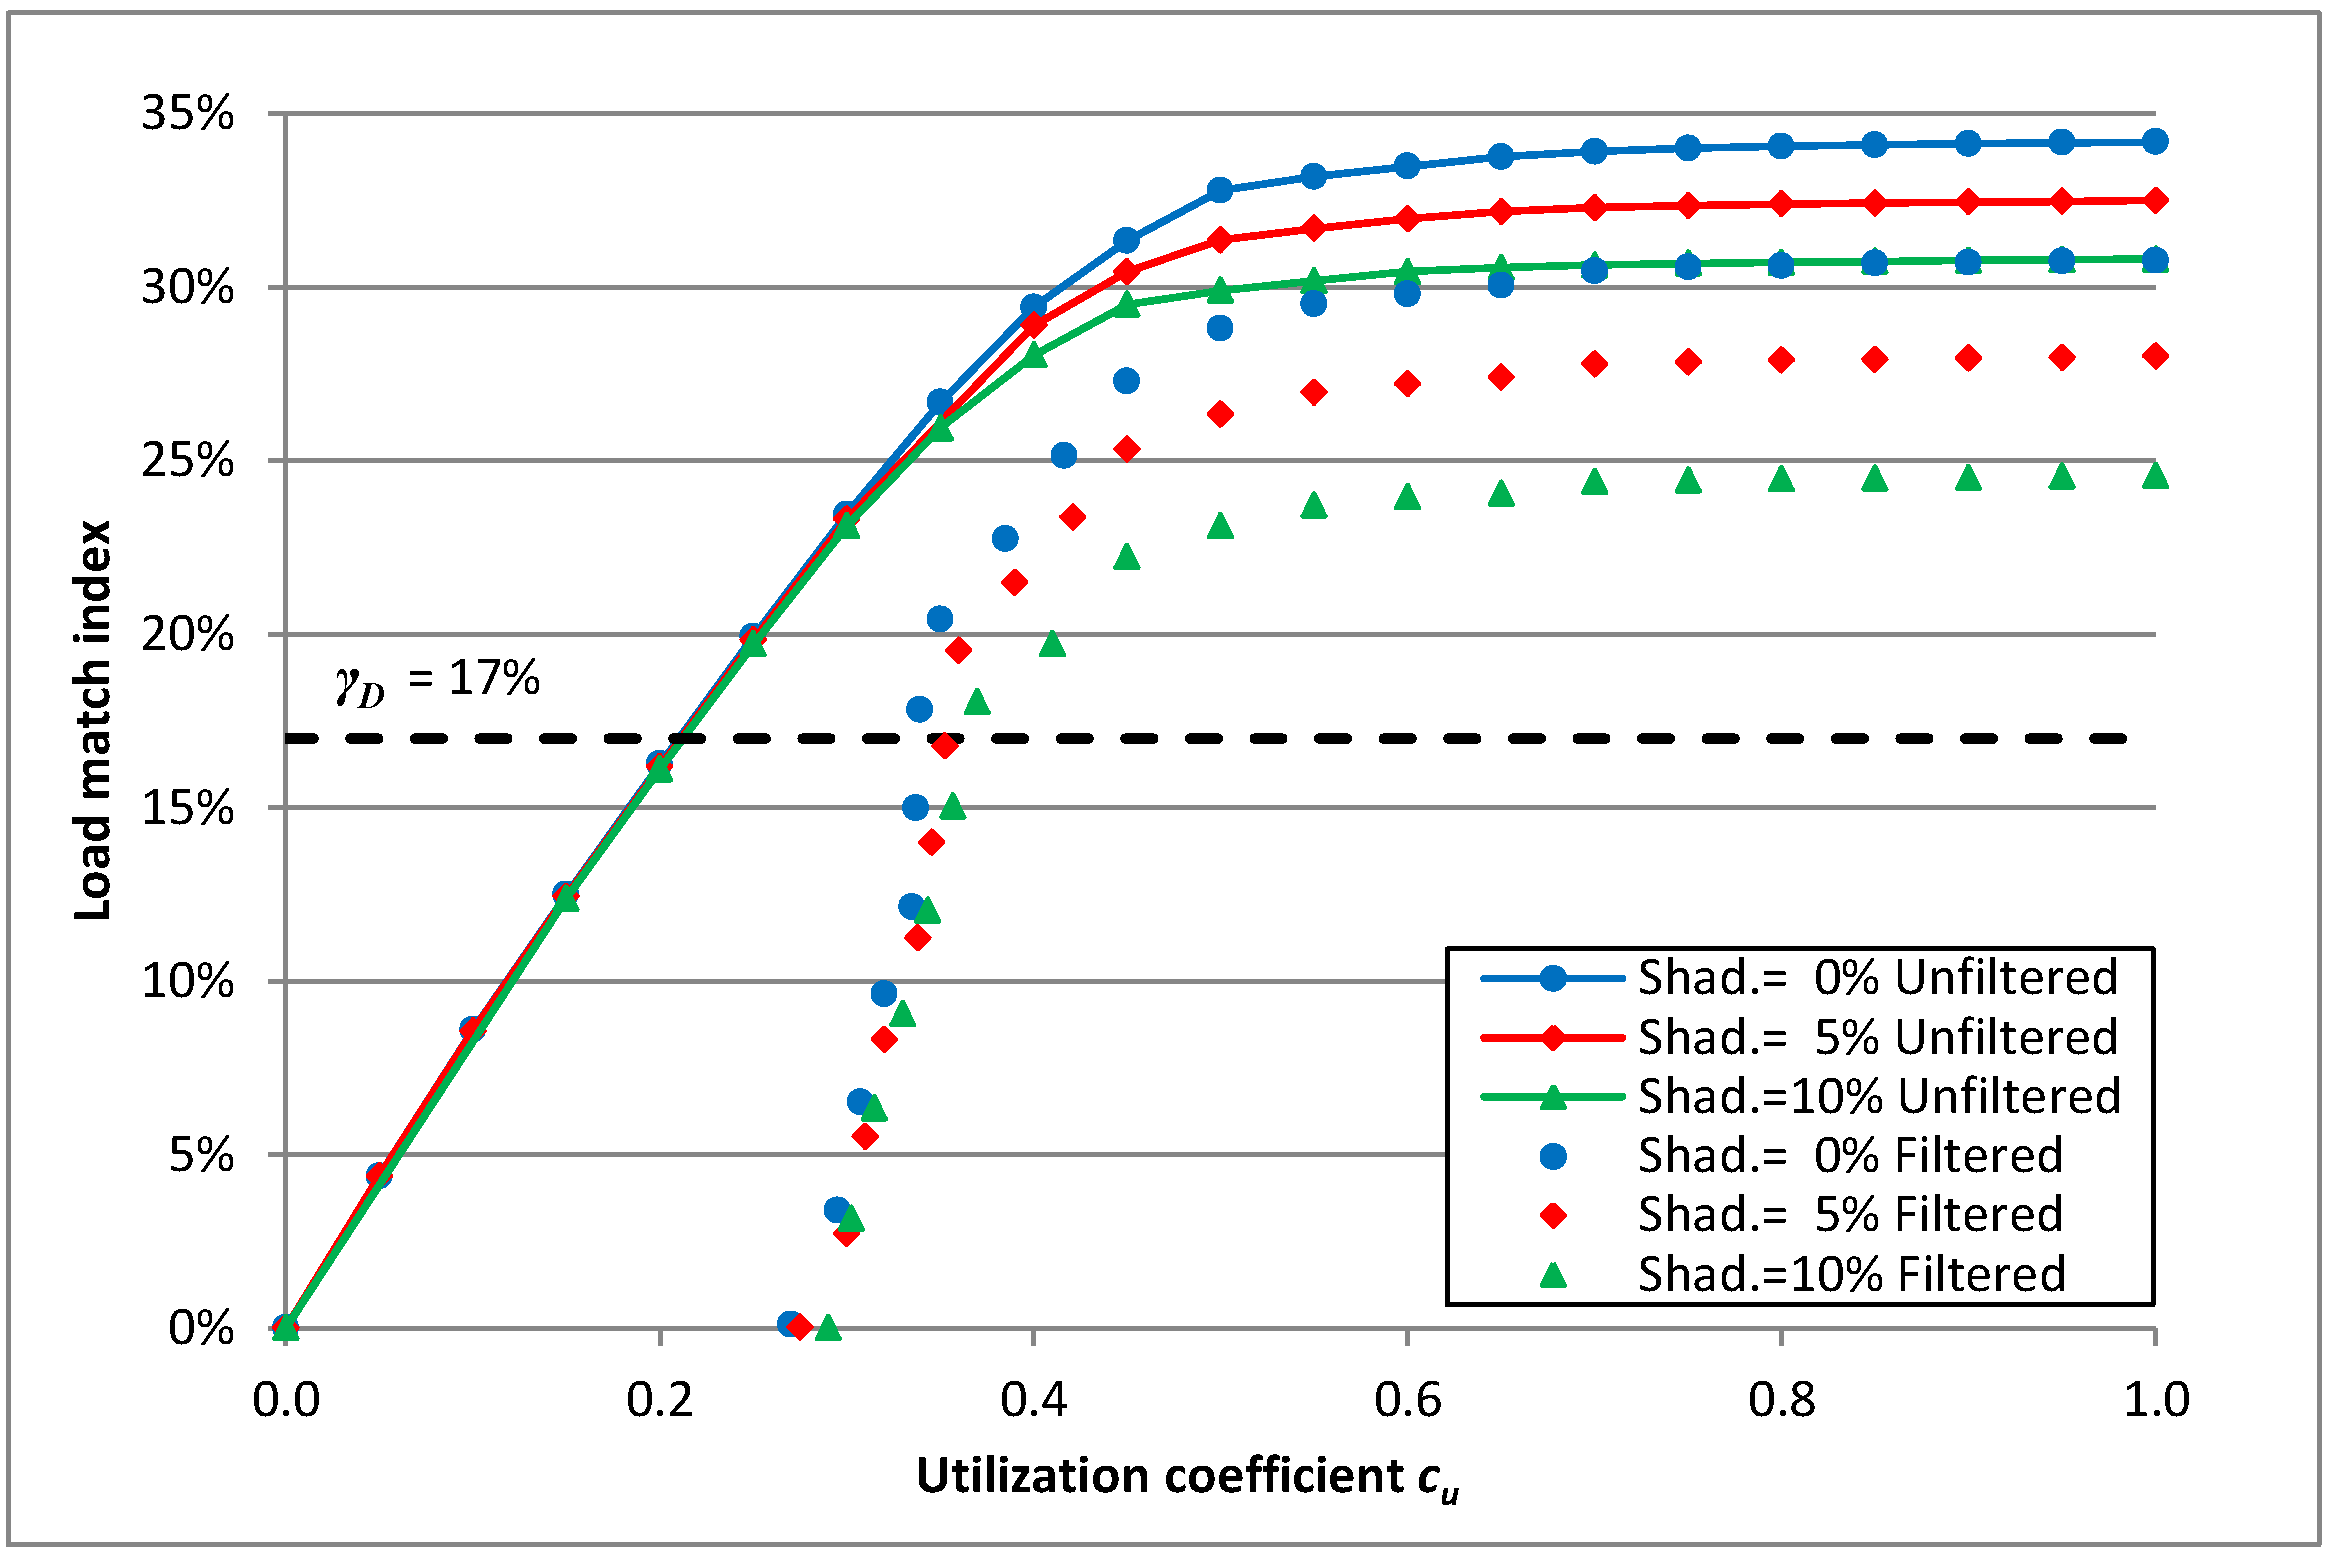
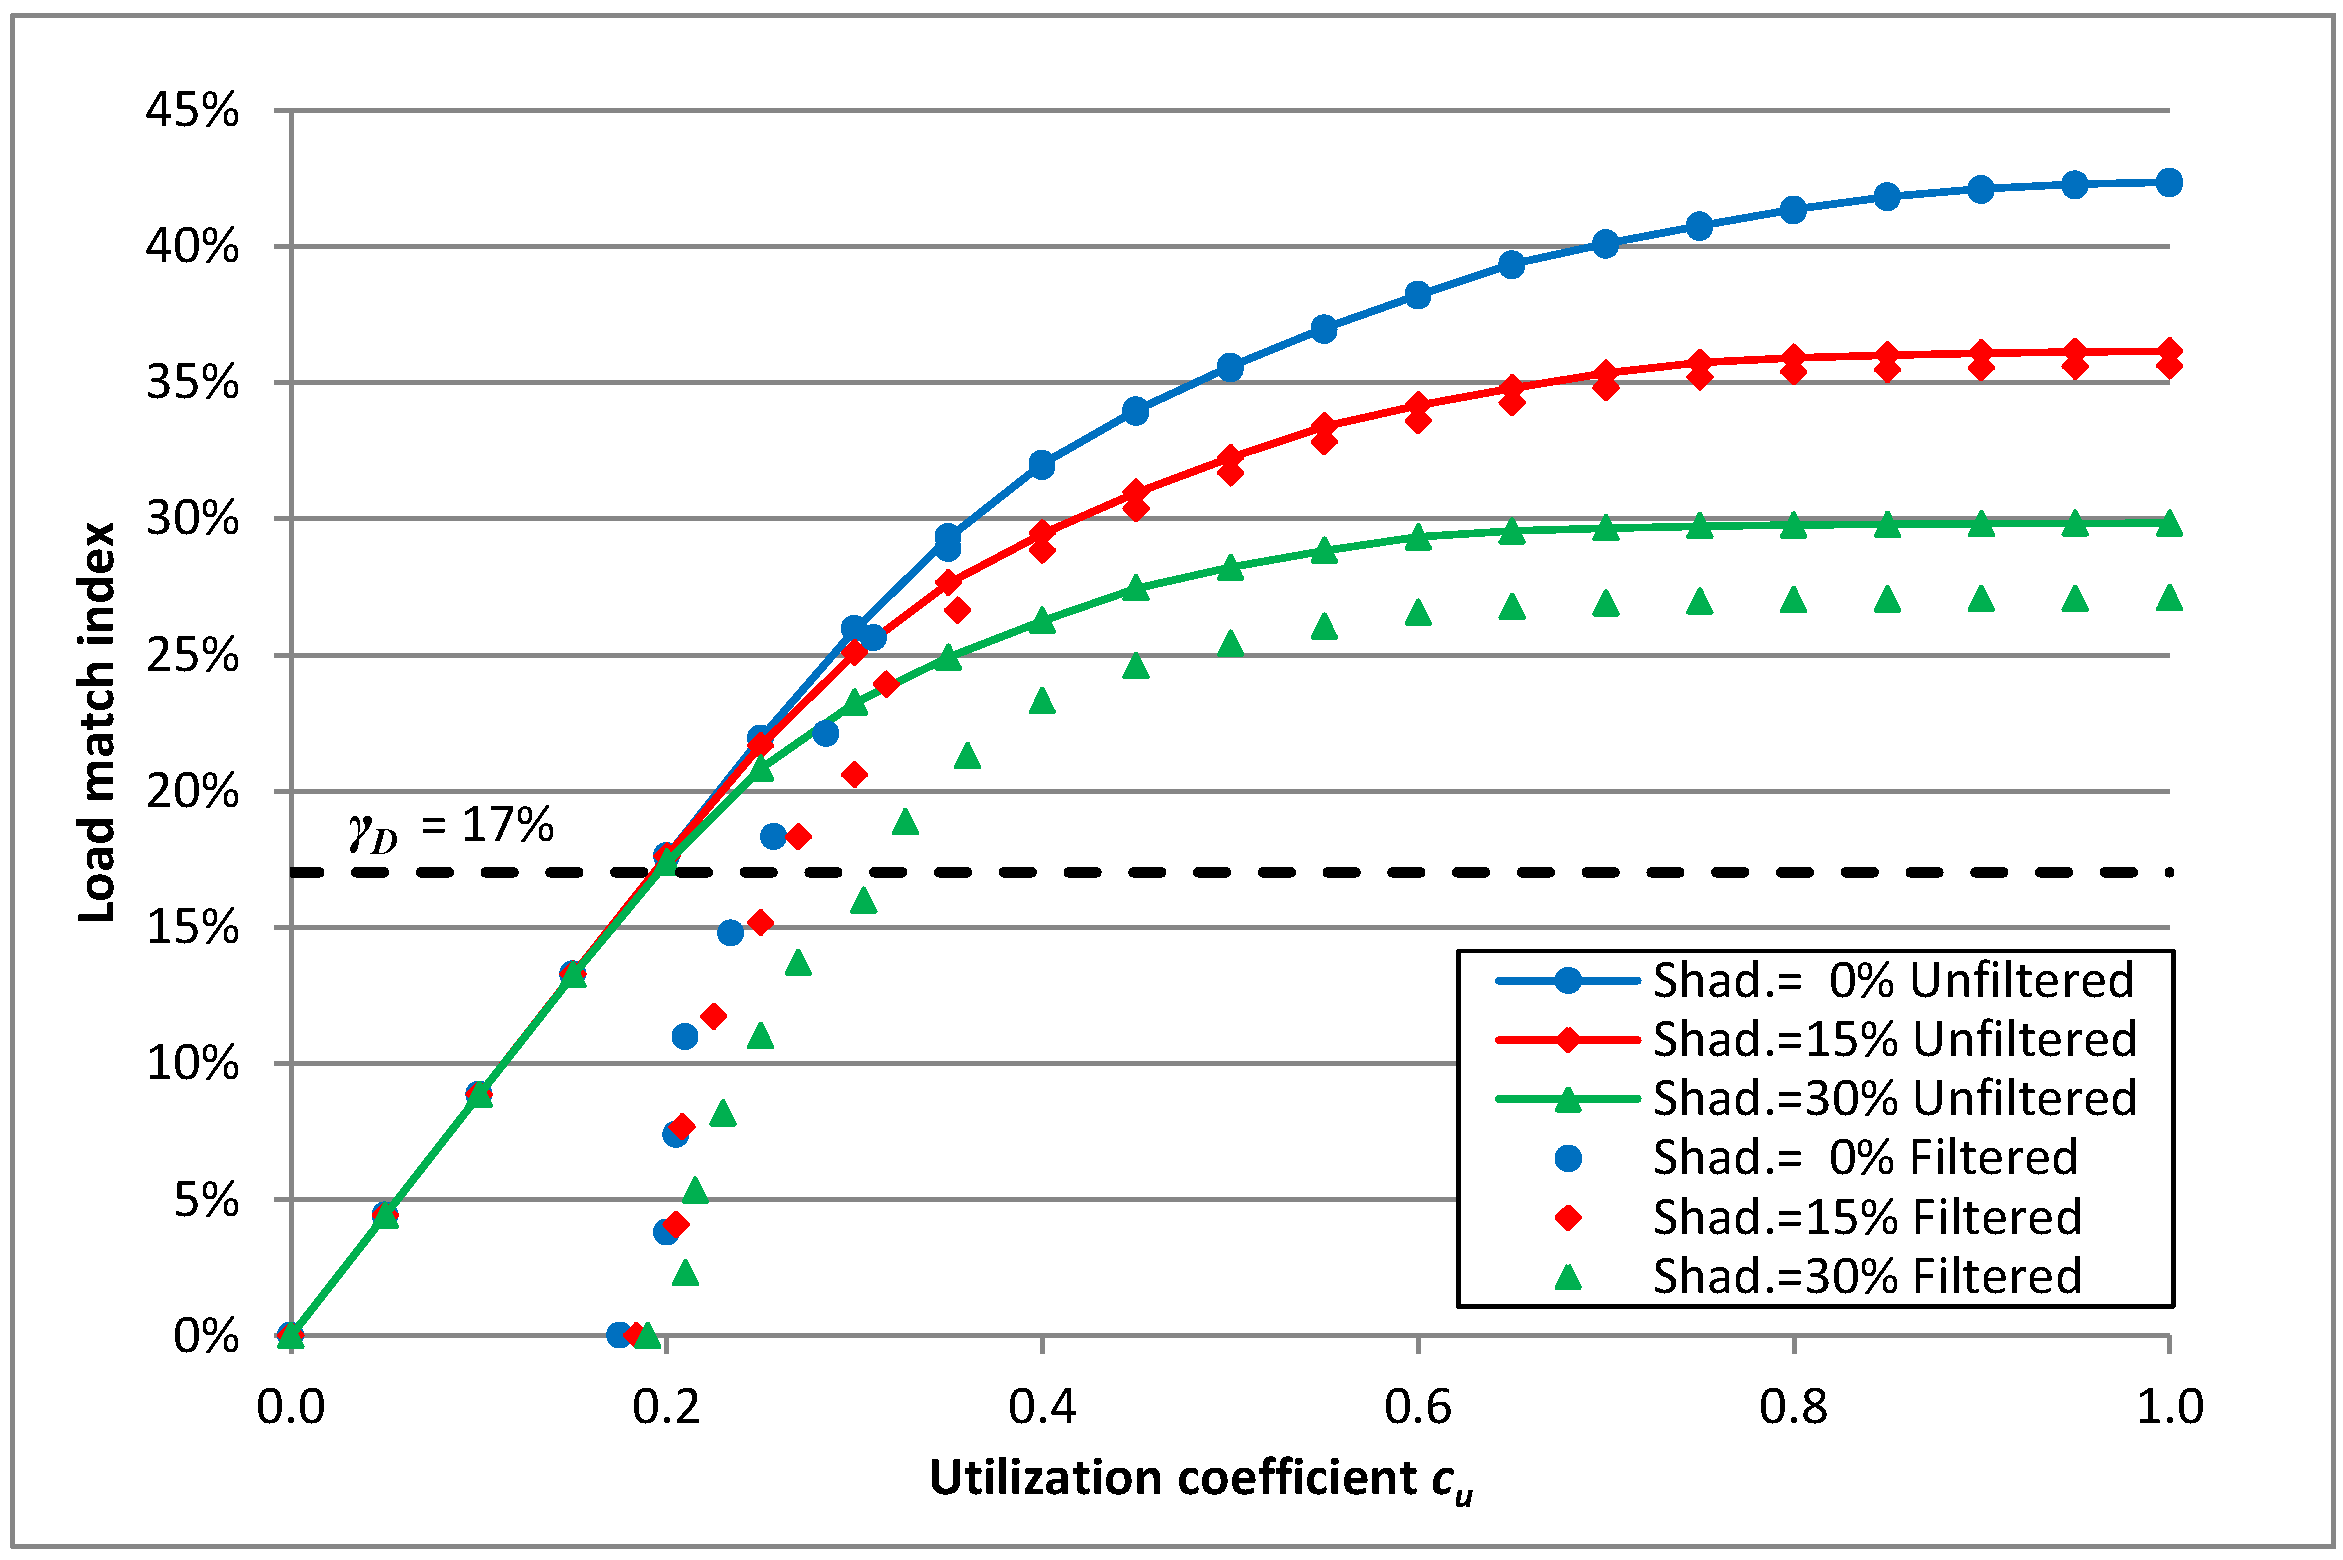
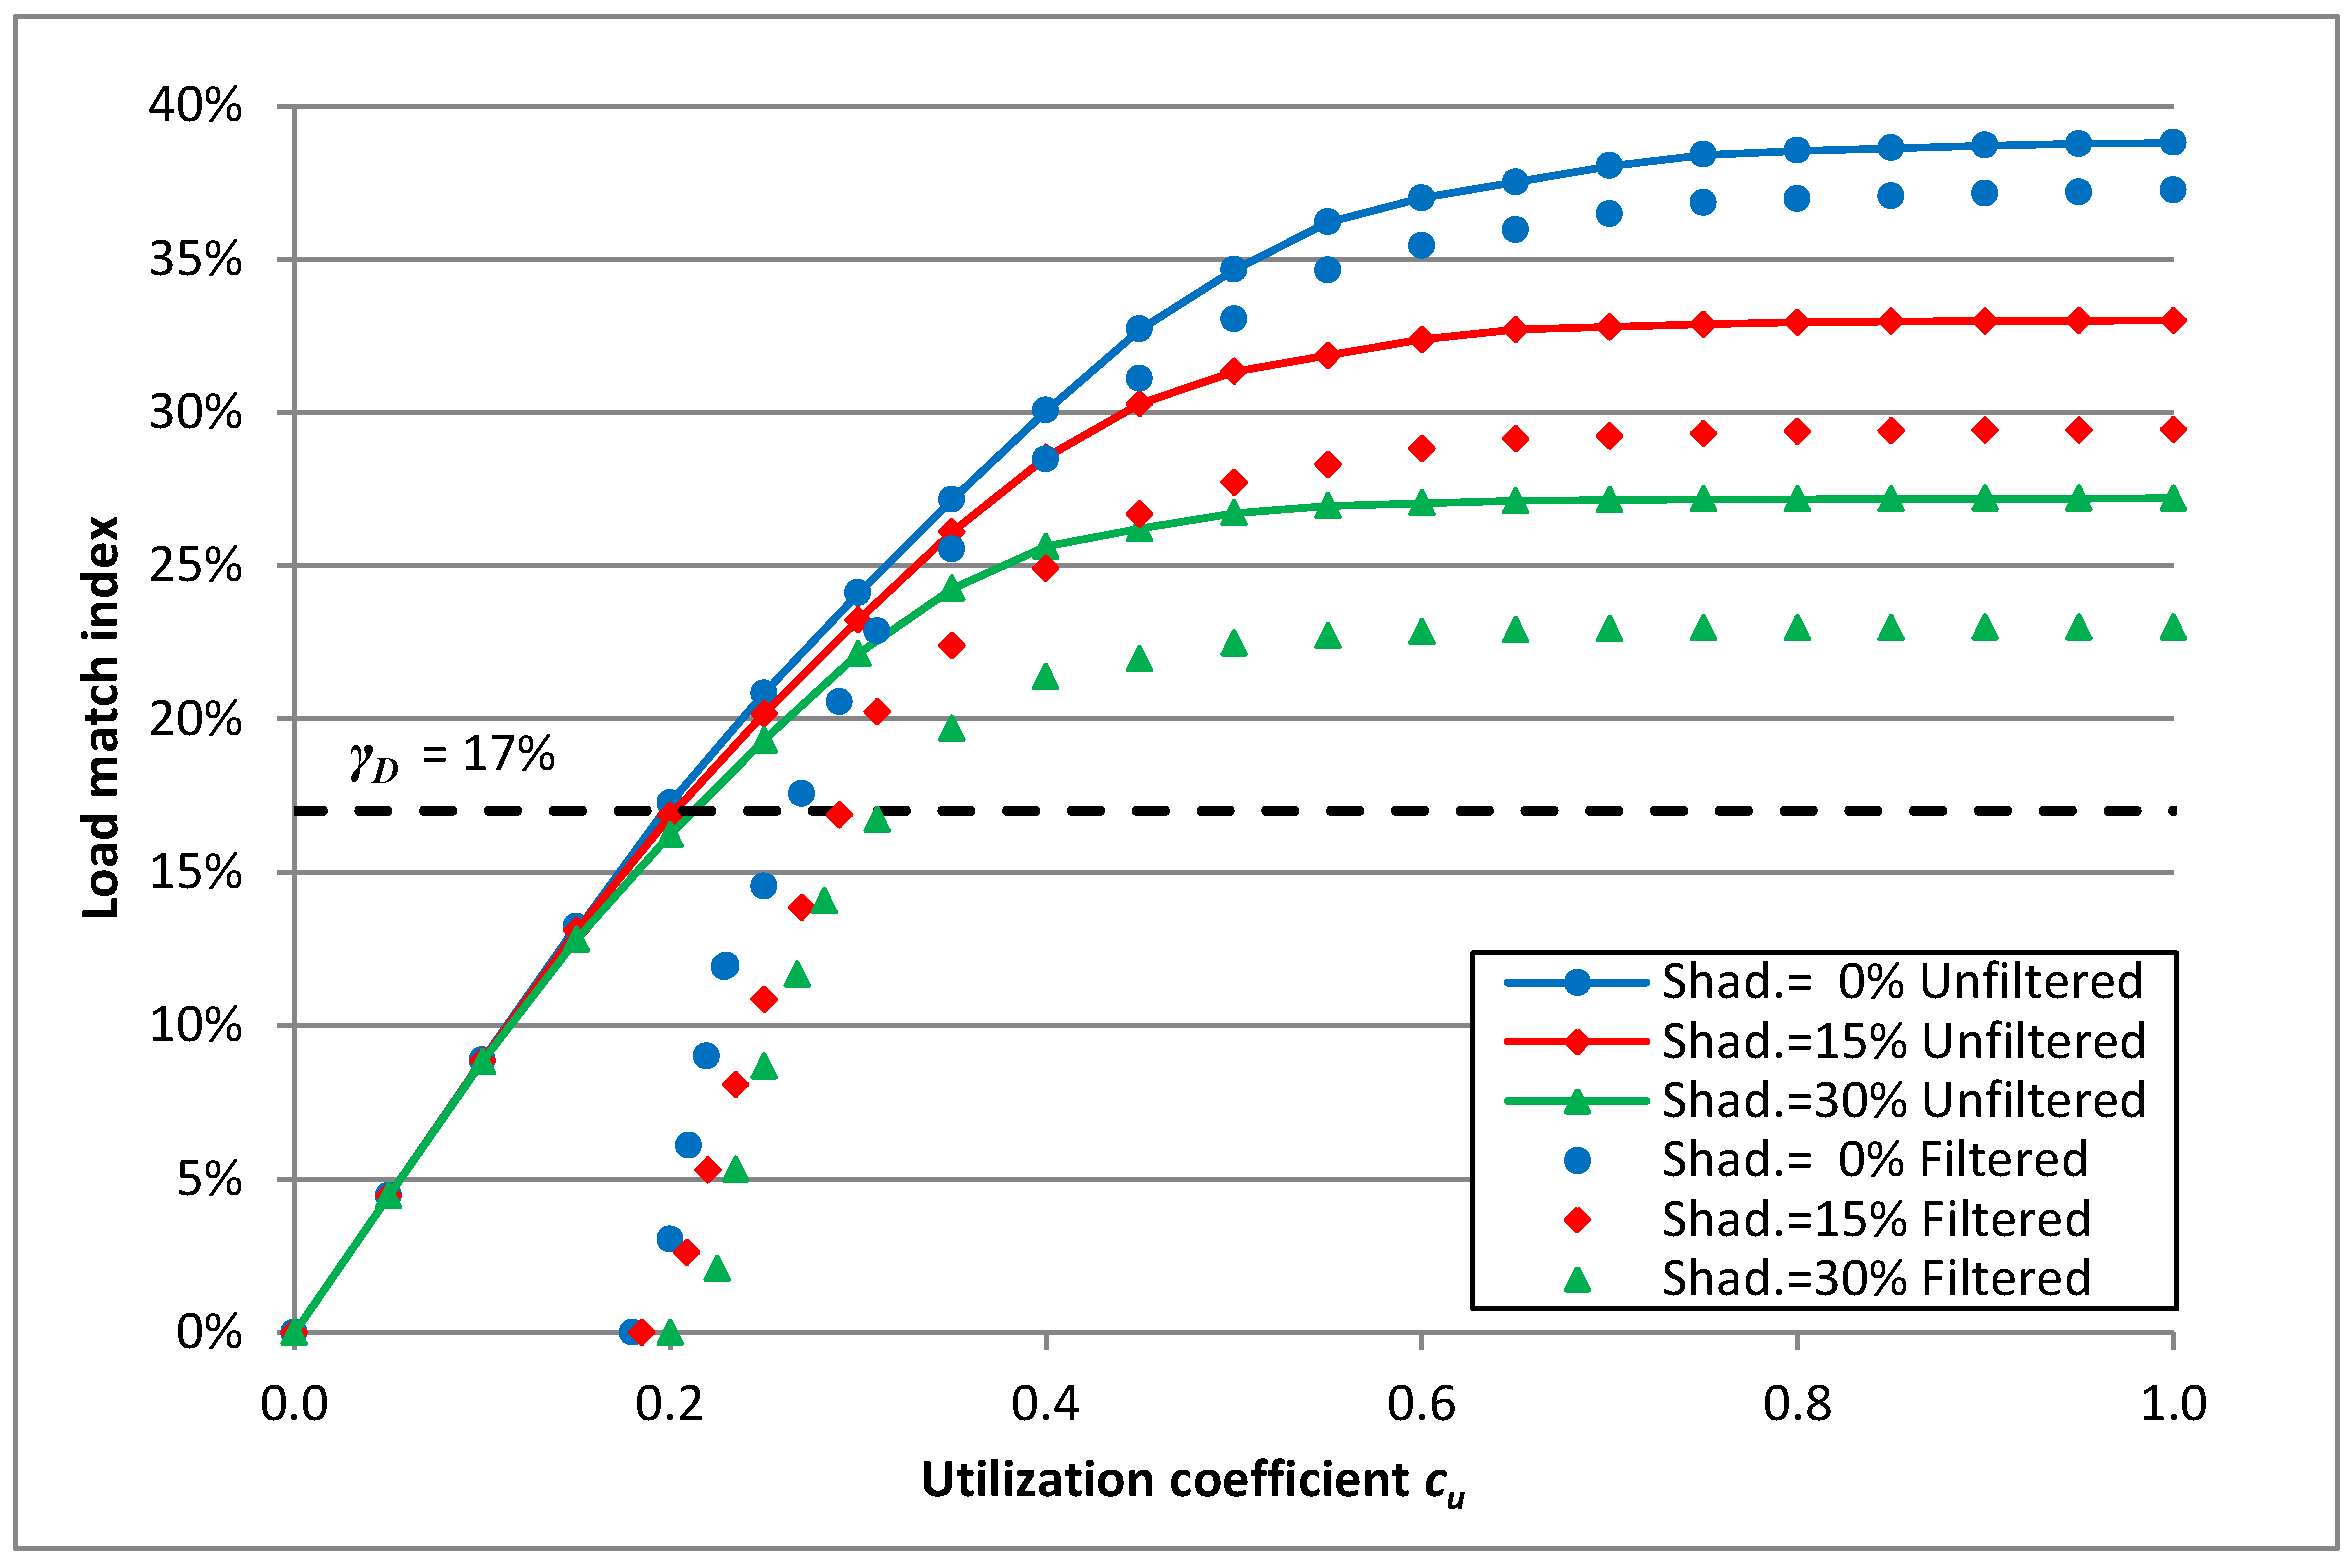
For the above reasons, the assessment of the load mismatch and shading effects was carried out by means of a sensitivity analysis based on the available yearly data and information. The described results represent how the load mismatch and shading averagely affect the electricity coverage of the totality of the PV systems installed on the roofs of the analysed districts. The shading effects are evaluated using a shading coefficient that varies from zero (no shading) to 100% (no solar energy is collected). In
Figure 13,
Figure 14,
Figure 15,
Figure 16,
Figure 17 and
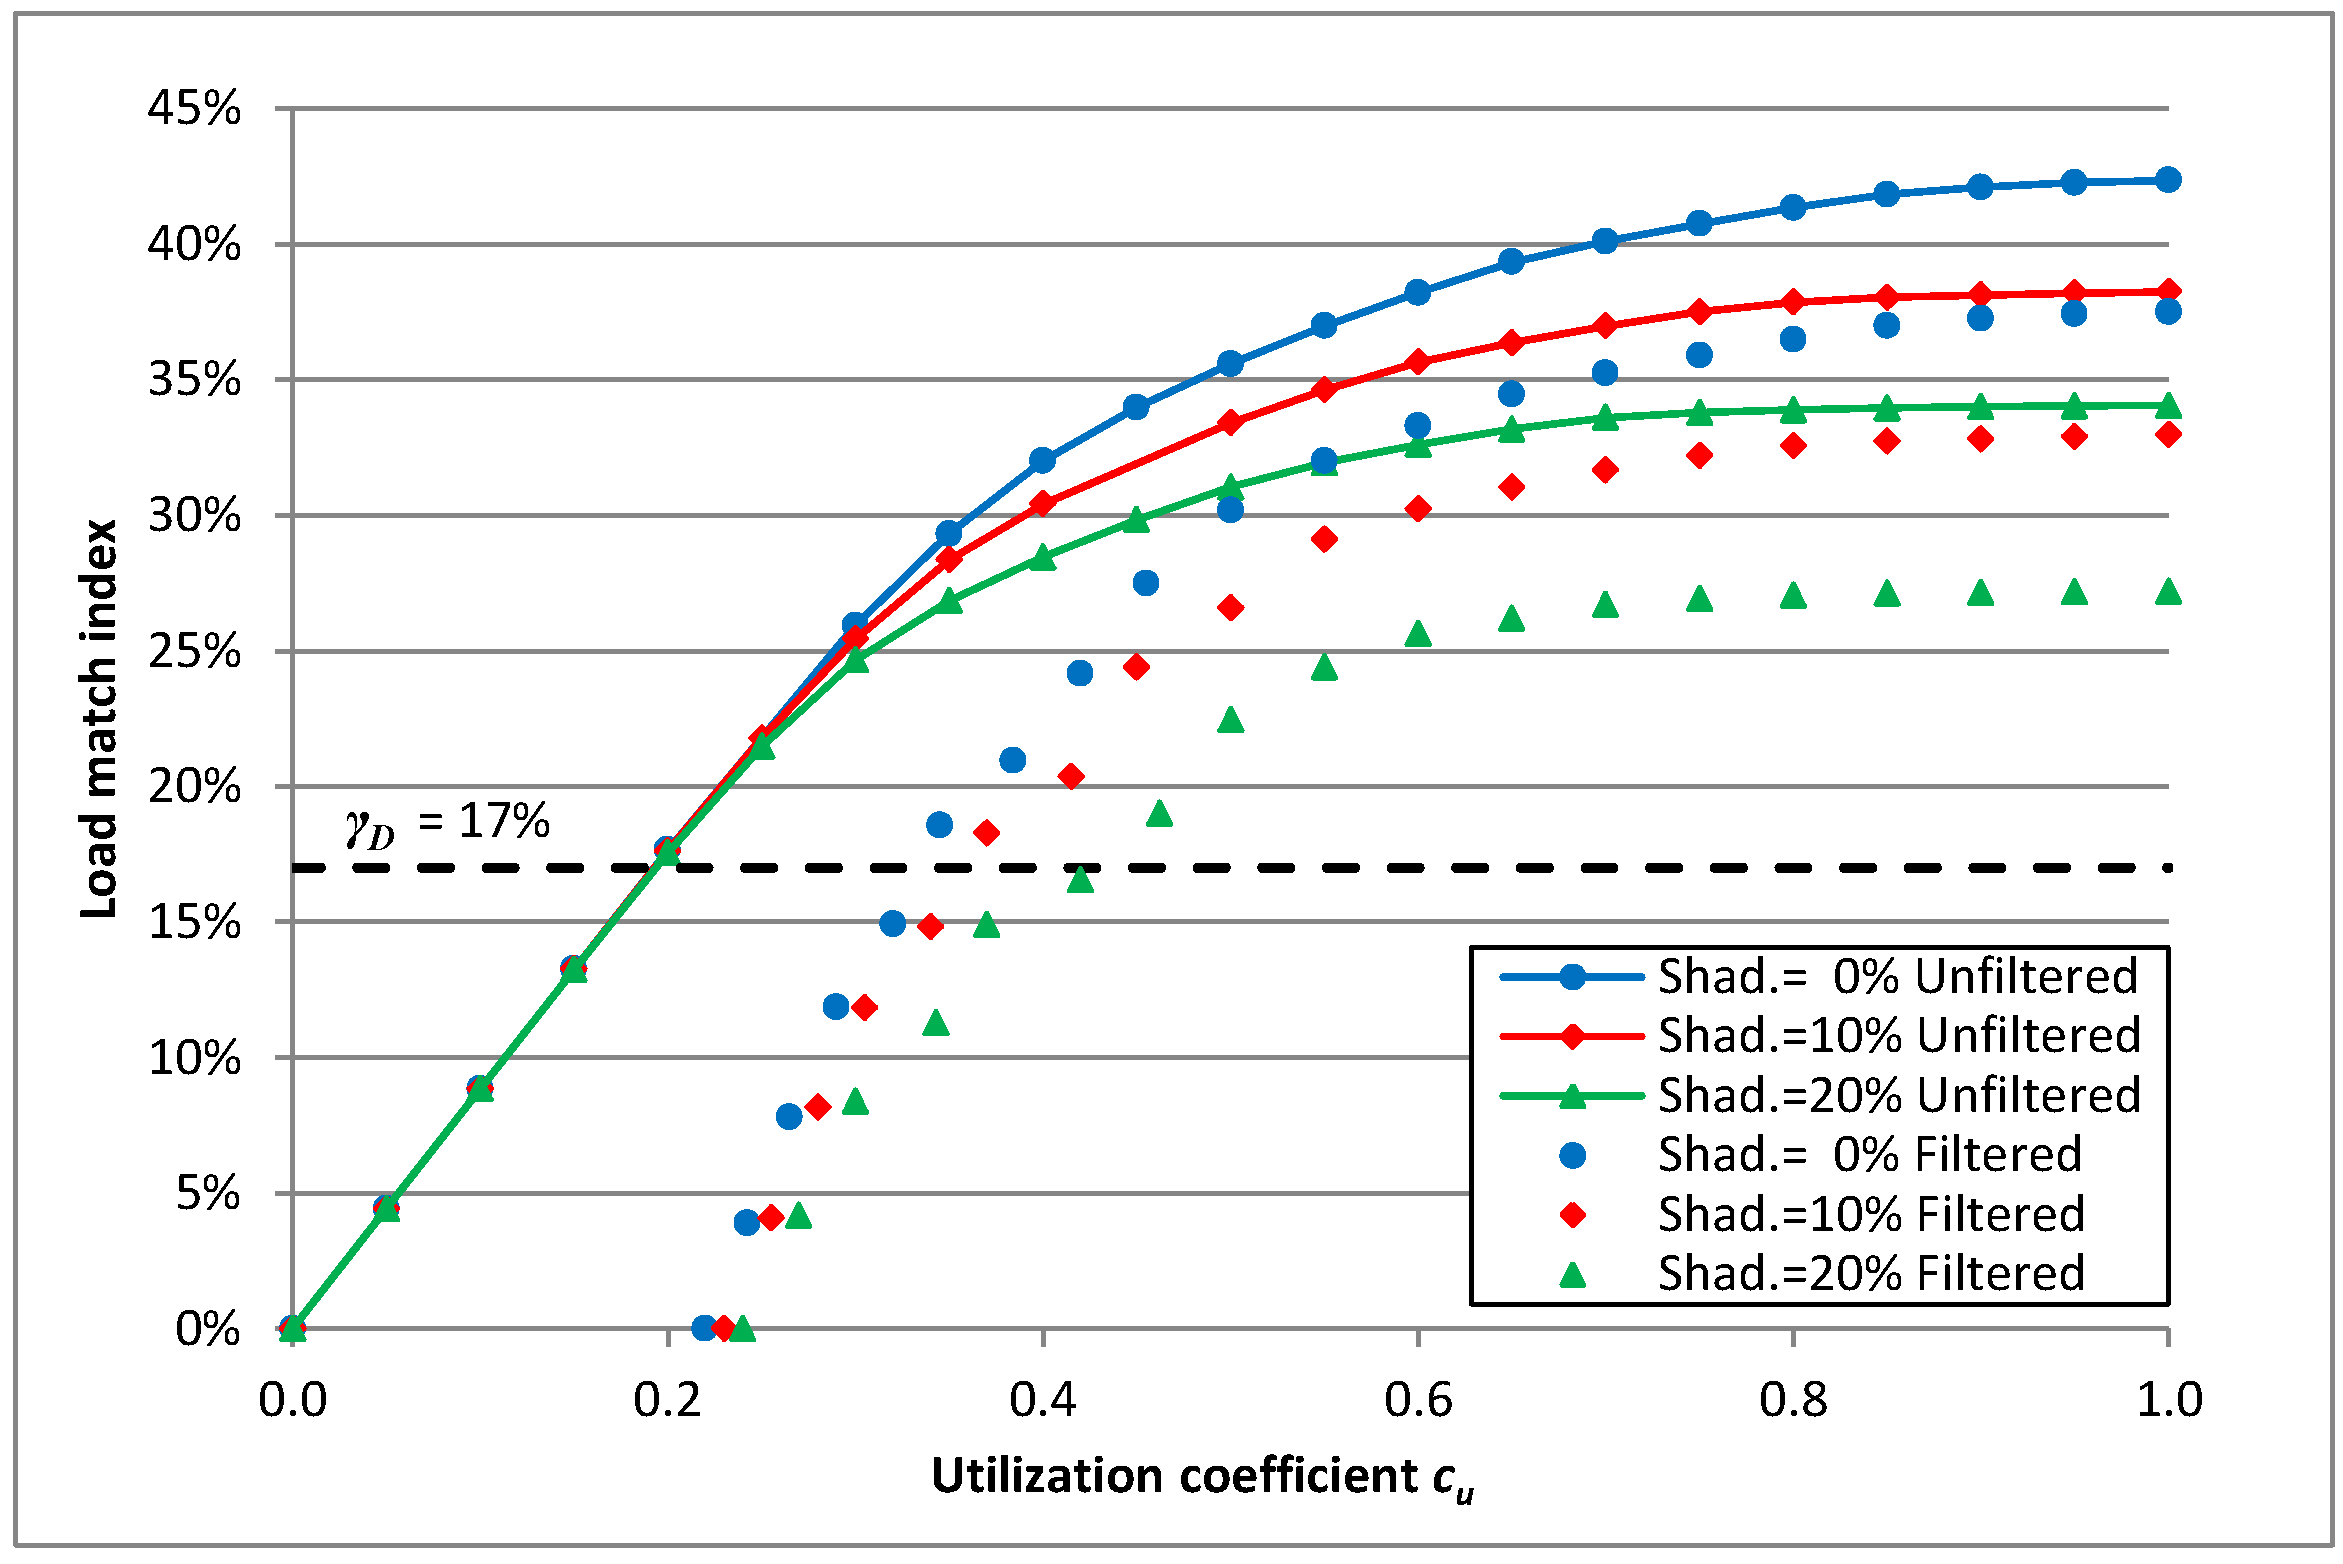
Figure 18 the curves of the load match indexes versus the utilization coefficient, for some values of the shading coefficient, are depicted.
Both the unfiltered and filtered load match indexes are lower when the utilization coefficient is reduced. The reduction is obviously more evident for the filtered load match indexes because of the omission of the PV systems that have a negative value of the NPV. Comparing the data that refer to the same city, it is possible to appreciate that the curves of the filtered match index calculated in June 2013 are lower than the ones evaluated in July 2013; such behaviour becomes more evident by increasing the shading coefficient. The district of Milan results particularly affected by the shading coefficient; actually, the values of the load match index calculated with a shading coefficient of 10% are comparable with the data obtained for Palermo and Rome for a value of the shading coefficient of 20%.
In the previous graphs also the lines for γ
D of 17%, which is the target value established by the Directive 2009/28/EC for Italy [
106], are depicted. From the comparison with the calculated results, it is evident that the tax credits scheme, in force after June 2013, results more effective in keeping the load match index at values greater than the target value of 17%. Such a conclusion is confirmed by the data shown in
Figure 19,
Figure 20 and
Figure 21, which refer to December 2014.
If no economic filtering of the data is considered, the values of
cu in correspondence to which the load match index is equal to 17% seem almost unaffected by the percentage of shaded solar energy; moreover, such values are much smaller than the values obtained considering the economic profitability of the PV systems. As a consequence, one may erroneously infer that the presence of shading buildings is not an issue and that, even if about 80% of the generated electricity does not match household consumption, the target value established by the Directive 2009/28/EC can be reached for each city. The filtered data gives more realistic results that highlight the importance of the latitude, the shading coefficient and the presence of the load mismatch.
Table 12 lists the values of the utilization coefficient for which the filtered load match index is equal to 17%.
For a fixed percentage of shaded solar energy, the coverage target set for Italy by the Directive 2009/28/EC can be met only if values of the utilization coefficient grater of the threshold data in
Table 10 are achieved. When the listed data are small, the householders are allowed a larger flexibility in using their domestic appliances because a greater amount of mismatch between PV generation and household consumption is tolerated without affecting the energy performance of the districts. It can be observed that the tax credits scheme is always more effective than the FIT scheme and its validity tends to increase further in time. Actually, the target value, which cannot be reached in Milan in 2013 with a shading coefficient of 15%, is obtained in December 2014 if at least 71.0% of generated electricity is consumed by the household. Using the data of
Table 12, similar observations can be made for the cities of Palermo and Rome.
On the basis of the presented results, it is possible to claim that, if the future values of the tax credits will be wisely fixed considering the current costs of PV devices, the recent Italian promoting policy will be able to adequately support the diffusion of domestic PV systems in densely urbanised areas. The effectiveness of the promoting policy would increase further if the values of the tax credits were arranged to compensate the effects of the latitude on the solar energy available in the various geographical areas of Italy.
5. Conclusions
A study on the electrical coverage of grid-connected rooftop PV systems was developed with the aim to evaluate the effectiveness of the energy strategies adopted over the 2013–2014 period: (1) the FIT mechanism that has guaranteed set prices for both generated electricity provided to the grid and self-consumed electricity; (2) the present tax credit scheme that, in contrast to the FIT program, does not include a remuneration, but directly allows the PV system owners to reduce their tax liability.
The approach combines the annual data of PV generation and electricity consumptions with a detailed architectural analysis of three Italian districts. The roof morphology, orientation, tilt and available surface for each householder, shading effects and load mismatch were considered. The results of the energy analysis were filtered by an economic analysis that included all costs (investment, insurance, replacement, maintenance and management costs) and benefits (FIT and premium on the self-consumed electricity, percentage of tax credit, reduced electricity bills, profits for sold electricity) of each PV system over a period of 20 years. The results show a significant reduction in the energy cover factors when, as it can be realistically assumed, only the energy produced by the economically advantageous PV systems is considered. The comparison between the FIT policy at the end of the supporting program (June 2013) and the tax credits scheme in December 2014 highlighted an increase in the electrical coverage from 37.5%, 34.5% and 28.6% to 42.3%, 37.2% and 32.7% for the districts in Palermo, Rome and Milan, respectively.
The results denote the major effectiveness of the energy policy based on the tax credits especially when solar energy shading and mismatch between PV generation and household consumption are considered. By means of a sensitivity analysis, the role of the shading and utilization coefficients, which respectively indicate the lack of solar energy, due to the surrounding buildings, and the mismatch between electricity generation and consumption, was considered. Aiming to assess the fulfilment of the target set for Italy by the Directive 2009/28/EC, the values of the utilization and shading coefficients, which allow 17% of the electrical coverage demand by renewable sources, were calculated. The presented study underlines how the results are significantly influenced by the latitude of the analysed districts. For this reason it would be desirable that the Italian government promoted supporting measures that were sensitive to the geographic position in order to compensate the penalizing effects of the latitude and reach the most homogeneous diffusion of the PV systems in each region of national territory.


