1. Introduction
Power transformers are expensive and very important pieces of equipment in power networks. Transformers are constructed using a special type of thin magnetic steel sheets in the core, copper or aluminum as conductor material in the windings, and materials like mineral oil and high density paper, etc. to provide electrical insulation between high and low voltage or grounded parts. In general, the active parts (core and windings) of a transformer are placed in the main tank that is usually filled with insulating oil which also provides cooling.
The reliability of transformer affects the reliability of the power network. Therefore, maintaining the transformer in good condition is important for improving system reliability. The transformer may fail due to reasons such as insulation degradation or mechanical displacement and deformation, etc. The faults that may occur in the transformer include loss of clamping pressure, inter-disk fault, high voltage (HV) winding faults, bushing faults, axial and/or radial displacement faults, leakage current faults, and short circuit faults, etc. The aging stresses of the transformer can cause winding deformation. Hence, tests to detect the winding displacement and deformation are important for safe operation of transformers. One type of deformation that occurs to a transformer is the mechanical deformation of its windings. Thus, the mechanical integrity of a transformer is an important aspect that determines the transformer’s condition. A transformer with minor winding damage can remain in operation, but this may cause a failure in the future. Also, a winding deformation which is initially non-intrusive, may lead to a short circuit after a certain period of operation [
1]. Usually the failures are caused by tough conditions, such as load shedding, short circuits, or presence of excessive moisture in the insulation. The short circuit current can cause winding deformations in the axial or radial directions, tilting, and hoop buckling [
2]. Thus, it is important to assess the condition of transformer by using some suitable diagnostic methods.
Frequency response analysis (FRA) is a technique which is commonly used for transformer condition assessment. This paper aims to provide a comprehensive review on the FRA method for condition assessment of power transformers and its applications as well as associated advances and challenges.
2. Mechanical Stresses and Damage to Transformer
There are two factors that can cause mechanical damage to a transformer. One is the high electromagnetic force (EMF) that is caused by large currents which flow in the transformer windings. Such currents can be induced by internal faults in the transformers or by external faults in the network where the transformer is located. Such situations result in huge EMFs in short periods of time which are sufficient to mechanically deform or damage the windings [
1,
3].
When a conductor carries current within a magnetic field, it experiences a mechanical force which is given by Equation (1):
Here,
B is the flux density vector (T),
I is the current vector (A) and
L is the conductor length (m). Thus, the windings are subjected to an EMF that is proportional to the winding current and the flux density
B. However,
B itself is proportional to the current (
). Thus, the EMF is proportional to the square of winding current [
1,
4]. This shows that during short circuits, the magnitudes of EMFs on the winding are significantly higher than those at the normal current and such forces may cause damage to the windings [
1].
There are several typical types of mechanical failures that may appear in transformer windings due to high short-circuit faults currents:
- −
axial winding displacement due to axial forces;
- −
buckling of windings due to radial forces; and
- −
bending or tilting of windings due to axial forces.
Since low voltage (LV) windings of the transformer are placed adjacent to the core and are covered; only the HV windings are mostly affected and thus are the main objects to be investigated. Of the above-mentioned possible failures, of main concern is axial displacement. Buckling and bending of the HV windings is less likely due to their small size and existence of full insulation in gaps between the HV and the LV windings [
5].
Damage may also happen to a transformer during transportation and/or installation [
6]. In such situations, any kind of damage to the transformer can cause long delays in replacement or repair. This necessitated the use of the impact recorder during the transportation of the transformer [
6]. Studies have recorded several transformer damage cases caused due to improper handling during transportation. Possible damage includes displacement of core limb, bent clamping rod and ruptured clamping frame, etc. [
7]. Thus, in addition to any manufacturing defect, the transformers can sustain some damage during the transportation, handling, installation, and in service operation. Hence, testing the transformers at each stage is important to avoid occurrence of failures. For this reason, the transformer needs to be monitored periodically and its condition should be assessed using suitable techniques.
3. Frequency Response Analysis Basics
Several techniques such as thermal monitoring, partial discharge measurements, dissolved gas analysis (DGA), and tan δ and capacitance measurements, etc. are available for condition assessment of the transformer. However, each one of these methods is applied for the identification of a specific type of problem and none of these methods is suitable for detecting winding displacement or deformation. Moreover, winding deformations in transformers are difficult to detect by conventional diagnostic tests such as measurements of turns ratio, winding impedance/inductance, or the magnetizing current etc. The main methods of detection of winding deformation or displacement are short circuit reactance measurement method, low voltage impulse (LVI) method and frequency response analysis (FRA) method [
8].
Due to resistance (
R) of the winding, inductance (
L) of winding coils, and capacitance (
C) of the insulation layers between coils, windings, winding and core, core and tank, and tank and winding, etc. a transformer is a complex network of RLC components [
9]. Any physical damage to the transformer will change this RLC network. The FRA method is used to identify these small changes in the RLC network parameters within the transformer by examining the frequency response of the transformer. Frequency response generally provides the network transfer function at various frequencies [
10].
In general, the changes introduced by winding displacement or deformation can be detected externally by the frequency response method applied at the terminals of transformer windings.
In FRA method, low voltage signal of varying frequencies is applied to the transformer winding and both the input and the output signal are recorded to derive the FRA signatures. The ratio of these two signals is called the transfer function, from which both the magnitude and phase angle variations with frequency can be obtained. The transfer function at each frequency is a measure of the effective impedance of the RLC network of the transformer [
9]. Thus, the FRA method can be used to measure the transfer function, analyze the frequency response characteristics and diagnose the winding state over a wide frequency band [
11].
3.1. Frequency Response Analysis Methods
The principle of the FRA method consists of measuring the transformer response over a wide frequency bandwidth. Currently, the test is usually performed on an unloaded and de-energized transformer. Different types of input signals and various stages can be considered. According to the input signal nature, two main measurement methods exist: impulse frequency-response analysis (IFRA) and sweep frequency-response analysis (SFRA) methods. The IFRA method uses a single non-periodic signal as excitation or input which is injected into any of the available transformer terminals. The maximum value of input impulse may reach hundreds of volts and the wide frequency content is suitably ensured by the waveform of the input pulse. This excitation causes induced voltages in the remaining ends of the same transformer. These induced signals depend on the transformer structure and are measured as an interesting output to evaluate. The frequency spectrum of the injected signal (input) and the measured signal (output) are obtained through mathematical procedures, such as fast fourier transform (FFT). Finally, the ratio between the two frequency spectra is obtained. In the SFRA measuring method, the excitation signal or input is a sinusoidal signal with a LV amplitude (usually in the 1–20 V range), which is applied to a transformer terminal in a frequency sweep (in the hertz to milli-hertz range). Again, the transfer function (TF) is obtained from the output/input ratio for various frequencies [
12,
13]. The IFRA technique is very quick (requiring only a few minutes) whereas the SFRA technique is rather slow (about 2 h).
3.2. Frequency Response Analysis Test Configurations
Four different test configurations are normally used for making FRA measurements. These are: (i) end to end open circuit test; (ii) end to end short circuit test; (iii) capacitive inter-winding test; and (iv) inductive inter-winding test [
6,
14]. The end to end open circuit test is performed on one winding (HV or LV). The input signal is connected to one terminal of the winding while the output signal is measured from the other end of the winding. This concept applies for Y-connected as well as Δ-connected windings and also for single phase units. The secondary winding of the same phase is left open during these measurements. The end to end short circuit test is conducted on one winding in a similar fashion. However, the two terminals of the secondary winding are connected together for the short circuit test. In the capacitive inter-winding test, the input signal is applied at one terminal of the primary winding and the output signal is measured at one terminal of the secondary winding while all other terminals are left floating. The fourth test configuration i.e., the inductive inter-winding test is similar to the capacitive test discussed above, except that the open terminals of the primary and secondary measured windings are connected to ground. Other terminals of unmeasured windings are left floating to avoid unwanted influences on the response. In this test, the input signal should be supplied at the HV terminal and measured at the LV terminal [
10]. In addition to winding, the FRA may also be applied to transformer bushing to check its condition [
15].
Conventional methods have very low sensitivity for detecting winding deformations. However, FRA technique can be a successful diagnostic method for detecting movement of the windings, core and/or deformation of transformer windings. Techniques such as LVI with TF method and sweep frequency method (SFM) can be applied for such purposes to obtain frequency responses. FRA is basically a comparative method, and FR measured in the range from 20 Hz to 2 MHz, is compared either to previous results on the same, similar units, or another phase of the same transformer which are used as reference fingerprints [
16].
Generally, at the beginning of a new type of technology, computer modeling is useful. Modeling allows the creation of many variations of simulated phenomena or test setup to save time and cost. Once models point to a useful outcome, then the technique is tried for in field applications. Thus, computer modeling has found applications in FRA of transformers [
16]. The first study on frequency response analysis was reported in 1978 [
17]. However, the application of FRA method on power transformers became industrial practice approximately a decade ago. Now this technique has been standardized [
13]. However, there are still many challenges regarding the interpretation of the test results obtained by this method.
There is no standard available to qualitatively identify the type of fault in the windings and quantify the degree of severity of the winding displacement. Thus, there are no clear guidelines for interpreting FRA data to unambiguously detect the faults in the transformers. A few researchers have used mathematical models to determine the resonant frequencies to relate frequency response data to the transformer mechanical structure and to quantify significant winding changes. Many researchers have focused on diagnostics and interpretation of FRA data for various deformations and research work is in progress in order to understand and analyze the data to detect such deformations. Research is continuing on this method.
4. Transformer Models
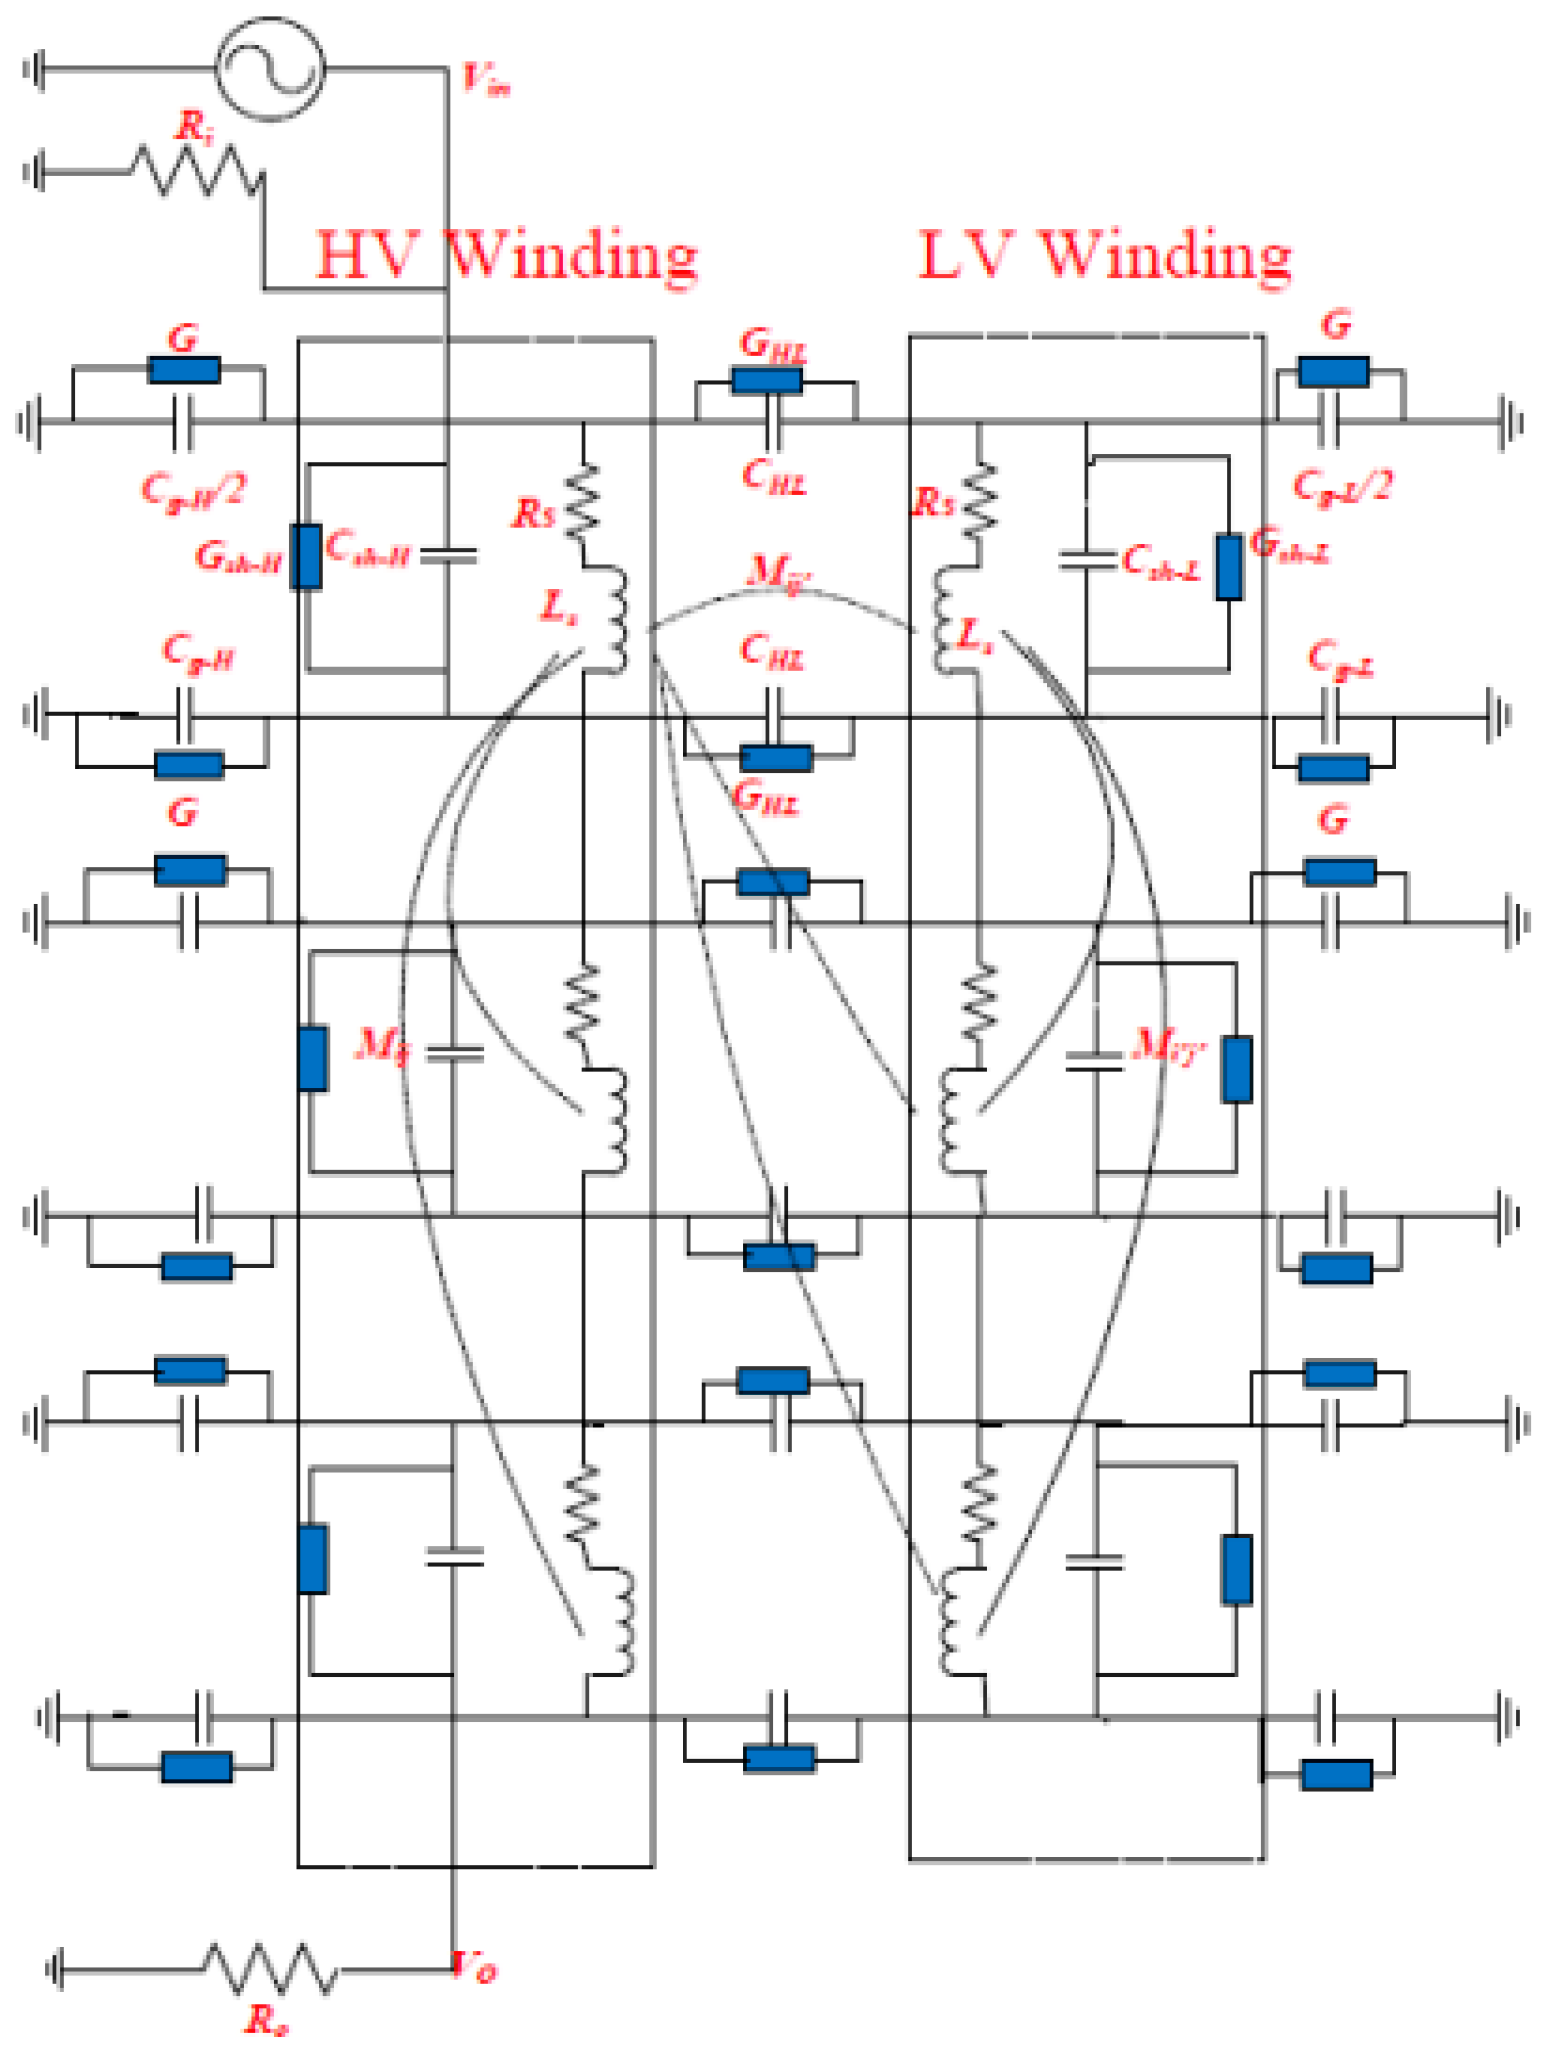
Different models have been used to simulate a transformer. In [
15], it was assumed that the HV and LV windings consisted of ten disks. Each disk comprises series resistance (
Rs) and inductance (
Ls) shunted by a capacitor (
Csh) and a conductance (
Gsh). In addition, the capacitance between HV and LV windings (
CHL) is shunted by dielectric conductance (
GHL). Also mutual inductances (
Mij) between relevant coils can be included. The insulation between the HV/LV winding and ground is represented by capacitance (
Cg) and dielectric conductance (
G) as shown in
Figure 1. Moreover, transformer bushing was simulated using model shown in
Figure 2 [
15].
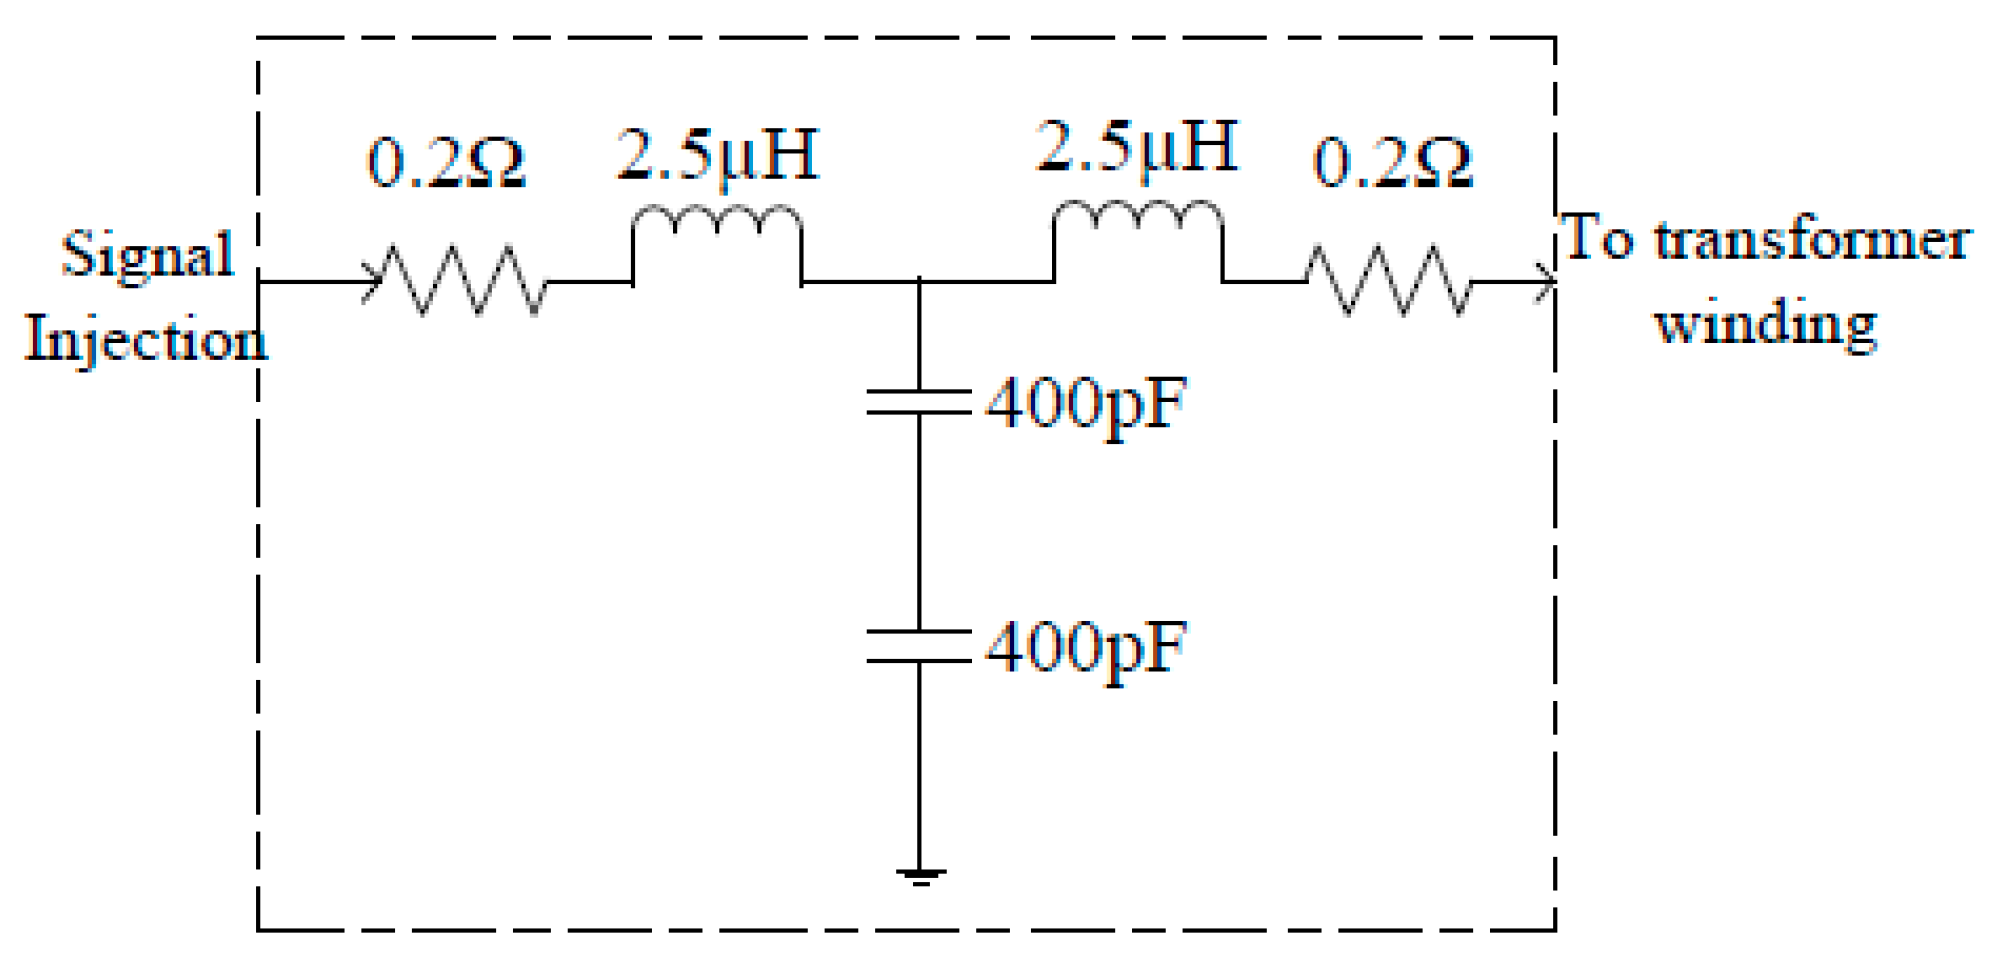
In [
7], the bushing model of the basic structural unit used was in the form of the series of capacitors and resistors. Moreover, parallel resistance is used to represent the surface resistance of the bushing. In one study, the bushing model consisted of five layers with three structural units in each layer. The equivalent model of the bushing simulation is shown in
Figure 3 [
11].
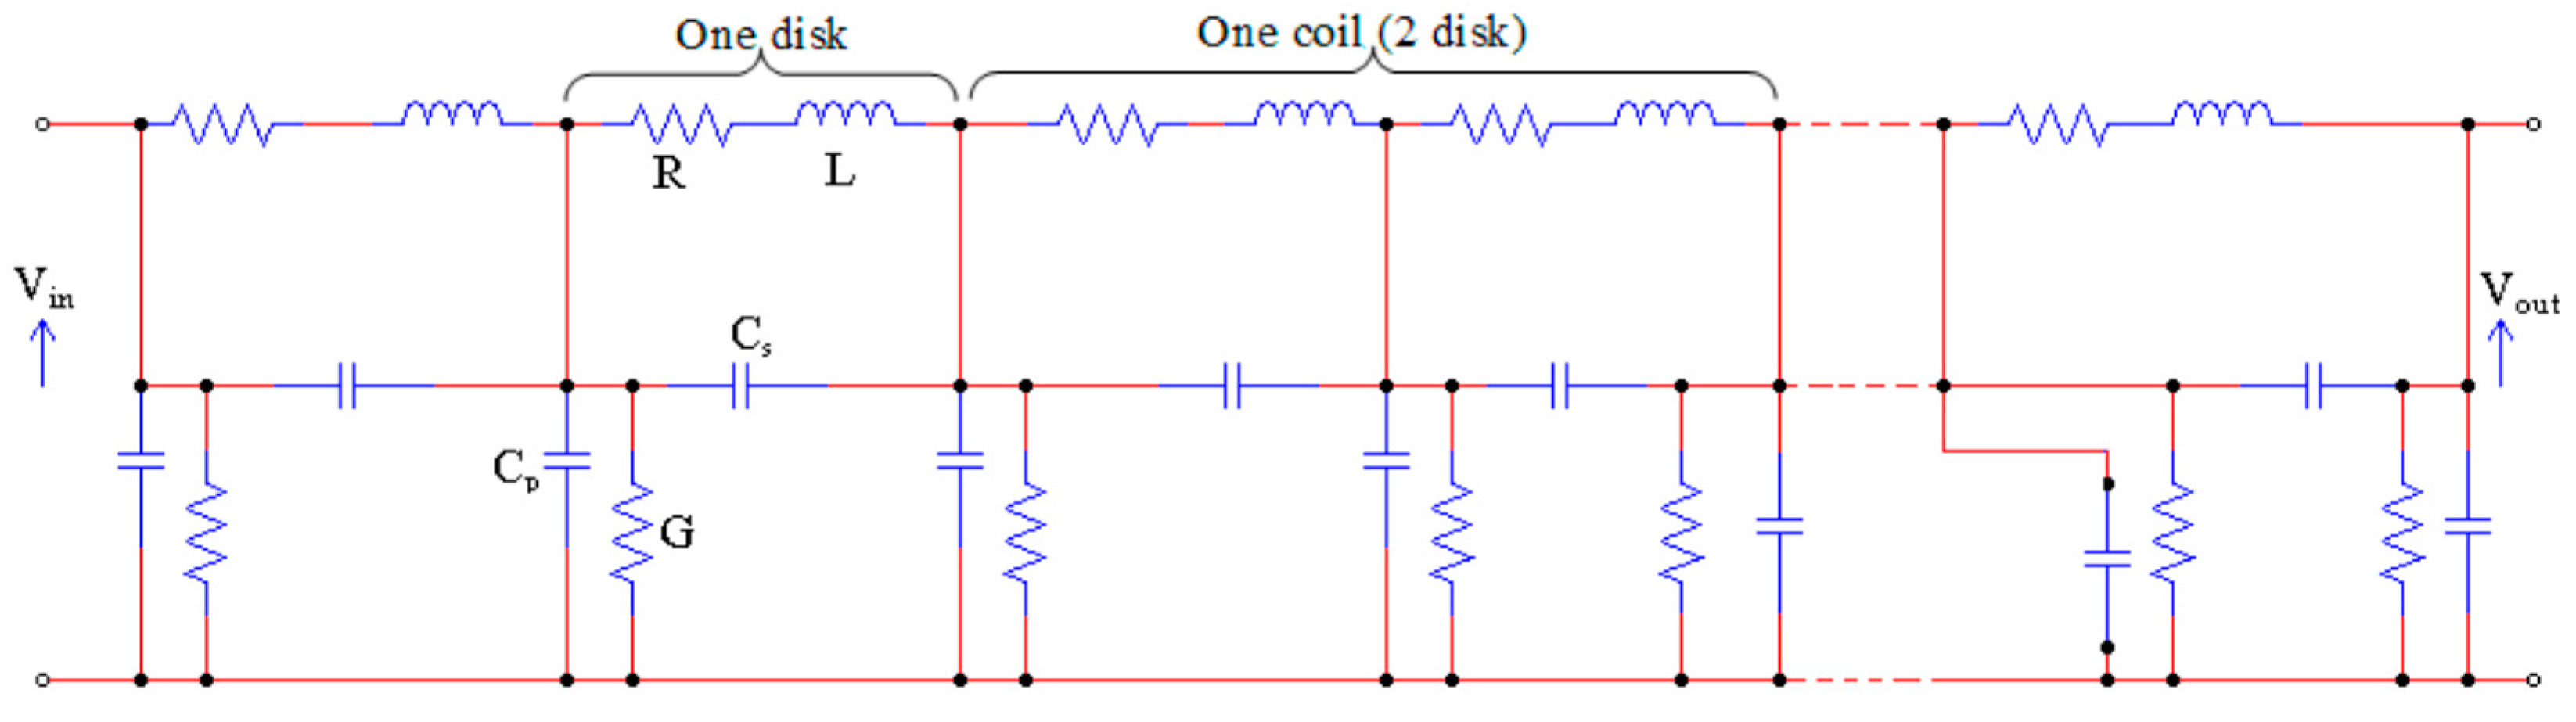
The authors of [
16] reported a sensitivity study for determining the effect of various model parameters on FRA signatures. For this purpose, a single transformer winding was divided into cascaded networks comprising of self/mutual inductances, resistance, series/shunt capacitances, and shunt dielectric conductance. For simplicity, it is assumed that the mutual inductances are lumped into the series inductances. The overall transfer function of such a network shows poles at the resonant frequencies of the winding model. Breakdown between turns or coils of winding under test correspond to short circuit of one of the local RLC network with a shift in the resonant pole to another frequency.
In FRA applications, the frequency ranges are divided into bands as shown in
Table 1 where the detection of sensitivity of associated fault types are also indicated [
11]. Typical transformer distributed model component values are
Rs (Ω): 0.5,
Ls (μH): 65,
Csh (nF): 0.026,
Cg (nF): 6,
CHL (nF): 5, 1/
G (MΩ): 7 [
18].
Table 2 lists the transformer model parameters and the mechanical faults which influence them. Various mechanical faults can be simulated by changing relevant parameters in the transformer model. This can help in establishing a standard code for FRA signature interpretation.
The effects of ±10% variation in various electrical parameters on FRA resonance frequency and magnitude (compared to healthy FRA signature) are summarized in
Table 3 [
18].
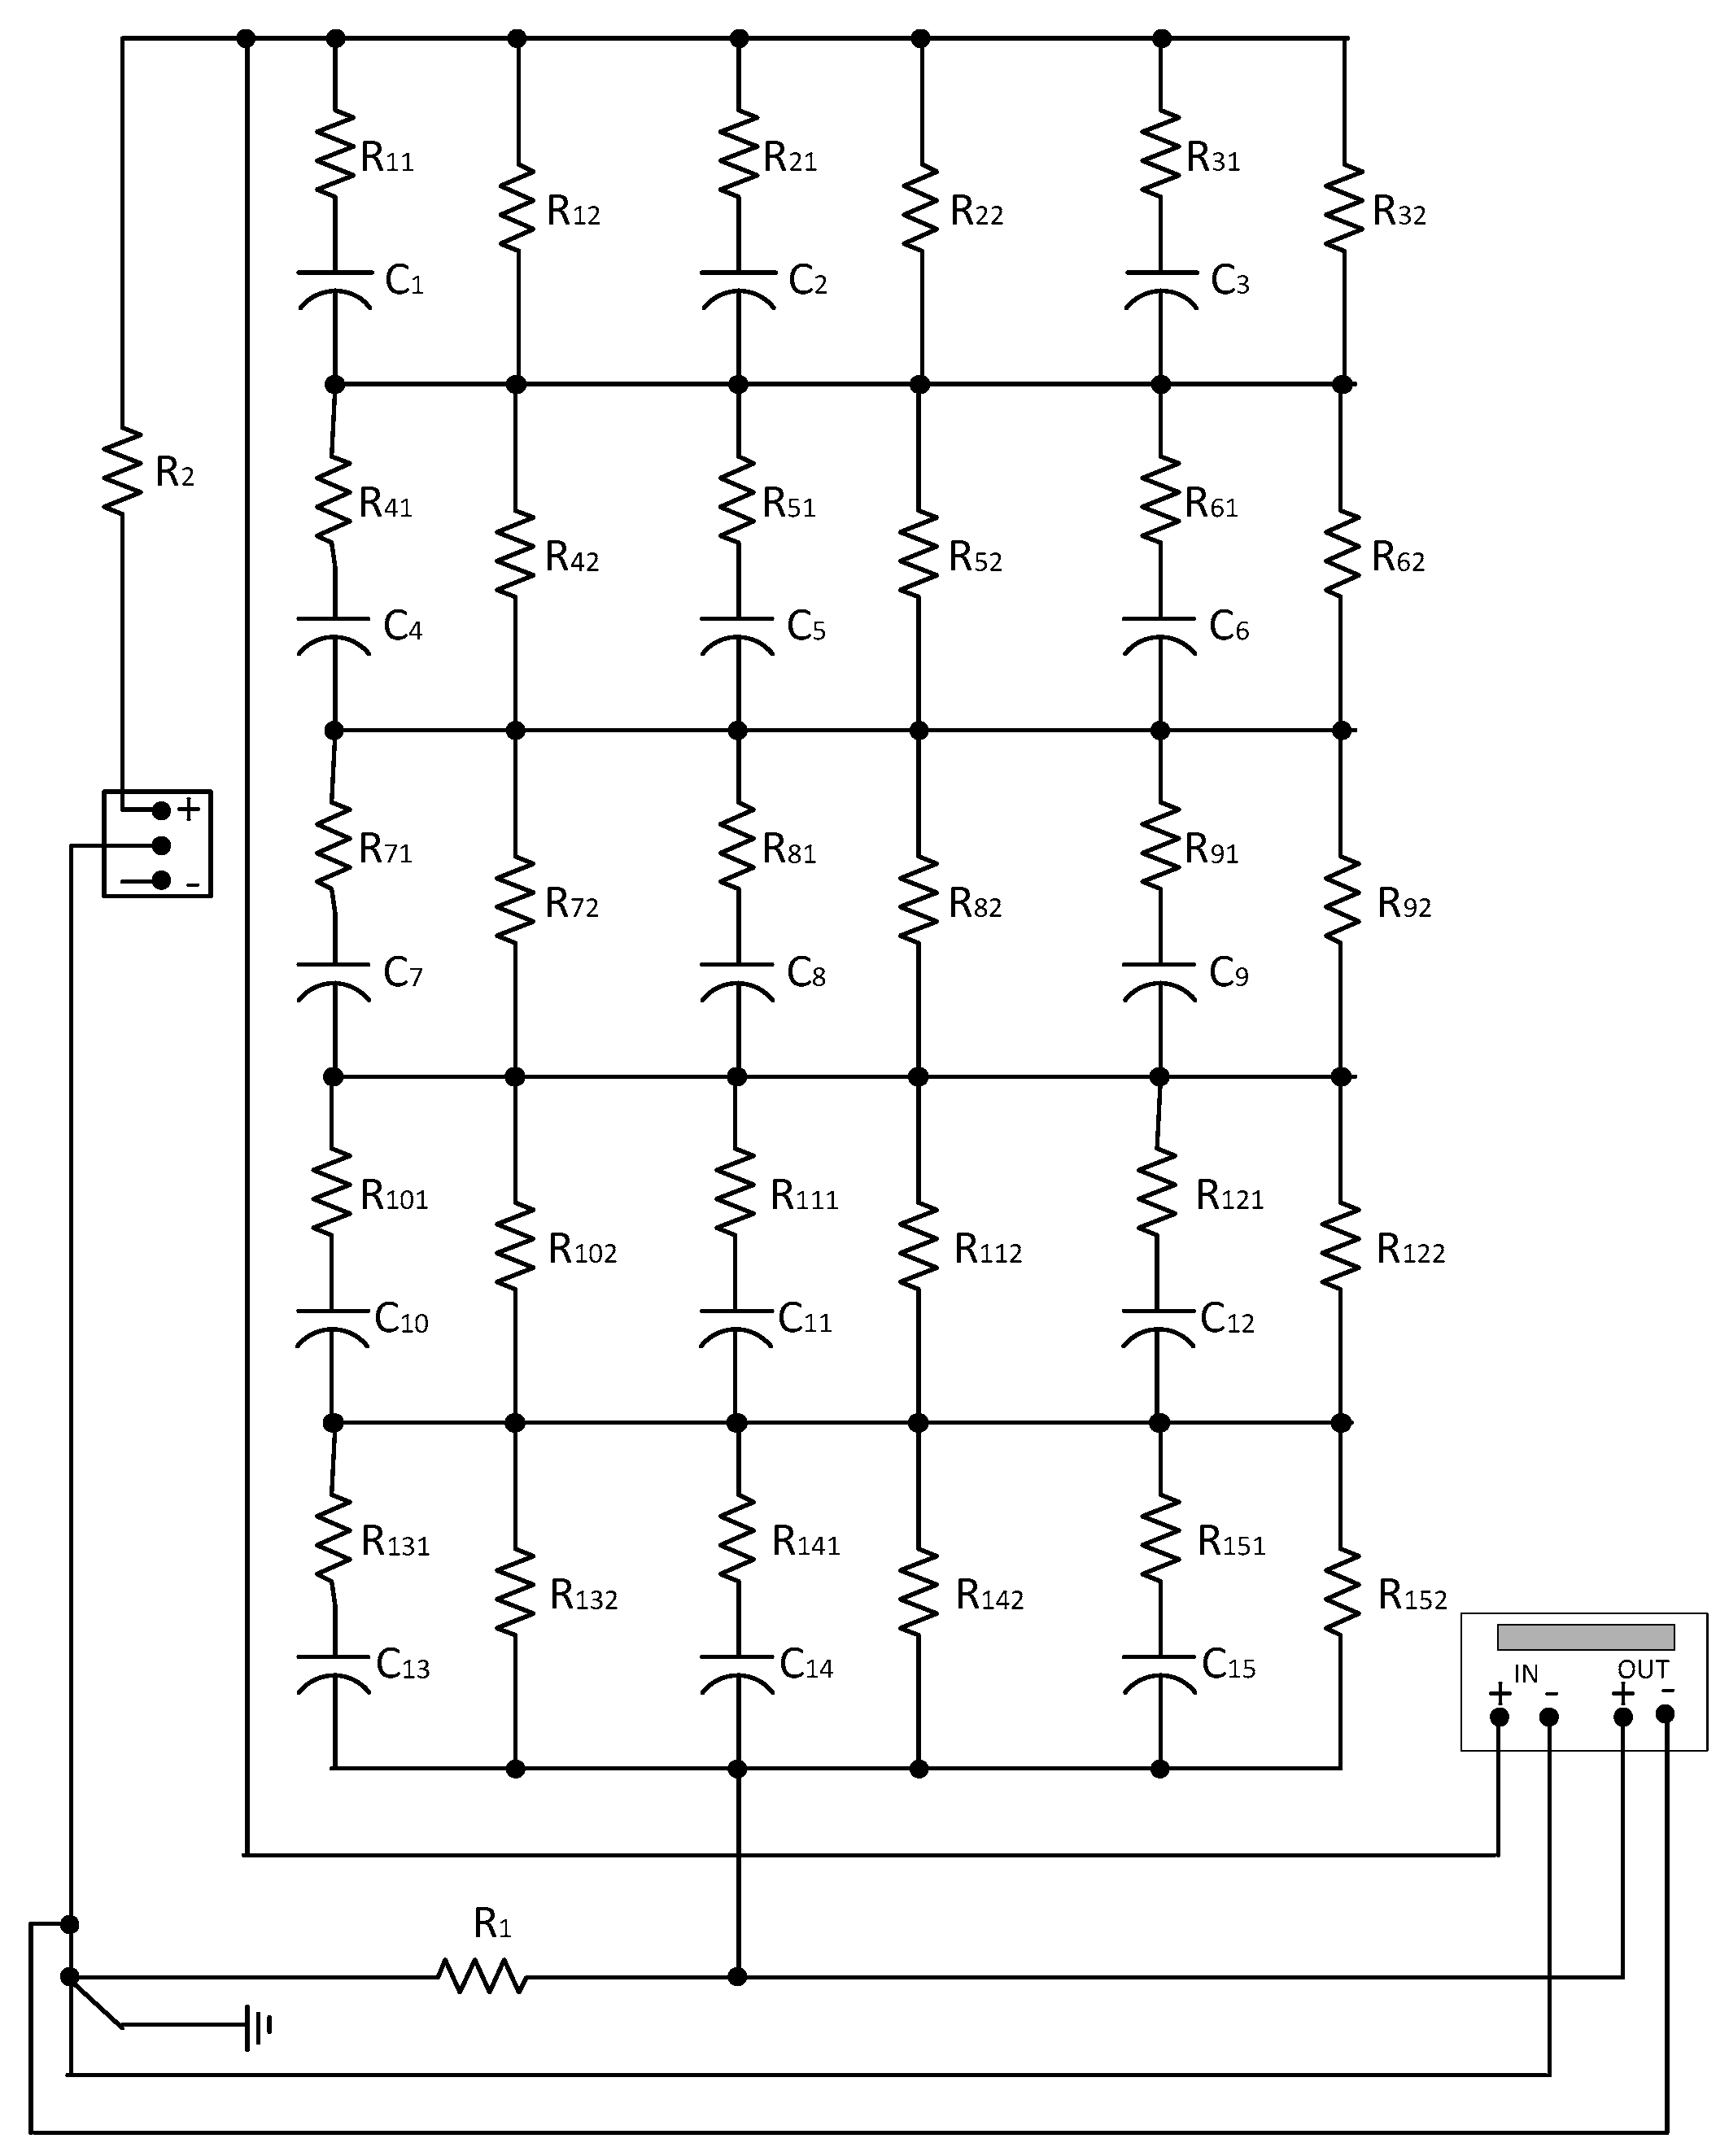
Table 4 shows the effect on FRA when changes were made in different parameters of the transformer model shown in
Figure 4 [
19].
5. Simulated Fault Studies
Various faults can be simulated to determine and understand the effect of such faults on the resulting FRA signature. The faults simulated by using the transformer model shown in
Figure 1 were loss of clamping pressure, inter-disk fault, HV bushing fault, axial displacement fault, leakage fault, and short circuit fault [
15]. This allows the identification of the problem inside the transformer and helps in establishing a standard code for FRA signature interpretation [
15]. The mechanical faults can be simulated within the model by changing particular parameters as discussed next:
5.1. Loss of Clamping Pressure
Loss of the clamping-pressure occurs due to aging of transformers caused by the mechanical hysteresis in the pressboard and paper insulation. This will increase the conductivity because of the reduction in dielectric thickness between the winding layers. This type of fault can be simulated by increasing the value of the shunt conductance (
Gsh) [
15].
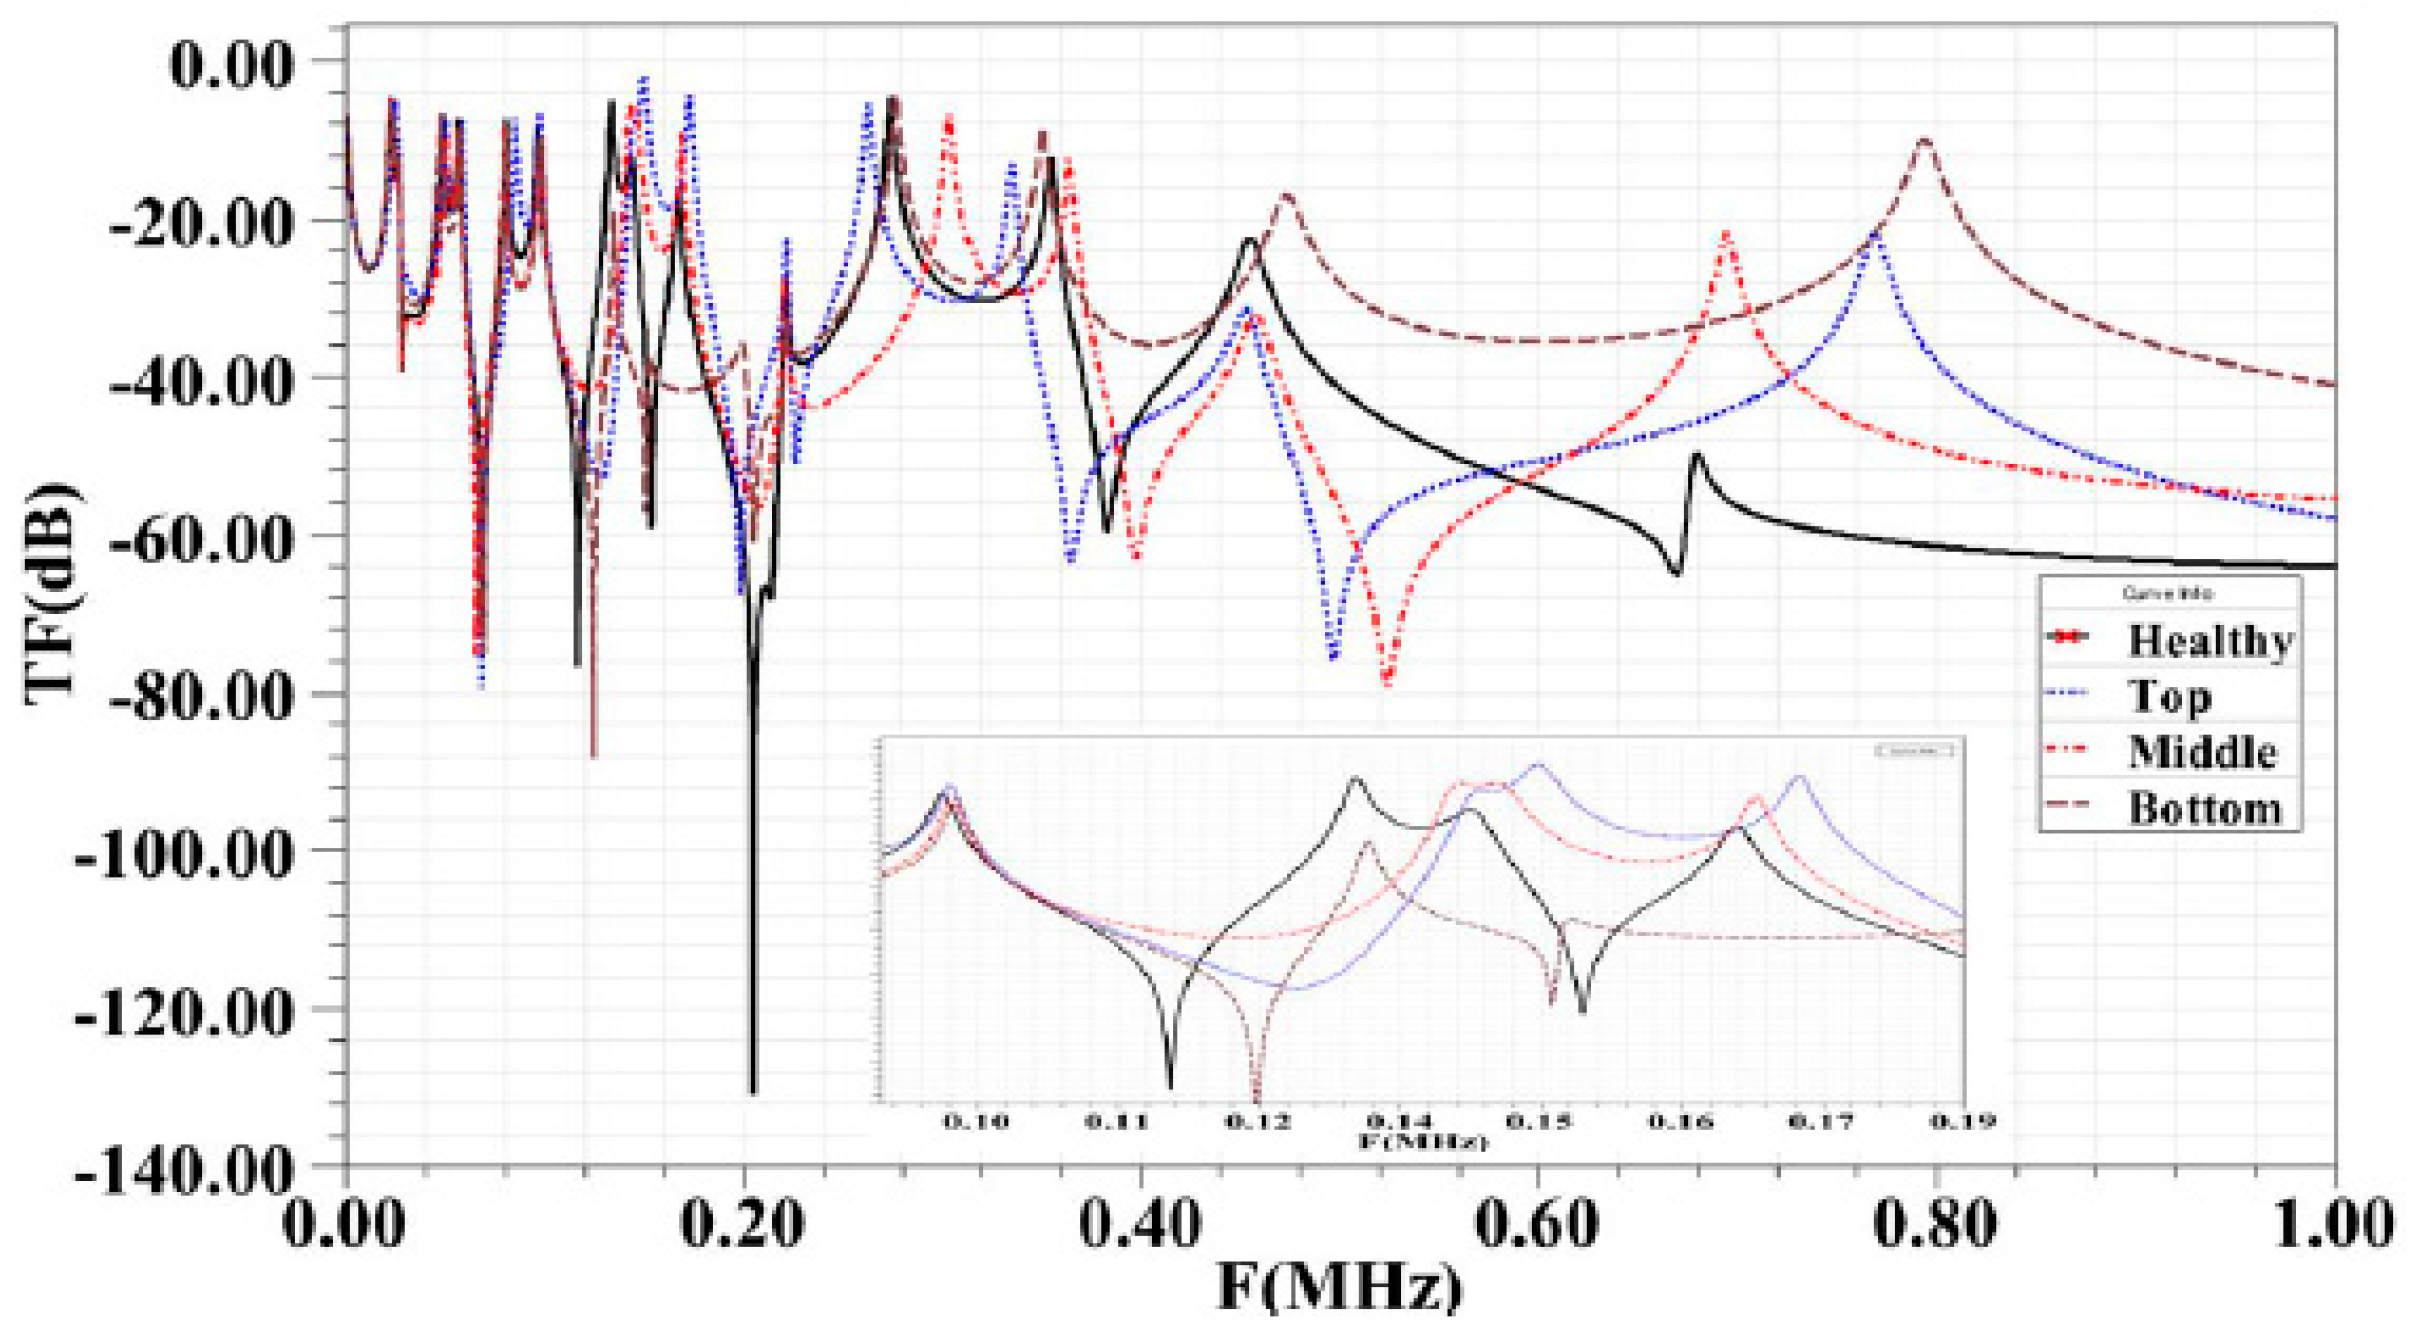
5.2. Inter-Disk Fault
High mechanical stress will cause variation in the axial disk spacing which can lead to a fault. It can be simulated by increasing the series capacitance (
Csh) and the mutual inductance (
Mij) between the two impacted disks. The change in parameters can be at different locations (top, middle, and bottom of the disk) [
15].
5.3. High Voltage Bushing Fault
Bushing can be simulated by adding a “T” circuit model to the transformer model as shown in
Figure 2. The impact of a 10% change in bushing capacitance on the FRA signature was studied. The results revealed that there is no impact of this type of fault on the FRA signature in the low and the medium frequency ranges. However, a slight change in the transfer function magnitude can be observed after 250 kHz and the magnitude increases in the high frequency range but there is no change in the position of the resonant peaks [
15].
5.4. Axial Displacement
This fault occurs due to the unbalanced magnetic forces generated in one winding as a result of a short-circuit fault which leads to the movement of the impacted winding axially. This fault can be simulated by changing the values of the series capacitance (
Csh) and mutual inductance (
Mij) [
15].
5.5. Leakage Fault
Leakage fault within a power transformer is caused by several reasons such ground shield damage, insulation damage, presence of high moisture content in the winding or oil, abrasion, hotspot formation and aging of insulation. This type of fault can be simulated by increasing the conductance to ground (
G) [
15].
5.6. Short Circuit Fault
The erosion of the winding and conductor insulation due to vibrations caused by the electromechanical forces can result in over current in the winding and severe damage, such as winding deformation, oil heating and flashover. This fault can be simulated by short circuiting the series resistance (
Rs) and inductance (
Ls) [
15].
Table 4 presents a summary of the different simulated faults discussed above and their impact on the FRA signature [
19].
6. Effects of Different Defects on Frequency Response Analysis
Below are few examples illustrating the influence of different defects on resulting FRA curves [
15].
Figure 5a,b shows the impact of loss of clamping pressure on the FRA signature for HV winding and for the LV winding, respectively.
Figure 6 shows the impact of inter-disk fault on FRA.
7. Effects of Test Configuration on Frequency Response Analysis Results
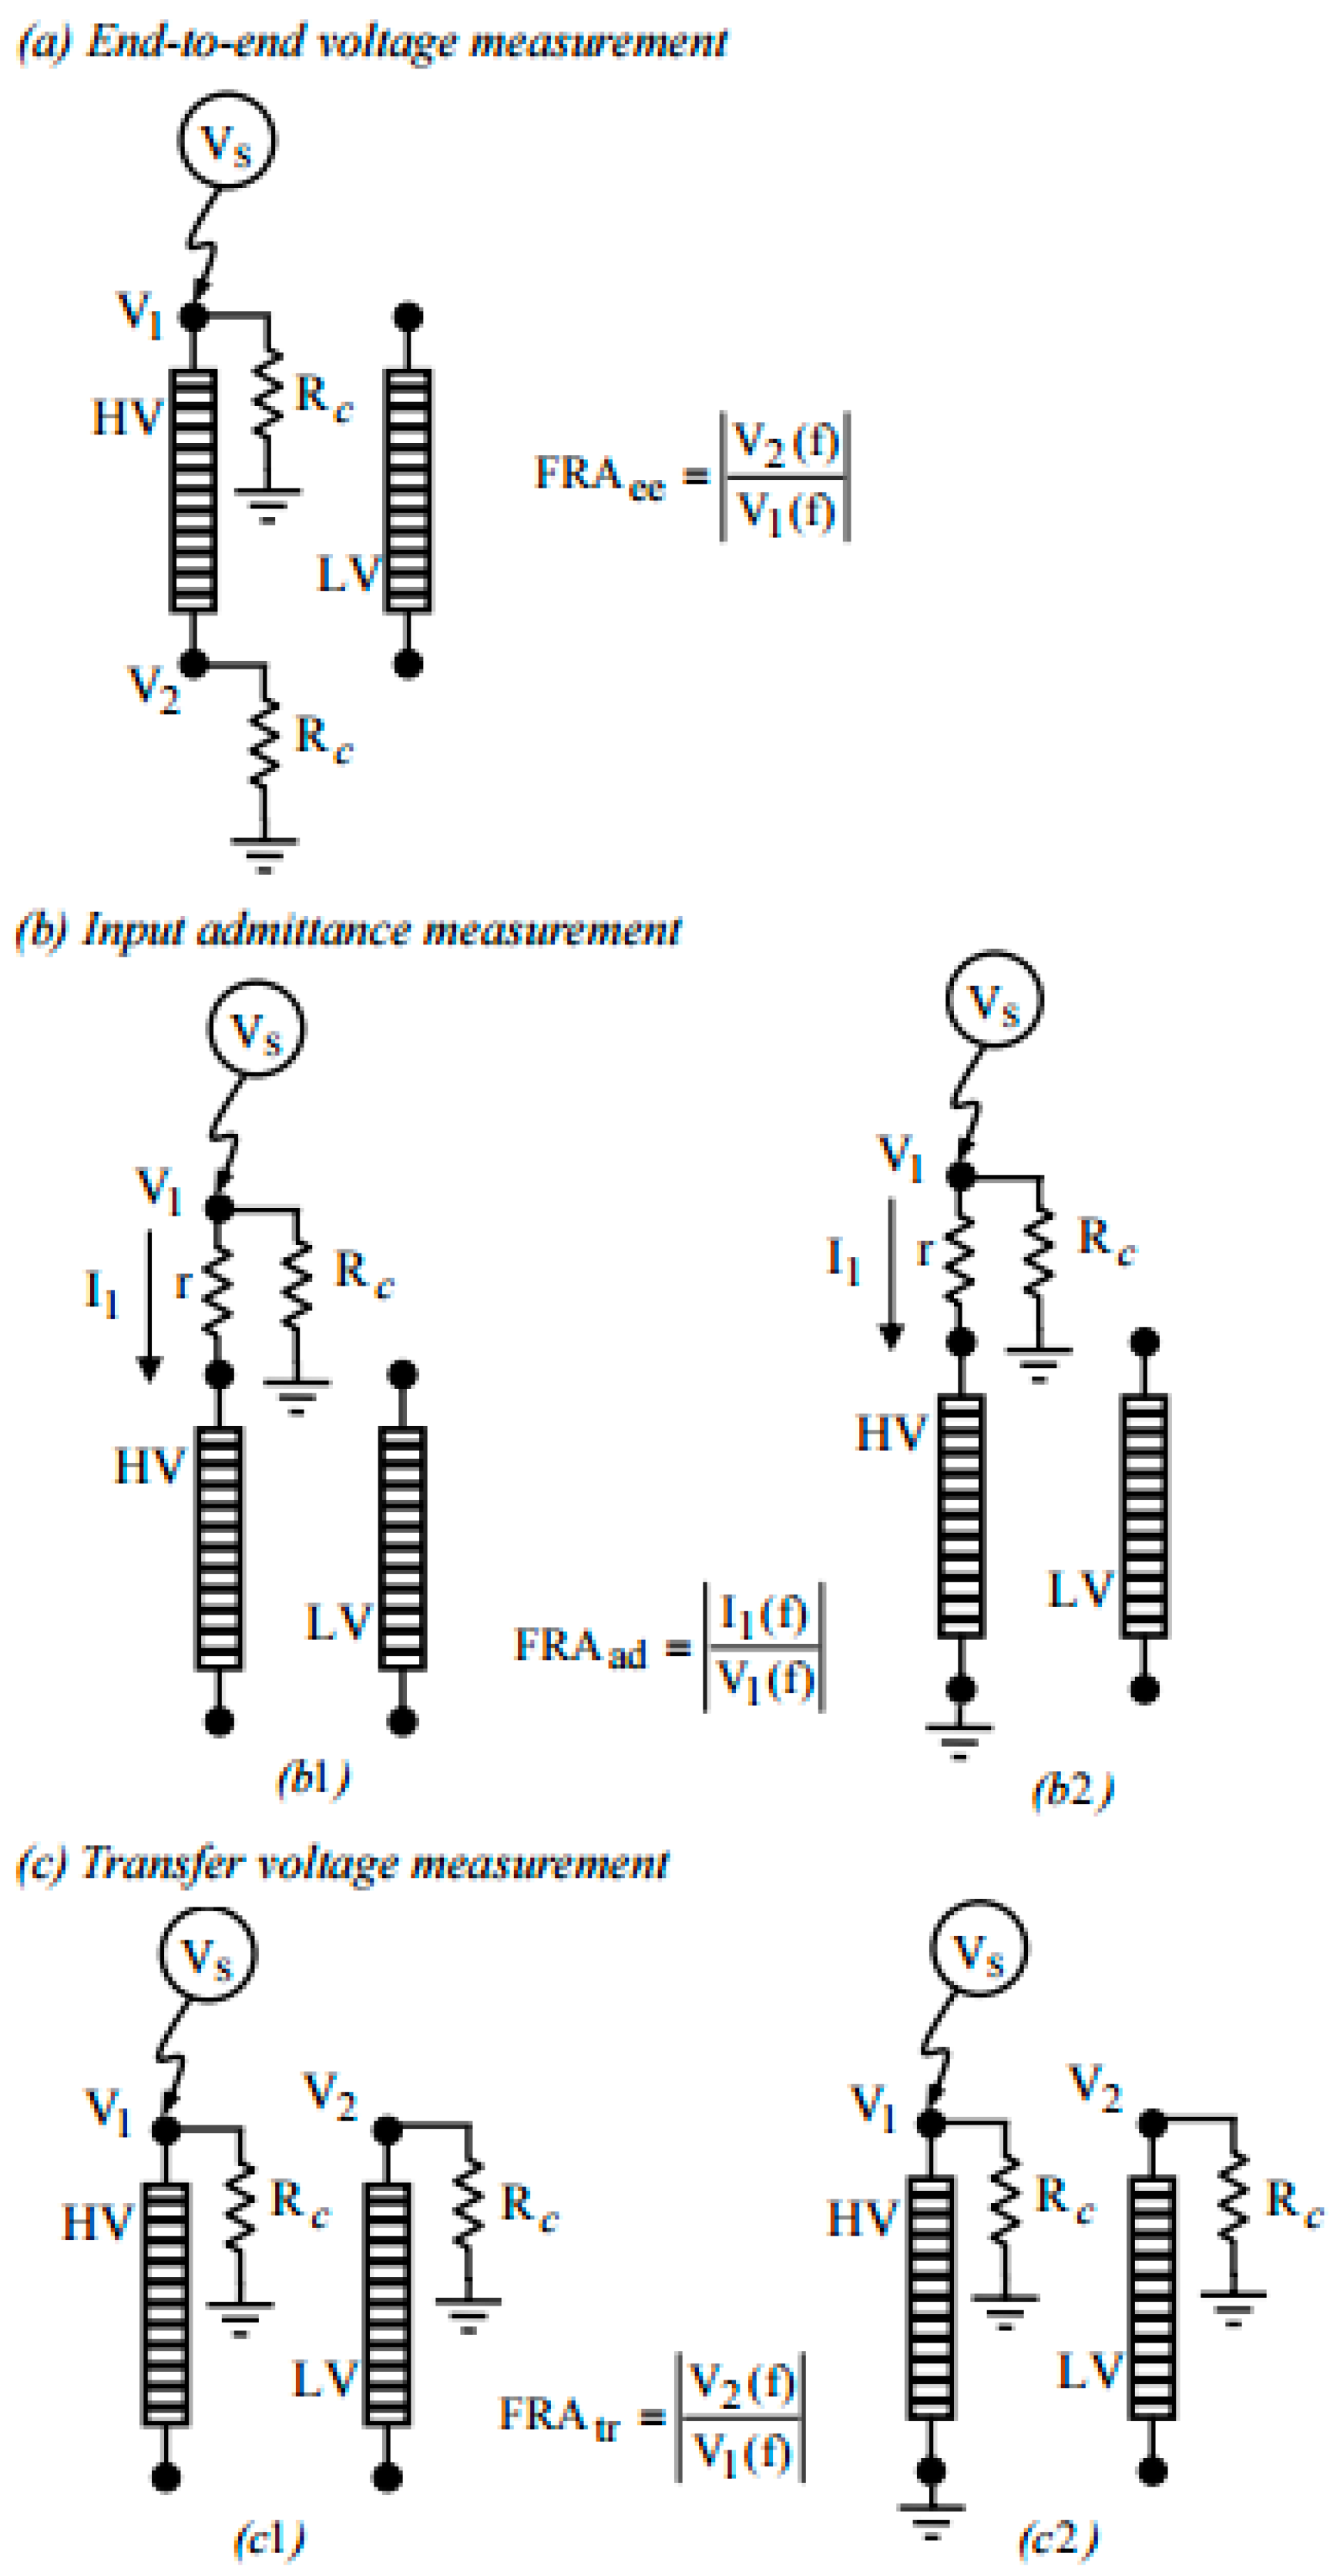
In [
17], a comparison of three different FRA measurement connections was studied. These were end-to-end voltage ratio, input admittance, and transfer voltage ratio measurements. Investigations were carried out to determine the sensitivity of these connections to three types of winding displacements or deformations. Considering a typical two-winding transformer, the FRA measurements can be expressed using terminal voltages and currents as shown in
Figure 7 [
20].
To determine the relative sensitivity of the three FRA connection methods to the detection of different types of winding movement, simulations of two-winding transformer model were carried out.
Results of the three FRA measurement connections on three winding movements studied show the sensitivity of each connection on the simulated fault. For axial and radial winding movements, the most sensitive connection is transfer voltage ratio whereas for conductor axial bending, the most sensitive connection is end-to-end voltage ratio [
20].
8. Case Study of In-Service Failure Diagnostics
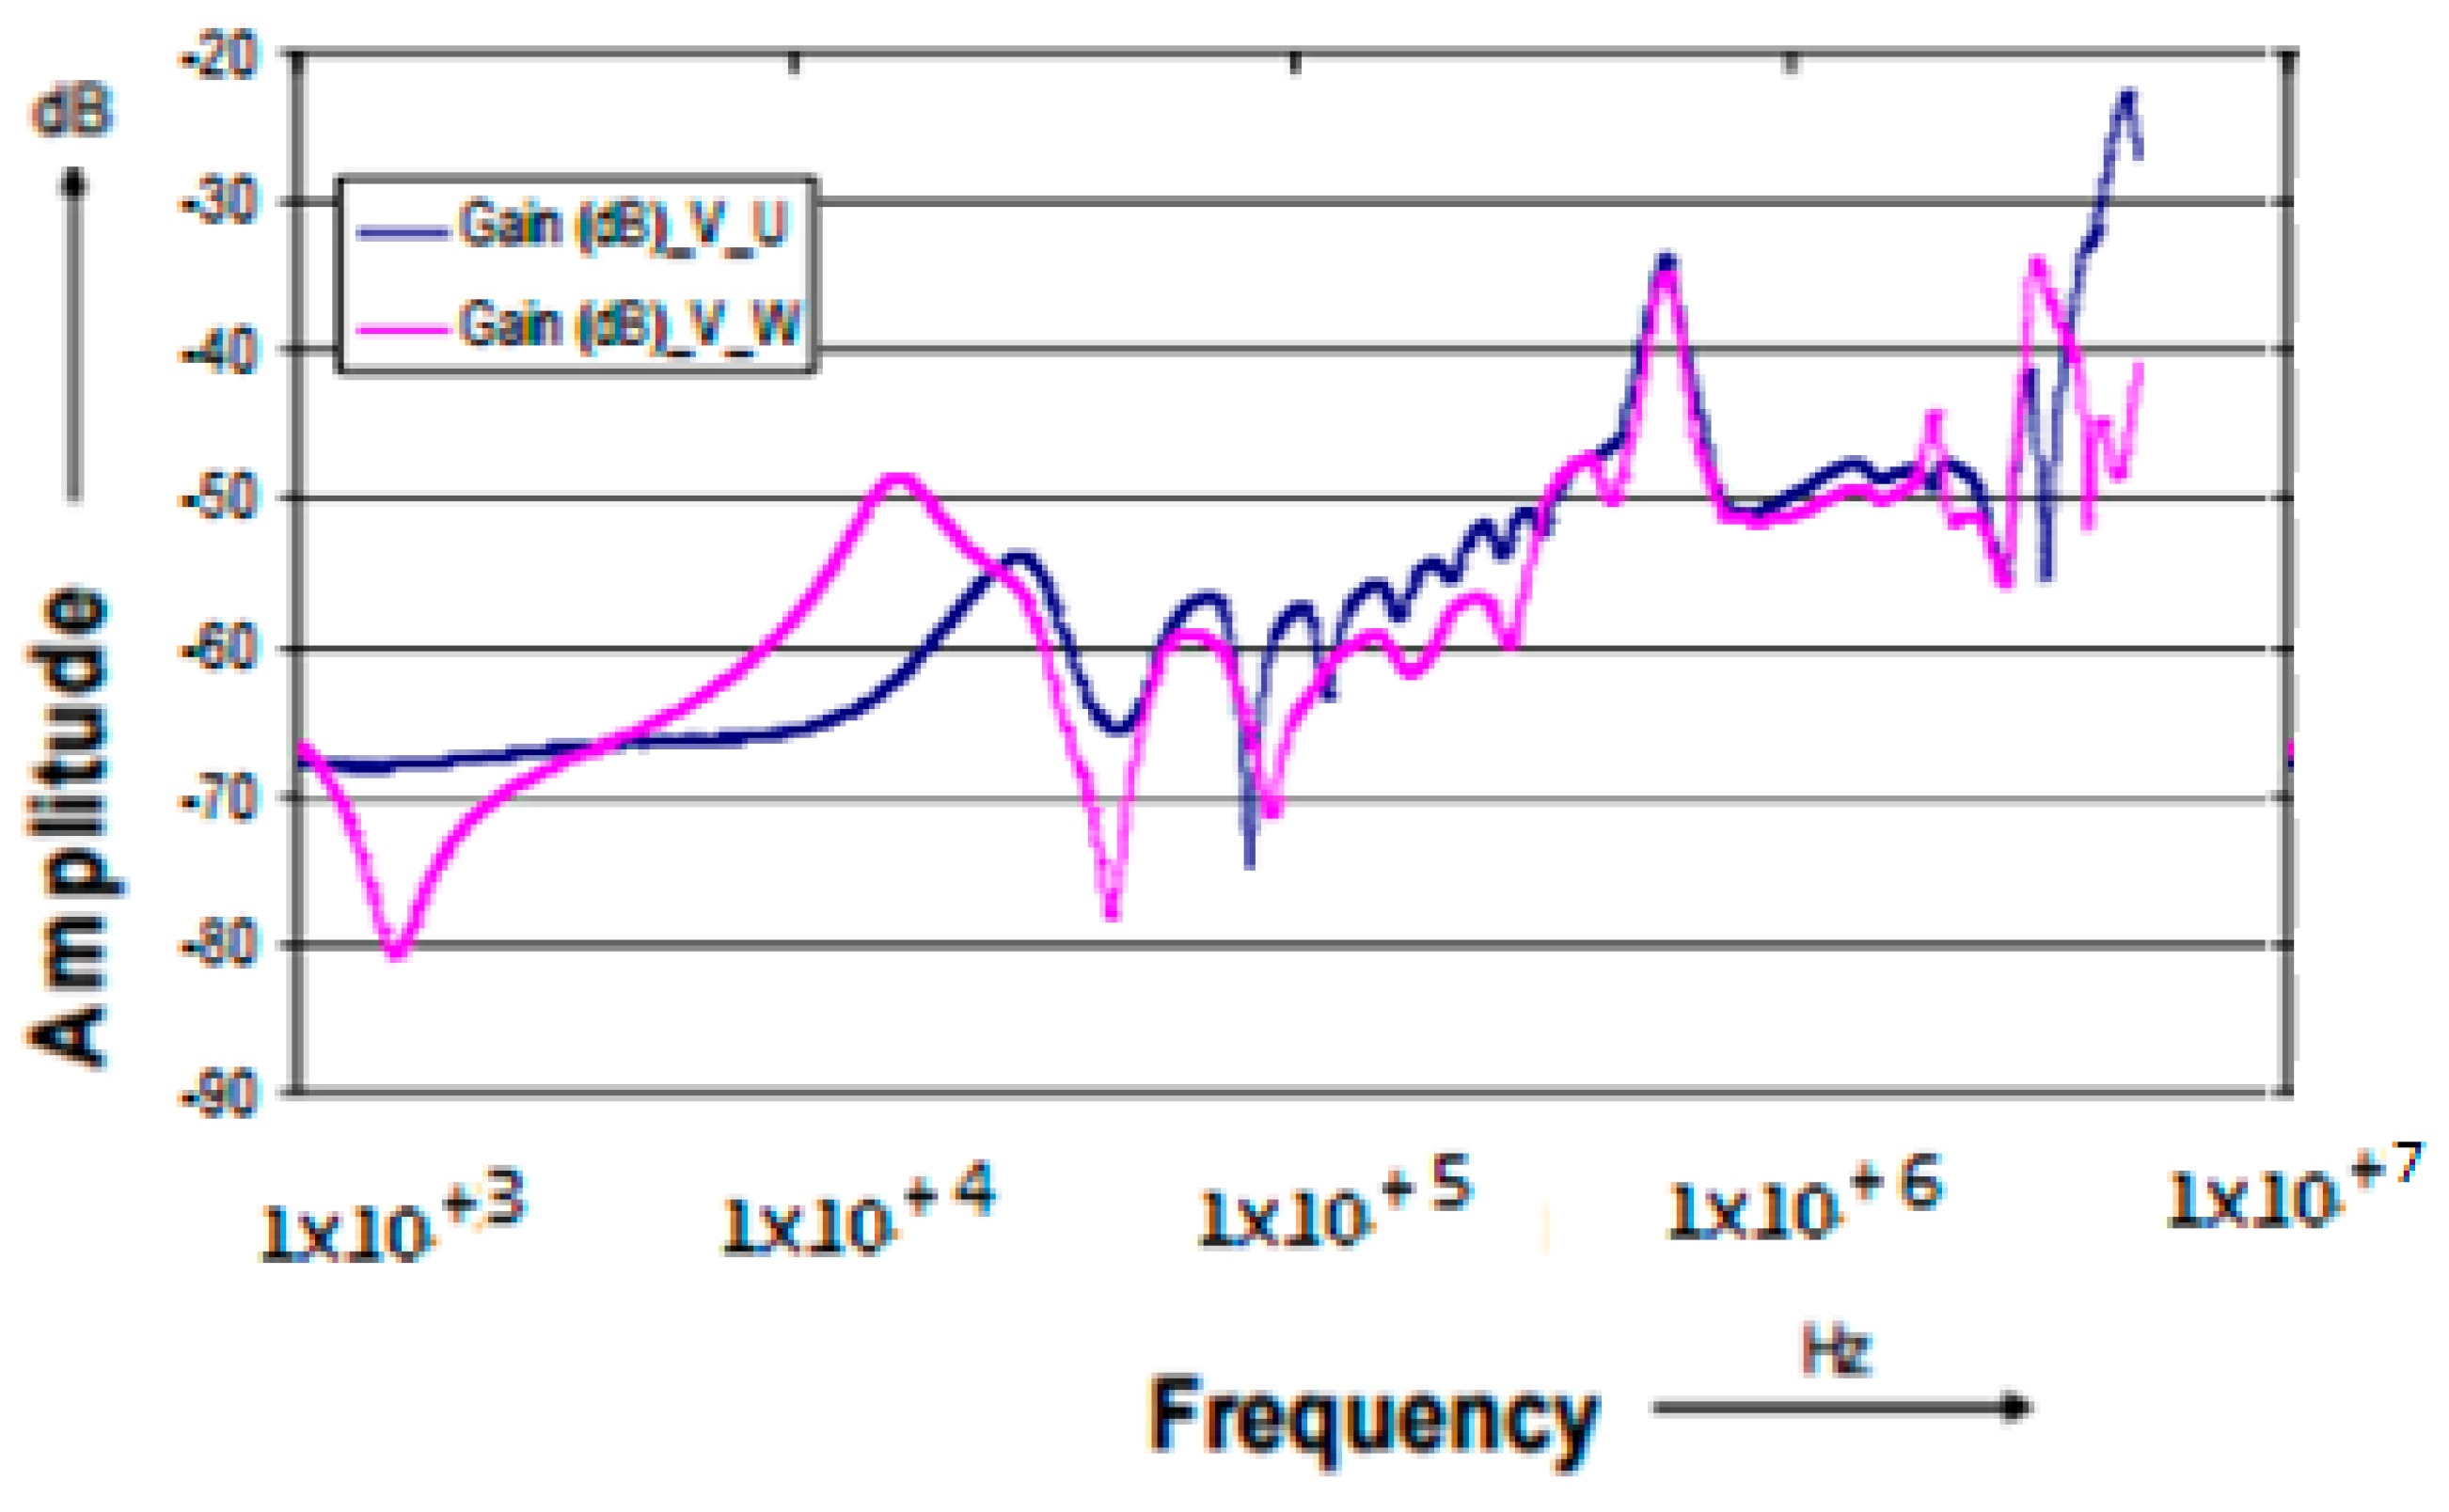
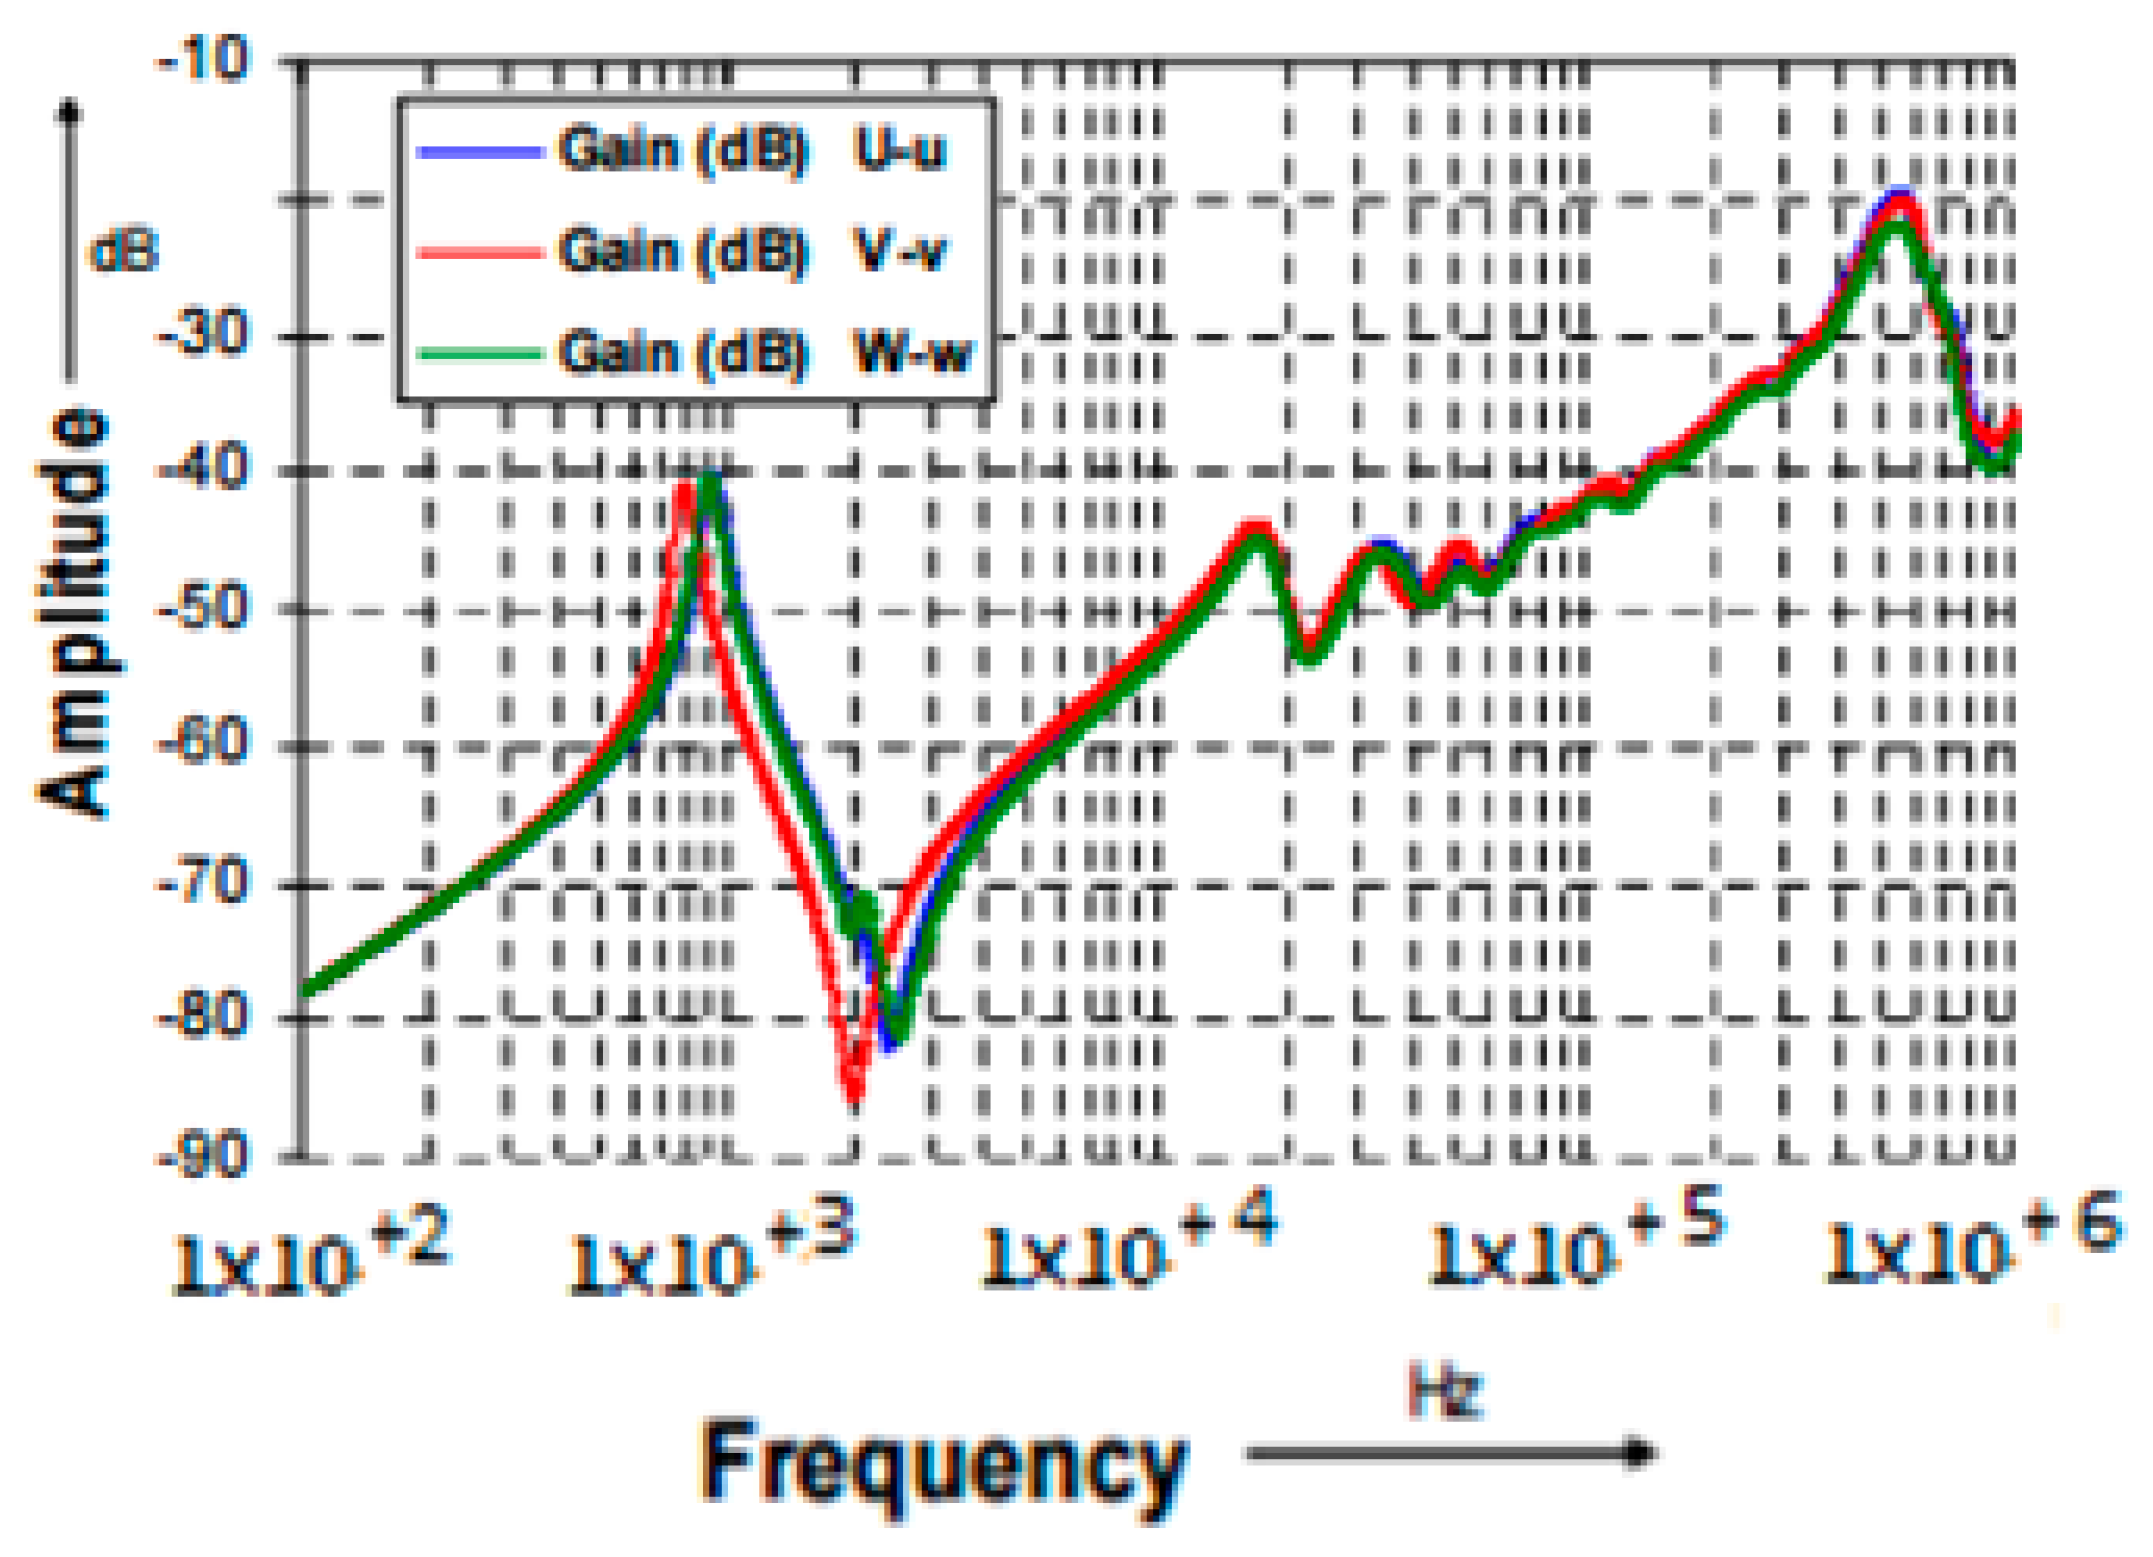
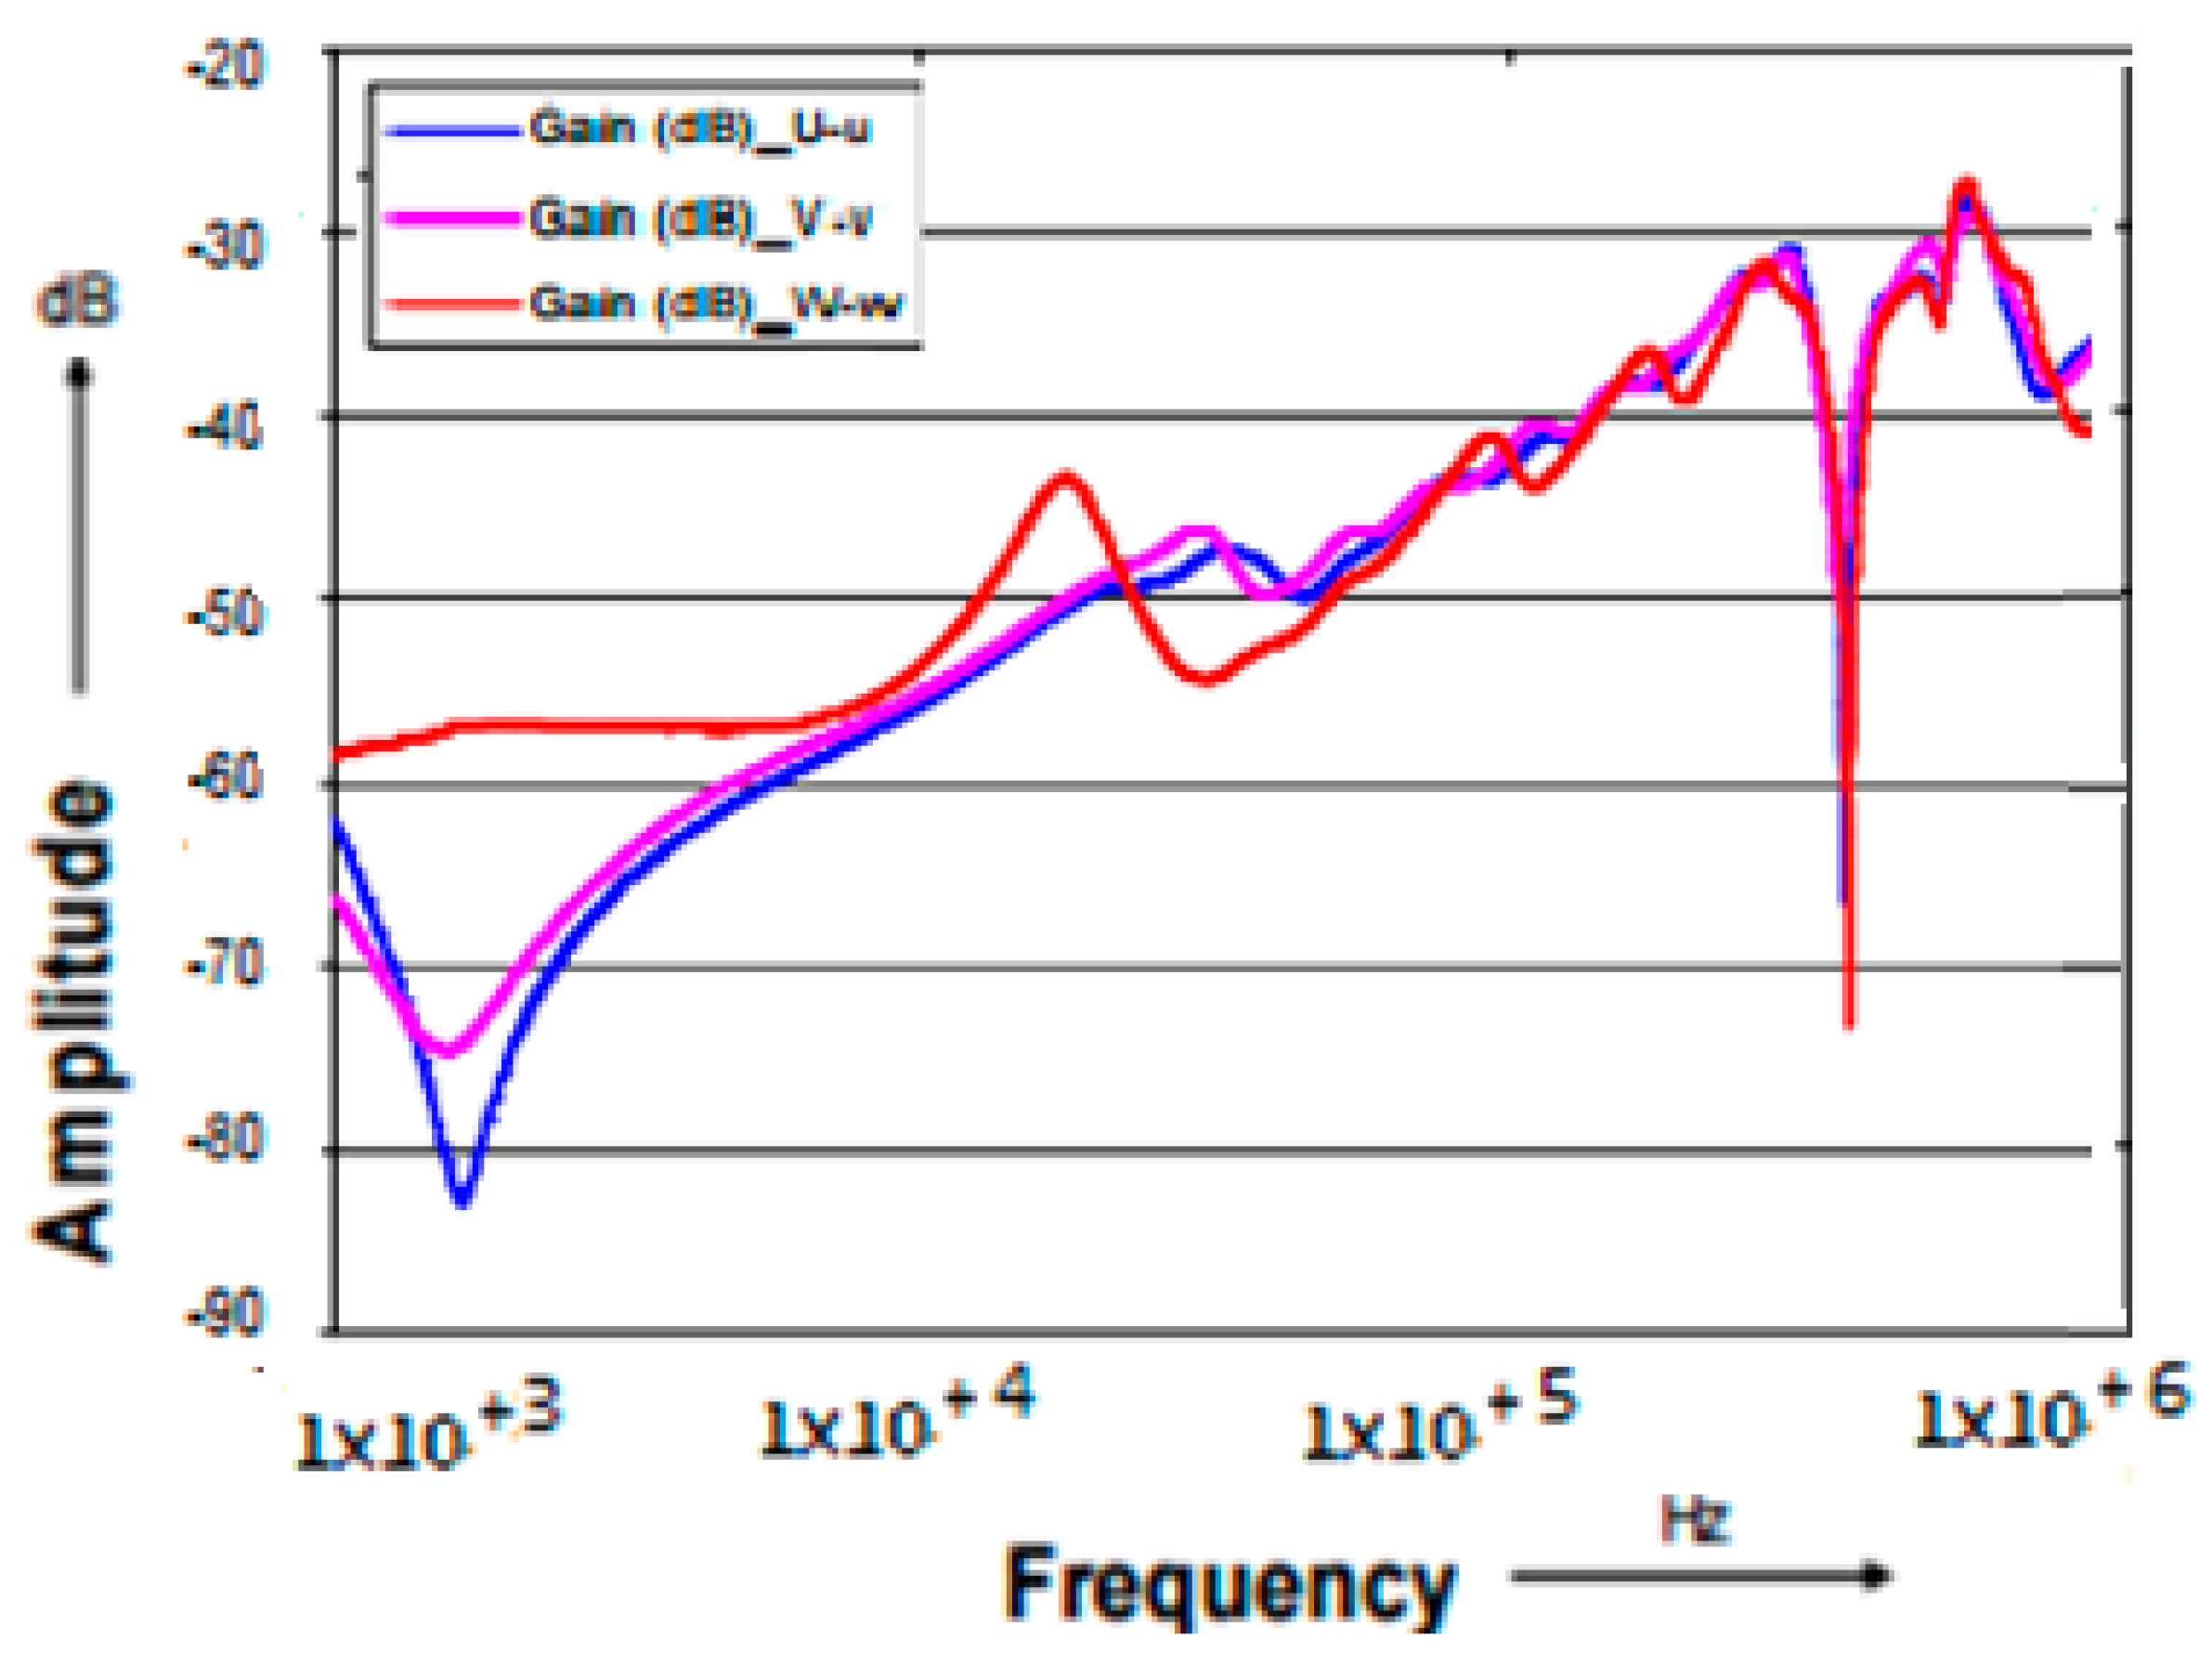
Transformers can fail in service and must be removed for diagnostics/repair/replacement. After removing the transformer from service, there are several methods to diagnose the fault and one of these methods is FRA as noted earlier. Authors of [
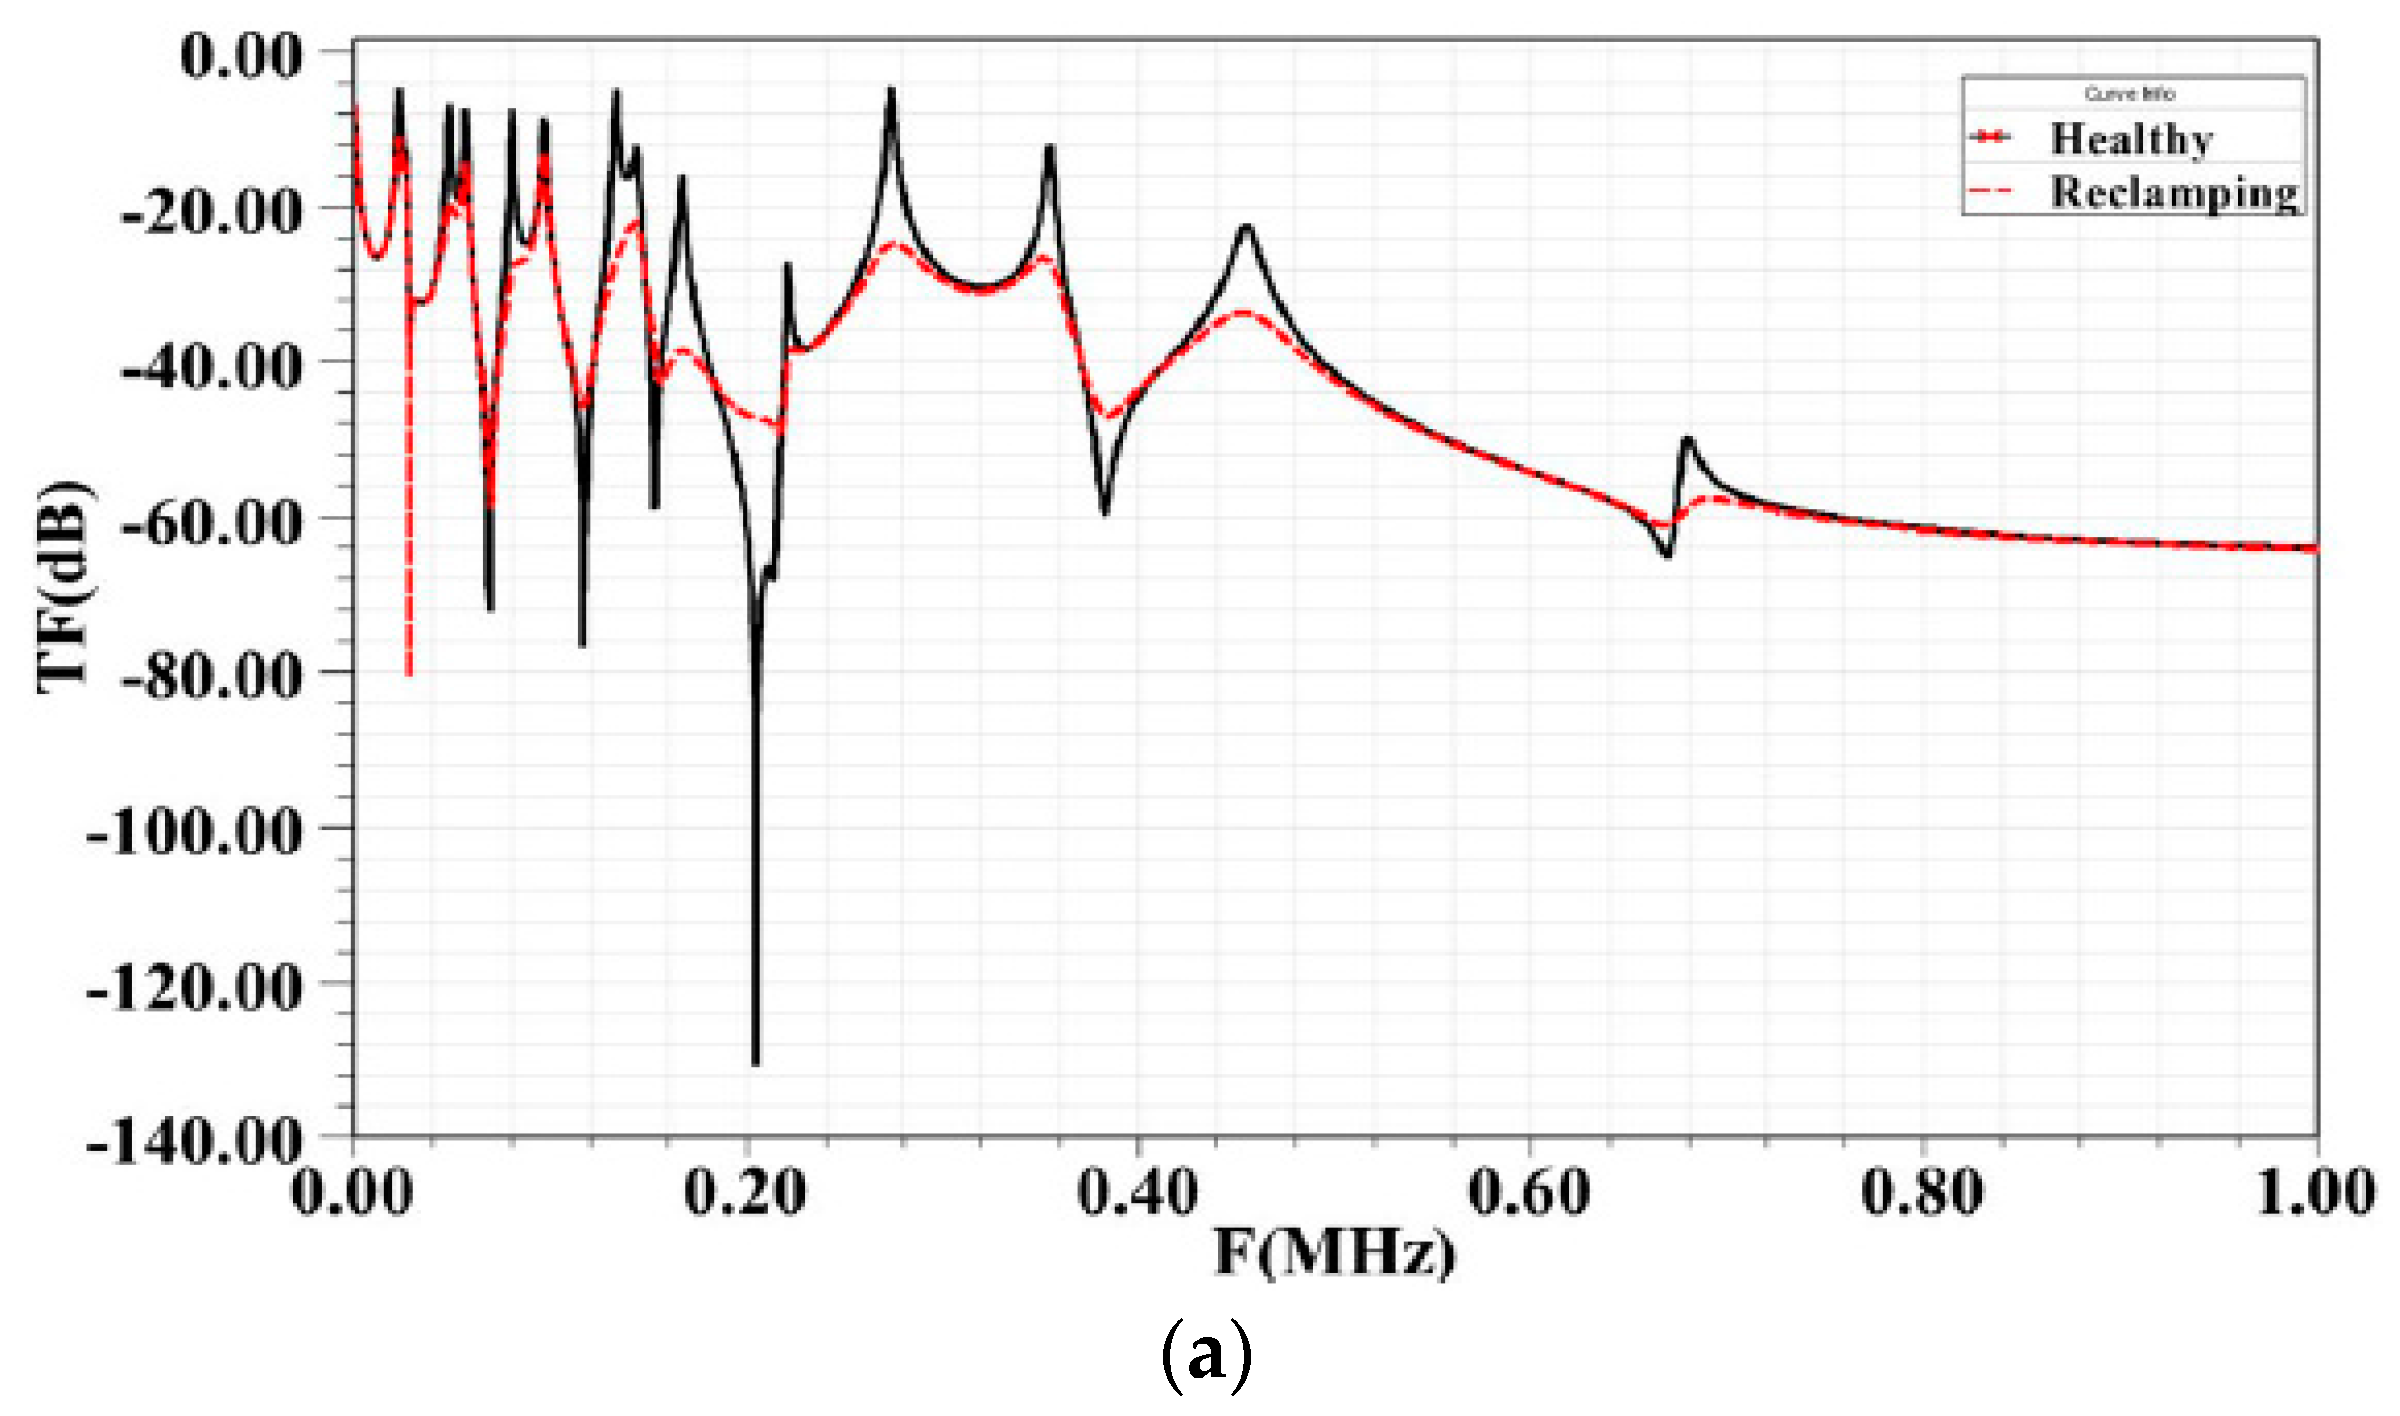
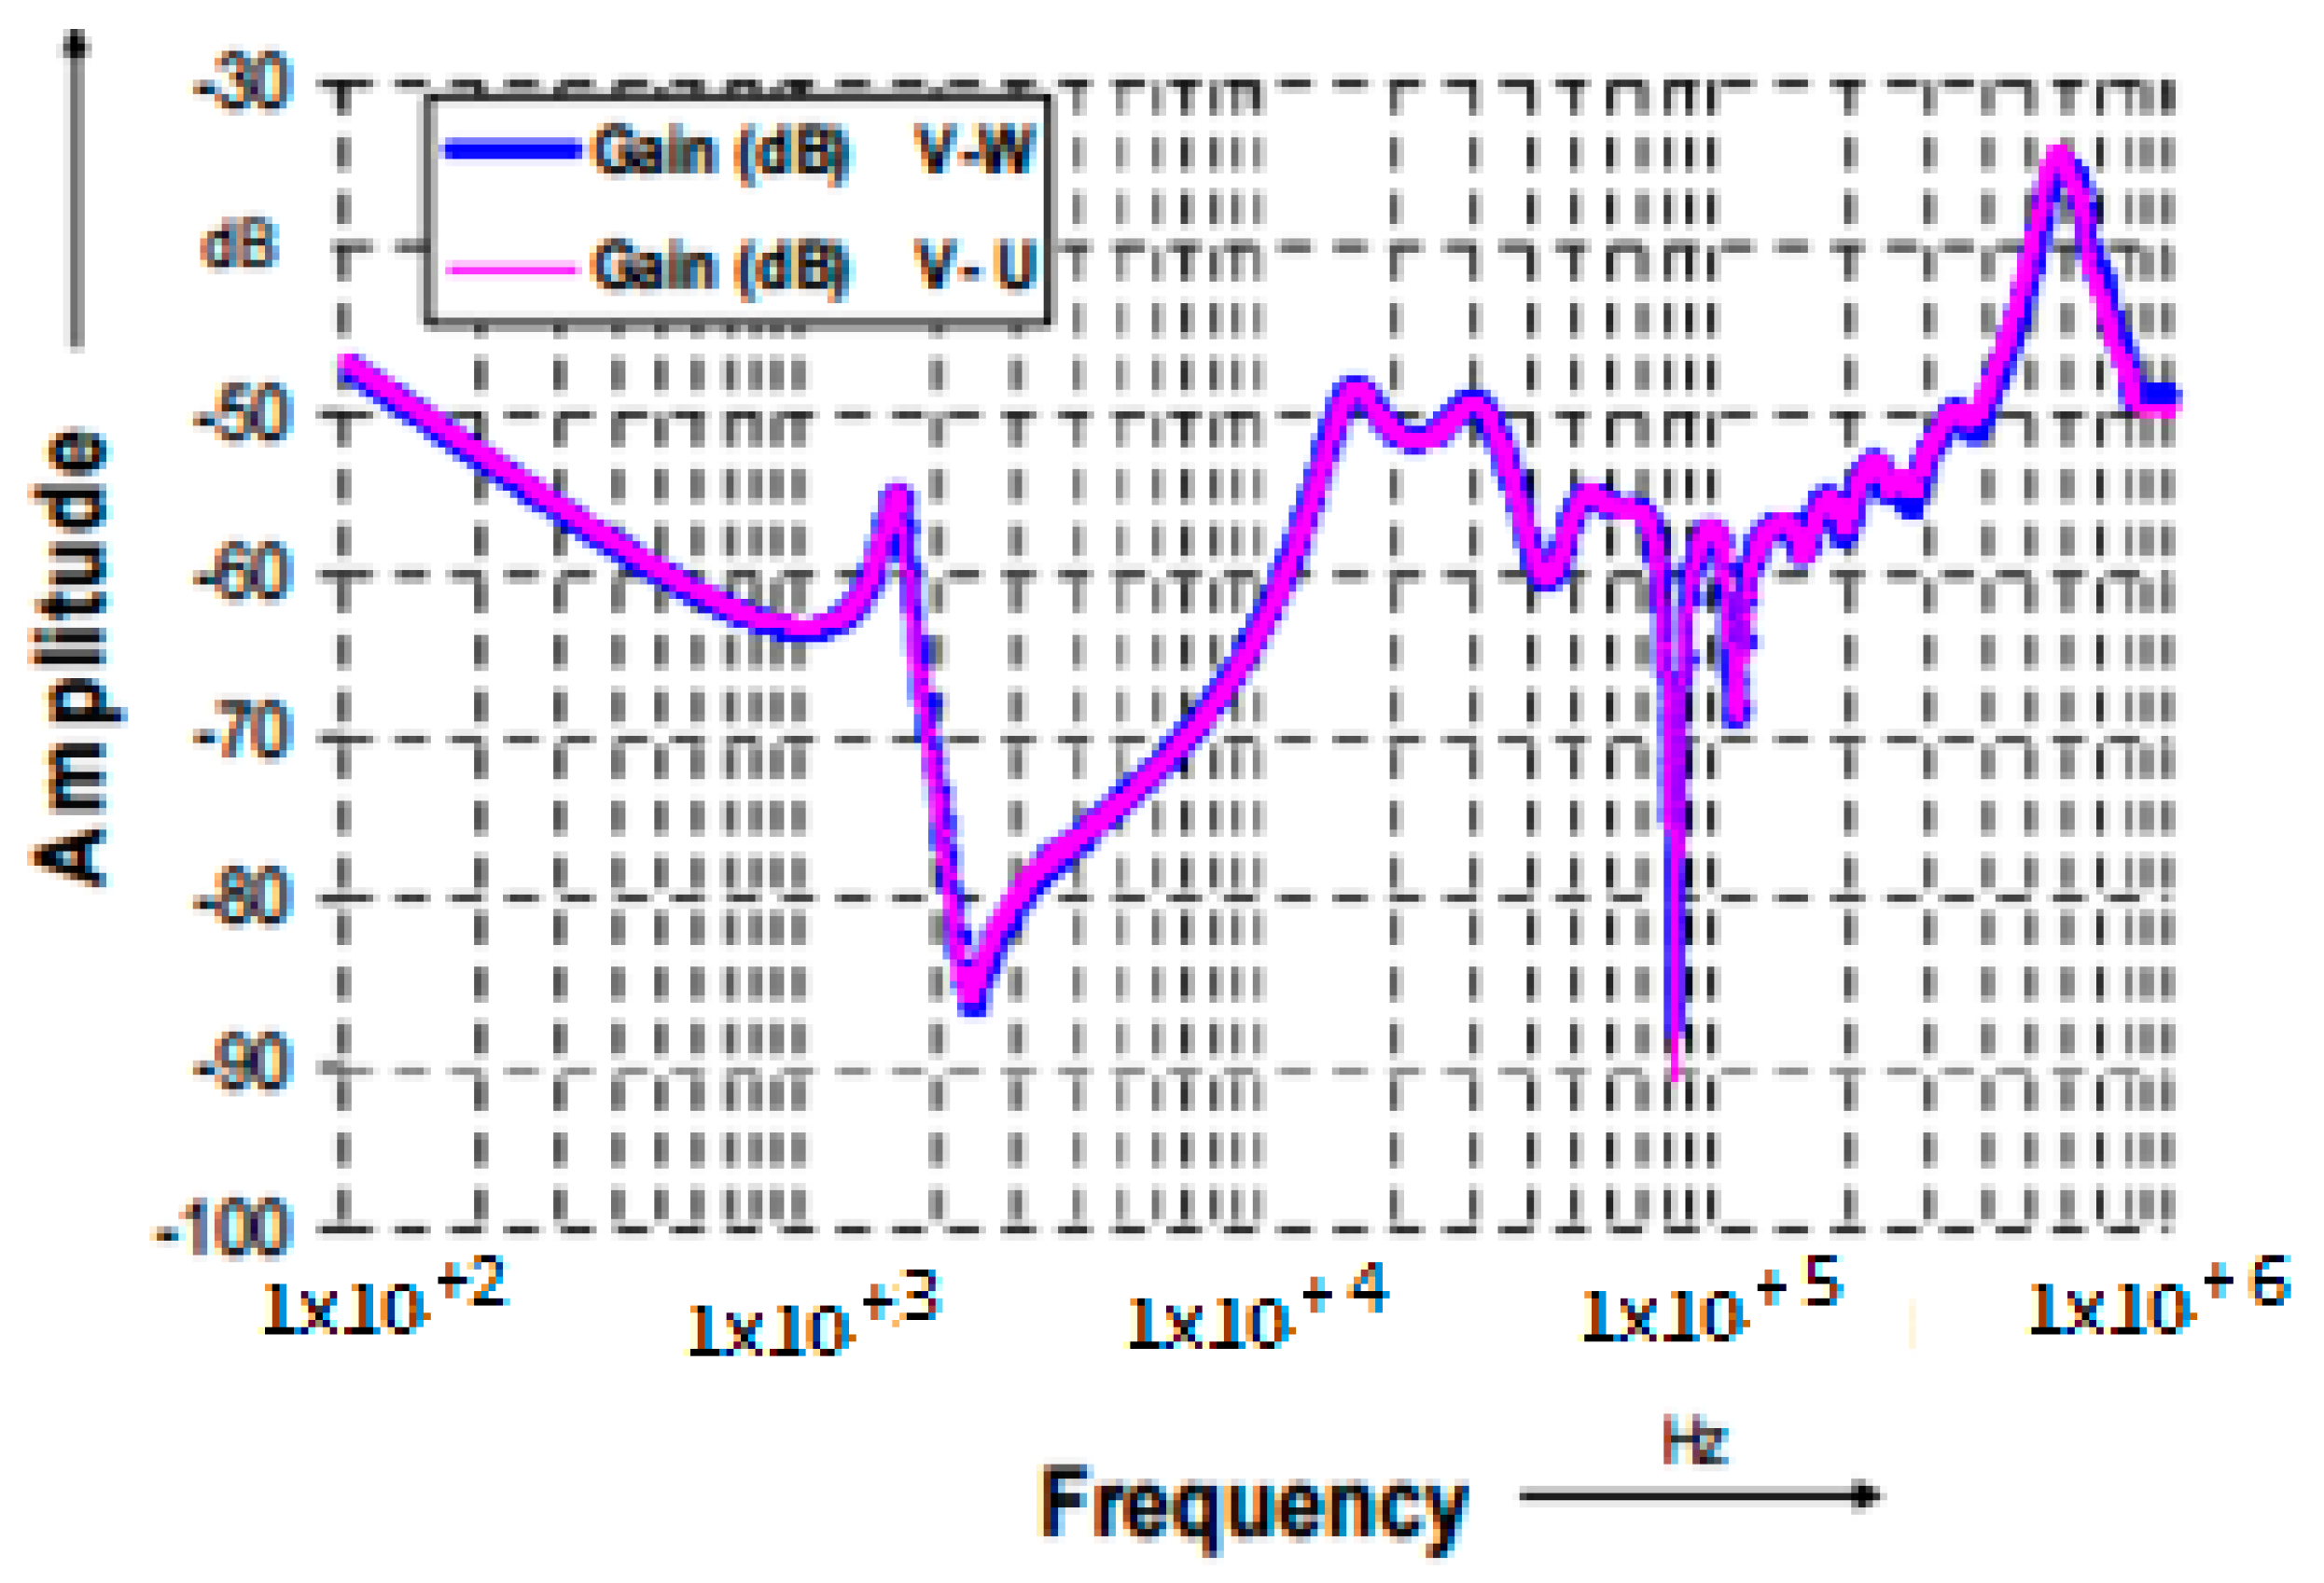
18] presented investigations done on a 0.4/10 kV, 100 kVA, oil-immersed transformer after a failure occurred. FRA measurements were performed on the transformer with respect to HV winding (i.e., V-U and V-W) and between HV and LV windings (i.e., U-u, V-v, and W-w).
Figure 8 and
Figure 9 show the FRA signatures of HV windings in a faulty transformer compared to a normal one [
8,
21]. Moreover,
Figure 10 and
Figure 11 show the FRA of high-low voltage windings of a faulty transformer compared to a normal transformer [
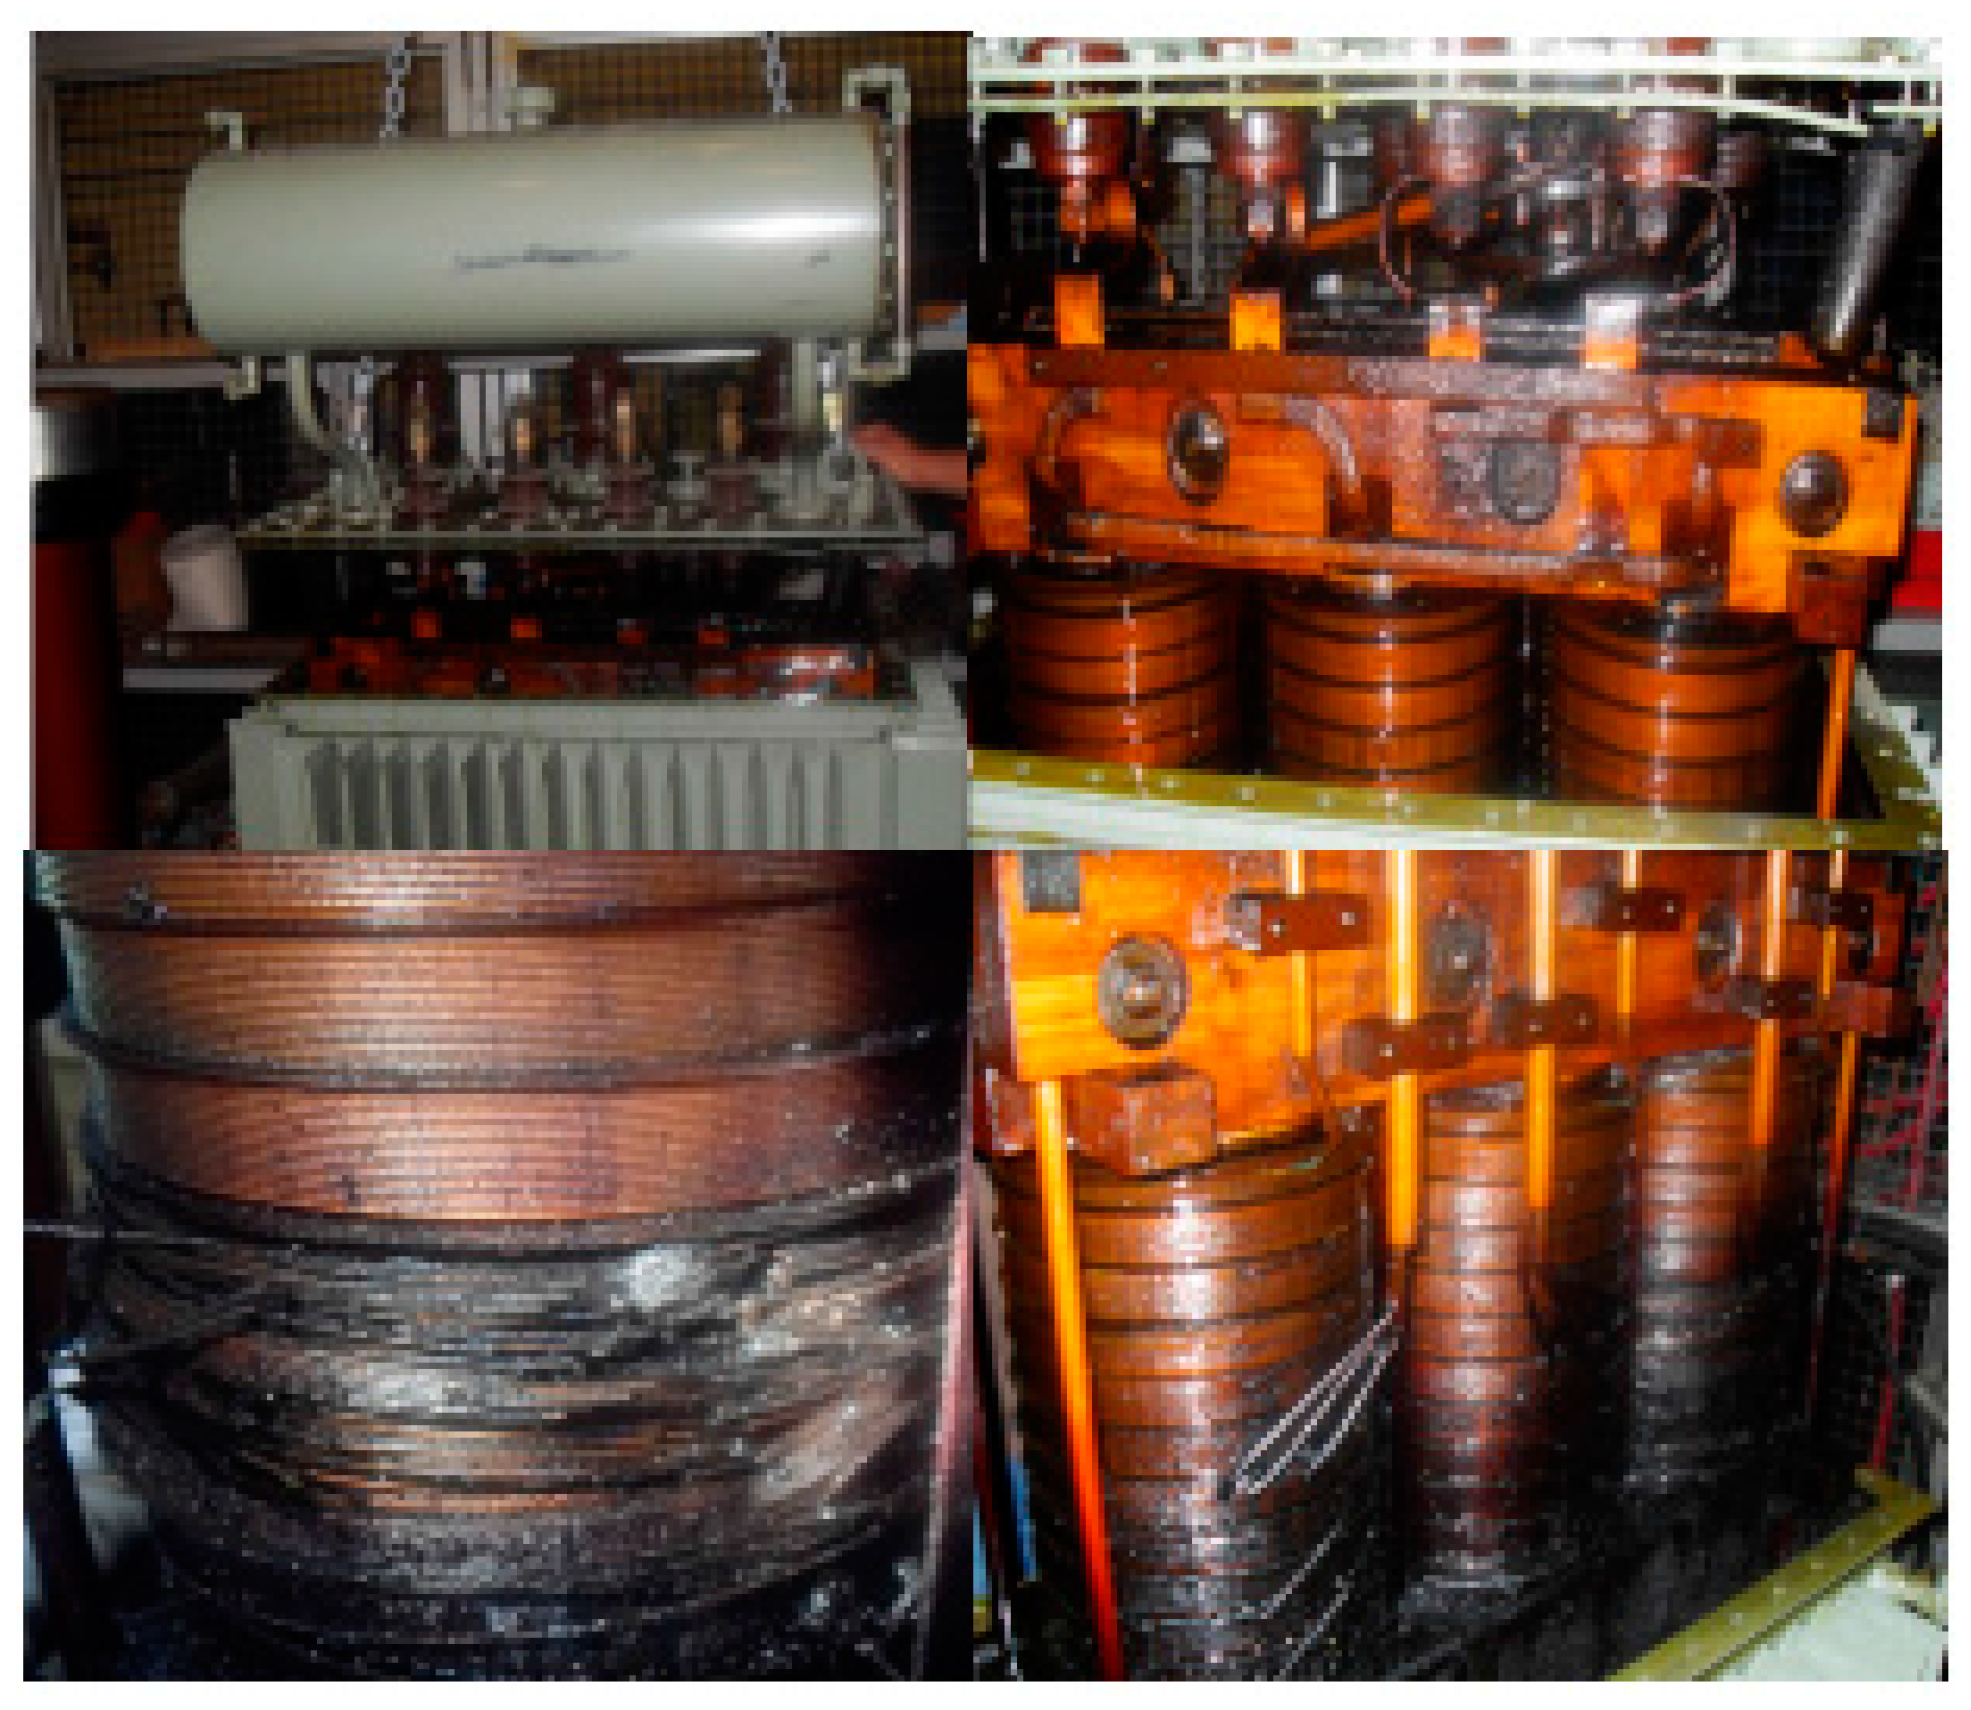
21]. These figures show the differences in FRA signatures of phase (W). After opening the transformer, deformation on the HV winding on phase W was noticed by the visual exam as shown in
Figure 12 [
21].
Thus, for transformer assessment, the following test procedures are useful: the DGA technique, the measurement of resistance between phases, insulation resistance, water content in oil, the polarization and depolarization current (PDC) measurements and FRA. FRA method provides useful information about winding movements and deformation, etc. [
21].
9. New Diagnostic Methods to Support Frequency Response Analysis
Several researchers have attempted to develop and refine the FRA method and this section discusses some of these efforts.
9.1. Impedance Test
There is a need to improve the interpretation of the FRA signatures. A diagnostic method, which is still based on a kind of non-physical analysis through waveform comparison and statistical coefficient interpretation, is discussed in [
22]. The paper shows that a physical FRA interpretation based on analysis of physical electrical parameters has not been feasible until now since one of the most important parameters that is the winding series capacitance cannot be precisely determined in transformer bulk.
To determine electrical parameters of power transformers for the purposes of failure diagnostics and FRA interpretation in low and mid frequency range, a new measurement-based method known as the impedance method is proposed in [
22]. The main applications of this method can be stated as follows:
- −
Determination of transformer electrical parameters such as frequency-dependent impedances of core sections, leakage, zero-sequence paths, and winding capacitances (ground, series, and inter-winding HV-LV); and
- −
Interpretation of different standard and nonstandard frequency responses, i.e., voltage ratios and input impedances, respectively, in low and mid frequency range [
5].
The studies show that the FRA method alone is not efficient to detect any detail of the failures, since the winding mechanical failures are associated with changes of leakage inductance and different capacitances (ground, series, and inter-winding HV-LV). Per-phase leakage inductances can be determined independently and reliably from measurements to detect failure type and failure level [
5] in the impedance techniques.
9.2. Statistics
Recent research has attempted to assist in the interpretation process of the FRA by introducing statistical and mathematical indicators, and then applying them to the FRA measurements. Statistical indicators are based on the degree of agreement or disagreement between two sets of measurements corresponding to the fault and normal conditions of the transformer. Such calculations lead to parameters that are exact, objective and transparent and also can be incorporated in an automated detection procedure. Some statistical parameters such as correlation coefficient (CC), spectrum deviation and maximum absolute difference have been proposed in order to establish the differences between recordings of the FRA measurements [
23].
As noted above, the main challenge related to the FRA method is the lack of a universally accepted and systematic interpretation technique for the test results. To overcome this problem, the statistical approach can be a useful tool. Many research efforts have attempted using different statistical methods and indicators to aid FRA interpretation process. Commonly used indicators are the CC, standard deviation, absolute sum of logarithmic error, mean square error, absolute difference (DABS), min–max ratio (MM), sum-squared MM error, sum-squared ratio error, spectrum deviation, ratio of area under curve and deviation of area under curve, weighted normalized difference, T-test and median, harmonic mean and F-test, etc. [
3,
24,
25].
The above mentioned statistical methods are generally known as parametric methods. A parametric statistical method is a test that makes assumptions about the parameters of the population distribution e.g., mean or standard deviation, while a non-parametric method is a test dealing with variables without making assumptions about the form or the parameters of their distribution [
24]. Thus, certain assumptions should be satisfied to be able to use parametric methods. Moreover, if all of these assumptions are satisfied only then one should use parametric statistical methods; otherwise, it is recommendable to use non-parametric statistical methods.
9.3. Fuzzy Tools
The application of fuzzy-logic algorithm (FLA) for the automatic analysis of frequency response measurements of power transformers has been reported in [
26]. FLA evaluates the curve obtained by subtracting the present and the reference frequency-response (comparison curve) over three different frequency ranges, each one associated with a particular defect type, i.e., short circuit between turns, radial and axial displacements. These frequency ranges have been selected considering mainly SFRA experimental results performed on transformers whose conditions were well known. FLA has been adopted to take into account the uncertainty in the identification of the different defects in these three frequency ranges (partially overlapped). Using this approach, different defect types are identified by means of “de-fuzzyfication”, into different predicates. Each predicate is associated to a specific defect with a membership function that indicates the confidence degree of the output.
The uncertainty is taken into account by using appropriate membership functions thus giving the users flexible tools to support the evaluation of the transformer conditions. The validation tests show that the algorithm is capable to distinguish between good conditions and different types and levels of winding faults. Moreover, the algorithm seems to be independent of the connection type adopted to test the transformers and appears less sensitive to the background noise or small differences. Thus, it is argued that the use of SFRA with the proposed algorithm constitutes an important step forward to the setting up of reliable diagnostics of power transformers [
26].
9.4. Digital Image Processing
Digital image processing aims at improving the interpretation of pictorial information using electronic devices. Digital image is represented by a two-dimensional matrix that consists of finite number of pixels with a dimension of
X ×
Y. Any point on the polar plot is represented as a (
x1,
y1) with a value of |a| that represents image intensity at the point which has spatial location (
x1,
y1). The first step is acquiring the FRA polar plot image. This approach can be built within any frequency response analyzer to facilitate the automatic capturing of the polar plot. Image pre-processing is aimed at resizing the image, adjusting its color format and extension type to ease sensing the image in electronic systems [
27].
Several case studies were carried out in [
27]. Digital image processing based on geometric dimension, texture analysis and invariant moment features extraction techniques were used to automate and standardize the process of fault identification and quantification. Practical and simulated results show that the FRA polar plot signature along with the developed digital image processing (DIP) technique is able to identify and quantify short circuit faults within transformer windings. The authors of [
27] suggest that the proposed technique is simple, fast and easy to implement within current frequency response analyzers in order to standardize the FRA interpretation process.
9.5. Frequency Response Analysis Polar Plot
One recent work [
28] has presented a new technique for FRA interpretation by incorporating the magnitude and angle of the FRA signature in one polar plot. The new technique is aimed at capturing all features of the FRA signature in one plot that can increase the reliability of the interpretation. The method also helps to automate the interpretation process and to reduce its reliance on expert personnel.
Certain faults such as bulking stress, axial displacement, inter-disk faults, and turn-to-turn short circuit, were simulated and studied in [
28]. These faults exhibit a unique impact on the FRA polar plot, which facilitates fault identification. The proposed technique is easy to implement within any FRA analyzer along with an image processing technique to automate the transformer fault identification and quantification.
10. IEEE Guide
IEEE has issued guidelines for FRA method applications to oil-filled transformer [
8]. The purpose of IEEE guide is to provide the user with sufficient information that will assist in making frequency response measurements and interpreting the results from these measurements. It provides guidance for all current methods employed in taking these measurements as well as the test equipment and test configurations to be used. The guide also illustrates the relationship to other transformer diagnostics.
11. Conclusions
Diagnostics of the power transformer is important for maintenance and keeping the transformer in service. FRA is a useful method for detecting some of internal faults in the transformer. FRA method is quite sensitive for diagnosing some of the internal faults in power transformer. The simulation of several faults such as short circuits, loss of clamps, inter-disk fault, and axial displacement show that such faults can be detected by the FRA technique. Also, the FRA is a useful technique for detecting the dielectric material in the transformer bushing and its associated fault. The test equipment and the test configuration have an effect on the FRA results and the test leads can also influence the results as well. Thus several points should be taken into account during the FRA measurements to draw clear conclusions from the measurements performed. The impedance method determines lumped electrical parameters and supports the standard FRA assessment for diagnostics of real mechanical failures. Since the deviations in FRA comparisons can change from transformer to transformer, it is not easy to detect failure type and failure level based on waveform identification alone. In such cases, the changes of electrical parameters can provide helpful additional information. Thus, the combination of FRA and “impedance” method can improve diagnostics of winding mechanical failures. The researchers have reported successful use of fuzzy logic, statistical tools, image processing and polar diagrams to improve the diagnostic accuracy of FRA methods.
Acknowledgments
The author would like to extend their sincere appreciation to the Deanship of Scientific Research (DSR) at King Saud University for its funding of this research through the Research Group Project No. RGP-1436-012.
Conflicts of Interest
The authors declare no conflict of interest.
References
- Bertagnolli, G. The ABB Approach to Short-Circuit Duty of Power Transformers, 3rd ed.; ABB Ltd.: Zurich, Switzerland, 1996. [Google Scholar]
- Liu, Y.; Ji, S.; Yang, F.; Cui, Y.; Zhu, L.; Rao, Z.; Ke, C.; Yang, X. A Study of the Sweep Frequency Impedance Method and Its Application in the Detection of Internal Winding Short Circuit Faults in Power Transformers. IEEE Trans. Dielectr. Electr. Insul. 2015, 22, 2046–2056. [Google Scholar] [CrossRef]
- Cesar Gonzales Arispe, J.; Esteban Mombello, E. Detection of Failures within Transformers by FRA Using Multiresolution Decomposition. IEEE Trans. Power Deliv. 2014, 29, 1127–1137. [Google Scholar] [CrossRef]
- Kulkarni, S.V.; Khaparde, S.A. Transformer Engineering: Design and Practice, 1st ed.; Marcel Dekker Inc.: New York, NY, USA, 2004. [Google Scholar]
- Pham, D.A.K.; Pham, T.M.T.; Borsi, H.; Gockenbach, E. A New Diagnostic Method to Support Standard Frequency Response Analysis Assessments for Diagnostics of Transformer Winding Mechanical Failures. IEEE Electr. Insul. Mag. 2014, 30, 34–41. [Google Scholar] [CrossRef]
- Picher, P.; Lapworth, J.; Noonan, T.; Christian, J. Mechanical-Condition Assessment of Transformer Windings Using Frequency Response Analysis (FRA); CIGRE WG A2.26, Technical Brochure 342; CIGRE: Toronto, ON, Canada, 2008. [Google Scholar]
- Kraetge, A.; Kruger, M.; Viljoen, H.; Dierks, A. Aspects of the Practical Application of Sweep Frequency Response Analysis (SFRA) on Power Transformers. In Proceedings of the CIGRE 6th Southern Africa Regional Conference, Somerset West, South Africa, 17–21 August 2009.
- IEEE Power and Energy Society. IEEE Guide for the Application and Interpretation of Frequency Response Analysis for Oil-Immersed Transformers; IEEE Standard Association: New York, NY, USA, 2013. [Google Scholar]
- Sofian, D.M.; Wang, Z.D.; Jayasinghe, S.B. Frequency response analysis in diagnosing transformer winding movements—Fundamental understandings. In Proceedings of the 39th International Universities Power Engineering Conference (UPEC), Bristol, UK, 6–8 September 2004; pp. 138–142.
- Betancourt, E.; Hernandez, C. Power Transformer Manufacturer’s Experience with Transportation Mishandling. In Proceedings of the 7th Annual WEIDMANN Diagnostic Solutions Technical Conference, New Orleans, LA, USA, 15–17 September 2008.
- Zang, C.; Gan, J.; Nie, D.; Du, Z.; Tang, Z.; Deng, X. Insulation Status Detection on the High Voltage Bushing by FRA Method. In Proceedings of the IEEE Innovative Smart Grid Technologies—Asia (ISGT Asia), Washington, DC, USA, 21–24 May 2012.
- Gomez-Luna, E.; Guillermo, A.M.; Carlos, G.G.; Jorge, P.G. Current Status and Future Trends in Frequency-Response Analysis with a Transformer in Service. IEEE Trans. Power Deliv. 2013, 28, 1024–1031. [Google Scholar] [CrossRef]
- Breytenbach, R. Winding Frequency Response Analysis Using the Impulse Frequency Response Analysis (IFRA) Method; IEEE FRA Specification, Starlogic IFRA Submission Version 1.0; Starlogic Instrument Development: South Africa, 2003. [Google Scholar]
- Power Transformers—Part 18, Measurement of Frequency Response; IEC 60076-18 Ed.1; International Electrotechnical Commission (IEC): Geneva, Switzerland, 2012.
- Hashemnia, N.; Abu-Siada, A.; Masoum, M.A.S.; Islam, S.M. Characterization of transformer FRA signature under various winding faults. In Proceedings of the International Conference on Condition Monitoring and Diagnosis (CMD), Bali, Indonesia, 23–27 September 2012; pp. 446–449.
- Gawrylczyk, K.M.; Banaszak, S. Modeling of frequency response of transformer winding with axial deformations. Arch. Electr. Eng. 2014, 63, 5–17. [Google Scholar] [CrossRef]
- Dick, E.P.; Erven, C.C. Transformer Diagnostic Testing by Frequency Response Analysis. IEEE Trans. Power Appar. Syst. 1978, 6, 2144–2153. [Google Scholar] [CrossRef]
- Abu Siada, A.; Hashemnia, N.; Islam, S.; Masoum, M.A.S. Understanding power transformer frequency response analysis signatures. IEEE Electr. Insul. Mag. 2013, 29, 48–56. [Google Scholar] [CrossRef]
- Abu-Siada, A.; Hashemnia, N.; Islam, S.; Masoum, M.S.A. Impact of Transformer Model Parameters Variation on FRA Signature. In Proceedings of the 22nd Australasian Universities Power Engineering Conference (AUPEC), Bali, Indonesia, 26–29 September 2012.
- Jayasinghe, J.A.S.B.; Wang, Z.D.; Jarman, P.N. Winding Movement in Power Transformers: A Comparison of FRA Measurement Connection Methods. IEEE Trans. Dielectr. Electr. Insul. 2006, 13, 1342–1349. [Google Scholar] [CrossRef]
- Abdallah, J. Using the frequency response analysis (FRA) in transformers internal fault detection. WSEAS Trans. Power Syst. 2009, 4, 297–306. [Google Scholar]
- Pham, D.A.K.; Pham, T.M.T.; Borsi, H.; Gockenbach, E. A new method for purposes of failure diagnostics and FRA interpretation applicable to power transformers. IEEE Trans. Dielectr. Electr. Insul. 2013, 20, 2026–2034. [Google Scholar] [CrossRef]
- Behjat, V.; Mahvi, M. Statistical Approach for Interpretation of Power Transformers Frequency Response Analysis Results. IET Sci. Meas. Technol. 2015, 9, 367–375. [Google Scholar] [CrossRef]
- Behjat, V.; Mahvi, M.; Rahimpour, E. New Statistical Approach to Interpret Power Transformer Frequency Response Analysis: Non-Parametric Statistical Methods. IET Sci. Meas. Technol. 2016, 10, 364–369. [Google Scholar] [CrossRef]
- Bagheri, M.; Phung, B.T.; Blackburn, T. Transformer Frequency Response Analysis: Mathematical and Practical Approach to Interpret Mid-Frequency Oscillations. IEEE Trans. Dielectr. Electr. Insul. 2013, 20, 1962–1970. [Google Scholar] [CrossRef]
- Contin, A.; Rabach, G.; Borghetto, J.; de Nigris, M.; Passaglia, R.; Rizzi, G. Frequency-response analysis of power transformers by means of fuzzy tools. IEEE Trans. Dielectr. Electr. Insul. 2011, 18, 900–909. [Google Scholar] [CrossRef]
- Aljohani, O.; Abu-Siada, A. Application of Digital Image Processing to Detect Short Circuit Turns in Power Transformers using Frequency Response Analysis. IEEE Trans. Ind. Inform. 2016. [Google Scholar] [CrossRef]
- Aljohani, O.; Abu-Siada, A. Application of FRA polar plot technique to diagnose internal faults in power transformers. In Proceedings of the PES General Meeting, Conference & Exposition, National Harbor, MD, USA, 27–31 July 2014.
© 2016 by the authors; licensee MDPI, Basel, Switzerland. This article is an open access article distributed under the terms and conditions of the Creative Commons Attribution (CC-BY) license (http://creativecommons.org/licenses/by/4.0/).


