
Energy Management Strategy for Microgrids by Using Enhanced Bee Colony Optimization

Abstract
:1. Introduction
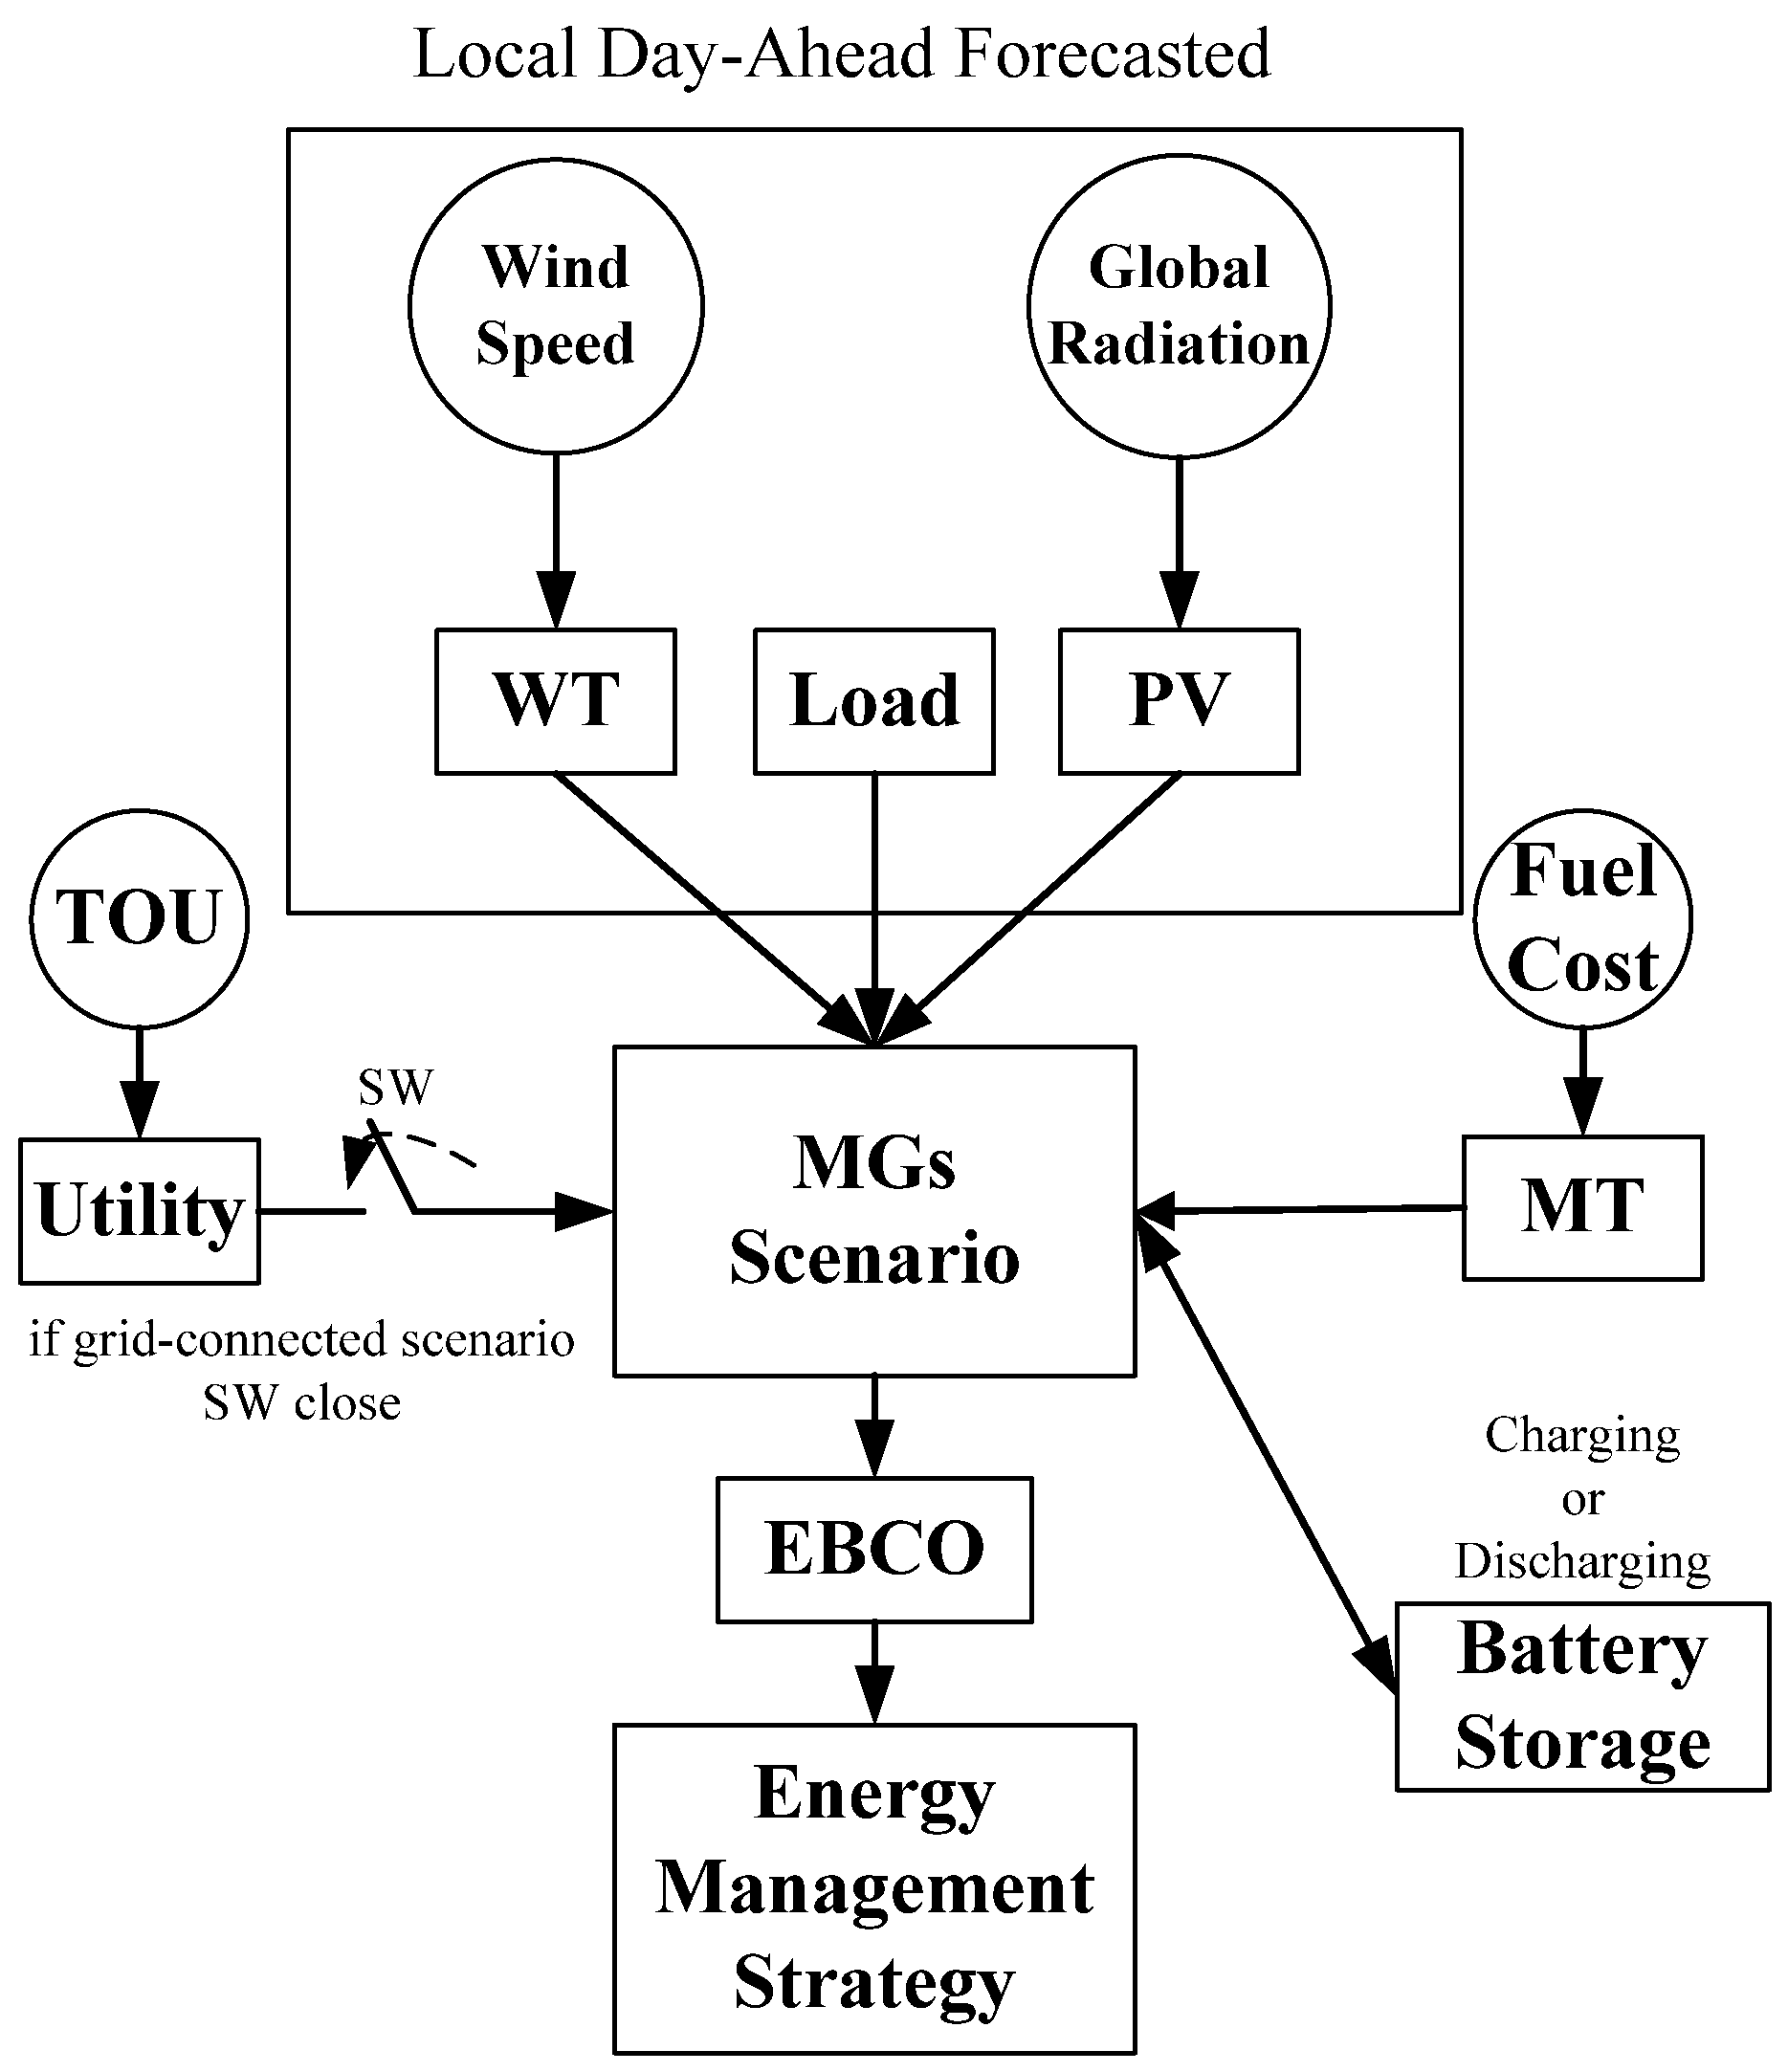
2. System Model

2.1. The Model of Micro-Turbine
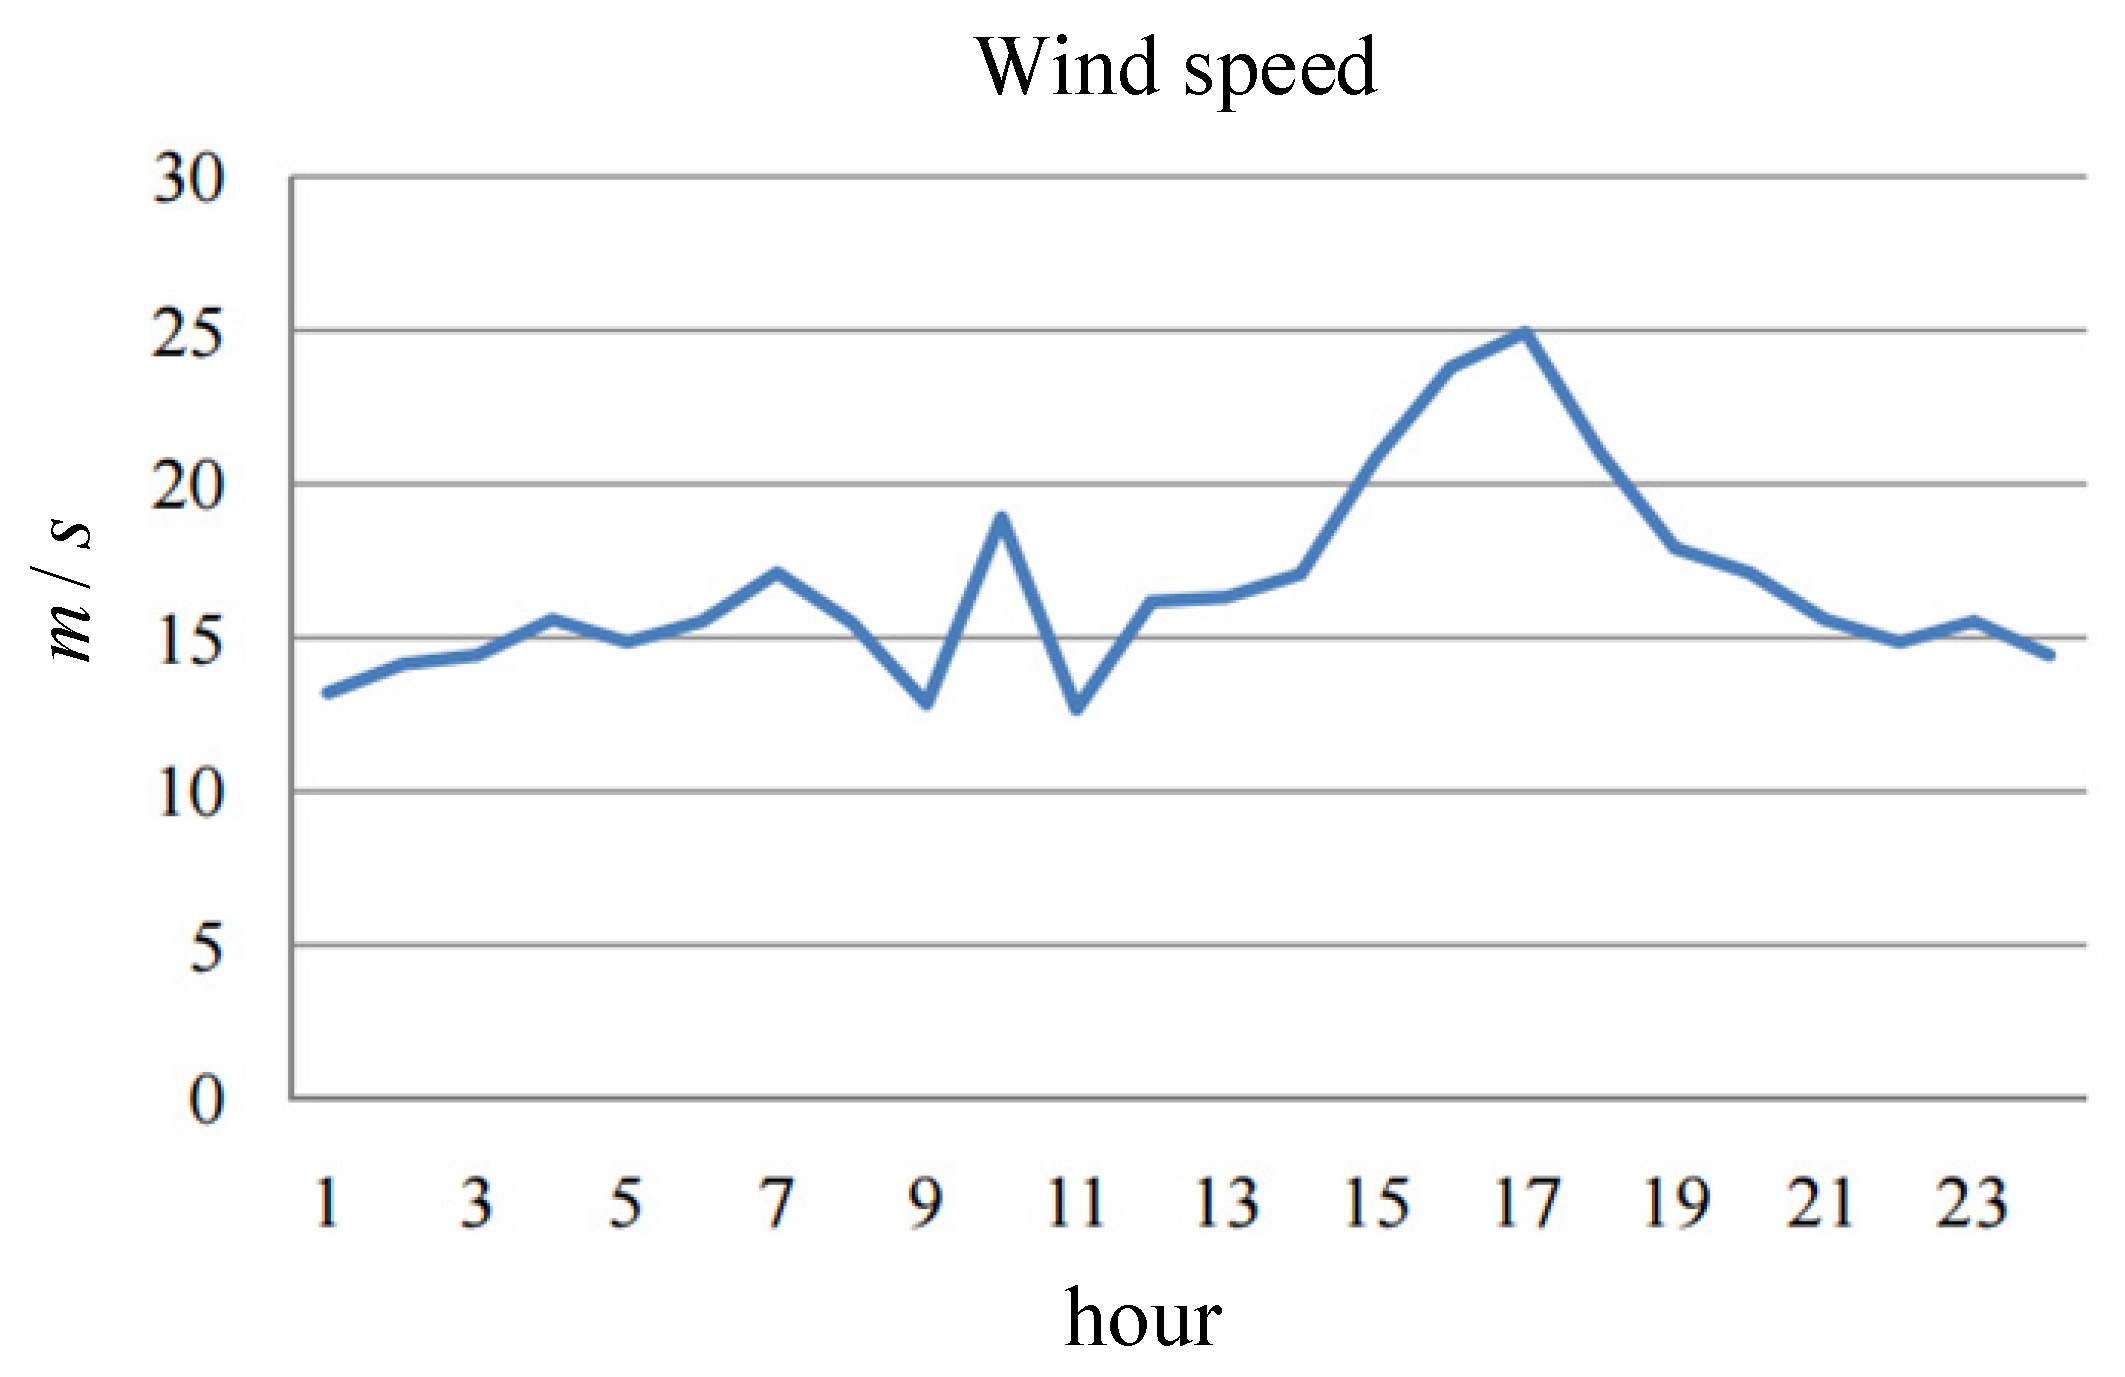
2.2. The Model of the Wind Turbine
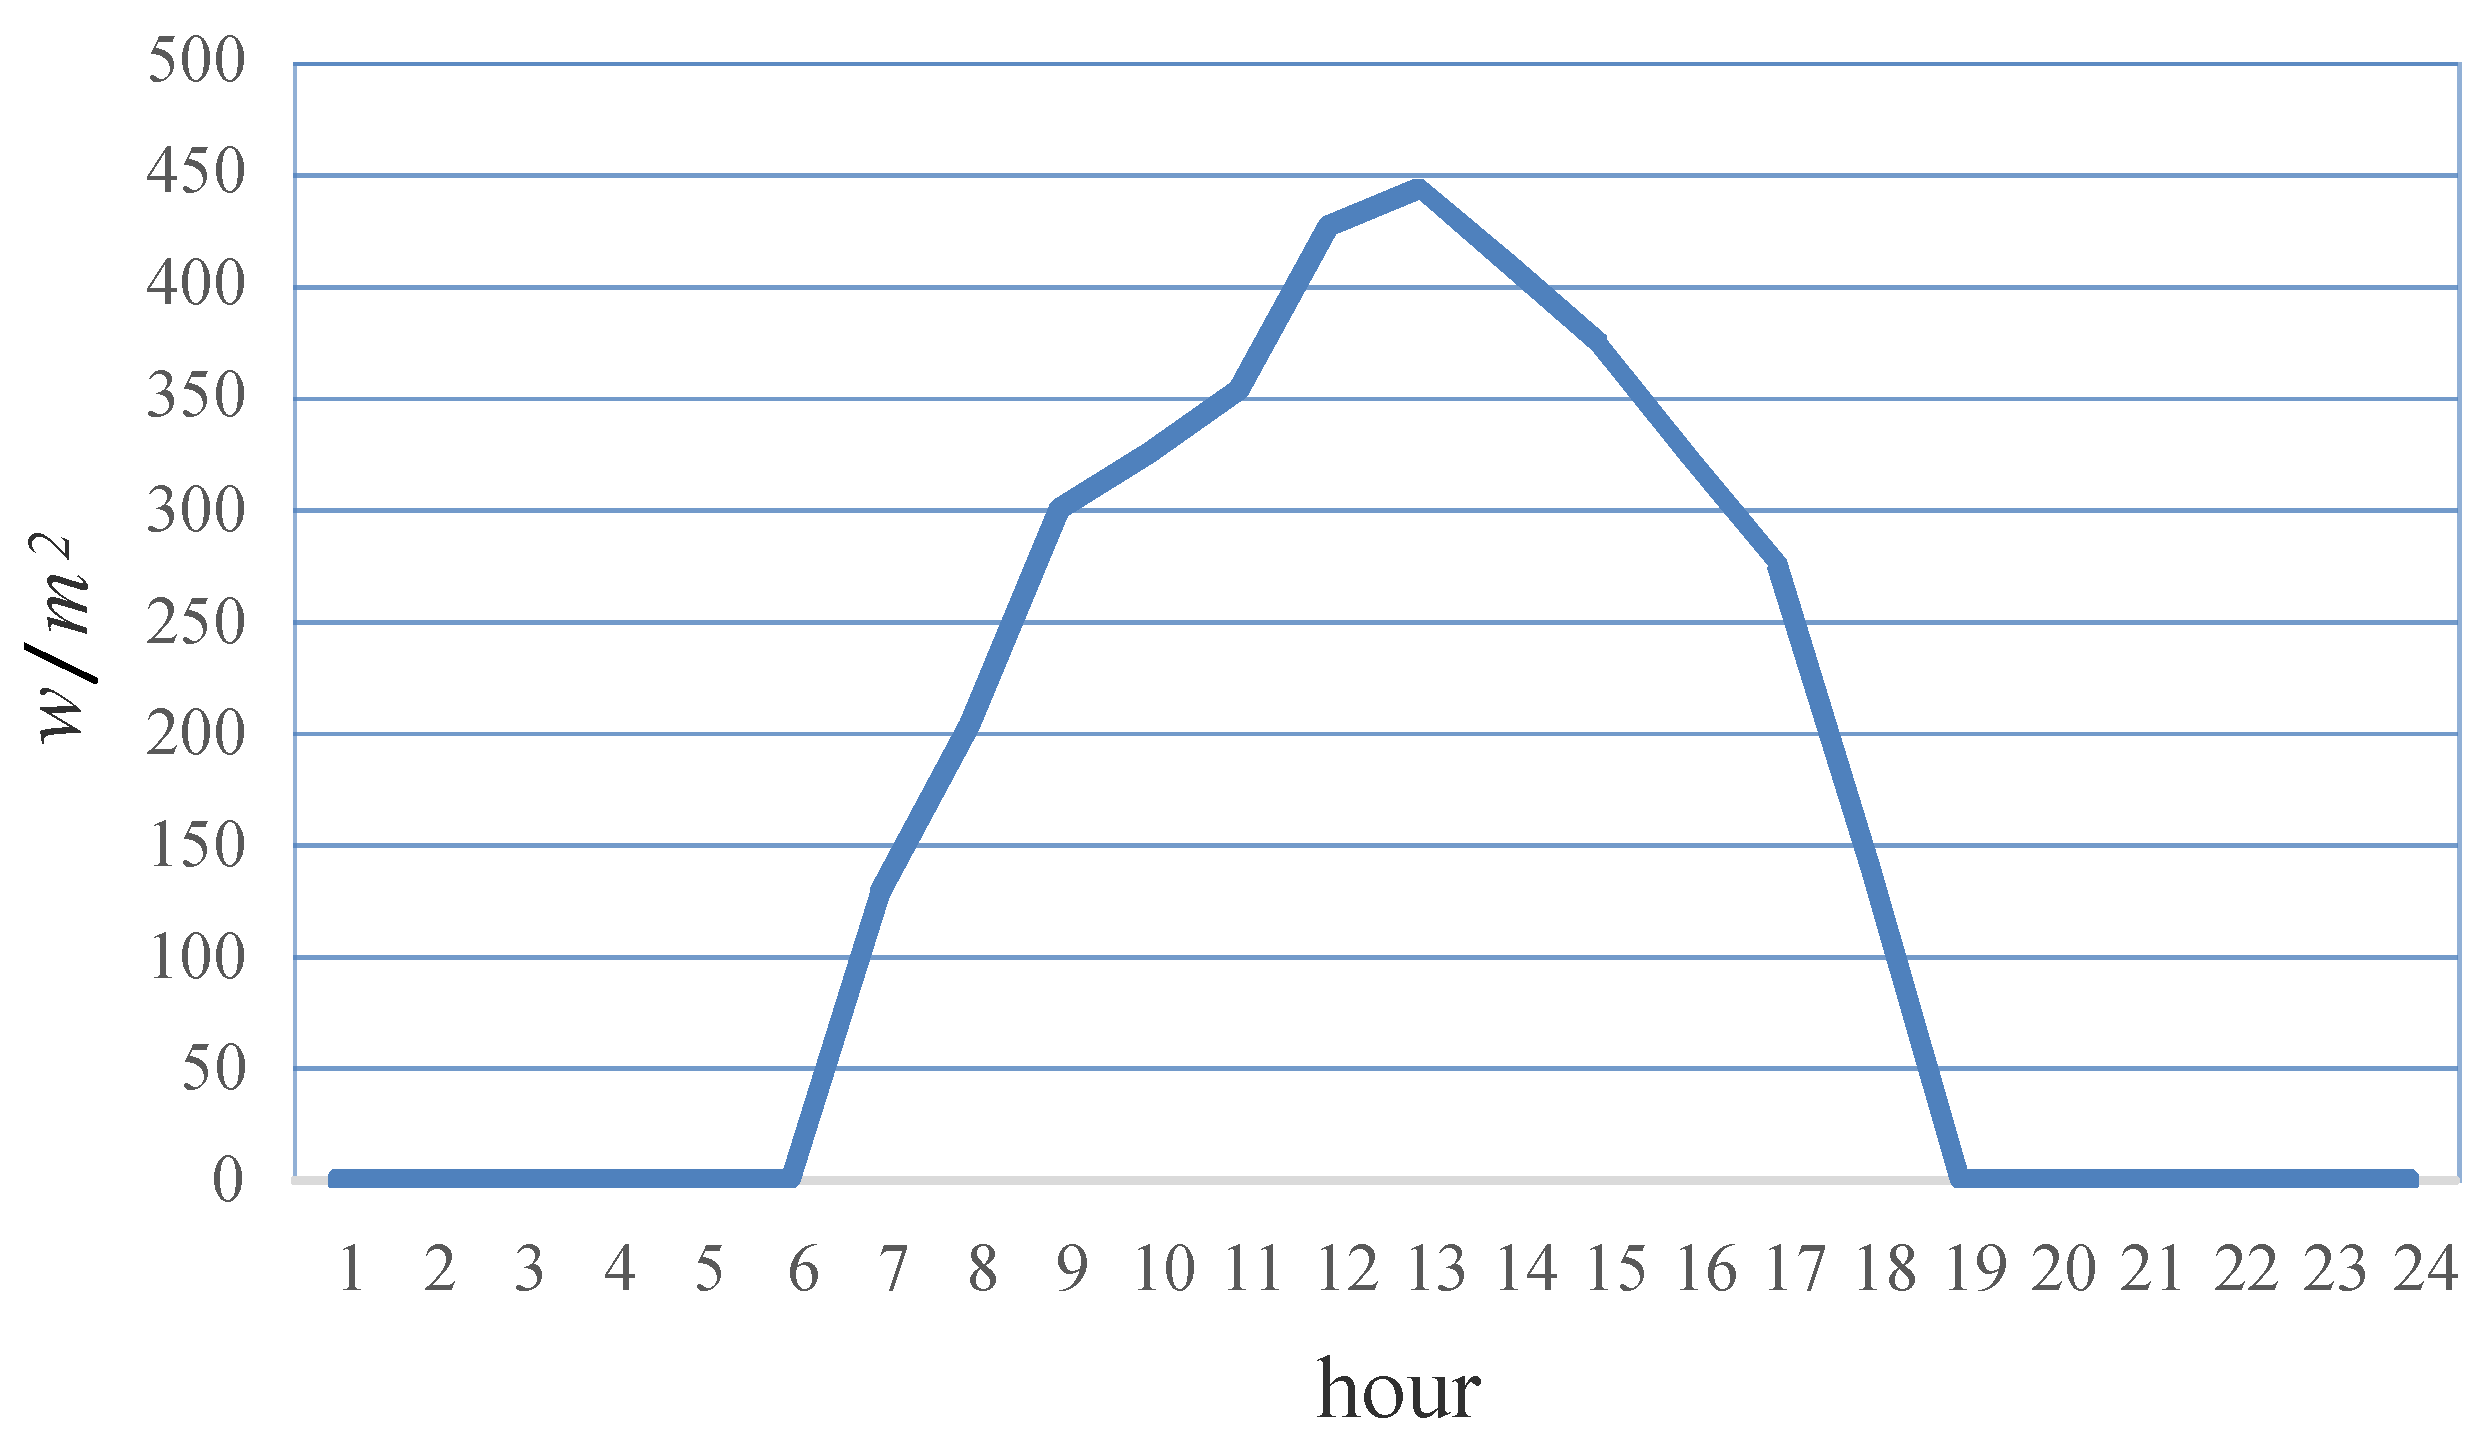
2.3. The Model of the Photovoltaic
2.4. The Model for Battery Storage
3. Problem Formulation
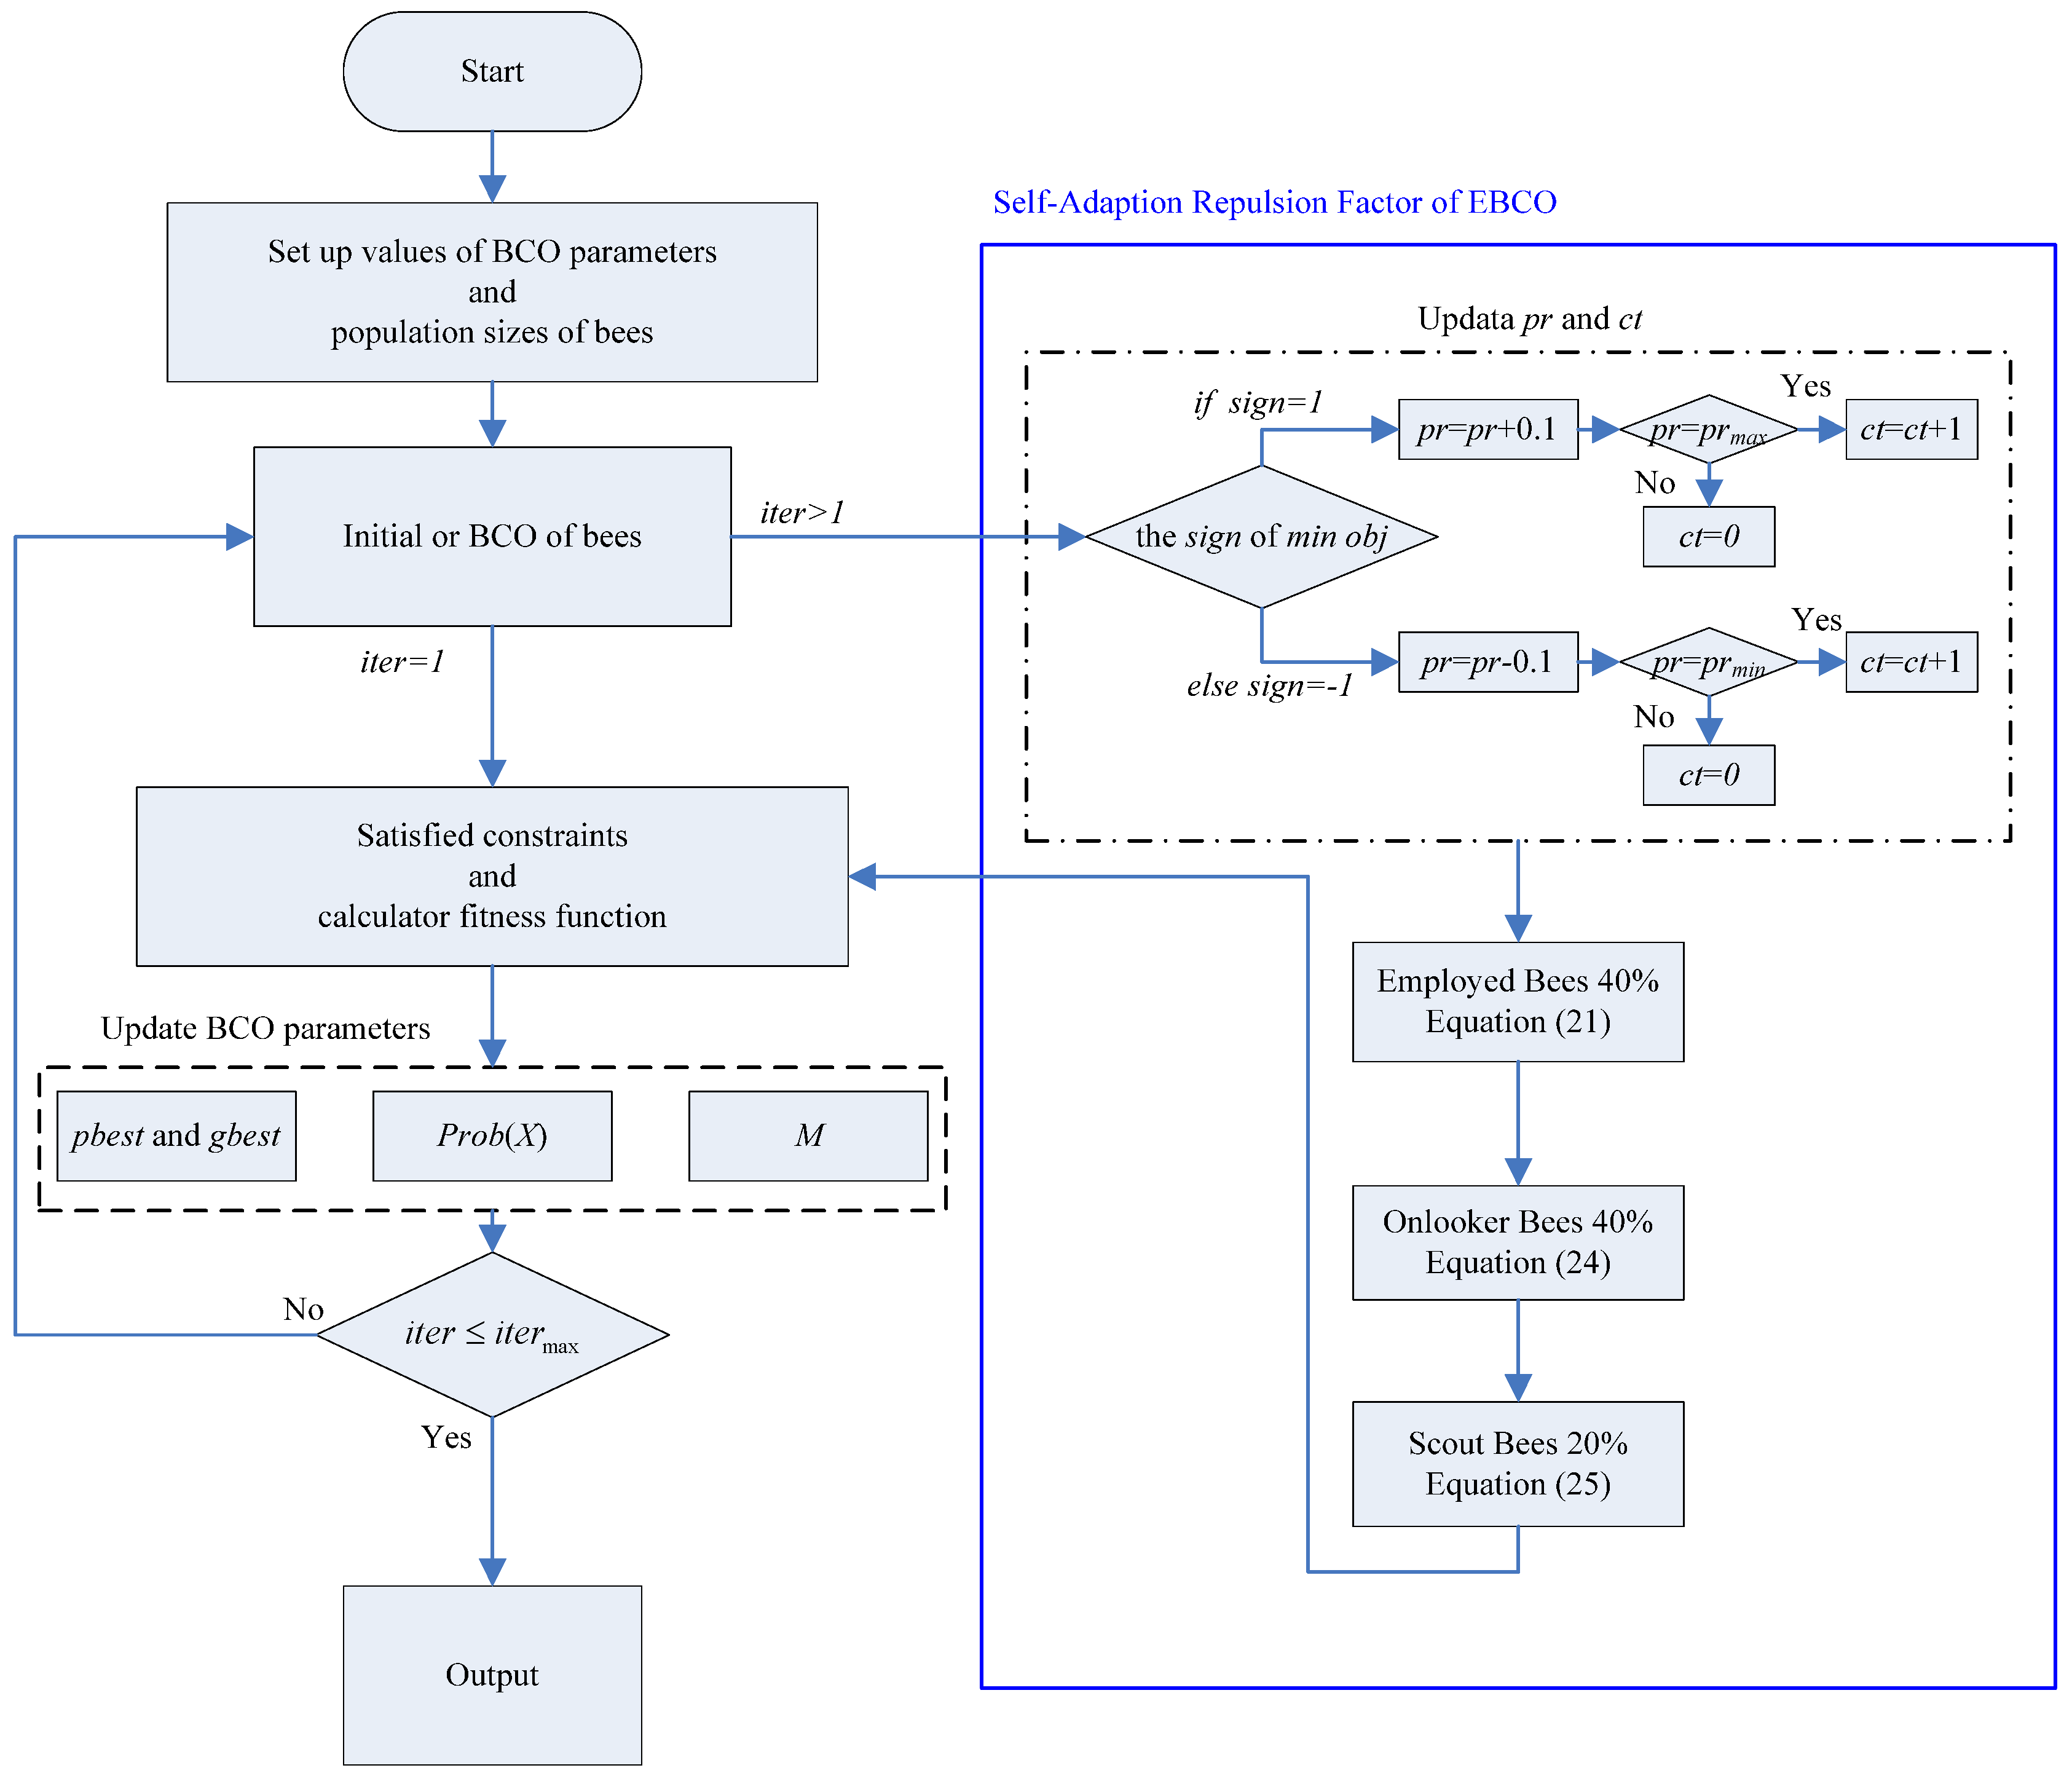
4. Enhanced Bee Colony Optimization
4.1. Initial Solutions
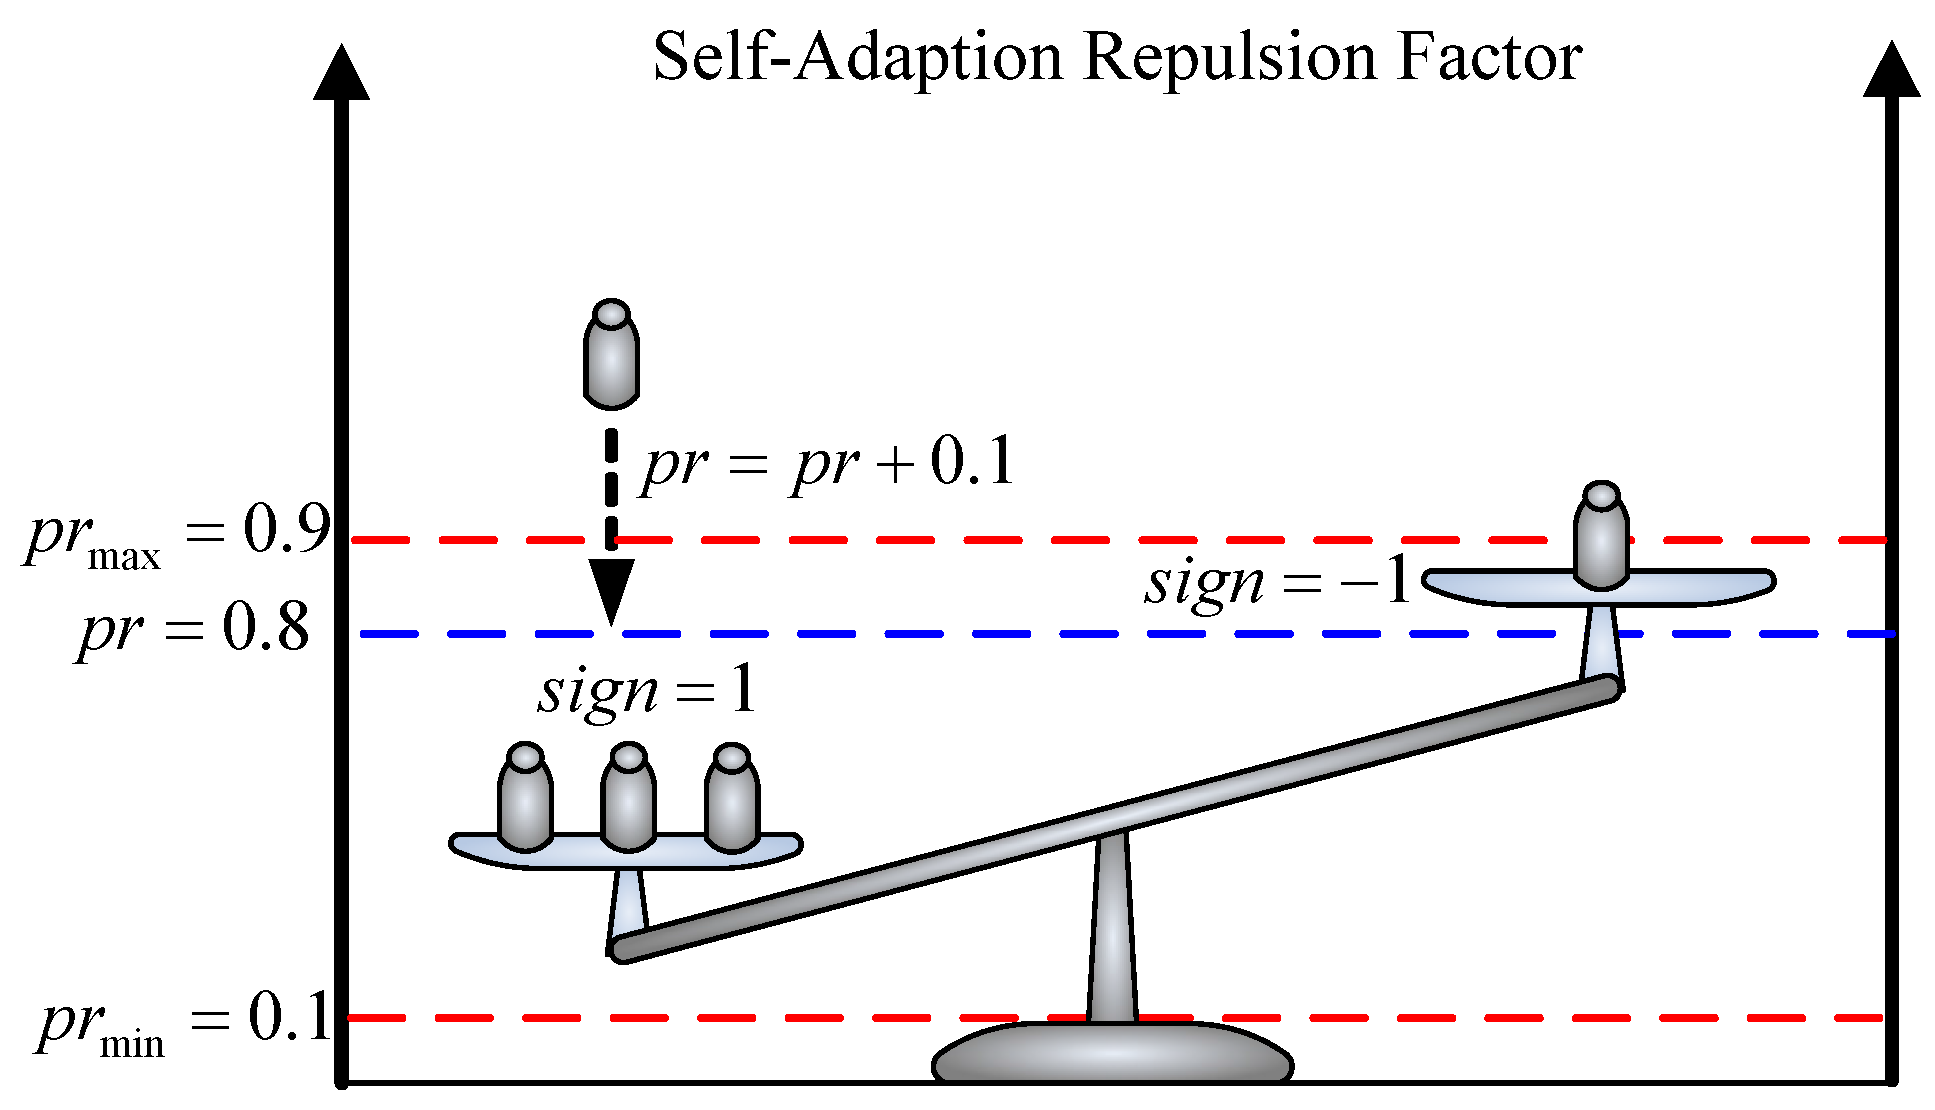
4.2. Employed Bees
| Algorithm 1 Self-adaption repulsion factor search |
| 1: if comes from |
| 2: |
| 3: if then and |
| 4: else |
| 5: if then and |
| 6: else comes from |
| 7: |
| 8: if then and |
| 9: else |
| 10: if then and |
| 11: end |

4.3. Onlooker Bees
4.4. Scout Bees
4.5. Stop Condition
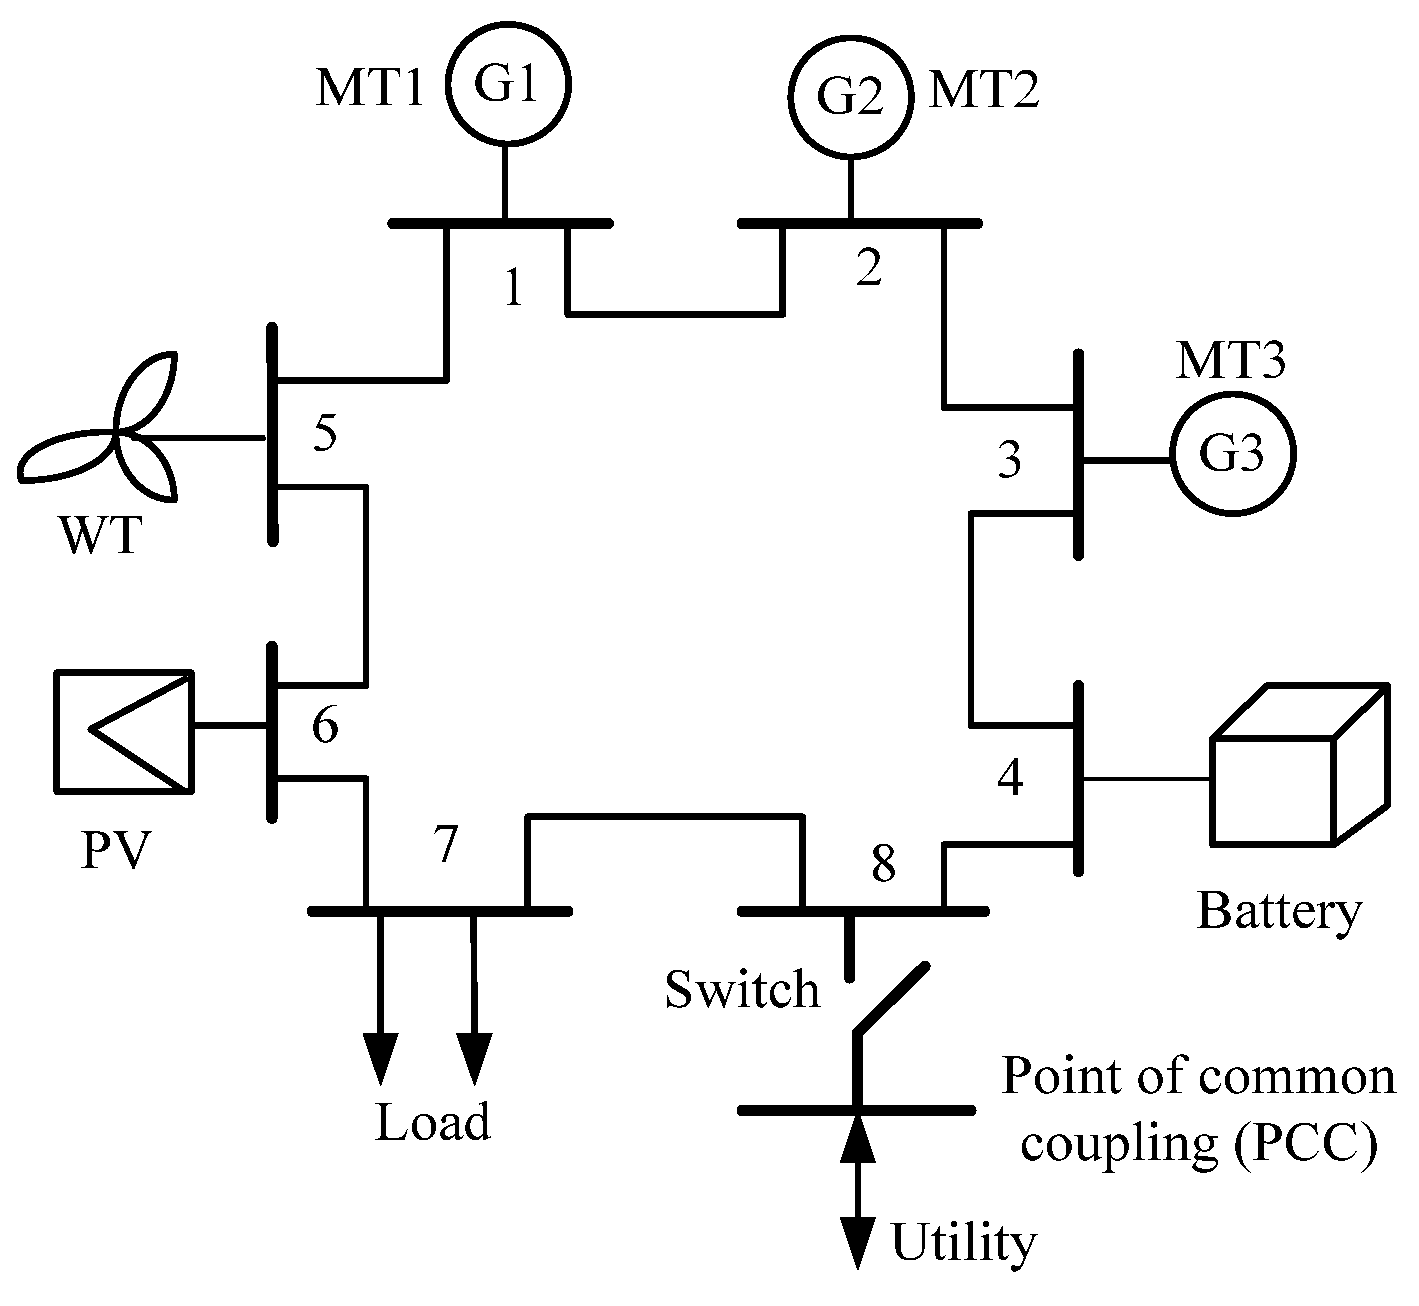
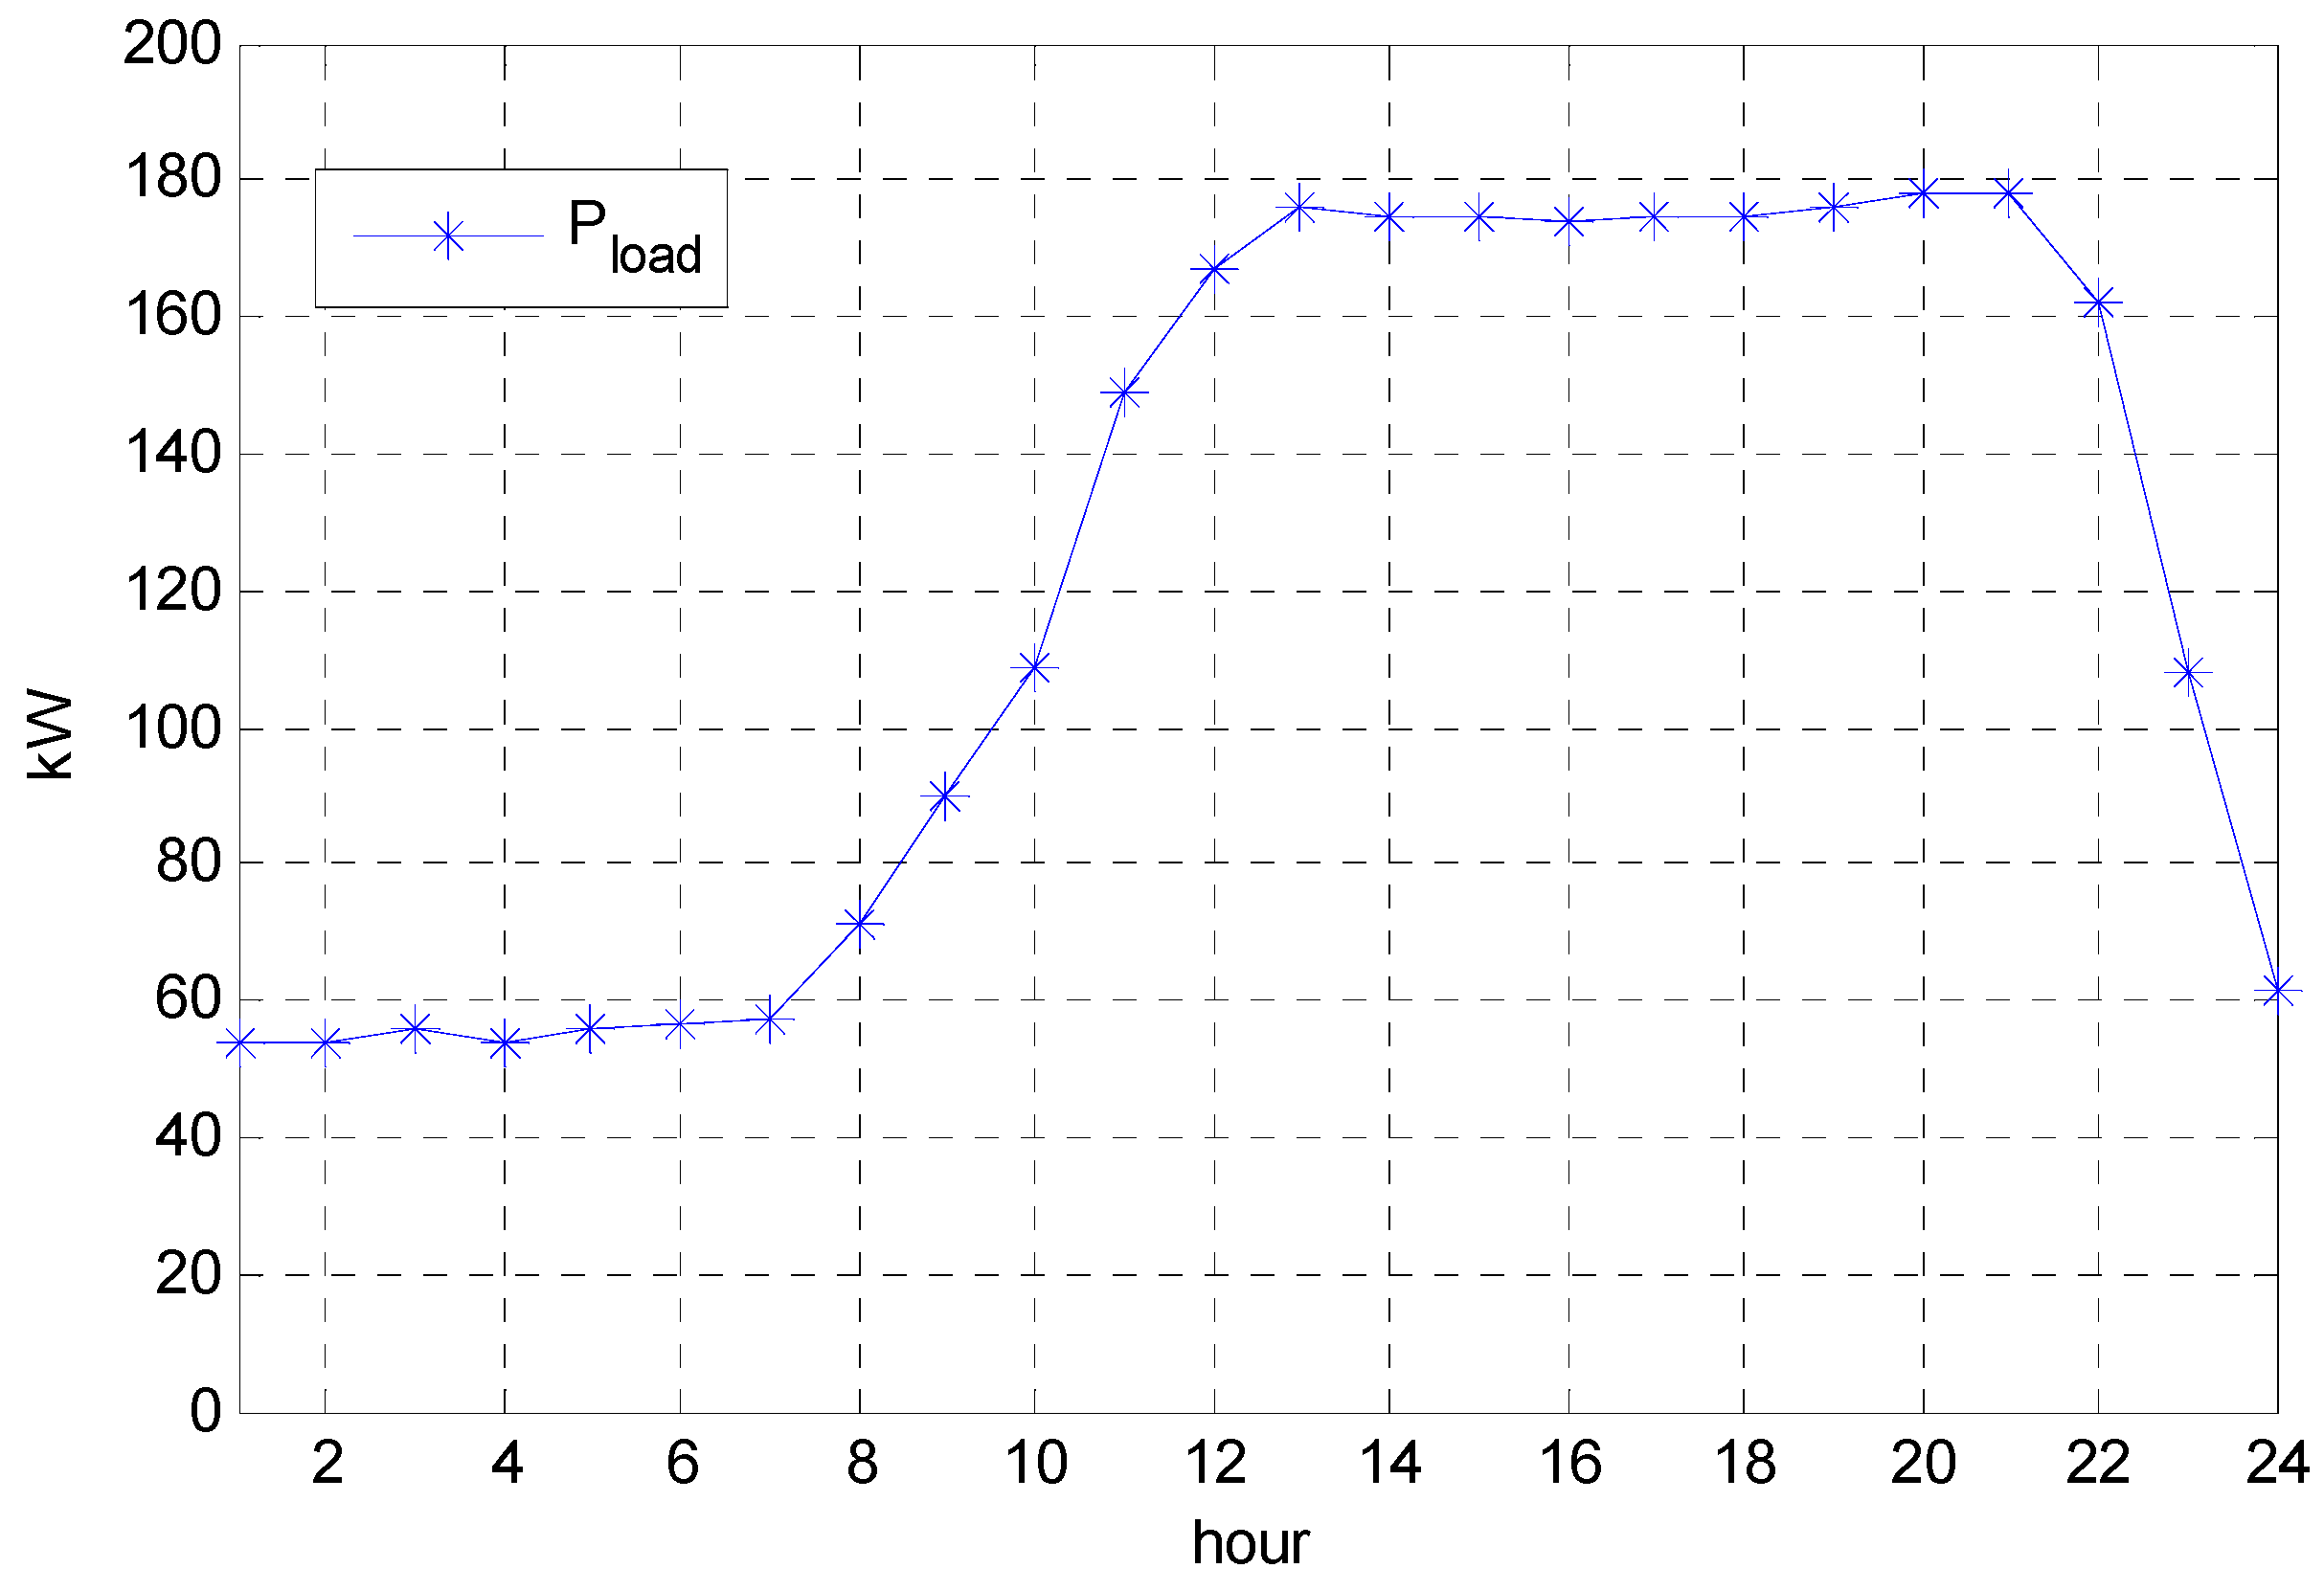
5. Case Studies


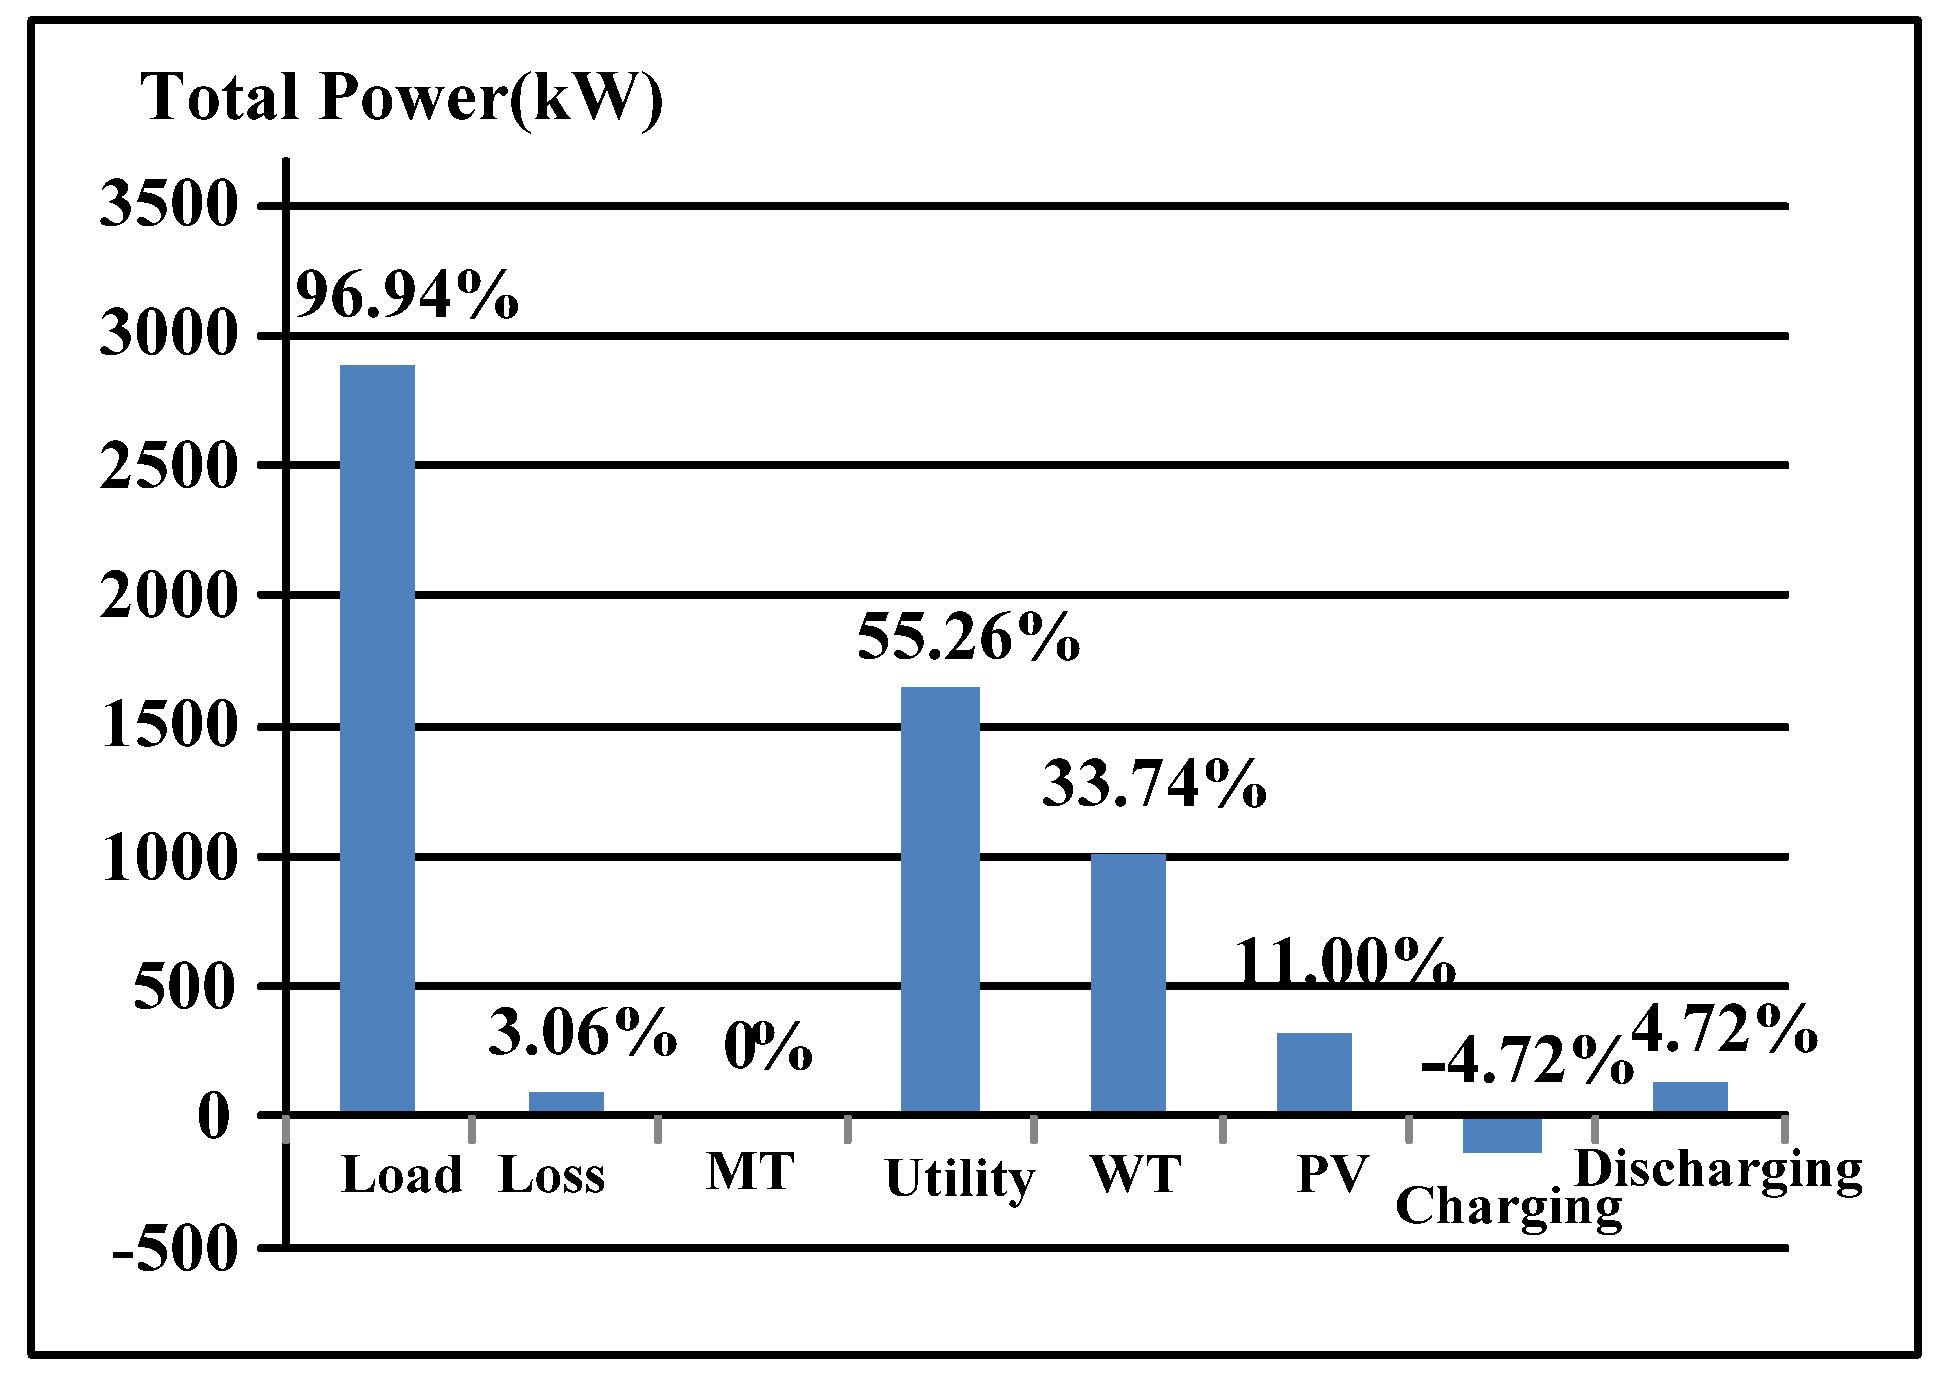
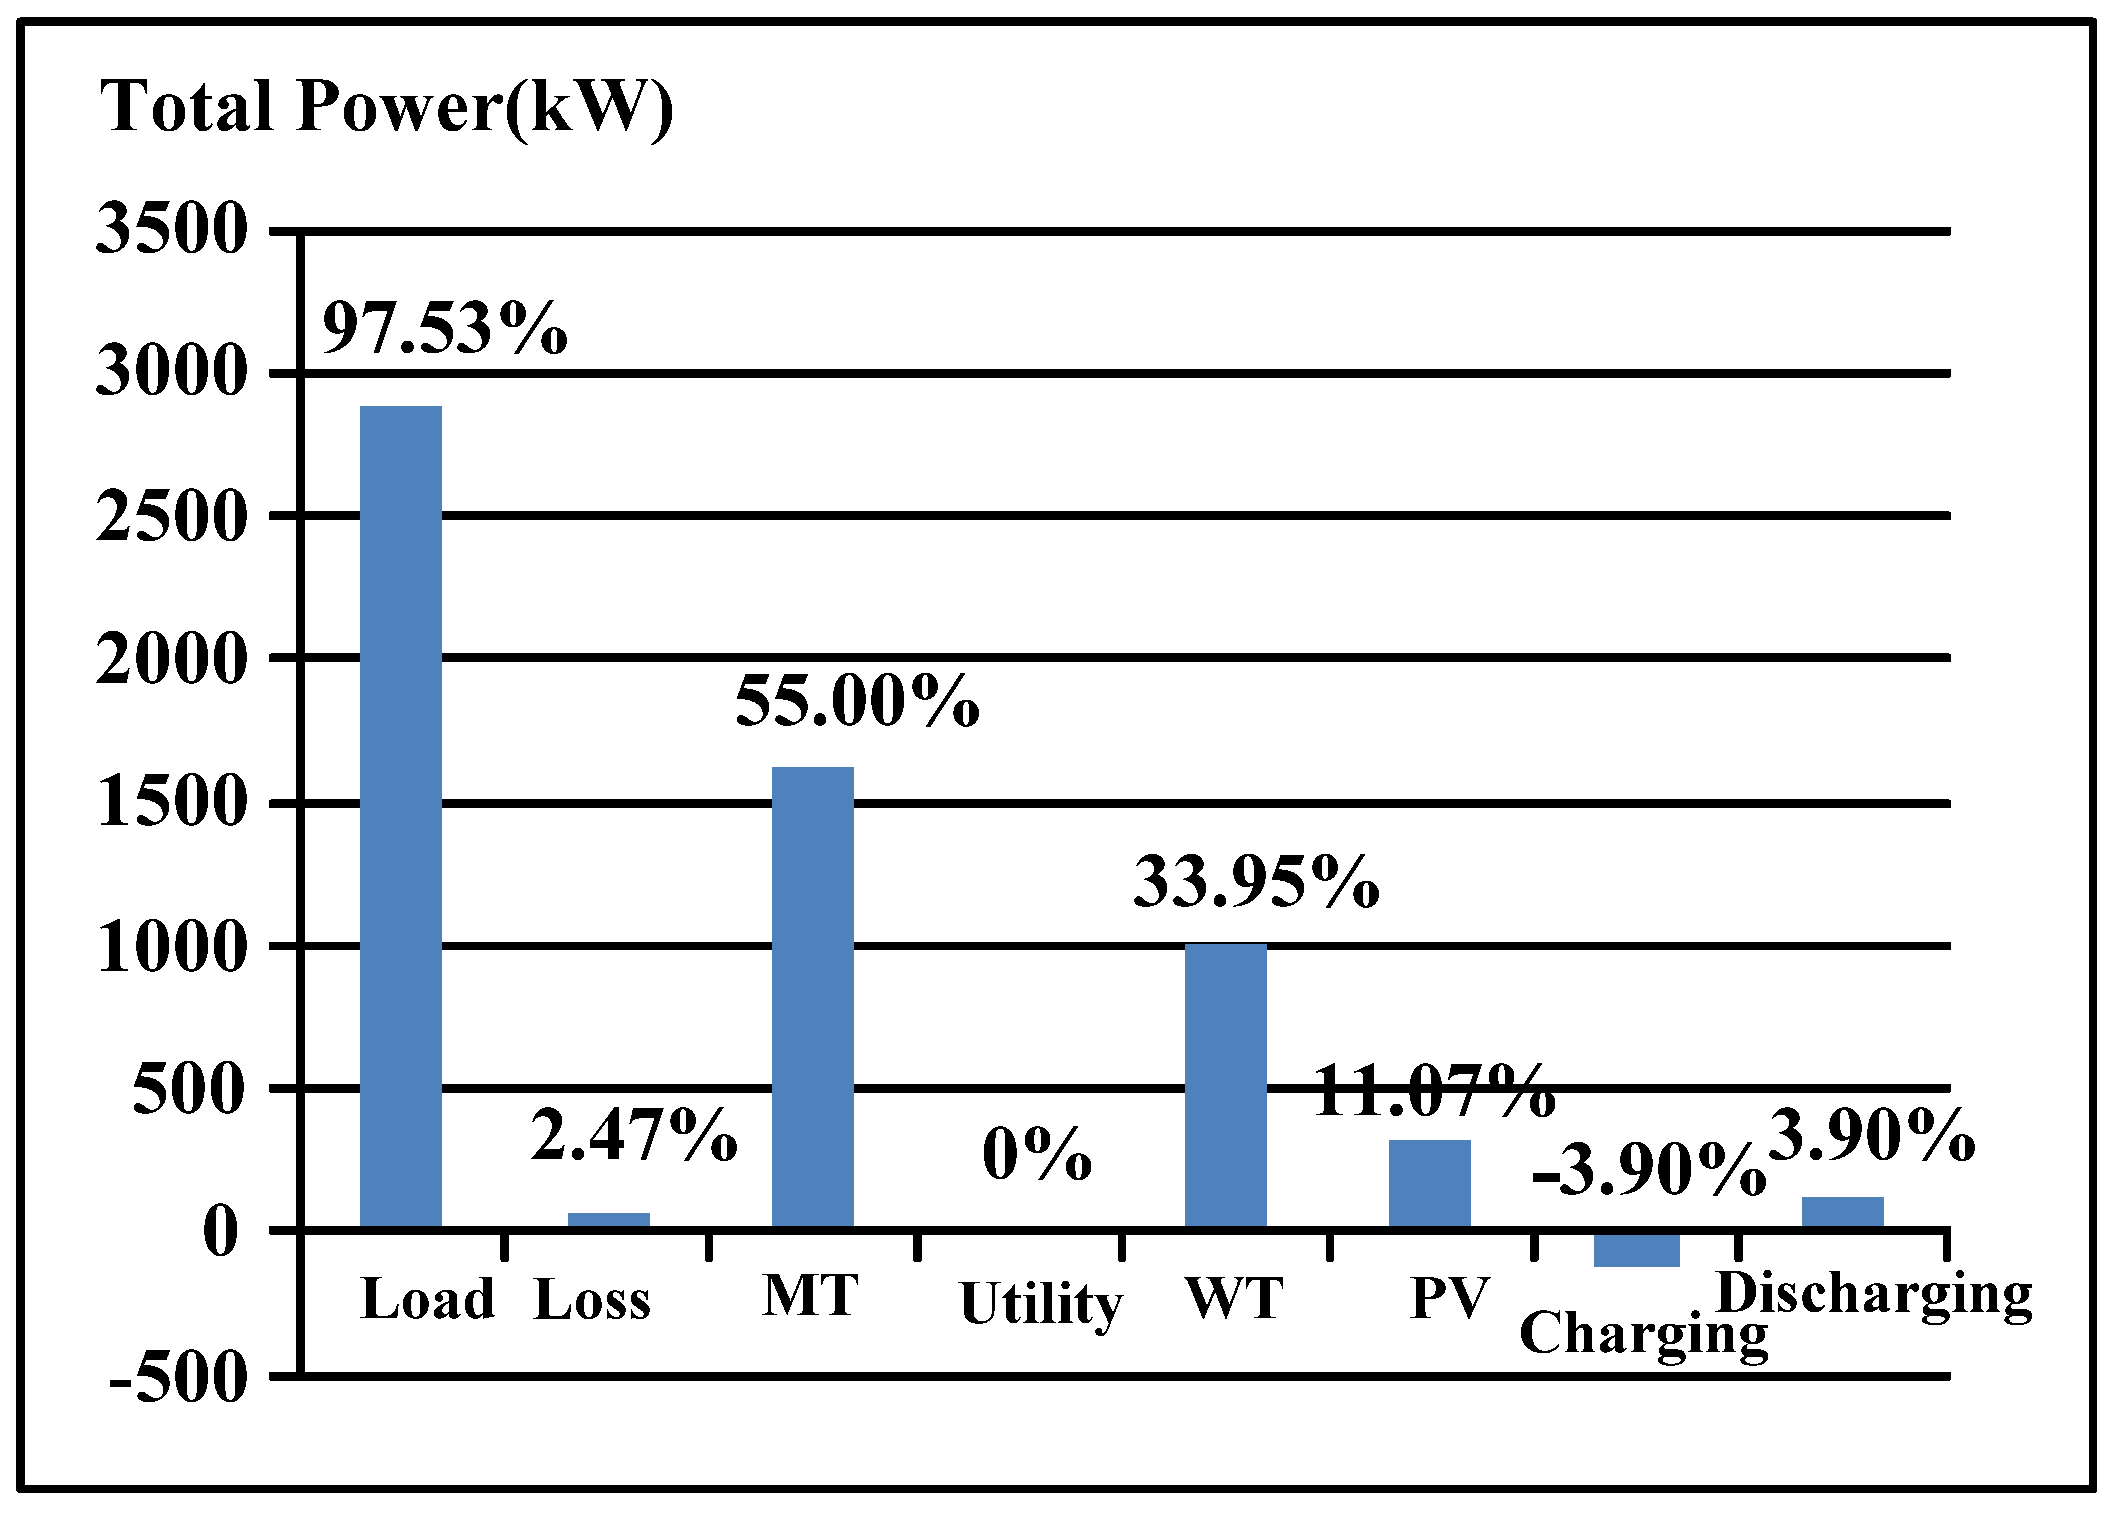
5.1. Results at Different Scenarios


| Item | Grid-Connected Scenario | Stand-Alone Scenario |
|---|---|---|
| Best (NT$) | 5037.031 | 15,925.274 |
| Worst (NT$) | 5048.385 | 15,951.841 |
| Average (NT$) | 5041.457 | 15,936.813 |
| Average number of generations to converge | 150 | 173 |
| Number of trials reaching optimum | 63 | 46 |
| Average execution time (s) | 0.78 | 2.42 |
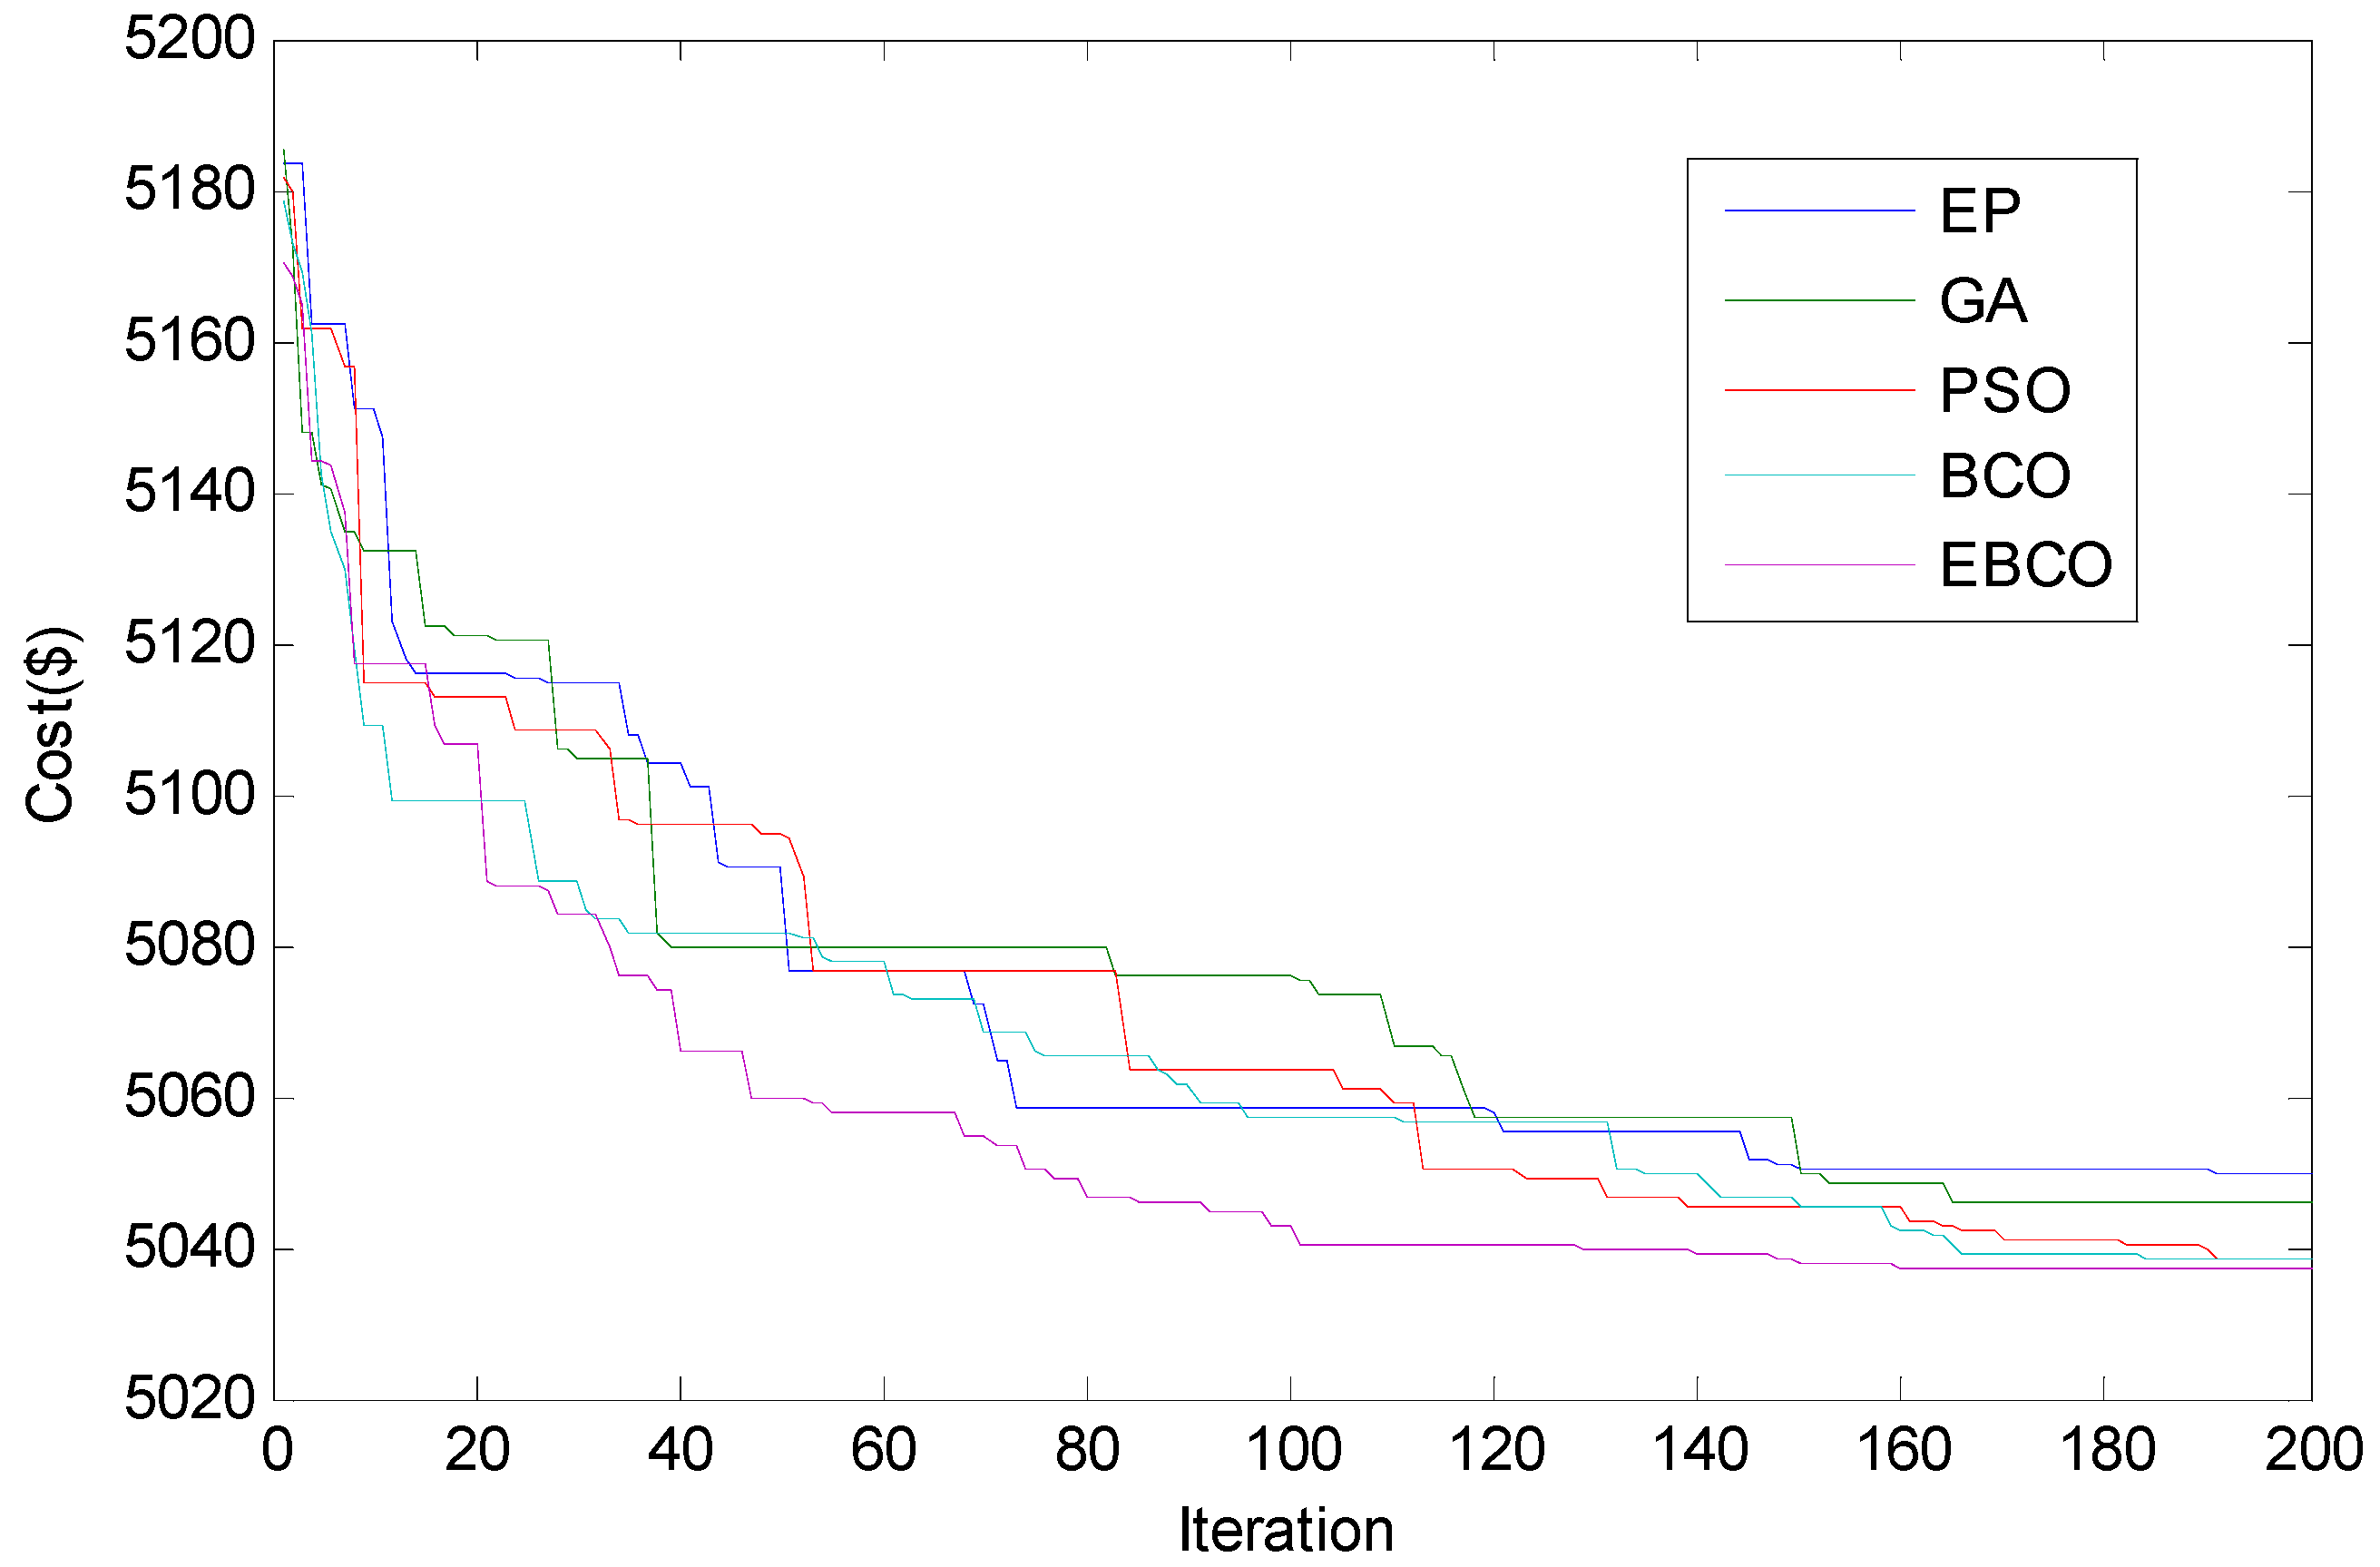
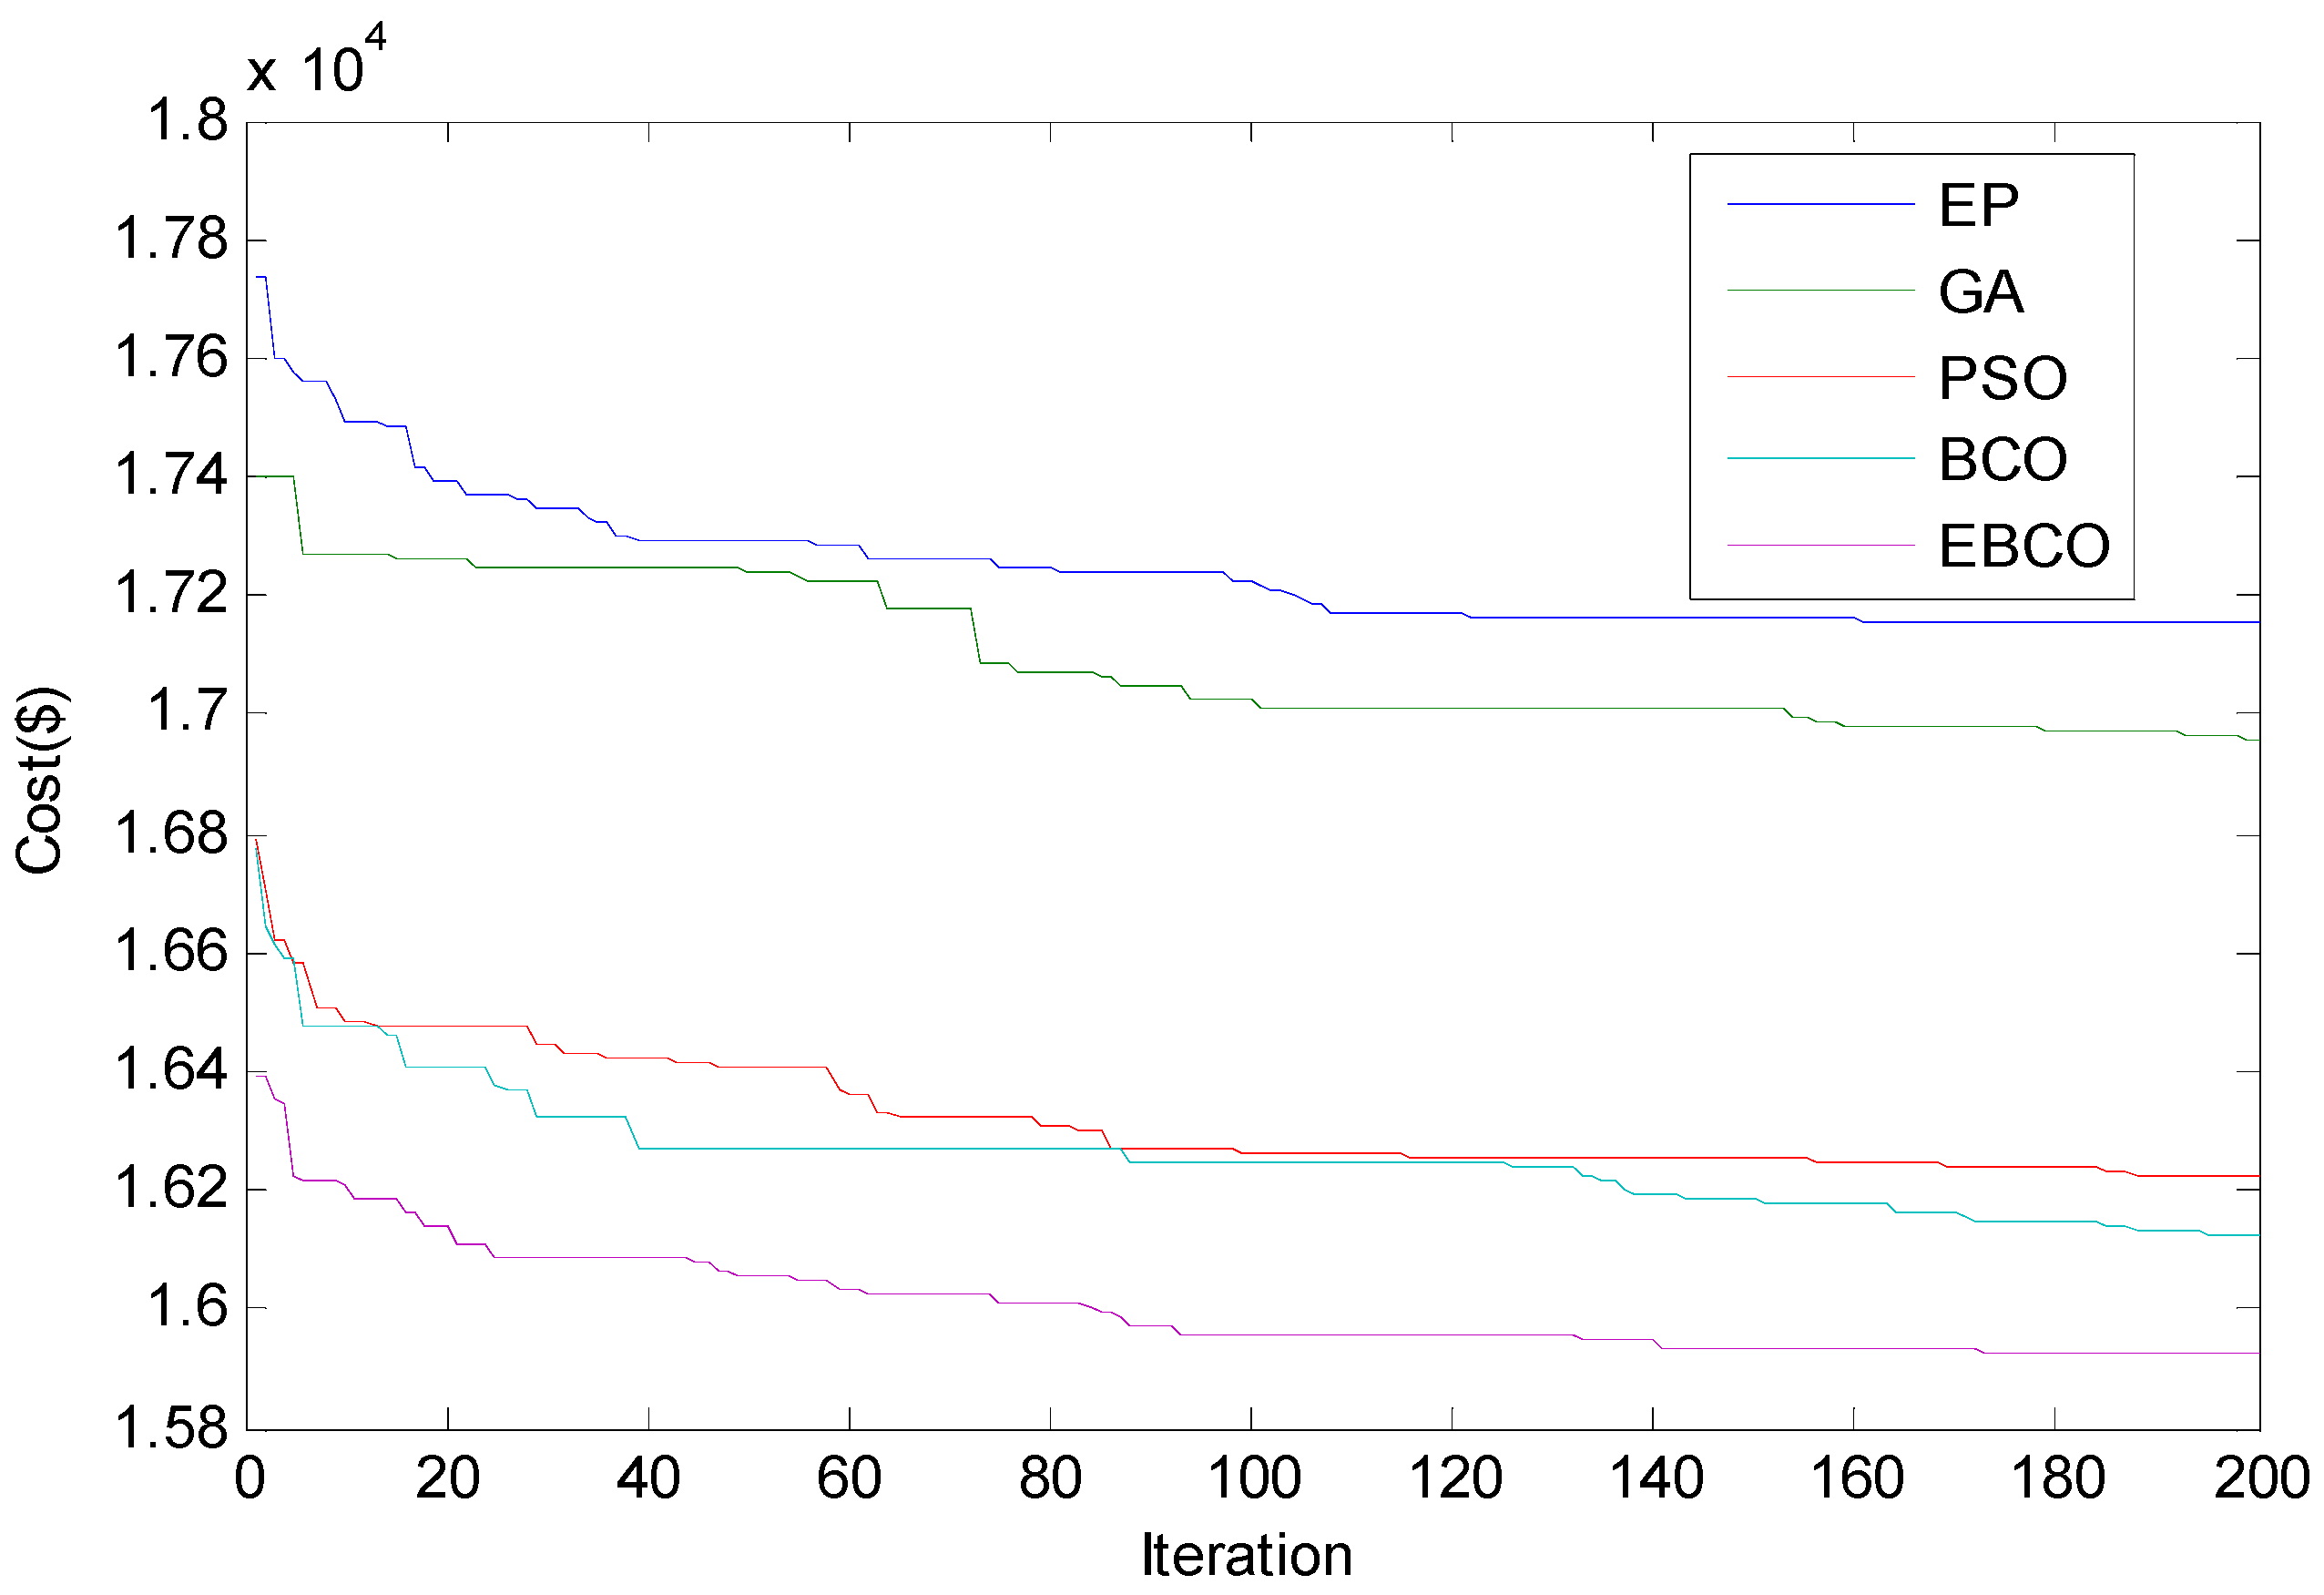
5.2. Convergence Test
| Algorithms | Grid-Connected Scenario (NT$) | Stand-Alone Scenario (NT$) |
|---|---|---|
| EP | 5049.711 | 17,153.754 |
| GA | 5045.813 | 16,958.279 |
| PSO | 5038.196 | 16,224.526 |
| BCO | 5038.209 | 16,122.949 |
| EBCO | 5037.030 | 15,925.270 |
5.3. Robustness Test
| Algorithm | Maximal Converged Cost (NT$) | Minimal Converged Cost (NT$) | Average Converged Cost (NT$) | Average Number of Generations to Converge | Number of Trials Reaching Optimum | Average Execution Time (s) |
|---|---|---|---|---|---|---|
| EP | 5074.095 | 5049.711 | 5060.149 | 191 | 4 | 0.56 |
| GA | 5067.188 | 5045.813 | 5054.248 | 193 | 6 | 1.53 |
| PSO | 5053.567 | 5038.209 | 5047.794 | 190 | 45 | 0.67 |
| BCO | 5051.554 | 5038.196 | 5046.624 | 169 | 42 | 0.72 |
| EBCO | 5048.385 | 5037.030 | 5041.457 | 150 | 64 | 0.78 |
| Algorithm | Maximal Converged Cost (NT$) | Minimal Converged Cost (NT$) | Average Converged Cost (NT$) | Average Number of Generations to Converge | Number of Trials Reaching Optimum | Average Execution Time (s) |
|---|---|---|---|---|---|---|
| EP | 17,382.375 | 17,153.754 | 17,266.188 | 197 | 1 | 1.68 |
| GA | 17,186.573 | 16,958.279 | 17,010.570 | 198 | 2 | 5.94 |
| PSO | 16,391.596 | 16,224.526 | 16,286.286 | 191 | 26 | 2.18 |
| BCO | 16,279.849 | 16,122.949 | 16,164.635 | 187 | 31 | 2.23 |
| EBCO | 15,951.841 | 15,925.270 | 15,936.813 | 173 | 46 | 2.42 |
6. Conclusions
Acknowledgments
Author Contributions
Conflicts of Interest
Nomenclature
| GHG | greenhouse gas |
| DG | distributed generator |
| MINLP | mixed-integer nonlinear programming |
| ESS | energy storage system |
| MABC | multi-period artificial bee colony |
| RTO | real-time operation |
| EBCO | enhanced bee colony optimization |
| EP | evolutionary programming |
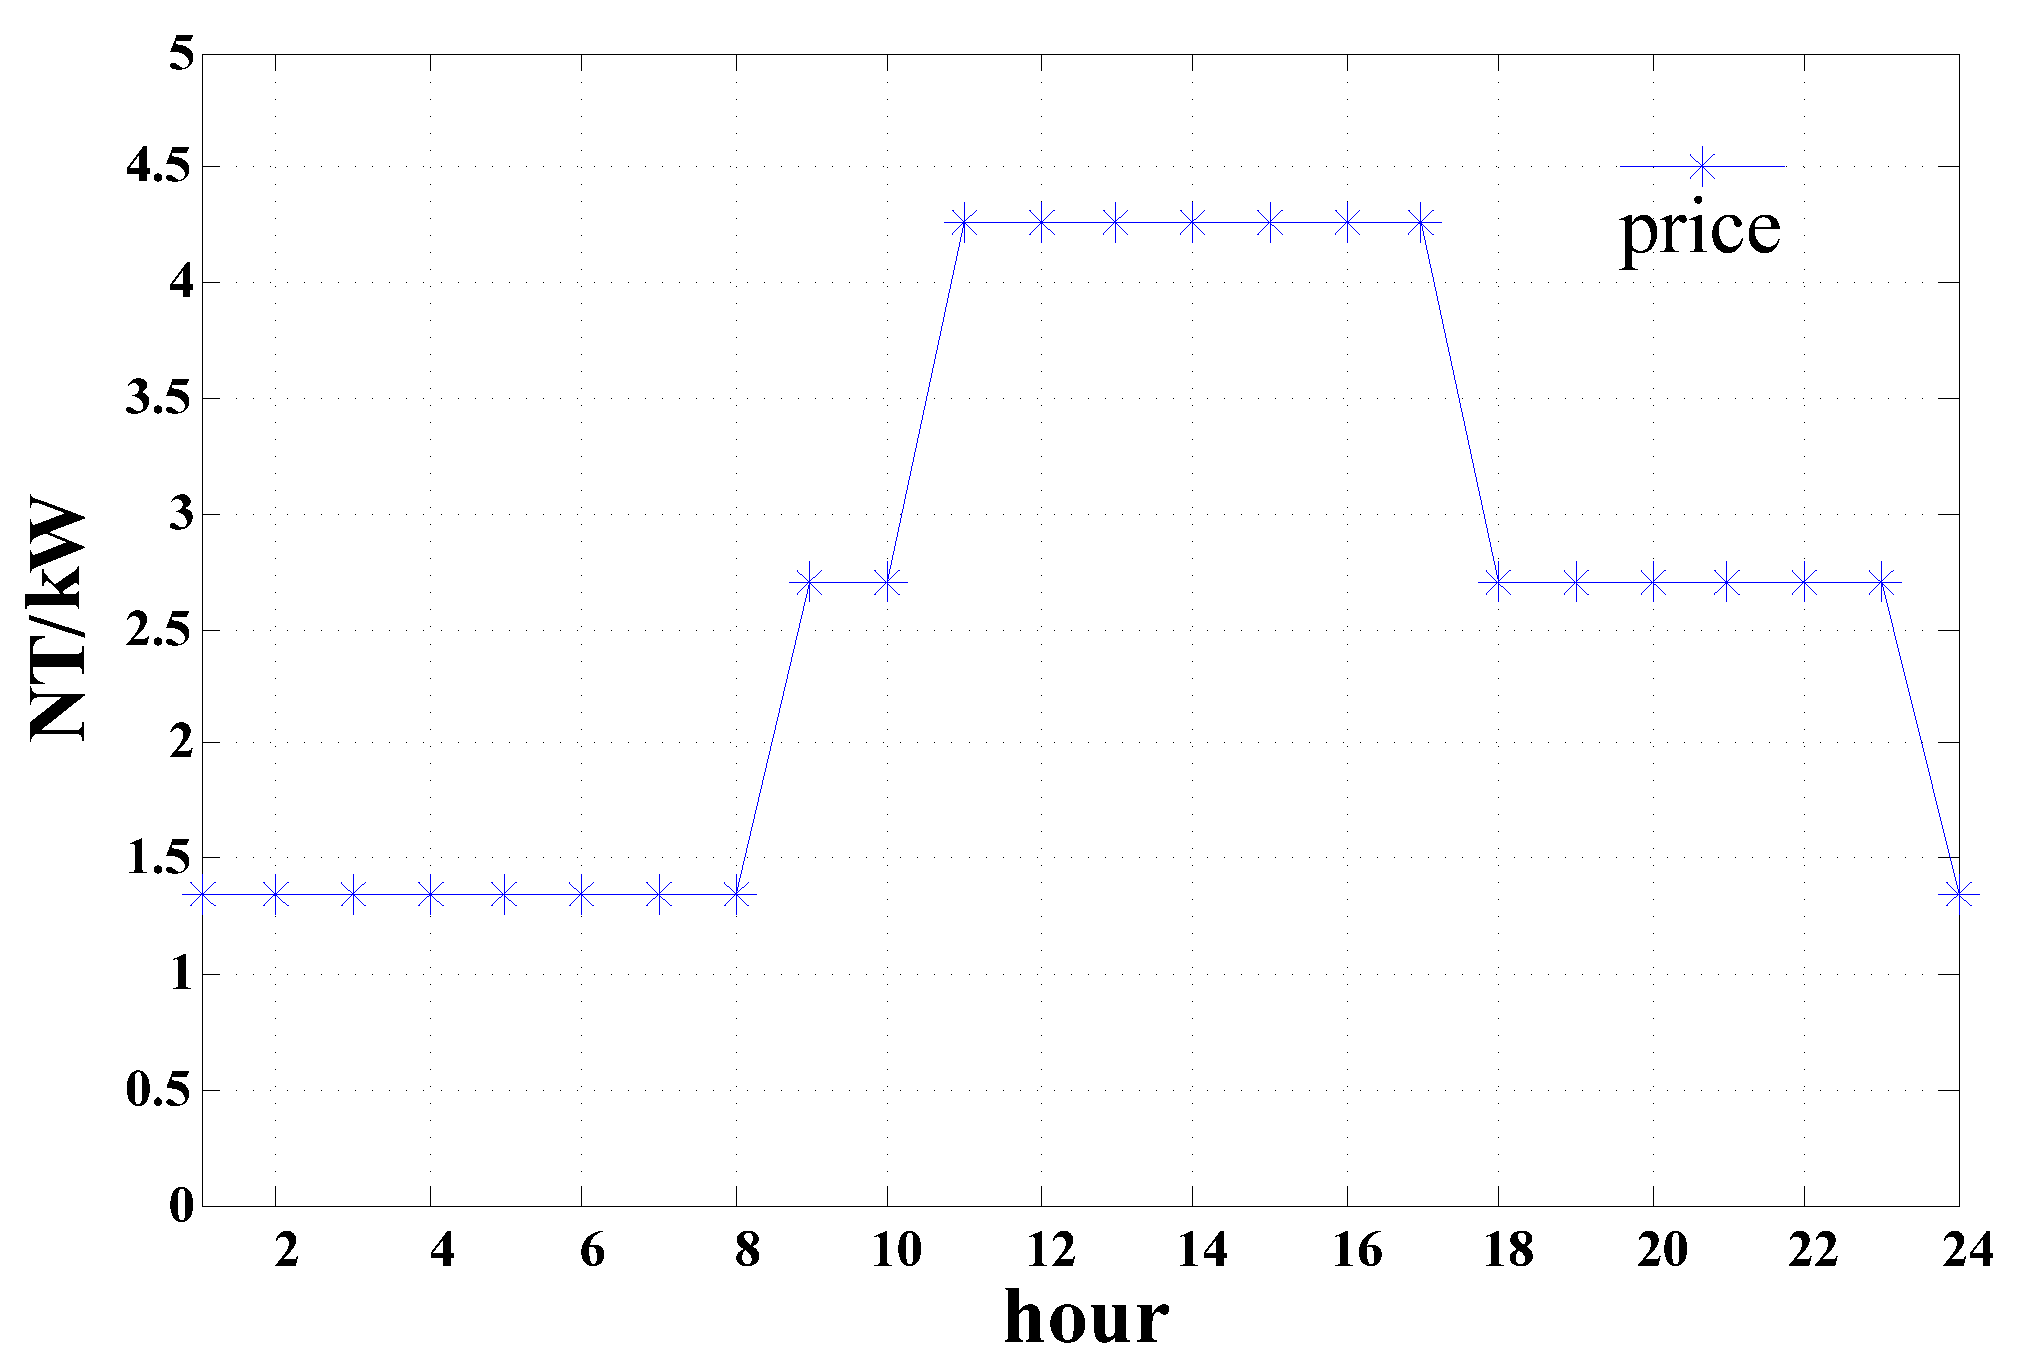
| TOU | time-of-use |
| the scheduling time | |
| the total number of micro gas turbines | |
| WT | wind turbine |
| PV | photovoltaic |
| MT | micro-turbine |
| MG | microgrid |
| ANN | artificial neural network |
| BCO | bee colony optimization |
| GA | genetic algorithm |
| PSO | particle swarm optimization |
| PCC | point of common coupling |
| the on/off status of unit i at time t | |
| / | ramp up/down limit of unit i |
| Pw(t) | power output from the wind turbine at time t |
| ρ | air density (kg/m3) |
| Cp | the performance coefficient of wind power |
| the area covered by the rotor (m2) | |
| the wind speed (m/s) at time t | |
| the tip speed ratio | |
| the pitch angle of rotor blades (deg) | |
| the current wind speed (m/s) at time t | |
| the start wind speed (m/s) | |
| the rated wind speed (m/s) | |
| the stop wind speed (m/s) | |
| the electricity purchased from or sold to the utility at time t | |
| the TOU rates | |
| the total system transmission loss at time t | |
| / | the minimum/maximum generation limits of unit i |
| / | the minimum up-time/down-time of unit i |
| / | continued up-time/down-time of unit i |
| active power bought/sold from/to the utility at time t | |
| / | minimum/maximum active power production of the utility at time t |
| the storage capacity of the battery at time t | |
| / | the minimum/maximum storage capacity of the battery |
References
- Hvelplund, F. Renewable energy and the need for local energy markets. Energy 2006, 31, 2293–2302. [Google Scholar] [CrossRef]
- Huang, J.; Jiang, C.; Xu, X. A review on distributed energy resources and Microgrid. Renew. Sustain. Energy Rev. 2008, 12, 2472–2483. [Google Scholar]
- Katiraei, F.; Iravani, R.; Hatziargyriou, N.; Dimeas, A. Microgrids management. IEEE Power Energy Mag. 2008, 6, 54–65. [Google Scholar] [CrossRef]
- Faber, I.; Lane, W.; Pak, W.; Prakel, M.; Rocha, C.; Farr, J.V. Micro-energy markets: The role of a consumer preference pricing strategy on microgrid energy investment. Energy 2014, 74, 567–575. [Google Scholar] [CrossRef]
- Zhang, L.; Gari, N.; Hmurcik, L.V. Energy management in a microgrid with distributed energy resources. Energy Convers. Manag. 2014, 78, 297–305. [Google Scholar] [CrossRef]
- Zhao, B.; Dong, X.; Luan, W.; Bornemann, X. Short-term operation scheduling in renewable-powered microgrids: A duality-based approach. IEEE Trans. Sustain. Energy 2014, 5, 209–217. [Google Scholar] [CrossRef]
- Jiang, Q.; Xue, M.; Geng, G. Energy management of microgrid in grid-connected and stand-alone modes. IEEE Trans. Power Syst. 2013, 28, 3380–3389. [Google Scholar] [CrossRef]
- Ahn, S.J.; Nam, S.R.; Choi, J.H.; Moon, S.I. Power scheduling of distributed generators for economic and stable operation of a microgrid. IEEE Trans. Smart Grid 2013, 4, 398–405. [Google Scholar] [CrossRef]
- Rémy, R.M.; Bruno, S.; Xavier, R.; Christophe, T. Optimal power dispatching strategies in smart-microgrids with storage. Renew. Sustain. Energy Rev. 2014, 40, 649–658. [Google Scholar]
- Gabbar, H.A.; Abdelsalam, A.A. Microgrid energy management in grid-connected and islanding modes based on SVC. Energy Convers. Manag. 2014, 86, 964–972. [Google Scholar] [CrossRef]
- Basu, A.K.; Chowdhury, S.P.; Chowdhury, S.; Paul, S. Microgrids: Energy management by strategic deployment of DERs—A comprehensive survey. Renew. Sustain. Energy Rev. 2011, 15, 4348–4356. [Google Scholar] [CrossRef]
- Mazidi, M.; Zakariazadeh, A.; Jadid, S.; Siano, P. Integrated scheduling of renewable generation and demand response programs in a microgrid. Energy Convers. Manag. 2014, 86, 1118–1127. [Google Scholar] [CrossRef]
- Moghaddam, A.A.; Seifi, A.; Niknam, T.; Pahlavani, M.R.A. Multi-objective operation management of a renewable MG (micro-grid) with back-up micro-turbine/fuel cell/battery hybrid power source. Energy 2011, 36, 6490–6507. [Google Scholar] [CrossRef]
- Mohammadi, S.; Soleymani, S.; Mozafari, B. Scenario-based stochastic operation management of microgrid including wind, photovoltaic, micro-turbine, fuel cell and energy storage devices. Int. J. Electr. Power Energy Syst. 2014, 54, 525–535. [Google Scholar] [CrossRef]
- Cau, G.; Cocco, D.; Ptrollese, M.; Kær, S.K.; Milan, C. Energy management strategy based on short-term generation scheduling for a renewable microgrid using a hydrogen storage system. Energy Convers. Manag. 2014, 87, 820–831. [Google Scholar] [CrossRef]
- Silva, M.; Morais, H.; Vale, Z. An integrated approach for distributed energy resource short-term scheduling in smart grids considering realistic power system simulation. Energy Convers. Manag. 2012, 64, 273–288. [Google Scholar] [CrossRef]
- Chen, C.; Duan, S.; Cai, T.; Liu, B.; Hu, G. Smart energy management system for optimal microgrid economic operation. IET Renew. Power Gener. 2011, 5, 258–267. [Google Scholar] [CrossRef]
- Zhong, H.; Xia, Q.; Xia, Y.; Kang, C.; Xie, L. Integrated dispatch of generation and load: A pathway towards smart grids. Electr. Power Syst. Res. 2015, 120, 206–213. [Google Scholar] [CrossRef]
- Wu, H.; Liu, X.; Ding, M. Dynamic economic of a microgrid: Mathematical models and solution algorithm. Int. J. Electr. Power Energy Syst. 2014, 63, 336–346. [Google Scholar] [CrossRef]
- Marzband, M.; Azarinejadian, F.; Savaghebi, M.; Guerrero, J.M. An optimal energy management system for islanded microgrids based on multiperiod artificial bee colony combined with Markov chain. IEEE Syst. J. 2015, 99, 1–11. [Google Scholar] [CrossRef]
- Marzband, M.; Sumper, A.; Ruiz-Álvarez, A.; Domínguez-García, J.L.; Tomoiagă, B. Experimental evaluation of a real time energy management system for stand-alone microgrids in day-ahead markets. Appl. Energy 2013, 106, 365–376. [Google Scholar] [CrossRef]
- Marzband, M.; Sumper, A.; Domínguez-García, J.L.; Gumara-Ferret, R. Experimental validation of a real time energy management system for microgrids in islanded mode using a local day-ahead electricity market and MINLP. Energy Convers. Manag. 2013, 76, 314–322. [Google Scholar] [CrossRef]
- Basrawi, F.; Yamada, T.; Obara, S. Economic and environmental based operation strategies of a hybrid photovoltaic-microgas turbine trigeneration system. Appl. Energy 2014, 121, 174–183. [Google Scholar] [CrossRef]
- Niknam, T.; Abarghooee, R.A.; Narimani, M.R. An efficient scenario-based stochastic programming framework for multi-objective optimal micro-grid operation. Appl. Energy 2012, 99, 455–470. [Google Scholar] [CrossRef]
- Moghaddam, A.A.; Seifi, A.; Niknam, T. Multi-operation management of a typical micro-grids using Particle Swarm Optimization: A comparative study. Renew. Sustain. Energy Rev. 2012, 16, 1268–1281. [Google Scholar] [CrossRef]
- Chakraborty, S.; Ito, T.; Senjyu, T.; Saber, A.Y. Intelligent economic operation of smart-grid facilitating fuzzy advanced quantum evolutionary method. IEEE Trans. Sustain. Energy 2013, 4, 905–916. [Google Scholar] [CrossRef]
- Liao, G.C. Solve environmental economic dispatch of smart microgrid containing distributed generation system—Using chaotic quantum genetic algorithm. Int. J. Electr. Power Energy Syst. 2012, 43, 779–787. [Google Scholar] [CrossRef]
- Firouzi, B.B.; Farjah, E.; Abarghooee, R.A. An efficient scenario-based and fuzzy self-adaptive learning particle swarm optimization approach for dynamic economic emission dispatch considering load and wind power uncertainties. Energy 2013, 50, 232–244. [Google Scholar] [CrossRef]
- Kuznetsova, E.; Li, Y.F.; Ruiz, C.; Zio, E. An integrated framework of agent-based modelling and robust optimization for microgrid energy management. Appl. Energy 2014, 129, 70–88. [Google Scholar] [CrossRef]
- Karaboga, D.; Akay, B. A comparative study of artificial bee colony algorithm. J. Appl. Math. Comput. 2009, 2014, 108–132. [Google Scholar] [CrossRef]
- Slootweg, J.G.; Haan, S.W.H.; Polinder, H.; Kling, W.L. General model for representing variable speed wind turbines in power system dynamics simulations. IEEE Trans. Power Syst. 2003, 18, 144–151. [Google Scholar] [CrossRef]
- Wang, J.; Li, X.; Yang, H.; Kong, S. Design and realization of microgrid composing of photovoltaic and energy storage system. Energy Procedia 2011, 12, 1008–1014. [Google Scholar] [CrossRef]
- Time-of-Use Rate for Industry. The Electricity Rate Structure of Taipower Company; Taiwan Power Company: Taipei, Taiwan, 2014.
- Huang, S.T. Day Ahead Unit Commitment in Microgrids Using Genetic Algorithm. Master’s Thesis, National Taiwan Ocean University, Keelung, Taiwan, 2011. [Google Scholar]
© 2015 by the authors; licensee MDPI, Basel, Switzerland. This article is an open access article distributed under the terms and conditions of the Creative Commons by Attribution (CC-BY) license (http://creativecommons.org/licenses/by/4.0/).
Share and Cite
Lin, W.-M.; Tu, C.-S.; Tsai, M.-T. Energy Management Strategy for Microgrids by Using Enhanced Bee Colony Optimization. Energies 2016, 9, 5. https://doi.org/10.3390/en9010005
Lin W-M, Tu C-S, Tsai M-T. Energy Management Strategy for Microgrids by Using Enhanced Bee Colony Optimization. Energies. 2016; 9(1):5. https://doi.org/10.3390/en9010005
Chicago/Turabian StyleLin, Whei-Min, Chia-Sheng Tu, and Ming-Tang Tsai. 2016. "Energy Management Strategy for Microgrids by Using Enhanced Bee Colony Optimization" Energies 9, no. 1: 5. https://doi.org/10.3390/en9010005
APA StyleLin, W.-M., Tu, C.-S., & Tsai, M.-T. (2016). Energy Management Strategy for Microgrids by Using Enhanced Bee Colony Optimization. Energies, 9(1), 5. https://doi.org/10.3390/en9010005