
Optimal Bidding Strategy for Renewable Microgrid with Active Network Management


Abstract
:1. Introduction
2. Microgrid Operators as Market Participant


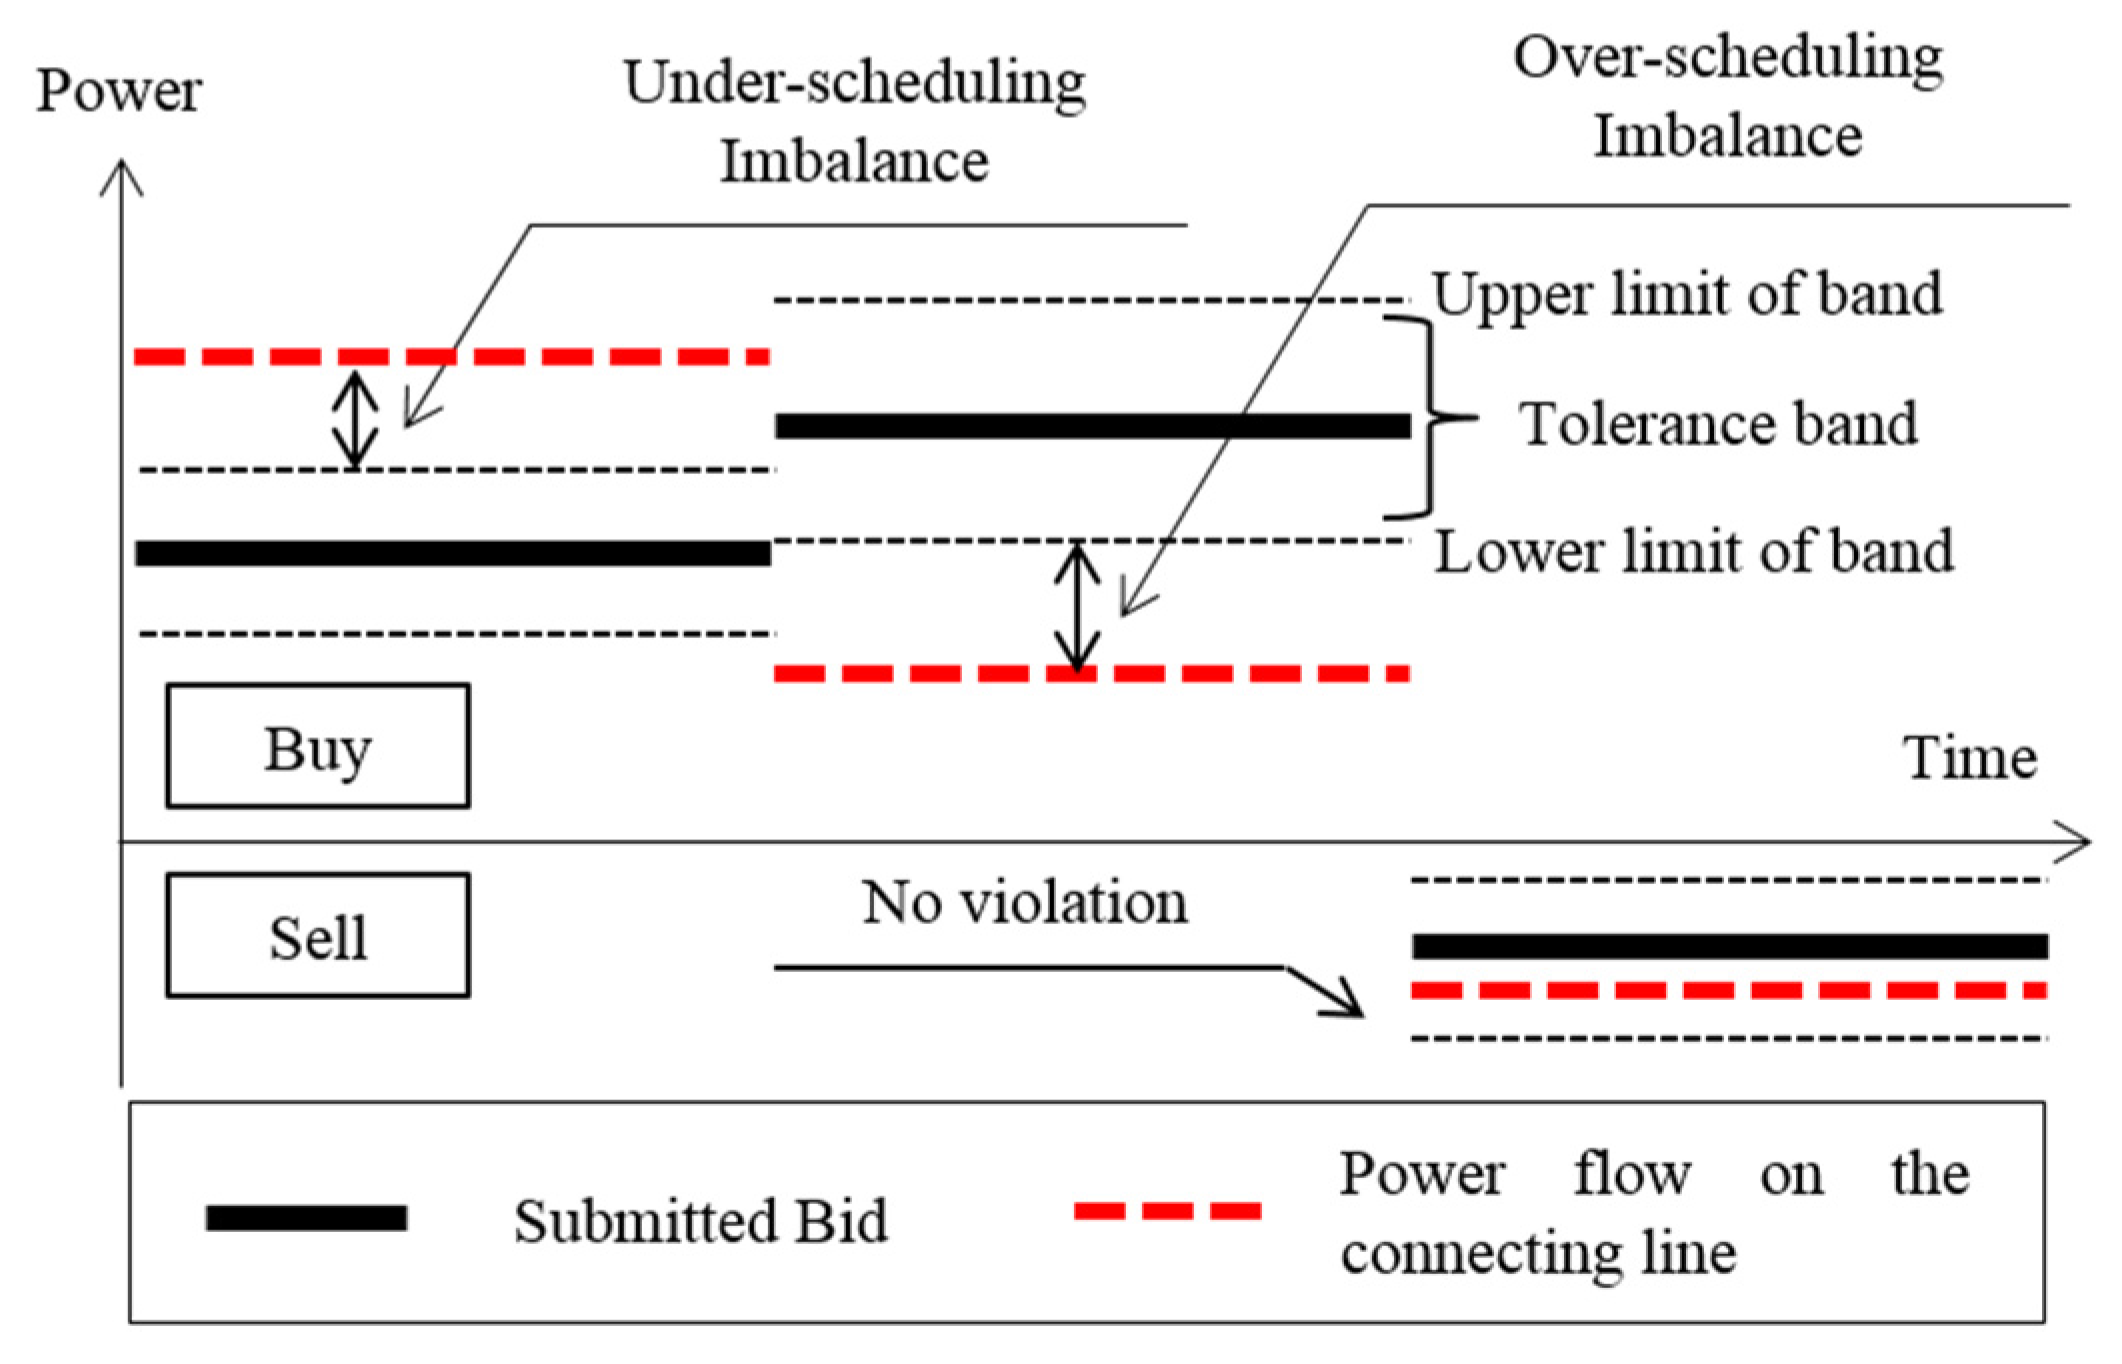
| Reference | Tolerance Band | Threshold Level | Penalty Price Factor | |
|---|---|---|---|---|
| Over-Scheduling Imbalance | Under-Scheduling Imbalance | |||
| Shi et al. [10] | None | None | 20% of MP | 15% of MP |
| Nguyen et al. [11] | None | None | Peak price of 24 h | Peak price of 24 h |
| CAISO [17] | ±5% of bid | >5% | 25% of MP | 25% of MP |
| >10% | 50% of MP | 100% of MP | ||
3. Basic Bidding Strategy Without Active Network Management
4. Proposed Bidding Strategy with Active Network Management
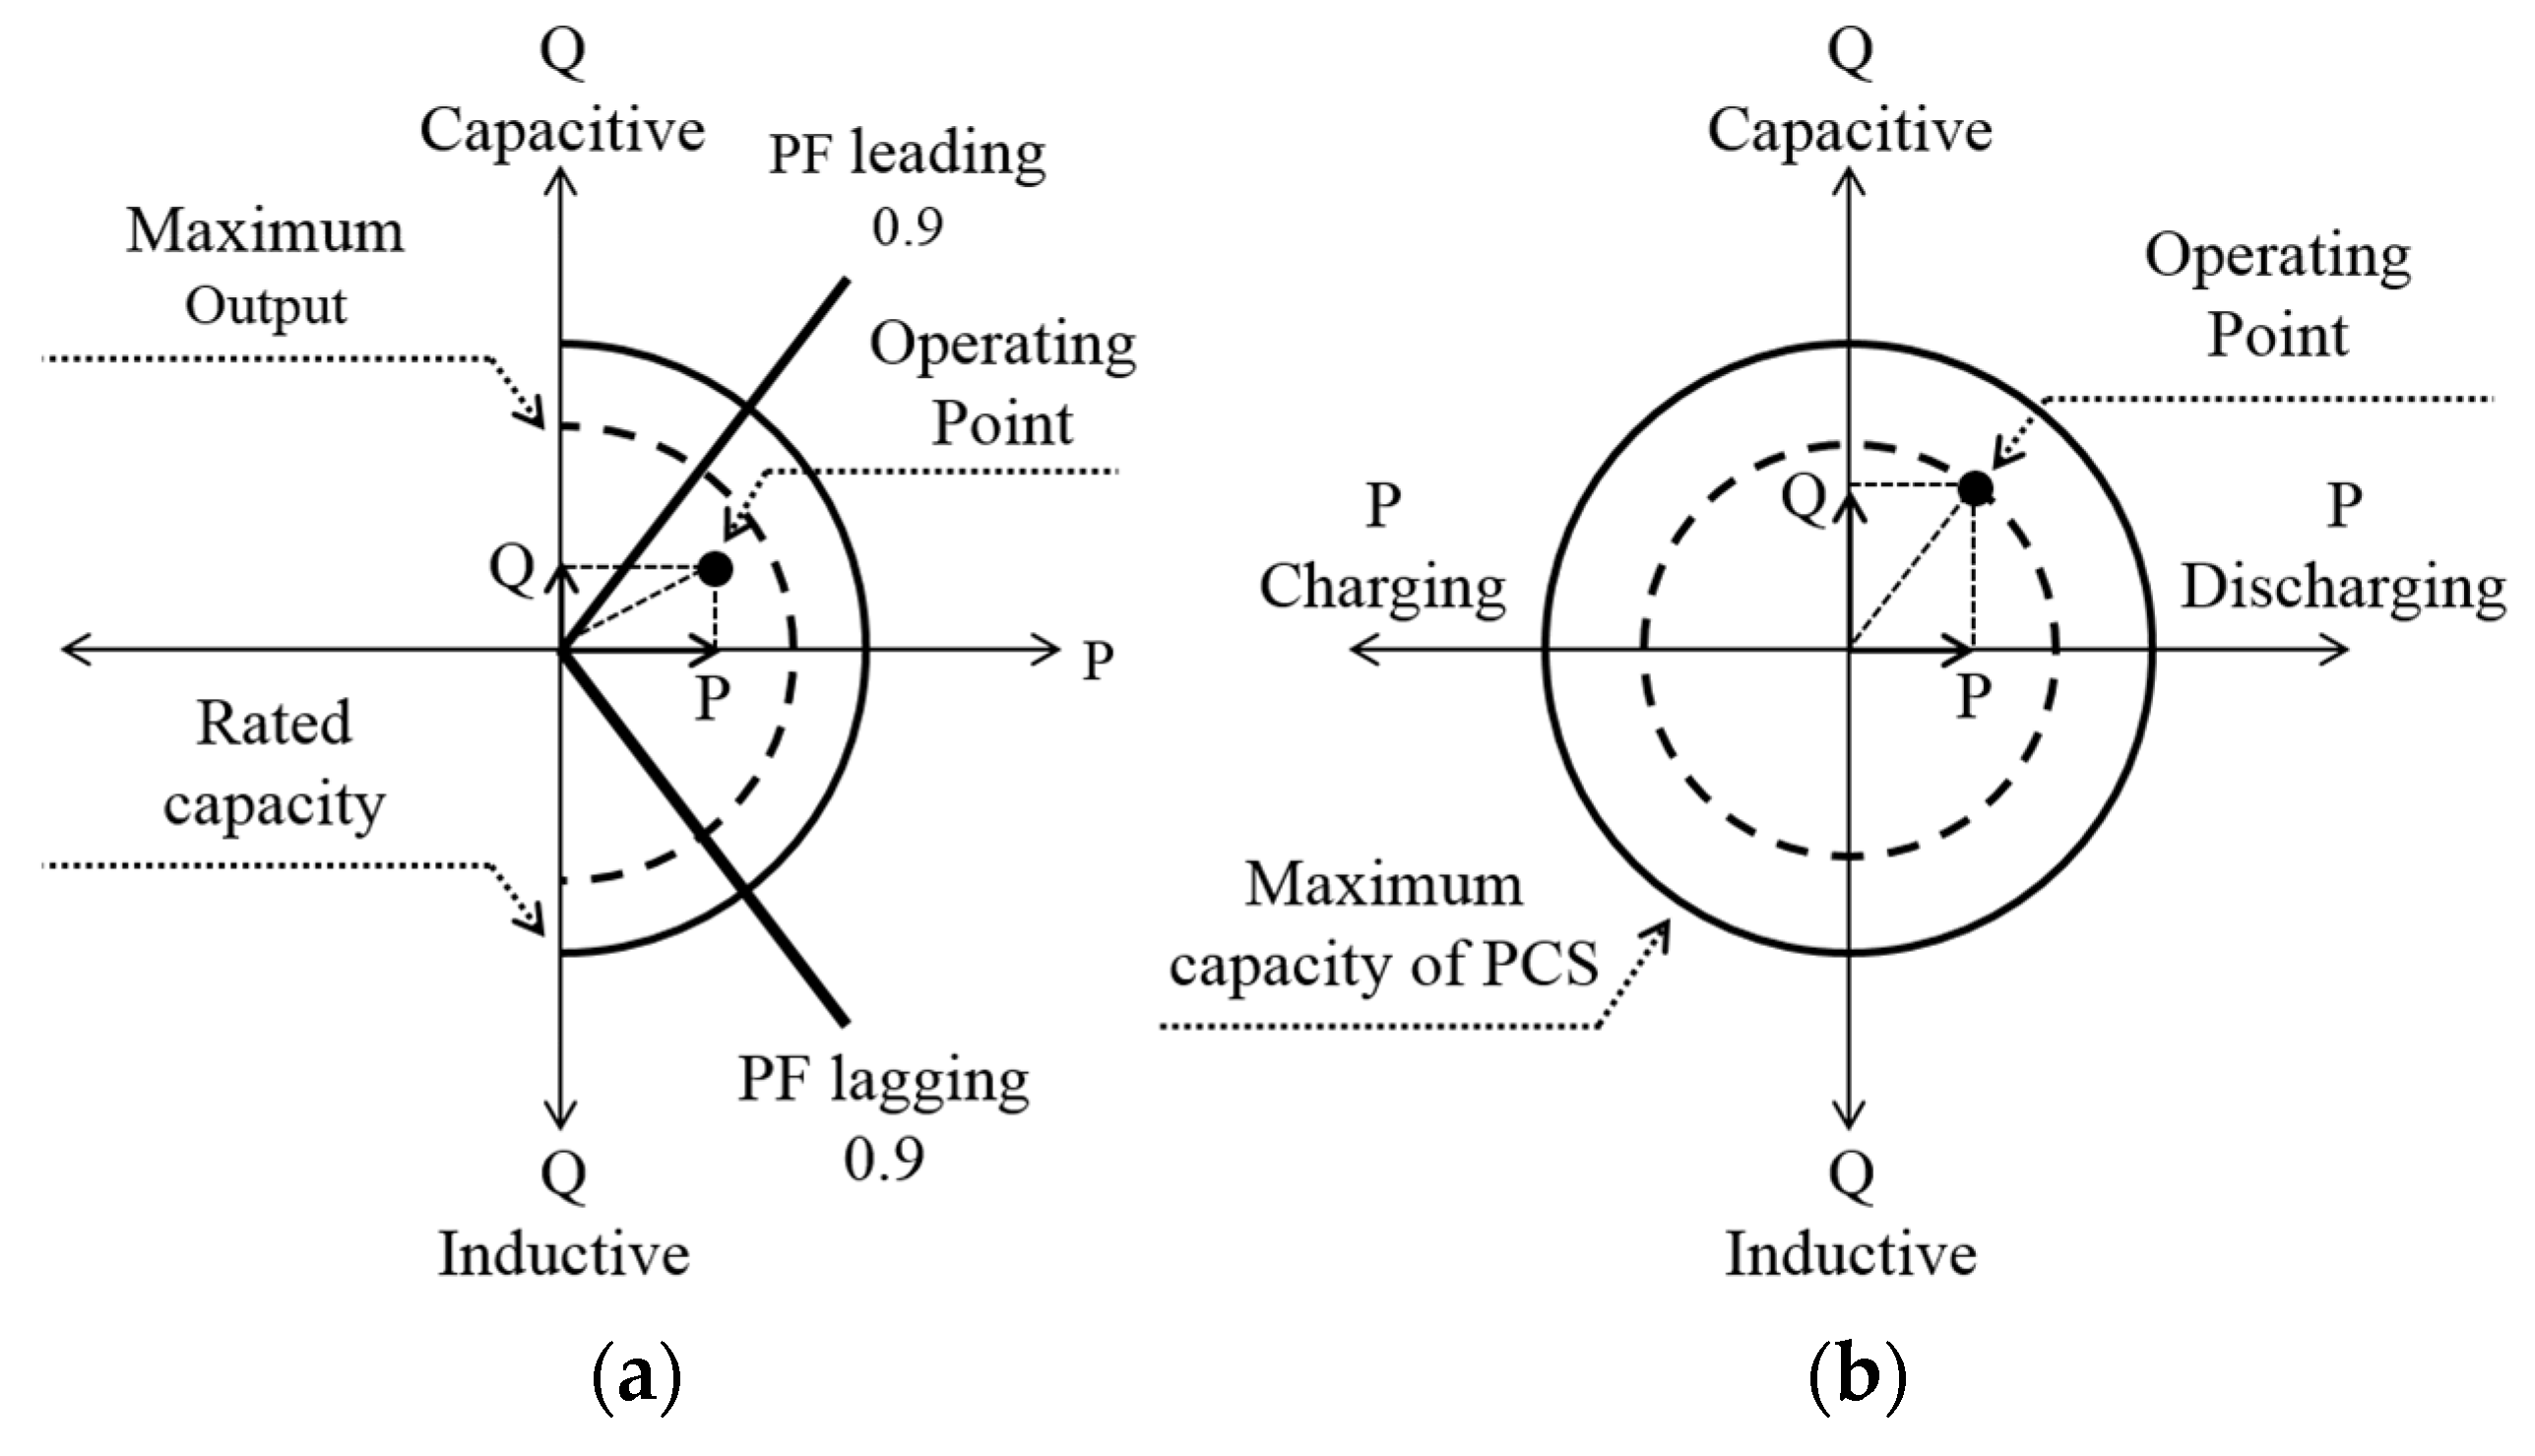
4.1. Features of Active Network Management in Microgrid Operation
4.2. Formulation of Optimal Bidding Strategy with Active Network Management
4.2.1. Objective function
4.2.2. Load constraints
4.2.3. Generation constraints
4.2.4. BESS constraints
4.2.5. Power flow constraints
5. Simulation
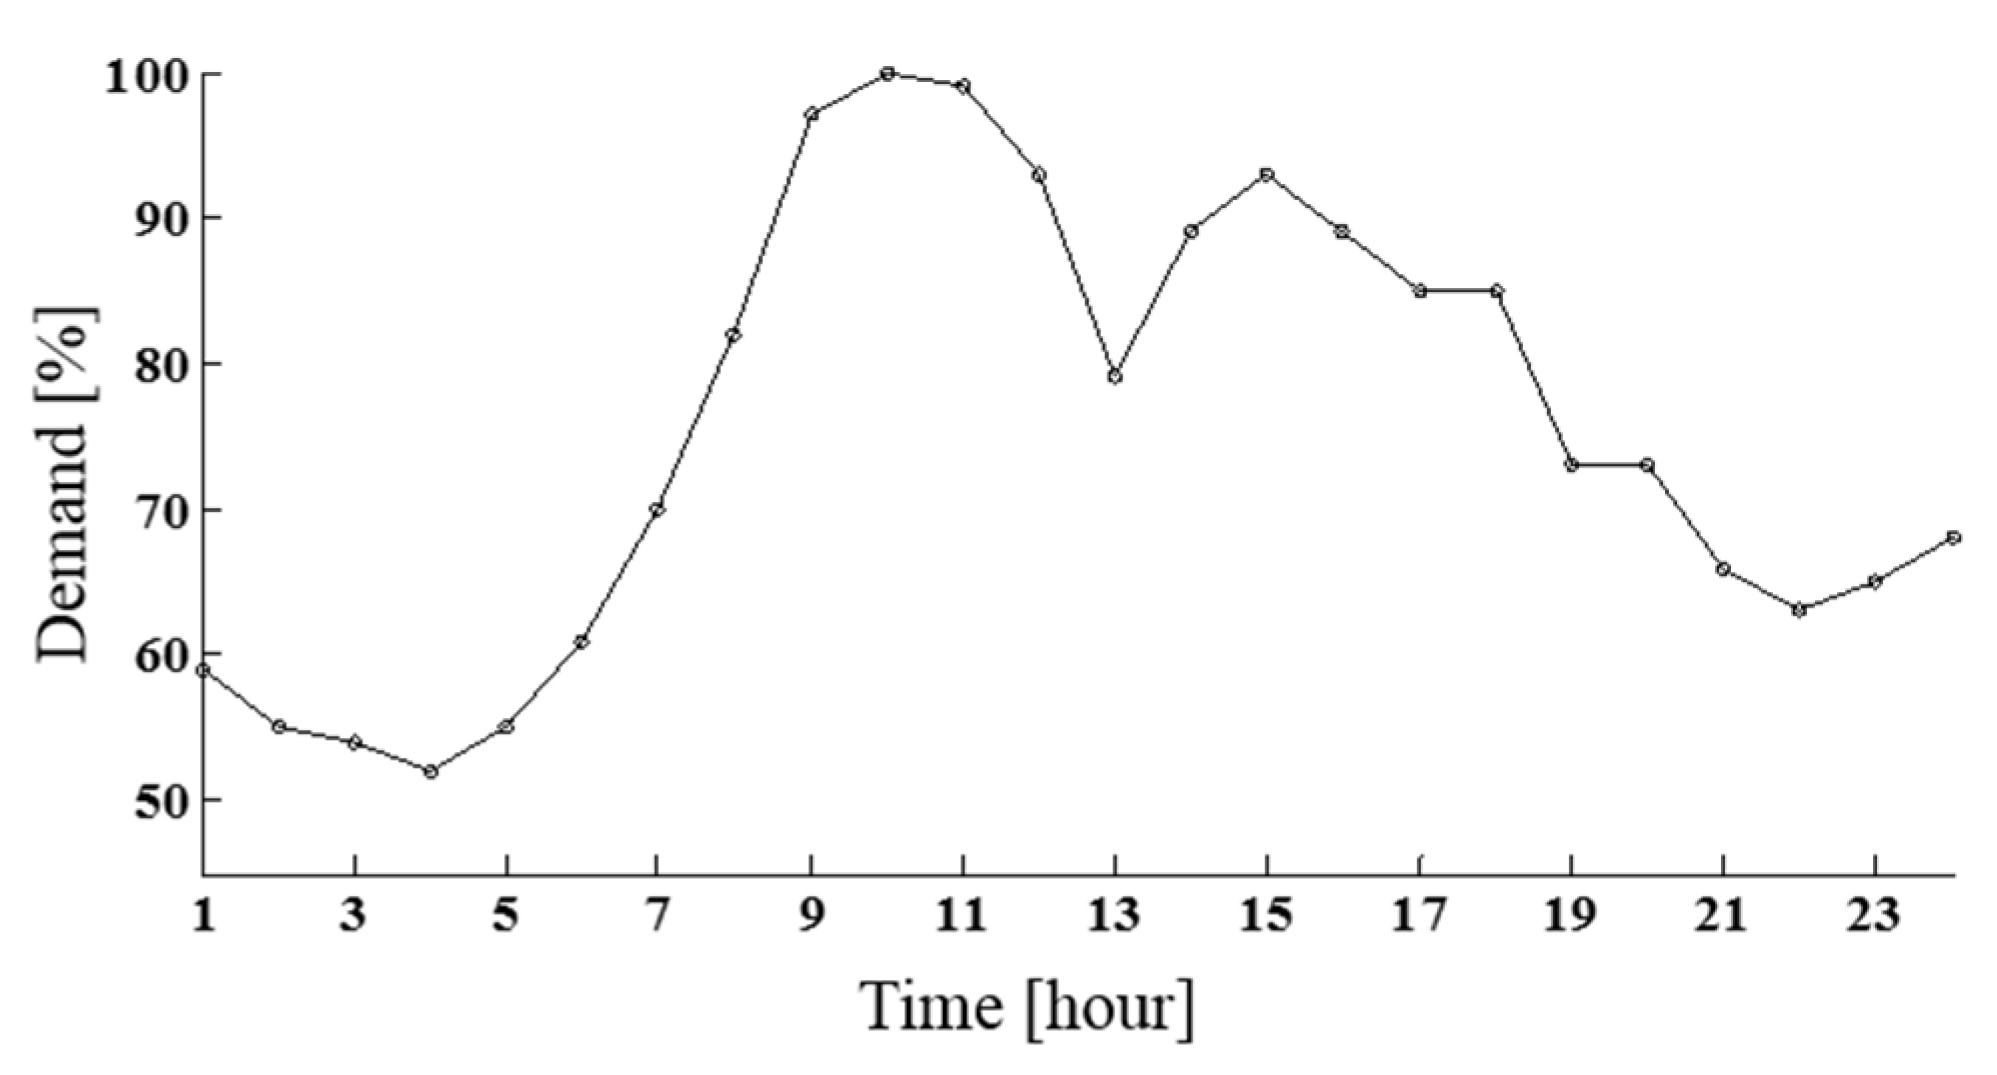
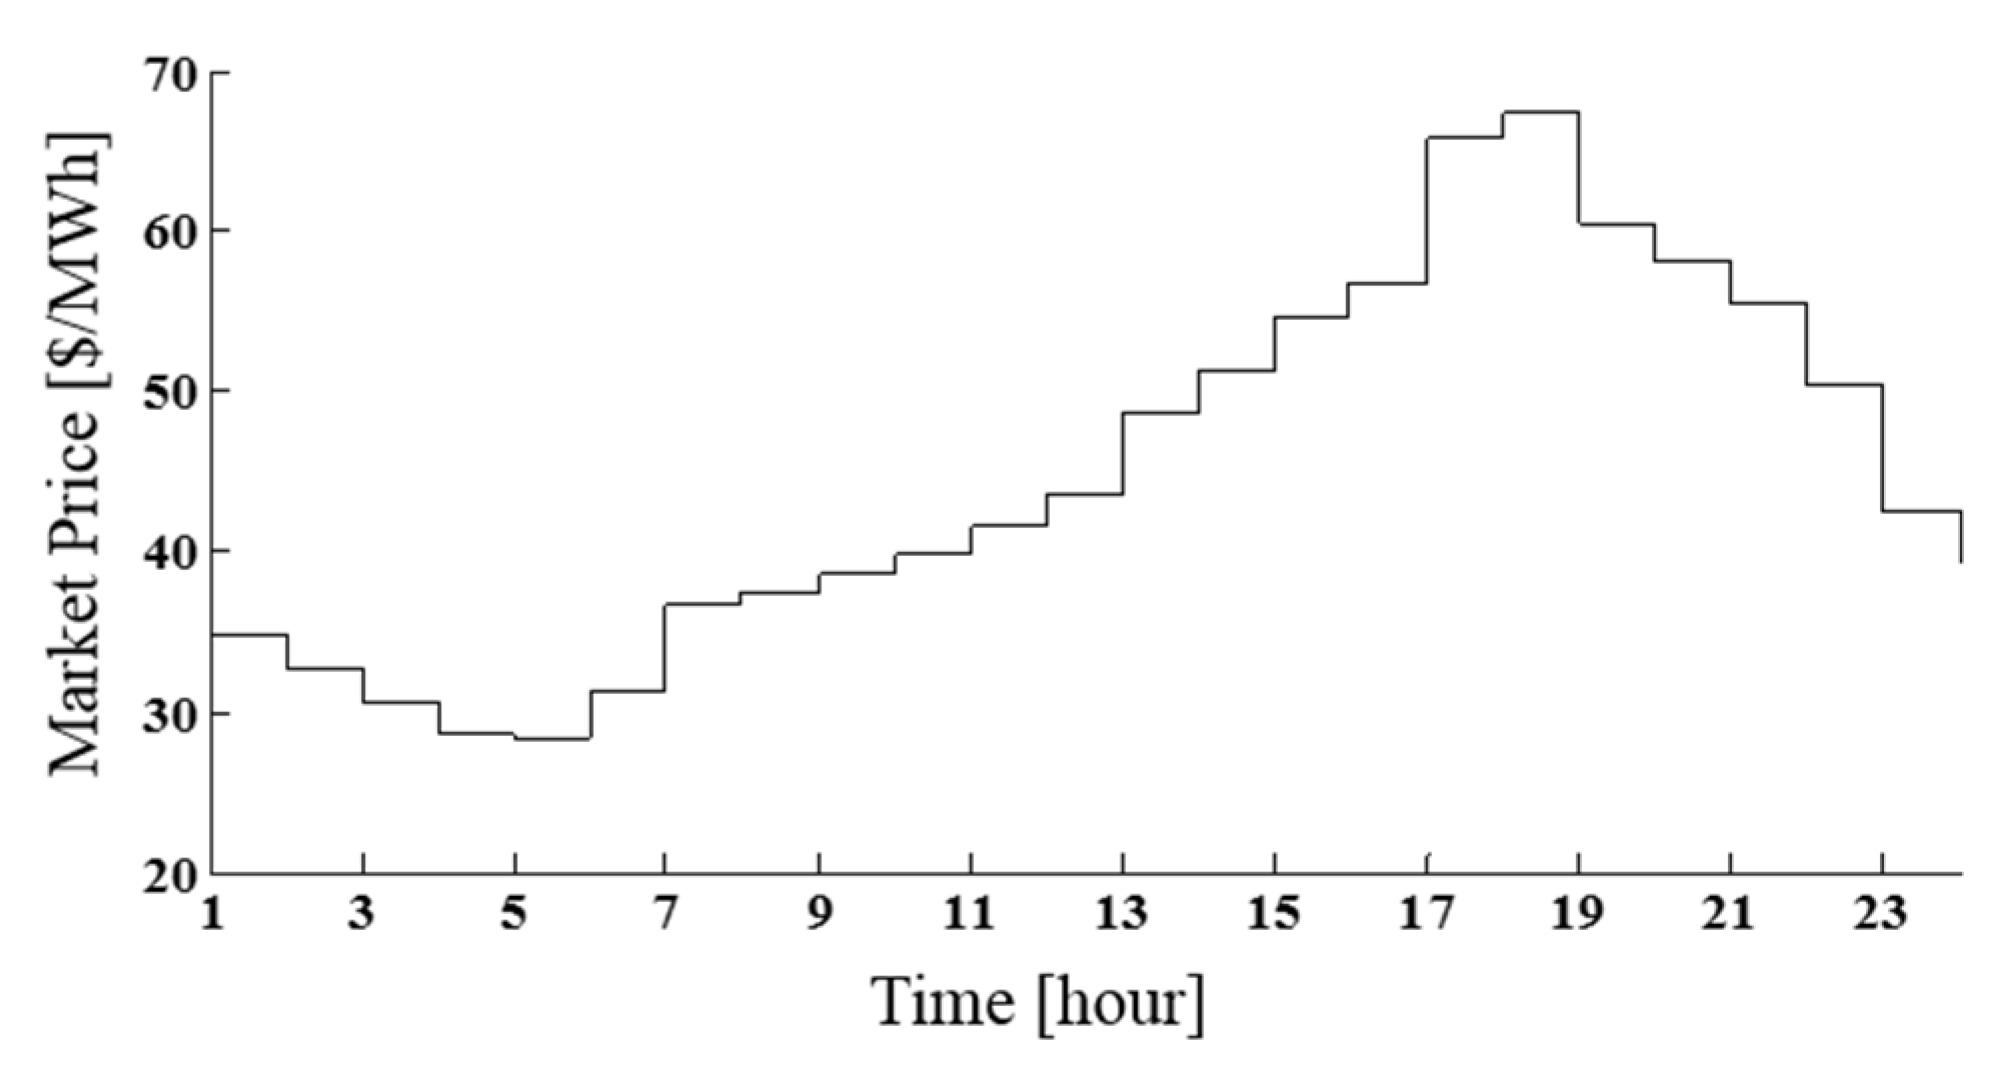
5.1. Simulation Settings

| Resource types | Properties | Values | ||||
|---|---|---|---|---|---|---|
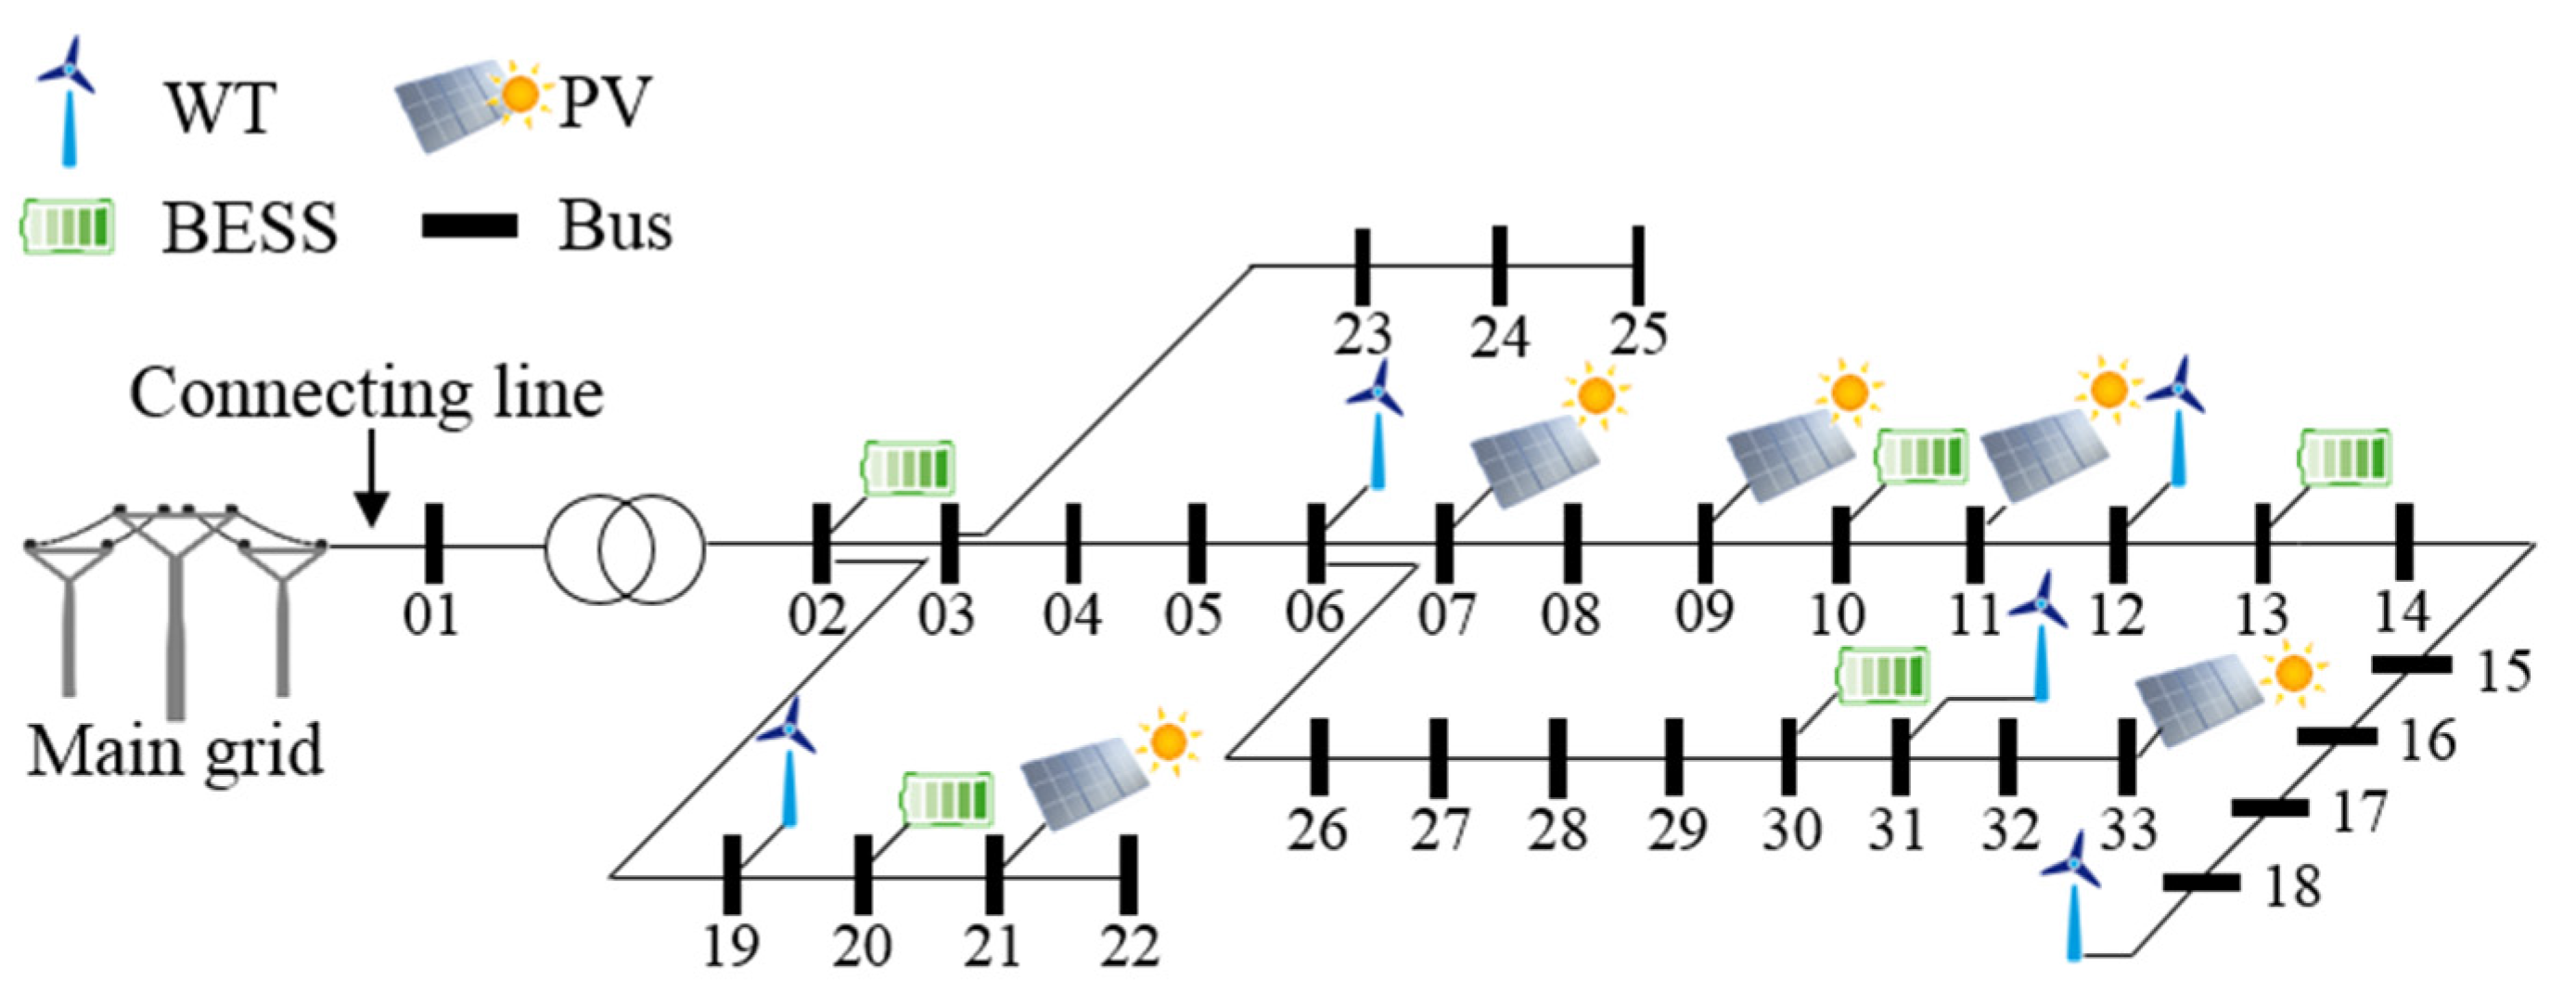
| WT | Location | Bus 6 | Bus 12 | Bus 18 | Bus 19 | Bus 31 |
| Capacity (MVA) | 1.2 | 0.6 | 0.6 | 0.96 | 1.2 | |
| PV | Location | Bus 7 | Bus 9 | Bus 11 | Bus 21 | Bus 33 |
| Capacity (MVA) | 0.24 | 0.36 | 0.36 | 0.36 | 0.6 | |
| BESS | Location | Bus 2 | Bus 10 | Bus 13 | Bus 20 | Bus 30 |
| Max. Power (MVA) | 0.18 | 0.06 | 0.06 | 0.18 | 0.30 | |
| Capacity (MWh) | 0.36 | 0.12 | 0.12 | 0.36 | 0.60 | |

| Simulation Case | Tolerance Band | Penalty Price Factor | |
|---|---|---|---|
| Over-Scheduling | Under-Scheduling | ||
| Case I | ±5% | 50% | 50% |
| Case II | 75% | 75% | |
| Generation curtailment compensation factor γGCURT | 80% |
| Load curtailment compensation factor γLCURT | 300% |
| Fast charging/cycling cost parameters αB, βB | 1/0.75 |
| Minimum/maximum state-of-charge of the BESS | 20%/95% |
| ∆t | 1 h |
| Predetermined power factor range of RDGs | 0.9 Lagging–0.9 Leading |
| Predetermined power factor range of the line connecting the main grid and MG | 0.95 Lagging–0.95 Leading |
| Lower/upper voltage limit VLL, VUL | 0.95 p.u./1.05 p.u. |
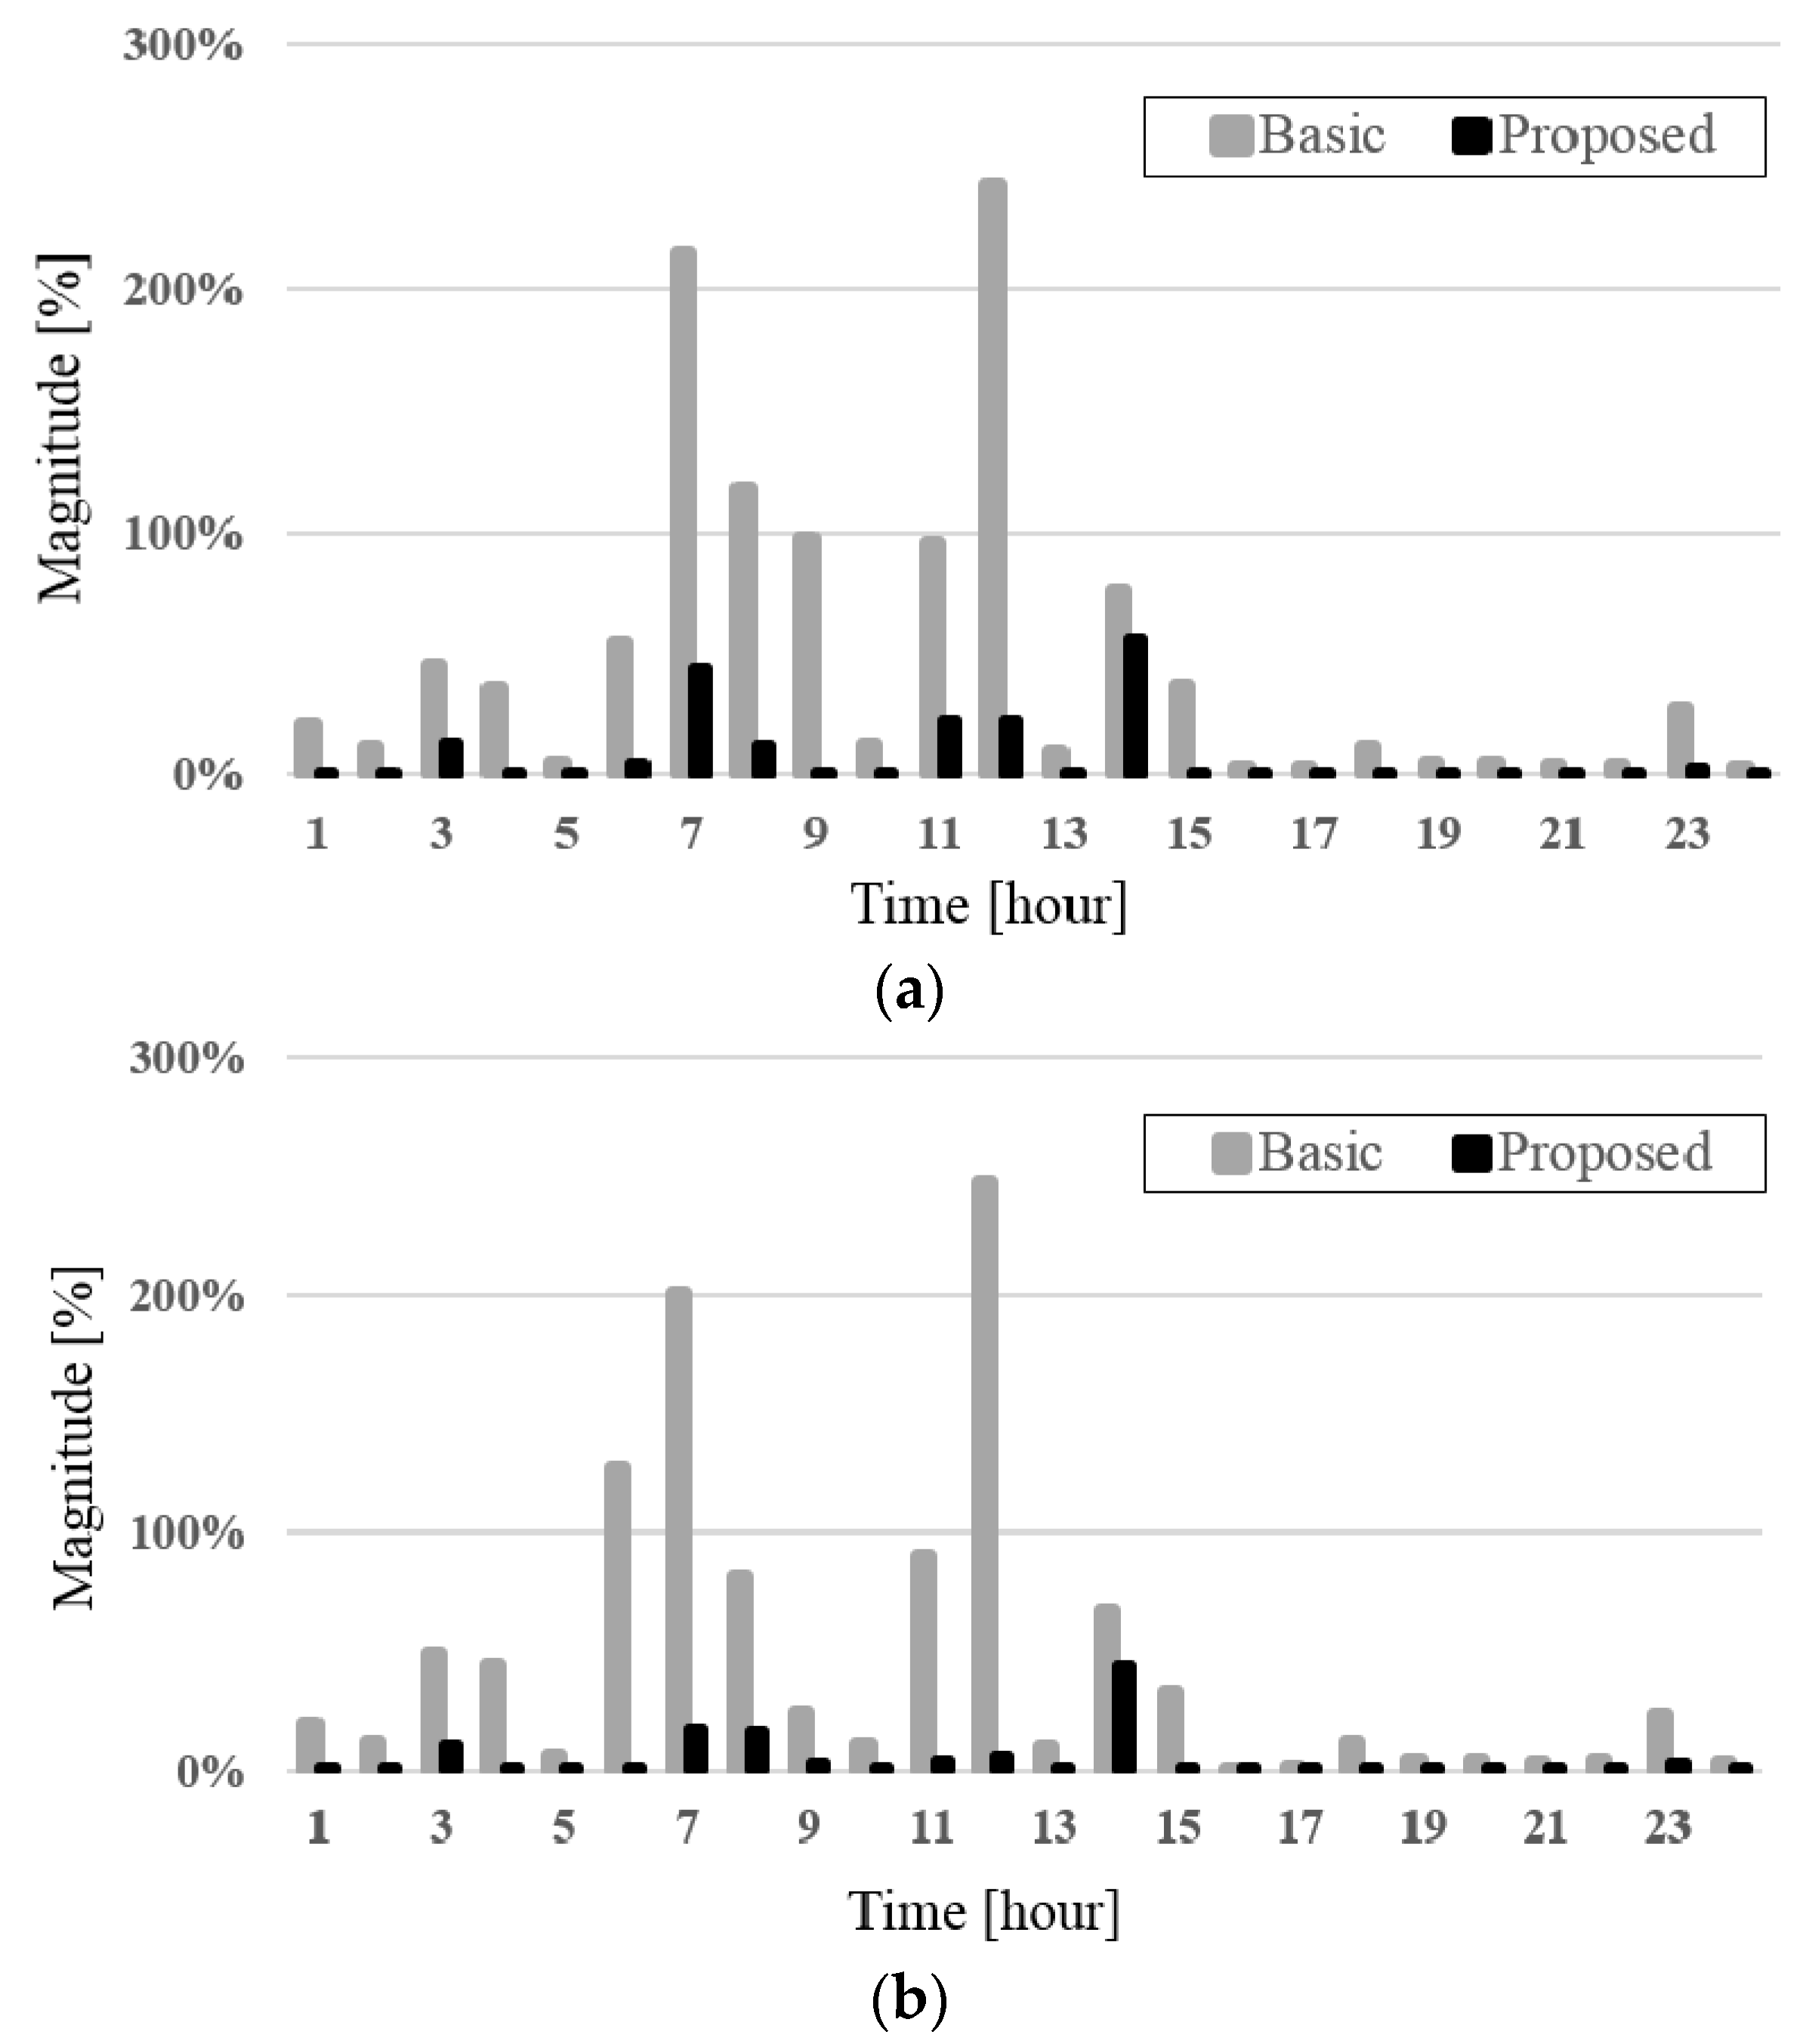
5.2. Simulation Results

| Simulation Case | Case I | Case II | |||||
|---|---|---|---|---|---|---|---|
| Basic | Proposed | Difference | Basic | Proposed | Difference | ||
| Revenue | 6484.14 | 6483.90 | −0.24 | 6483.62 | 6482.64 | −0.98 | |
| Costs | Exchange cost | 1562.30 | 1562.90 | 0.60 | 1563.24 | 1571.00 | 7.77 |
| Imbalance cost | 54.04 | 13.10 | −40.94 | 78.44 | 9.55 | −68.90 | |
| Loss cost | 66.55 | 65.68 | −0.86 | 67.26 | 64.91 | −2.35 | |
| Battery wear cost | 0.18 | 0.18 | 0.00 | 0.20 | 0.24 | 0.04 | |
| Generation cost | 1728.98 | 1727.69 | −1.28 | 1729.61 | 1719.88 | −9.73 | |
| Generation curtailment cost | 110.67 | 111.69 | 1.03 | 110.16 | 117.95 | 7.78 | |
| Load curtailment cost | 221.68 | 221.89 | 0.21 | 222.98 | 223.91 | 0.93 | |
| Profit | 2739.75 | 2780.76 | 41.01 | 2711.73 | 2775.20 | 63.48 | |
6. Conclusions
Author Contributions
Conflicts of Interest
Nomenclatures
- Abbreviations
MG Microgrid MGO Microgrid Operator SO System Operator of the main grid RDG Renewable Distributed Generation WT Wind Turbine PV Photovoltaic system BESS Battery Energy Storage System ANM Active network management MP Market Price in day-ahead energy market TOU Time-of-Use tariff - Indices and Sets
s Index of each bus in the MG i Index of each bus in the MG t Index of each time stage l Index of each distribution line T Set of time stages B Set of buses in the MG - Functions
PRs Daily operating profit for scenario s Rs Daily operating revenue for scenario s Daily load curtailment cost for scenario s Daily generation cost for scenario s Daily generation curtailment cost for scenario s Daily loss cost for scenario s Daily exchange cost in the market for scenario s Daily imbalance cost for scenario s Daily battery wear cost for scenario s Total loss in the MG at time stage t for scenario s - Variables
, Dispatched active/reactive loads in the i-th bus at time stage t for scenario s , Dispatched active/reactive power outputs of the RDG in the i-th bus at time stage t for scenario s , Scheduled active/reactive powers of the BESS at the i-th bus at time stage t for scenario s State-of-charge of the BESS in the i-th bus at time stage t for scenario s , Active/reactive power flows in the line connecting the main grid and MG at time stage t for scenario s , Active/reactive power flows in the i-th distribution line at time stage t for scenario s , Magnitude/angle of the voltage of the i-th bus at time stage t for scenario s Submitted bid in the day-ahead energy market at time stage t - Parameters
, Forecasted active/reactive power demands in the i-th bus at time stage t for scenario s Forecasted active power output of the RDG in the i-th bus at time stage t for scenario s Capacity of the RDG in the i-th bus , Minimum/maximum state-of-charge of the BESS in the i-th bus at time stage t Maximum power output of the BESS in the i-th bus , Capacities of the i-th distribution line and the line connecting the main grid and MG Probability of scenario s Retail price at time stage t Day-ahead market price at time stage t , Penalty price factors for the under/over-scheduling imbalance , Load and generation curtailment compensation factors b Half-width of the tolerance band , Fast charging and cycling cost parameters of the BESS Duration of each time stage , Lower/upper voltage limits , Conductance/susceptance of the distribution line between the i-th bus and the j-th bus , Limit of the power factor for RDG and the power flow on the connecting line
References
- Lasseter, R.; Akhil, A.; Marnay, C.; Stephens, J.; Dagle, J.; Guttromson, R.; Meliopoulous, A.S.; Yinger, R.; Eto, J. Integration of Distributed Energy Resources: The CERTS Microgrid Concept; Lawrence Berkeley National Laboratory: Berkeley, CA, USA, 2002.
- Hatziargyriou, N.; Asano, H.; Iravani, R.; Marnay, C. Microgrids. IEEE Power Energy Mag. 2007, 5, 78–94. [Google Scholar] [CrossRef]
- Hawkes, A.D.; Leach, M.A. Modelling high level system design and unit commitment for a microgrid. Appl. Energy 2009, 86, 1253–1265. [Google Scholar] [CrossRef]
- Elsied, M.; Oukaour, A.; Gualous, H.; Hassan, R. Energy management and optimization in microgrid system based on green energy. Energy 2015, 84, 139–151. [Google Scholar] [CrossRef]
- Lee, S.Y.; Jin, Y.G.; Yoon, Y.T. Determining the optimal reserve capacity in a microgrid with islanded operation. IEEE Trans. Power Syst. 2016, in press. [Google Scholar] [CrossRef]
- Palizban, O.; Kauhaniemi, K.; Guerrero, J.M. Microgrids in active network management–Part I: Hierarchical control, energy storage, virtual power plants, and market participation. Renew. Sustain. Energy Rev. 2014, 36, 428–439. [Google Scholar] [CrossRef]
- Niknam, T.; Golestaneh, F.; Malekpour, A. Probabilistic energy and operation management of a microgrid containing wind/photovoltaic/fuel cell generation and energy storage devices based on point estimate method and self-adaptive gravitational search algorithm. Energy 2012, 43, 427–437. [Google Scholar] [CrossRef]
- Mohammadi, S.; Mozafari, B.; Solimani, S.; Niknam, T. An adaptive modified firefly optimization algorithm based on Hong’s point estimate method to optimal operation management in a microgrid with consideration of uncertainties. Energy 2013, 51, 339–348. [Google Scholar] [CrossRef]
- Mohammadi, S.; Soleymani, S.; Mozafari, B. Scenario-based stochastic operation management of microgrid including wind, photovoltaic, micro-turbine, fuel cell and energy storage devices. Int. J. Elect. Power Energy Syst. 2014, 54, 525–535. [Google Scholar] [CrossRef]
- Shi, L.; Luo, Y.; Tu, G.Y. Bidding strategy of microgrid with consideration of uncertainty for participating in power market. Int. J. Elect. Power Energy Syst. 2014, 59, 1–13. [Google Scholar] [CrossRef]
- Nguyen, D.T.; Le, L.B. Risk-constrained profit maximization for microgrid aggregator with demand response. IEEE Trans. Smart Grid 2015, 6, 135–146. [Google Scholar] [CrossRef]
- Zhang, J.; Fan, H.; Tang, W.; Wang, M.; Cheng, H.; Yao, L. Planning for distributed wind generation under active management mode. Int. J. Elect. Power Energy Syst. 2013, 47, 140–146. [Google Scholar] [CrossRef]
- Carr, S.; Premier, G.C.; Guwy, A.J.; Dinsdale, R.M.; Maddy, J. Energy storage for active network management on electricity distribution networks with wind power. IET Renew. Power Gen. 2014, 8, 249–259. [Google Scholar] [CrossRef]
- Gill, S.; Kockar, I.; Ault, G.W. Dynamic optimal power flow for active distribution networks. IEEE Trans. Power Syst. 2014, 29, 121–131. [Google Scholar] [CrossRef]
- Yun, S.Y.; Chu, C.M.; Kwon, S.C.; Song, I.K.; Choi, J.H. The development and empirical evaluation of the Korean smart distribution management system. Energies 2014, 7, 1332–1362. [Google Scholar] [CrossRef]
- Hernandez, L.; Baladron, C.; Aguiar, J.M.; Calavia, L.; Carro, B.; S-Esquevillas, A.; Sanjuan, J.; Gonzalez, A.; Lloret, J. Improved short-term load forecasting based on two-stage predictions with artificial neural networks in a microgrid environment. Energies 2013, 6, 4489–4507. [Google Scholar] [CrossRef]
- Dragomir, O.E.; Dragomir, F.; Stefan, V.; Minca, E. Adaptive neuro-fuzzy inference systems as a strategy for predicting and controlling the energy produced from renewable sources. Energies 2015, 8, 13047–13061. [Google Scholar] [CrossRef]
- Matevosyan, J.; Söder, L. Minimization of imbalance cost trading wind power on the short-term power market. IEEE Trans. Power Syst. 2006, 21, 1396–1404. [Google Scholar] [CrossRef]
- California Independent System Operator (ISO). Business Practice Manual for the Energy Imbalance Market; California ISO: Folsom, CA, USA, 2014. [Google Scholar]
- Shi, W.; Xie, X.; Chu, C.C.; Gadh, R. Distributed optimal energy management in microgrids. IEEE Trans. Smart Grid 2015, 6, 1137–1146. [Google Scholar] [CrossRef]
- Safdarian, A.; Fotuhi-Firuzabad, M.; Lehtonen, M. A stochastic framework for short-term operation of a distribution company. IEEE Trans. Power Syst. 2013, 28, 4712–4721. [Google Scholar] [CrossRef]
- Gabash, A.; Li, P. Active-reactive optimal power flow in distribution networks with embedded generation and battery storage. IEEE Trans. Power Syst. 2012, 27, 2026–2035. [Google Scholar] [CrossRef]
- Baran, M.E.; Wu, F.F. Network reconfiguration in distribution systems for loss reduction and load balancing. IEEE Trans. Power Deliv. 1989, 4, 1401–1407. [Google Scholar] [CrossRef]
- California ISO: Open Access Same-Time Information System. Available online: http://oasis.caiso.com/mrioasis/logon.do?tiny=X_JAPA (accessed on 6 November 2015).
- Wang, J.; Shahidehpour, M.; Li, Z. Security-constrained unit commitment with volatile wind power generation. IEEE Trans. Power Syst. 2008, 23, 1319–1327. [Google Scholar] [CrossRef]
- Bouffard, F.; Galiana, F.D. Stochastic security for operation planning with significant wind power generation. In Proceedings of the Power and Energy Society General Meeting-Conversion and Delivery of Electrical Energy in the 21st Century, Pittsburgh, PA, USA, 20–24 July 2008.
- Pacific Gas and Electric Co: Electric Rates. Available online: http://www.pge.com/tariffs/electric.shtml (accessed on 6 November 2015).
© 2016 by the authors; licensee MDPI, Basel, Switzerland. This article is an open access article distributed under the terms and conditions of the Creative Commons by Attribution (CC-BY) license (http://creativecommons.org/licenses/by/4.0/).
Share and Cite
Kim, S.W.; Kim, J.; Jin, Y.G.; Yoon, Y.T. Optimal Bidding Strategy for Renewable Microgrid with Active Network Management. Energies 2016, 9, 48. https://doi.org/10.3390/en9010048
Kim SW, Kim J, Jin YG, Yoon YT. Optimal Bidding Strategy for Renewable Microgrid with Active Network Management. Energies. 2016; 9(1):48. https://doi.org/10.3390/en9010048
Chicago/Turabian StyleKim, Seung Wan, Jip Kim, Young Gyu Jin, and Yong Tae Yoon. 2016. "Optimal Bidding Strategy for Renewable Microgrid with Active Network Management" Energies 9, no. 1: 48. https://doi.org/10.3390/en9010048
APA StyleKim, S. W., Kim, J., Jin, Y. G., & Yoon, Y. T. (2016). Optimal Bidding Strategy for Renewable Microgrid with Active Network Management. Energies, 9(1), 48. https://doi.org/10.3390/en9010048