1. Introduction
Resource exhaustion, climate change and environmental deterioration arising from the deepening exploitation and utilization of energy resources have brought great challenges to human development [
1,
2]. Building a safe, clean and economical energy supply system has become the common desire of people all over the world. To mitigate climate change, improve energy security and ecological environment, and achieve the targets of energy saving and emission reduction, the renewable energy resources with the characteristics of less environmental pollution and abundant reserves are catching more and more attentions of energy planners and policy makers [
3,
4].
China is rich in renewable energy resources, such as wind energy, solar energy, and biomass energy [
5]. In recent years, China has seen the rapid development of renewable energy power. At 2014, the installed capacity of renewable energy power reached 0.43 billion kW, which accounted for 32% of the national total [
6]. In the same year, the annual generation of grid-connected renewable energy power amounted to 1.2 trillion kWh, accounting for 22% of the total power generation [
6]. Specifically, the installed capacity of grid-connected wind power amounted to 95.8 million kW and the generation was more than 150 billion kWh, which shared 2.78% of the national total [
6]. The development and utilization of wind power in China is dominant in all kinds of renewable energy power types, but the proportion of wind power generation in national total is still relatively low. In view of the sustainable development request and current supporting policies for renewable energy power, the wind power and solar PV power in China have broad development prospects [
7,
8].
Due to the randomness and intermittency of power output, the wind power integration into the power grid will bring some negative influences on multiple subjects of electric power system [
9]. With regard to the impacts of wind power integration, there are generally two categories,
i.e., economic impacts [
10,
11,
12,
13] and technical impacts [
14,
15,
16,
17,
18,
19]. In this paper, the issue we are going to study is the economic impact. Furthermore, the economic impact of wind power integration on multiple subjects of electric power system can be studied from two perspectives, namely Externality and Quasi-public goods property. Some studies about the economic impacts of wind power integration have been done from the Externality perspective [
10,
11,
12,
20,
21,
22]. However, to the best of our knowledge, few studies that assess the economic impacts of wind power integration on multiple subjects of electric power system from the Quasi-public goods property perspective have been reported in the literatures. Therefore, to fill the gap of current studies, this paper will quantitatively assess the economic impacts of wind power integration from the Quasi-public goods property perspective, which is the objective of this study. The Quasi-public goods property mentioned in this paper derives from the transmission services provided by power grid corporations, which will be elaborated in detail in
Section 2. This study performs the economic impact assessment of wind power integration from a new perspective, namely Quasi-public goods property perspective, which is the main contribution of this paper. In the past few years, a large percentage of wind power generation has been abandoned [
7,
22]. Therefore, the studies on how to promote wind power to access to power grid and improve the utilization of wind energy resource are urgently needed. This study performs the economic impact assessment of wind power integration from Quasi-public goods property, and gains some new results which are quite different from that obtained from Externality perspective. The new findings can inform power system managers, energy planners, and policy makers on how to reduce the wind curtailment and make the best of wind energy resource.
The rest of this paper is organized as follows:
Section 2 elaborates the Quasi-public goods property of transmission services provided by power grid corporations.
Section 3 analyzes the multiple subjects of China’s electric power system. Based on OPF-based nodal price model and transmission service cost allocation model, the economic impact assessment model of wind power integration on multiple subjects of China’s electric power system is built from the Quasi-public goods property perspective in
Section 4.
Section 5 performs the simulation analysis. Conclusion and discussion are presented in
Section 6.
2. Quasi-public Goods Property of Transmission Services
Goods in the economic life can be divided into private goods and public goods. When consumed or used, the private goods show two characteristics of competitiveness and exclusiveness, while the public goods usually possess the characteristic of non-competitiveness. The competitiveness characteristic refers to that the goods cannot be simultaneously consumed or used by one and others, and the exclusiveness characteristic refers to that the goods can only be consumed or used by the payers [
23].
Generally speaking, the public goods can be broken down into two kinds: pure public goods and quasi-public goods. Pure public goods refer to one class of public goods that possess the characteristics of non-competitiveness and non-exclusiveness, while quasi-public goods refer to another class of public goods that only have non-competitiveness characteristic. The former is impossible to be priced, but the latter can be priced easily.
Typical quasi-public goods possess three essential characteristics, namely congestible, non-equivalent of consumption quantity, and imperfectly exclusive. The detailed descriptions are as follows:
(1) Quasi-public goods bring some limits on the number of consumers, or say there exists Capacity issue. Within the scope of Capacity, there is no competition, which implies the consumption utilities of consumers and marginal costs of products will be free of adverse effects due to the increasing number of consumers. Once beyond Capacity, the consumption utilities of consumers will decrease with the increasing number of consumers, and then the consumption on quasi-public goods shows the characteristic of competitiveness. The aforementioned analysis indicates the congestible and imperfectly exclusive characteristics of quasi-public goods.
(2) Over a period of time, the consumption quantity and acquired utility are different for different consumers. The main reasons are: 1) the quantities of quasi-public goods required by different consumers are different due to the disparities in income levels and consumption habits; and 2) the consumption on quasi-public goods can be easily quantified. Those lead to non-equivalent characteristic of quasi-public goods.
The transmission services provided by power grid corporations (PGCs) have the Quasi-public goods property, which are reflected as follows.
(1) The transmission services provided by PGCs possess the non-competitiveness characteristic within a certain range of electricity transmission. The upper limit of this range is called “congestion point”, which is the maximum quantity of electricity transmitted by the power grid. When excess the congestion point, the consumption on transmission services will become competitive.
(2) The transmission services consumed by the electric power producers are different, which mainly depend on the capacity and power generation cost.
(3) The transmission services provided by PGCs show the exclusiveness characteristic, which implies the electric power producers can use power grid to transmit the generated electricity only after paying to the PGCs.
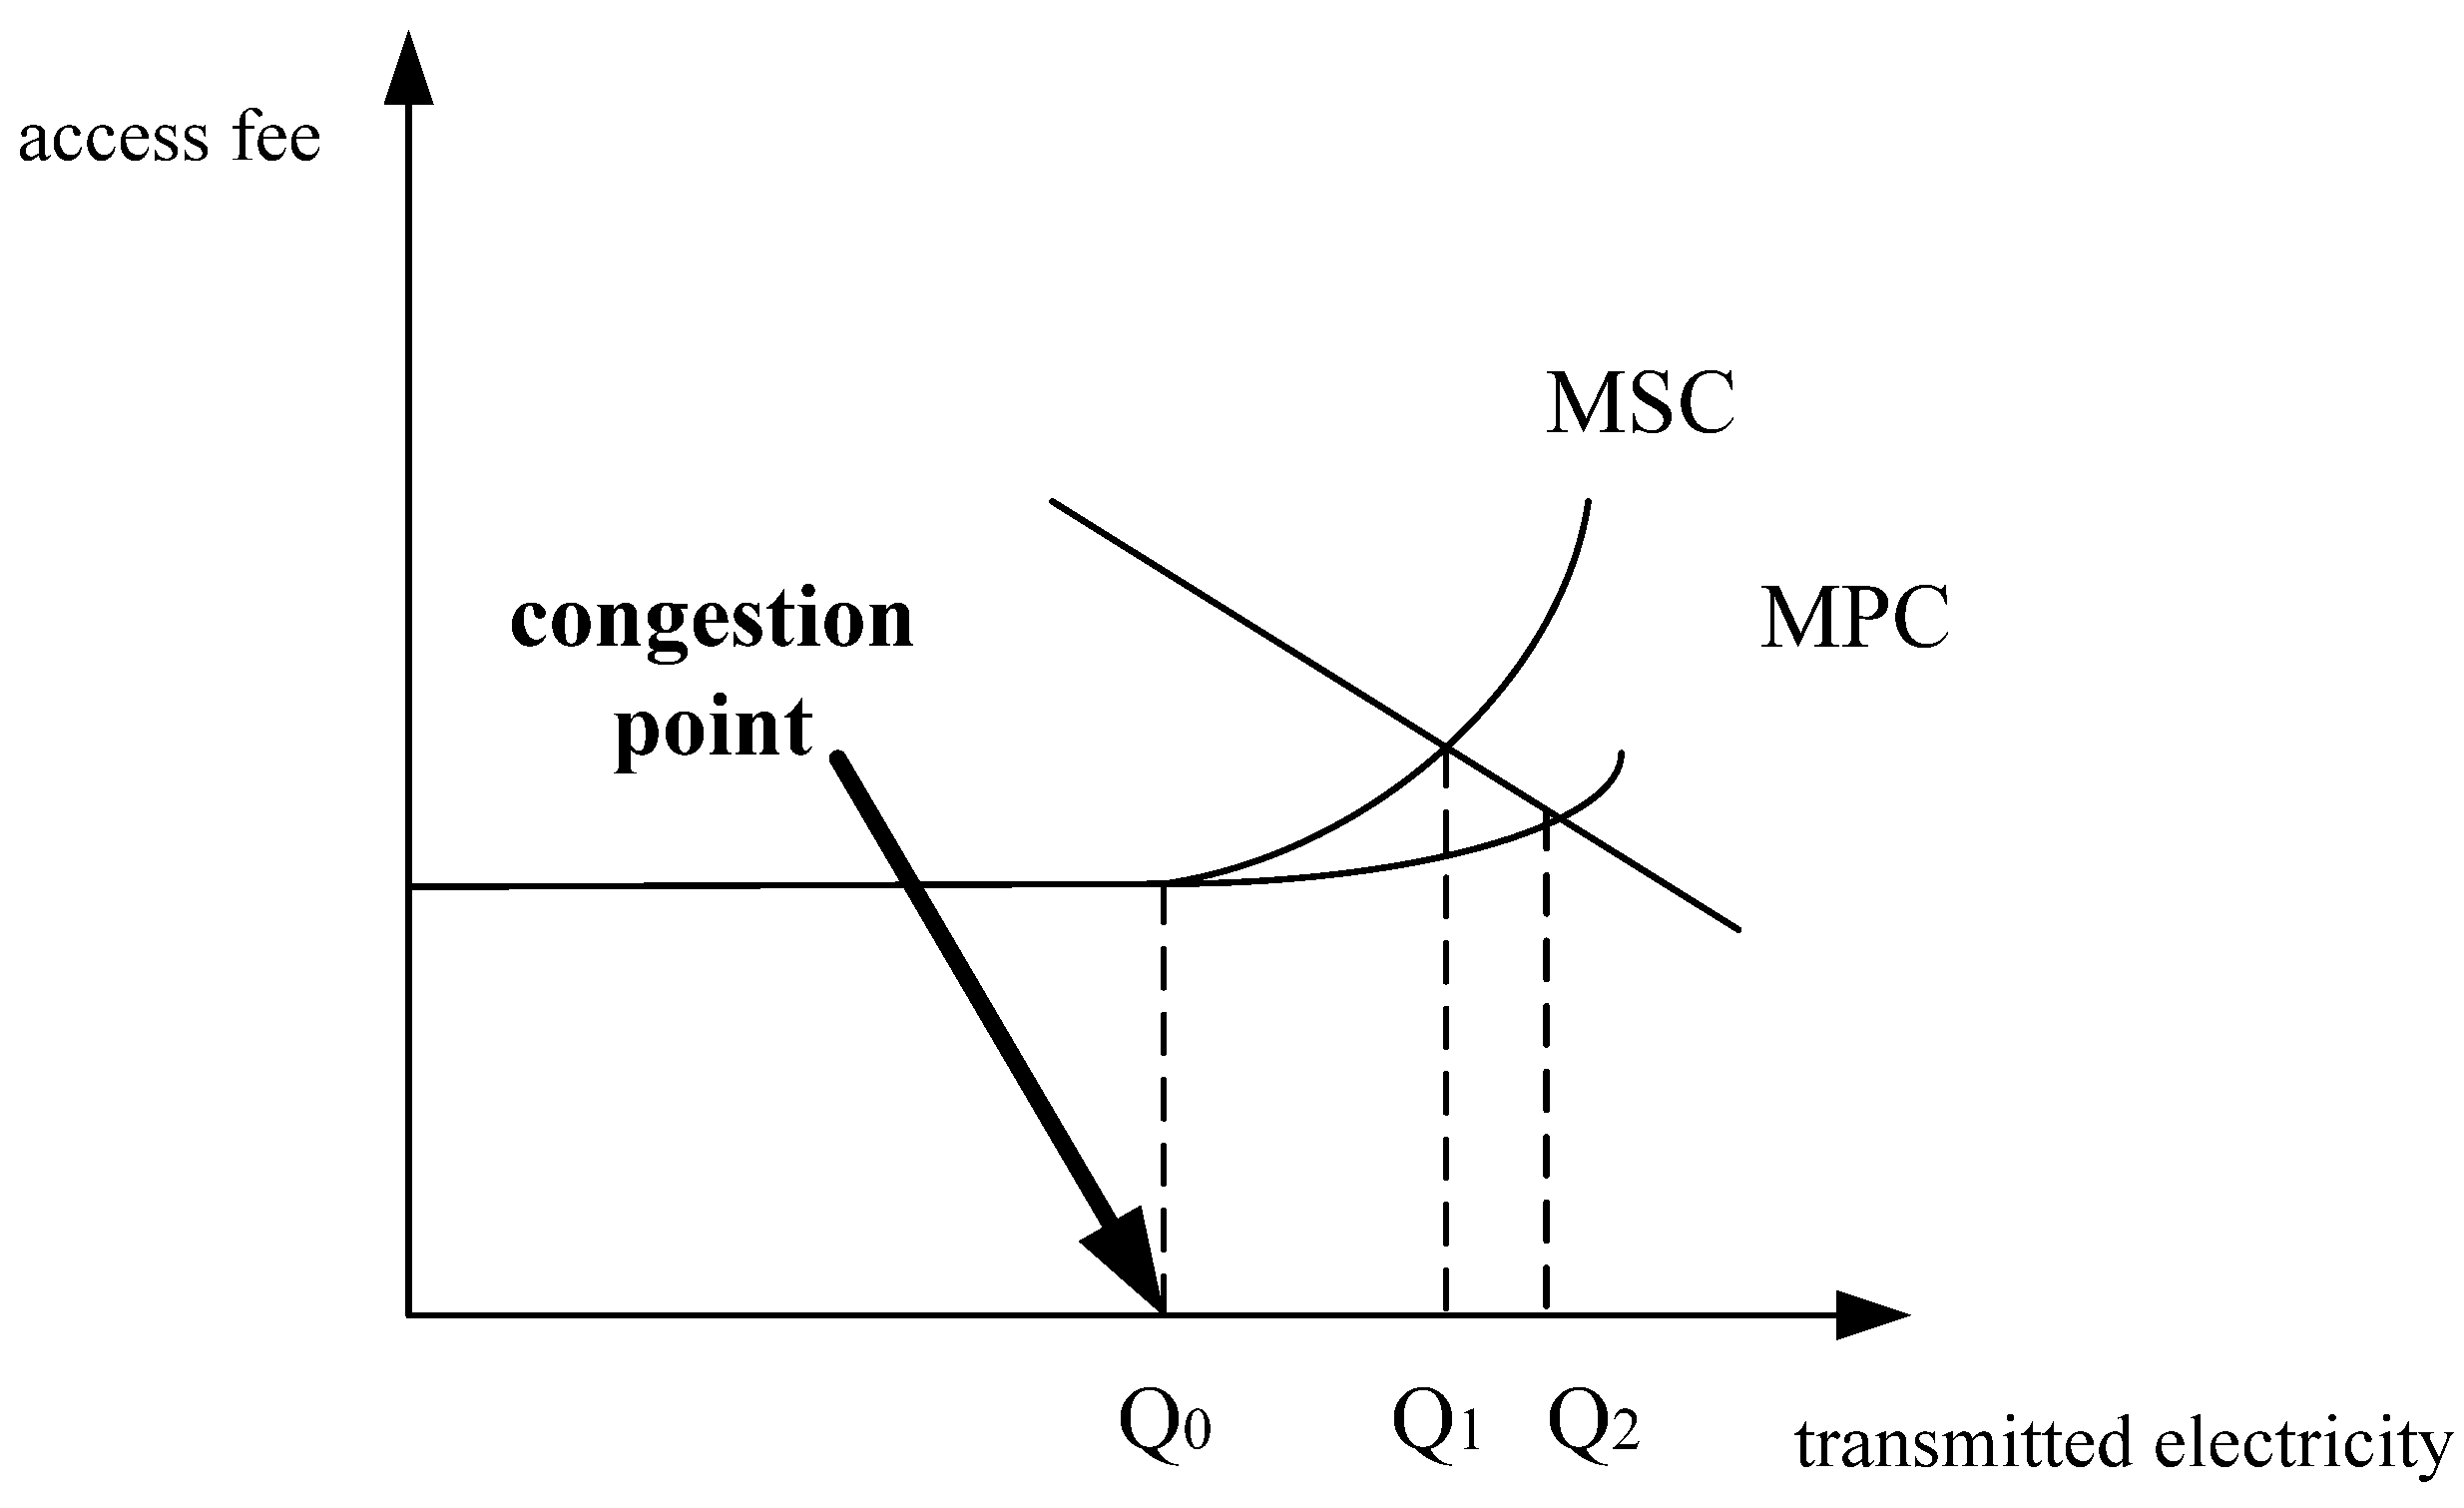
The congestible characteristic of transmission services is described in
Figure 1.
Figure 1.
Congestible characteristic of transmission services.
Figure 1.
Congestible characteristic of transmission services.
As depicted in
Figure 1, when the quantity of electricity transmission (Q) is between 0 and Q
0 (also called ‘congestion point’), the cost of transmission services will not increase with the increase in Q. In this case, the consumption on transmission services is non-competitive. When Q excesses Q
0, the consumption on transmission services will become competitive, and the consumption utilities of previous electric power producers will decline with the increase in Q. On this occasion, the marginal social cost (MSC) will be larger than marginal private cost (MPC). When Q reaches the upper limit of power transmitting capacity, the new electric power producers will make MSC go to infinity because the new facilities for electricity transmission need to be constructed.
It is worth pointing out that the exclusiveness characteristic of transmission services provided by PGCs is always there, but whether there is competitiveness characteristic depends on the conditions of power system.
3. Multiple Subjects of Electric Power System in China
Electric power system is a complex system for electricity production and consumption. Electric power is the core of electric power system, which can be generated by various types of power plants utilizing primary energy resources, such as coal, oil, natural gas, hydro, wind, and solar. After generated, the electricity will be transmitted to consumers via the transmission network.
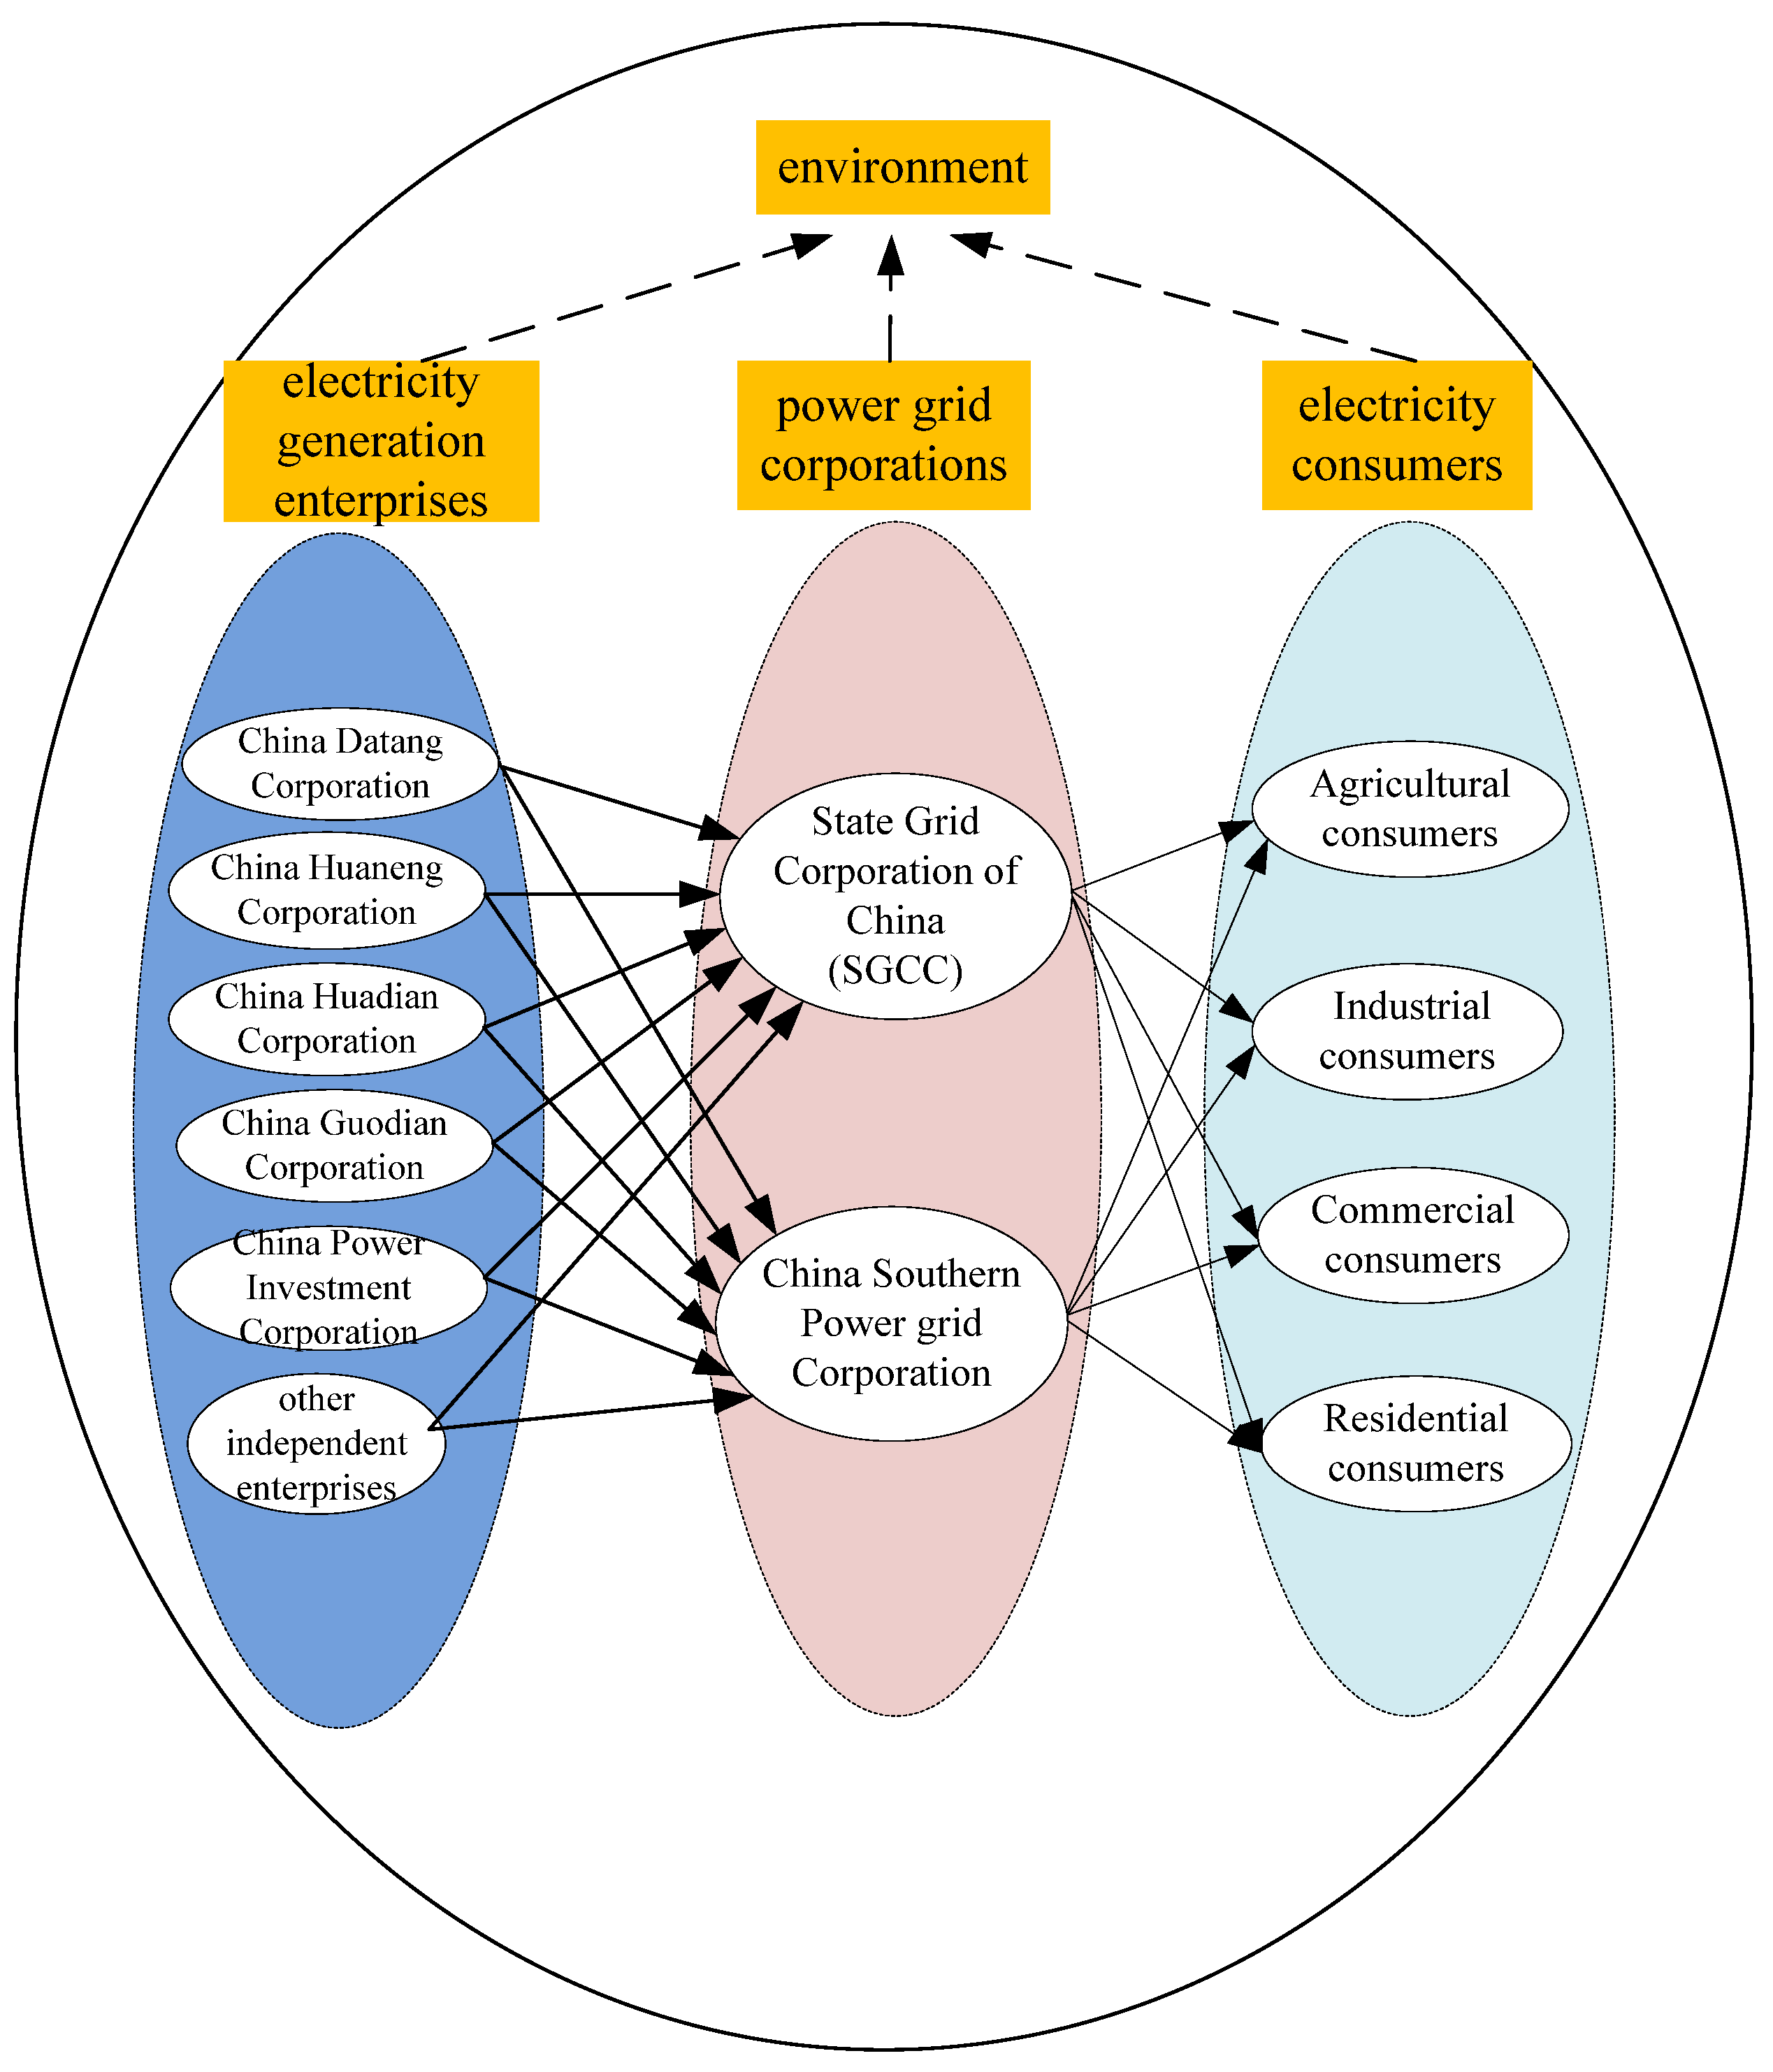
With the adjustment of electric power management system and deepening of electricity market reform in China, the subjects of electric power system have undergone great changes. The current subjects of China’s electric power system include electricity generation enterprises (EGEs), power grid corporations (PGCs), electricity consumers (ECs), and Environment, which are shown in
Figure 2.
Figure 2.
The subjects of China’s electric power system and their relationships.
Figure 2.
The subjects of China’s electric power system and their relationships.
As an important component of electric power system, EGEs utilize primary energy resources, such as fossil and renewable energy, to generate electricity. Therefore, from the view of utilized energy resources, the EGEs can be divided into thermal power enterprises, nuclear power enterprises, wind power enterprises, PV power enterprises, and so on. In China’s electricity market, five state-owned electricity generation corporations are dominant, which are shown in
Figure 2. In the electric power system, the EGEs and ECs distribute in every possible position within the coverage of transmission network. Thus, the transmission network is needed to make the electricity can be transmitted to ECs from EGEs. PGCs provide this kind of transmission services. In China, PGCs possess the step-up transformers, transmission lines, and step-down transformers, who undertake the obligation of electricity transmission and distribution. In China’s electricity market, PGCs mainly include State Grid Corporation of China and China Southern Power Grid Corporation. Electricity generated by EGEs will suffer a small fraction of losses during transmission and distribution, and the majority will be supplied to ECs. ECs include agricultural consumers, industrial consumers, commercial consumers, and residential consumers. As a subject of electric power system, Environment refers to the natural environment which includes atmospheric environment, water environment, and ecological environment.
Four subjects of electric power system are interconnected and interactive. The activity of one subject may exert an impact on other subjects. For example, wind power generation enterprises, as a kind of EGEs, accessing to power grid will decrease the electricity generation of coal-fired power enterprises, and then reduce the revenue of coal-fired power enterprises. Meanwhile, a percent of coal-fired power generation will be substituted, which will reduce the consumption on coal and then bring positive impacts on Environment.
4. Economic Impact Assessment Model of Wind Power Integration from the Quasi-Public Goods Property Perspective
Compared with traditional power generation types such as coal-fired power generation, the wind power has relatively higher generating cost and poorer economy in China [
24,
25]. Meanwhile, the wind power has the characteristics of randomness, intermittency, and anti-peaking, which will bring adverse impacts on the electric power system [
26]. Chinese government has promulgated some laws and supporting policies for promoting the development of renewable energy power. Renewable Energy Law of the People's Republic of China requires that PGCs have the responsibility of purchasing all the renewable energy power generation [
27]. Therefore, the wind power integration will bring both positive and negative impacts on EGEs, PGCs, ECs, and Environment.
The modelling approach of economic impact assessment of wind power integration from the Quasi-public goods property perspective is as follows. Wind-based electricity generated by EGEs is transmitted to ECs via transmission equipment provided by PGCs. The usage of transmission equipment by wind-EGEs will lead to the decrease of available electricity transmission capability for other EGEs such as coal-fired EGEs, and may cause the crowdedness of electricity transmission. Moreover, the generating costs of various types of EGEs are different. Therefore, the wind power integration will make some indicators of electricity market changed, such as feed-in tariff and electricity generation and consumption. Consequently, the economic interests of four subjects will be influenced.
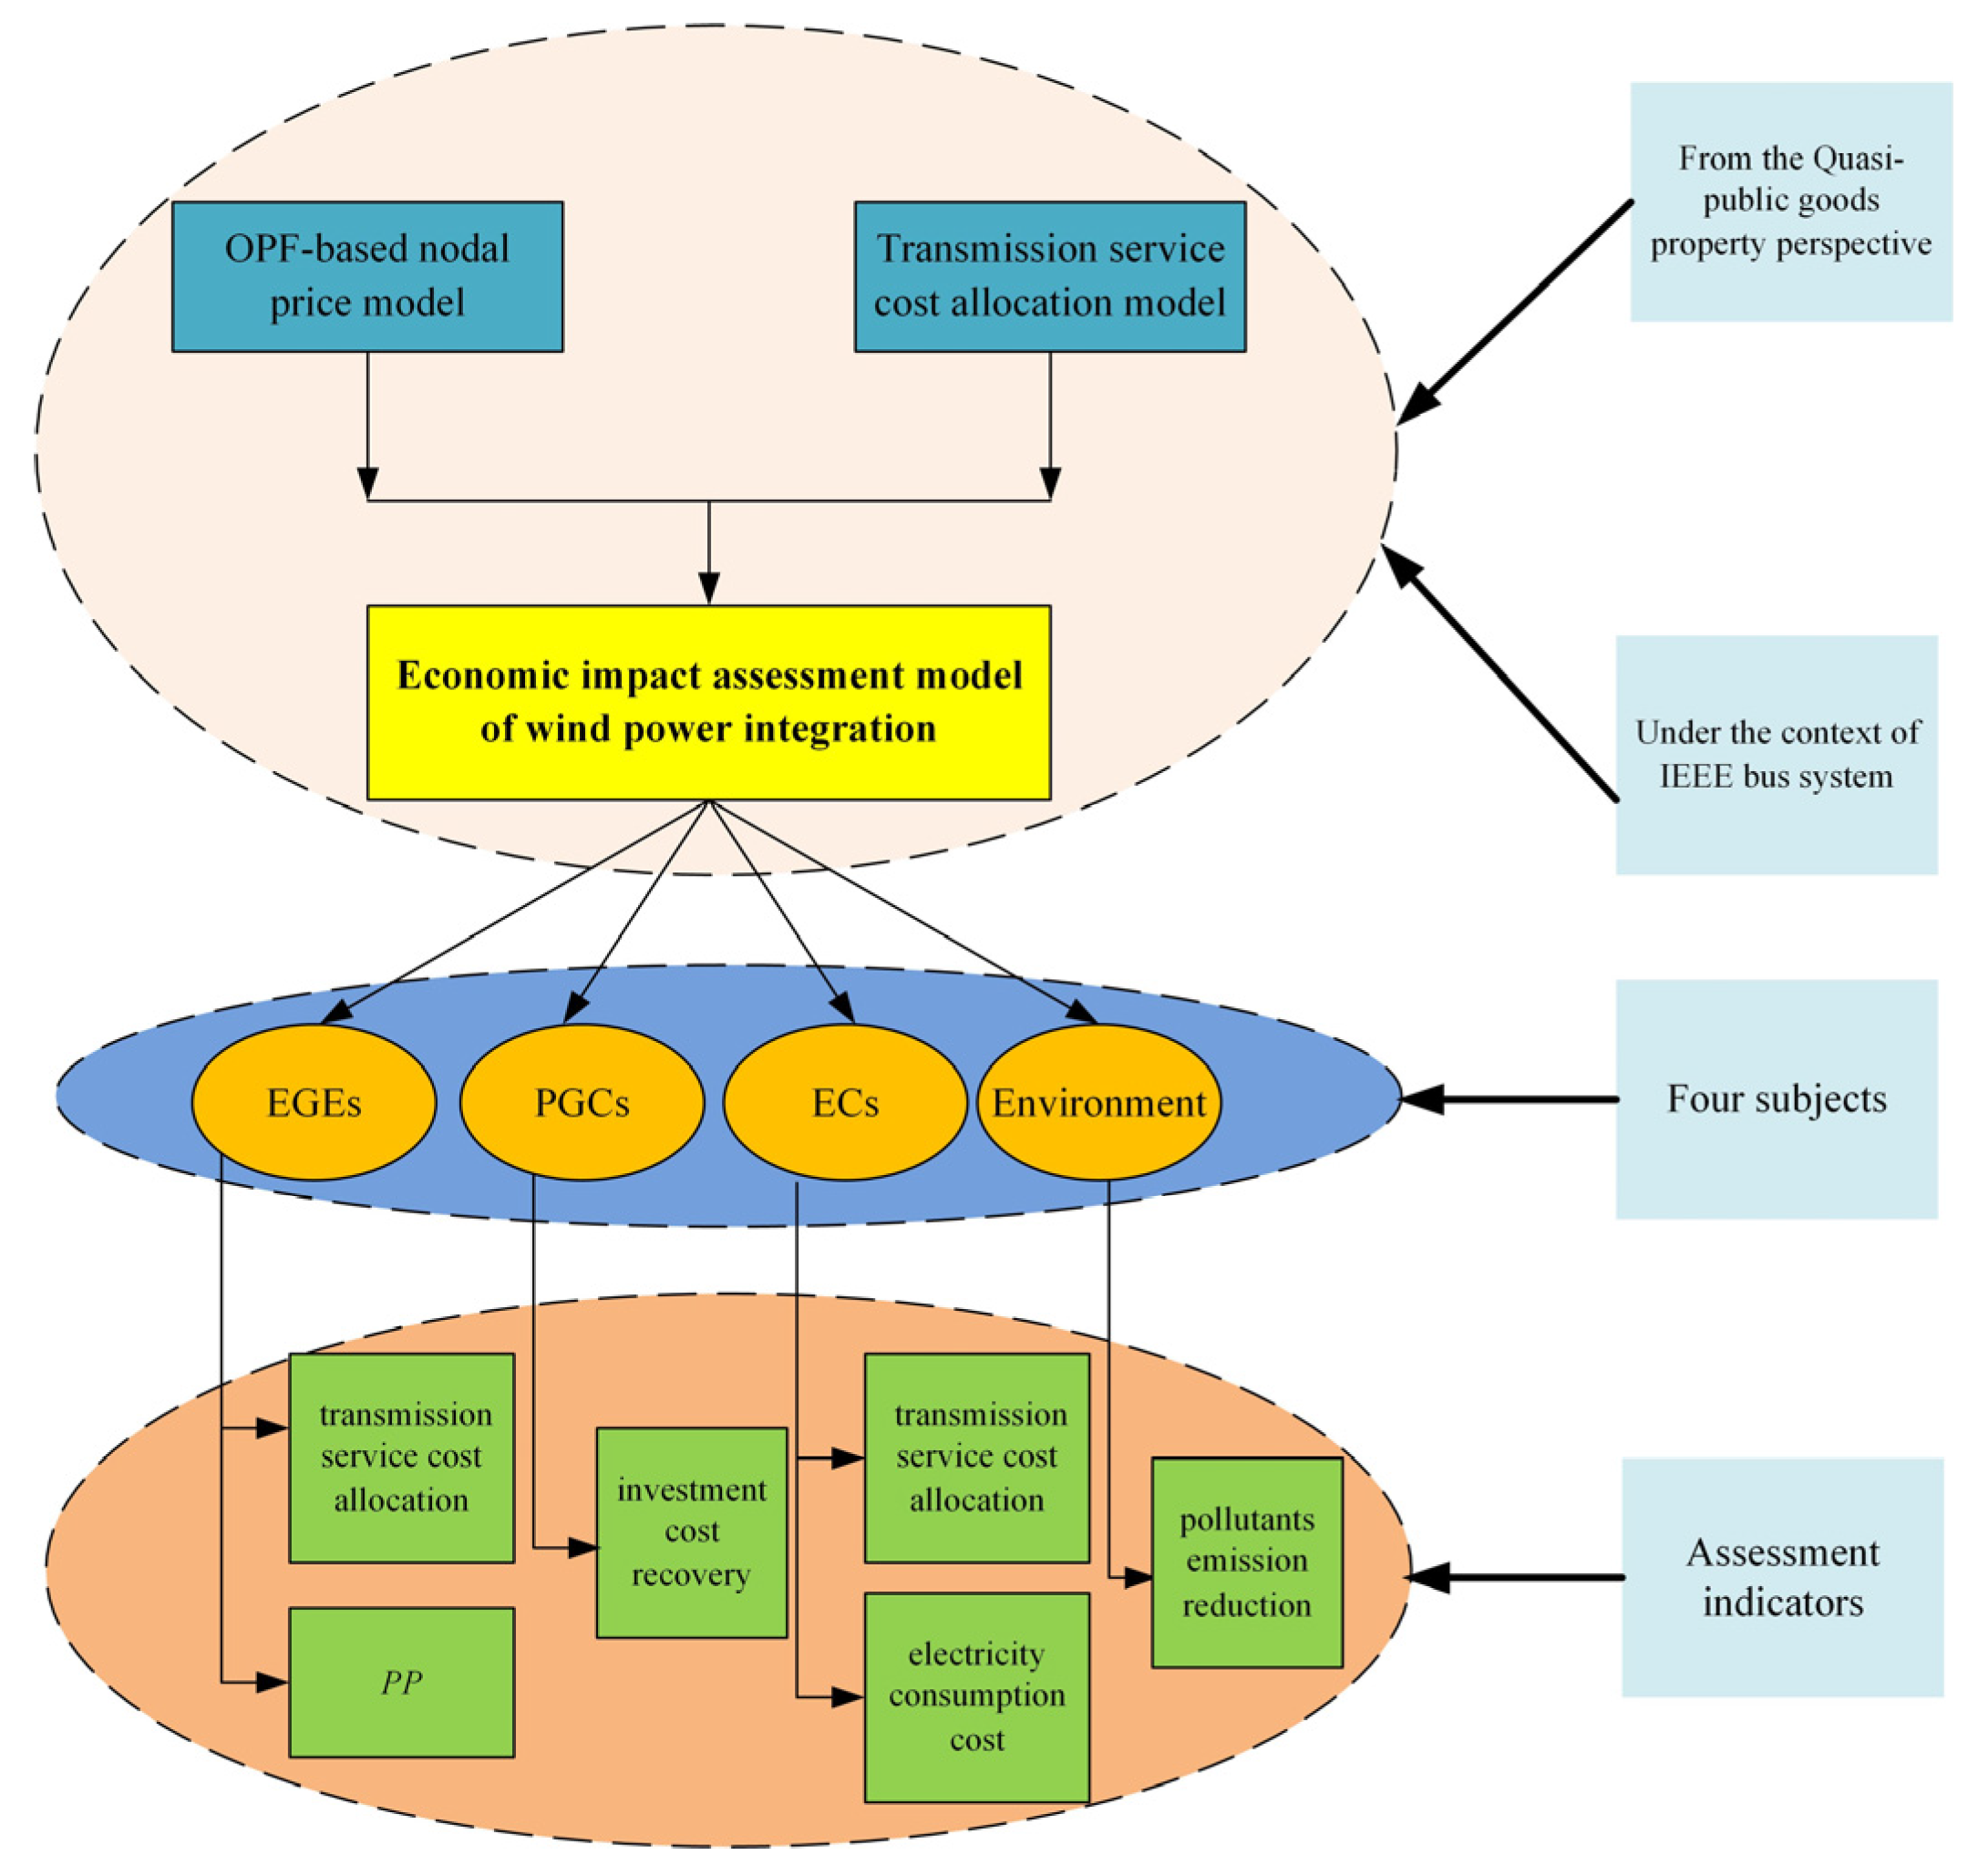
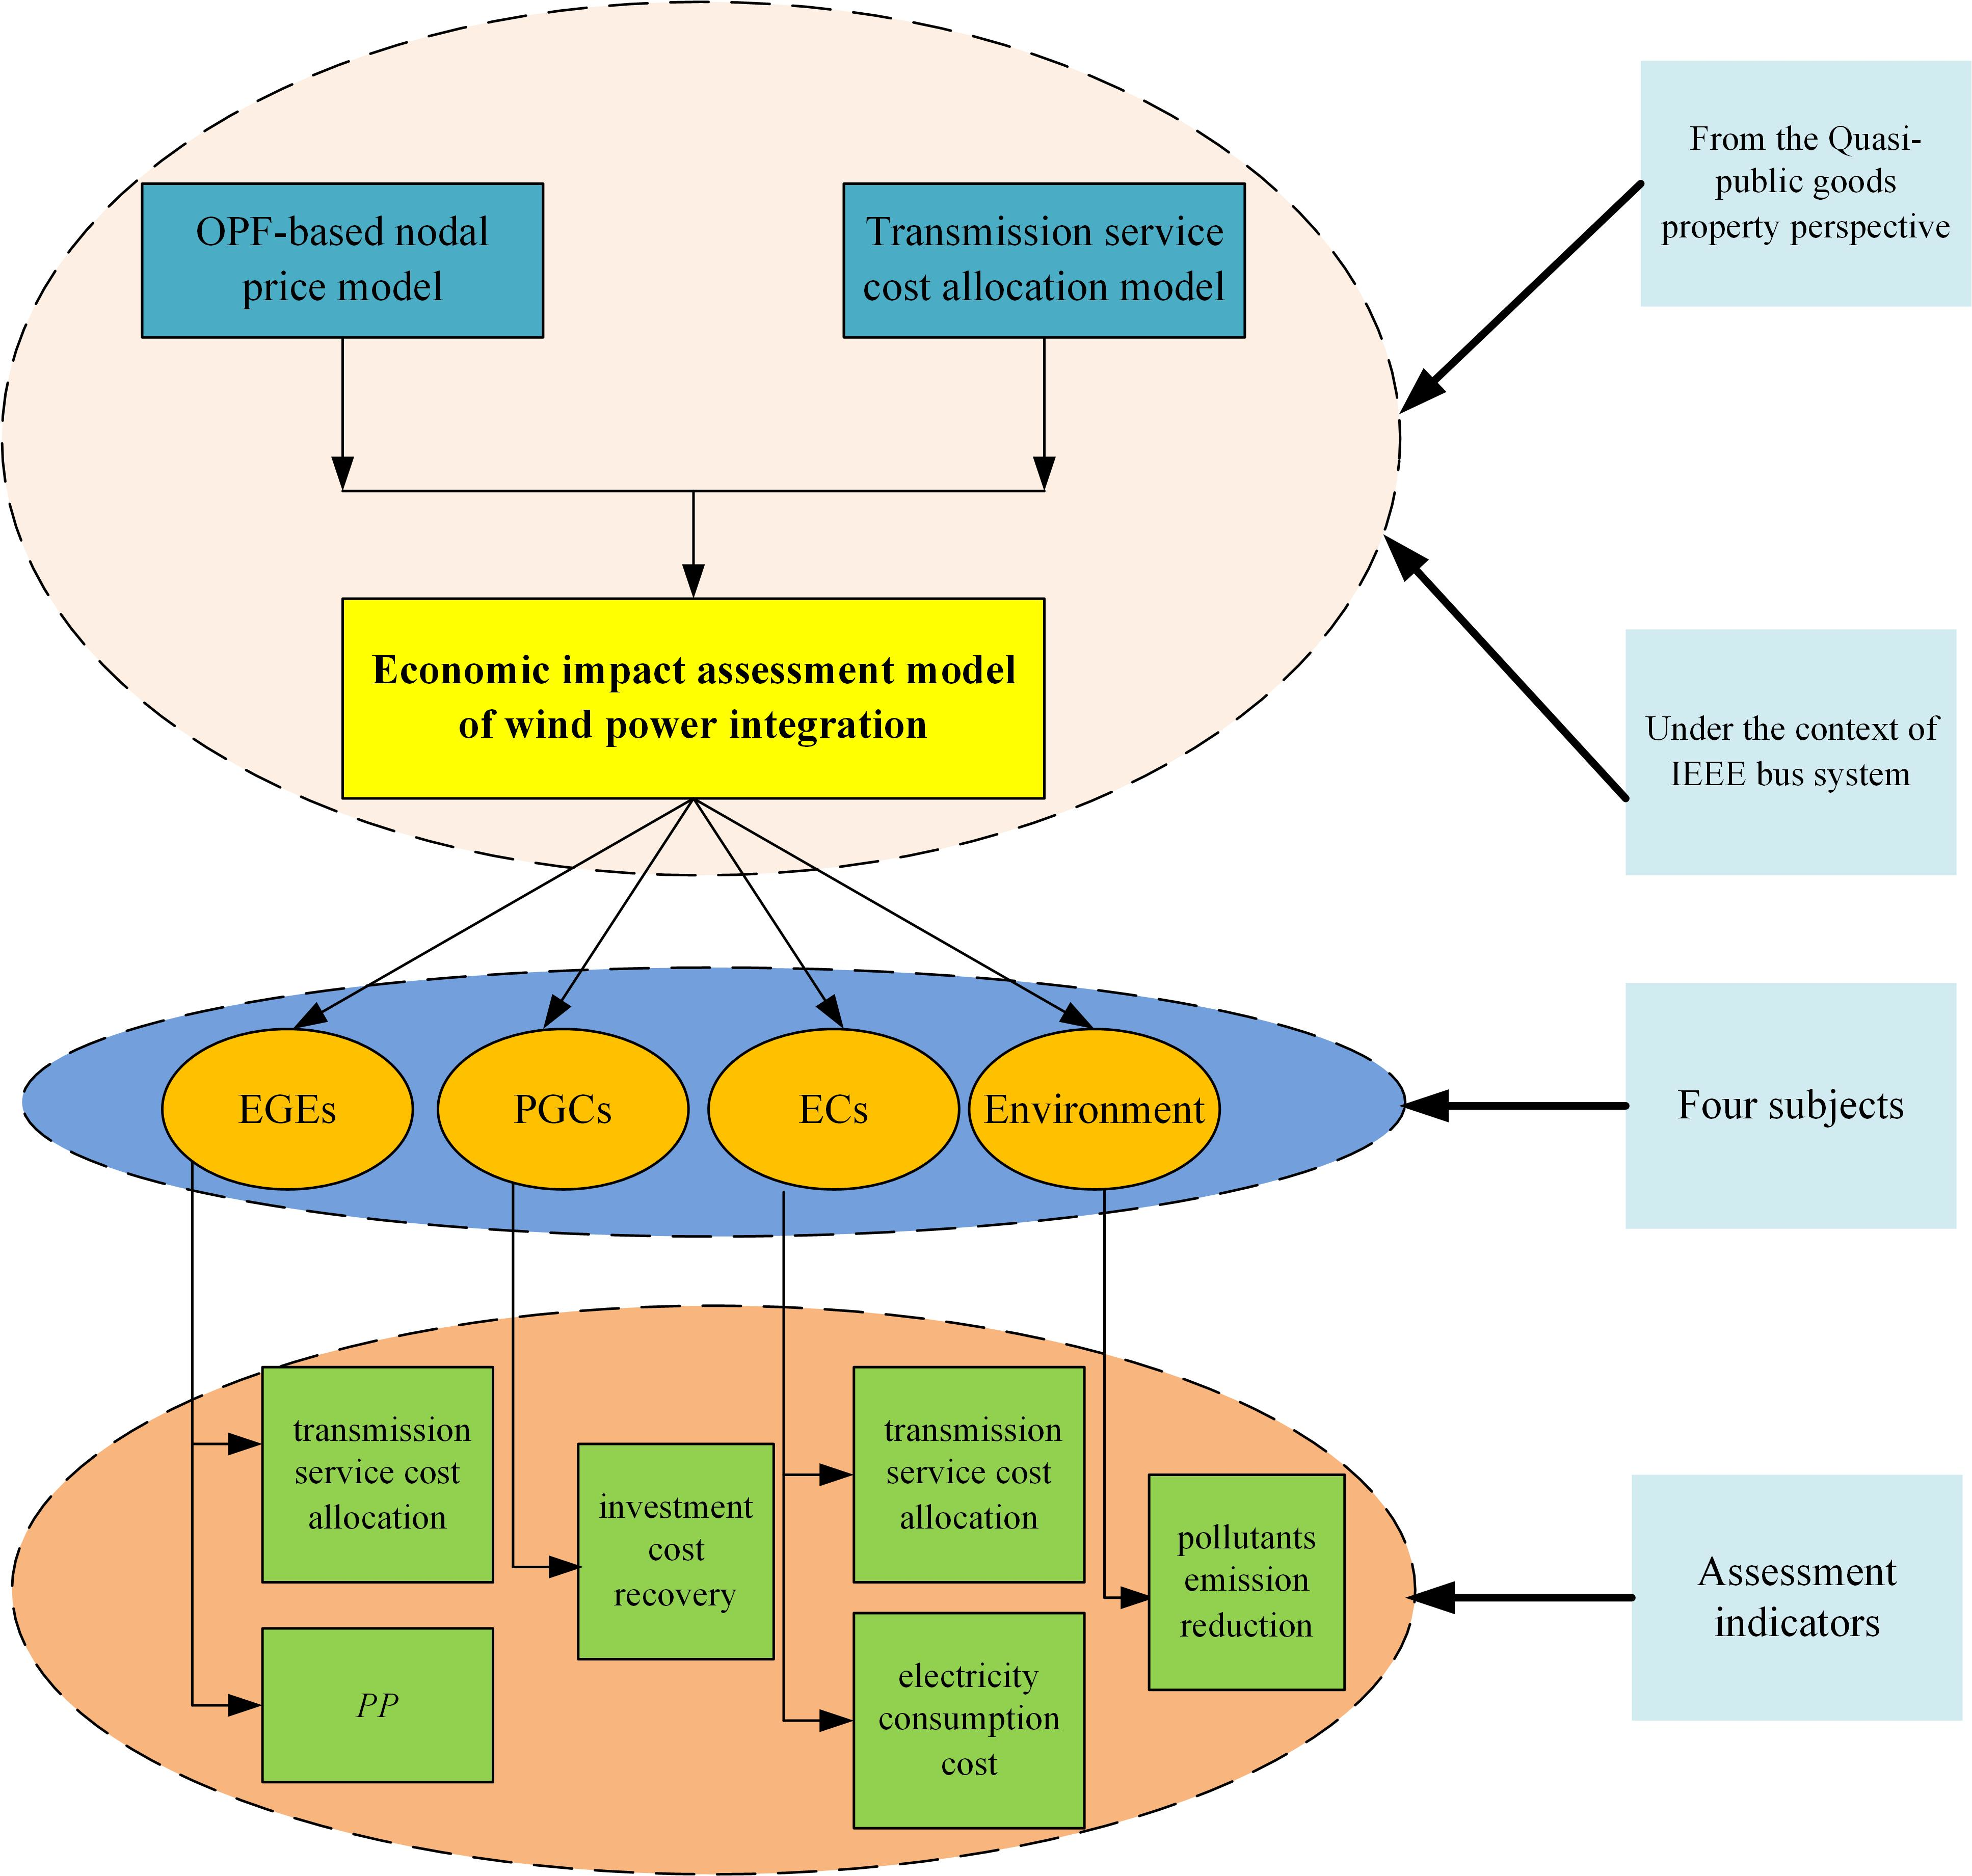
From the Quasi-public goods property perspective, the economic impact assessment model of wind power integration on multiple subjects of China’s electric power system can be built based on OPF-based nodal price model and transmission service cost allocation model. The modeling procedure is as shown in
Figure 3.
Figure 3.
Modeling procedure of economic impact assessment of wind power integration.
Figure 3.
Modeling procedure of economic impact assessment of wind power integration.
4.1. OPF-based Nodal Price Model
As an optimization tool for the planning and operation of electric power system, the optimal power flow (OPF), which combines power flow calculation and economic dispatch, has the ability to find the optimal solution with consideration of security and economy of power system [
28]. Therefore, the OPF has been widely applied in the planning and operation of electric power system in the last decades.
The purpose of OPF issue is to find the optimal control variables to minimize the objective function with consideration of various equality and inequality constraints [
29]. The goal of OPF issue is to minimize the generating cost, which is formulated as follows:
where
f is the total cost of generating units;
and
are the active and reactive power generated by generator
i, respectively;
and
are the cost function of active and reactive power of generator
i, respectively.
Commonly, the cost function of generating units can be written as:
where
c0,
c1, and
c2 are the cost coefficients of generator
i;
K is the profit rate; and
is the maximum power output of generator
i.
The constraints of OPF issue include:
(1) Power flow constraints:
where
and
are the demanded active and reactive power at bus
i, respectively;
and
are the injected active and reactive power at bus
i, respectively;
and
are the voltage magnitude at bus
i and
j, respectively;
is the transfer conductance between bus
i and
j;
is the voltage angle difference between bus
i and
j;
is the transfer susceptance between bus
i and
j.
(2) Generator voltage magnitude constraint:
where
and
are the lower and upper bounds of voltage magnitude at bus
i, respectively.
(3) Line power flow constraint:
where
and
are the lower and upper bounds of active power transmitted by the
i-th branch, respectively.
(4) Generator power output constraints:
where
and
are the lower and upper bounds of active power generated by generator
i, respectively;
and
are the lower and upper bounds of reactive power generated by generator
i, respectively.
The Lagrange function can be built based on the aforementioned objective function and constrains, which is expressed as:
where
are the Lagrange multipliers.
Set
. According to the first-order optimal conditions of
Karush-Kukn-Tucher (
KKT), we can obtain:
By substituting Equation (7) into Equation (8), we can obtain:
Then, the price at each node can be computed by:
4.2. Transmission Service Cost Allocation Model
A fair and effective pricing on the transmission services can not only reduce the effects of transmission monopoly, but also provide coherent economic signals for transmission services providers and users.
How to build a reasonable and effective transmission service cost allocation model is an important topic studied by many researchers in recent years [
30]. M. Ghayeni and R. Ghazi proposed a new method to allocate the transmission service costs from the perspective of nodal pricing [
31]. In this method, the marginal prices are controlled by Ramsey pricing concept, which can ensure the maximization of social welfare subject to the constraint of producer’s minimum profit [
32]. This new transmission service cost allocation method not only guarantees the recovery of total transmission costs, but also provides economic signals for electricity market participants. In this paper, this new transmission service cost allocation method is employed to provide the foundation for building the economic impact assessment model of wind power integration. The basic principles of this new transmission service cost allocation method are introduced as follows.
Ramsey pricing concept is a pricing method which maximizes the social welfare subject to producer’s minimum profit constraint based on the inverse proportionality of price elasticity, which is formulated as follows:
Subject to
where
SW(social welfare) is the sum of consumer’s surplus (
CS) and producer’s profit (
PP);
is the inverse demand function of consumer
i; and
is the cost function of producer
i.
Constructing the Lagrangian function according to Equation (11) and (12), and then performing the first order derivative on
, we can obtain:
where
is the marginal cost of producer
i;
is the Lagrange multipliers associated with the producer’s break-even constraint.
Define the price elasticity of consumer
i as:
By substituting Equation (14) into (13), we obtain the standard Ramsey-Boiteux formula:
Substitute the locational marginal price (LMP) and new nodal price (NNP) for
and
, and Equation (15) can be rewritten as follows:
In order to meet the constraint of total transmission service cost recovery, the
NNP needs to be controlled, namely
where
and
are the demanded and injected power at node
i respectively;
TNC is the transmission service cost allocated to electricity consumers and producers at each hour of electricity market.
Substitute Equation (16) into (17), an equation in term of
can be obtained:
Set
, which is called Ramsey factor. Then, Equation (18) is translated to:
For calculating
R, the method of minimum deviation of
NNPs from
LMPs is employed, which can be calculated by:
By substituting the calculated
R in (16), the
NNPs are determined. Now, the share of each consumer and producer in transmission service costs can be calculated respectively, just as follows:
where
and
are the share of electricity producers and consumers in transmission service cost at node
i, respectively.
4.3. Economic Impact Assessment Model of Wind Power Integration
On the basis of OPF-based nodal price model and transmission service cost allocation model, the economic impact assessment model of wind power integration on multiple subjects of China’s electric power system under the context of IEEE bus system can be built from the Quasi-public goods property perspective.
4.3.1. Economic Impacts on EGEs
The economic impacts of wind power integration on the EGEs contain two categories, namely the transmission service cost allocation and producer’s profit (PP).
The variation of EGEs’ allocated transmission service cost due to wind power integration can be calculated by:
where
is the variation of transmission service cost allocation of EGEs;
is the share of EGEs in the transmission service cost at bus
i;
is the locational marginal price at bus
i;
is the Ramsay-improved new nodal price at bus
i; superscript
a and
b denote after and before the integration of wind power respectively, similarly hereinafter.
The change of EGEs’
PP due to wind power integration can be calculated by:
where
is the change value of EGEs’ profit;
is the profit of EGEs;
is the feed-in tariff of generating units at bus
i.
4.3.2. Economic Impacts on PGCs
The economic impact of wind power integration on PGCs refers to the change of investment cost recovery. The investment cost recovery of PGCs is represented by the proportion of revenue on total transmission cost. So, the economic impact of wind power integration on PGCs’ investment cost recovery can be calculated by:
where
represents the change of transmission cost recovery of PGCs due to the wind power integration;
is the transmission cost recovery rate of PGCs.
4.3.3. Economic Impacts on ECs
The economic impacts of wind power integration on ECs contain two categories, namely the transmission service cost allocation and electricity consumption expenditure.
The variation of ECs’ transmission service cost allocation due to wind power integration can be calculated by:
where
is the variation of transmission service cost allocation of ECs; and
is the share of ECs in the transmission service cost at bus
i.
The variation of ECs’ electricity consumption expenditure due to wind power integration can be calculated by:
where
is the variation of electricity consumption cost;
is the electricity consumption cost.
4.3.4. Economic Impacts on Environment
The economic impact of wind power integration on Environment refers to the benefit of emission reduction of pollutants, which can be calculated by:
where
EB is the reduction benefit of pollutant emission due to wind power integration;
is the average consumption rate of standard coal consumed by coal-fired power plants;
is the power generation reduction of coal-fired power plants due to the wind power integration;
is the emission rate of pollutant
i;
is the environmental value of pollutant
i;
i stands for pollutants,
i.e., SO
2, NO
X, CO
2, CO, TSP, coal ash, and coal cinder.
5. Simulation Analysis
The economic impact analysis of wind power integration on multiple subjects of China’s electric power system is performed under the context of IEEE-24 bus system. After calculating the basic indicators such as LMP, NNP, and power output, the economic impacts of wind power integration on EGEs, PGCs, ECs, and Environment can be assessed according to Equations (24)–(29).
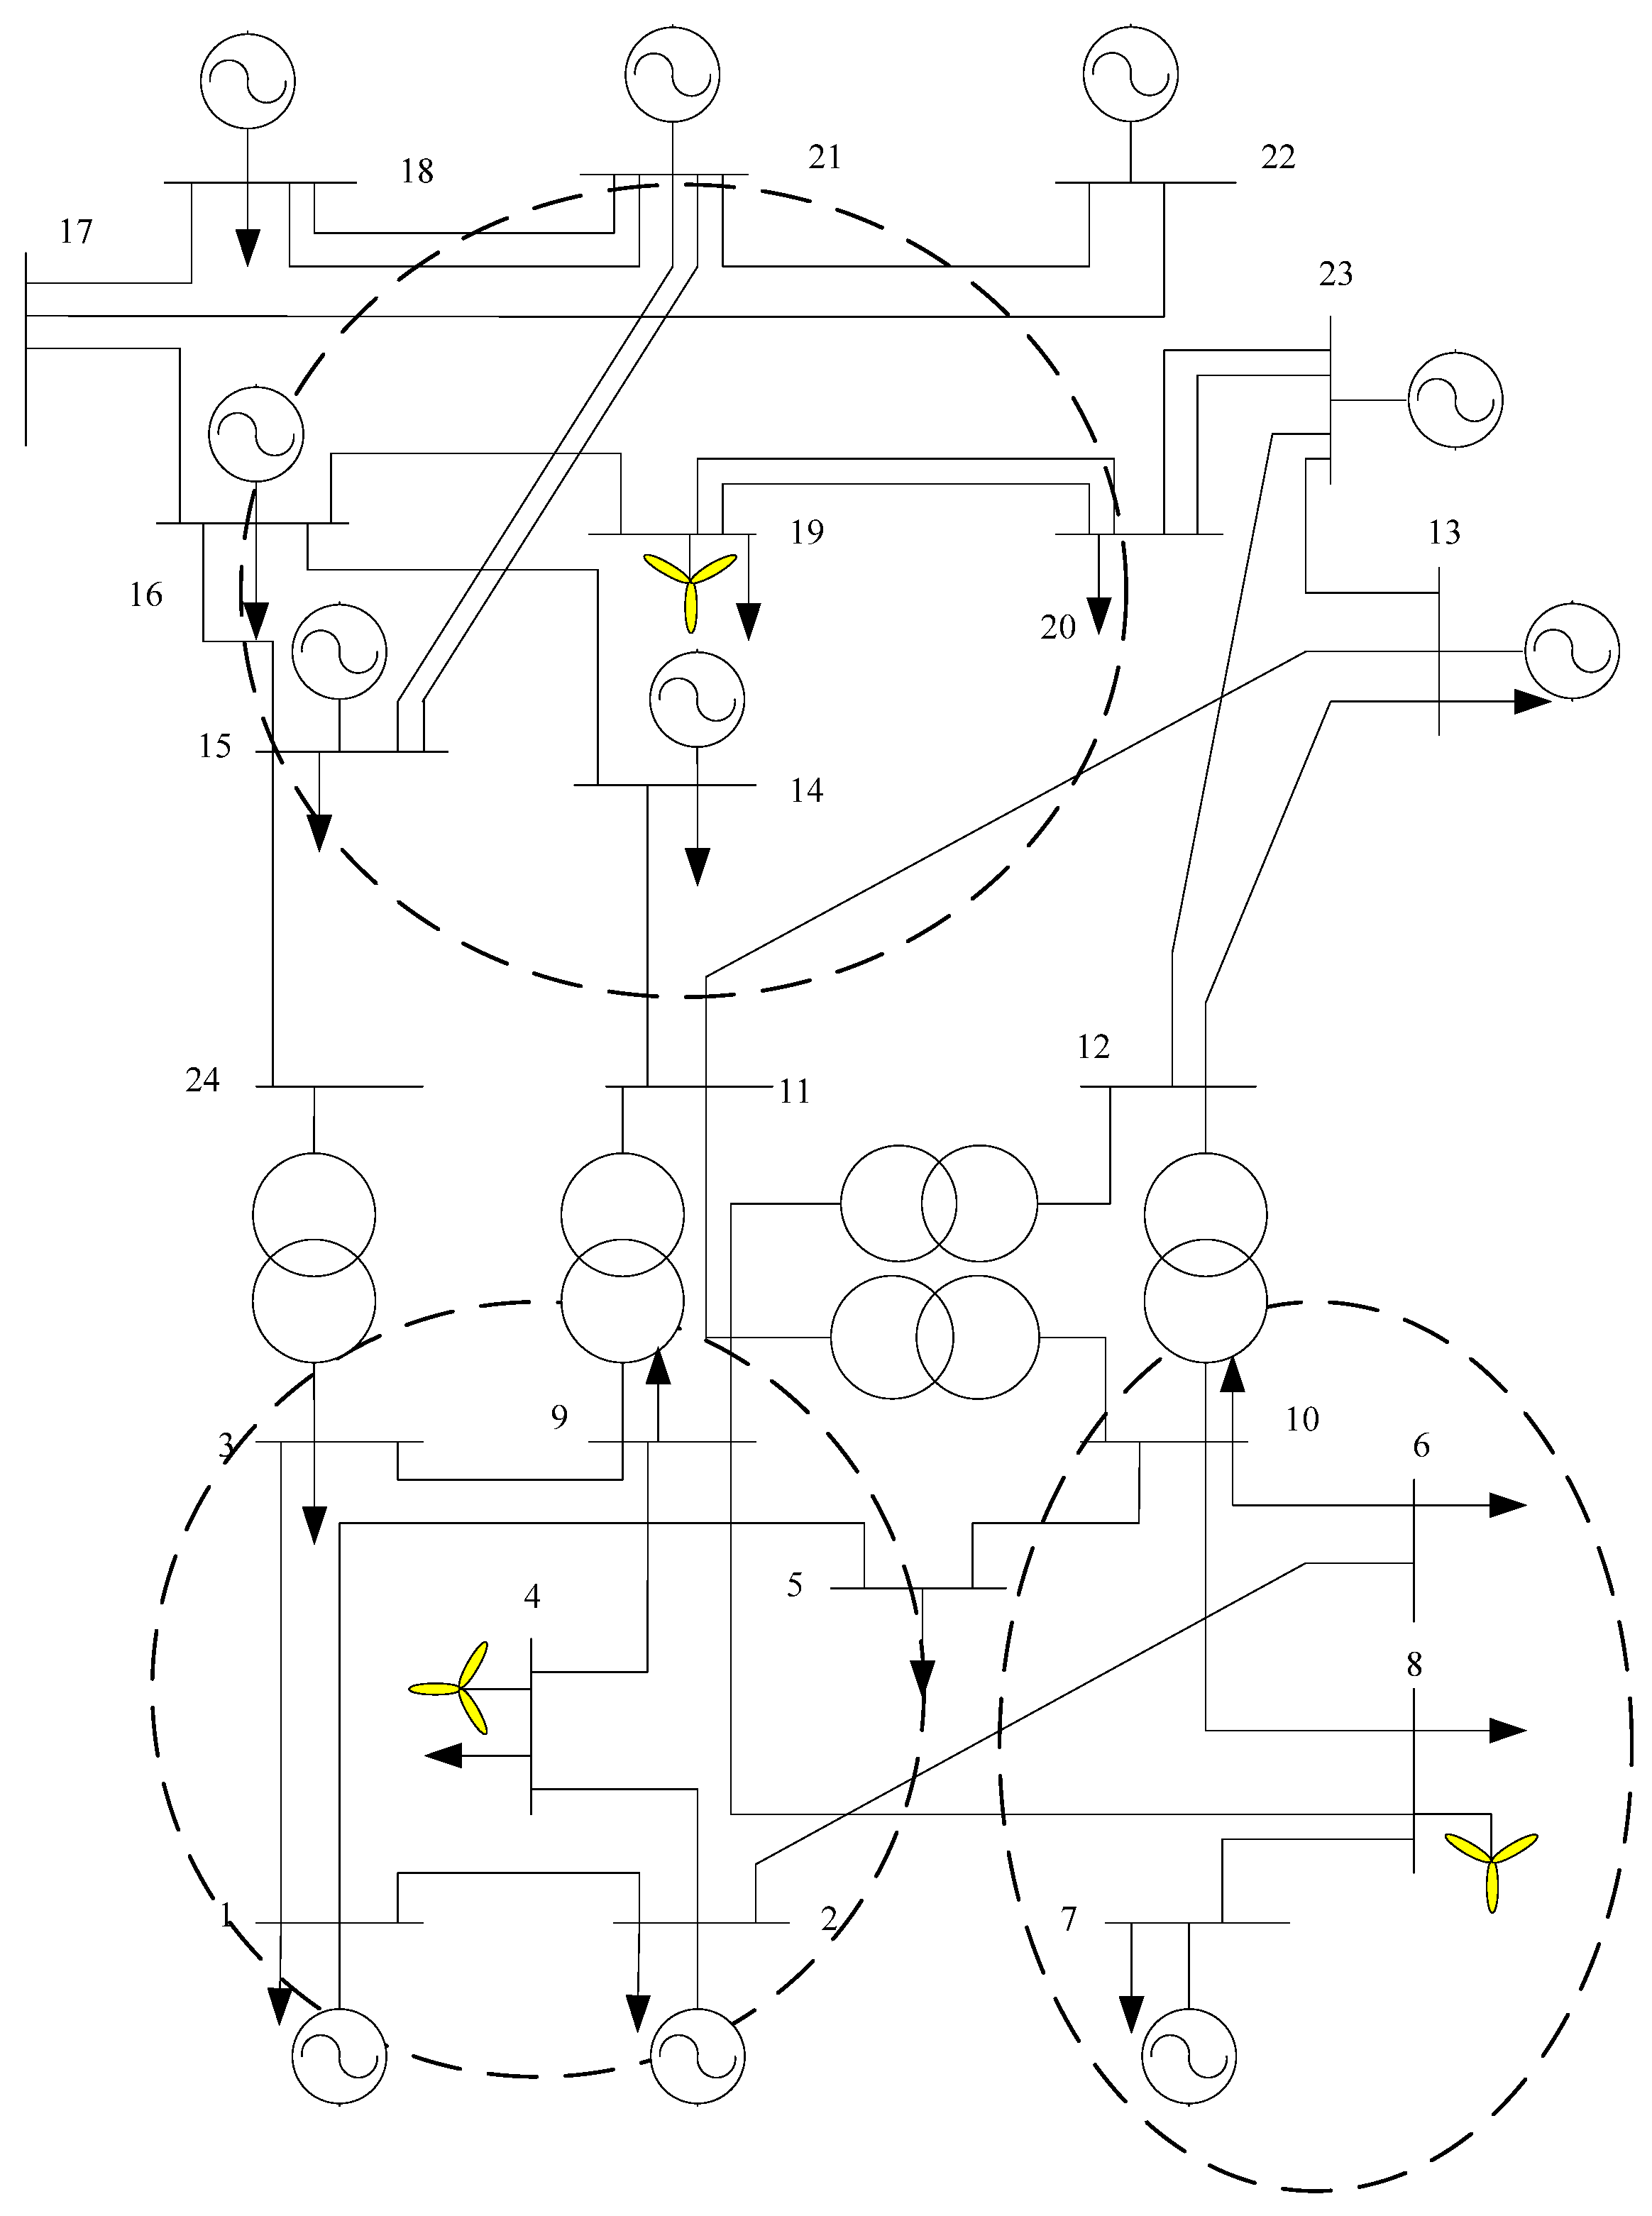
5.1. IEEE-24 Bus System and Wind Turbine Modeling
The basic IEEE-24 bus system is elaborated in [
33].This system contains two voltage levels of 138 kV and 230 kV, as well as 33 transmission lines connected together via five transformers. The generation capacity is 3405 MW, and the annual peak load of system is 2850 MW and 580 MVAr. The
TNC contains lines and substations costs as well as operating cost.
To assess the economic impacts of wind power integration on multiple subjects of China’s electric power system, some parameters of IEEE-24 bus system need to be adjusted according to the practical situation of China’s electric power system. The parameters of generating units and generating cost are adjusted, which are shown in
Table 1. In view of the grid-connected power generation and geographical distribution of China’s wind power, three wind units are located at bus 4, 8, and 19 in the IEEE-24 bus system, as shown in
Figure 4.
Table 1.
The parameters of generating units and costs.
Table 1.
The parameters of generating units and costs.
| Bus | Pg | Pmax | Pmin | C |
|---|
| C2 | C1 | C0 |
|---|
| 1 | 170 | 170 | 40 | 0.00834 | 12.3883 | 382.2391 |
| 2 | 150 | 150 | 35 | 0.00834 | 12.3883 | 382.2391 |
| 7 | 240 | 300 | 75 | 0.00717 | 48.5804 | 832.7575 |
| 13 | 280 | 350 | 140 | 0.00489 | 11.8495 | 665.1094 |
| 14 | 0 | 0 | 0 | 0.00012 | 3.8733 | 523.6742 |
| 15 | 220 | 220 | 44 | 0.00717 | 48.5804 | 832.7575 |
| 16 | 155 | 155 | 54.3 | 0.00834 | 12.3883 | 382.2391 |
| 18 | 400 | 400 | 100 | 0.00021 | 4.4231 | 395.3749 |
| 21 | 400 | 400 | 100 | 0.00021 | 4.4231 | 395.3749 |
| 22 | 300 | 300 | 60 | 0.00489 | 11.8495 | 665.1094 |
| 23 | 350 | 350 | 140 | 0.00489 | 11.8495 | 665.1094 |
Figure 4.
IEEE-24 bus system with wind power integration.
Figure 4.
IEEE-24 bus system with wind power integration.
The power output of wind turbine largely depends on wind speed. Generally, the behavior of wind velocity in a given site can be specified as a probability distribution function [
34]. A large number of measured data reveal that the probability distribution of annual average wind speed can be described by a Weibull probability distribution [
35]. The probability density function of wind speed, denoted by
f1(
v), is given in Equation (30). By integrative approach, the probability distribution function (
PDF) of wind speed, denoted by
F1(
v), can be obtained, just as shown in Equation (31).
where
v is wind speed;
C is the shape coefficient of Weibull
PDF, which represents the value of average wind speed;
s is the scale coefficient of Weibull
PDF, which represents the characteristic of wind speed distribution.
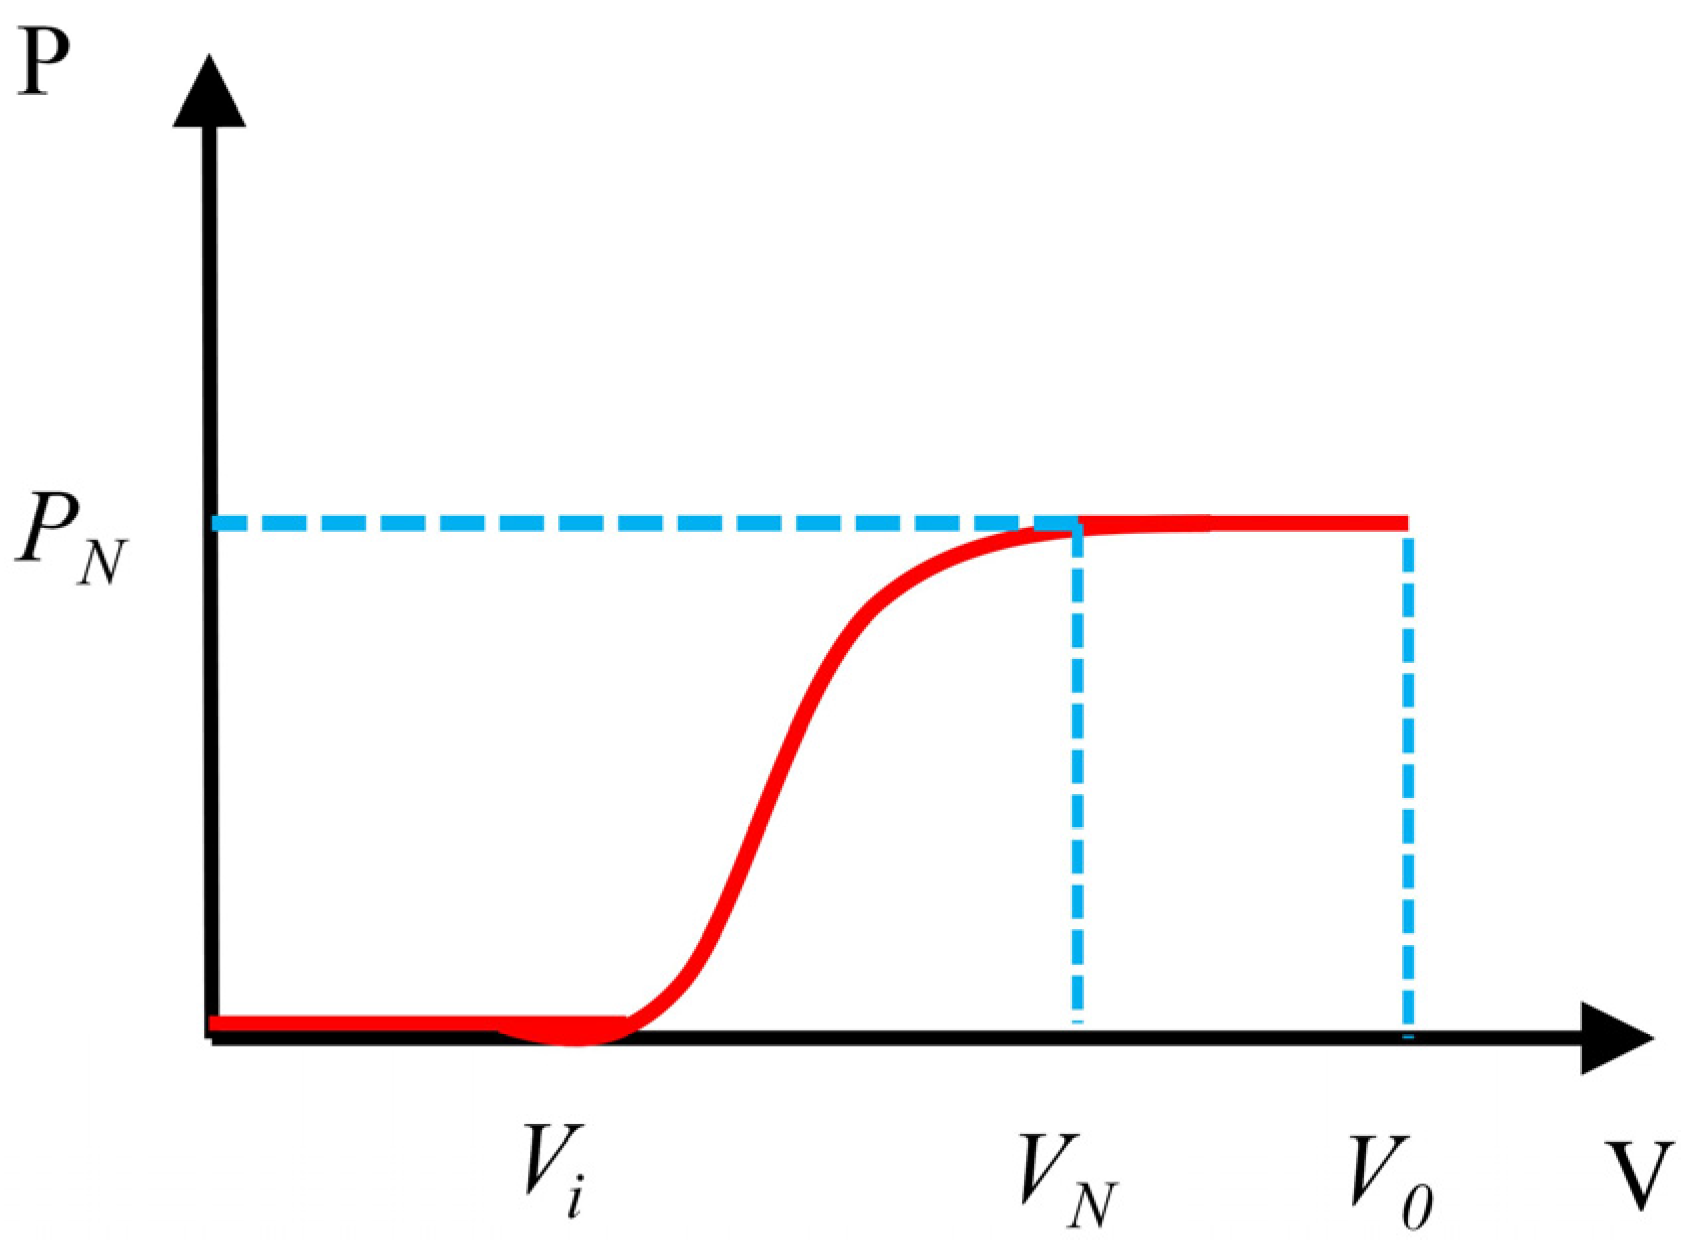
The relationship between power output of wind turbine and wind speed can be described by the power curve of wind turbine, just as shown in
Figure 5. The mathematical expression of power curve is given by:
Figure 5.
The power curve of wind turbine.
Figure 5.
The power curve of wind turbine.
The wind turbine starts to generate electricity at cut-in wind speed vi and reaches its rated power PN when wind speed rises to vN. When wind speed v is less than cut-in wind speed vi or more than cut-out wind speed vo, the power output of wind turbine will equal to 0. After v reaches vN, if it continues to increase, the power output will remain constant at PN up to v reaching vo.
5.2. Numerical Results
In China, PGCs need purchase all the electricity produced by renewable energy generators according to Renewable Energy Law of the People's Republic of China. So, the renewable power generation has a priority in power grid dispatching. Based on this situation, all electricity generated by wind-EGEs will be purchased by PGCs.
The simulation is performed in the MATLAB environment incorporating some features of MATPOWER 4.1 toolbox [
36,
37]. The calculation results of power output of generating units and
LMP at each bus in IEEE-24 bus system are listed in
Table 2. It can be seen that: (1) the power output of three wind turbines are 50MW, 80MW, and 115MW, respectively; (2) the power output of most coal-fired power generating units decline; and (3) the
LMP increases due to the integration of wind power.
Table 2.
Power output and LMP at each bus in IEEE-24 bus system.
Table 2.
Power output and LMP at each bus in IEEE-24 bus system.
| Bus | Before the wind power integration | After the wind power integration |
|---|
| Output power/MW | LMP/(RMB Yuan/kWh) | Output power/MW | LMP/(RMB Yuan/kWh) |
|---|
| 1 | 170 | 0.5187 | 170 | 0.5934 |
| 2 | 150 | 0.5192 | 110 | 0.5969 |
| 3 | 0 | 0.5171 | 0 | 0.5843 |
| 4 | 0 | 0.5309 | 50 | 0.5890 |
| 5 | 0 | 0.5284 | 0 | 0.5883 |
| 6 | 0 | 0.5364 | 0 | 0.6981 |
| 7 | 232.64 | 0.5192 | 219.49 | 0.5273 |
| 8 | 0 | 0.5361 | 85 | 0.5539 |
| 9 | 0 | 0.5199 | 0 | 0.5744 |
| 10 | 0 | 0.5228 | 0 | 0.5652 |
| 11 | 0 | 0.5188 | 0 | 0.5695 |
| 12 | 0 | 0.5172 | 0 | 0.5679 |
| 13 | 350 | 0.5102 | 315 | 0.5610 |
| 14 | 0 | 0.5122 | 0 | 0.5637 |
| 15 | 75.90 | 0.4967 | 220 | 0.5473 |
| 16 | 155 | 0.4970 | 155 | 0.5477 |
| 17 | 0 | 0.4877 | 0 | 0.5390 |
| 18 | 400 | 0.4849 | 305 | 0.5368 |
| 19 | 0 | 0.4982 | 115 | 0.5486 |
| 20 | 0 | 0.4950 | 0 | 0.5476 |
| 21 | 400 | 0.4834 | 380 | 0.5343 |
| 22 | 300 | 0.4711 | 240 | 0.5206 |
| 23 | 660 | 0.4917 | 550 | 0.5442 |
| 24 | 0 | 0.5102 | 0 | 0.5694 |
In the transmission service cost allocation model, how to determine the elasticity value which involves many uncertainties is a complex task. To obtain the price elasticity value [
31], considered four typical cases,
i.e., (i) the values of price elasticity for all nodes are unity; (ii) the magnitudes of price elasticity for all consumers are equal to −1 and for all producers are equal to +1; (iii) the price elasticity of one node is much lower than other nodes; and (iv) the rate of change of power with respect to price is equal for all consumers and producers. In this paper, this method is also employed.
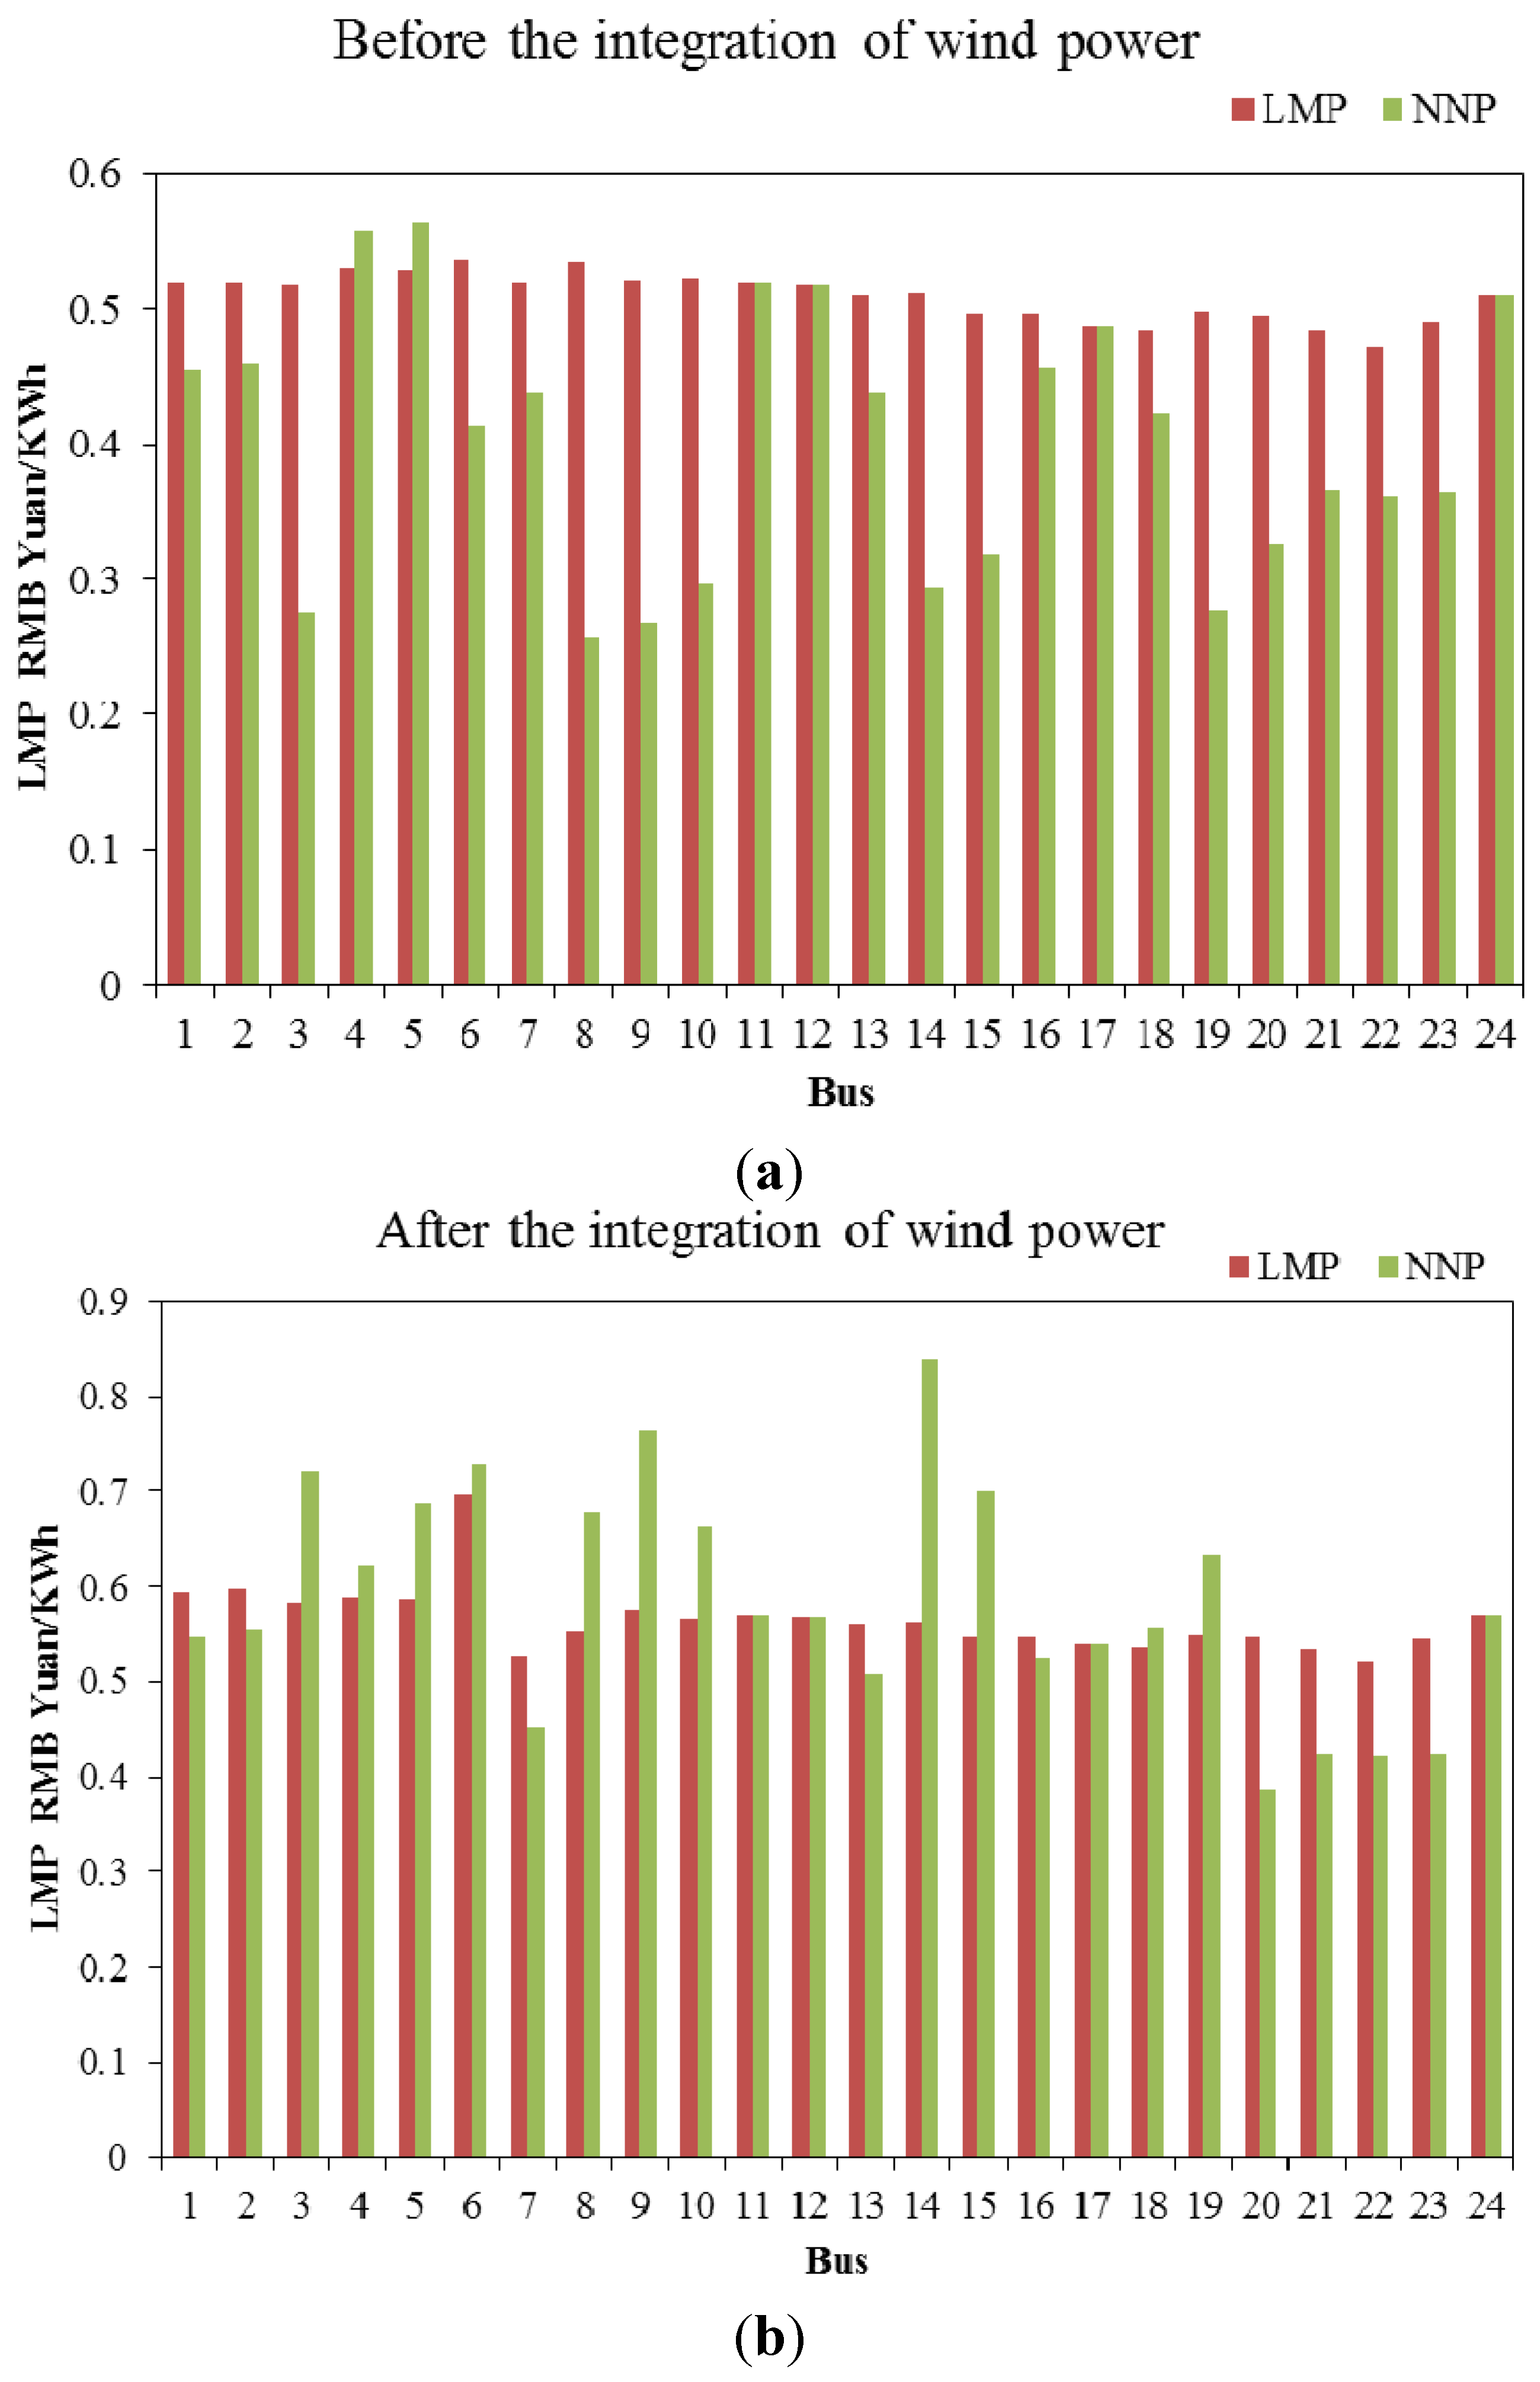
The calculation results of
NNP before and after the integration of wind power are shown in
Figure 6a,b, respectively.
Figure 6.
LMP and NNP (a) before and (b) after the integration of wind power.
Figure 6.
LMP and NNP (a) before and (b) after the integration of wind power.
5.2.1. Economic Impacts on EGEs
(1) Transmission service cost allocation
The allocated transmission service cost of coal-fired EGEs before and after the integration of wind power can be calculated according to Equation (24), and the results are listed in
Table 3. It can be seen that the allocated transmission service cost of most coal-fired EGEs have declined after the integration of wind power except that at bus 7.
Total allocated transmission service cost of coal-fired EGEs has decreased to 154.68 RMB Yuan/h from 272.65 RMB Yuan/h, i.e.,
= 117.97. It indicates that the share of transmission service cost of coal-fired EGEs has decreased by 43.27% due to the integration of wind power.
Table 3.
The allocated transmission service cost of coal-fired EGEs (Unit: RMB Yuan/h).
Table 3.
The allocated transmission service cost of coal-fired EGEs (Unit: RMB Yuan/h).
| Bus | Before wind power integration | After wind power integration |
|---|
| 1 | 10.84 | 7.83 |
| 2 | 8.83 | 6.32 |
| 7 | 19.15 | 21.52 |
| 13 | 25.28 | 18.47 |
| 15 | 13.56 | −33.44 |
| 16 | 6.19 | 3.51 |
| 18 | 25.01 | −8.17 |
| 21 | 47.05 | 43.55 |
| 22 | 32.93 | 29.51 |
| 23 | 83.81 | 65.58 |
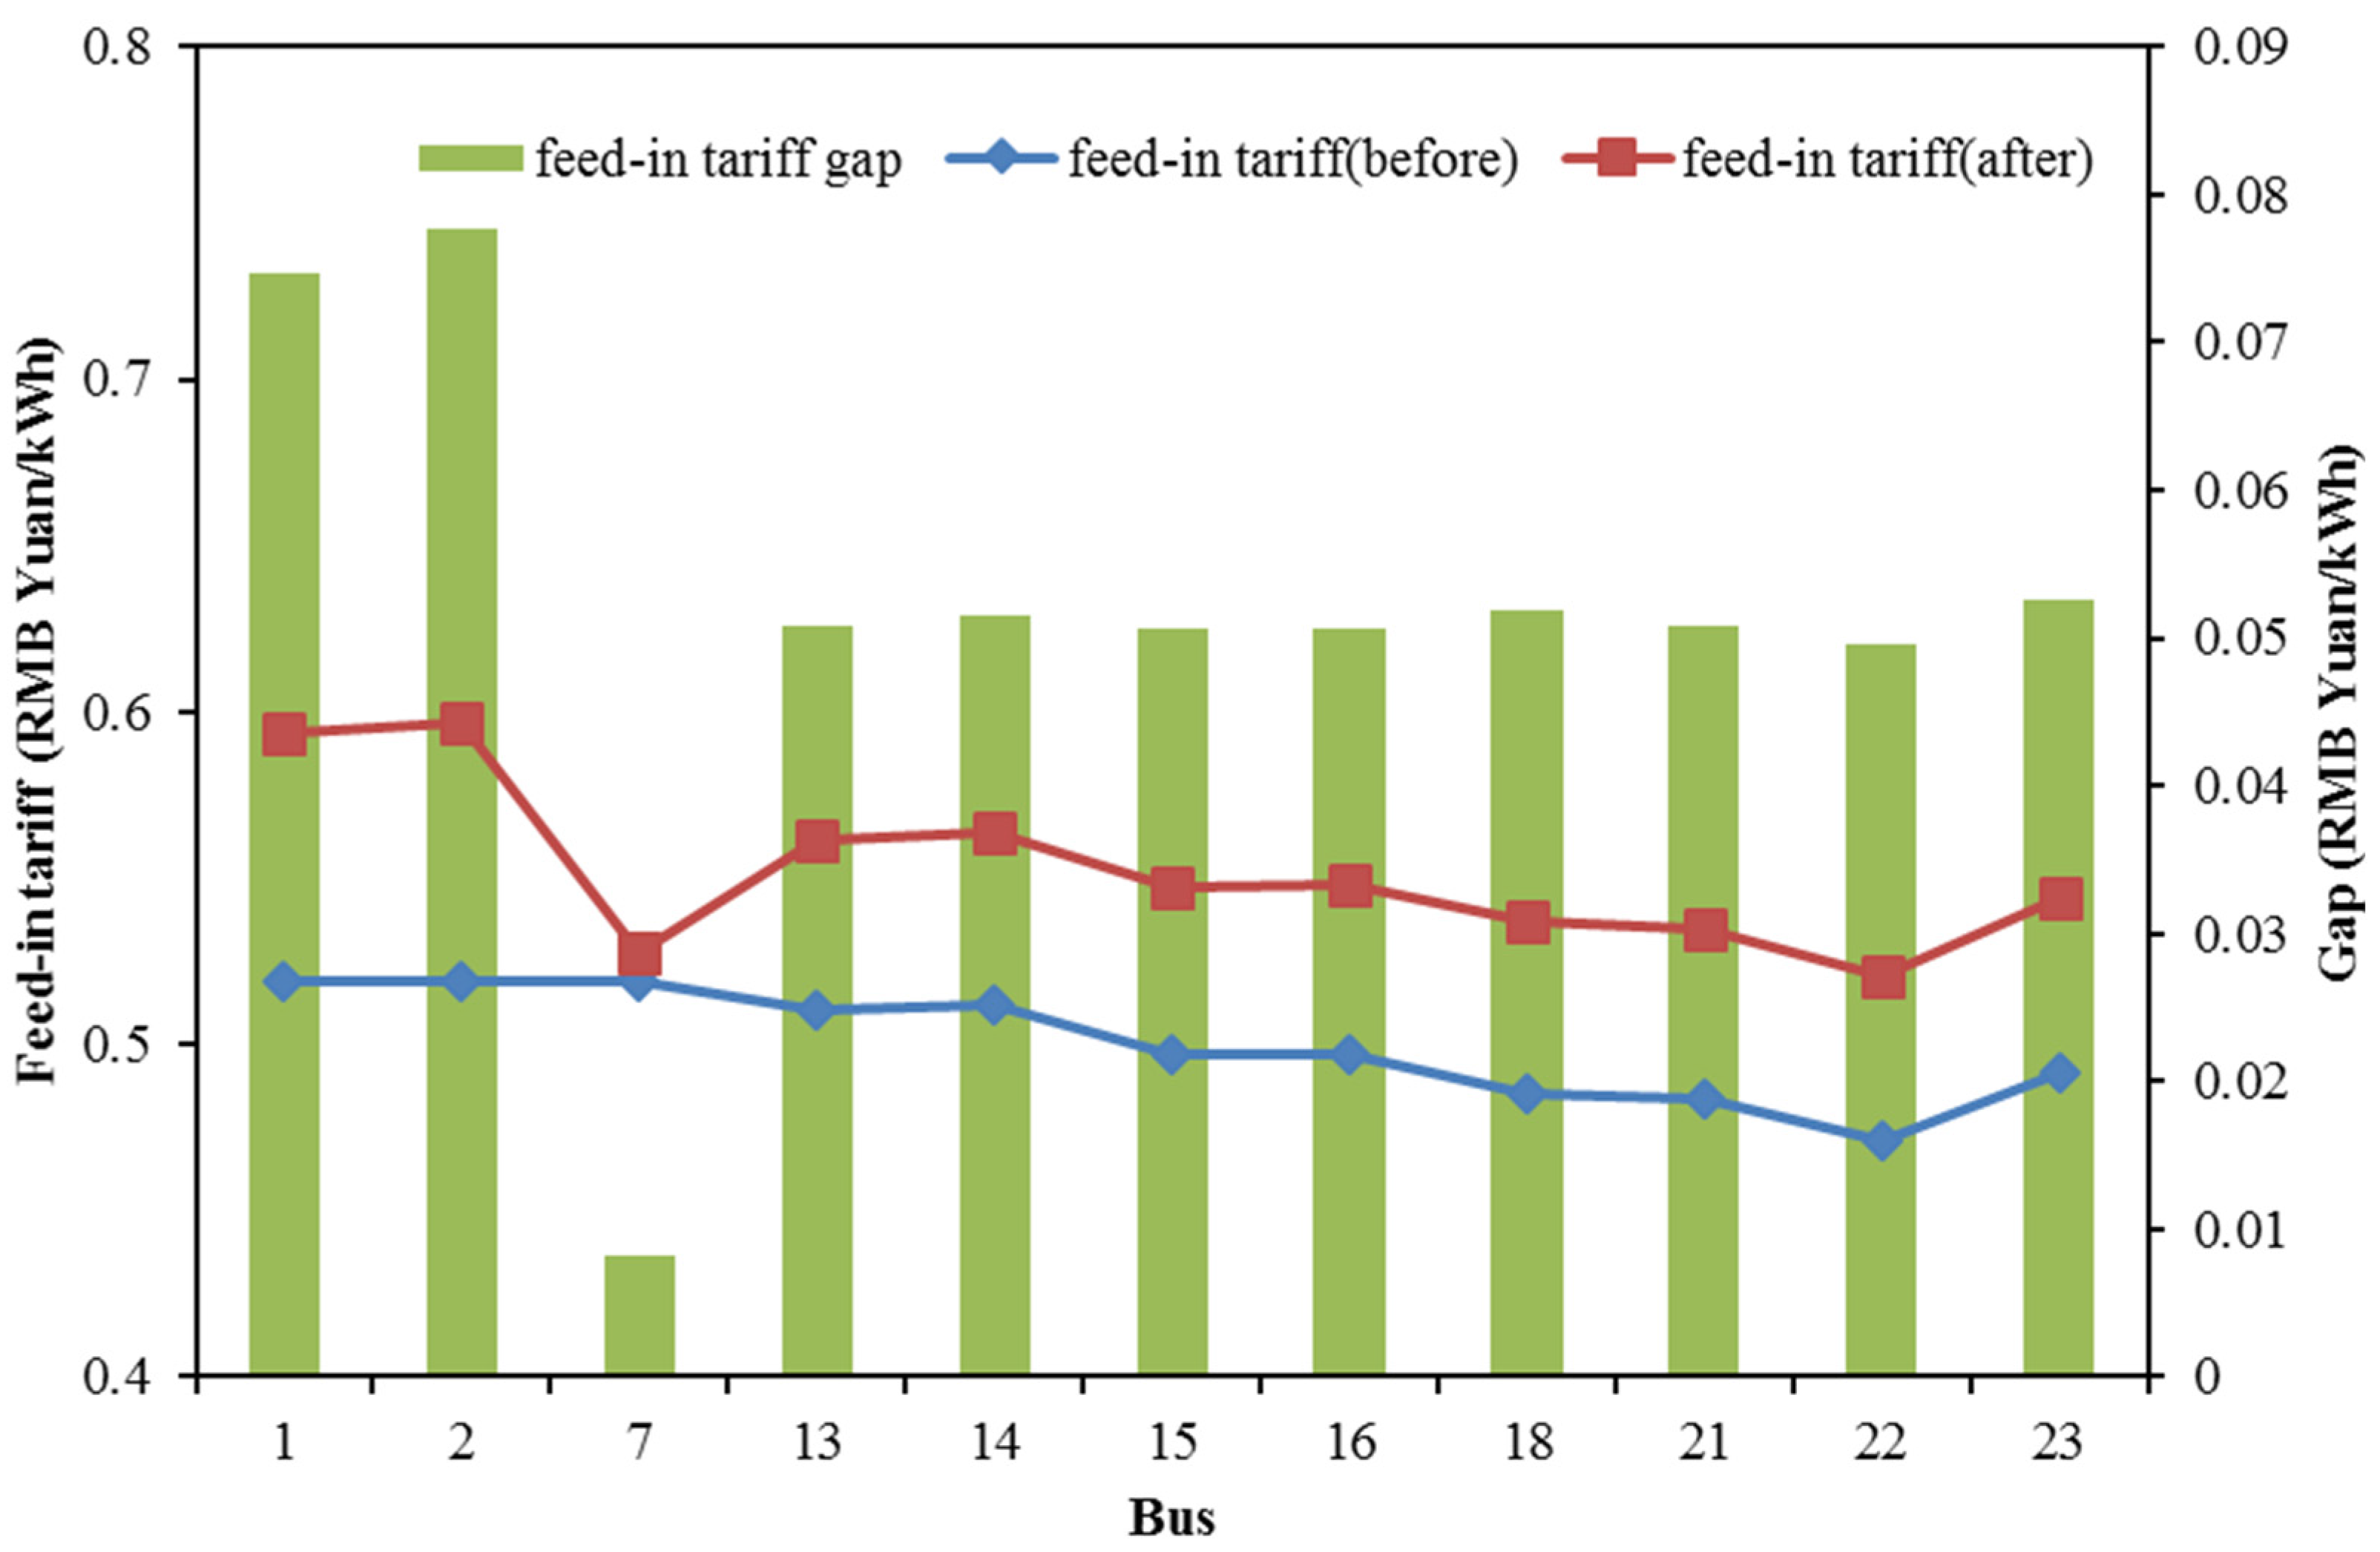
(2) Producer’s profit (PP)
The feed-in tariffs of coal-fired EGEs change with the integration of wind power, which are shown in
Figure 7. The feed-in tariffs of all coal-fired EGEs have increased after the integration of wind power, and the average feed-in tariff increases by 0.05 RMB Yuan/kWh, which increases from 0.50 RMB Yuan/kWh to 0.55 RMB Yuan/kWh.
Figure 7.
The feed-in tariffs of coal-fired EGEs at each bus.
Figure 7.
The feed-in tariffs of coal-fired EGEs at each bus.
The generating costs of coal-fired EGEs at each bus are listed in
Table 4. According to Equation (25), the
PP of coal-fired EGEs increases from 87854.8 RMB Yuan to 92478.5 RMB Yuan, with the growth rate of 5.26%. The main reason is that the increase of feed-in tariffs of coal-fired EGEs is dominant over all other varying factors, namely feed-in tariffs, power output, and generating costs.
Table 4.
The costs of coal-fired EGEs (Unit: RMB Yuan).
Table 4.
The costs of coal-fired EGEs (Unit: RMB Yuan).
| Bus | Before wind power integration | After wind power integration |
|---|
| 1 | 2729.33 | 2729.33 |
| 2 | 2428.18 | 1845.89 |
| 7 | 12522.55 | 11841.09 |
| 13 | 5412.07 | 4883.41 |
| 15 | 4561.32 | 11867.47 |
| 16 | 2502.84 | 2502.84 |
| 18 | 2198.70 | 1764.24 |
| 19 | 6259.14 | 2123.79 |
| 22 | 4660.51 | 3790.94 |
| 23 | 12192.29 | 9719.26 |
5.2.2. Economic Impacts on PGCs
With the wind power integration, the investment cost recovery of PGCs increases to 39.95 RMB Yuan/h from 22.16 RMB Yuan/h. Thus, Ka and Kb are equal to 36.80% and 20.41%, respectively, and then
=16.39%. It indicates the investment cost recovery rate of PGCs increases by 16.39% due to the integration of wind power.
Wind power holds the characteristics of randomness, intermittency, and anti-peaking. So, it will bring adverse impacts on electric power system operation. In order to ensure the safe and stable operation of electric power system, the PGCs have to purchase additional auxiliary service such as peak shaving and spinning reserve, which will increase the operational cost. However, with the integration of wind power, the investment cost recovery rate of PGCs will also increase. To some extent, it can alleviate the adverse impacts of wind power integration.
5.2.3. Economic Impacts on ECs
(1) Transmission service cost allocation
The allocated transmission service costs of ECs before and after the integration of wind power are calculated according to Equation (27), and the results are listed in
Table 5. It can be seen that the allocated transmission service cost of ECs have substantially increased after the integration of wind power.
In total, the allocated transmission service costs of ECs have increased to 188.37 RMB Yuan/h from −418.95 RMB Yuan/h, i.e.,
= 607.32. It indicates that the share of allocated transmission service costs of ECs increases by 144.96% due to the integration of wind power.
Table 5.
The allocated transmission service cost of ECs (Unit: RMB Yuan/h).
Table 5.
The allocated transmission service cost of ECs (Unit: RMB Yuan/h).
| Bus | Before wind power integration | After wind power integration |
|---|
| 1 | −6.89 | −4.97 |
| 2 | −5.71 | −4.09 |
| 3 | −43.35 | 31.61 |
| 4 | 2.03 | 2.40 |
| 5 | 2.52 | 7.10 |
| 6 | −16.74 | 5.29 |
| 7 | −10.29 | −9.29 |
| 8 | −47.61 | 21.20 |
| 9 | −44.09 | 42.90 |
| 10 | −44.11 | 19.03 |
| 13 | −19.14 | −13.98 |
| 14 | −42.36 | 53.16 |
| 15 | −56.62 | 48.18 |
| 16 | −4.00 | −2.27 |
| 18 | −20.82 | 8.84 |
| 19 | −40.09 | 15.23 |
| 20 | −21.69 | −31.97 |
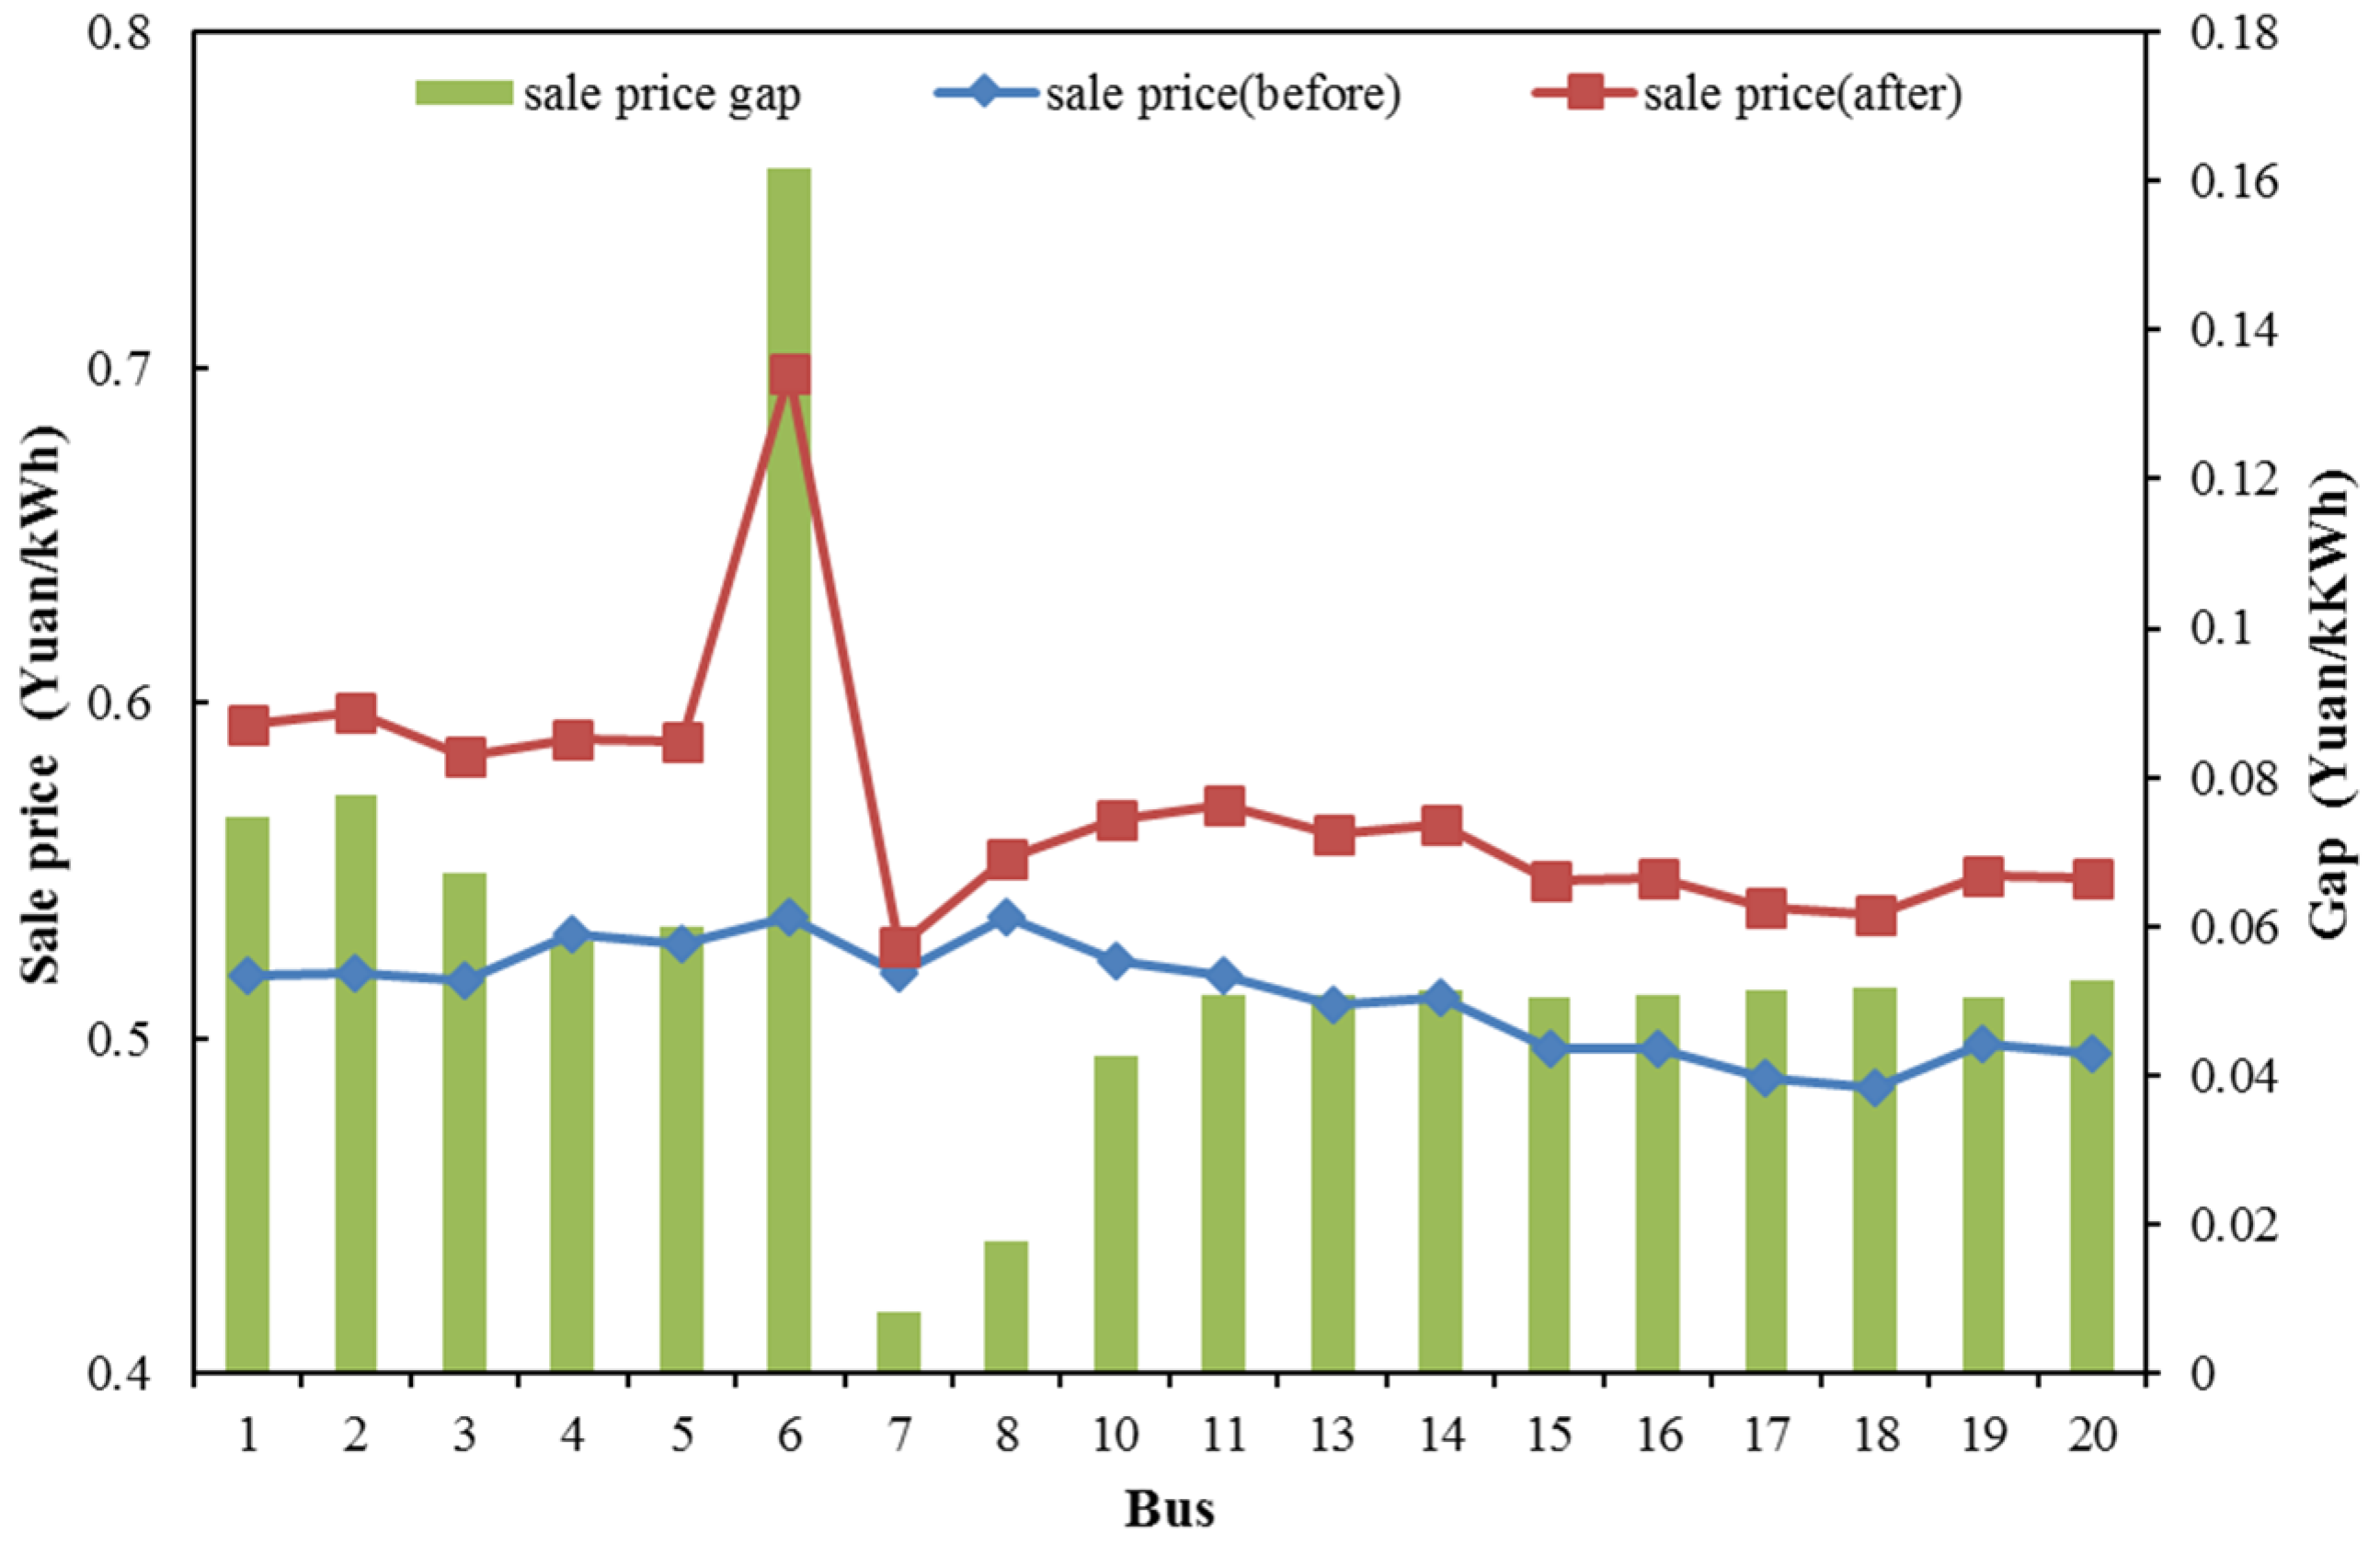
(2) Electricity consumption expenditure
The impact of wind power integration on sale price is shown in
Figure 8. With the integration of wind power, the sale price increases at each bus, and the average sale price improves from 0.51 RMB Yuan/kWh to 0.57 RMB Yuan/kWh, which increases by 0.06 RMB Yuan/kWh. Therefore, according to Equation (28), the variation of electricity consumption expenditure of consumers can be calculated, which increases from 1455.19 RMB Yuan/h to 1789.89 RMB Yuan/h, increased by 23%.
Figure 8.
The sale price at each bus.
Figure 8.
The sale price at each bus.
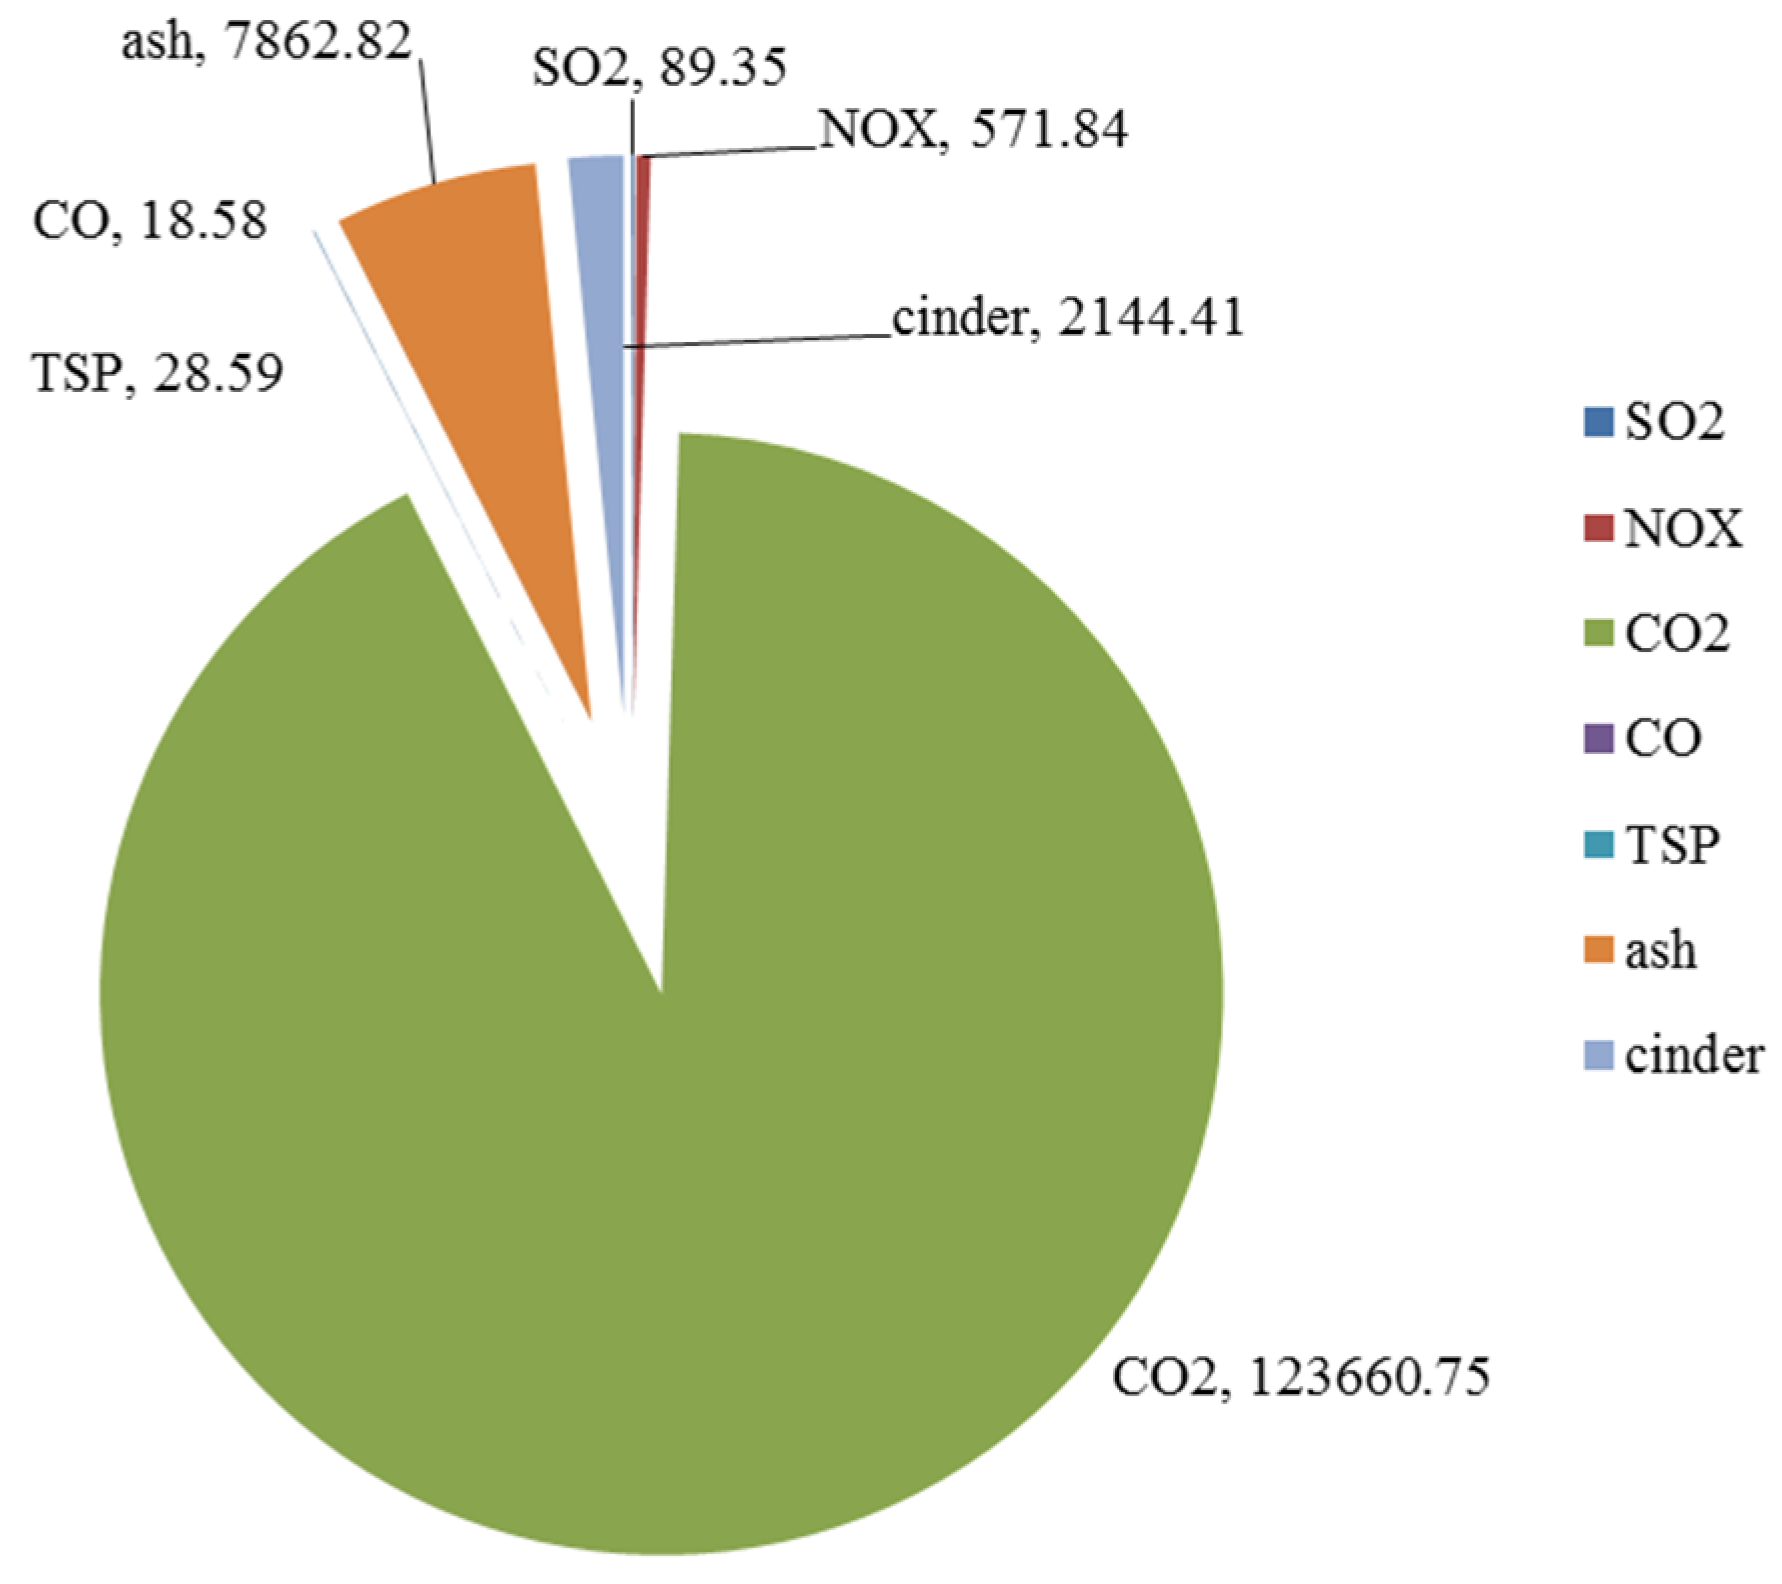
5.2.4. Economic Impacts on Environment
The power outputs of coal-fired EGEs at bus 2, 7, 13, 18, 21, 22, and 23 decline after the integration of wind power, while that at bus 15 increases. The power output variation and standard coal consumption rates of coal-fired generating units are shown in
Table 6. Thus, the coal saving of coal-fired EGEs due to the wind power integration can be calculated, which amounts to 71.4802 tons. According to the standard pollutant emission rate of coal-fired power plant (as shown in
Table 7) [
38], the emission reduction of pollutants discharged by coal-fired EGEs can be calculated, as shown in
Figure 9.
Table 6.
Power output reduction and standard coal consumption rates of coal-fired generating units.
Table 6.
Power output reduction and standard coal consumption rates of coal-fired generating units.
| Bus | Power output reduction/MW | Standard coal consumption rate/(g/kWh) |
|---|
| 1 | 0 | 333 |
| 2 | 40 | 335 |
| 7 | 13.15 | 328 |
| 13 | 35 | 322 |
| 15 | −144.10 | 330 |
| 16 | 0 | 335 |
| 18 | 95 | 310 |
| 21 | 20 | 310 |
| 22 | 60 | 320 |
| 23 | 110 | 320 |
Table 7.
Standard pollutant emission rate of coal-fired power plant [
38].
Table 7.
Standard pollutant emission rate of coal-fired power plant [38].
| Pollutant | SO2 | NOX | CO2 | CO | TSP | Ash | Cinder |
|---|
| Emission rate (kg/t) | 1.25 | 8 | 1730 | 0.26 | 0.40 | 110 | 30 |
Figure 9.
Emission reduction of pollutants discharged by coal-fired EGEs.
Figure 9.
Emission reduction of pollutants discharged by coal-fired EGEs.
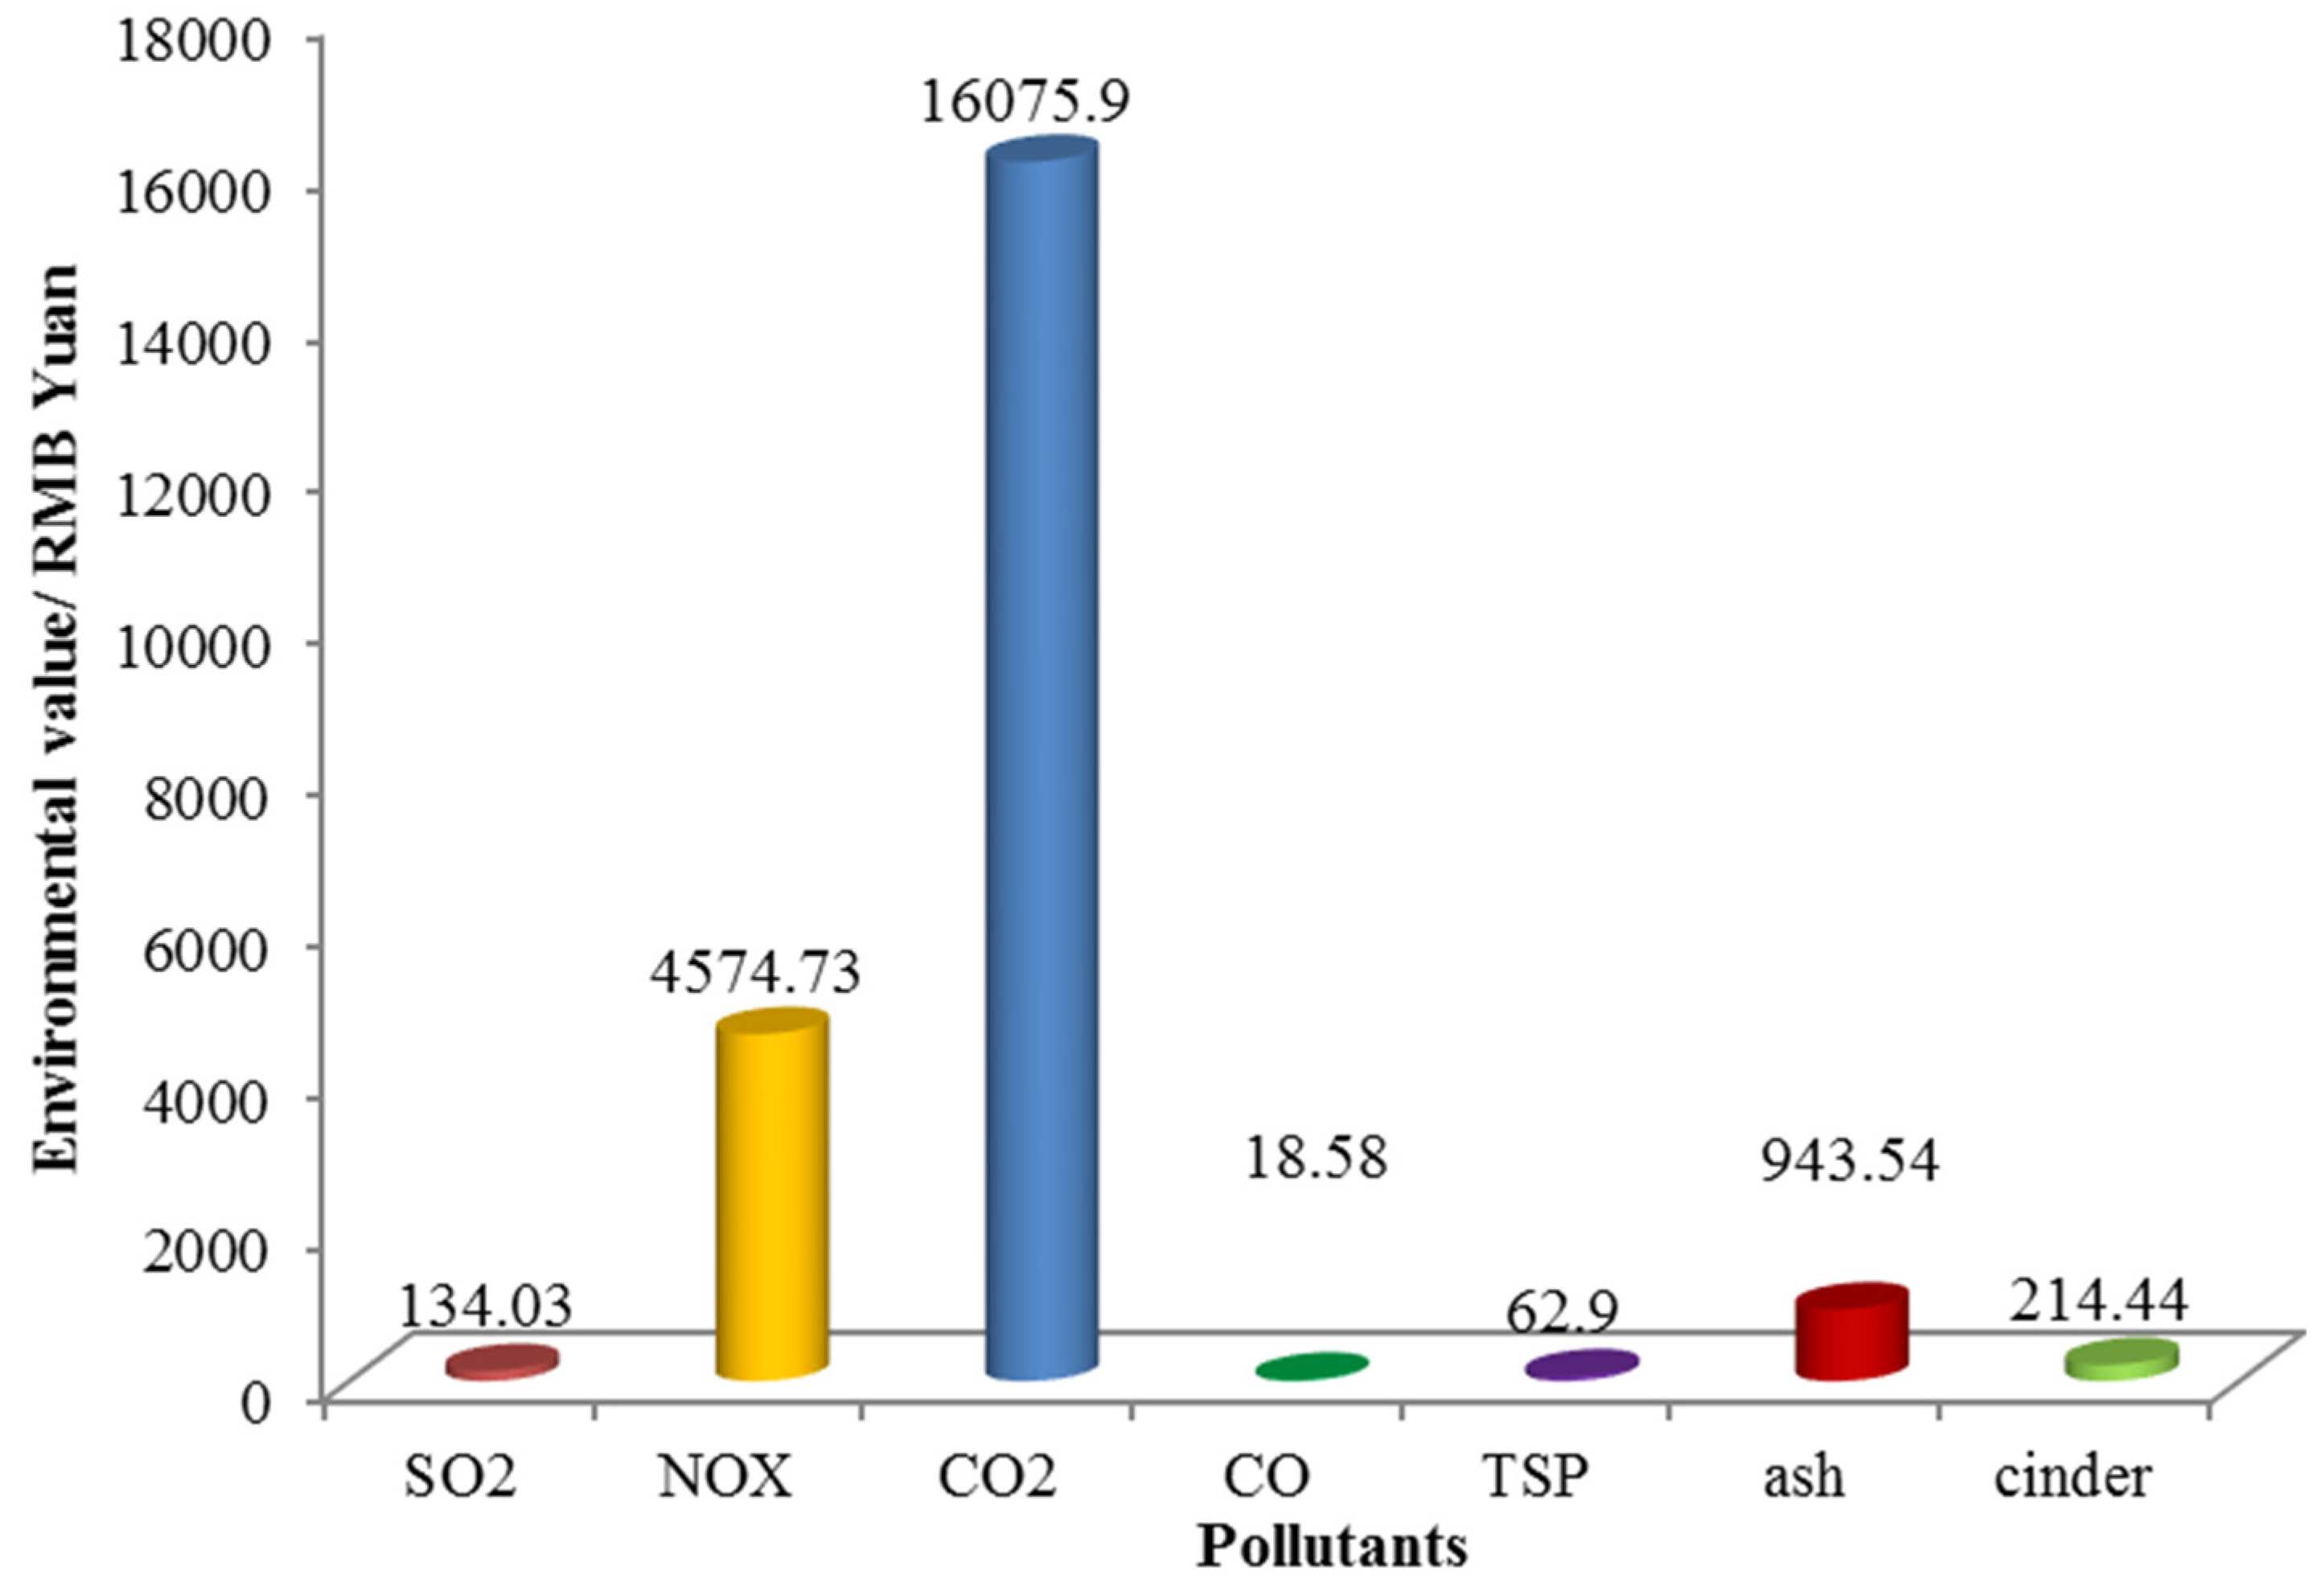
The environmental values of pollutants are listed in
Table 8 [
38].Then, the environmental benefit produced by emission reduction of pollutants discharged by coal-fired EGEs can be calculated, which is shown in
Figure 10. Total environmental benefit due to the wind power integration amounts to 22024.12 RMB Yuan/h. The environmental values related to emission reduction of SO
2, NO
X, CO
2, CO, TSP, ash, and cinder are 134.03, 4574.73, 16075.9, 18.58, 62.9, 943.54, and 214.44 RMB Yuan/h, respectively.
Table 8.
Environmental value of pollutants.
Table 8.
Environmental value of pollutants.
| Pollutant | SO2 | NOX | CO2 | CO | TSP | Ash | Cinder |
|---|
| Environmental value (RMB Yuan/kg) | 1.50 | 8 | 0.13 | 1 | 2.20 | 0.12 | 0.10 |
Figure 10.
Environmental benefit due to wind power integration.
Figure 10.
Environmental benefit due to wind power integration.
In conclusion, the economic impacts of wind power integration on multiple subjects of China’s electric power system are summarized in
Table 9. From Quasi-public goods property perspective, the wind power integration will bring positive impacts on EGEs, PGCs, and Environment, while negative impacts on ECs. From the angle of Sustainability, the indicators “transmission service cost allocation”, “investment cost recovery”, and “electricity consumption expenditure” are affiliated with Economy aspect, the indicator “
PP” is affiliated with Society aspect, and the indicator “pollutant emission reduction” is affiliated with Environment aspect. Therefore, the economic impacts assessment of wind power integration performed in this paper can also be analyzed from the perspective of Sustainability. In terms of Economy aspect, the wind power integration brings 806.26 RMB Yuan/h of negative impact (also called cost). In terms of Society aspect, the wind power integration can bring 4623.7 RMB Yuan /h of positive impact (also called benefit). In terms of Environment aspect, the wind power integration can contribute 22024.12 RMB Yuan/h of environmental benefit. Therefore, the wind power integration will make great positive contributions to Society and Environment, but adverse impacts on Economy. As a whole, those six indicators can also be combined as one integrated indicator, namely net economic benefit, which refers to the total positive impact minus total negative impact. Based on the aforementioned calculation, the net economic benefit brought for China’s electric power system due to the wind power integration amounts to 25841.56 RMB Yuan /h.
Table 9.
Economic impacts of wind power integration.
Table 9.
Economic impacts of wind power integration.
| Subject | Impact indicator | Impact category | Impact degree | Sustainability angle |
|---|
| EGEs | transmission service cost allocation | Positive | decreases by 43.27% (117.97 RMB Yuan/h) | Economy |
| PP | Positive | increases by 5.26% (4623.70 RMB Yuan/h) | Society |
| PGCs | investment cost recovery | Positive | increases by 16.39% (17.79 RMB Yuan/h) | Economy |
| ECs | transmission service cost allocation | Negative | increases by 144.96% (607.32 RMB Yuan/h) | Economy |
| electricity consumption expenditure | Negative | increased by 23% (334.70 RMB Yuan/h) | Economy |
| Environment | pollutant emission reduction | Positive | 22024.12 RMB Yuan/h | Environment |
6. Conclusions and Discussion
Wind power in China is dominant in all kinds of renewable power types. In this paper, the economic impacts of wind power integration on multiple subjects of China’s electric power system were evaluated from the Quasi-public goods property perspective. The simulation analysis was performed under the context of IEEE-24 bus system, and some conclusions can be drew:
- (1)
For coal-fired EGEs, the share of allocated transmission service cost decreases by 43.27% (i.e., 117.97 RMB Yuan/h), and the PP increases by 5.26% (4623.70 RMB Yuan/h) after wind power integration;
- (2)
For PGCs, after wind power integration, the investment cost recovery increases to 39.95 RMB Yuan/h from 22.16 RMB Yuan/h, and the investment cost recovery rate increases by 16.39%;
- (3)
For ECs, the share of allocated transmission service cost increases by 144.96% (i.e., 607.32 RMB Yuan/h), and electricity consumption expenditure increases from 1455.19 RMB Yuan/h to 1789.89 RMB Yuan/h, increased by 23%;
- (4)
For Environment, total environmental benefit produced by wind power integration amounts to 22024.12 RMB Yuan/h, and environmental values resulting from emission reduction of SO2, NOX, CO2, CO, TSP, ash, and cinder are 134.03, 4574.73, 16075.9, 18.58, 62.9, 943.54, and 214.44 RMB Yuan/h, respectively;
- (5)
The net economic benefit brought for China’s electric power system due to the wind power integration amounts to 25841.56 RMB Yuan/h.
From the Quasi-public goods property perspective, the simulation analysis indicates the integration of wind power will bring certain economic benefits to coal-fired EGEs and PGCs. However, from Externality perspective, the integration of wind power will cause negative impacts on coal-fired EGEs and PGCs, such as the revenue decline and operation cost increase of coal-fired EGEs, and the cost increase of PGCs due to additional purchase of auxiliary service to maintain the stable and safe operation of power grid [
22,
39]. It is commonly believed that the integration of wind power will only bring negative impacts on coal-fired EGEs and PGCs due to its characteristics of randomness, intermittency, and anti-peaking. So, the coal-fired EGEs have hostile sentiments towards wind-EGEs, and PGCs are also reluctant to purchase the wind power generation. However, our analysis results show the integration of wind power can also bring positive impacts (namely economic benefits) on coal-fired EGEs and PGCs, which can decrease the allocated transmission service cost and increase the welfare for coal-fired EGEs, and speed up the recovery of initial investment for PGCs. It indicates the negative impacts of wind power integration on coal-fired EGEs and PGCs may be not as large as previously thought.
The analysis result also shows the integration of wind power will increase the cost of ECs, which causes ECs reluctant to purchase green electricity. To eliminate this kind of adverse effects, supporting policies should be provided by government. For example, the government can provide subsidy for ECs when they purchase green power, and give appropriate compensation when ECs buy equipment used for ensuring the power quality. The integration of wind power will produce remarkable environmental benefit. Nowadays, the worsening environmental quality such as the frequent occurrence of haze has made a marked impact on people’s daily life in China. In recent years, the publics have come to realize the importance of environmental protection. Developing renewable power is an important path to reduce the pollutant emission and the dependence on fossil fuels, which can not only improve environmental quality but also raise China's energy security. Therefore, the government should enhance the propaganda on renewable energy and renewable power. As time passes, the publics can deeply realize the importance of developing renewable energy, which can make a better living condition for them. By then, the publics, especially in the developed and highly contaminated regions such as Beijing, may be willing to pay higher price to purchase green power.
This paper quantitatively assesses the economic impacts of wind power integration on multiple subjects of China’s electric power system from the Quasi-public goods property perspective under the context of IEEE-24 bus system. In the future study, we will employ other IEEE bus systems such as IEEE-118 bus system to evaluate the economic impacts of wind power integration. Meanwhile, how to evaluate the comprehensive impacts of wind power integration from both Quasi-public goods property perspective and Externality perspective is also a big challenge


