
Measurements of the Aerodynamic Normal Forces on a 12-kW Straight-Bladed Vertical Axis Wind Turbine


Abstract
:
1. Introduction
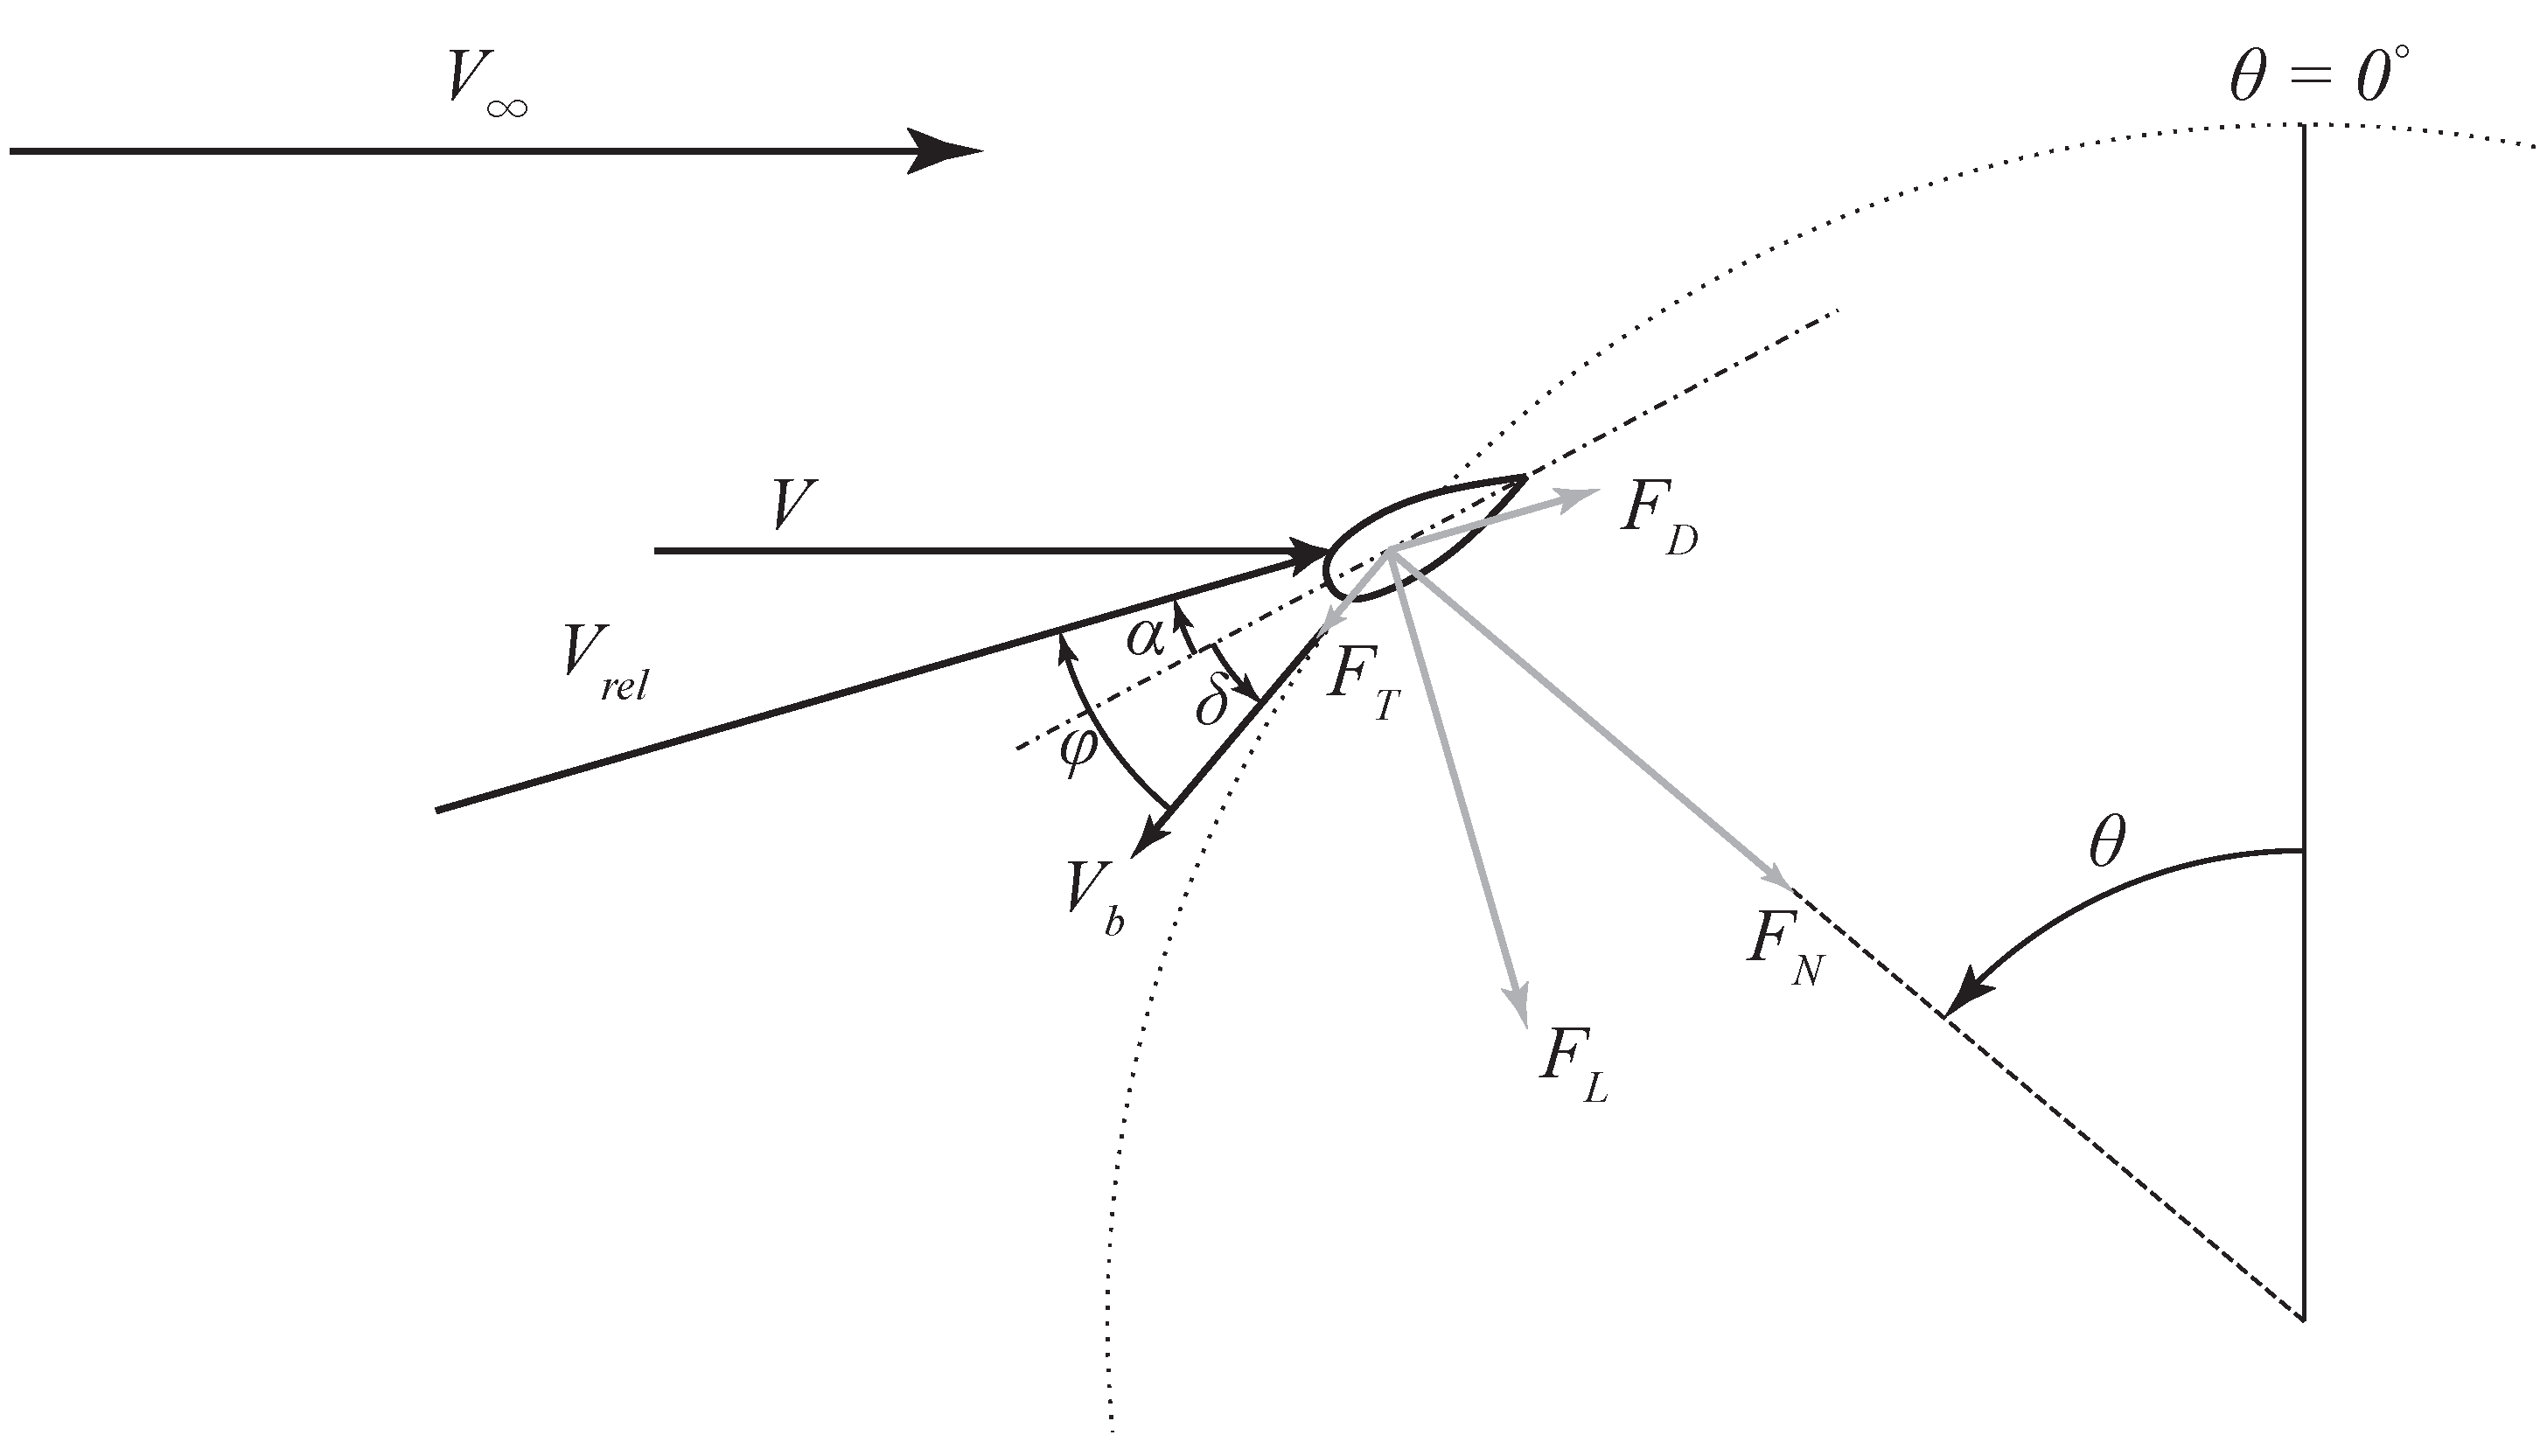
2. Theory

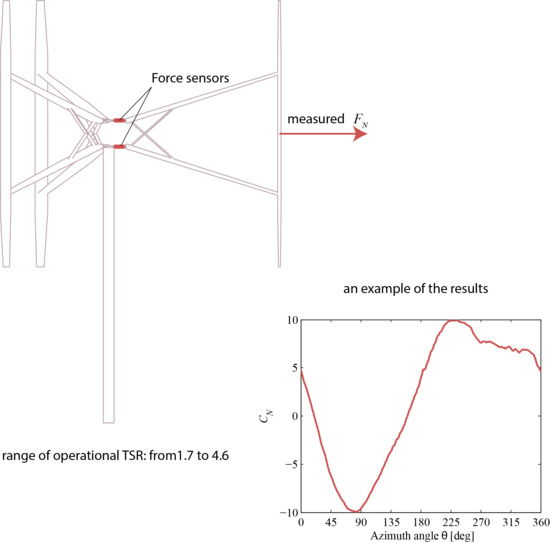
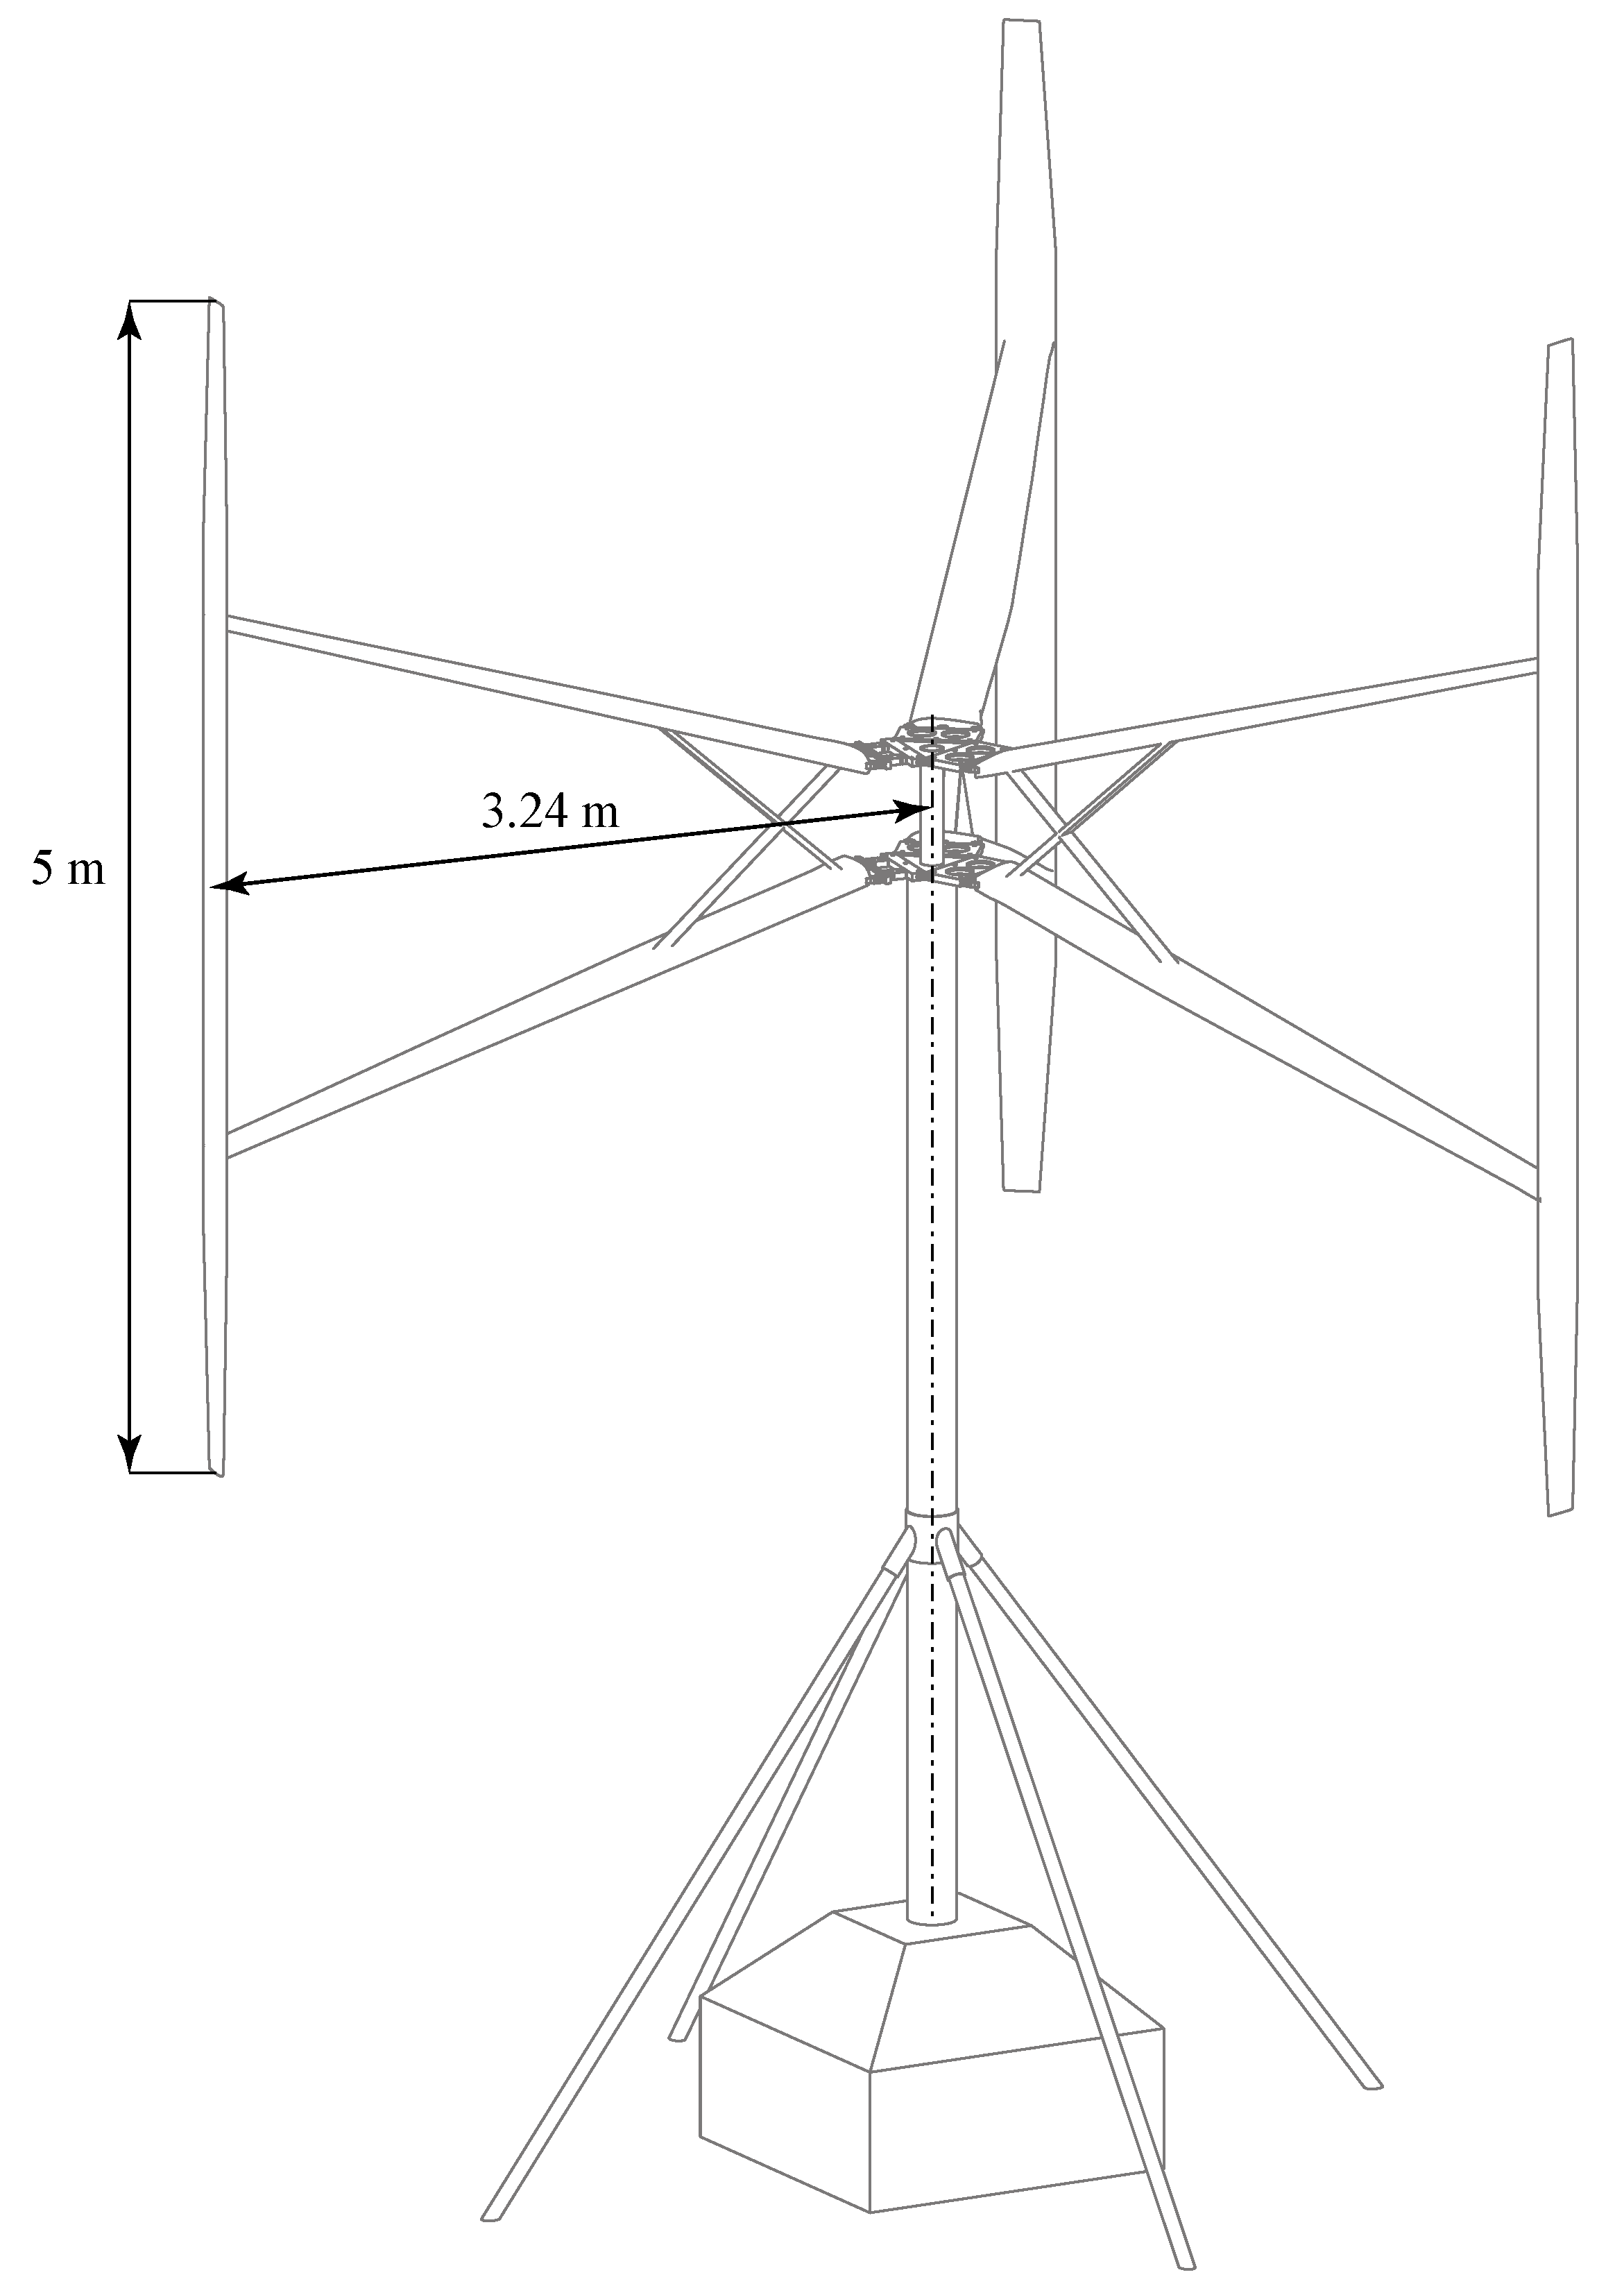
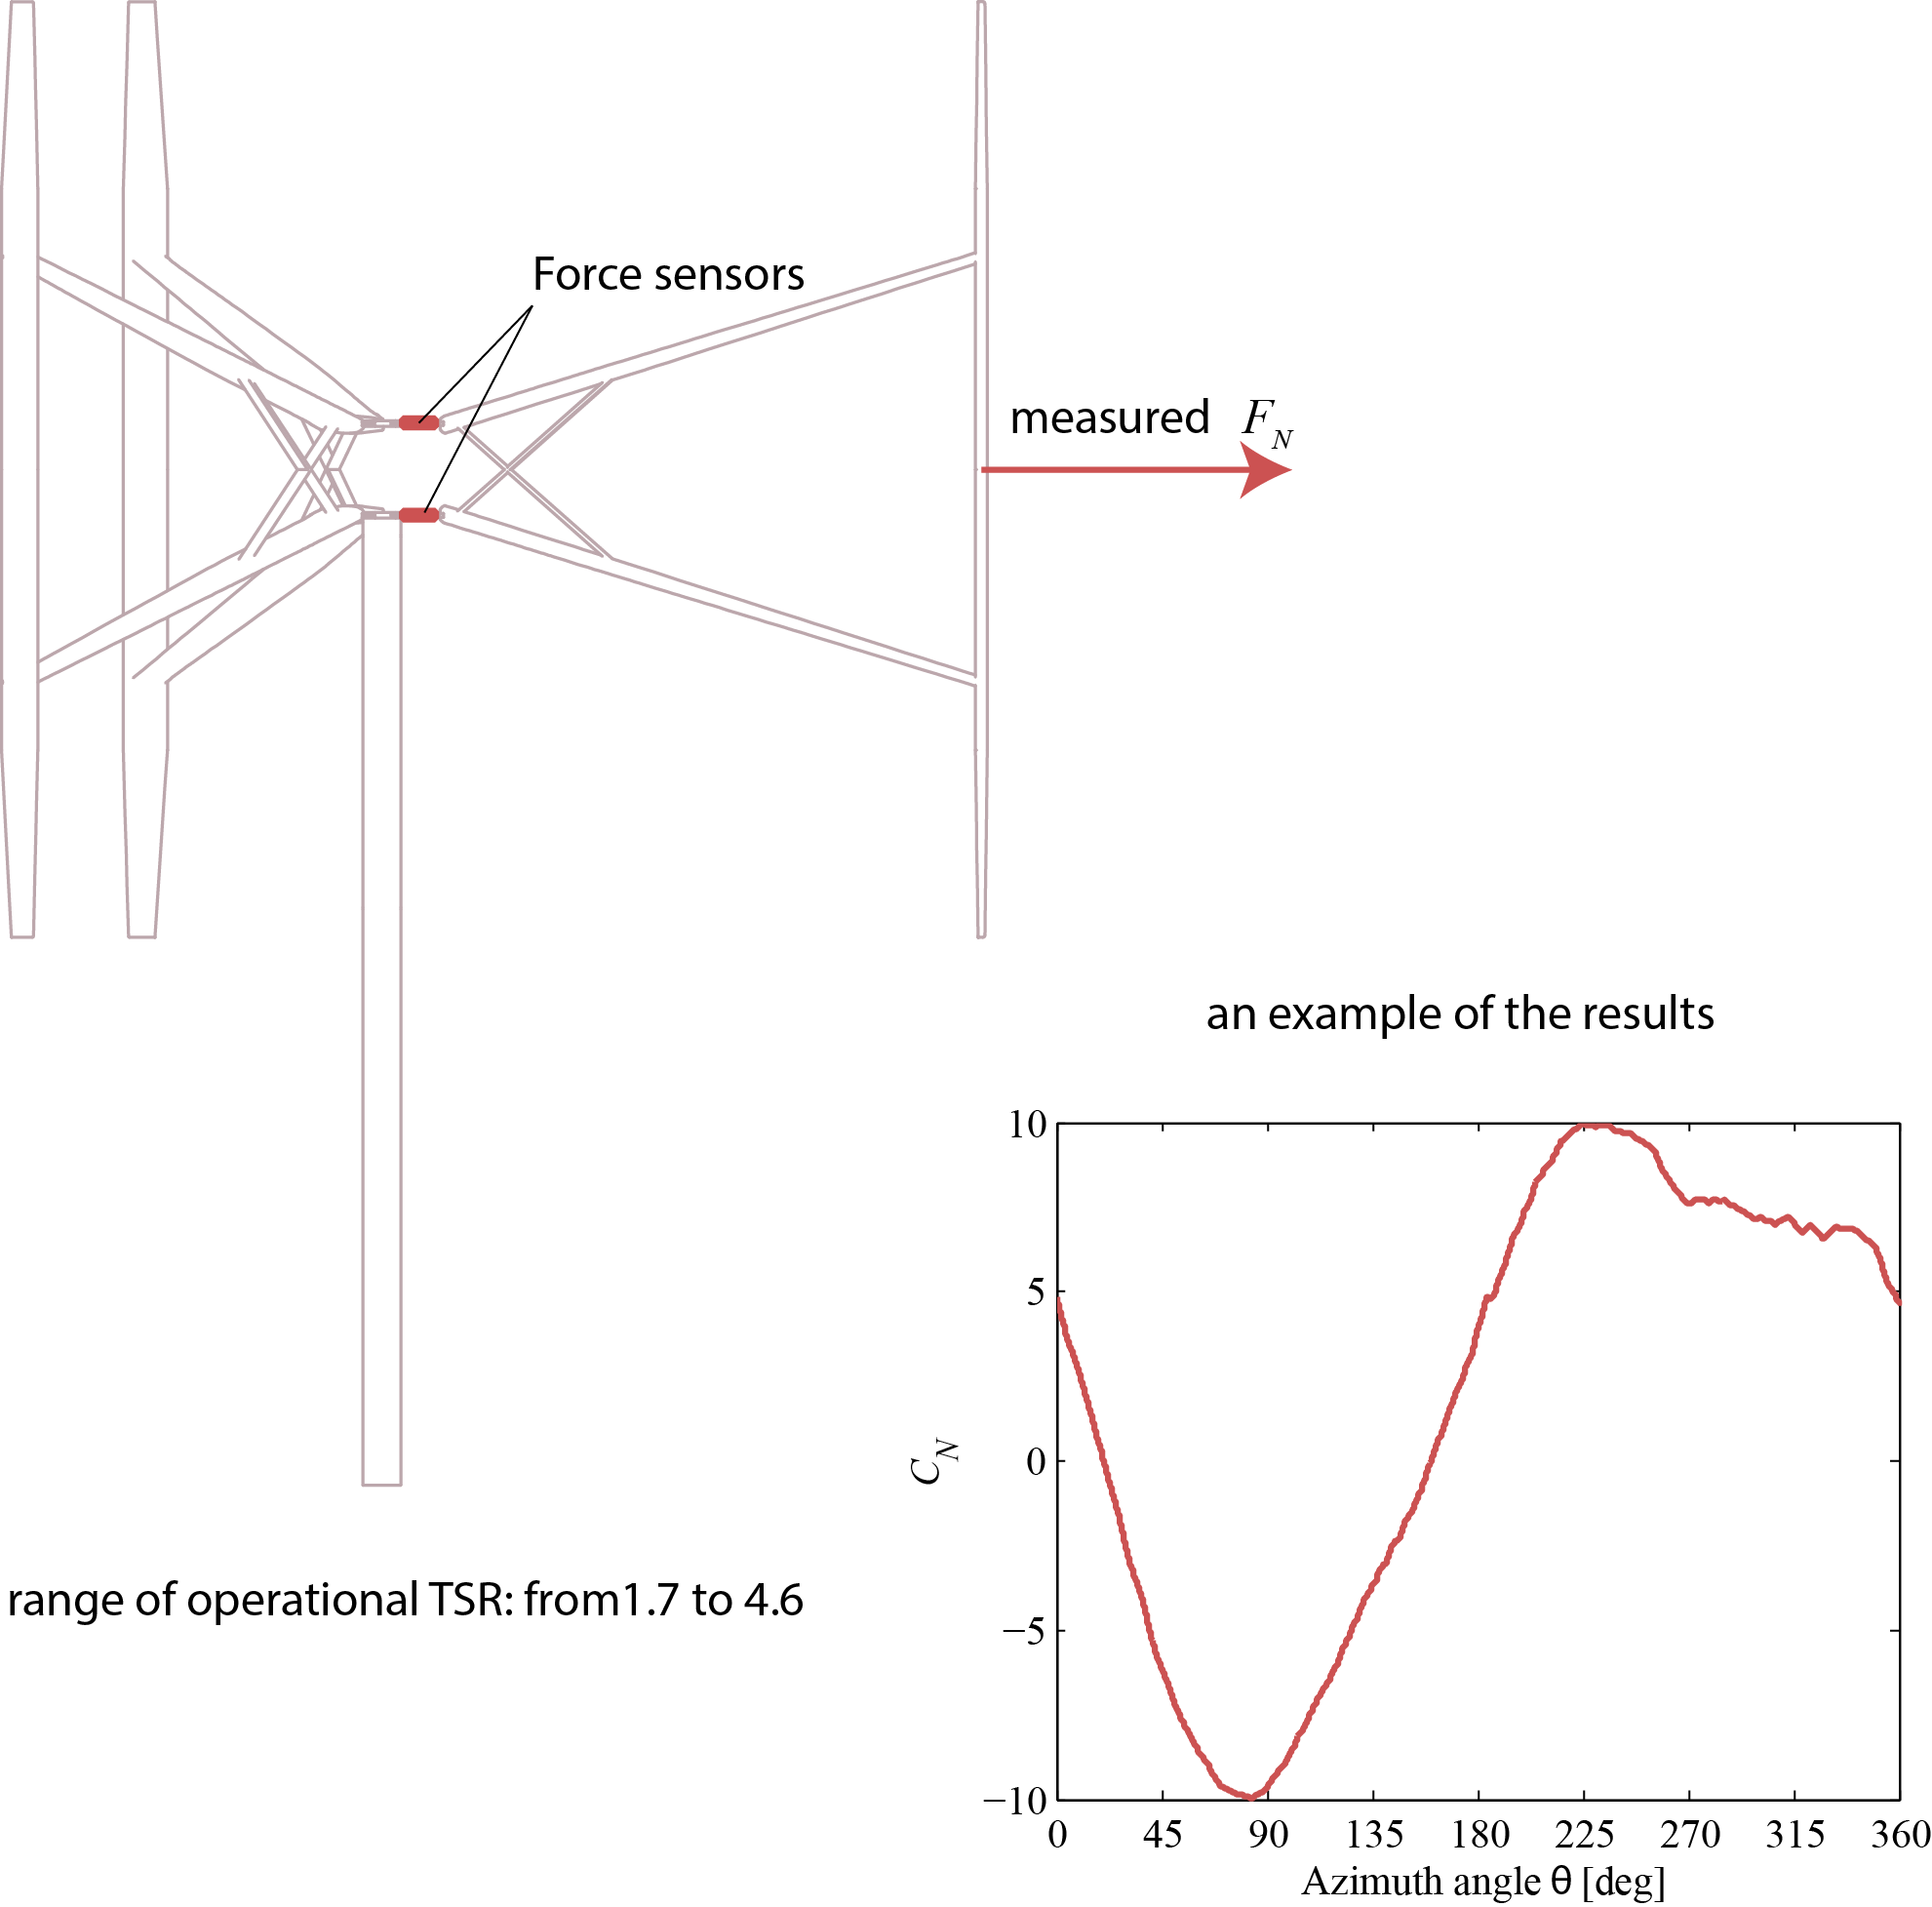
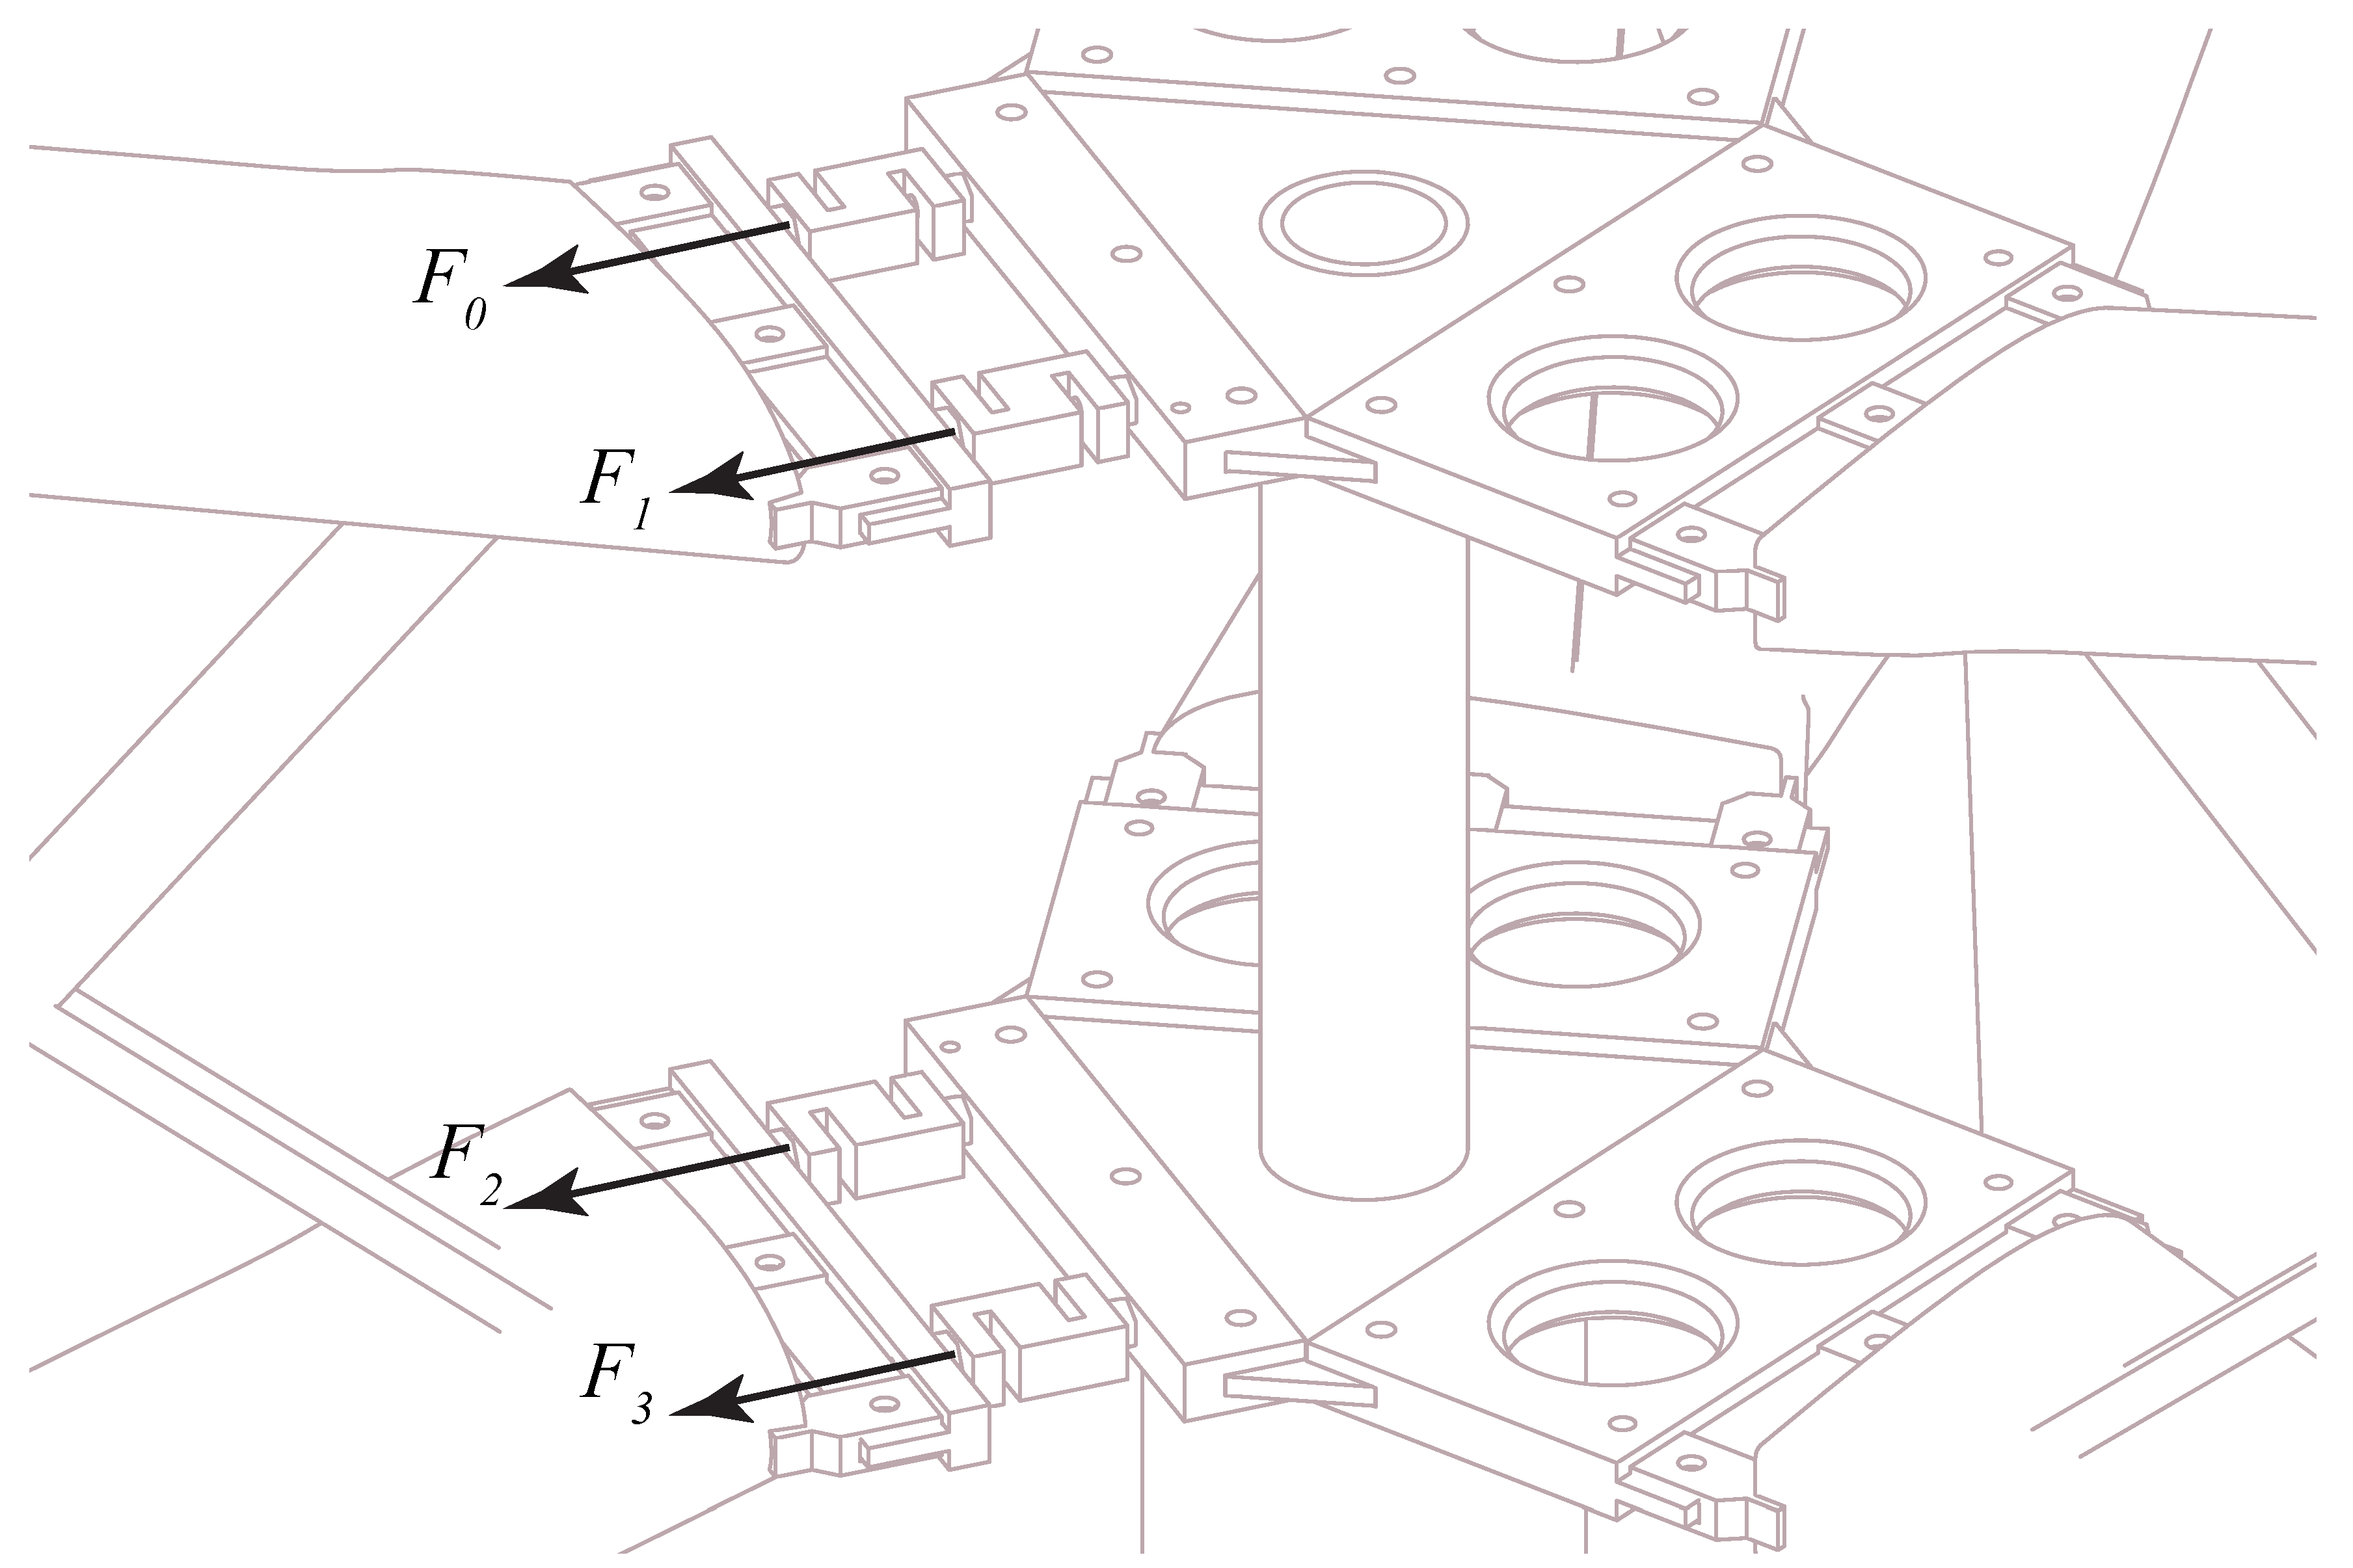
3. Experimental Setup
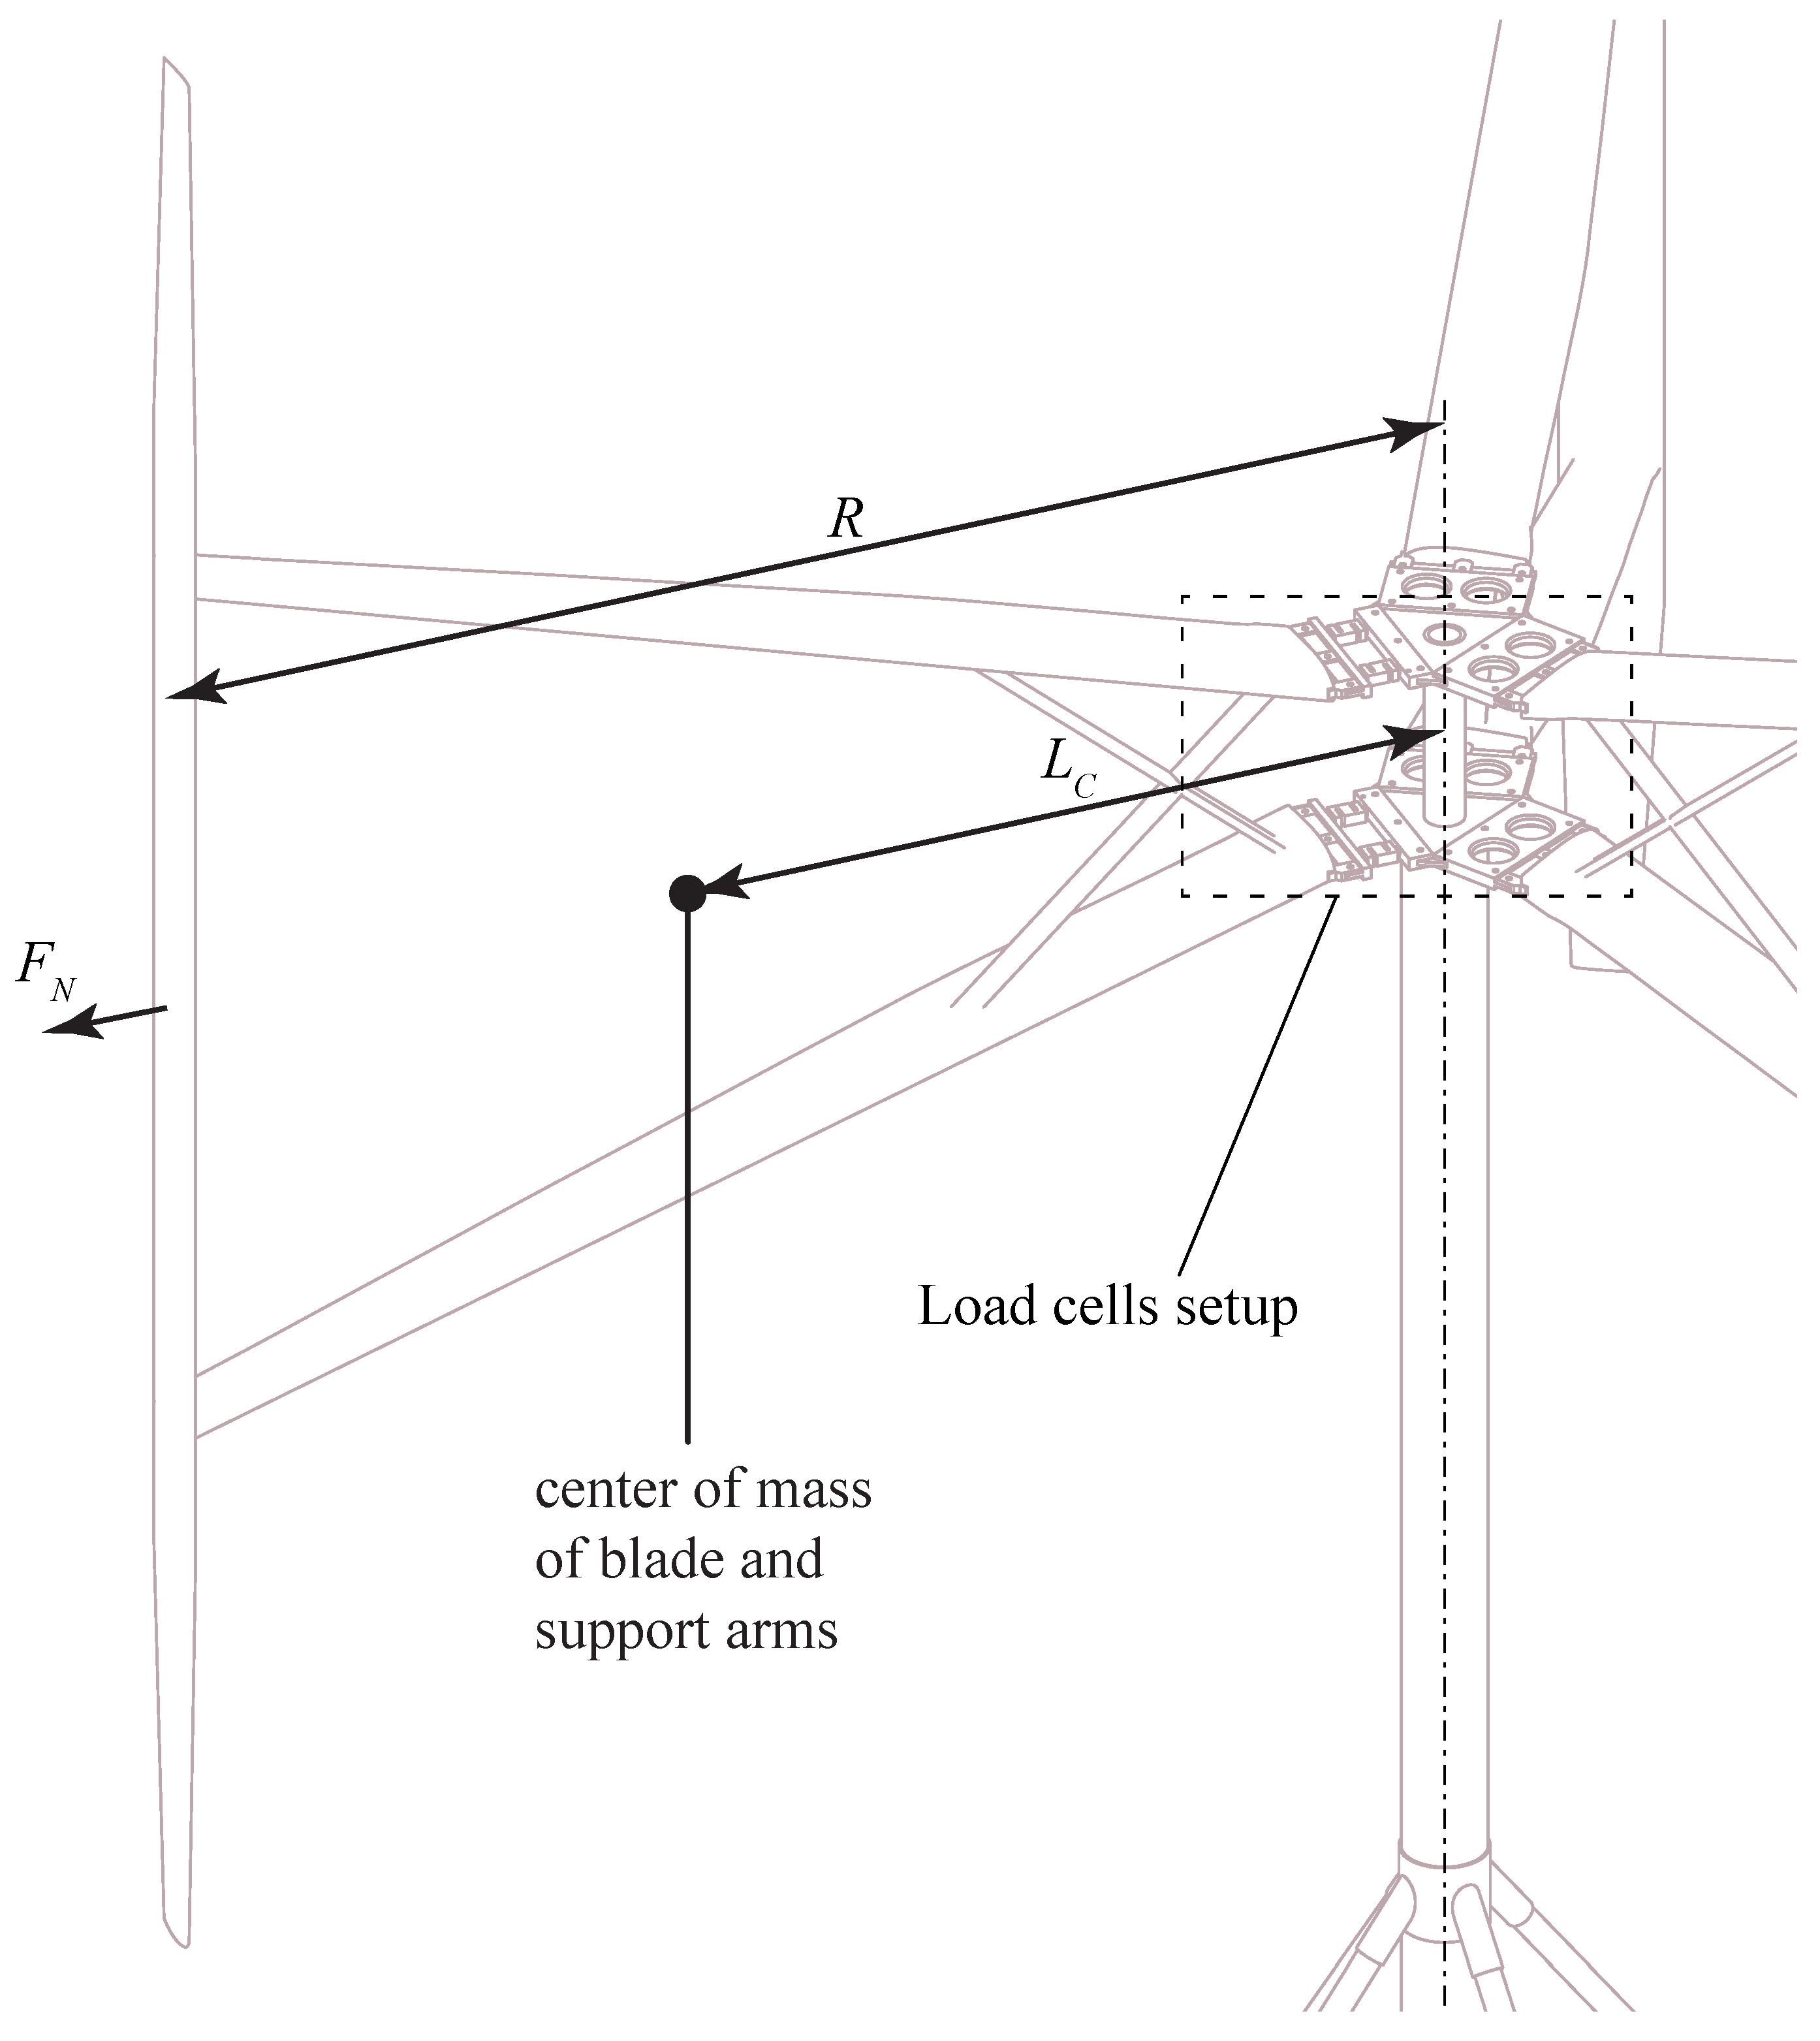

3.1. Data Extraction

4. Results and Discussion
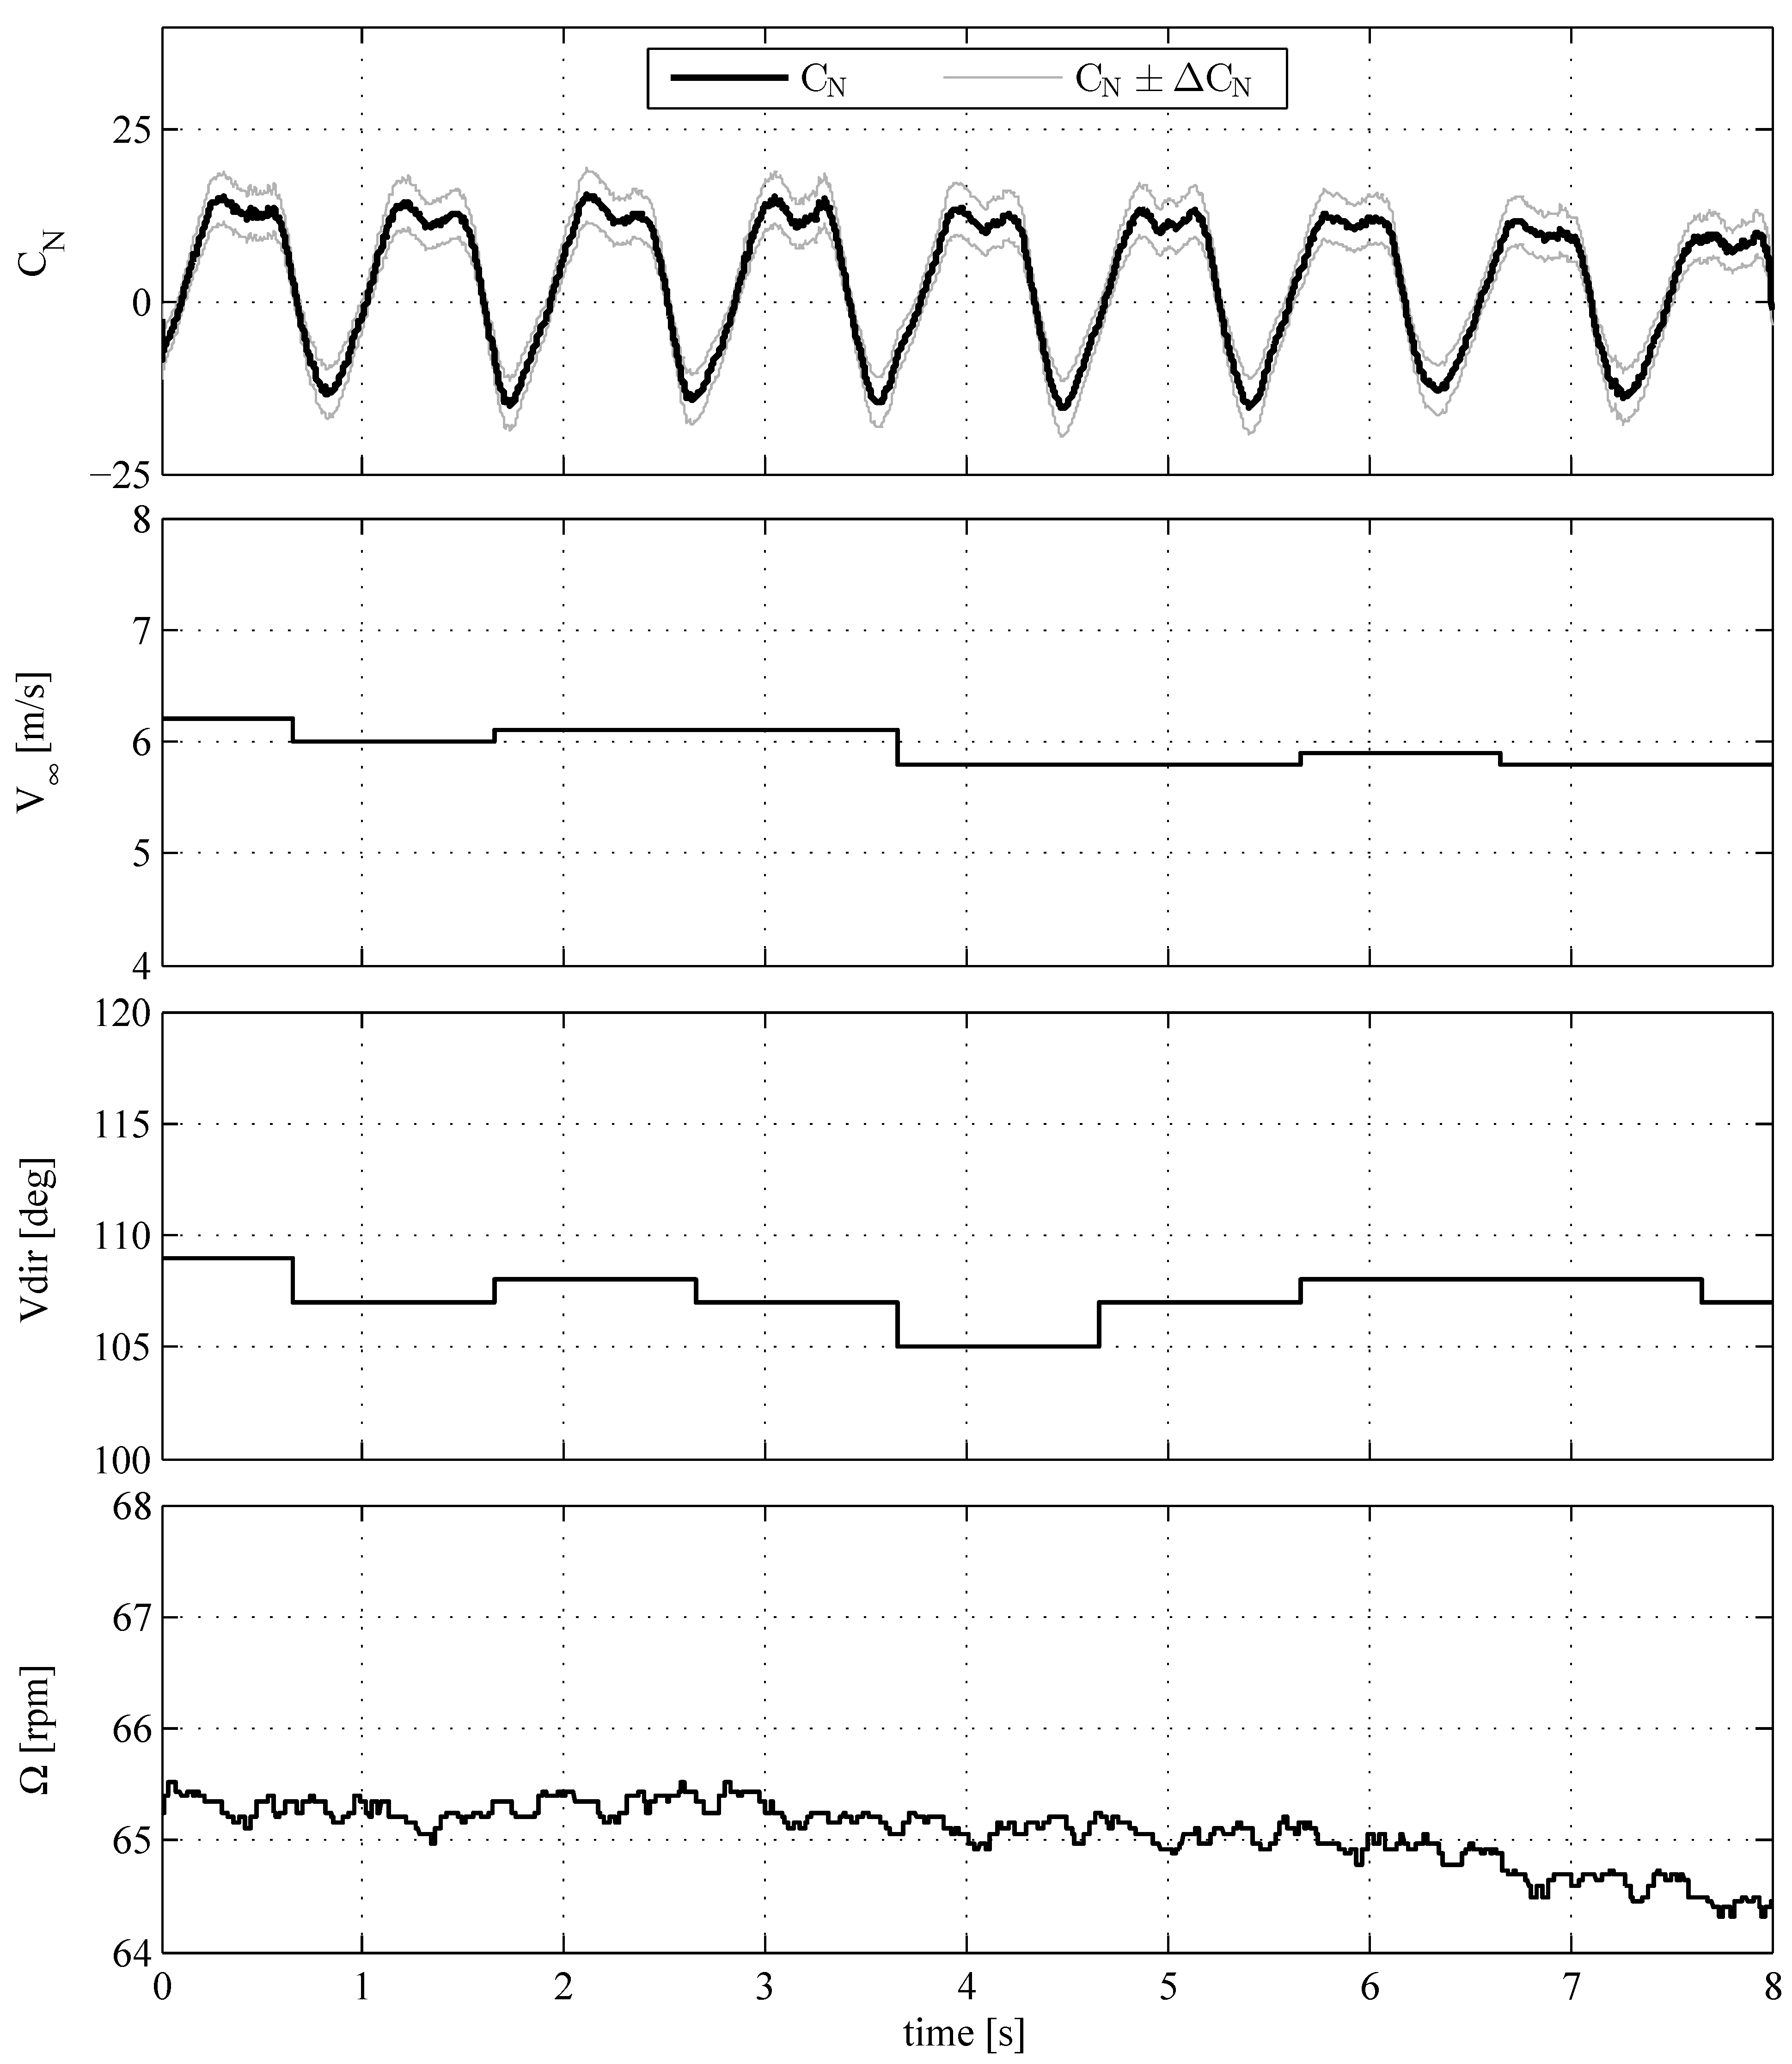
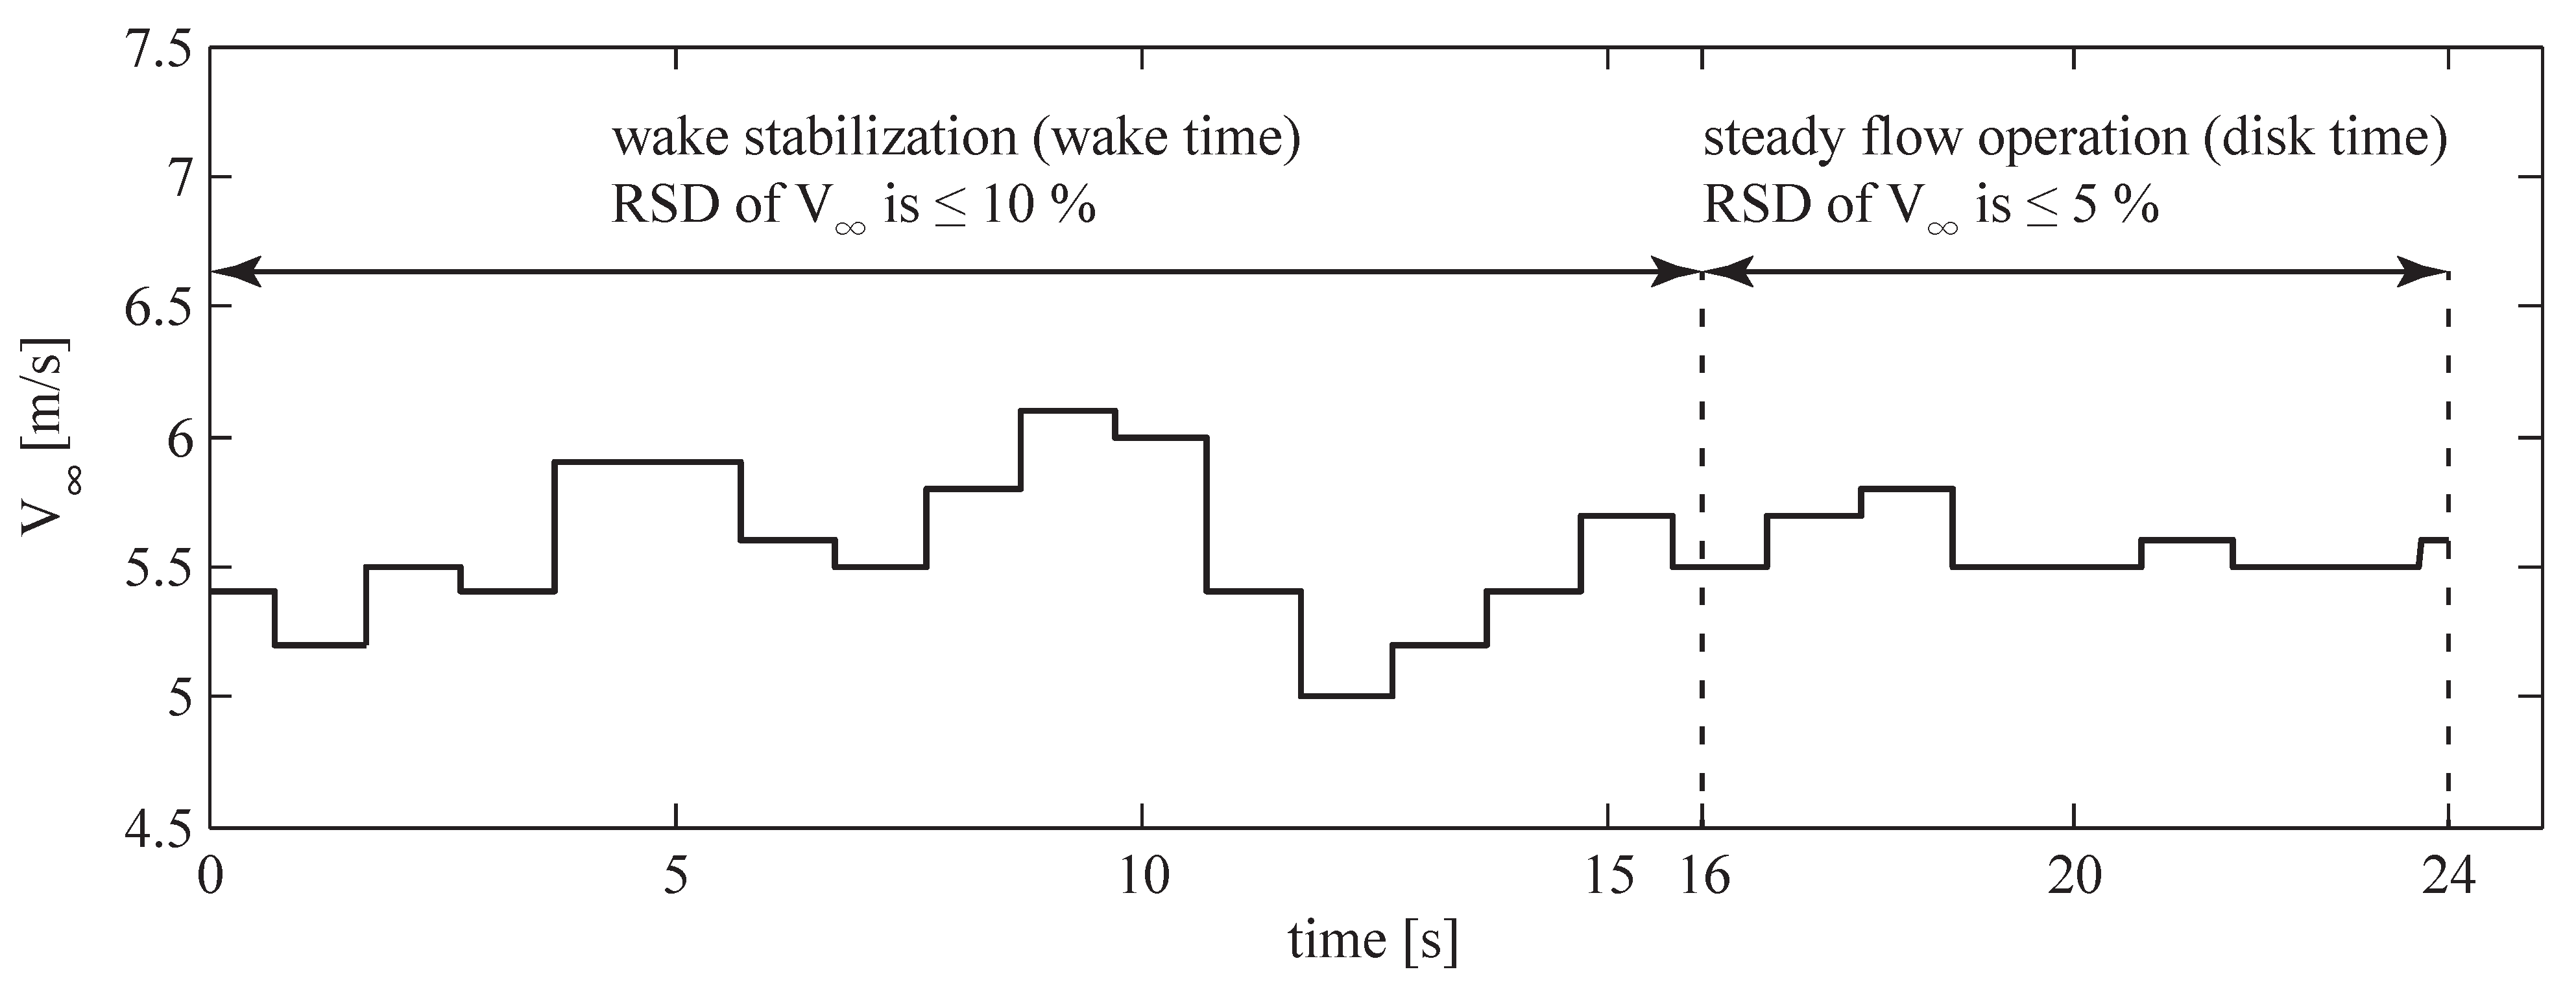
4.1. Measurement Accuracy
4.2. Normal Force Coefficient


| Conditions | λ | ||||
|---|---|---|---|---|---|
| Steady, Figure 6 | 3.71 ± 0.20 | 65.07 | ±4.0 | ±3.0 | 1.2385 |
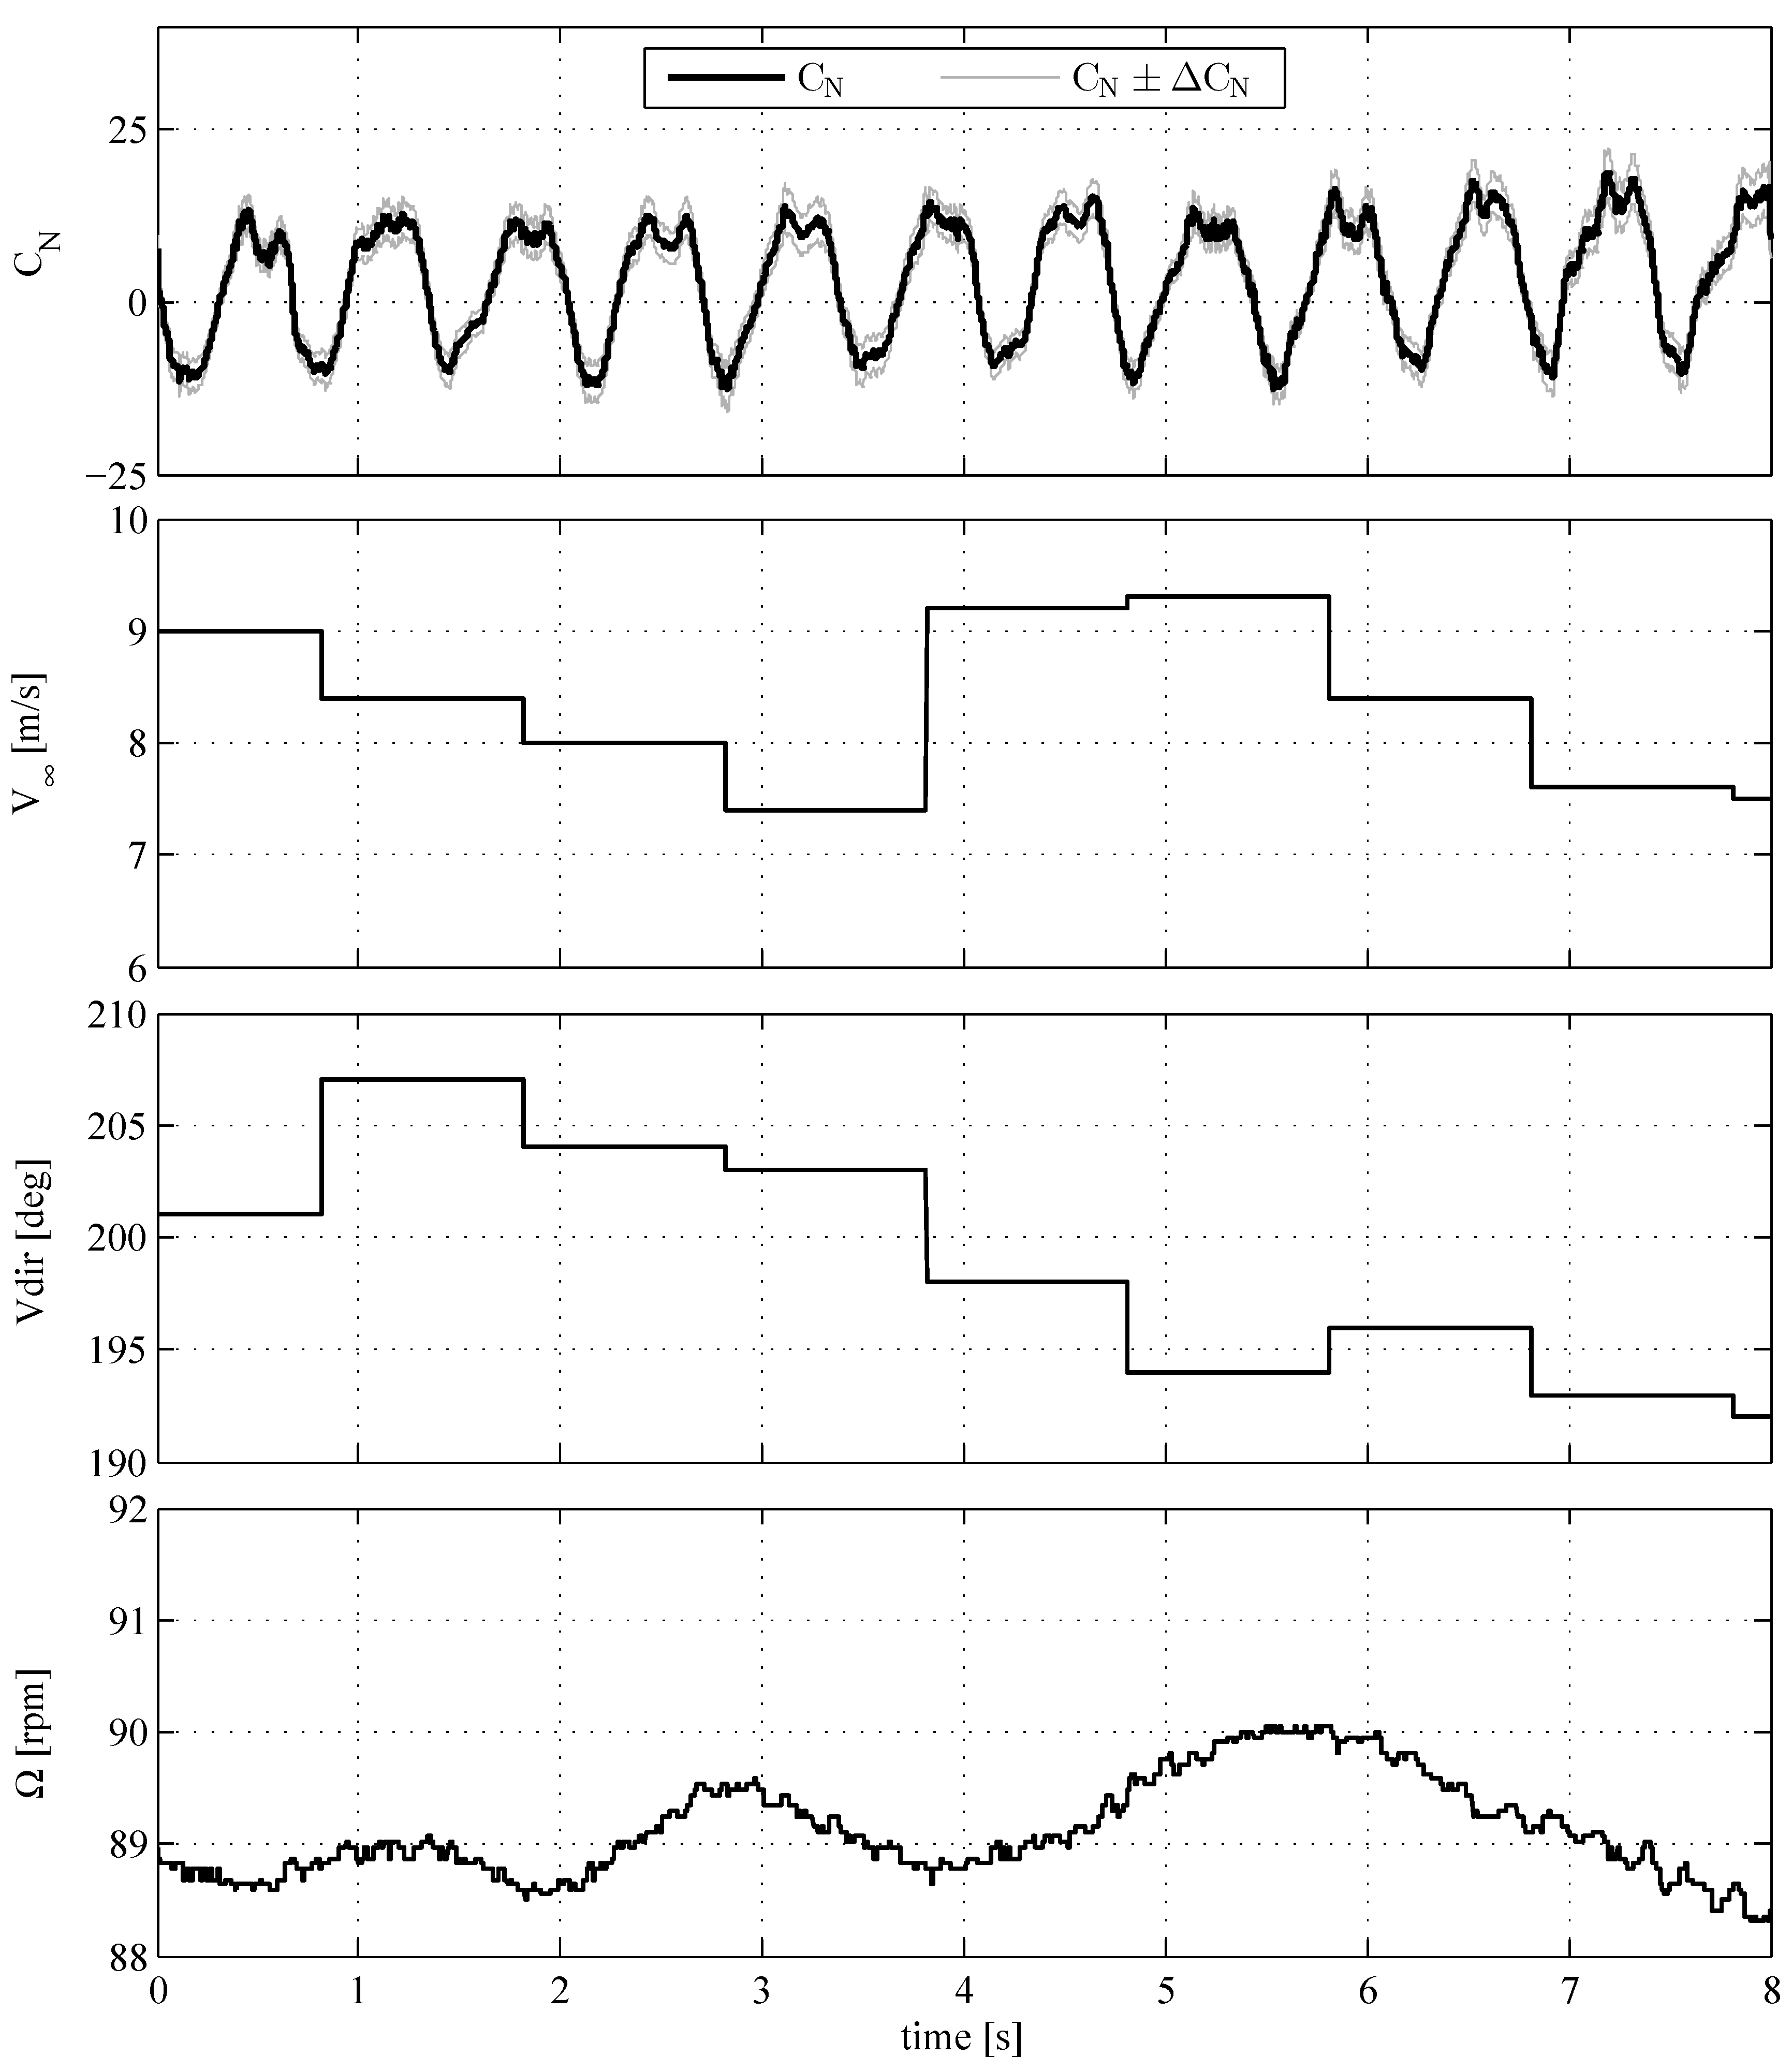
| Unsteady, Figure 7 | 3.61 ± 0.14 | 89.13 | ±3.6 | ±2.5 | 1.2469 |
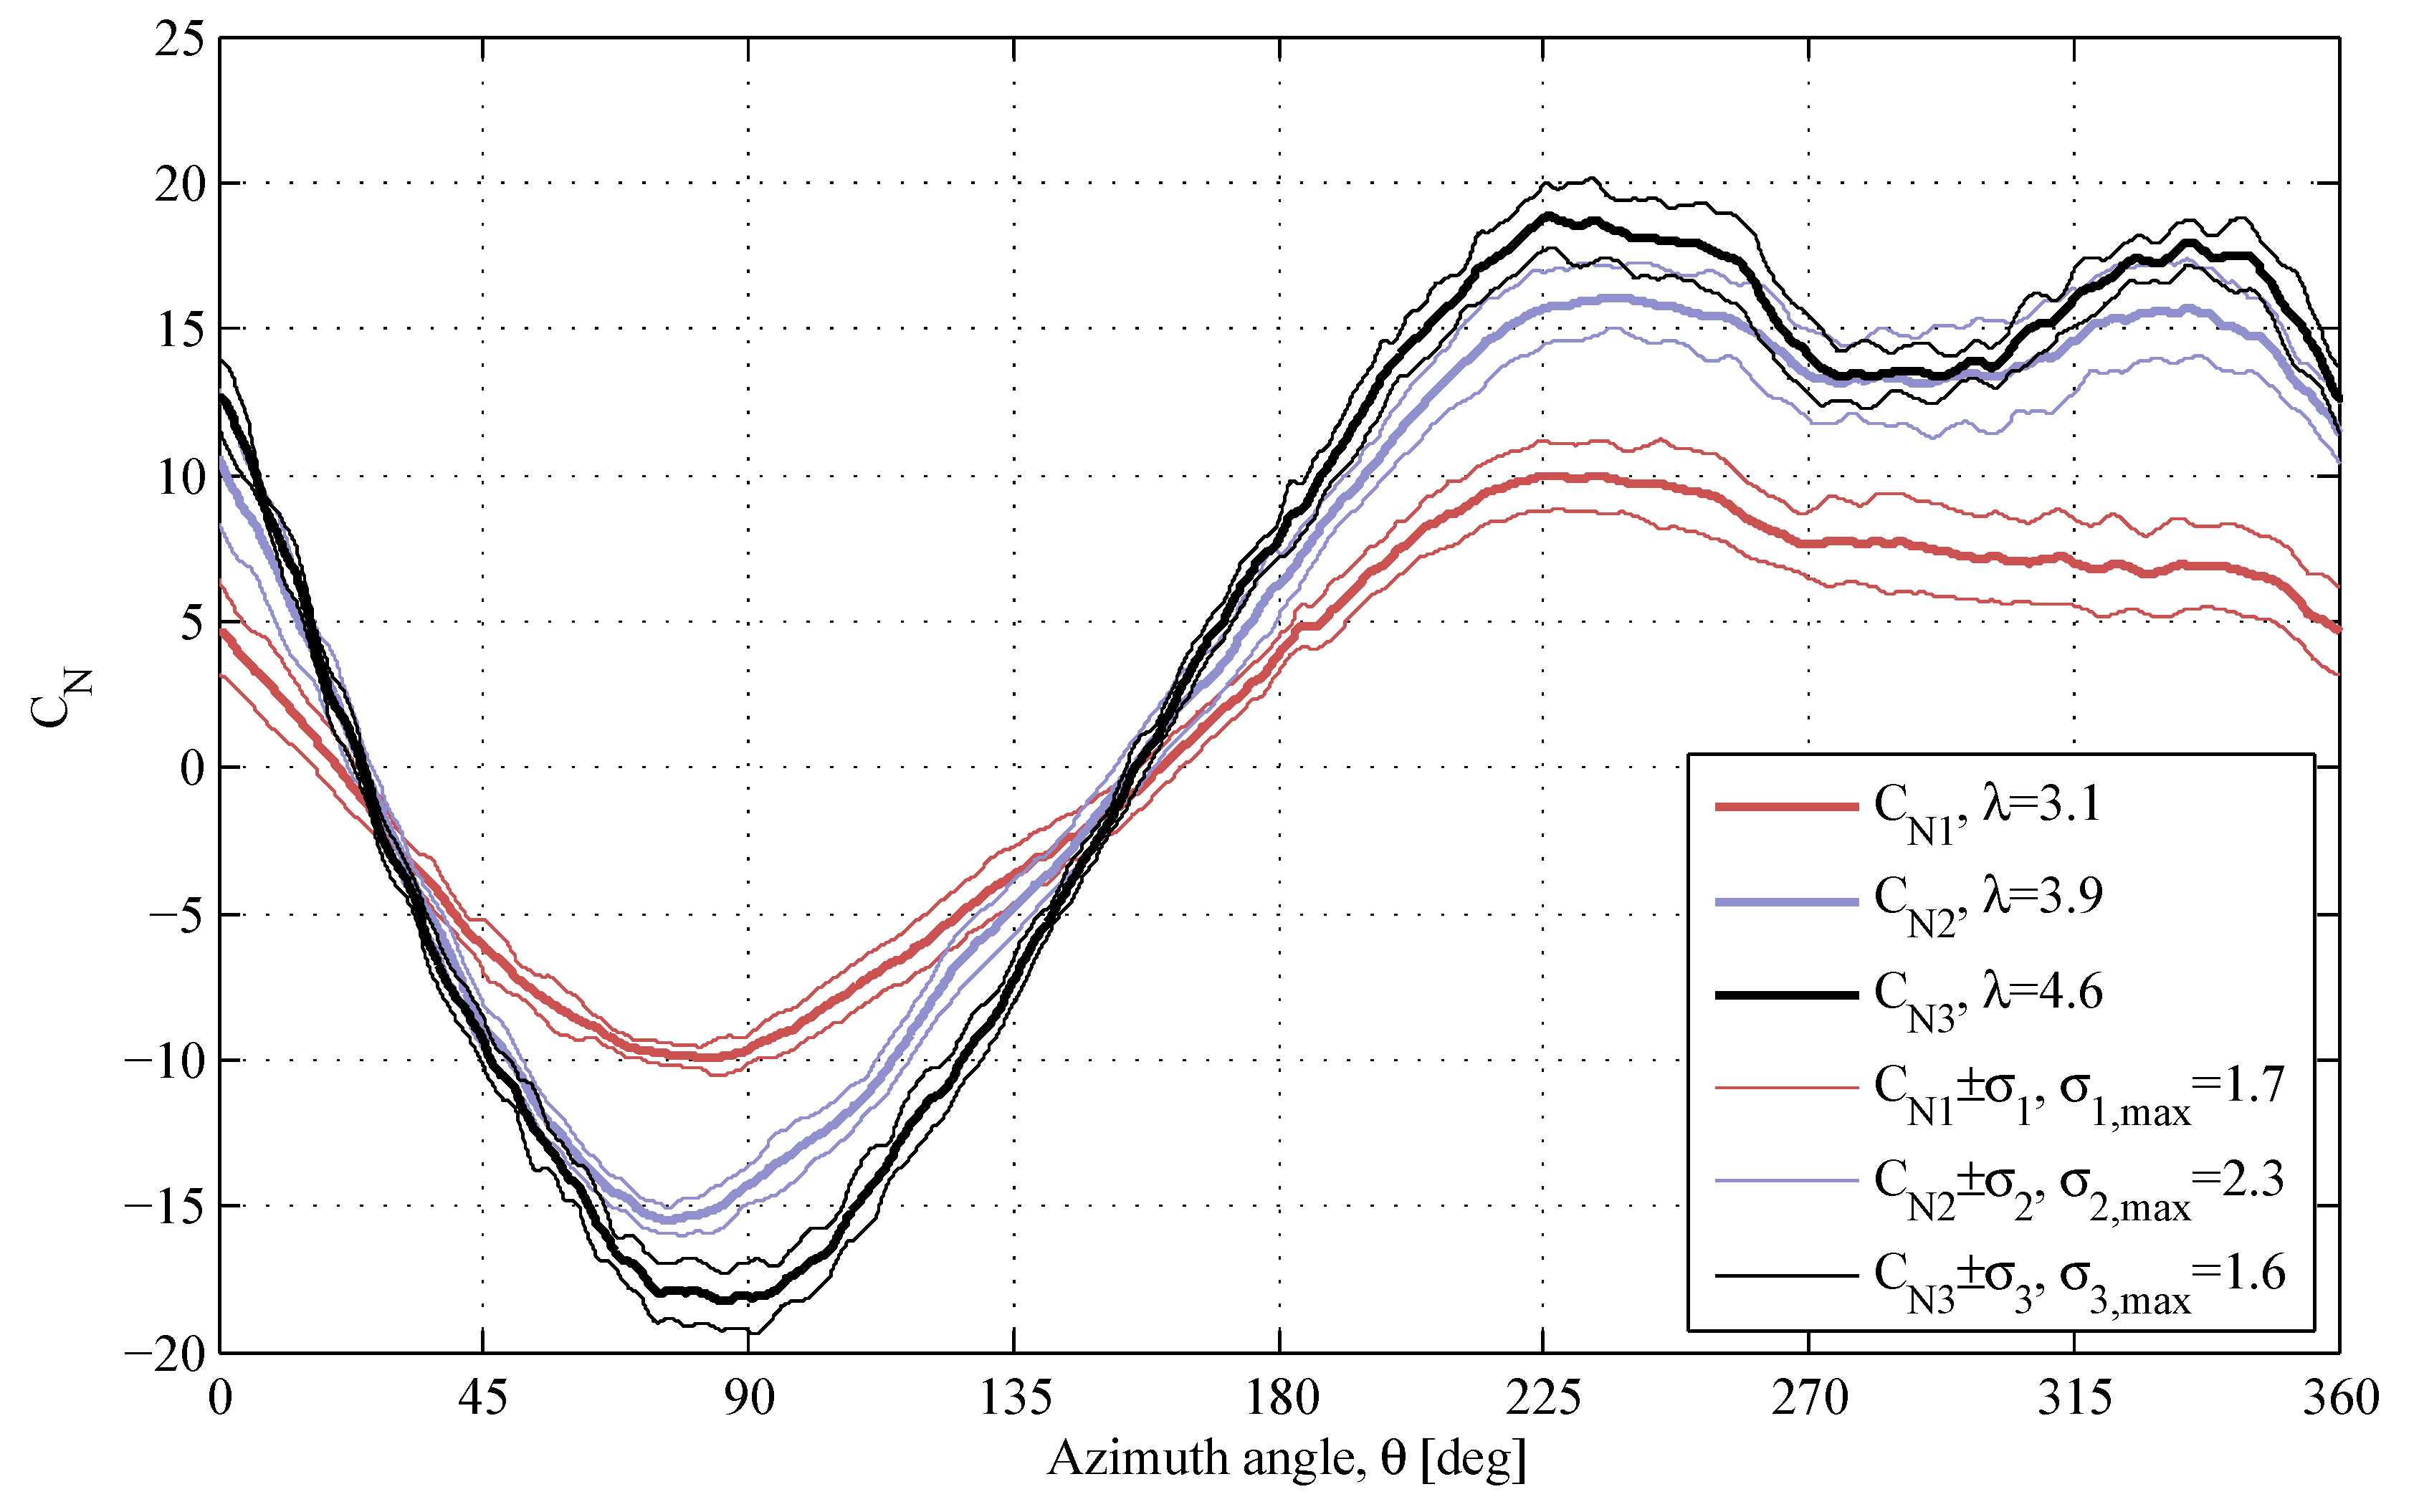
| 65 rpm, Figure 8 | 3.06 ± 0.14 | 65.36 | ±2.4 | ±1.7 | 1.2367 |
| 3.87 ± 0.22 | 65.98 | ±4.1 | ±3.0 | 1.2447 | |
| 4.57 ± 0.30 | 65.35 | ±5.7 | ±4.2 | 1.2479 | |
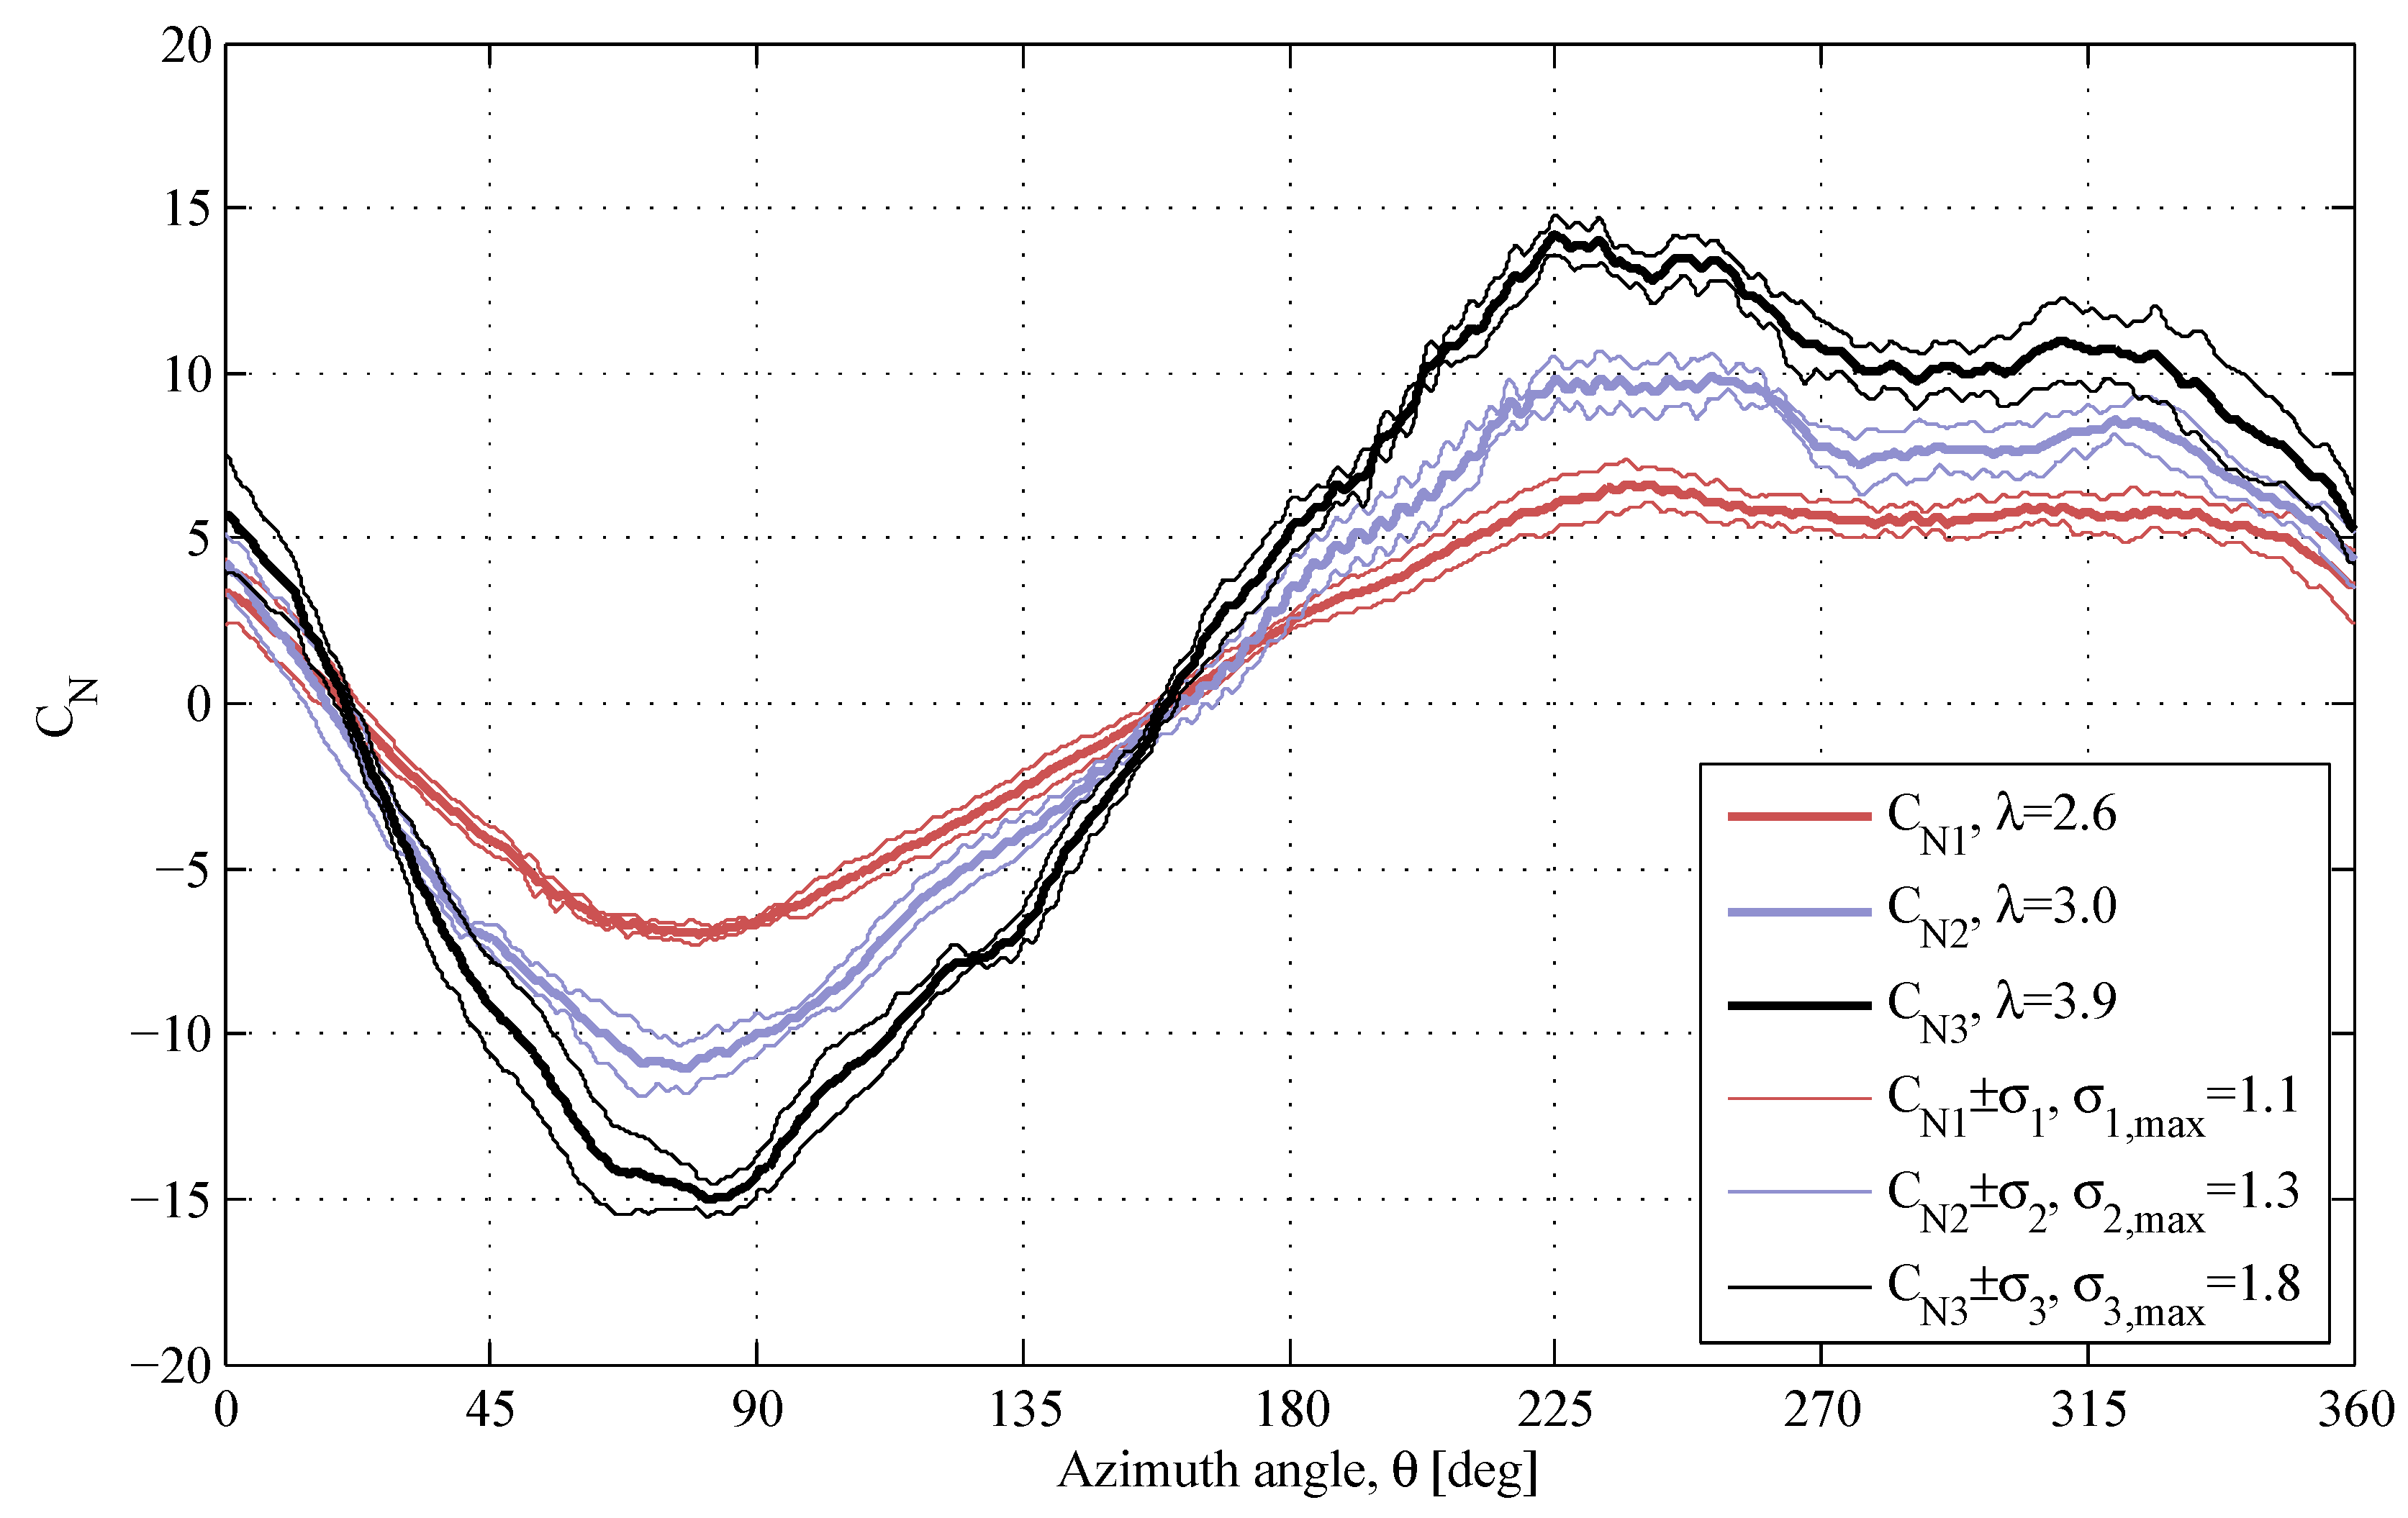
| 50 rpm, Figure 9 | 2.55 ± 0.13 | 49.89 | ±2.0 | ±1.5 | 1.2535 |
| 3.04 ± 0.18 | 49.74 | ±3.2 | ±2.5 | 1.2748 | |
| 3.88 ± 0.28 | 49.57 | ±5.3 | ±4.2 | 1.2761 | |
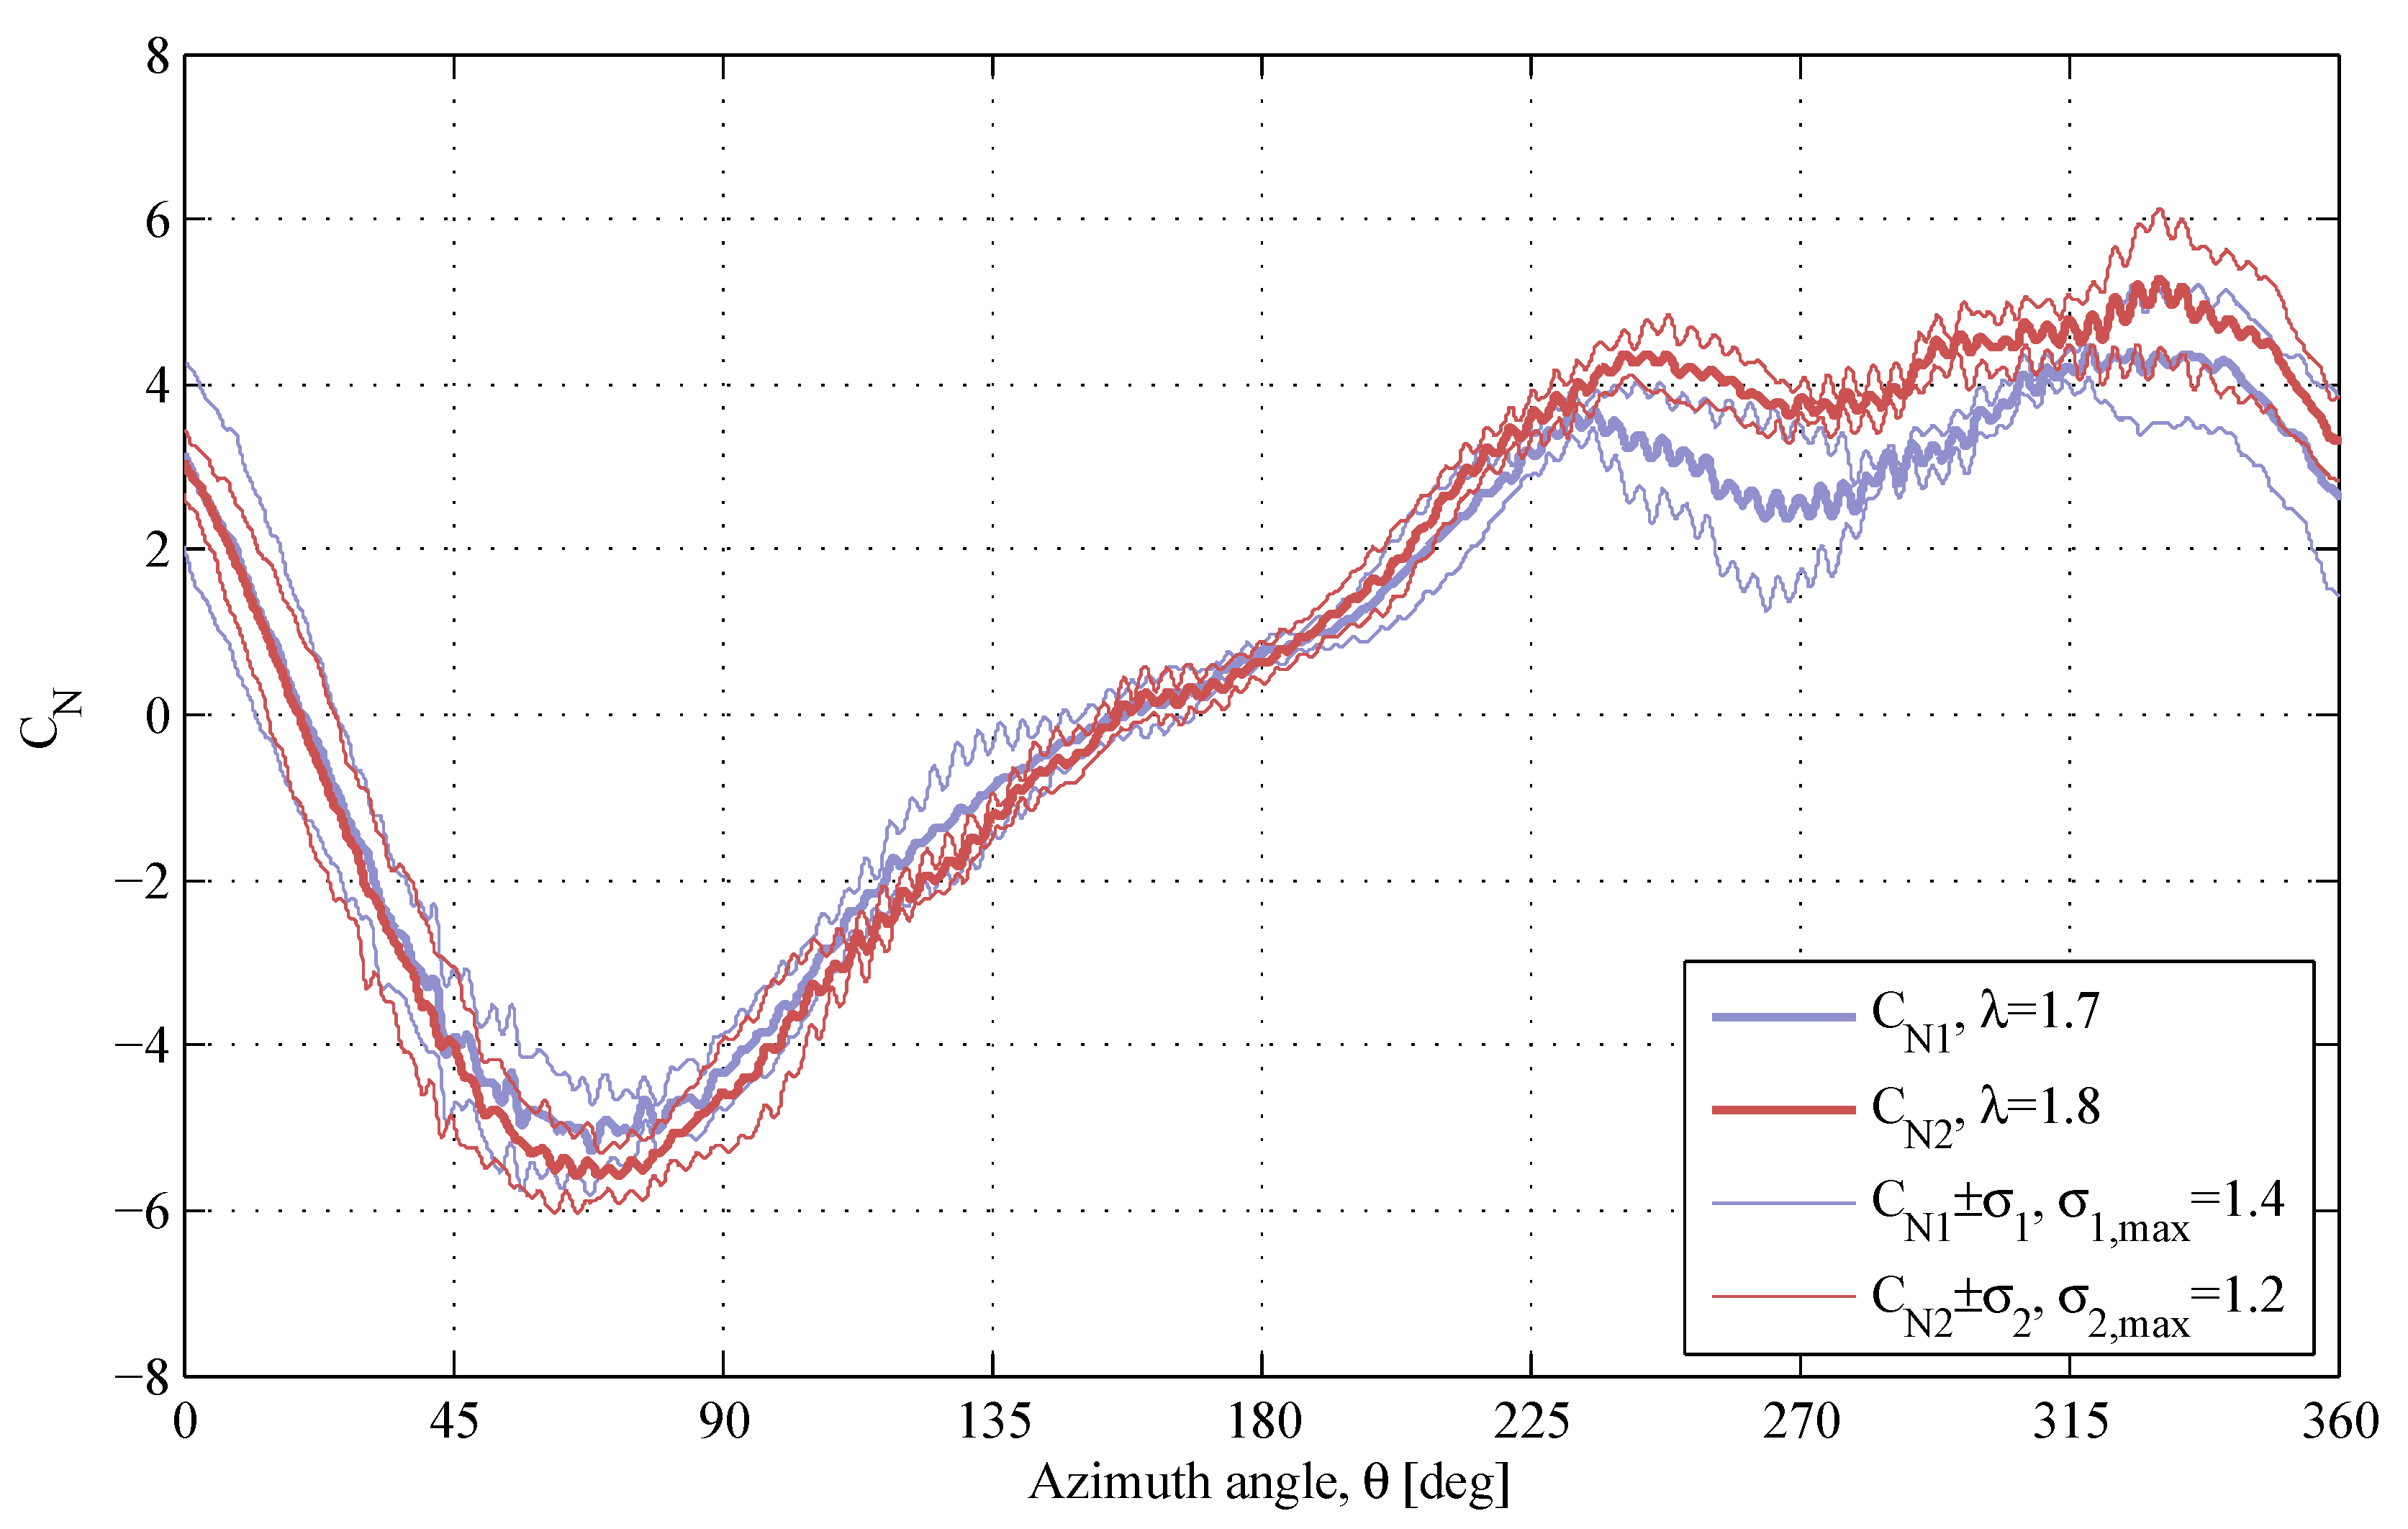
| 40 rpm, Figure 10 | 1.66 ± 0.07 | 39.97 | ±1.2 | ±1.0 | 1.2533 |
| 1.84 ± 0.08 | 40.29 | ±1.5 | ±1.2 | 1.2533 |

4.3. General Comments
5. Conclusions
Acknowledgments
Author Contributions
Conflicts of Interest
References
- Paquette, J.; Barone, M. Innovative offshore vertical-axis wind turbine rotor project. In Proceedings of EWEA 2012 Annual Event, Copenhagen, Denmark, 16–19 April 2012.
- Sutherland, H.J.; Berg, D.E.; Ashwill, T.D. A Retrospective of VAWT Technology; Technical Report SAND2012-0304; Sandia National Laboratories: Albuquerque, NM, USA, 2012. [Google Scholar]
- Blusseau, P.; Patel, M.H. Gyroscopic effects on a large vertical axis wind turbine mounted on a floating structure. Renew. Energy 2012, 46, 31–42. [Google Scholar] [CrossRef]
- Paulsen, U.S.; Madsen, H.A.; Hattel, J.H.; Baran, I.; Nielsen, P.H. Design Optimization of a 5 MW Floating Offshore Vertical-Axis Wind Turbine. In Proceedings of the 10th Deep Sea Offshore Wind R and D Conference, DeepWind, Trondheim, Norway, 24–25 January 2013; Elsevier BV: Trondheim, Norway, 2012; Volume 35, pp. 22–32. [Google Scholar] [CrossRef]
- Shires, A. Design optimisation of an offshore vertical axis wind turbine. Proc. ICE-Energy 2013, 166, 7–18. [Google Scholar] [CrossRef]
- Kaldellis, J.; Kapsali, M. Shifting towards offshore wind energy—Recent activity and future development. Energy Policy 2013, 53, 136–148. [Google Scholar] [CrossRef]
- Johnston, S.F. Proceedings of the Vertical Axis Wind Turbine (VAWT) Design Technology Seminar for Industry; Technical Report SAND80-0984; Sandia National Laboratories: Albuquerque, NM, USA, 1989. [Google Scholar]
- Akins, R.E. Measurements of Surface Pressures on an Operating Vertical-Axis Wind Turbine; Technical Report SAND89-7051; Sandia National Laboratories: Albuquerque, NM, USA, 1989. [Google Scholar]
- Oler, J.; Strickland, J.; Im, B.; Graham, G. Dynamic Stall Regulation of the Darrieus Turbine; Sandia National Laboratories: Albuquerque, NM, USA, 1983. [Google Scholar]
- Shires, A. Development and Evaluation of an Aerodynamic Model for a Novel Vertical Axis Wind Turbine Concept. Energies 2013, 6, 2501–2520. [Google Scholar] [CrossRef] [Green Version]
- Keinan, M. A Modified Streamtube Model for Vertical Axis Wind Turbines. Wind Eng. 2012, 36, 145–180. [Google Scholar] [CrossRef]
- Wang, K.; Hansen, M.O.L.; Moan, T. Model improvements for evaluating the effect of tower tilting on the aerodynamics of a vertical axis wind turbine. Wind Energy 2015, 18, 91–110. [Google Scholar] [CrossRef]
- Strickland, J.H.; Webster, B.T.; Nguyen, T. A vortex model of the Darrieus turbine: An analytical and experimental study. J. Fluids Eng. 1979, 101, 500–505. [Google Scholar] [CrossRef]
- Ashuri, T.; van Bussel, G.; Mieras, S. Development and validation of a computational model for design analysis of a novel marine turbine. Wind Energy 2013, 16, 77–90. [Google Scholar] [CrossRef]
- Kjellin, J.; Bülow, F.; Eriksson, S.; Deglaire, P.; Leijon, M.; Bernhoff, H. Power coefficient measurement on a 12 kW straight bladed vertical axis wind turbine. Renew. Energy 2011, 36, 3050–3053. [Google Scholar] [CrossRef]
- Apelfröjd, S.; Bülow, F.; Kjellin, J.; Eriksson, S. Laboratory verification of system for grid connection of a 12 kW variable speed wind turbine with a permanent magnet synchronous generator. In Proceedings of the EWEA 2012 Annual Event, Copenhagen, Denmark, 16–19 April 2012.
- Rossander, M.; Dyachuk, E.; Apelfröjd, S.; Trolin, K.; Goude, A.; Bernhoff, H.; Eriksson, S. Evaluation of a blade force measurement system for a vertical axis wind turbine using load cells. Energies 2015, 8, 5973–5996. [Google Scholar] [CrossRef]
© 2015 by the authors; licensee MDPI, Basel, Switzerland. This article is an open access article distributed under the terms and conditions of the Creative Commons Attribution license (http://creativecommons.org/licenses/by/4.0/).
Share and Cite
Dyachuk, E.; Rossander, M.; Goude, A.; Bernhoff, H. Measurements of the Aerodynamic Normal Forces on a 12-kW Straight-Bladed Vertical Axis Wind Turbine. Energies 2015, 8, 8482-8496. https://doi.org/10.3390/en8088482
Dyachuk E, Rossander M, Goude A, Bernhoff H. Measurements of the Aerodynamic Normal Forces on a 12-kW Straight-Bladed Vertical Axis Wind Turbine. Energies. 2015; 8(8):8482-8496. https://doi.org/10.3390/en8088482
Chicago/Turabian StyleDyachuk, Eduard, Morgan Rossander, Anders Goude, and Hans Bernhoff. 2015. "Measurements of the Aerodynamic Normal Forces on a 12-kW Straight-Bladed Vertical Axis Wind Turbine" Energies 8, no. 8: 8482-8496. https://doi.org/10.3390/en8088482
APA StyleDyachuk, E., Rossander, M., Goude, A., & Bernhoff, H. (2015). Measurements of the Aerodynamic Normal Forces on a 12-kW Straight-Bladed Vertical Axis Wind Turbine. Energies, 8(8), 8482-8496. https://doi.org/10.3390/en8088482