Article

Investigation of Fault Permeability in Sands with Different Mineral Compositions (Evaluation of Gas Hydrate Reservoir)

Reservoir Modeling Team, Methane Hydrate Research Centre, National Institute of Advanced Industrial Science and Technology (AIST), 2-17-2-1 Tsukisamu-Higashi, Toyohira-ku, Sapporo 062-8517, Japan
*
Author to whom correspondence should be addressed.
Current Address: Research Institute of Innovative Technology for the Earth (RITE), 9-2 Kizugawa-dai, Kizugawa, Kyoto 619-0292, Japan;
Energies 2015, 8(7), 7202-7223; https://doi.org/10.3390/en8077202
Submission received: 26 March 2015 / Revised: 4 July 2015 / Accepted: 7 July 2015 / Published: 16 July 2015

Abstract

:
We used a ring-shear apparatus to examine the perpendicular permeability of sands with different mineral compositions to evaluate fault behavior around gas hydrate reservoirs. The effect of effective normal stress on the permeability of two sand types was investigated under constant effective normal stresses of 0.5–8.0 MPa. Although Toyoura sand and silica sand No. 7 mainly comprise quartz, silica sand No. 7 contains small amounts of feldspar. For Toyoura sand, the permeability after ring-shearing dramatically decreased with increasing effective normal stress up to 3.0 MPa, then gradually decreased for stresses over 3.0 MPa, whereas the permeability after ring-shearing of silica sand No. 7 rapidly decreased with increasing effective normal stress up to 2.0 MPa. Although the relationships between the permeability after ring-shearing and effective normal stress for both sands could be expressed by exponential equations up to 3.0 MPa, a more gradual change in slope was shown for Toyoura sand. The permeabilities of both sands were almost equal for effective normal stresses over 3.0 MPa. The mineralogical properties of the small amount of feldspar in the sample indicate that both mineralogy and original grain size distribution affect the fault permeability and shear zone formation.

1. Introduction

Gas hydrates in sediments are expected to be developed as a next-generation energy resource, which would affect the future development of agriculture, construction, industry, and human life. In the exploitation of methane hydrates, the production methods of methane gas from methane hydrate layers by depressurisation, thermal stimulation, and inhibiter injection have been proposed [1,2,3,4]. For all methods, the gas and water permeability of methane hydrate-bearing sediments are important factors in estimating the efficiency of methane gas production. As a result of coring and logging, the existence of sandy layers containing a large amount of methane hydrate is predicted in the eastern Nankai Trough area, offshore central Japan, where many faults and folds have been observed [5]. It is necessary to consider production methods as well as the permeability around faults to estimate methane gas production from methane hydrate reservoirs, because shearing caused by fault slip may produce drastic changes in the texture of materials. Typically, porosity reduction is associated with grain size reduction and fault slip due to the reorientation of particles [6,7,8,9,10]. Several studies used a ring-shear apparatus with large-displacement shearing to measure permeability evolution [11,12,13,14,15,16], because a ring-shear device can shear a specimen with a large displacement that is similar to natural faults with the same direction of movement for the mobile half of the specimen relative to the stationary half [17,18,19,20,21,22,23,24]. Previous studies found that permeability evolution due to particle crushing is related to porosity reduction [11,12,13,14,15,16]. However, these studies have not completely clarified the relationship between permeability and effective normal stress after large-displacement ring-shearing under overburden pressure, which is less than approximately 10 MPa, in methane hydrate reservoir zones. In particular, it is not obvious to research the influence of similar grain size and the sand mineralogy on fault permeability under the normal stress conditions of methane hydrate reservoirs. Further investigations of fault permeability are required for the safe, long-term, and rational production of methane from methane hydrate reservoirs.
The objective of this study was to investigate whether the effects of effective normal stress conditions influence the fault-normal permeability of sand samples with different mineral compositions in experimental faults using a ring-shear apparatus. We measured the permeability after large-displacement shearing under a constant effective normal stress in the range of 0.5–8.0 MPa, considering the effective normal stress conditions of methane hydrate reservoirs. Furthermore, to reveal the relationship between the shear zone conditions and permeability, the microstructure and grain size distribution of the shear zone were analyzed after each experiment. In an updated discussion that considers these new test results in addition to those of Kimura et al. [16], grain crushing in two sand samples with similar grain size distributions and different mineralogical compositions is described to clarify the role of grain crushing in the permeability evolution of a shear zone.

2. Materials and Experimental Section
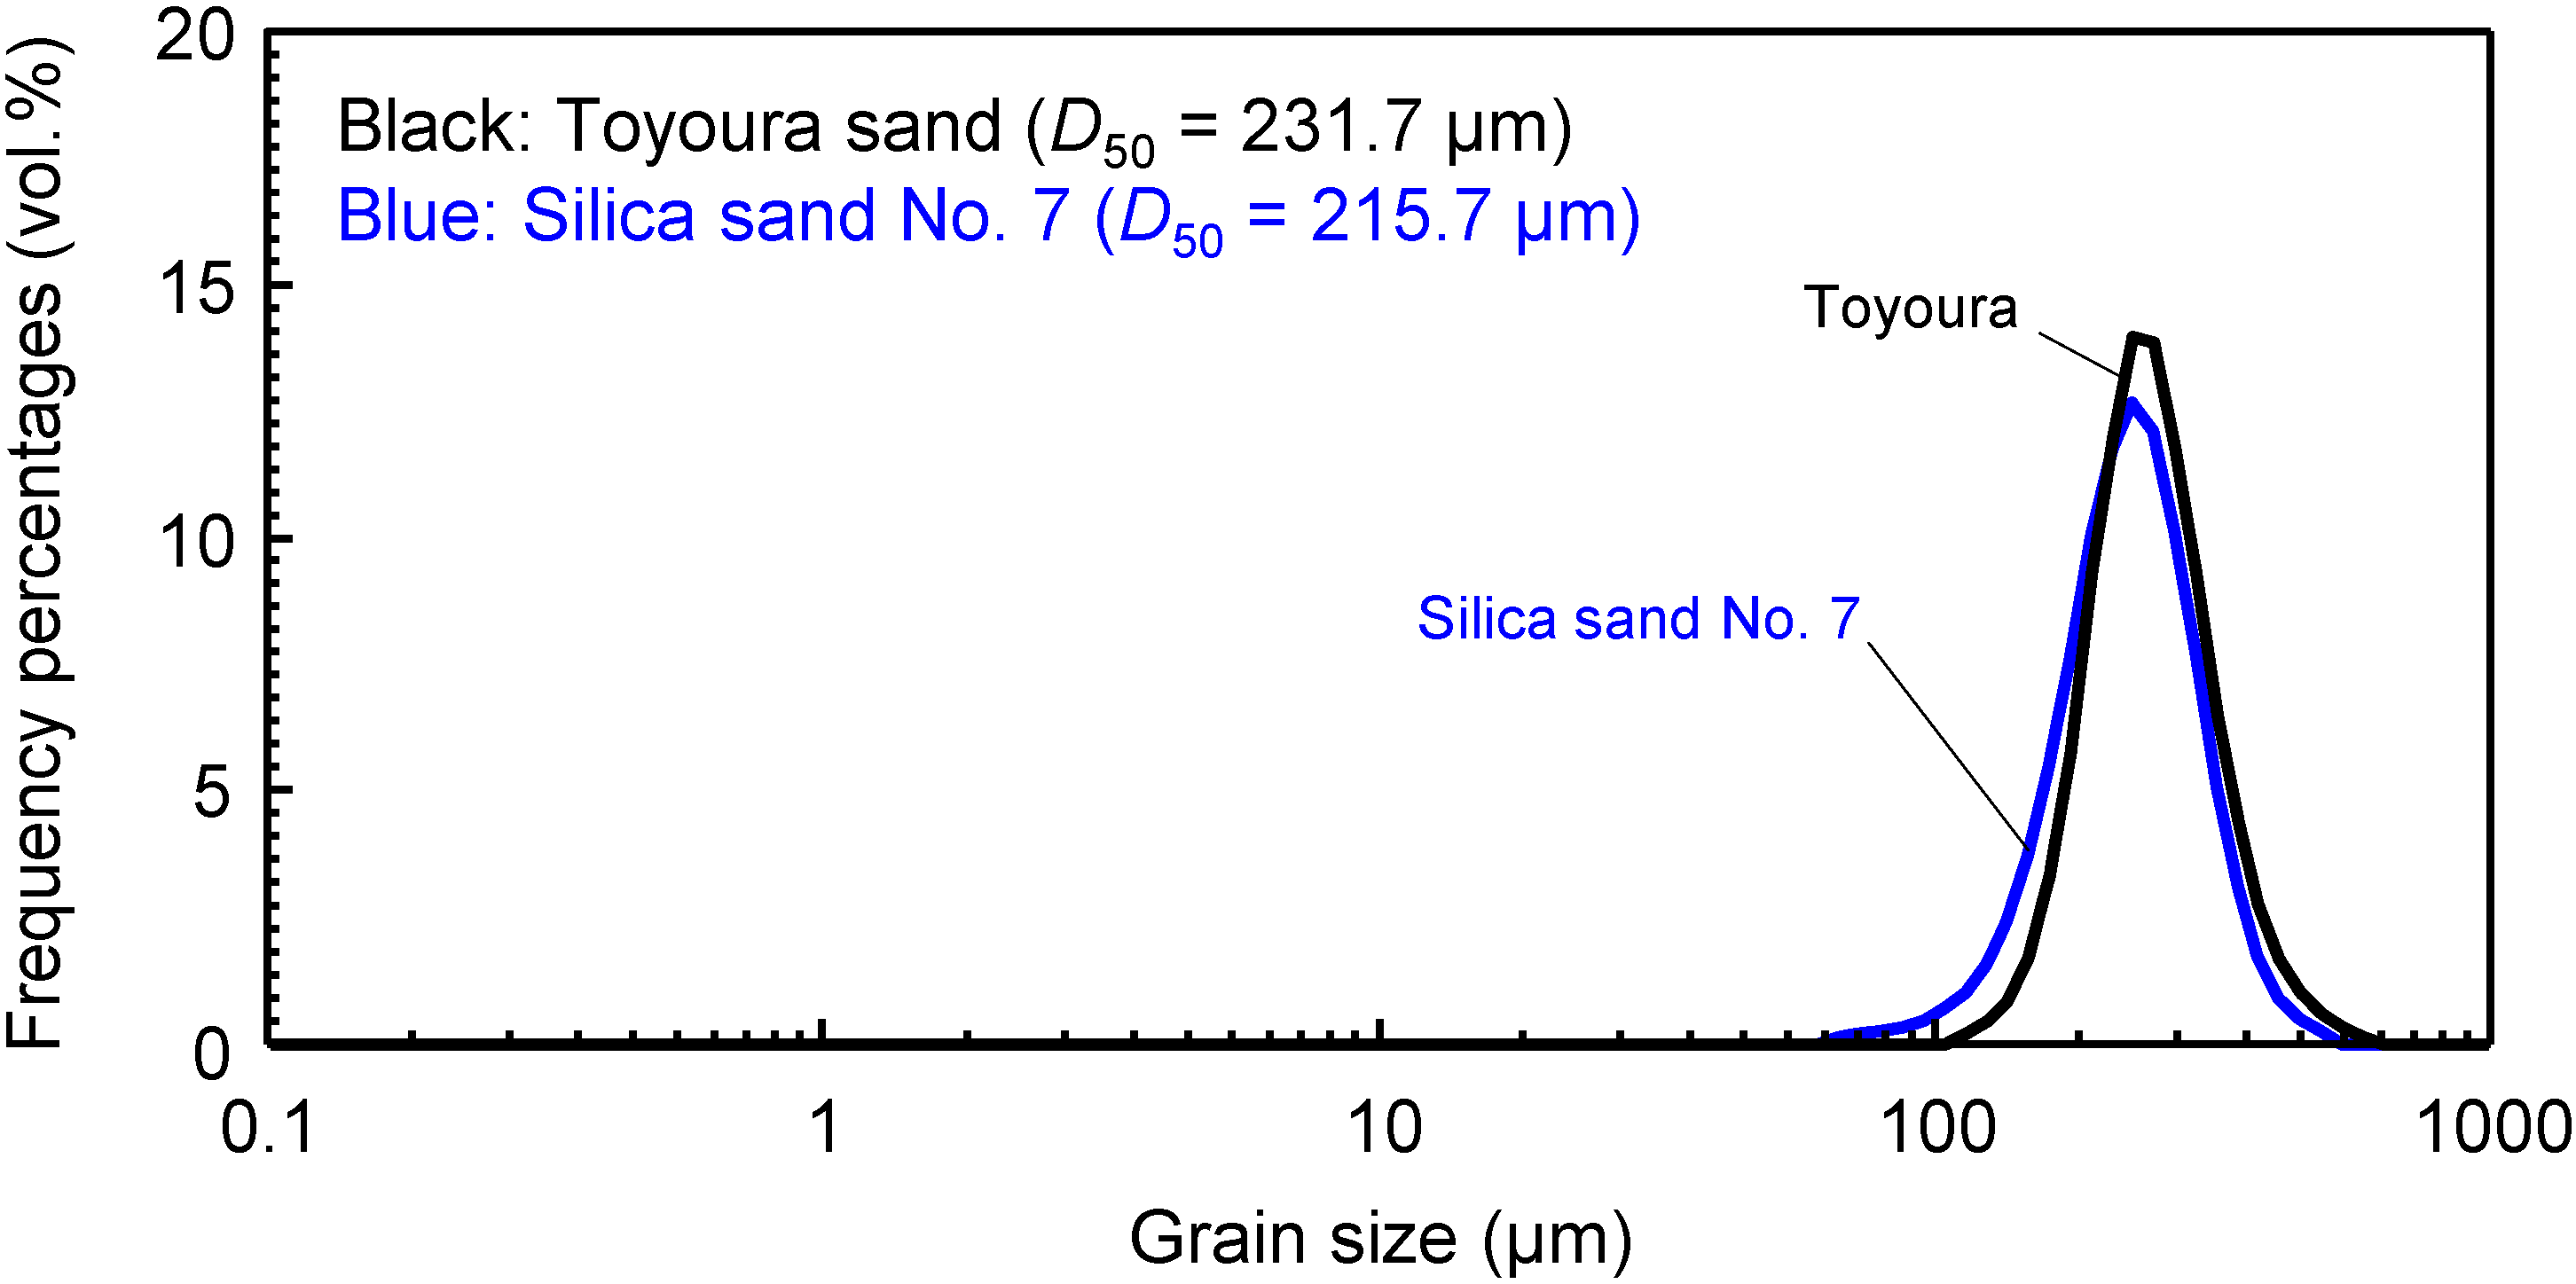
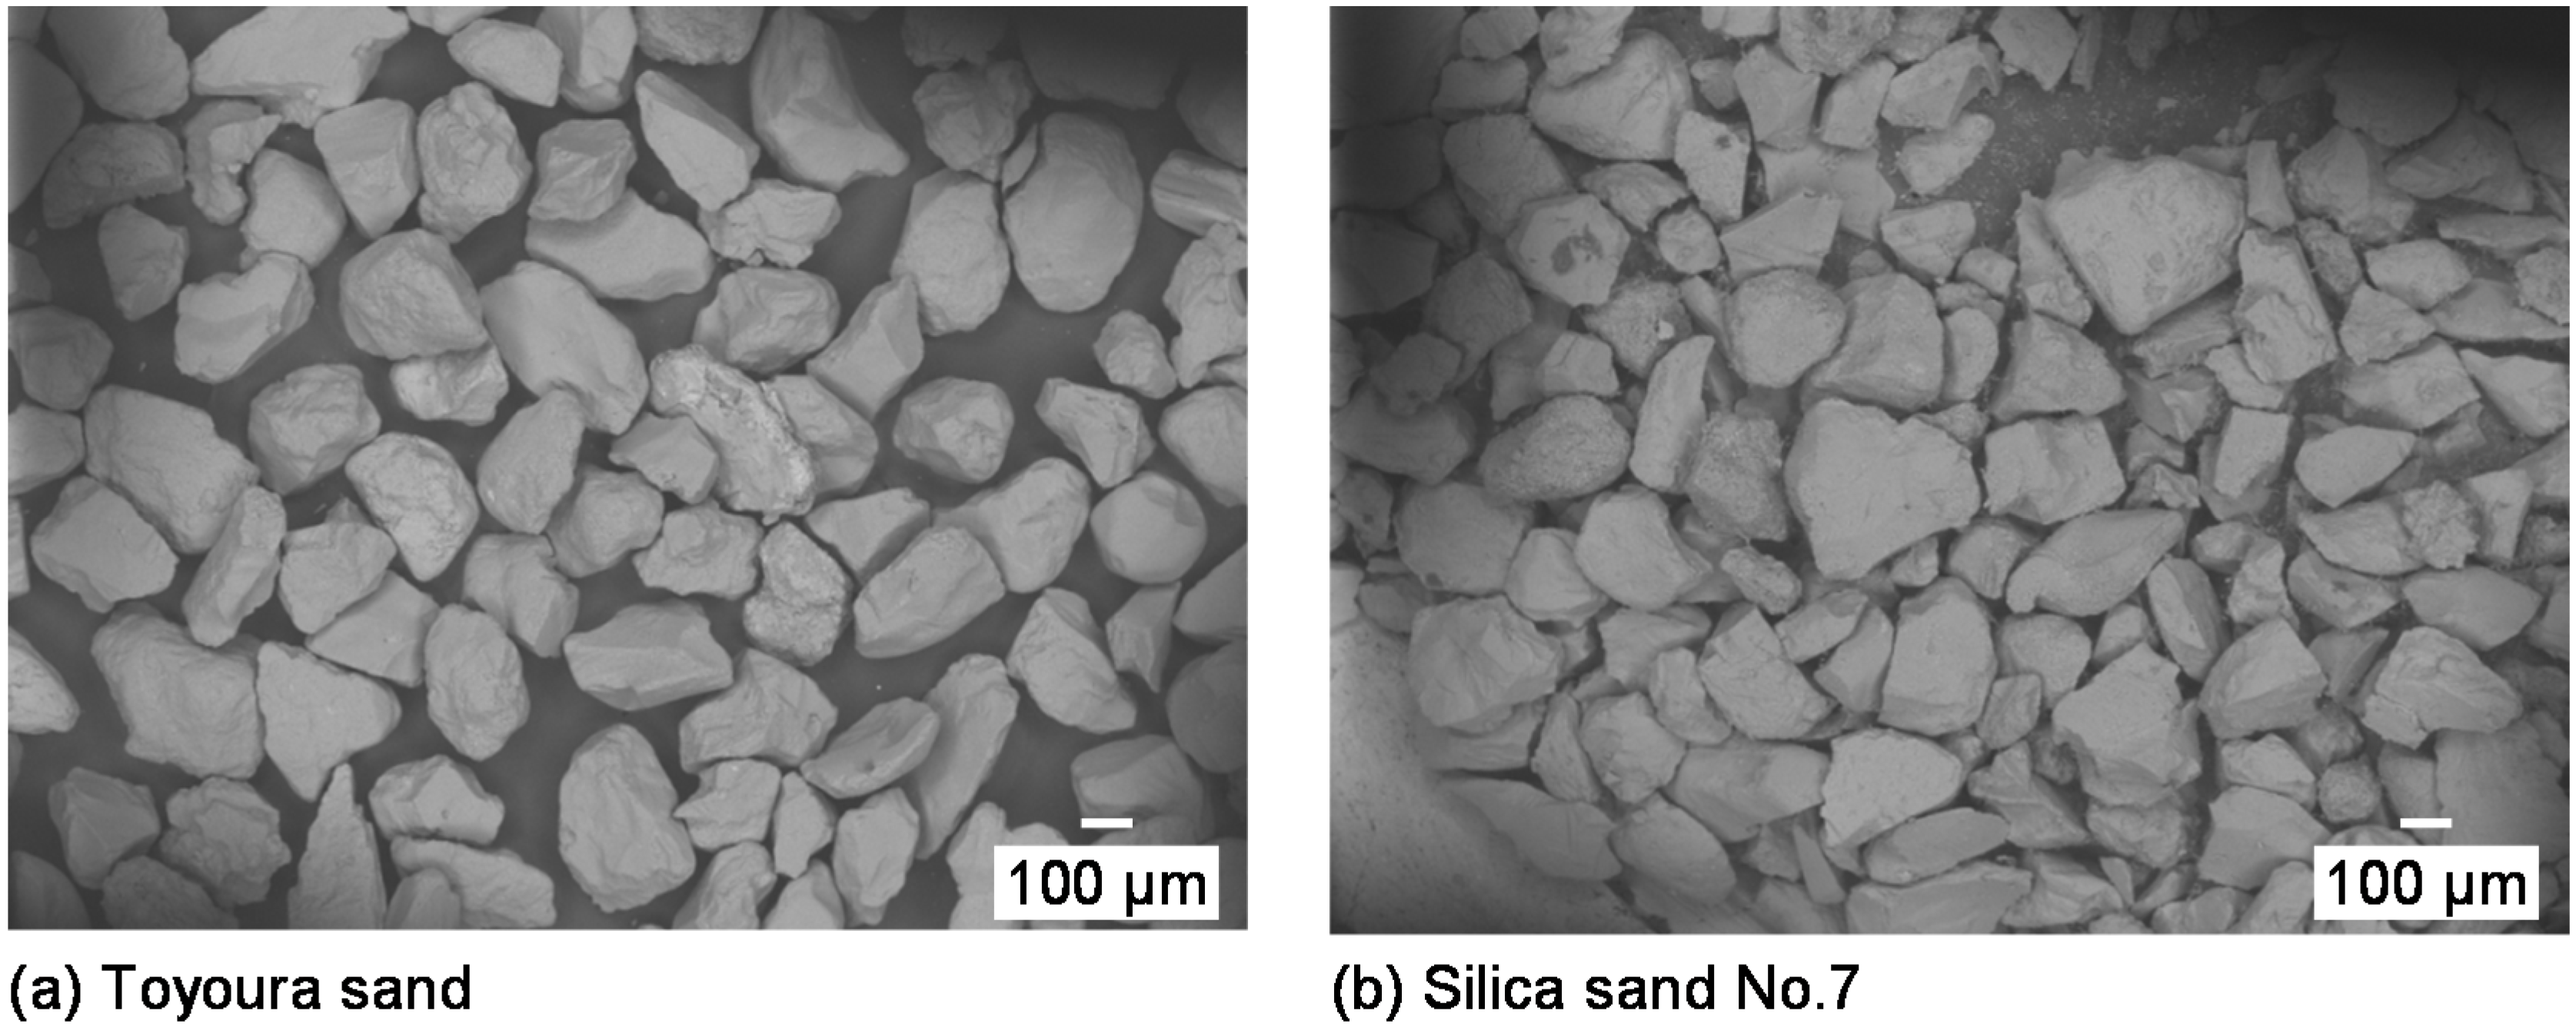
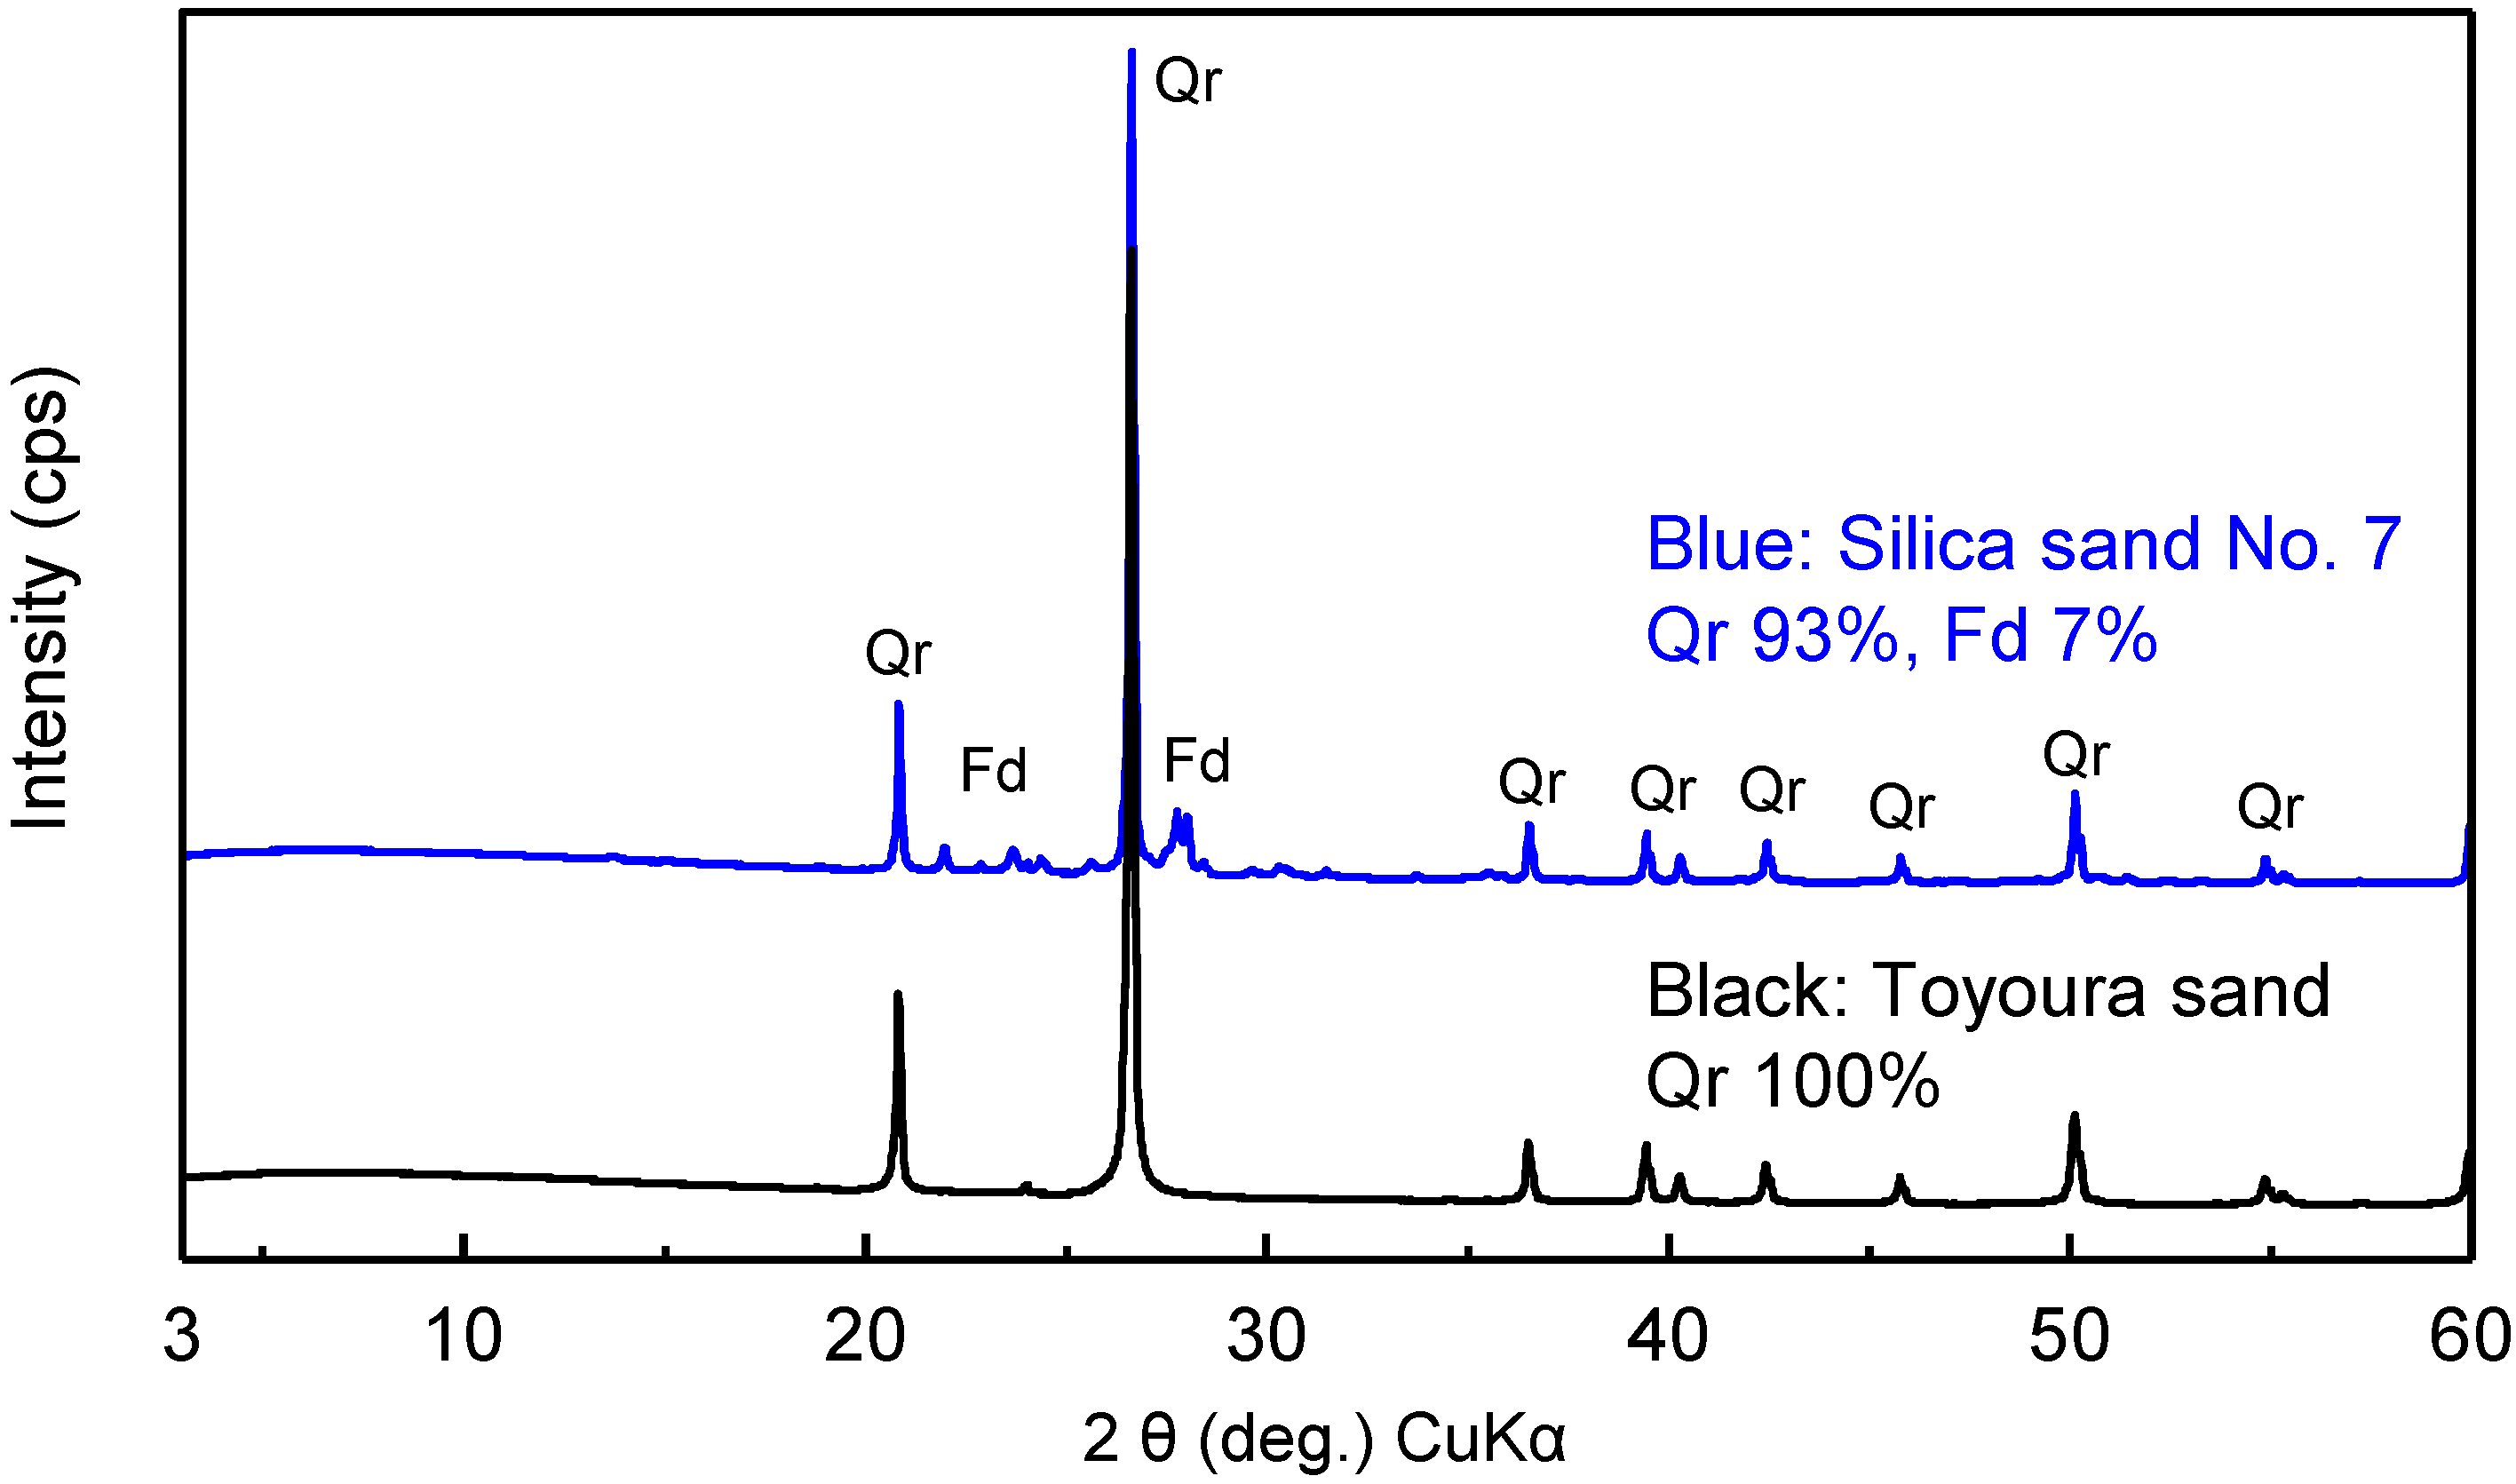
2.1. Samples

The sand samples used for the permeability test and grain size analysis were Toyoura sand and silica sand No. 7. The grains in Toyoura sand and silica sand No. 7 are sub-angular to angular with median diameters D50 of 231.7 and 215.7 µm, respectively (Figure 1 and Figure 2). Furthermore, the particle densities ρs of Toyoura sand and silica sand No. 7 are 2.697 and 2.717 g/cm3, respectively. Minagawa et al. [25,26] reported that the pore size distributions of these sands measured using two methods, mercury porosimetry and the transverse magnetic relaxation time T2 of the nuclear magnetic resonance (NMR) method, have a maximum value of approximately 40 µm. The sand specimen is loaded into the glass sleeve by sedimentation and is formed into a column by sedimentation of sand in water using a vibrator in mercury porosimetry analysis (Quantachrome Instruments Japan, Kawasaki, Japan) and NMR analysis (Resonance Research Inc., Billerica, MA, USA), respectively. The pore size distribution of sand specimens in NMR analysis was measured under the effective confining stress of 1.0 MPa [25,26].
Figure 1. Field emission scanning electron microscopy (FE-SEM) image of the microstructure of (a) Toyoura sand and (b) Silica sand No. 7 used in the experiments.
Energies 08 07202 g001
Figure 2. Grain size frequency distribution curves for Toyoura sand (black) and silica sand No. 7 (blue) samples.
Energies 08 07202 g002
Although the mineral compositions of both samples analyzed by X-ray diffraction (Rigaku, Akishima, Japan) mainly comprised quartz, a small amount of feldspar was detected in silica sand No. 7 sample and not in Toyoura sand (Figure 3). The quartz and feldspar compositions were determined using the method described by Egashira et al. [27]. The quartz and feldspar in silica sand No. 7 are 93% and 7%, respectively. The sub-2000-µm soil fraction of the two sand samples was used in the testing program.
Figure 3. Results of powder X-ray diffraction of Toyoura sand (black) and silica sand No. 7 (blue).
Energies 08 07202 g003

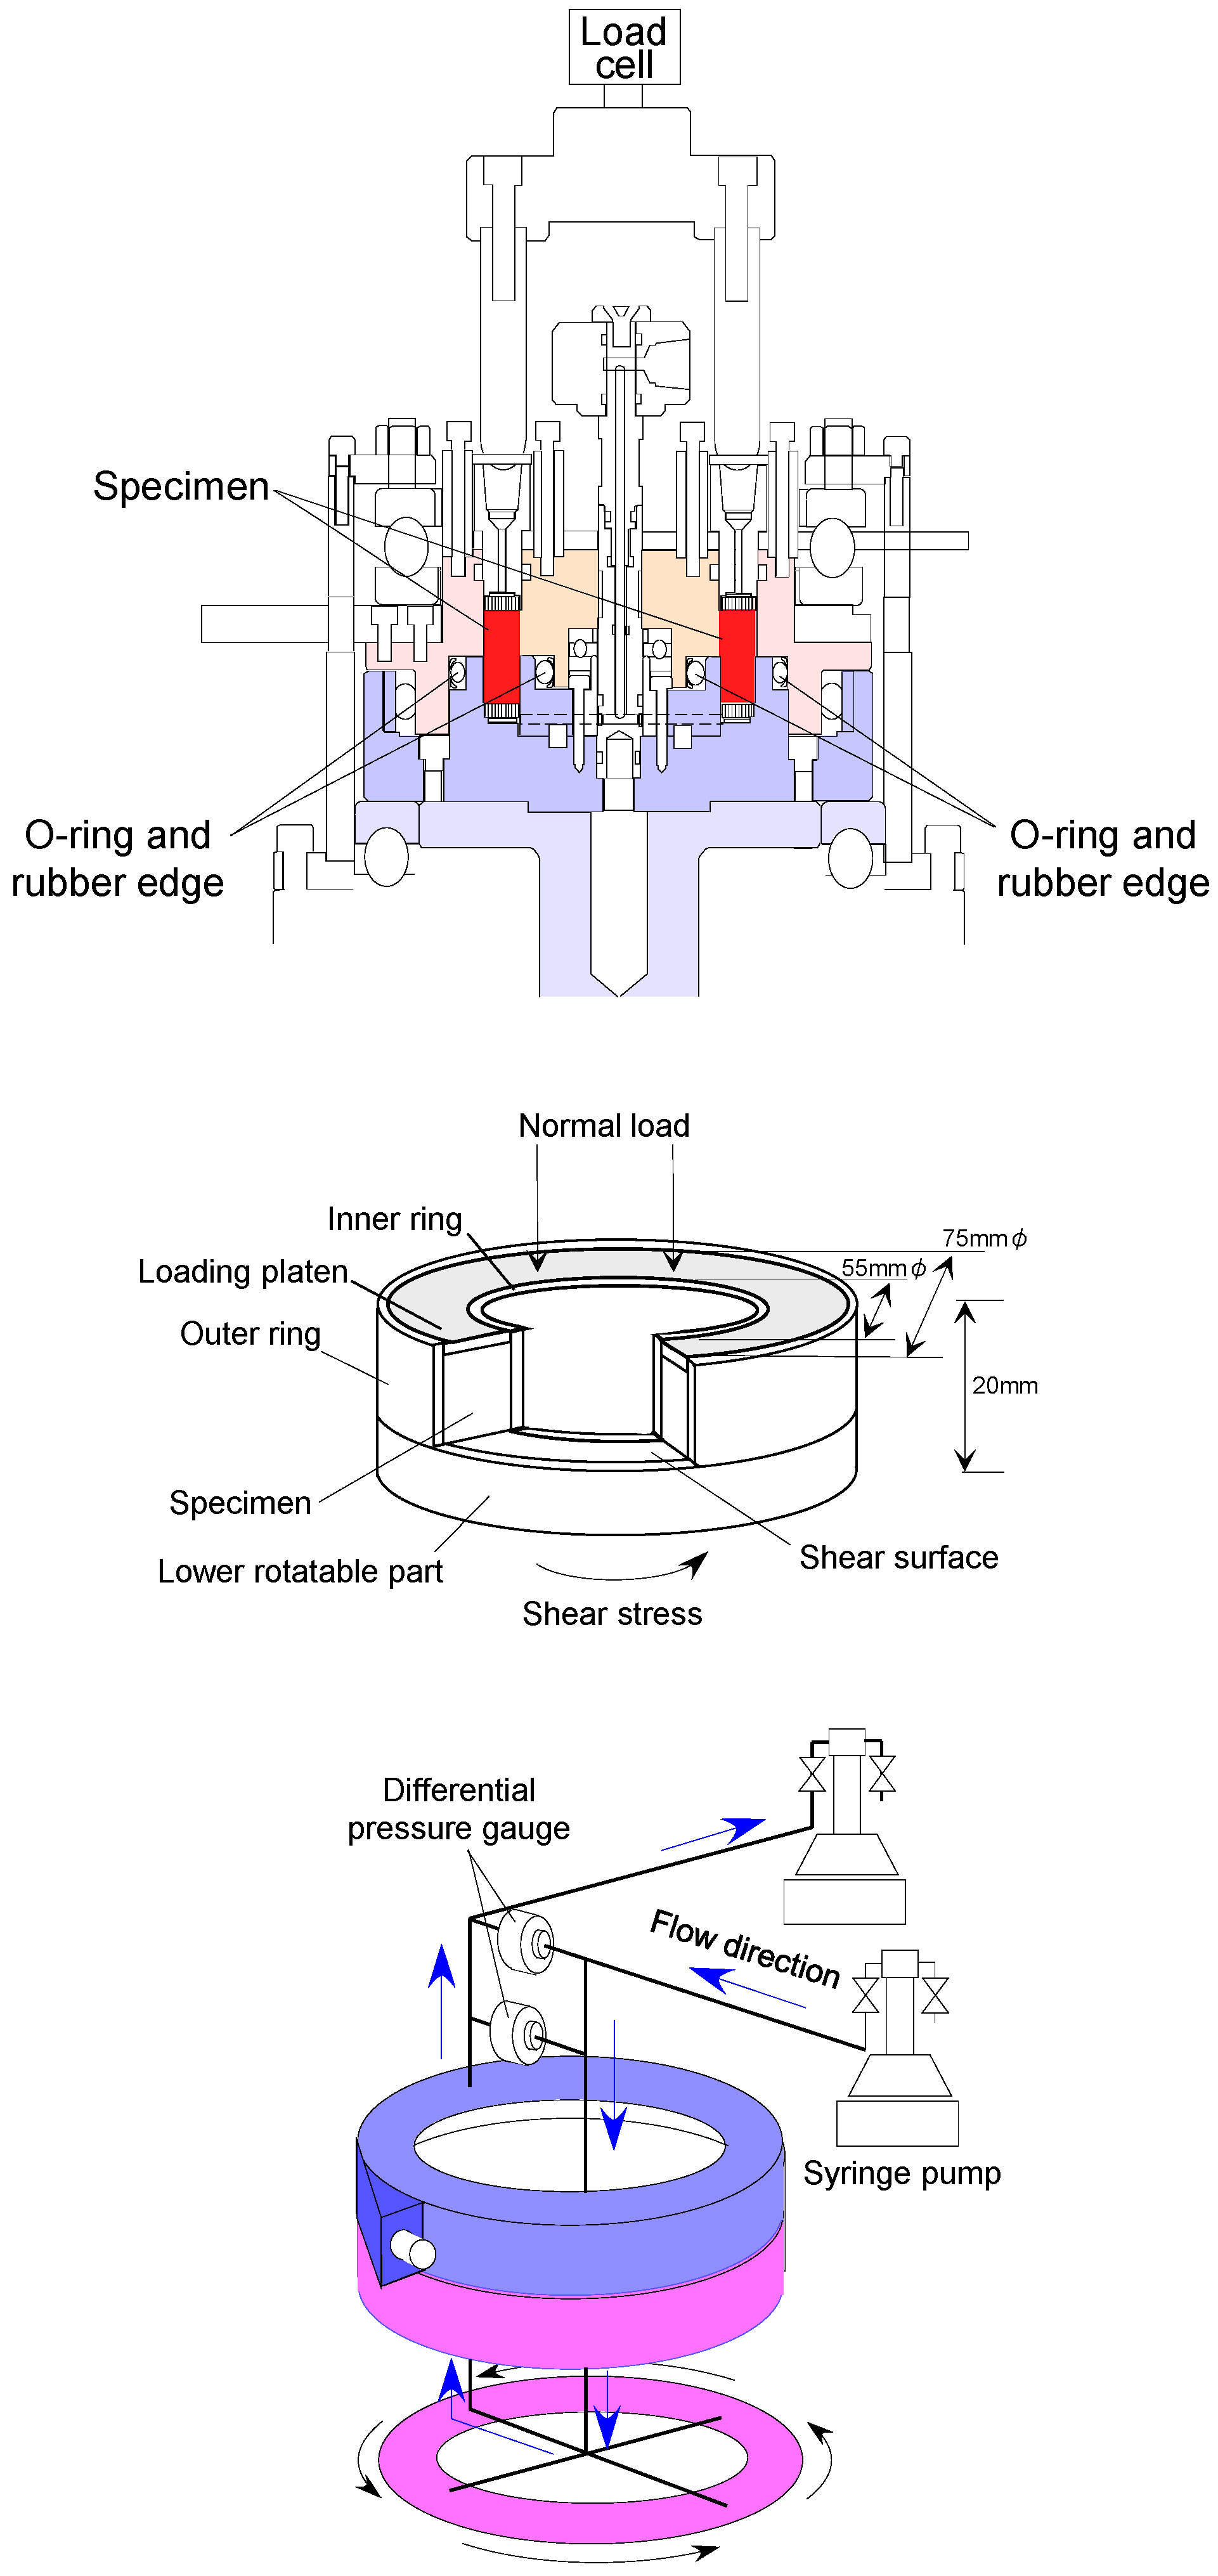
2.2. Ring-Shear Apparatus and Permeability Measurements

Permeability measurements were performed using an improved ring-shear apparatus (Jacom, Sapporo, Japan). A ring-shear test apparatus is commonly used in investigations of shear strength in the slip surfaces of landslides and fault zones because it can shear a specimen with a unidirectional rotational movement for unlimited relative displacement [10,16,18,19,21,22,23,24,28,29,30,31,32,33,34,35,36,37,38]. The ring-shear apparatus used in this study was improved at the National Institute of Advanced Industrial Science and Technology (AIST) in Japan. It allows shear testing in both drained and undrained conditions for permeability measurements [16].
Figure 4 shows a vertical cross-sectional view of the apparatus. The specimen is sheared by rotating the lower half of the shear box while the upper half remains stationary. The gap between the upper and lower halves of the confining rings is covered by O-rings and rubber edges in the inner and outer parts of the shear box to prevent water leakage from the gap and ensure the maintenance of undrained conditions for the shear and permeability experiments. A normal load is applied to the sample through a loading plate and is controlled by a pneumatic system. The torque is applied by an electronic servo motor system and is measured by a load cell in the constrained upper half of the confining ring. The application and maintenance of the shearing rate and data retrieval are computer-controlled. In this study, the measurement specifications of the ring-shear apparatus used are as follows: a maximum normal stress of approximately 10 MPa, a shearing rate range of approximately 0.2–1020 mm/min, and a simultaneous data acquisition system with a digital indicator and desktop computer. The accuracy ranges for the data acquisition are as follows: a normal stress of 0.0024 MPa, a shear stress of 0.0012 MPa, a vertical displacement of 0.0020 mm, and a differential pressure of 0.0067 kPa. Simple schematics of a specimen in the ring-shear apparatus and the permeability measurement system are shown in Figure 4. The specimen has outer and inner diameters of 75 and 55 mm, respectively. The final height of the specimen after initial compaction is variable but typically averages 20 mm in the ring-shear box. To measure the water permeability, distilled and deionized water is injected into the bottom of the specimen and drained from the top of the specimen by a precisely controlled syringe pump. The water flow rate can be varied in the range of 0.001–200 cm3/min. The pressure difference between the specimen inlet and outlet is measured by two differential pressure gauges with full ranges of 20 kPa and 1.0 MPa.
Figure 4. Schematics of the ring-shear apparatus, a specimen in the ring-shear apparatus, and the permeability measurement system.
Energies 08 07202 g004
Ring-shear experiments were conducted at room temperature under effective normal stresses of 0.5, 1.0, 2.0, 3.0, 5.0, and 8.0 MPa. The effective normal stress (σ′n) on the specimen is defined as the difference between the confining pressure and the pore fluid pressure. In this study, the back pressure on the specimen was maintained at 0.1 MPa by the air pump for all experiments. The dry sand sample was poured into an annular ring-shear box. The specimen was saturated with distilled and deionized water with a volume of at least five times that of the specimen. Then, the sand sample was vertically loaded with incremental increases in the effective normal stress until the desired pressure was achieved. The ring-shear tests were performed under a constant effective normal stress and drained conditions during shearing. A shearing rate of 2.0 mm/min was used. The shear displacement was approximately 2000 mm under various effective normal stresses to satisfy the requirement of achieving a sufficiently large displacement in the residual state throughout this study. The change in total porosity ϕ was determined by a vertical displacement at each testing.
Following Darcy’s law, measurements of permeability perpendicular to the experimental fault zone were conducted using the constant flow method controlled by the syringe pump, because the confining rings were not subject to confining pressure. To examine the permeability evolution of the specimen, the permeability k was measured in each testing stage. The testing stages were the phase after initial compaction (before shearing) and the phase after large-displacement shearing, which had permeabilities kic and kas, respectively. A single-stage test was performed for a single set of load, drained shear, and permeability values. After the shear testing, the sample was removed, and a new sample was moulded for the next test. In each test, the effective normal stress at each shear was the same as that under normal stress, yielding an overconsolidation ratio (OCR) value of 1.0.

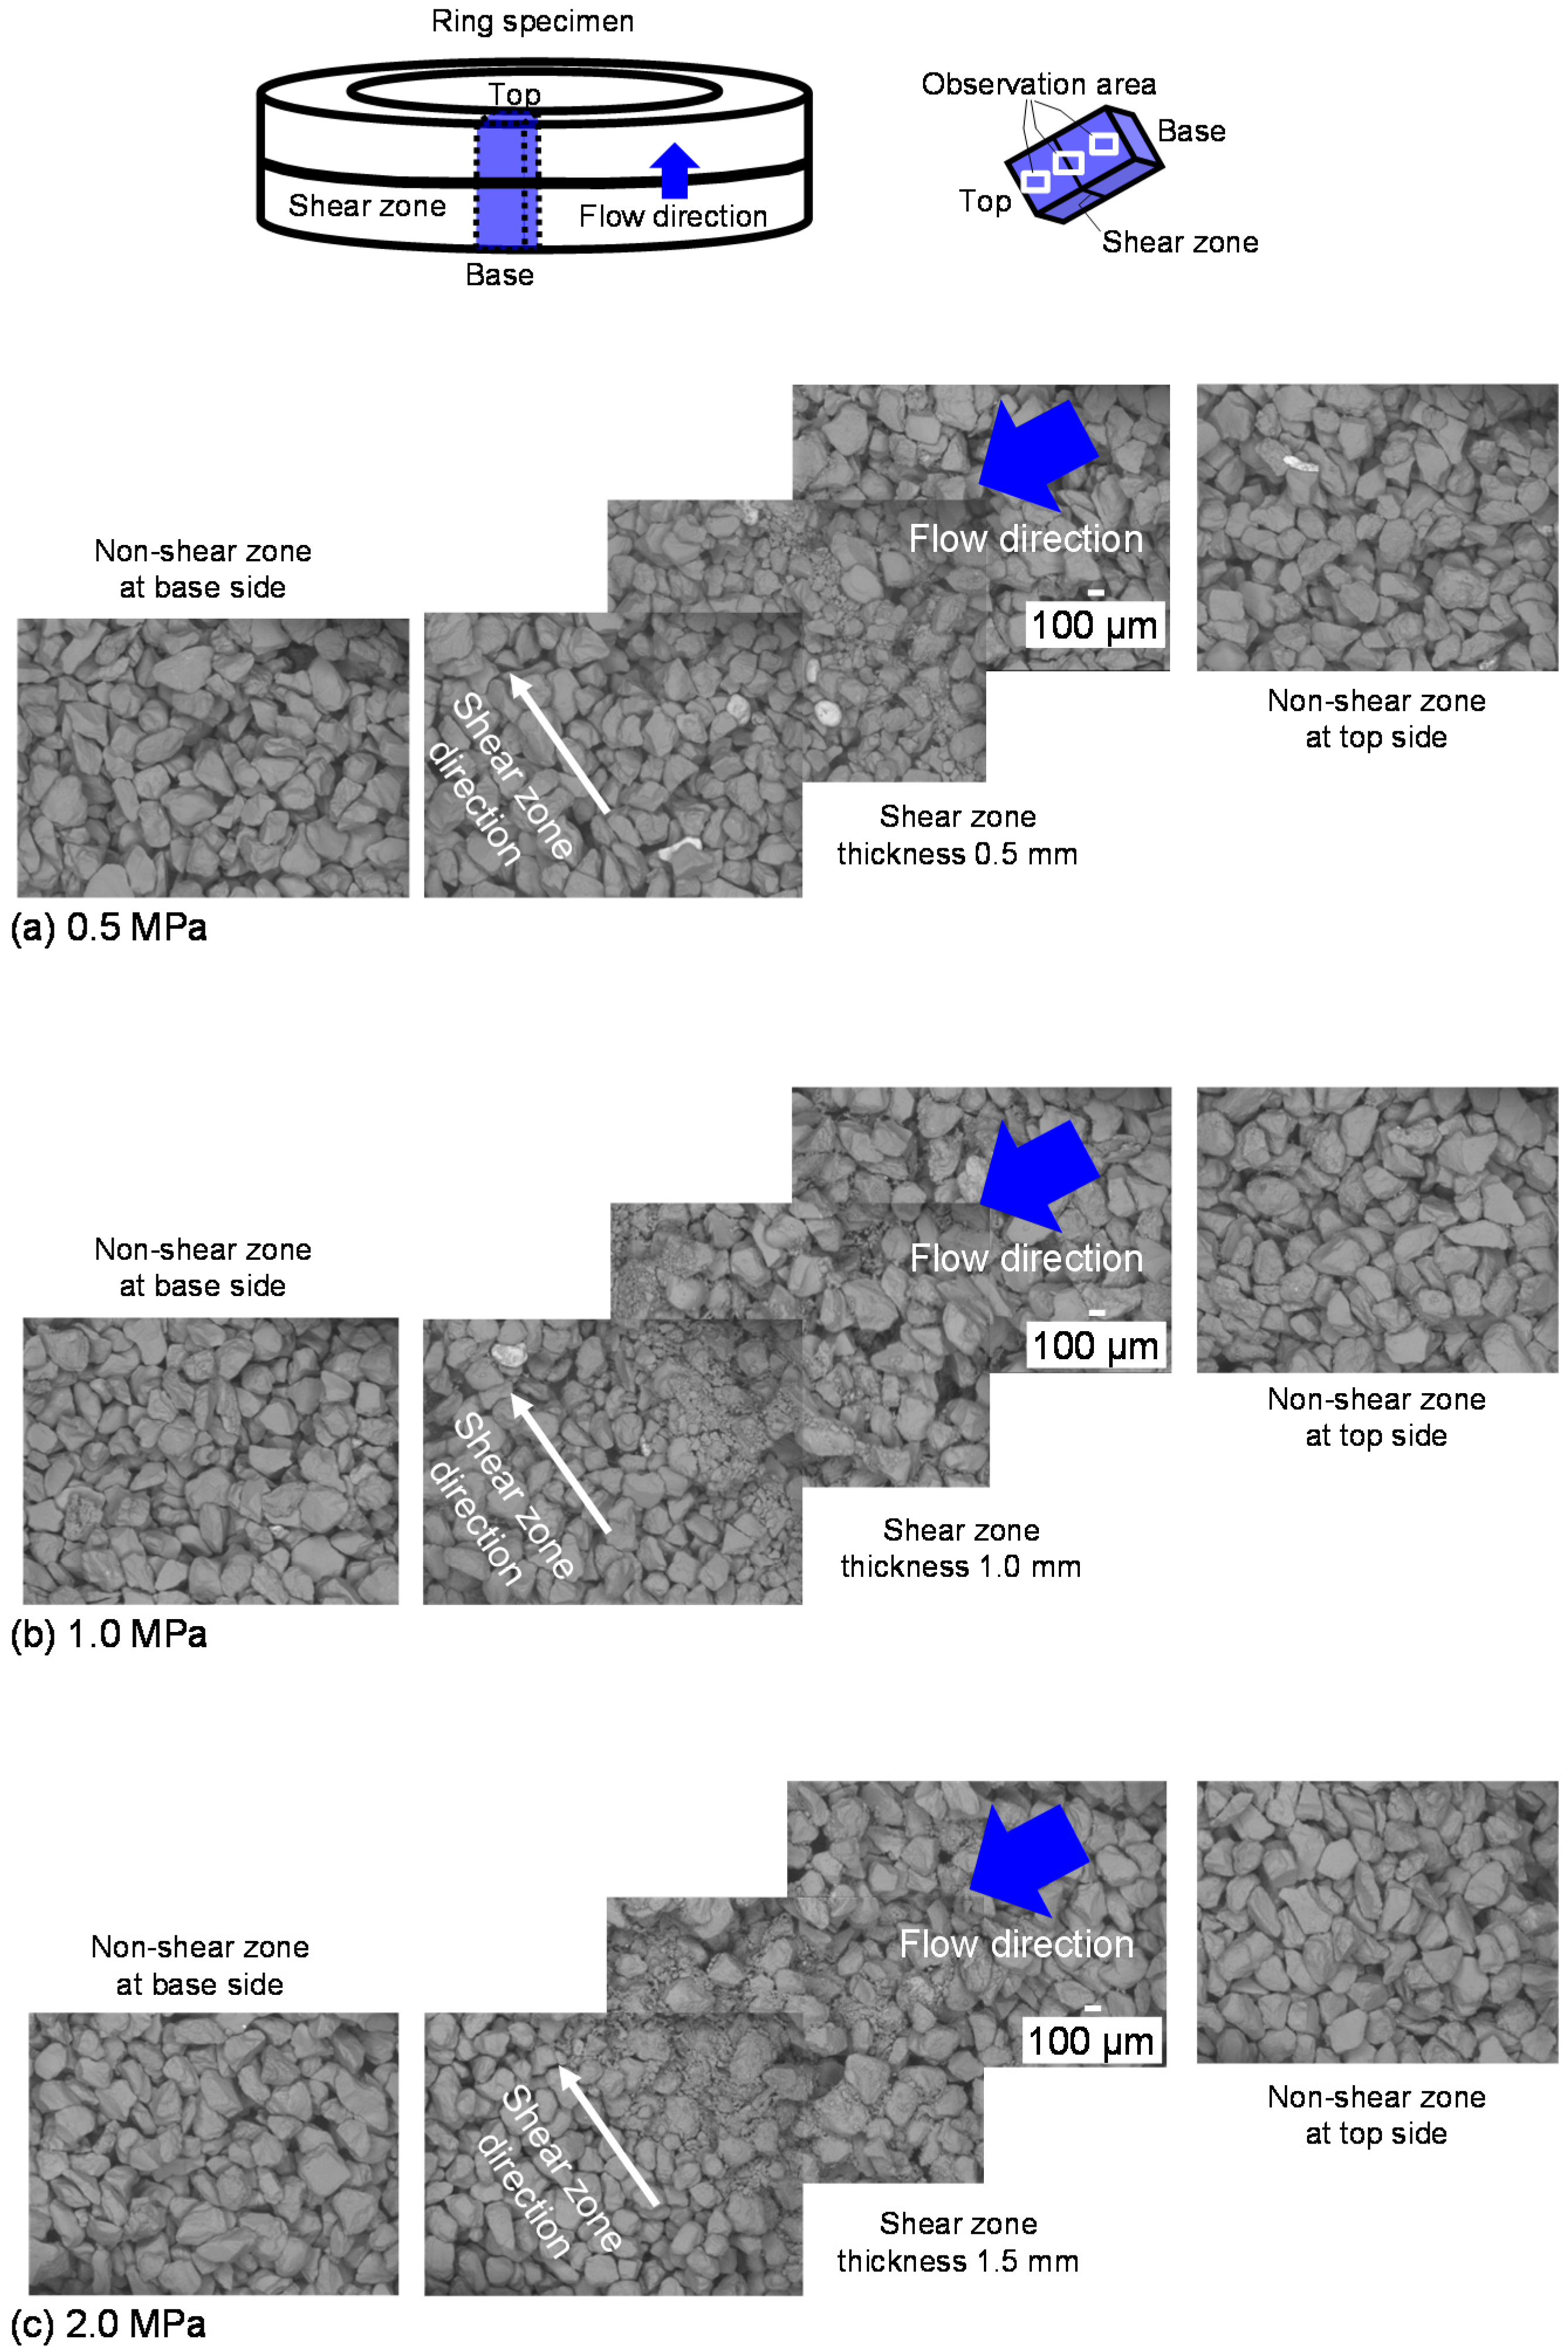
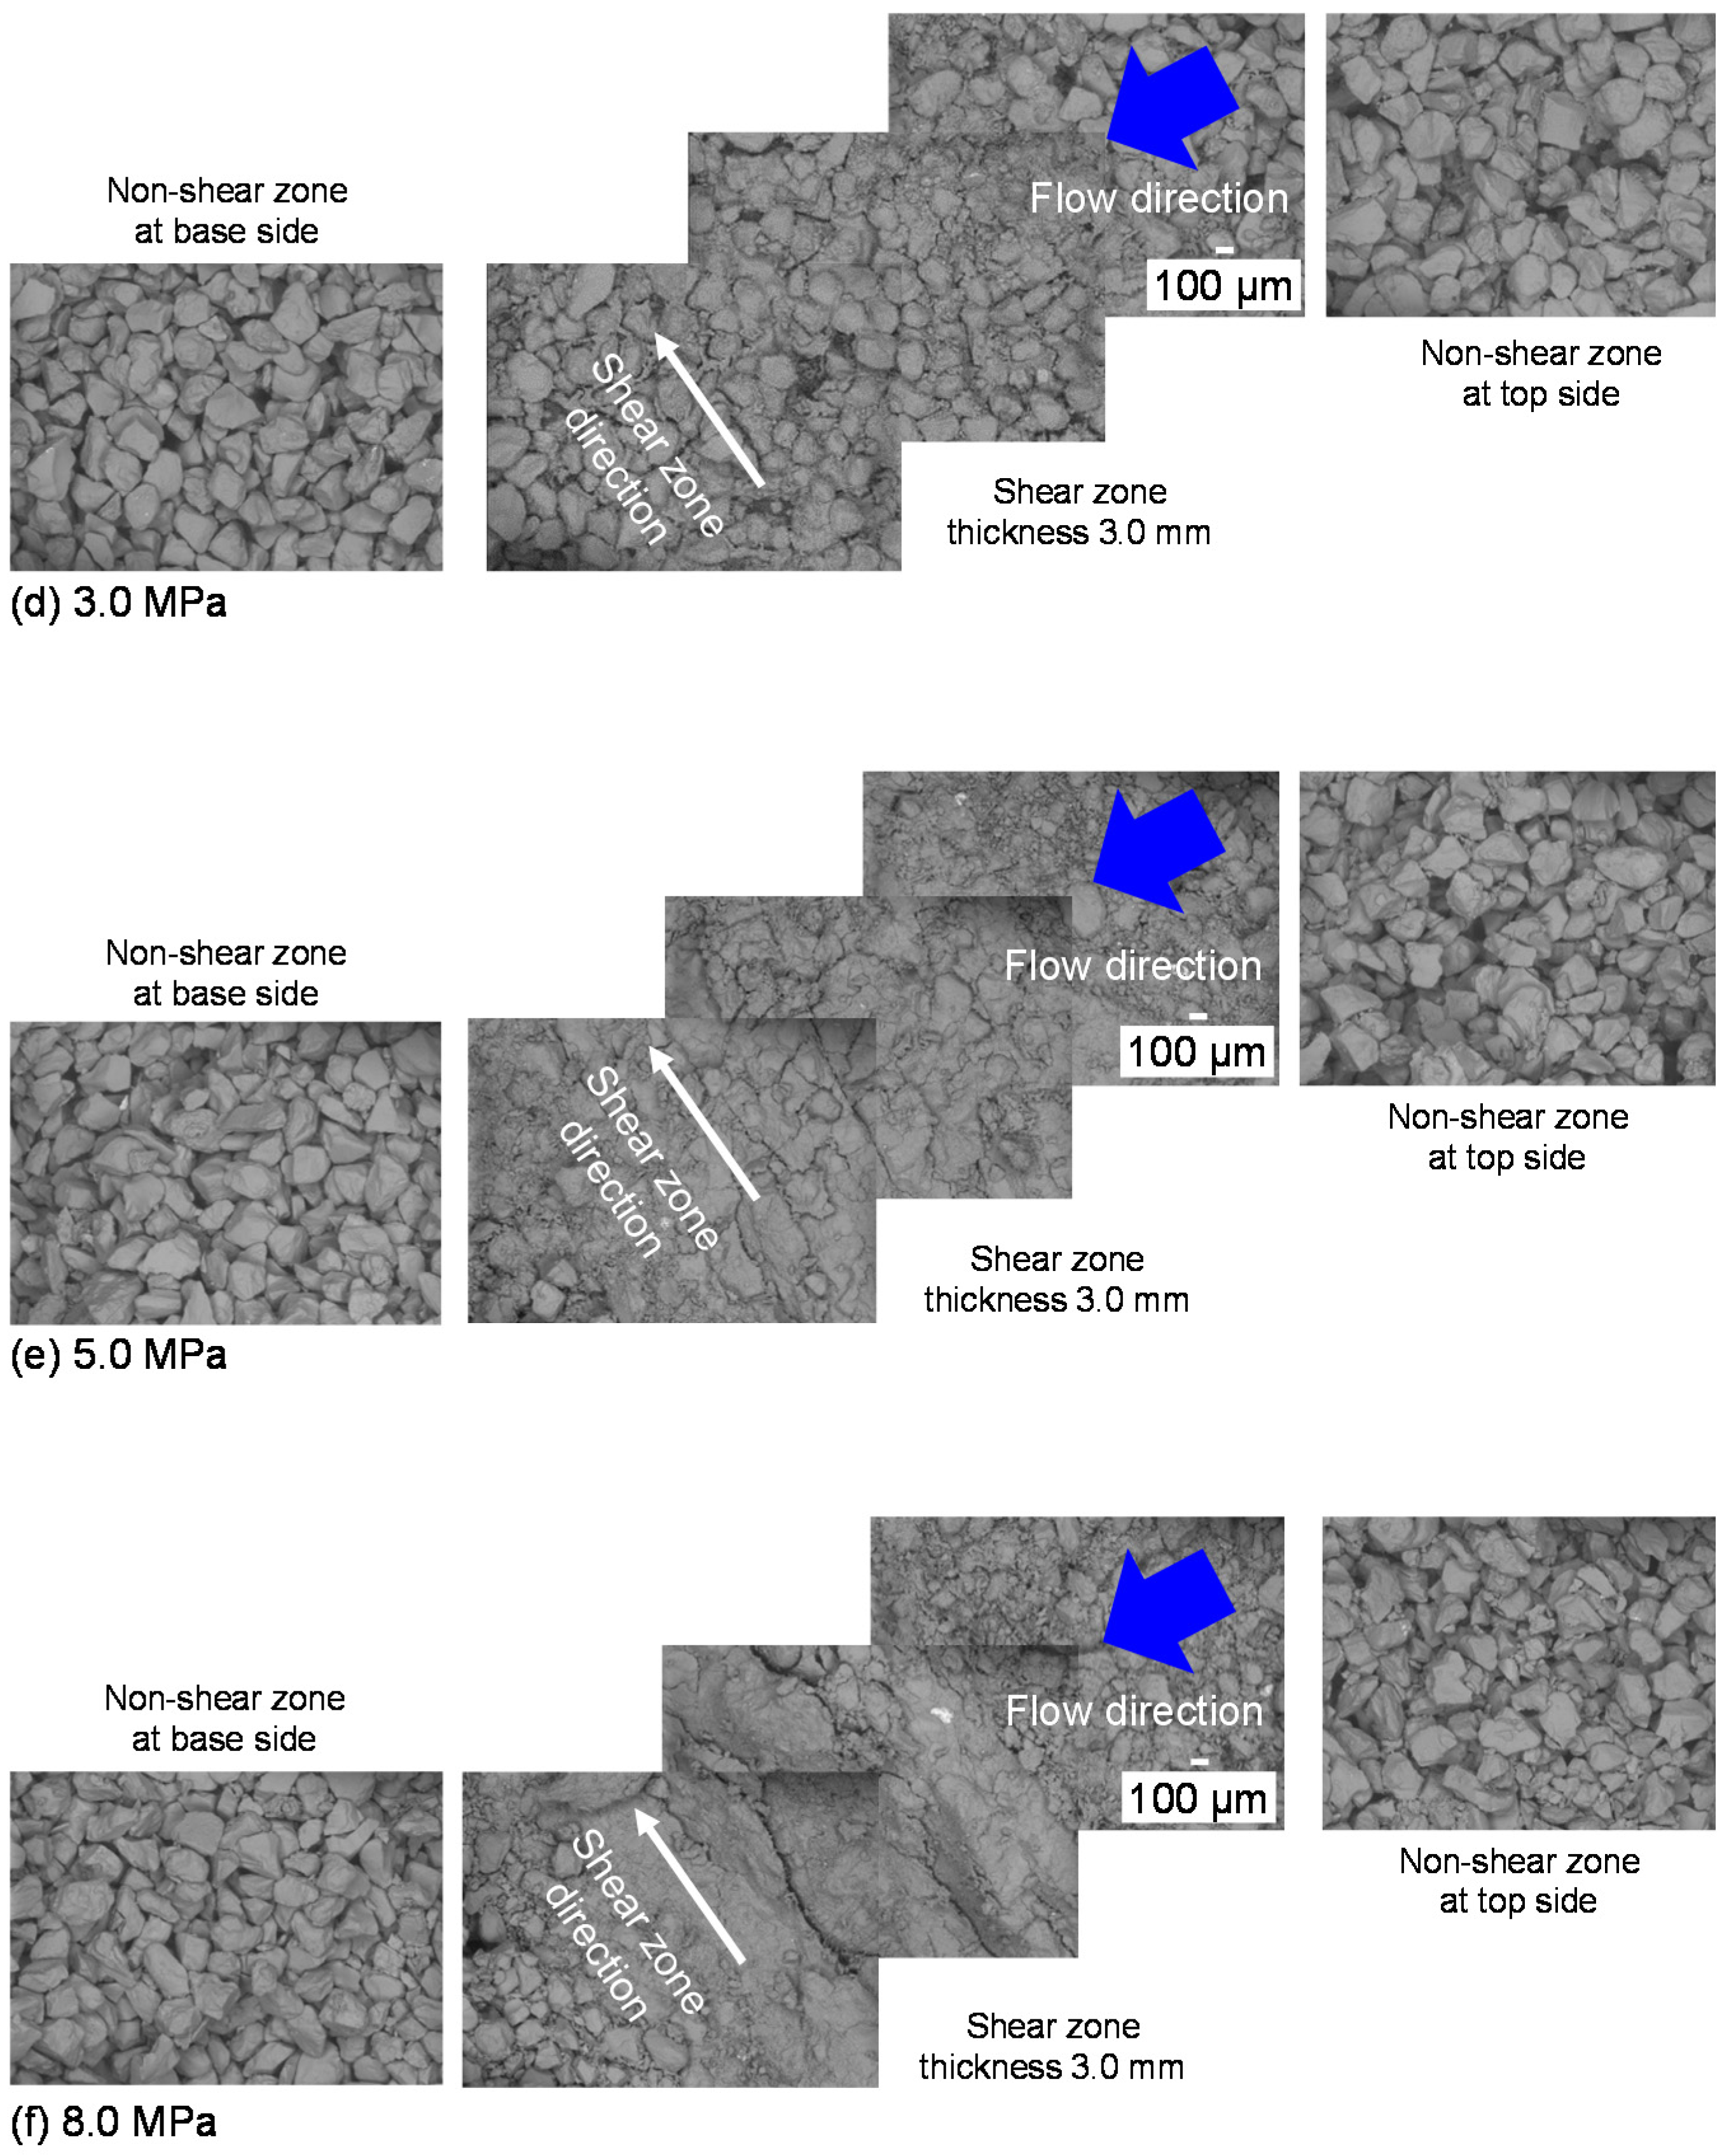
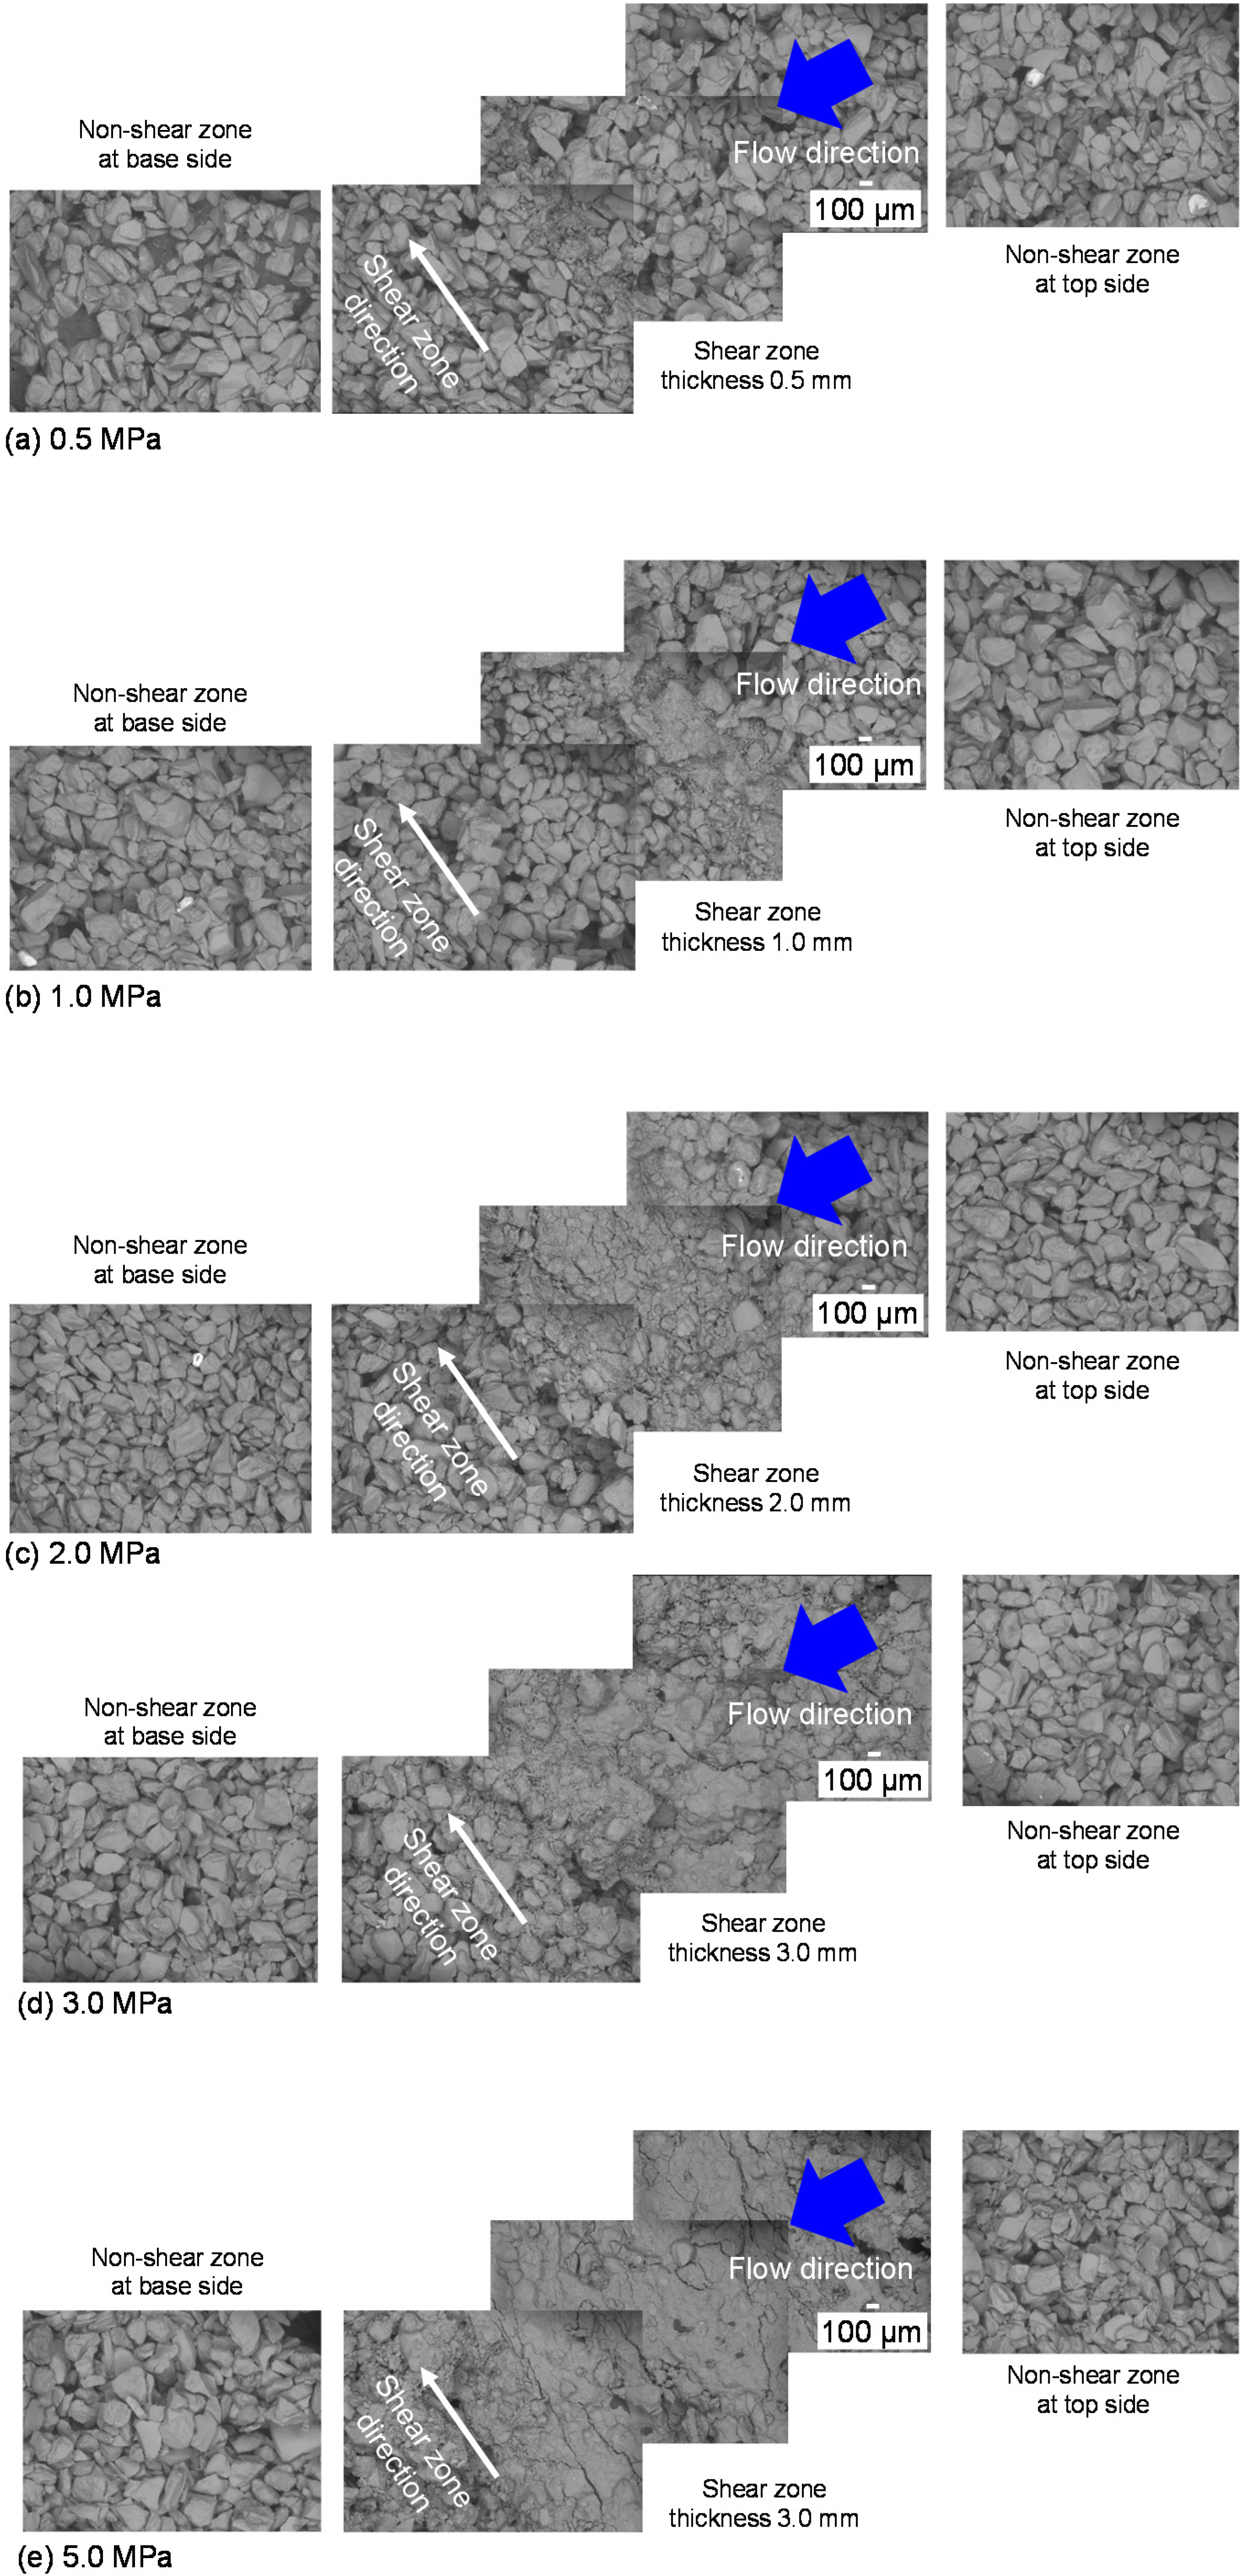
2.3. Analysis of Microstructure and Grain Size Distribution of Shear Zones

The specimens used in the analysis of the microstructure and grain size distribution were collected with a steel tube at the end of each experiment. The steel tube was pushed perpendicularly into the shear zone of the specimen without disturbance. The samples for the microstructure observation were halved lengthwise and frozen at −150 °C. The microstructures around the shear zones in the specimens after the tests were observed by field emission scanning electron microscopy (FE-SEM, JEOL JSM-7000F, Akishima, Japan). To maintain the sample structure, the observations were conducted at −193 °C in the freezing system of FE-SEM. The grain size distribution was determined using the laser diffraction method with a Nikkiso Microtrac MT3300EXII [39] (Tokyo, Japan). The shear zone samples for the grain size analysis were separated and air-dried at room temperature. Before the grain size analysis, a dry sample weighing approximately 0.1 g was placed into 50 cm3 of distilled and deionized water and then dispersed using ultrasonic vibration [40]. The results are expressed as volume percentages.

3. Results and Discussion

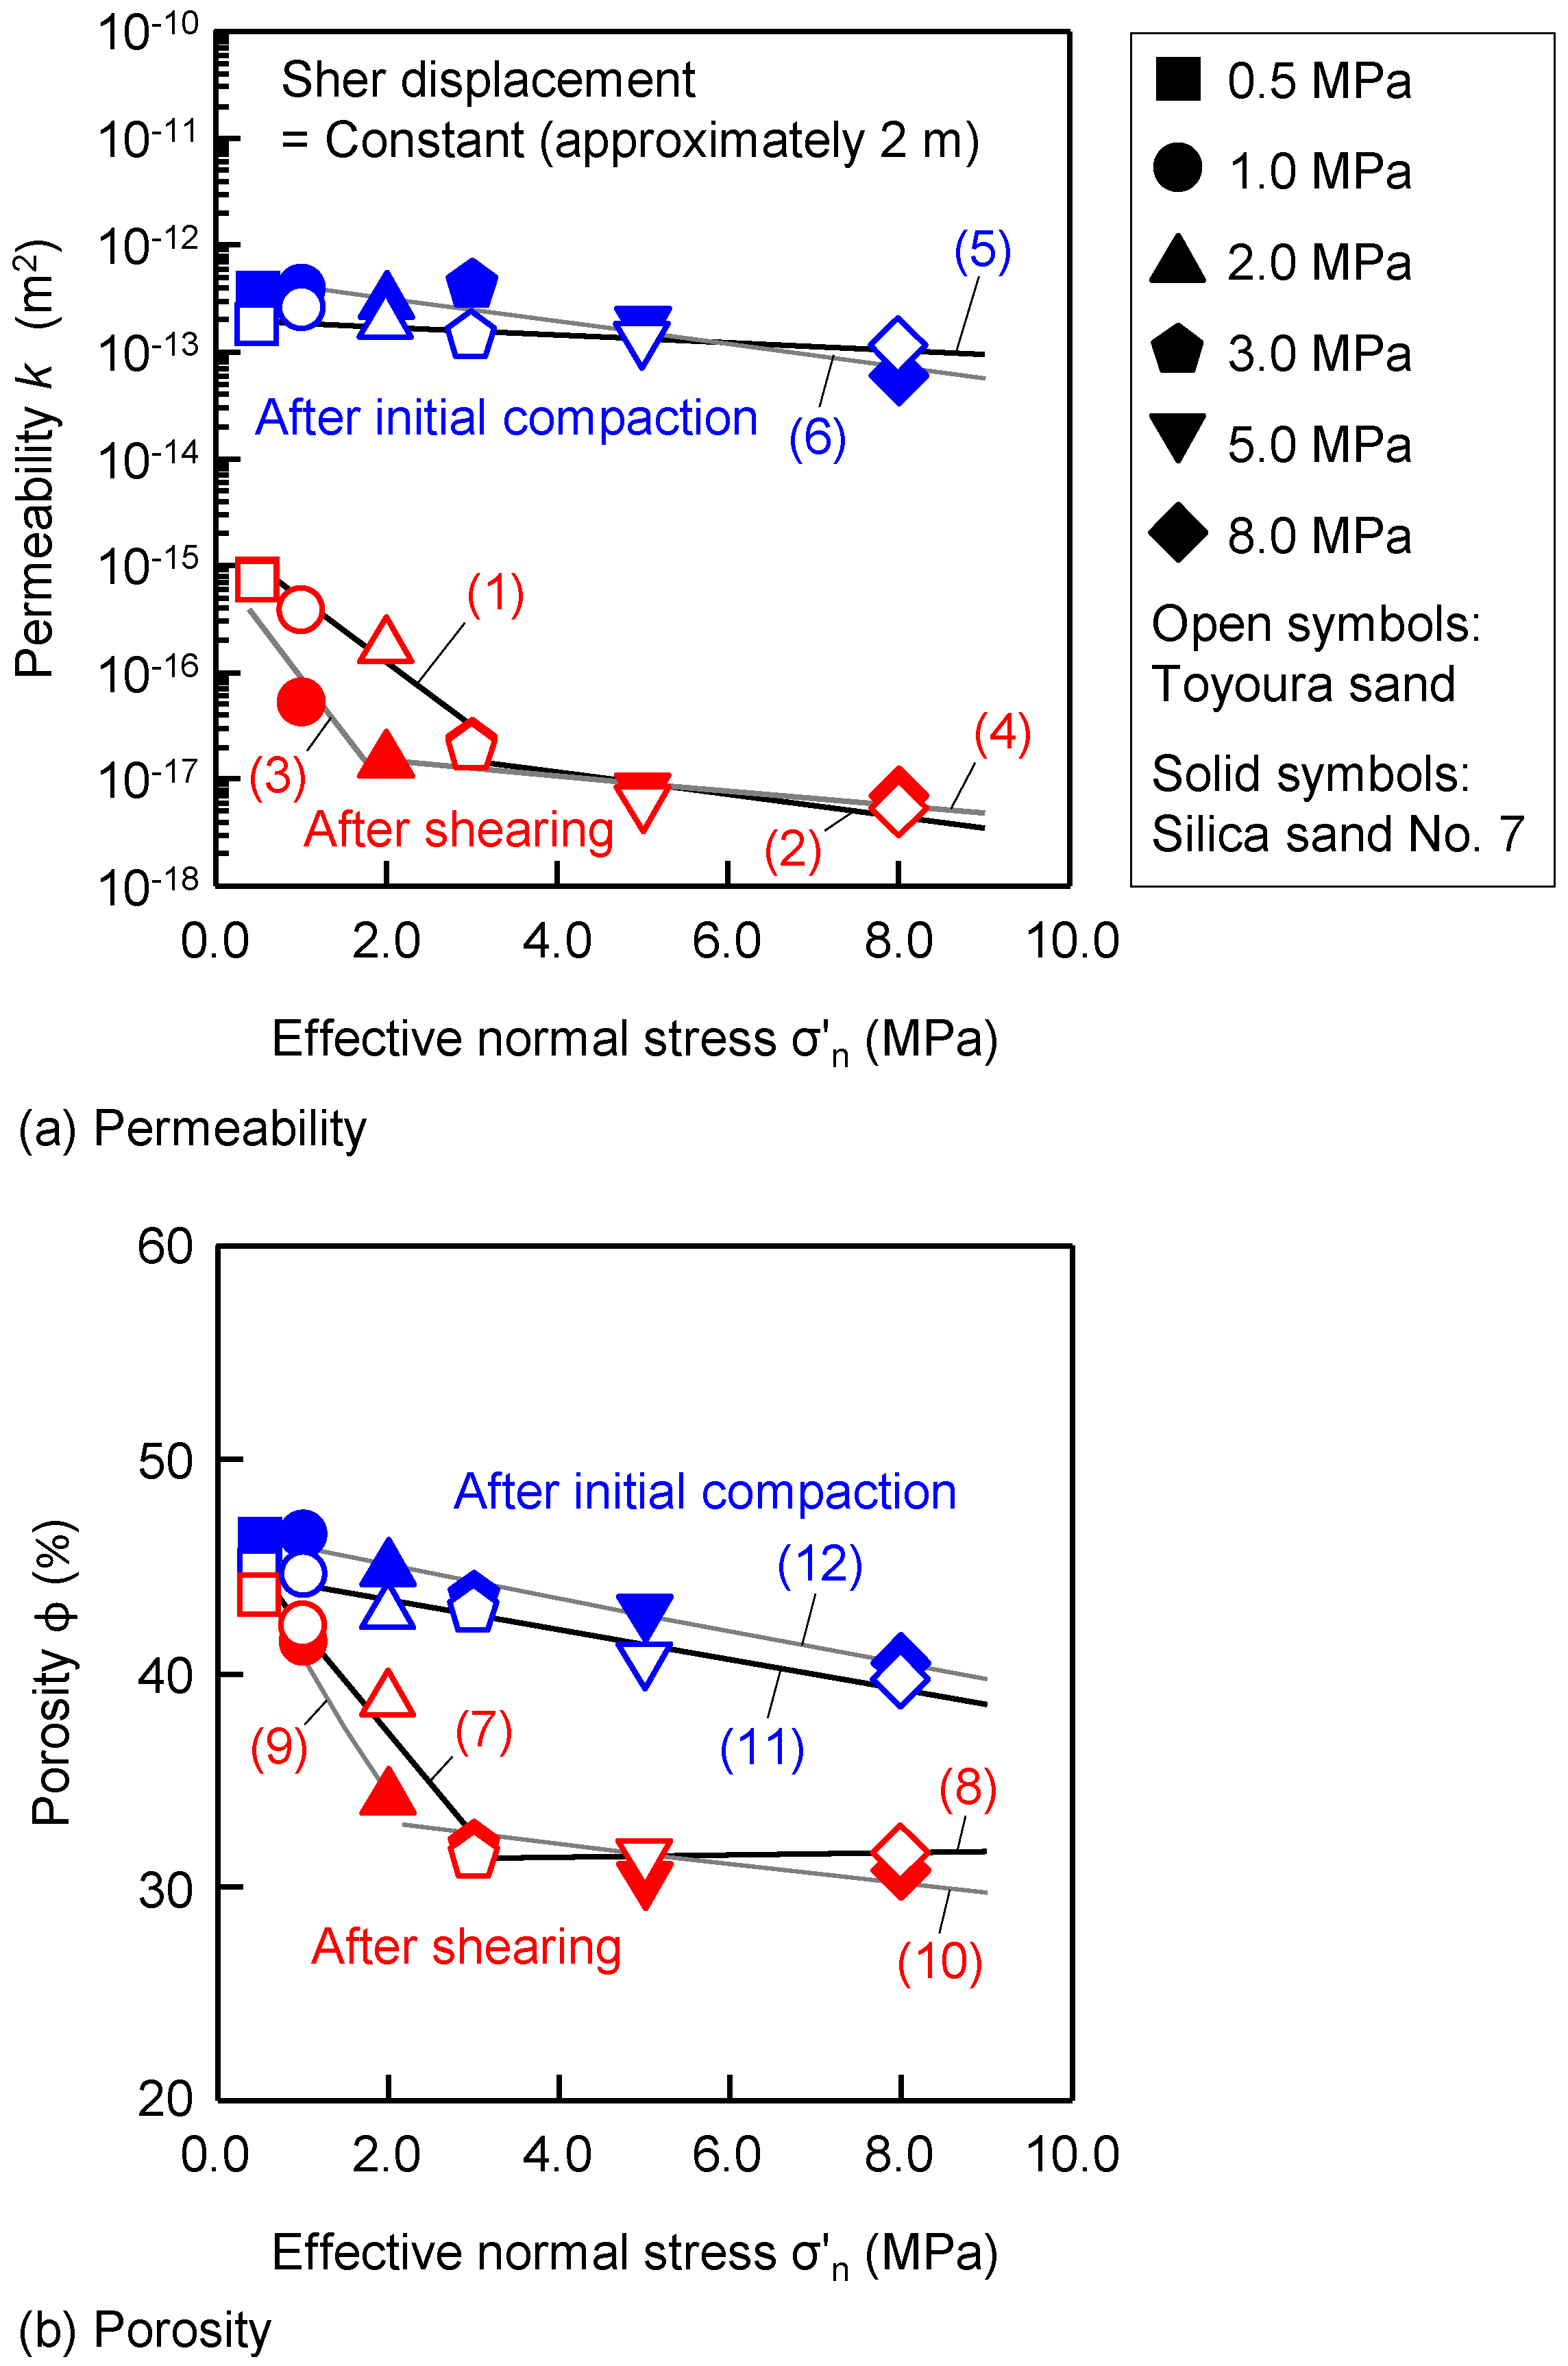
3.1. Permeability and Porosity Reduction versus Effective Normal Stress

Table 1 summarizes the results of the ring-shear tests for the fault permeability and porosity at each effective normal stress. For the calculation of permeabilities after initial compaction kic (m2) and after shearing kas (m2), the Equations are as follows:
k ic = q μ L A D P
k as = q μ L 1 A ( D P 1 D P 2 )
D P 2 = A k ic q μ L 2
where q is the flow rate (cm3/min) of the pore fluid, μ is the viscosity of the pore fluid, L is the length of the water flow (m), DP is the difference in pressure after initial compaction (Pa), and A is the cross-sectional area of the specimen (m2). The length of the water flow L1, which is related to the shear zone thickness (m), was determined in each experiment from FE-SEM observations, as discussed in Section 3.2. The length of the water flow L2, which is the non-shear zone in the specimen after shearing without any change in permeability, is of unchanging permeability before shearing (m). Furthermore, the length of the water flow L2 is obtained as the difference between the specimen and shear zone heights after the shear test. DP1 and DP2 are the different pressures (Pa) after shearing for the whole specimen and at the non-shear zone of the specimen, respectively. kic is the permeability measured after initial compaction (m2).
Table 1. Permeability and porosity after initial compaction and after shearing in sand samples.
Effective Normal Stress during Shearing (MPa)Permeability (m2)Porosity (%)Specimen Height (mm)
Initial CompactionAfter ShearingInitial CompactionAfter ShearingInitial CompactionAfter Shearing
σ′nkickasϕicϕasHicHas
Toyoura
0.51.80 × 10−137.21 × 10−1644.843.623.721.7
1.02.55 × 10−133.83 × 10−1644.442.222.419.8
2.03.64 × 10−131.70 × 10−1642.838.722.319.3
3.05.06 × 10−131.92 × 10−1742.931.421.518.5
5.03.42 × 10−136.15 × 10−1840.631.421.617.6
8.04.74 × 10−145.31 × 10−1839.731.623.319.5
Silica sand No. 7
0.53.51 × 10−137.38 × 10−1646.243.721.120.2
1.03.88 × 10−135.19 × 10−1746.541.521.319.4
2.02.83 × 10−131.42 × 10−1744.834.122.919.2
3.04.10 × 10−132.02 × 10−1743.531.822.418.5
5.01.82 × 10−137.73 × 10−1842.930.422.018.0
8.05.71 × 10−146.89 × 10−1840.530.821.218.2
Figure 5 shows the variation in permeability k (Figure 5a) and porosity ϕ (Figure 5b) after large-displacement ring-shearing and initial compaction plotted as functions of the effective normal stress σ′n for both sand samples. The average permeability and porosity before initial compaction were approximately 10−13 m2 and approximately 46%–47% in the both sands (Table 1 and Figure 5). The lowest permeability values in the experiments were approximately 10−18 m2 after ring-shearing at the high effective normal stresses of 5.0 and 8.0 MPa. In contrast, a lower permeability of 10−16 m2 was obtained at the low effective normal stress of 0.5 MPa. At midrange effective normal stresses of 1.0, 2.0, and 3.0 MPa, the permeability values after shearing ranged from 10−16 to 10−17 m2. The permeability after shearing was lower than that after initial compaction by a maximum of five orders of magnitude at high effective normal stresses. However, the difference between the permeabilities before and after shearing was not negligible at low effective normal stresses. For both sands, the stress dependency of the change in permeability after shearing is clearly visible within the tested effective normal stress. The decrease in the permeabilities of both sands after shearing with increasing effective normal stress changed from sharp to gradual. However, the difference in the stress dependency behaviors of the two sands was evident at effective normal stresses below 3.0 MPa (Figure 5a). The permeability after the shearing of silica sand No. 7 was lower than that of Toyoura sand by a maximum of one order of magnitude. The porosity after shearing at effective normal stresses in the range of 3.0–8.0 MPa was less than approximately 35%, whereas its value at effective normal stresses of 0.5 and 1.0 MPa, respectively, was greater than approximately 40%. The porosity after shearing of Toyoura sand and silica sand No. 7 sharply decreased with increasing effective normal stresses up to 3.0 and 2.0 MPa, respectively. With increasing effective normal stress up to 3.0 MPa, the reduction in the porosity after the shearing of Toyoura sand was more gradual than that of silica sand No. 7. However, with further increases in effective normal stress, the porosity of both sands gradually reduced. The abrupt changes in permeability at 2.0 and 3.0 MPa for the two sands are causally related to the sharp decrease in porosity at 2.0 and 3.0 MPa. The porosity reduction mainly reflects the formation of the shear zone structure because of large-displacement shear under effective normal stress. Figure 5 indicates that the permeability and porosity for the tested sand samples were considerably reduced at 2.0 or 3.0 MPa. In contrast, the permeability after initial compaction of both samples decreased with increasing effective normal stress, and differences between the behaviors of the samples were unclear. Furthermore, although the results of particle shape and grain size distribution in both sands showed that their properties are similar (Figure 1 and Figure 2), different permeabilities after shearing were observed at the moderate effective normal stresses of 1.0 and 2.0 MPa. Therefore, the properties of the difference between the sand samples were reported in the results of X-ray diffraction analysis (Figure 3). The peak of feldspar, which is clear despite reflecting a minor amount, was visible for silica sand No. 7. The existing literature has reported that the permeability of granitic soil samples that contain feldspar after ring-shearing is relatively lower, and particle breakage in such samples is comparatively higher than that in quartz samples at 0.5 MPa [15] and is in the range of 25–100 MPa [13].
Figure 5. Variation in (a) permeability and (b) porosity with respect to effective normal stress for Toyoura sand (open symbols) and silica sand No. 7 (solid symbols). Numbers in parentheses indicate the correlations listed in Table 2.
Energies 08 07202 g005
Data points were considered to form two distinct groups, and regressions were performed. The correlations between the permeability after shearing and the effective normal stress during shearing can be expressed by exponential relationships with boundaries at effective normal stresses of 2.0 or 3.0 MPa, depending on sand type. The Correlations are given in Table 2, and numbers in parentheses in Figure 5 correspond to the numbers of these correlations. In Figure 5 and Table 2, the corresponding correlations for Toyoura sand and silica sand No. 7 can be found in Correlations (1), (2), (5), (7), (8), and (11) and Correlations (3), (4), (6), (9), (10), and (12), respectively. Figure 5a and Table 2 show the relationship between the permeability and effective normal stress. The statistical fits r of Correlations (1) and (2) to the permeability after shearing of Toyoura sand were 0.976 and 0.861 for effective normal stresses lesser and greater than 3.0 MPa, respectively. The boundary between Correlations (1) and (2) is defined by the effective normal stress of 3.0 MPa. In contrast, for silica sand No. 7, the statistical fits r of Correlations (3) and (4) to the permeability after shearing were 0.926 and 0.832 for effective normal stresses lesser and greater than 2.0 MPa, respectively. The regressions for permeability after initial compaction throughout the tested effective normal stresses for Toyoura sand and silica sand No. 7 are presented in Correlations (5) and (6) and have fits of r = 0.825 and r = 0.921, respectively. Figure 5b and Table 2 exhibit the relationship between the porosity and effective normal stress. The statistical fits r of Correlations (7) and (8) to the porosity after shearing of Toyoura sand were 0.969 and 0.993 for effective normal stresses lesser and greater than 3.0 MPa, respectively. The statistical fits r of Correlations (9) and (10) to the porosity after shearing of silica sand No. 7 were 0.991 and 0.758 for effective normal stresses lesser and greater than 2.0 MPa, respectively. Each regression presenting the porosity after initial compaction as a function of effective normal stresses for Toyoura sand and silica sand No. 7 was exhibited in Correlations (11) and (12) with r = 0.967 and r = 0.981, respectively.
Table 2. Correlations and statistical fits obtained from various correlations in Figure 5.
No.CorrelationsStatistical FitSample *Remarks
rT or No. 7
1kas = 2.0 × 10⁻¹⁵ × exp (−1.3915 × σ′n)0.976Tkas, σ′n < 3.0 MPa
2kas = 3.0 × 10⁻¹⁷ × exp (−0.2408 × σ′n)0.861Tkas, σ′n > 3.0 MPa
3kas = 1.0 × 10⁻¹⁵ × exp (−2.4430 × σ′n)0.926No. 7kas, σ′n < 2.0 MPa
4kas = 2.0 × 10⁻¹⁷ × exp (−0.1602 × σ′n)0.832No. 7kas, σ′n > 2.0 MPa
5kic = 2.0 × 10⁻¹³ × exp (−0.0839 × σ′n)0.825Tkic, σ′n = 0.5–8.0 MPa
6kic = 5.0 × 10⁻¹³ × exp (−0.2450 × σ′n)0.921No. 7kic, σ′n = 0.5–8.0 MPa
7ϕas = 47.7362 × exp (−0.1297 × σ′n)0.969Tϕas, σ′n < 3.0 MPa
8ϕas = 31.2473 × exp (0.0012 × σ′n)0.993Tϕas, σ′n > 3.0 MPa
9ϕas = 48.2113 × exp (−0.1696 × σ′n)0.991No. 7ϕas, σ′n < 2.0 MPa
10ϕas = 33.9440 × exp (−0.0149 × σ′n)0.758No. 7ϕas, σ′n > 2.0 MPa
11ϕic = 44.9012 × exp (−0.0168 × σ′n)0.967Tϕic, σ′n = 0.5–8.0 MPa
12ϕic = 46.6999 × exp (−0.0181 × σ′n)0.981No. 7ϕic, σ′n = 0.5–8.0 MPa
* T: Toyoura sand, No. 7: Silica sand No. 7.

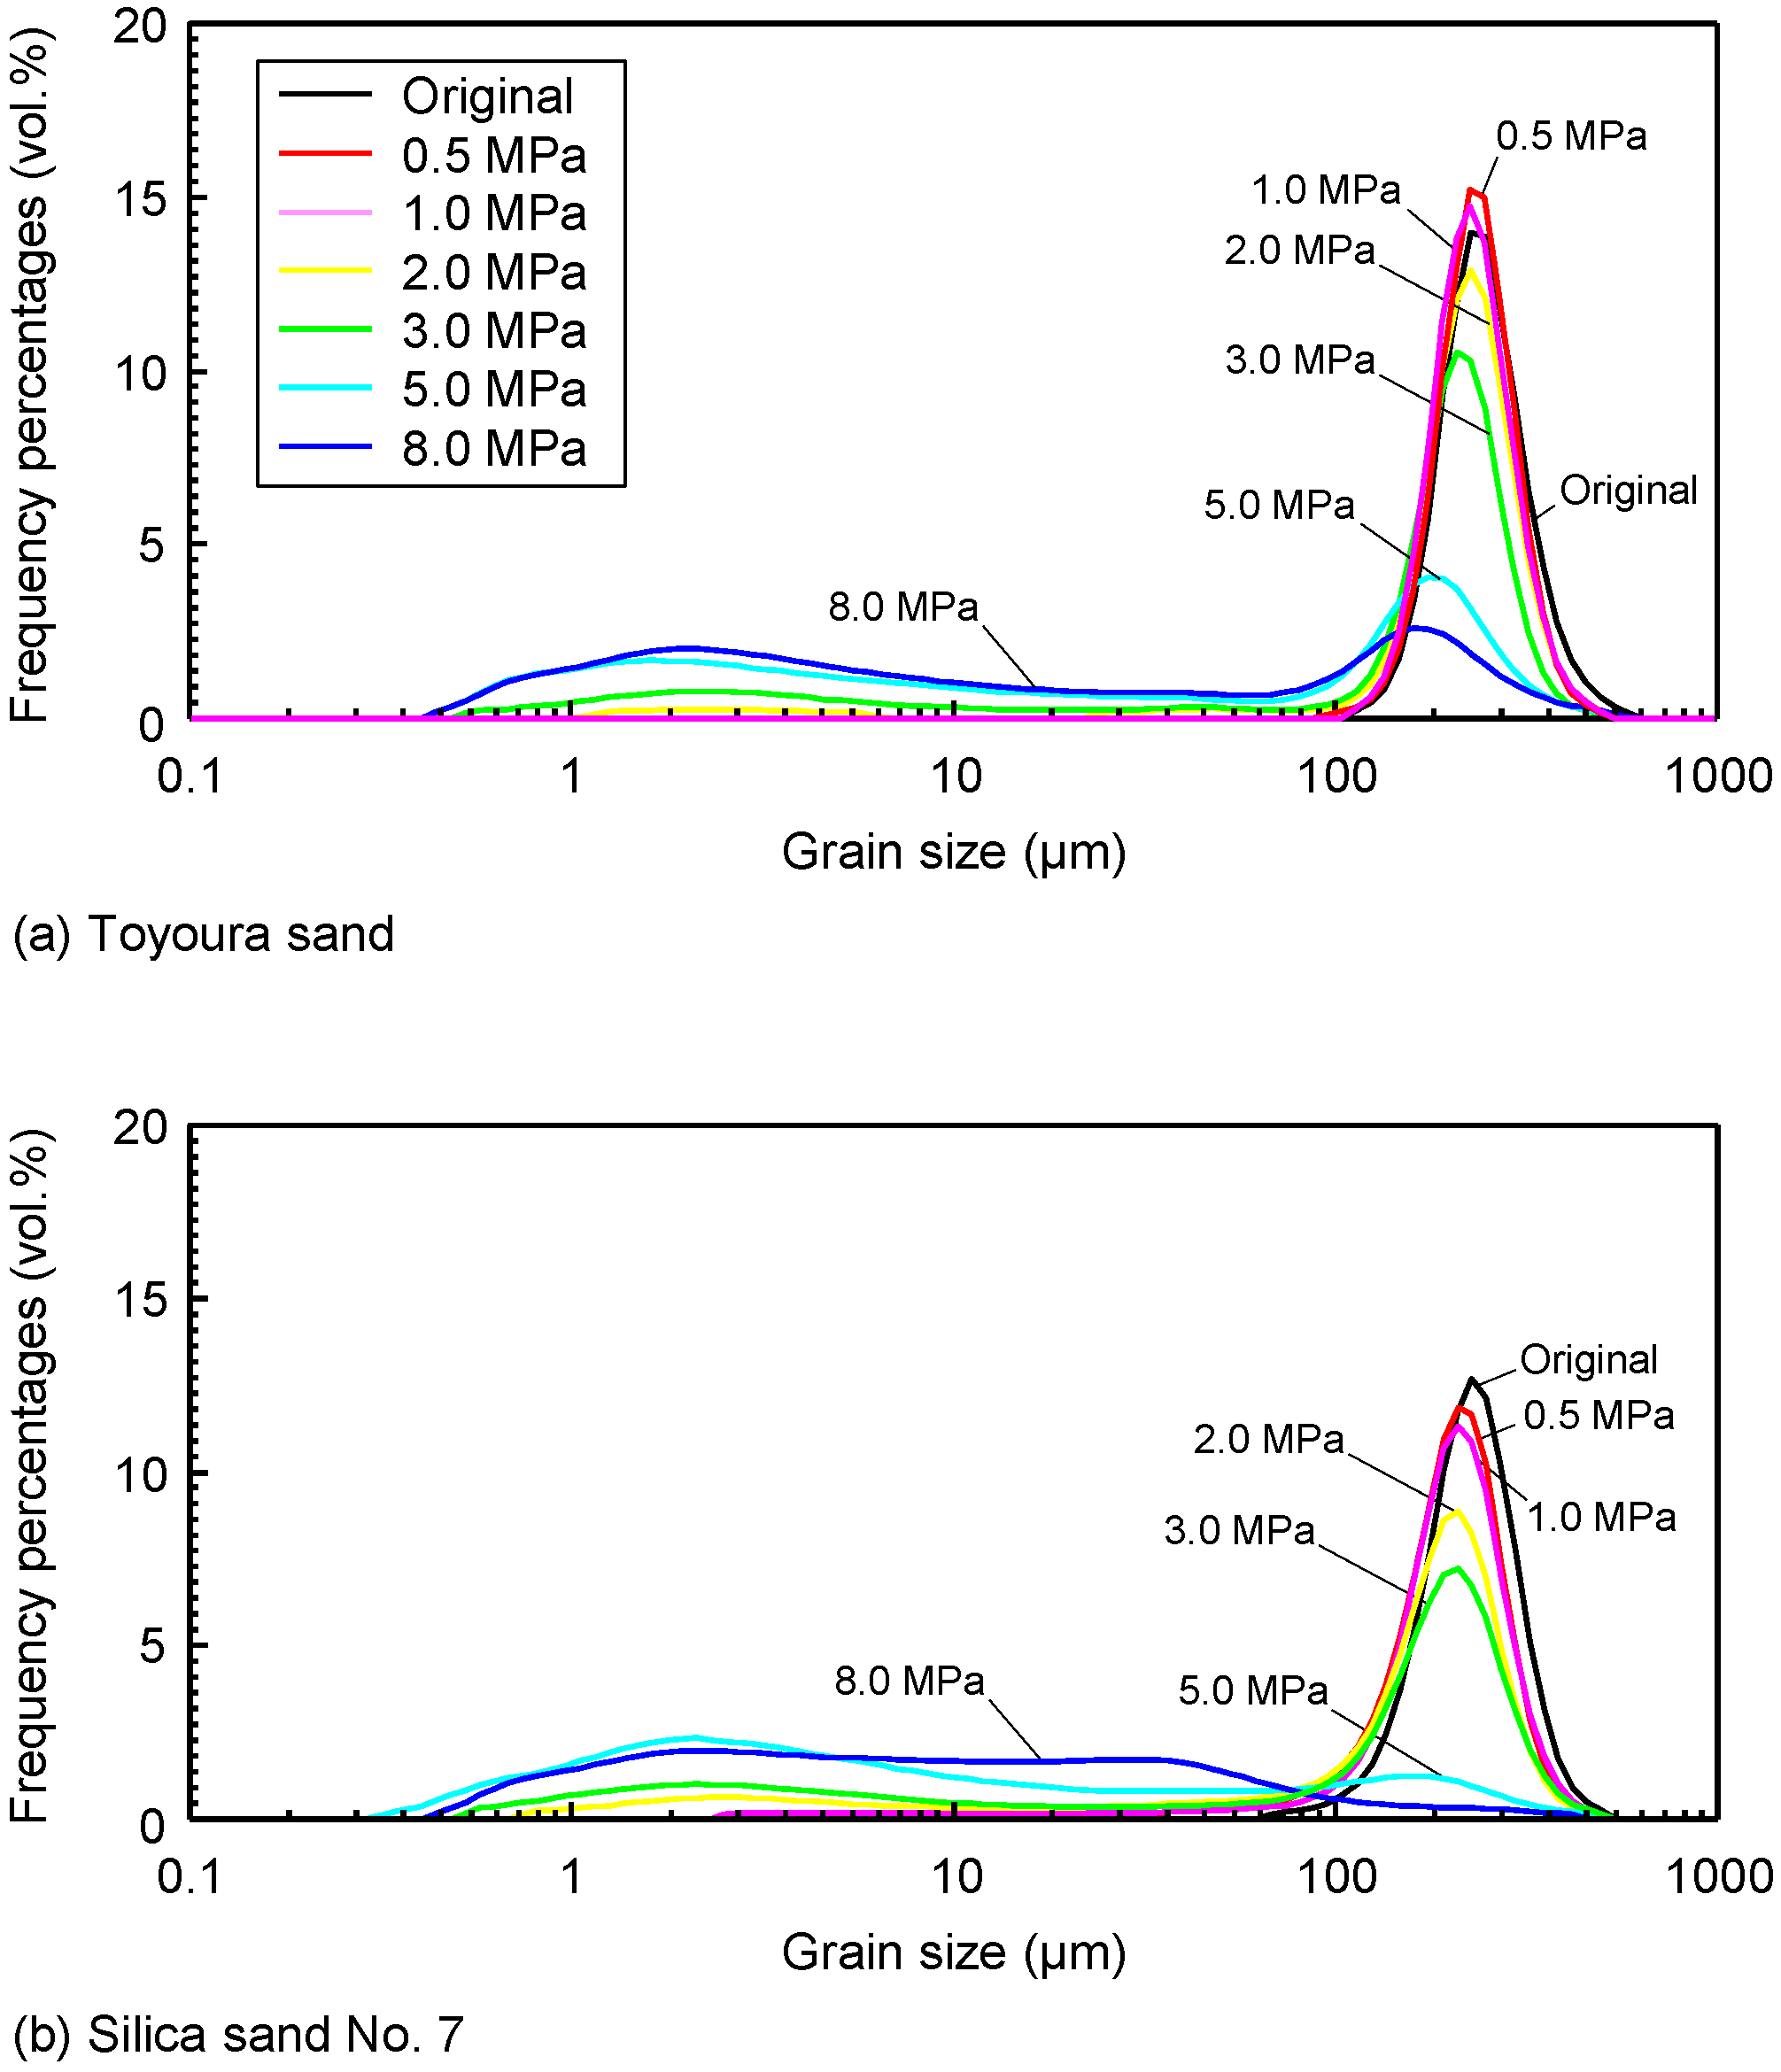
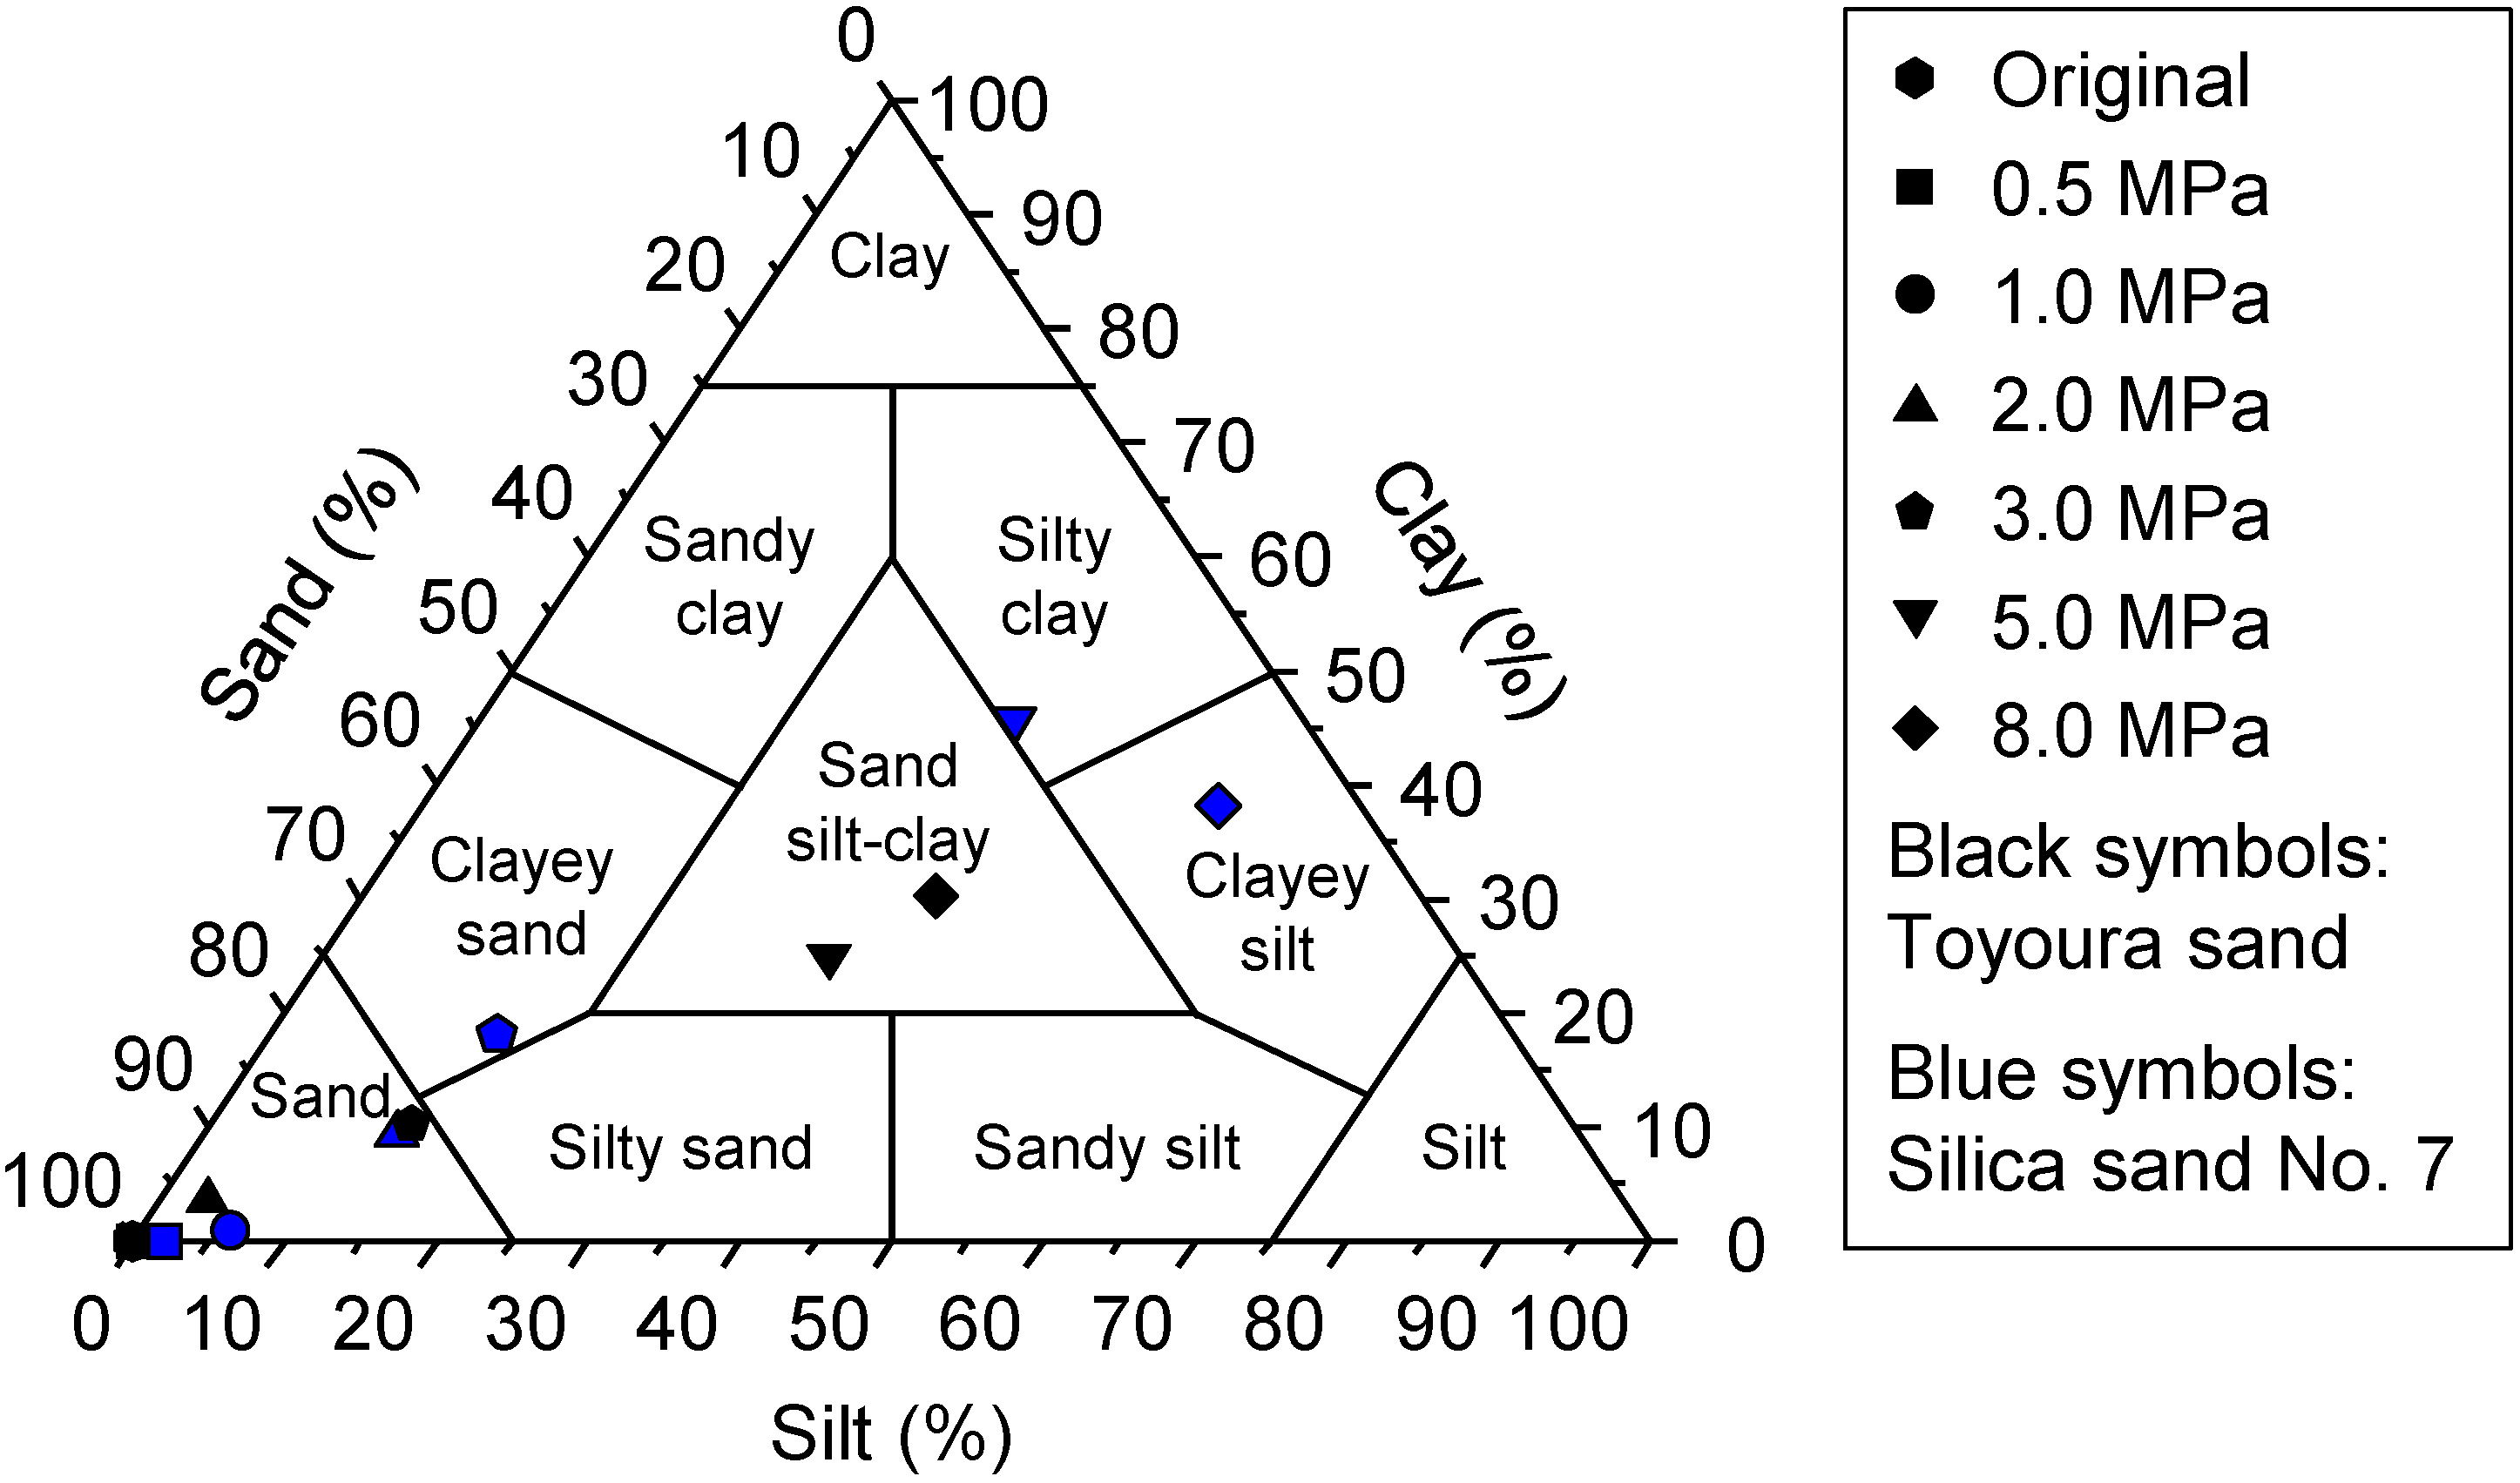
3.2. Microstructure and Grain Size Distribution of Shear Zones

To investigate the microstructure of the shear zones in the specimens after ring-shearing under each effective normal stress, an imaging method (FE-SEM) was used to observe the microstructures around the shear zone. Figure 6 and Figure 7 show the FE-SEM images of the shear zones for halved samples within the selected effective normal stress range. The local changes in the conditions of the shear zones were observed in the collected samples. The shear zone thickness was determined by the microstructure in each sheared sample and was considered to be causally related to the permeability reduction after shearing for all tested values of effective normal stress. The shear zone thickness was 0.5–3.0 mm (Figure 6 and Figure 7). The shear zone thickness varied with effective normal stress. Furthermore, the morphology within the shear zone varied with effective normal stress during shearing. Grain size reduction and compaction in the shear zone due to grain crushing were observed more clearly with increasing effective normal stress. Grain crushing in both samples was apparent at the high effective normal stresses of 5.0 and 8.0 MPa. Furthermore, the principal shear plane in the shear zone at 8.0 MPa, which was horizontal, could be discerned in both sands. The grain sizes at effective normal stresses of 1.0 and 2.0 MPa were moderately reduced. Slight particle breakage and a thin shear zone layer were seen even at an effective normal stress of 0.5 MPa. Permeability reduction after shearing is because of the shear zone. In contrast, the shear zone thicknesses in both sands increased with increasing effective normal stress (Figure 6 and Figure 7). Although Fukuoka et al. [41] showed that the shear zone thickness could change in the sample, its ring-shear box apparatus has an outer diameter and an inner diameter of 350 mm and 270 mm, respectively. Furthermore, the maximum shear rate is 300 cm/s. Our apparatus is relatively smaller than that of the previous apparatus and the shear rate used low range. Therefore, in our study, the change of shear zone thickness in the specimen could not be clearly observed. The shear zones of the samples after ring shearing were collected as quadrangular prisms and were separated for a more detailed investigation of the role of grain size reduction in the formation of shear zones under each effective normal stress.
Figure 6. FE-SEM images of shear zones and non-shear zones for Toyoura sand at each effective normal stress. Continued for Toyoura sand at (a) 0.5 MPa; (b) 1.0 MPa; (c) 2.0 MPa; (d) 3.0 MPa; (e) 5.0 MPa; and (f) 8.0 MPa.
Energies 08 07202 g006aEnergies 08 07202 g006b
Figure 8 shows the results of the grain size distribution analysis of the shear zone samples. The frequency peak was reduced for effective normal stress values greater than 2.0 MPa, although this reduction was not clearly observed for stresses up to 1.0 MPa. The grain size reduction is particularly obvious under effective normal stresses of 5.0 and 8.0 MPa. For silica sand No. 7, the fine fraction frequency was slightly higher at higher effective normal stresses. For Toyoura sand, the frequency peaks at effective normal stresses of 0.5 and 1.0 MPa were higher than that of the original sample (no shearing). This reflects that coarse particles are slightly broken by shearing at lower effective normal stresses.
Figure 7. FE-SEM images of shear zones and non-shear zones for silica sand No. 7 at each effective normal stress. Continued for silica sand No. 7 at (a) 0.5 MPa; (b) 1.0 MPa; (c) 2.0 MPa; (d) 3.0 MPa; (e) 5.0 MPa; and (f) 8.0 MPa.
Energies 08 07202 g007aEnergies 08 07202 g007b
Figure 8. Grain size frequency distribution curves for the shear zones of (a) Toyoura sand and (b) silica sand No. 7 samples.
Energies 08 07202 g008
Table 3 gives the grain size distribution, median diameter D50, and sorting So of the shear zone samples for each sample and each effective normal stress value. D50 of the shear zone samples for Toyoura sand and silica sand No. 7 varied in the range of 8.8–225.8 µm and 4.8–194.2 µm, respectively. The D50 values of the shear zone samples at effective normal stresses of 5.0 and 8.0 MPa are significantly smaller than the values at other effective normal stresses. D50 of the shear zones drastically decreased as the effective normal stress increased from 3.0 to 5.0 MPa, although D50 gradually decreased with increasing effective normal stress up to 3.0 MPa. The So of the shear zone samples for Toyoura sand and silica sand No. 7 varied in the range of 0.31–3.03 and 0.42–2.81, respectively. Thus, both sand samples rapidly increased with increasing effective normal stress up to an effective normal stress of 3.0 MPa. The So values of the two sands at an effective normal stress of 2.0 MPa substantially differed from each other. Although So for Toyoura sand at effective normal stress values greater than 3.0 MPa indicates that the sand is very poorly sorted, according to Folk and Ward [42], its values at stresses lower than 2.0 MPa are moderately well sorted. For silica sand No. 7, So at effective normal stresses of 0.5, 1.0, and 2.0 MPa, and greater than 3.0 MPa, are classified as well sorted, moderately sorted, poorly sorted, and very poorly sorted, respectively. The sorting after shearing for both sands tended to be poor at higher effective normal stresses. The change in the grain size distribution with varying effective normal stress is apparent. The sand size fraction decreased, and the clay and silt size fractions increased with increasing effective normal stress. The sand, silt, and clay size fractions for Toyoura sand were in the ranges of 100.0%–32.0%, 0.0%–30.3%, and 0.0%–37.7%, respectively. For silica sand No. 7, the sand, silt, and clay size fractions were in the ranges of 100.0%–9.4%, 0.0%–52.5% and 0.0%–45.7%, respectively. The sand size fraction of the Toyoura sand clearly decreased with increasing effective normal stress of 2.0–5.0 MPa, whereas the sand value for the silica sand No. 7 decreased with increasing effective normal stress of 1.0–5.0 MPa. The grain size reduction of the silica sand No. 7 was more apparent than that of the Toyoura sand. The results for each sand sample are in agreement with the shear zone microstructures observed using FE-SEM (Figure 6 and Figure 7). Fragmentation of feldspar at low temperature is facilitated by cleavage fracturing, which in this case probably produces a larger fraction of finer particles (Figure 8). This would in turn affect permeability.
Table 3. Grain size distribution, median, and sorting in shear zones of specimen after ring-shearing.
Effective Normal Stress during ShearingGrain Size Distribution (%)MedianSorting
ClaySiltSandD50SO
σ′n (MPa)Sub-3.9-µm3.9–62.5 (µm)62.5–2000 (µm)(µm)
Toyoura
Original0.00.0100.0231.70.37
0.50.00.0100.0225.80.31
1.00.00.0100.0219.50.35
2.03.23.693.2211.70.71
3.013.210.276.6184.22.49
5.033.425.041.618.13.03
8.037.730.332.08.82.96
Silica sand No. 7
Original0.00.0100.0215.70.42
0.50.02.098.0194.20.49
1.01.05.993.1192.10.75
2.09.312.877.9166.41.99
3.018.115.066.9149.22.76
5.045.735.219.14.82.81
8.038.152.59.47.02.28
Figure 9 shows the grain size distribution of the shear zones for each effective normal stress plotted on a triangular diagram for the classification sediment types developed by Shepard [43]. To propose the possible areas for gas hydrate reservoirs, it is important to consider seal layers with lithological features of hydrate-bearing sediments and geological structures (e.g., faults). The shear zone samples for Toyoura sand at effective normal stresses of 5.0 and 8.0 MPa were classified as sand silt-clay, while the others were sand. The shear zone samples for silica sand No. 7 at effective normal stresses of 3.0, 5.0, and 8.0 MPa were classified as clayey sand, silty clay, and clayey silt, respectively. Methane hydrate–bearing layer samples in the eastern Nankai Trough area were classified as sand, silty sand, sandy silt, and clayey silt by Ito and Minagawa [39], Ito et al. [44] using the Shepard [43] triangle diagram. Hemipelagic mud classified as clayey silt acted as a sealing layer in gas production from the methane hydrate–bearing layer. These results indicate that although the shear zone samples at moderate effective normal stresses of 2.0 and 3.0 MPa are classified as sand, the fault zone formed at moderate effective normal stresses can be assumed to be a sealing (low-permeability) layer as well as the fault zone formed at higher effective normal stresses. Furthermore, to develop the exploitation of the production method for a long-term, safe, and stable production, relationships between lithological features of sediments and experimental fault properties is needed to be revealed on the basis of more tests.
Figure 9. Classification of shear zone sample after ring-shearing using the triangle diagram developed by Shepard [43].
Energies 08 07202 g009

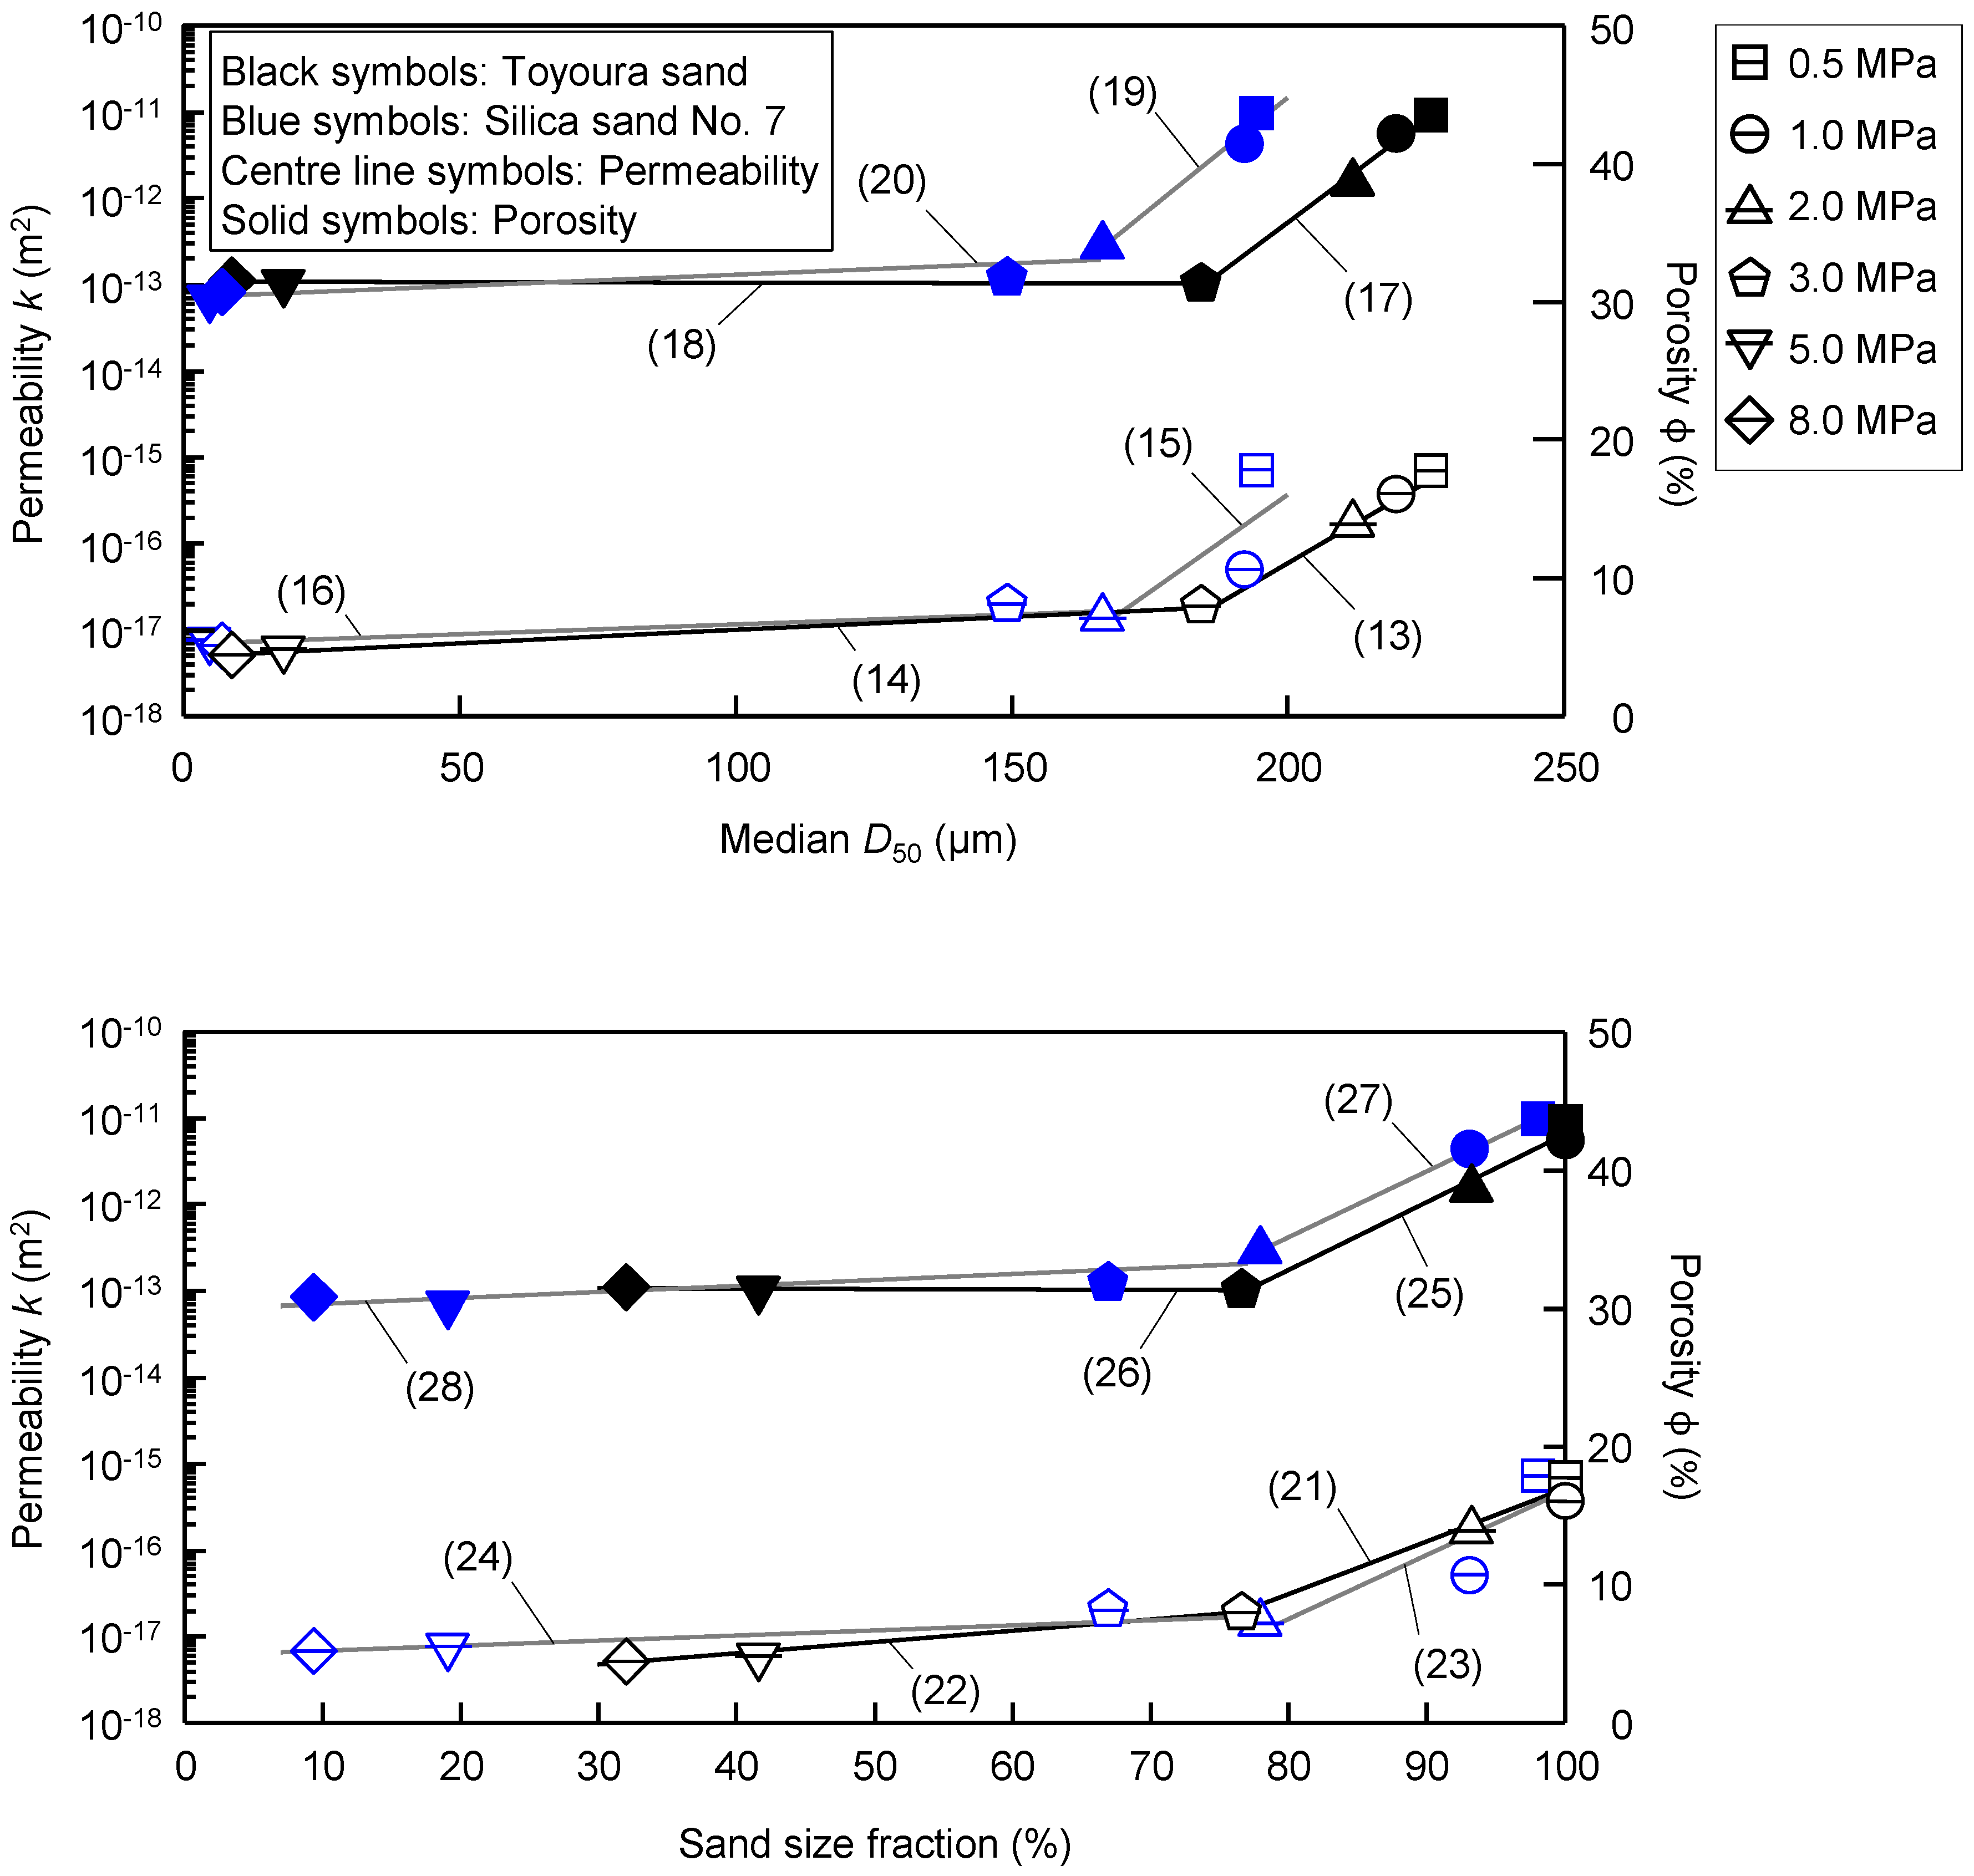
3.3. Effect of Grain Size Reduction of Shear Zone on Permeability/Porosity Reduction

Figure 10 shows the permeability and porosity as functions of the median and sand size fraction for each effective normal stress. The relationships can be presented significantly. The statistical fits r of the correlations given in Table 4 to the permeability and porosity of Toyoura sand were in the range of 0.985–0.998 (Correlations (13), (14), (21) and (22)) and 0.761–0.995 (Correlations (17), (18), (24) and (25)), respectively. The fits of the correlations to the permeability and porosity of silica sand No. 7 were in the range of 0.795–0.928 (Correlations (15), (16), (23) and (24)) and 0.867–0.999 (Correlations (19), (20), (27) and (28)), respectively. Although relationships obtained in Figure 5 and Figure 10 and Table 2 and Table 4 are expected to be an estimation method of fault permeability and preliminary simulations of natural gas production, it is necessary to further investigate soils with different mineralogical features for statistically reliable relationships in a future study. The permeability and porosity decreased with decreasing D50 and sand size fractions. Considering the relationship between permeability, porosity, and effective normal stress (Figure 5), the boundaries in Figure 10 can be defined by separating the two phases. The permeability and porosity decreased from approximately 10−16 to 10−17 m2 and approximately 43% to 31%, respectively, within a relatively narrow range of D50 and sand size fraction values. The permeability and porosity outside that D50 and sand size fraction range gradually decreased from approximately 10−17 to 10−18 m2 and approximately 30% to 31%, respectively. As shown in Figure 10, the controlling grain size distribution factors for permeability and porosity reduction quickly shifted from non-sealing to sealing behavior at D50 values of approximately 180 and 160 µm for Toyoura sand and silica sand No. 7, respectively. Furthermore, the permeability and porosity of both sand samples drastically decreased with decreasing sand size fractions in the range of approximately 80%–100% and gradually decreased as sand size fractions decreased from 80% downwards. For Toyoura sand and silica sand No. 7, the behavior of D50 and the sand size fractions with respect to permeability and porosity after ring-shearing significantly changed at effective normal stresses of 3.0 and 2.0 MPa, respectively. These features show that the porosity decreases with decreasing grain size and increasing effective normal stress during shearing for decreasing permeability, because grain crushing does not occur during the initial compaction of the sand (Figure 6 and Figure 7). This indicates that the shear zone formation, due to the increase in finer grains and porosity reduction, is a controlling factor for fault permeability reduction in sands with different mineral compositions. These results are significant for any reservoirs that contain fractures, which would be expected in a subduction zone environment, and even more generally for fluid flow. As an implication subject for safety and for rationally extracting natural gas from gas hydrate reservoirs, to effectively explain the microstructural processes behind the shear displacement of change and to evaluate networks of small displacements at shallow depths in gas hydrate reservoirs, the relationship between porosity/permeability and shear displacement for various applied effective normal stress needs to be investigated in a future study.
Table 4. Correlations and statistical fits obtained from various correlations in Figure 10.
No.CorrelationsStatistical FitSample *Remarks
rT or No. 7
13kas = 2.0 × 10⁻²⁴ × exp (0.0862 × D50)0.998Tkas, D50 > 184.2 µm
14kas = 5.0 × 10⁻¹⁸ × exp (0.00071 × D50)0.998Tkas, D50 < 184.2 µm
15kas = 2.0 × 10⁻²⁵ × exp (0.1033 × D50)0.795No. 7kas, D50 > 166.4 µm
16kas = 7.0 × 10⁻¹⁸ × exp (0.0054 × D50)0.928No. 7kas, D50 < 166.4 µm
17ϕas = 0.2978 × D50 − 23.66460.995Tϕas, D50 > 184.2 µm
18ϕas = −0.0008 × D50 + 31.50570.761Tϕas, D50 < 184.2 µm
19ϕas = 0.3204 × D50 − 19.25910.988No. 7ϕas, D50 > 166.4 µm
20ϕas = 0.0166 × D50 + 30.41210.867No. 7ϕas, D50 < 166.4 µm
21kas = 4.0 × 10⁻²² × exp (0.1411 × Sand)0.985Tkas, Sand > 76.6%
22kas = 2.0 × 10⁻¹⁸ × exp (0.0298 × Sand)0.995Tkas, Sand < 76.6%
23kas = 2.0 × 10⁻²³ × exp (0.1701 × Sand)0.885No. 7kas, Sand > 77.9%
24kas = 6.0 × 10⁻¹⁸ × exp (0.0136 × Sand)0.913No. 7kas, Sand < 77.9%
25ϕas = 0.4921 × Sand − 6.56340.991Tϕas, Sand > 76.6%
26ϕas = −0.0036 × Sand + 31.63090.854Tϕas, Sand < 76.6%
27ϕas = 0.4793 × Sand − 3.20280.999No. 7ϕas, Sand > 77.9%
28ϕas = 0.0431 × Sand + 29.90390.873No. 7ϕas, Sand < 77.9%
* T: Toyoura sand, No. 7: Silica sand No. 7.
Figure 10. Permeability (centre line symbols) and porosity (solid symbols) plotted against median grain size and sand size fraction of shear zone samples of Toyoura sand (black symbols) and silica sand No. 7 (blue symbols). Numbers in parentheses indicate the correlations listed in Table 4.
Energies 08 07202 g010

4. Conclusions

This study reported an analysis of the fault-normal permeability of sands with different mineral compositions using a ring-shear apparatus for the evaluation of faults around gas hydrate reservoirs. Although Toyoura sand and silica sand No. 7 are mainly composed of quartz, silica sand No. 7 contained small amounts of feldspar. The effect of the effective normal stress on the permeability was investigated in these two sands under constant effective normal stresses in the range of 0.5–8.0 MPa. For Toyoura sand, the permeability after ring-shearing substantially decreased with increasing effective normal stress up to 3.0 MPa and then gradually decreased for increasing effective normal stress greater than 3.0 MPa. In contrast, the permeability after the ring-shearing of silica sand No. 7 drastically decreased for increasing effective normal stress up to 2.0 MPa. Although the relationships between the permeability after ring-shearing and the effective normal stress could be expressed by an exponential equation up to 3.0 MPa, a more gradual change in the slope was shown for Toyoura sand than silica sand No. 7. The permeability of both sands was almost the same for effective normal stresses greater than 3.0 MPa.
The stress dependencies of the permeability and porosity before and after ring-shearing were clearly observed. The microstructure identified using FE-SEM showed a reduction in the grain size and porosity at the shear zone. The shear zone thickness increased with increasing effective normal stress. The grain size distribution, which was investigated using laser diffraction, demonstrated significant grain crushing in the shear zone for both sand samples. It also clarified the relationship between the fault permeability, porosity, and grain size distribution. The finer fractions increased with increasing effective normal stress. The reduction in porosity with grain size reduction caused by particle breakage during shear zone formation at each effective normal stress may explain the permeability reduction. To understand the differences in the permeabilities of the two sands up to 3.0 MPa, the mineralogical properties of the small amount of feldspar composition in the sand sample indicate that both the mineralogy and the original grain size distribution affect the fault permeability and shear zone formation.

Acknowledgments

The authors sincerely acknowledge the assistance provided by O. Nishimura and S. Izumi of the Methane Hydrate Research Centre, National Institute of Advanced Industrial Science and Technology (AIST), for the FE-SEM image observation and X-ray diffraction analysis described in this paper. This work was financially supported by the Research Consortium for Methane Hydrate Resources in Japan (MH21 Research Consortium) of the National Methane Hydrate Exploitation Program planned by the Ministry of Economy Trade and Industry (METI).

Author Contributions

Sho Kimura, who is a principal investigator of this work, designed the study, performed the tests, analyzed the data, and composed the first manuscript and all the figures and tables. Hiroaki Kaneko performed the ring-shearing test work in this research. Takuma Ito advised on grain size distribution and the data quality of the ring-shearing zone. Hideki Minagawa developed the ideas of this research. All the authors approved this manuscript.

Conflicts of Interest

The authors declare no conflict of interest.

References

  1. Pooladi-Darvish, M. Gas production from hydrate reservoirs and its modelling. J. Petrol. Technol. 2004, 56, 65–71. [Google Scholar] [CrossRef]
  2. Kawamura, T.; Sakamoto, Y.; Toon, J.; Ohtake, M.; Yamamoto, Y.; Komai, T.; Haneda, H. Dissociation behavior of hydrate core sample using thermodynamic inhibitor. Int. J. Offshore Polar Eng. 2006, 16, 5–9. [Google Scholar]
  3. Sakamoto, Y.; Komai, T.; Kawamura, T.; Minagawa, H.; Tenma, N.; Yamachi, T. Laboratory-scale experiment of methane hydrate dissociation by hot-water injection and numerical analysis for permeability estimation in reservoir: Part 1—Numerical study for estimation of permeability in methane hydrate reservoir. Int. J. Offshore Polar Eng. 2007, 17, 47–56. [Google Scholar]
  4. Sakamoto, Y.; Kakumoto, M.; Kawamura, T.; Minagawa, H.; Tenma, N.; Yamachi, T. Numerical study on dissociation of methane hydrate and gas production behavior in laboratory-scale experiments for depressurization: Part 3—Numerical study on estimation of permeability in methane hydrate reservoir. Int. J. Offshore Polar Eng. 2009, 19, 124–134. [Google Scholar]
  5. Nagakubo, S.; Kobayashi, T.; Saeki, T.; Shimoda, N.; Fujii, T.; Noguchi, S. The Relations between Methane Hydrate-bearing Formations and Seafloor Manifestations Accompanied by Methane Discharges in the Eastern Nankai Trough. J. Geogr. 2009, 118, 835–853, (In Japanese with English Abstract). [Google Scholar] [CrossRef]
  6. Biegel, R.L.; Sammis, C.G.; Dieterich, J.H. The frictional properties of a simulated gouge having a fractal particle distribution. J. Struct. Geol. 1989, 11, 827–846. [Google Scholar] [CrossRef]
  7. Marone, C.; Scholz, C.H. Particle-size distribution and microstructures within simulated fault gouge. J. Struct. Geol. 1989, 11, 799–814. [Google Scholar] [CrossRef]
  8. Morrow, C.A.; Byerlee, J.D. Experimental studies of compaction and dilatancy during frictional sliding on faults containing gouge. J. Struct. Geol. 1989, 11, 815–825. [Google Scholar] [CrossRef]
  9. Beeler, N.M.; Tullis, M.; Blanpied, J.D. Frictional behavior of large displacement experimental faults. J. Geophys. Res. 1996, 101, 8697–8715. [Google Scholar] [CrossRef]
  10. Tobari, A.; Braathen, A.; Cuisiat, F.; Fossen, H. Shear zones in porous sand: Insights from ring-shear experiments and naturally deformed sandstones. Tectonophysics 2007, 437, 37–50. [Google Scholar]
  11. Dewhurst, D.N.; Brown, K.M.; Clennell, M.B.; Westbrook, G.K. A comparison of the fabric and permeability anisotropy of consolidated and sheared silty clay. Eng. Geol. 1996, 42, 253–267. [Google Scholar] [CrossRef]
  12. Zhang, S.; Tullis, T.E. The effect of fault slip on permeability and permeability anisotropy in quartz gouge. Tectonophysics 1998, 295, 41–52. [Google Scholar] [CrossRef]
  13. Zhang, S.; Tullis, T.E.; Scruggs, V.J. Permeability anisotropy and pressure dependency of permeability in experimentally sheared gouge materials. J. Struct. Geol. 1999, 21, 795–806. [Google Scholar] [CrossRef]
  14. Zhang, S.; Tullis, T.E.; Scruggs, V.J. Implications of permeability and its anisotropy in a mica gouge for pore pressures in fault zones. Tectonophysics 2001, 335, 37–50. [Google Scholar] [CrossRef]
  15. Okada, Y.; Sassa, K.; Fukuoka, H. Excess pore pressure and grain crushing of sands by means of undrained and naturally drained ring-shear tests. Eng. Geol. 2004, 75, 325–343. [Google Scholar] [CrossRef]
  16. Kimura, S.; Kaneko, H.; Ito, T.; Minagawa, H. The effect of effective normal stress on particle breakage, porosity and permeability of sand: Evaluation of faults around methane hydrate reservoirs. Tectonophysics 2014, 630, 285–299. [Google Scholar] [CrossRef]
  17. Hvorslev, M.J. Torsion Shear Tests and Their Place in the Determination of Shearing Resistance of Soils. Proc. ASTM 1939, 39, 999–1022. [Google Scholar]
  18. La Gatta, D.P. Residual Strength of Clays and Clay-Shale by Rotation Shear Tests. Harvard Soil Mechanics Series (86). Ph.D. Thesis, Harvard University, Cambridge, MA, USA, June 1970. [Google Scholar]
  19. Bishop, A.W.; Green, G.E.; Garga, V.K.; Anderson, A.; Brown, J.D. A new ring shear apparatus and its application to the measurement of residual strength. Géotechnique 1971, 21, 273–328. [Google Scholar] [CrossRef]
  20. Bromhead, E.N. A Simple Ring Shear Apparatus. Ground Eng. 1979, 12, 40–44. [Google Scholar]
  21. Skempton, A.W. Residual strength of clays in landslides, folded strata and the laboratory. Géotechnique 1985, 35, 3–18. [Google Scholar] [CrossRef]
  22. Gibo, S.; Egashira, K.; Ohtsubo, M. Residual strength of smectite-dominated soils from the Kamenose landslide in Japan. Can. Geotech. J. 1987, 24, 456–462. [Google Scholar] [CrossRef]
  23. Stark, T.D.; Choi, H.; McCone, S. Drained shear strength parameters for analysis of landslides. J. Geotech. Geoenviron. 2005, 131, 575–588. [Google Scholar] [CrossRef]
  24. Nakamura, S.; Gibo, S.; Egashira, K.; Kimura, S. Platy layer silicate minerals for controlling residual strength in landslide soils of different origins and geology. Geology 2010, 38, 743–746. [Google Scholar] [CrossRef]
  25. Minagawa, H.; Egawa, K.; Sakamoto, Y.; Komai, T.; Tenma, N.; Narita, H. Characterization of hydraulic permeability and pore-size distribution of methane hydrate-bearing sediment using proton nuclear magnetic resonance measurement. Int. J. Offshore Polar Eng. 2012, 22, 306–313. [Google Scholar]
  26. Minagawa, H.; Nishikawa, Y.; Ikeda, I.; Miyazaki, K.; Takahara, N.; Sakamoto, Y.; Komai, T.; Narita, H. Characterization of sand sediment by pore size distribution and permeability using proton nuclear magnetic resonance measurement. J. Geophys. Res. 2008, 113. [Google Scholar] [CrossRef]
  27. Egashira, K.; Matsuo, K.; Gibo, S.; Nakamura, S.; Zhou, Y.; Inoue, H.; Sasaki, K. Clay mineralogical approach to the slip-surface formation in the O’dokoro landslide. Clay Sci. 2000, 11, 107–113. [Google Scholar]
  28. Lupini, J.F.; Skinner, A.E.; Vaughan, P.R. The drained residual strength of cohesive soils. Géotechnique 1981, 31, 181–213. [Google Scholar] [CrossRef]
  29. Hungr, O.; Morgenstern, N.R. High velocity ring shear tests on sand. Géotechnique 1984, 34, 415–421. [Google Scholar] [CrossRef]
  30. Tika, T.E.; Vaughan, P.R.; Lemos, L.J.L.J. Fast shearing of pre-existing shear zones in soil. Géotechnique 1996, 46, 197–233. [Google Scholar] [CrossRef]
  31. Gibo, S.; Egashira, K.; Ohtsubo, M.; Nakamura, S. Strength recovery from residual state in reactivated landslide soils. Géotechnique 2002, 52, 683–686. [Google Scholar] [CrossRef]
  32. Sassa, K.; Fukuoka, H.; Wang, G.; Ishikawa, N. Undrained dynamic-loading ring-shear apparatus and its application to landslide dynamics. Landslides 2004, 1, 7–19. [Google Scholar] [CrossRef]
  33. Tiwari, B.; Marui, H. A new method for the correlation of residual shear strength of the soil with mineralogical composition. J. Geotech. Geoenviron. 2005, 131, 1139–1150. [Google Scholar] [CrossRef]
  34. Fukuoka, H.; Sassa, K.; Wang, G. Influence of shear speed and normal stress on the shear behavior and shear zone structure of granular materials in naturally drained ring shear tests. Landslides 2007, 4, 63–74. [Google Scholar] [CrossRef]
  35. Toyota, H.; Nakamura, K.; Sugimoto, M.; Sakai, N. Ring shear tests to evaluate strength parameters in various remoulded soils. Géotechnique 2009, 59, 649–659. [Google Scholar] [CrossRef]
  36. Iverson, N.R.; Mann, J.E.; Iverson, R.M. Effects of soil aggregates on debris-flow mobilization: Results from ring-shear experiments. Eng. Geol. 2010, 114, 84–92. [Google Scholar] [CrossRef]
  37. Vithana, S.B.; Nakamura, S.; Kimura, S.; Gibo, S. Effects of overconsolidation ratios on the shear strength of remoulded slip surface soils in ring shear. Eng. Geol. 2012, 131–132, 29–36. [Google Scholar] [CrossRef]
  38. Kimura, S.; Nakamura, S.; Vithana, S.B.; Sakai, K. Shearing rate effect on residual strength of landslide soils in the slow rate range. Landslides 2014, 11, 969–979. [Google Scholar] [CrossRef]
  39. Ito, T.; Minagawa, H. Selective dehydration during methane-hydrate dissociation in the eastern Nankai Trough sediments and its implications. J. Sediment. Soc. Jpn. 2013, 72, 3–12, (In Japanese with English Abstract). [Google Scholar] [CrossRef]
  40. Ito, T.; Iwamoto, H.; Kamiya, K.; Fukushima, T.; Kumon, F. Use of flood chronology for detailed environmental analysis: A case study of Lake Kizaki in the northern Japanese Alps, central Japan. Environ. Earth Sci. 2010, 60, 1607–1618. [Google Scholar] [CrossRef]
  41. Fukuoka, H.; Sassa, K.; Wang, G.; Sasaki, R. Observation of shear zone development in ring-shear apparatus with a transparent shear box. Landslides 2006, 3, 239–251. [Google Scholar] [CrossRef]
  42. Folk, R.L.; Ward, W.C. Brazos river bar: A study of significance of grain size parameters. J. Sediment. Petrol. 1957, 27, 3–26. [Google Scholar] [CrossRef]
  43. Shepard, F.P. Nomenclature based on sand-silty-clay ratios. J. Sediment. Petrol. 1954, 24, 151–158. [Google Scholar]
  44. Ito, T.; Komatsu, Y.; Fujii, T.; Suzuki, K.; Egawa, K.; Nakatsuka, Y.; Konno, T.; Yoneda, J.; Jin, T.; Kida, M.; et al. Lithological features of hydrate-bearing sediments and their relationship with gas hydrate saturation in the eastern Nankai Trough, Japan. Mar. Pet. Geol. 2015. [Google Scholar] [CrossRef]

