Article

Thermo-Mechanical Simulations of Rock Behavior in Underground Coal Gasification Show Negligible Impact of Temperature-Dependent Parameters on Permeability Changes

GFZ German Research Centre for Geosciences, Telegrafenberg, Potsdam 14473, Germany
*
Author to whom correspondence should be addressed.
Energies 2015, 8(6), 5800-5827; https://doi.org/10.3390/en8065800
Submission received: 27 April 2015 / Accepted: 9 June 2015 / Published: 16 June 2015
(This article belongs to the Special Issue Recent Advances in Coal Combustion and Gasification)

Abstract

:
A coupled thermo-mechanical model has been developed to assess permeability changes in the vicinity of an underground coal gasification (UCG) reactor resulting from excavation and thermo-mechanical effects. Thereto, we consider a stepwise UCG reactor excavation based on a pre-defined coal consumption rate and dynamic thermal boundary conditions. Simulation results demonstrate that thermo-mechanical rock behavior is mainly driven by the thermal expansion coefficient, thermal conductivity, tensile strength and elastic modulus of the surrounding rock. A comparison between temperature-dependent and temperature-independent parameters applied in the simulations indicates notable variations in the distribution of total displacements in the UCG reactor vicinity related to thermal stress, but only negligible differences in permeability changes. Hence, temperature-dependent thermo-mechanical parameters have to be considered in the assessment of near-field UCG impacts only, while far-field models can achieve a higher computational efficiency by using temperature-independent thermo-mechanical parameters. Considering the findings of the present study in the large-scale assessment of potential environmental impacts of underground coal gasification, representative coupled simulations based on complex 3D large-scale models become computationally feasible.

1. Introduction

Underground coal gasification (UCG) has the potential to increase the worldwide coal reserves by utilization of coal deposits that are currently not mineable by conventional methods. The original idea of UCG is not new, but rather has a long history. A detailed description of the early ideas and their evolution is given by Klimenko [1]. Nowadays, a target coal seam is developed by directional drilling to make the coal accessible for in situ coal combustion [2]. The resulting high-calorific synthesis gas can be applied for fuel production, electricity generation or chemical feedstock production [1,2,3,4,5,6,7,8,9]. Apart from its high energetic and economic potential [10,11,12,13,14], UCG may cause environmental impacts such as ground subsidence and groundwater pollution [8,9,15,16,17]. In order to completely avoid or significantly mitigate these potential environmental concerns, the UCG reactor is generally operated below hydrostatic pressure to hinder the outflow of UCG process fluids into adjacent aquifers [8,18,19]. Changes in permeability and generation of fractures in the overburden as a result of the in situ combustion process may introduce potential migration pathways for UCG contaminants like organic (phenols, benzene, PAHs and heterocyclics) and inorganic pollutants (ammonia, sulphates, cyanides, and heavy metals) [20,21,22,23]. As groundwater pollution is recognized to be the most relevant environmental risk related to UCG [1], extensive investigations on the formation, release, and migration of contaminants have to be conducted at the laboratory and field scale [24].
Major contributions to the environmental impact mitigation can be achieved by improving the understanding of coupled thermo-mechanical processes in the rocks surrounding the UCG reactor. However, these are difficult to investigate for deep UCG operations in the field, so that the current knowledge on these processes is mainly based on laboratory experiments [25,26] and UCG field trails at shallow depths, e.g., Angren (110 m) in Uzbekistan, Chinchilla (140 m) in Australia, Hanna (80 m) and Hoe Creek (30–40 m) in the USA [8,16]. During UCG, temperatures of more than 1500 °C can be reached in the UCG reactor and its close vicinity, and thus the temperature-dependent coal and rock behavior in the reactor vicinity is expected to be of the uttermost importance for assessment of UCG- related permeability changes in the rocks surrounding the UCG reactor. Next to mechanical stress changes due to excavation effects resulting from the reactor growth, thermal stresses also induce permeability changes. Permeability in consideration of the difference between hydrostatic and UCG reactor pressure, controls fluid in- and outflow into and out of the reactor, respectively [27]. This affects the drying of coal, pyrolysis gas flow from the coal into the reactor, oxidant and synthesis gas flow from the reactor, gasification efficiency as well as convective heat transfer into surrounding rocks [28,29,30].
Coupled numerical models can be applied to assess the mechanical integrity of the UCG reactor and its surrounding rocks. Wolf et al. [29] found in their study on the interaction between underground coal fires and the respective roof rocks that the combustion process and permeability behavior, influenced by the thermo-mechanical behavior of the overburden rock, are the essential processes to be considered. Although, the study focused on shallow coal fires, similar behavior is expected in underground coal gasification of deeper seated coal seams. A 3D model for combined reactive heat and mass transport comprising thermo-mechanical failure behavior has been developed by Biezen [31]. With his approach, an understanding of the development of an underground coal gasification reactor is obtained taking into account thermo-mechanical failure properties of coal and rocks, as well as thermo-mechanically induced spalling of both, roof rock and coal. Simulation results show that a high permeability zone between the injector and producer develops, which leads to the formation of a single channel at the bottom of the coal seam. However, permeability changes in the overburden are not considered by this model. Hettema et al. [32] studied the effect and influence of thermal spalling on differently heated Felser sandstones under the presence of water in thermal shock experiments. The pore pressure increases in the reactor vicinity, whereby the opening of the pores and micro-cracks can lead to a significant increase in permeability [33]. However, Hettema et al. [32] concluded that even for sedimentary rocks, which have the potential to spall by steam pressure alone, spalling probably occurs by a combination of steam pressure and a fracturing mechanism associated with high compressive thermal stress.
Several early studies on UCG demonstrated that roof rock behavior has an important effect on reactor stability and ground subsidence [34,35,36]. Thermo-mechanical coupled models implemented by Tian [34] and Najafi et al. [37] aimed at the investigation of UCG induced ground subsidence based on the Controlled Retraction and Injection Point (CRIP) UCG configuration. Numerical studies performed by Tian [34] therefore focused on the temperature impact and implementation of thermo-mechanical Hoek-Brown (TMHB) and Mohr-Coulomb models, whereas Najafi et al. [37] analyzed the stress distribution in the vicinity of UCG panels to estimate the required protection pillar width for commercial scale UCG operation. Their simulation results show increasing ground subsidence with the increase of the reactor size as well as the stress increased at the front of the face and pillar edge due the induced thermal stresses. Thermo-mechanical simulation results of rocks surrounding an UCG reactor elaborated by Yang et al. [38] show the temperature distribution and stress increase (around 10%) as well as vertical displacements (0.073 m) above the coal seam after three days of gasification. Sarraf et al. [39] present a 2D model for the growth of a UCG reactor based on the CRIP technology, which incorporates the combined effects of fluid flow through porous media, mass transfer of species, heat transfer and reaction kinetics. The resulting cavity shape and growth rate are in good agreement with experimental data from post-burn experiments, but thermo-mechanical rock behavior and permeability changes in surrounding rocks have not been taken into account in that study. The implementation of a comprehensive UCG simulation tool, which is able to numerically couple underground gasification thermodynamics with hydro-mechanical and reactive transport processes to predict reactor growth, synthesis gas composition and rate, and UCG process interaction with the host environment, accounting for site characteristics, oxidant composition and injection rate is computationally extremely challenging and was recently reported to be in development [40].
Furthermore, most existing mechanical modeling studies focused on ground subsidence or stress changes by applying only coarsely refined structured numerical grids, resulting in a limited validity considering thermo-mechanical processes in the close reactor vicinity [37,38,41]. Most of the present experimental studies on thermo-mechanical properties of rocks at high temperatures mainly considered crystalline rocks such as granites and marbles. Due to limited data availability on thermo-mechanical properties of sedimentary rocks, previous thermo-mechanical modeling studies generally did not incorporate the influence of thermo-mechanical parameters [29,37] or used those of igneous rocks instead, e.g., Min [42] and Sarhosis et al. [43].
In the present study, a coupled thermo-mechanical model has been developed to assess permeability changes in the UCG reactor overburden based on a volumetric strain to permeability relationship after Chin et al. [44]. Simulations carried out for this study are not focusing on the investigation of rock spalling at the reactor boundary, reactor roof collapse and ground surface subsidence. The finite-difference thermo-hydro-mechanical simulator FLAC3D [45] was employed to analyze thermo-mechanical stress changes, displacements and volumetric strain increments around a UCG reactor using a specifically refined unstructured grid.

2. Methodology

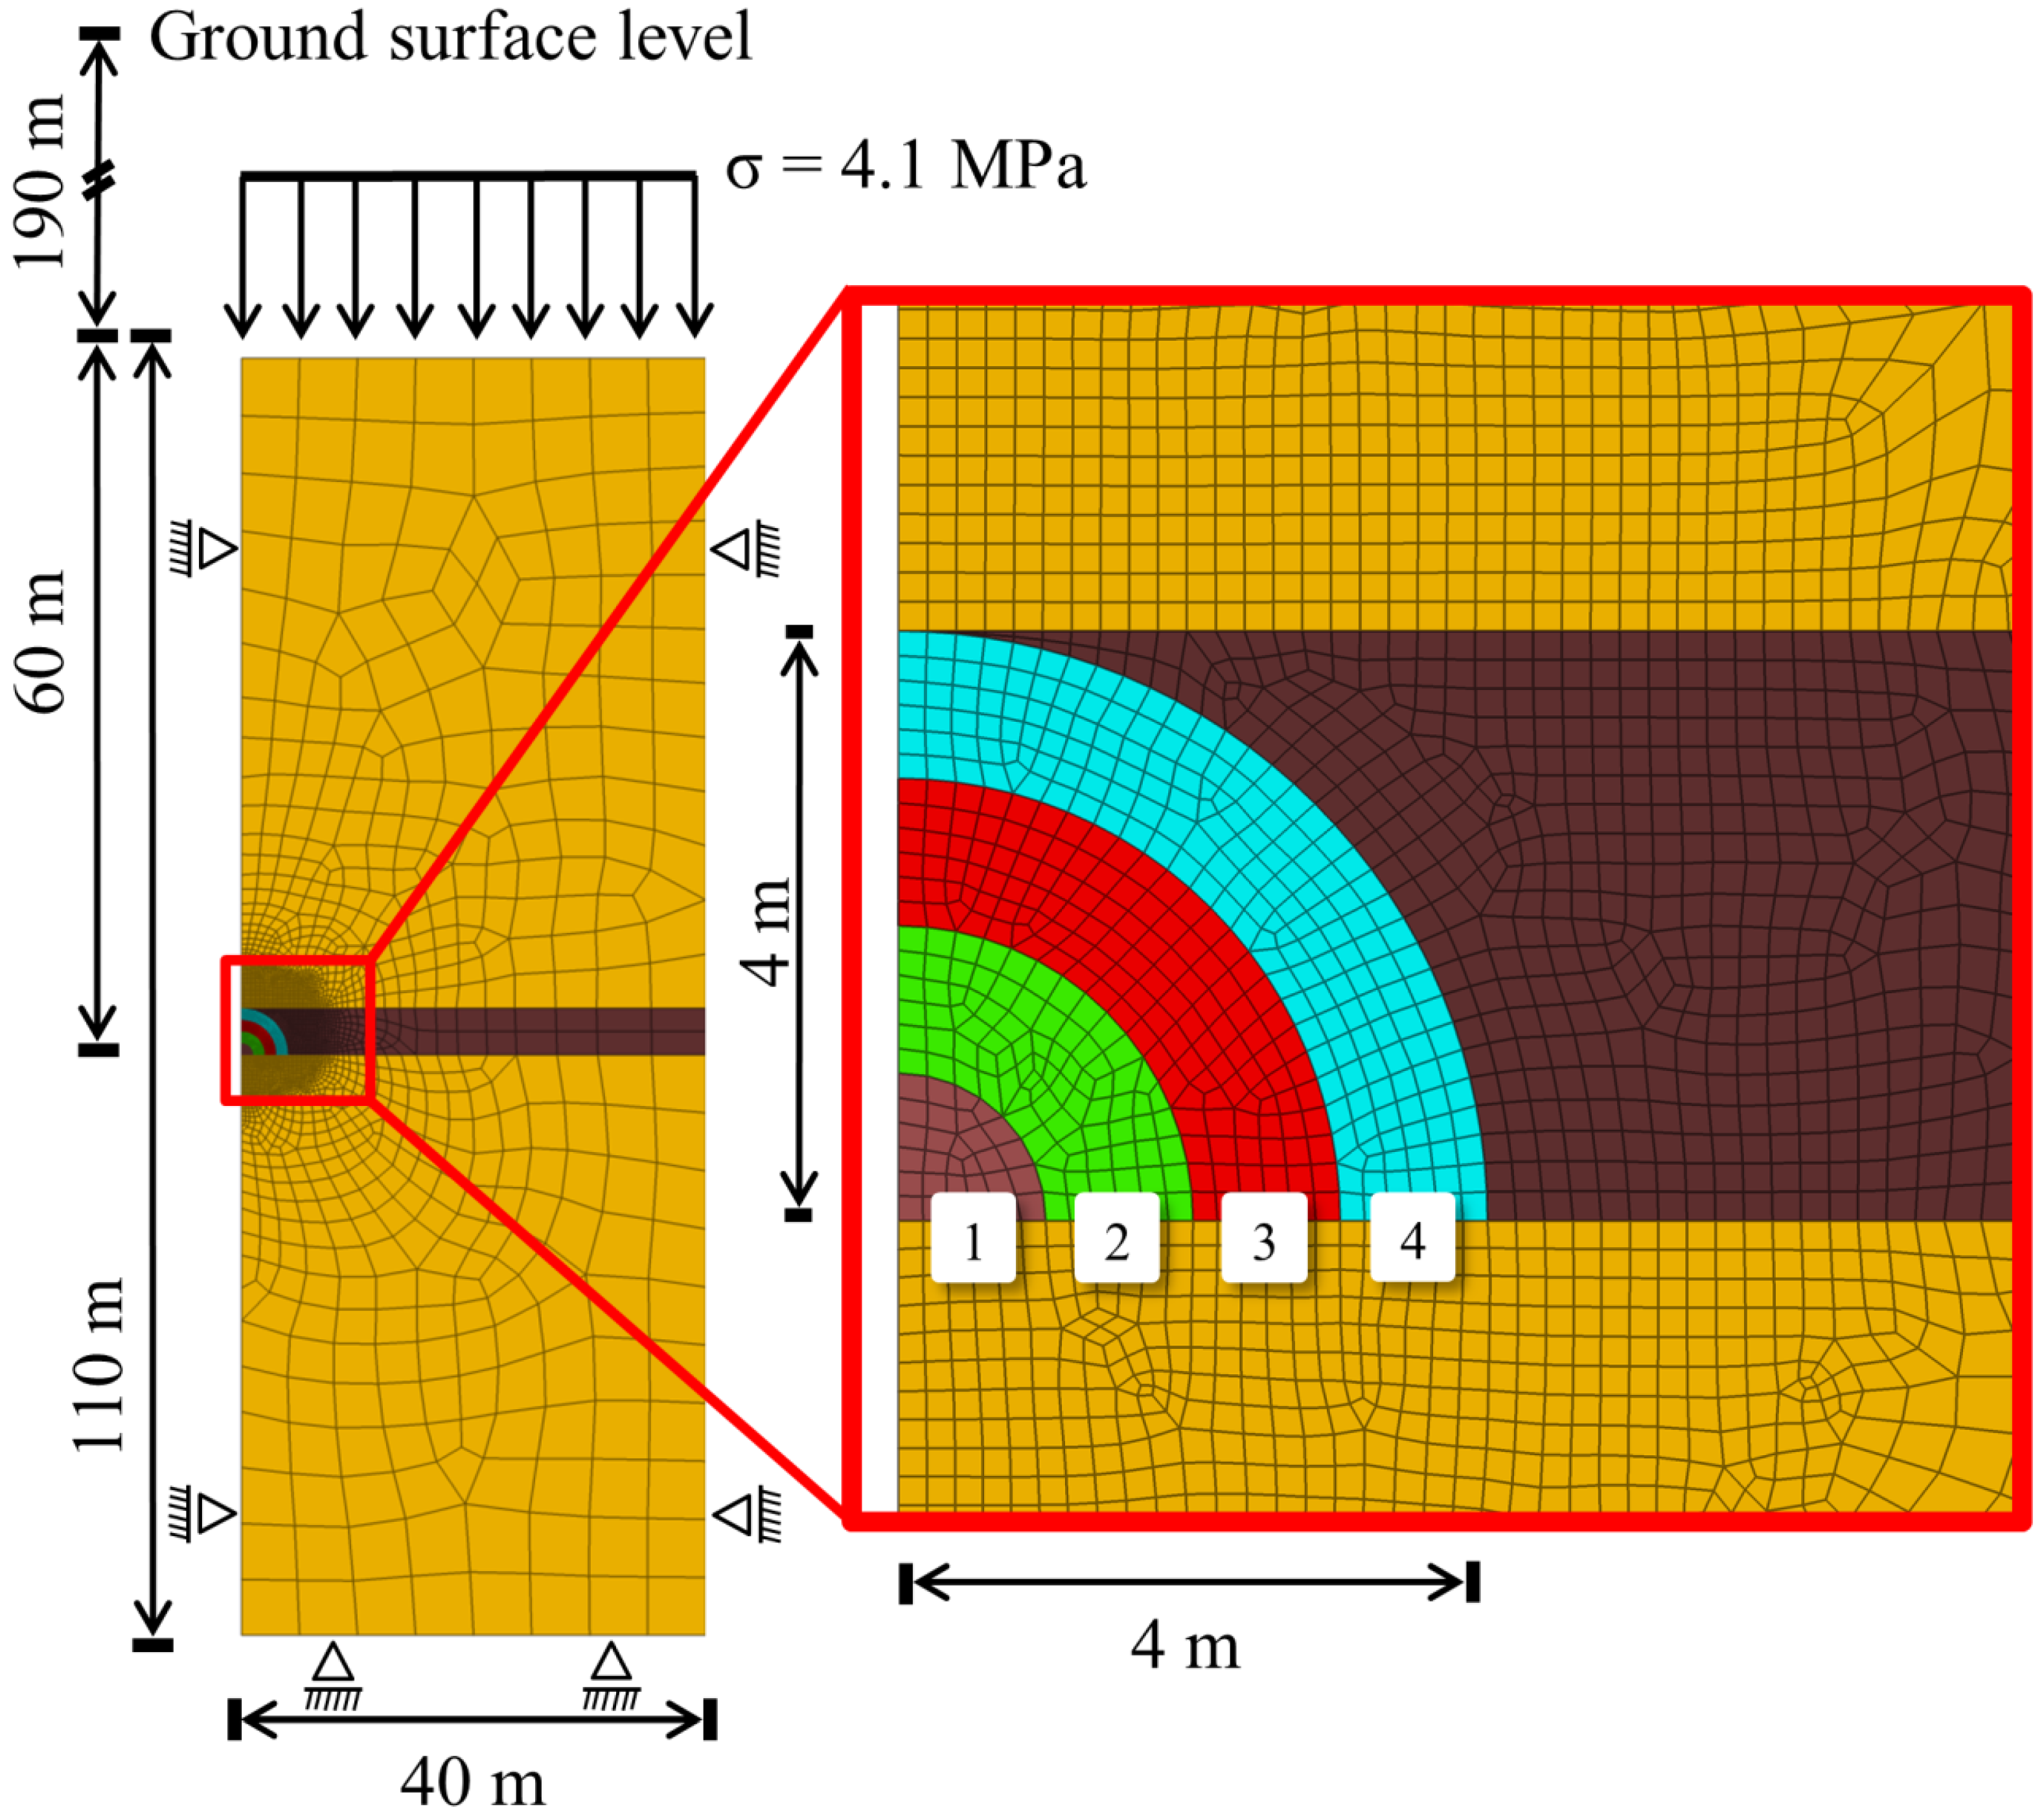
2.1. Model Grid Geometry, Boundary Conditions and Applied Simulator

The chosen model size and grid discretization of the implemented numerical model were adapted to calculation time, whilst model boundary conditions were placed at a distance far enough away to minimize their impact on the computational results. The implementation of the 2D UCG reactor model presented here is derived from Hanna trial data, numerical simulation results of UCG thermodynamics carried out by Luo et al. [46] and literature data after Tian et al. [47,48,49,50,51]. The implemented numerical model uses the UCG reactor symmetry present along its vertical axis assuming that a half-radial symmetric reactor develops along the UCG panel. Hence, the present approach neglects the 3D tear-drop shape of the UCG reactor as reported by, e.g., Burton et al. [8], but maintains its major geometric features (Figure 1). The two-dimensional geometry of the Hanna coal seam of 4 m thickness is uniformly expanded towards the model boundaries with the reactor bottom located at a depth of 250 m below ground surface. Model size was set to 40 m × 110 m and discretized by about 3000 elements with sizes of 0.16 m to 5 m in horizontal and vertical directions. Application of an unstructured mesh allowed us for a sufficient grid refinement to maintain numerical accuracy in the UCG reactor vicinity for the four considered geometrical reactor growth steps. Therefore, the implemented model grid enables a specific stepwise UCG reactor excavation based on a pre-defined low coal consumption rate (0.654 t per day and meter reactor length), and thereby prevents overestimations of mechanical excavation effects, which would introduce unrealistic grid point velocities into the numerical model, and consequently overestimate strains and mechanical failure. In numerical modeling of mechanical processes, specific mechanical excavation methods may lead to different stress paths, which have an important impact on failure modes around excavation boundaries. However, the behavior of rock mass can be only reasonably revealed, if the stress path is captured in a realistic manner [52]. Based on sensitivity studies using time-dependent forces derived from elements at the outer reactor boundaries, the four step excavation showed comparable grid point velocities during excavation as in a finer step excavation.
A stress boundary condition with a vertical stress of 4.1 MPa has been assigned at the top model boundary, representing the weight of overburden. Fixed boundary conditions were applied normal to the lateral boundaries and model bottom. Hence, displacements perpendicular to the model bottom and lateral boundaries were not allowed at the respective model boundaries, while the model top was allowed to freely displace in any direction. Based on grid size sensitivity analyses, the final unstructured grid was generated using the open source GMSH software package [53] and own grid conversion tools to transfer the resulting grid into the finite-difference software package FLAC3D.
Figure 1. Geometry of the thermo-mechanical coupled 2D UCG model based on simplified geological data of the Hanna UCG trail. The model comprises two sandstone layers (colored in light brown) and one coal seam (colored in dark brown) with four geometric reactor growth steps considered in the simulations (light brown, green, red and turquois).
Energies 08 05800 g001

2.2. Numerical Model Parameterization as well as Rock and Coal Properties

Literature reviews and experimental studies carried out by Tian et al. [47,48,49,50,51] summarize the extensive laboratory research on rock specimens exposed to high temperatures undertaken in the last decades to investigate the temperature influence on thermo-mechanical rock properties. These research efforts indicate that mechanical rock properties are generally highly dependent on temperature, and that the characteristics of temperature dependency vary with rock types, rock initial features such as micro-cracks and structure as well as with the experienced temperature gradient (heating rate) [47,48,49,50,51]. In addition to the previously mentioned review on international literature, Tian et al. [47,48,49,50,51] provide new experimental study results on temperature-dependent thermo-mechanical rock properties, especially addressing the thermo-mechanical parameters of sedimentary rocks at temperatures of up to 1000 °C. Temperature-dependent thermal properties (linear thermal expansion coefficient, specific heat capacity, thermal conductivity) are not yet published for claystones [50]. Since this modeling study focused on the temperature-dependent permeability development in the UCG reactor vicinity, all simulations have been implemented with thermal parameters derived for sandstone from published laboratory testing studies (see Figure 2 and Figure 3) [34,42,54,55,56,57,58,59,60]. The normalized trends of thermo-mechanical coal properties after high temperature treatment are derived from a review carried out by Min [42]. All data applied in the thermo-mechanical model are compiled in Table 1, whereby typical initial values of density (ρ) and Poisson’s ratio (ν) were assumed based on literature data [61,62] and maintained constant for all lithological units. As a generally accepted law on temperature influence on the Poisson’s ratio (e.g., [62]) has not been published so far, the Poisson’s ratio is assumed to be independent of temperature in our simulations.
Figure 2. Trend of normalized thermo-mechanical properties of sandstones as a function of temperature.
Energies 08 05800 g002
Figure 3. Trend of thermo-mechanical coal properties as a function of temperature. Red dashed lines delimit temperature regions representing the temperature zones exhibiting specific thermo-mechanical coal behavior.
Energies 08 05800 g003
Density of sedimentary rocks decreases with increasing temperature due to volumetric expansion and/or the release of volatile matter, but the magnitude in decrease is relatively small compared to that of virgin rocks [47,48,49,50,51]. The density is maintained constant for all geological units, whereas the linear thermal expansion coefficient (α) was chosen to be temperature-dependent as discussed below in more detail.
Table 1. Initial thermo-mechanical rock properties applied for numerical model parameterization.
Input ParameterUnitSandstoneCoal
Mechanical parameters
Elastic modulus (E) f(T)GPa42
Tensile strength (σt) f(T)MPa50.27
Friction angle (ϕ) (constant for rock)°3220
Cohesion (c) (constant for rock)MPa50.1
Poisson ratio (ν) (constant)-0.350.44
Density (ρ) (constant)kg/m322001300
Thermal parameters
Linear thermal expansion coefficient (α) f(T)K−11.6 × 10−55.0 × 10−6
Specific heat capacity (CP) f(T)J/kg K13632000
Thermal conductivity (λ) f(T)W/m/K2.300.23

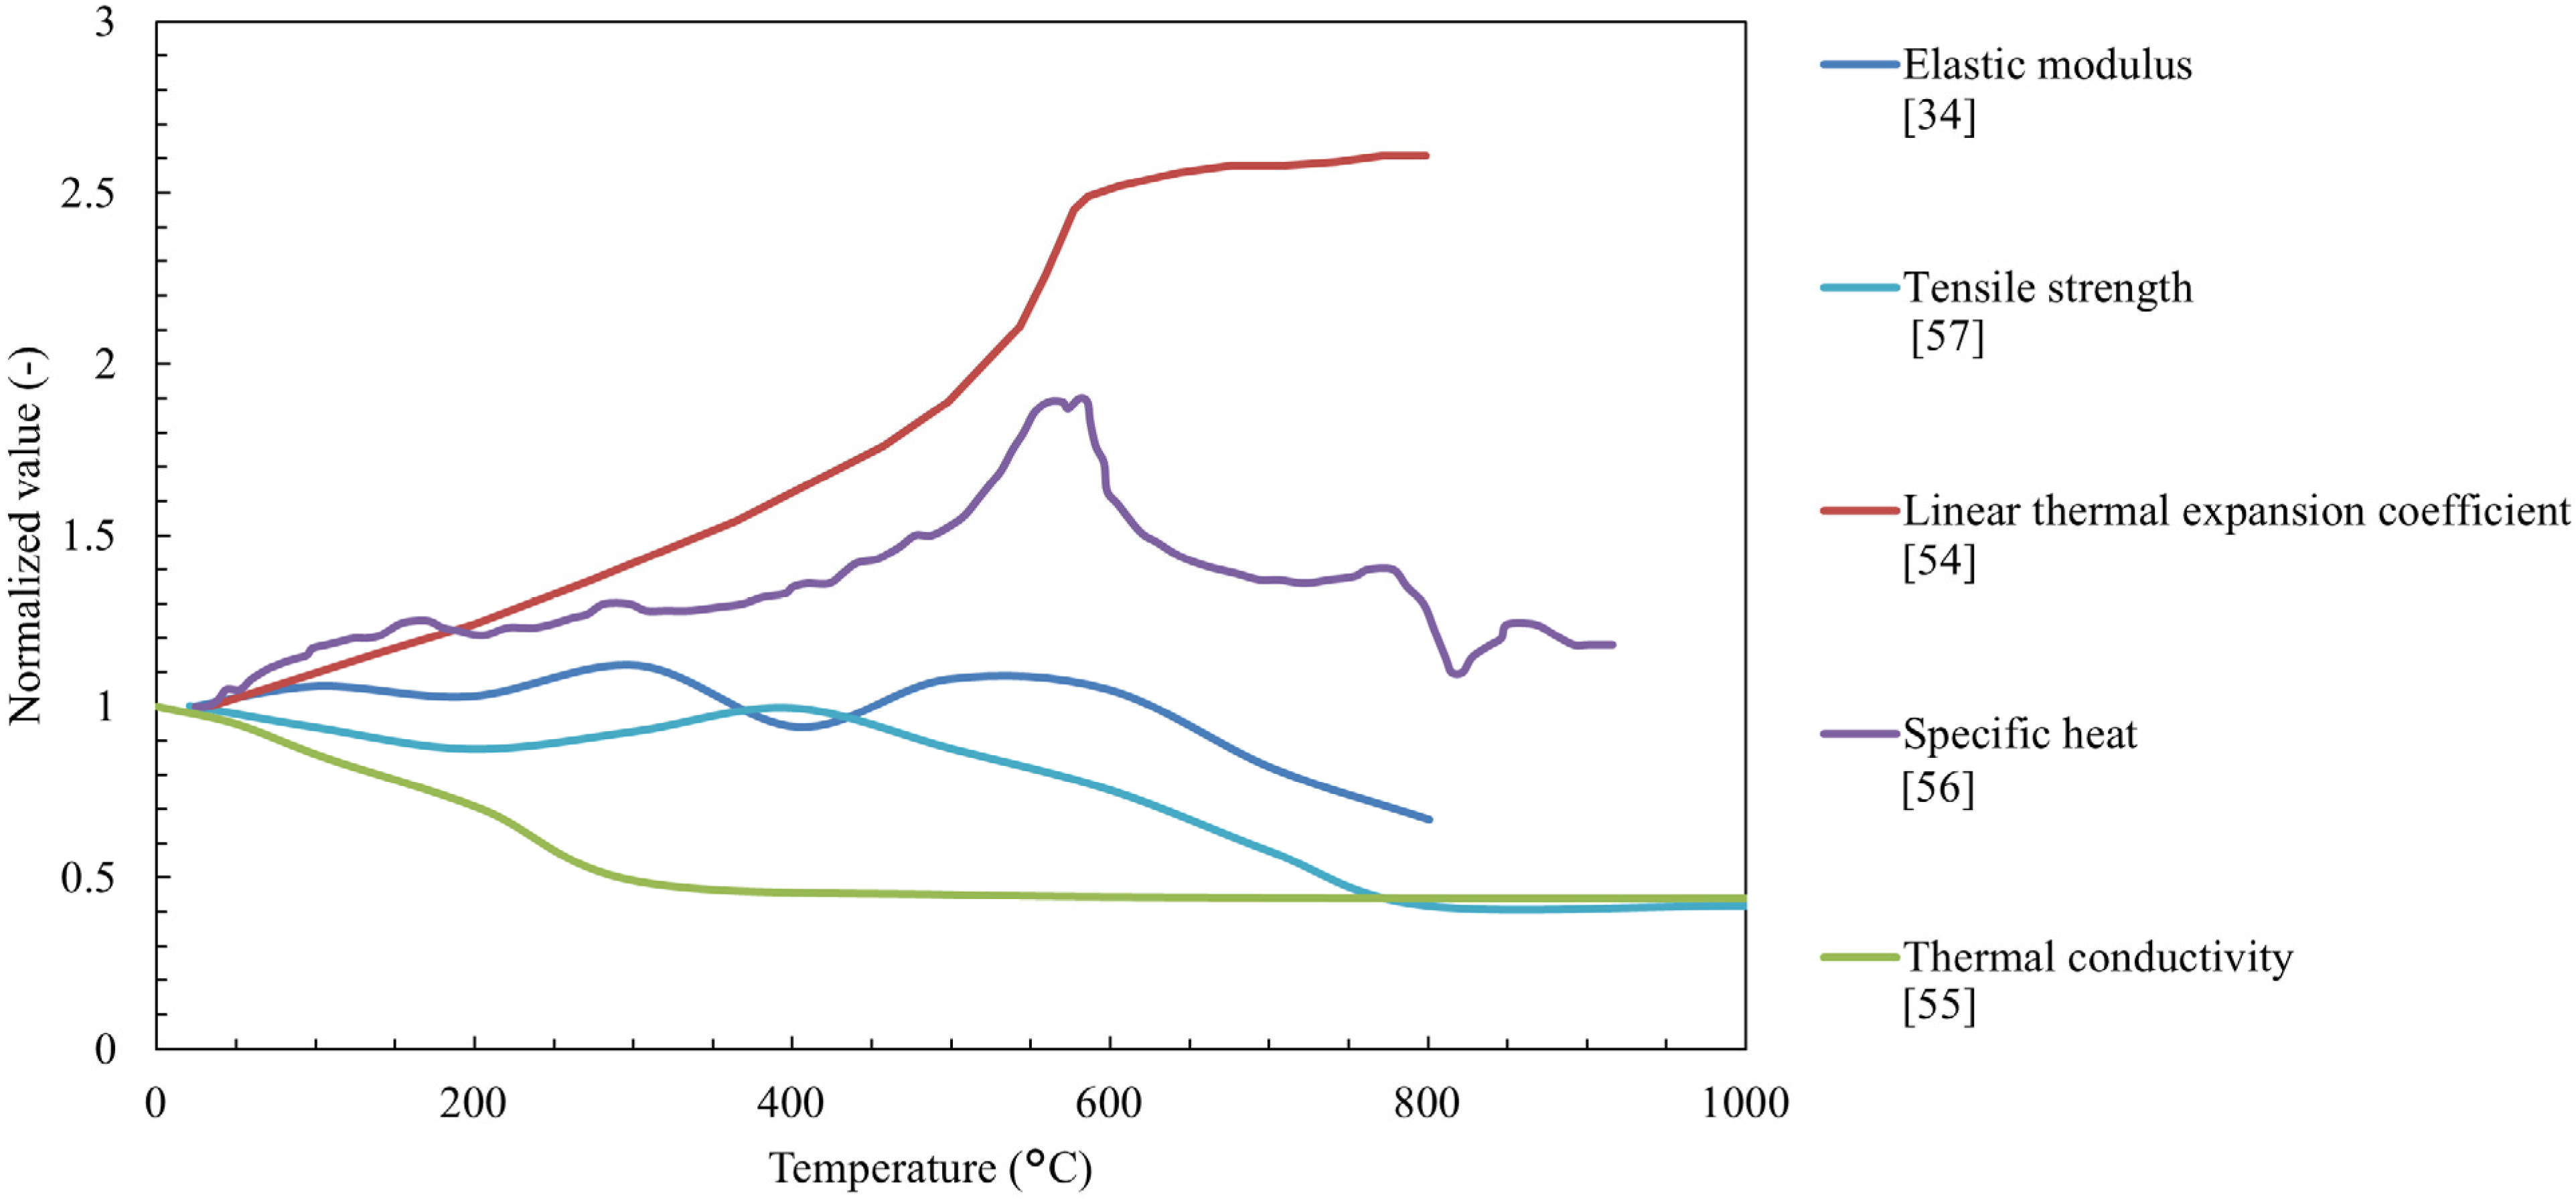
2.2.1. Sandstone Properties as Function of Temperature

As summarized by Tian et al. [47,48,49,50,51], significant experimental research on mechanical and thermal rock properties during and after high temperature treatment has been carried out in the scope of underground coal gasification research, whereby the results indicate that temperature-dependent parameters have to be considered in numerical simulations on high temperature rock mechanical processes (e.g., [54,55,56,57,63,64]). Thus, temperature dependent thermo-mechanical properties of sandstone assigned to the models considered here include the elastic modulus (E), tensile strength (σt), linear thermal expansion coefficient (α), specific heat capacity (CP) and thermal conductivity (λ) (Figure 2). The normalized values shown in Figure 2 are the respective ratios of these values at the tested temperature to those determined at initial conditions (Table 1) as a function of temperature. Experimental results have indicated that the nature of changes of rock strength properties with increasing temperature is not consistent for sedimentary rocks, but it is generally accepted that elastic modulus and strength of rocks decrease with increasing temperature [47,48,49,50,51]. It is obvious that thermal property behavior of sedimentary rocks is related to its mineral composition. Somerton [54] reported that less dense feldspars and clays are known to have lower thermal conductivities compared to quartz. Although, differences in mineral compositions have some effect on the magnitude of thermal effects, experimental results of linear thermal expansion coefficient tests on sandstone samples show that the quartz content has a dominant effect on its expansion [54]. The linear thermal expansion coefficient of sandstone increases in a continuous linearly manner with temperature and notably above 500 °C until the α–β quartz phase inversion at approximately 575 °C is reached, and then remains constant. Hajpál and Török [56] observed that the specific heat capacity of sandstones increases with increasing temperature and reaches its maximum in the range of 550 °C to 700 °C, and decreases thereafter. In accordance with other studies on sedimentary rocks, Clauser and Huenges [55] reported a generally decreasing trend in thermal conductivity with increasing temperature for sandstone. For sedimentary rocks in general, they showed that further factors influencing thermal conductivity are porosity and the origin of the particular sediment.

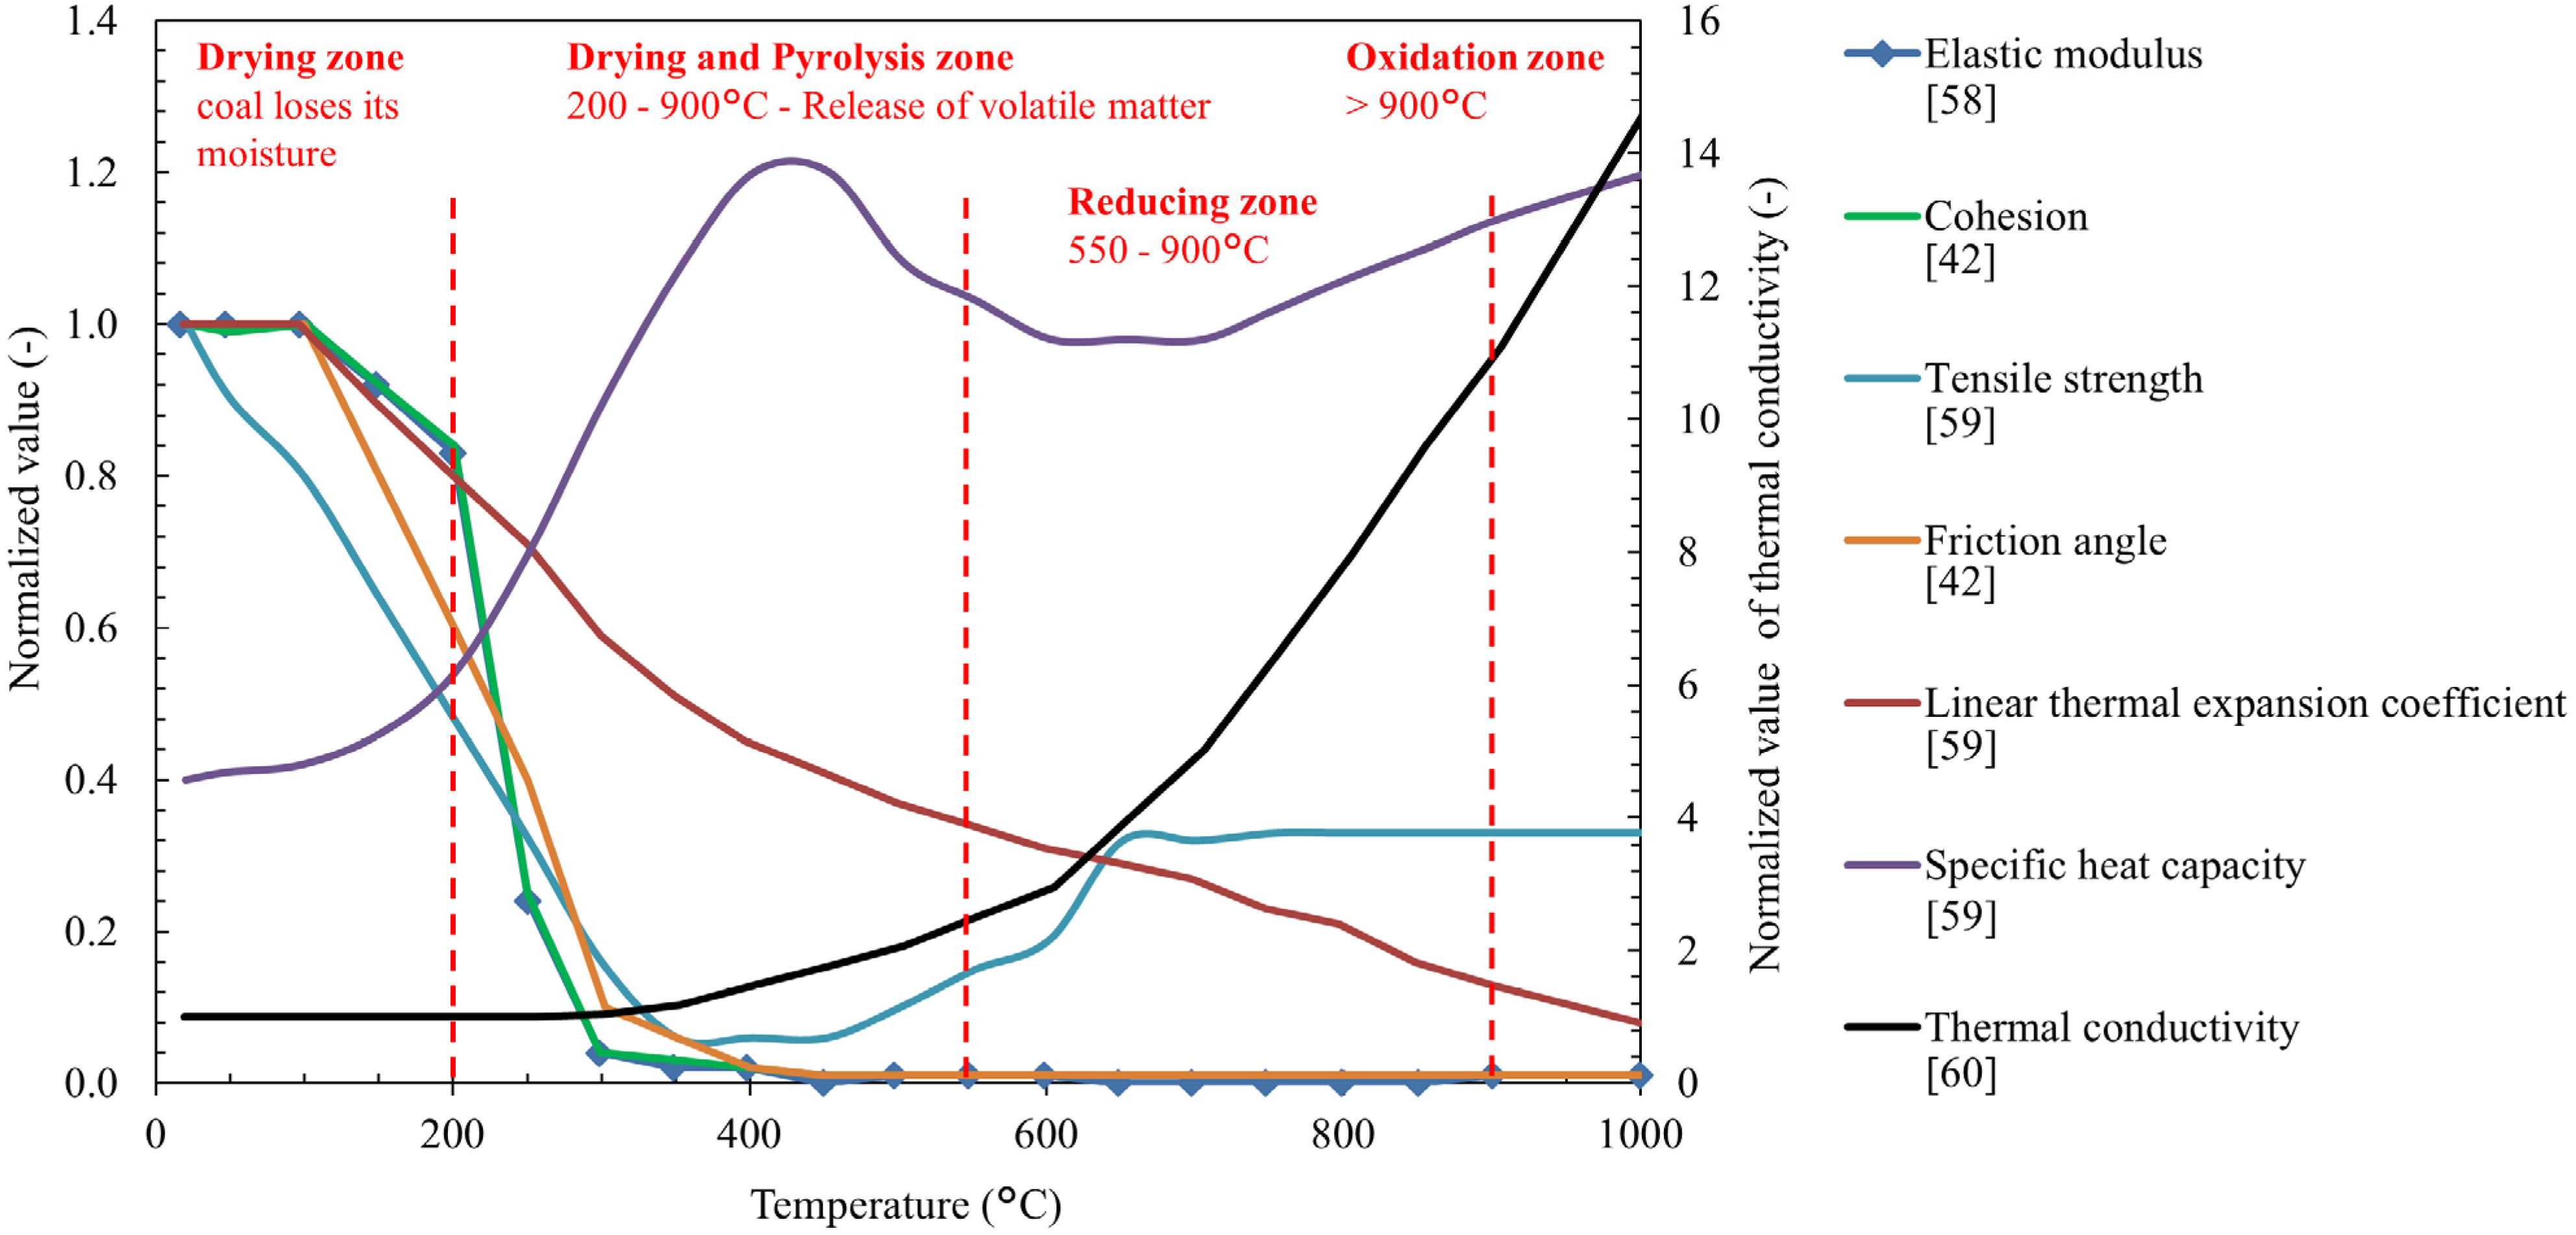
2.2.2. Coal Properties as Function of Temperature

Initial parameterization of coal (Table 1) considered data from the review of experimental testing data on temperature-dependent thermo-mechanical properties for bituminous coals carried out by Min [38]. From the thermal trends of the coal’s elastic modulus (E) and tensile strength (σt), its cohesion (c) and friction angle (ϕ) were assumed and applied for model parameterization [42]. The implemented temperature-dependent thermal coal properties comprise the linear thermal expansion coefficient (α), specific heat capacity (CP) and thermal conductivity (λ) (Figure 3) [42,58,59,60]. Coal undergoes a number of pyrolysis reactions during heating [42]. A significant decrease of the elastic modulus, tensile strength, cohesion and friction angle occurs at temperatures above 200 °C due to the release of volatile matter. Further notable property changes occur in the drying and pyrolysis temperature regions close to the coal liquefaction temperature at 300 to 350 °C, where softening and highly viscoelastic behavior occur [58,65]. In the present study, it is assumed that coal exposed to temperatures above 400 °C is either gasified or collapsed into a reactor forming a rubble pile. These transitions are not explicitly implemented, however, the loss in strength is considered through the implemented temperature-dependent mechanical properties. Thereto, all three mechanical properties (elastic modulus, cohesion and friction angle) are assumed to significantly decrease tending towards zero. Model elements experiencing temperatures above 400 °C do not have any strength assigned.

2.3. Coupling of Volumetric Strain Increments to Porosity and Permeability Changes

Conditions in the UCG reactor and its combustion zone are strongly influenced by the influx of water, which is controlled by the host rock permeability and the gradient between hydrostatic and UCG reactor pressure [30]. Hence, UCG operation, i.e., especially UCG reactor temperature, is determined by a complex interaction between hydro-mechanical effects and related permeability changes as well as coal properties and oxidant composition. In order to determine permeability changes, various approaches to this problem have been developed, but the impracticability of describing discrete fracture systems in detail has limited the specificity of analyses [66]. Studies on the relation between principal stresses and discrete fracture permeability have been mainly motivated by interest in effects of tectonics and engineered excavations (e.g., [67,68]). Thermally-induced mechanical and permeability changes around excavations are often addressed in the context of nuclear waste disposal [69]. In addition to the excavation damage zone, which is created in the excavation near-field exposing a high potential for changing rock permeability, also thermal stress effects generated in the near-field have been an issue of great concern (e.g., [42,69,70,71,72]). Changes in permeability of simulated fractured rock masses were calculated with a set of stress-dependent empirical equations that account for both, normal and shear dilation [73]. The results show that permeability changes are small, i.e., a factor of two and generally decreasing around a nuclear waste repository, and thermally induced dilation was not observed [69]. However, the evolution of stresses and permeability changes around excavation zones is analyzed for different rock types (crystalline rock, rock salt, and indurated and plastic clays), at different times scale and much lower temperatures [69,73].
Wolf and Bruining [29] expected that the combustion process, the heat transfer and permeability behavior influenced by the thermo-mechanical behavior of the overburden rock are essential elements to be considered. For an initial uniform permeability field in the study presented by Wolf and Bruining [29], the reactive free convection model was used to obtain a temperature distribution, which was then used in a compaction model to derive an updated permeability distribution. In the present study, deformation is associated with volume changes affecting rock and coal permeability, so that the rock compaction behavior in the UCG reactor vicinity was simulated by using an isotropic elasto-plastic constitutive model applying the material properties shown in Table 1. For modeling thermal and mechanical stress-induced permeability changes, the permeability is related to volumetric strain using the stress-induced relationship developed by Chin et al. [44]:
ϕ = 1 ( 1 ϕ i ) e Δ ϵ ν
k = k i ( ϕ ϕ i ) n
where ϕ is the porosity at a given volumetric strain εν; ϕi the initial porosity; k the permeability at a given εν; ki the initial permeability; and n a power-law exponent (porosity sensitivity exponent) with a value range of 2 to 25 depending on stress and lithology [74,75]. David et al. [74] found a linear correlation of the logarithmic permeability and bulk porosity for all tested sandstones. Therefore, permeability scales in form of a power-law with porosity (Equation (2)). Experimental results from David et al. [74] show that a rather large permeability loss corresponds to a moderate porosity reduction, which results in high values for the porosity sensitivity exponent (n). The effect of this exponent will be further discussed in the Results and Discussion section. Relating permeability to porosity and volumetric strain enables straightforward permeability change calculations in our coupled thermo-mechanical model. Our assumptions comprise a homogeneous and isotropic rock considering thermo-mechanical properties independent of pore pressure. Consequently, the applied model allows us to assess the damage zone in the reactor vicinity, which is associated with a strong permeability increase. In the developed model, calculated permeability changes are not reversible, what can be explained by the permanent increase in fracture aperture due to shear and tensile dilation in the rock. Furthermore, the thermo-mechanical simulations carried out for this study focus on an extreme case of spatial temperature distribution by neglecting fluid flow into and out of the reactor as well as the steam jacket present in the hanging wall.

2.4. Scenario Analysis

Two different simulation scenarios were applied to carry out a sensitivity analysis for a coupled thermo-mechanical simulation of one day and 50 days length, respectively. Simulations were essentially carried out in two steps: the first step represents the initial setup of the numerical grid, material properties, boundary conditions, and initialization of the in situ stress as previously discussed. This initial model was then run to achieve a mechanical equilibrium (defined by the maximum unbalanced force present in the model), and used from there as initial state model for all simulations discussed in the following. Secondly, the UCG reactor was excavated in one step for the sensitivity analysis, whereas for the 50 day simulation, the reactor sizes were generated in a stepwise manner depending on the given coal consumption rate (0.654 t per day and meter reactor length). A constant temperature of 1000 °C was applied at the reactor boundary for each excavation step and the model was calculated to mechanical equilibrium for each thermal time step. The temperature-dependent rock and coal properties have been implemented in a tabular format in the numerical model for each element and time step. Thereto, FISH (Itasca macro programming language) functions were implemented and called for these properties at each iterative step in the coupled numerical analysis. In all cases, the coupled simulations were run separately for each excavation step until the achievement of a mechanical equilibrium before proceeding with the next excavation step.

3. Results and Discussion

3.1. Temperature Dependency of Thermo-Mechanical Rock Properties

Mechanical processes in the UCG reactor vicinity are strongly influenced by mechanical and thermal properties, which are in turn controlled by the temperature distribution in the surrounding coal and its adjoining rock, provided that properties are considered to be temperature-dependent. Changes in the reactor temperature result in different mechanical behavior, whereby each parameter has a different development and a varying influence on total displacements in time (Figure 2 and Figure 3). For the sensitivity analysis, all four radial reactor zones were excavated at once and a temperature of 1000 °C was applied for one day at the reactor walls. Except for the parameter to be investigated within the sensitivity analysis, all other model input parameters were maintained constant at initial conditions in time. The results of total displacements are plotted along three profiles (Figure 4) for comparison of the simulations using temperature-independent and temperature-dependent properties (Figure 5).
Figure 4. Position of the total displacement profiles in the 2D model.
Energies 08 05800 g004
Figure 5. Profiles of total displacements (ac) after one day of simulation show that the thermo-mechanical rock behavior is mainly influenced by the linear thermal expansion coefficient (α), tensile strength (σt) and elastic modulus (E).
Energies 08 05800 g005
The proposed methodology enabled us to identify the most relevant thermo-mechanical parameters in the simulation and to highlight, which of those have to be taken into account in thermo-mechanical environmental impact assessments of UCG operations. Parameters inducing the highest displacement variations were identified and quantified. Displacement profiles plotted in Figure 4 exhibit significant differences between simulations considering temperature-independent and dependent rock parameters. In general, the displacement magnitudes of temperature-dependent simulations are higher in regions of notable temperature changes.
At the upper and lower reactor to sandstone boundary, the experienced high temperatures have the highest impacts on total displacements, especially due to the influence of the sandstone’s linear thermal expansion coefficient. Maximum total displacements at the reactor bottom of about 6 cm are achieved, which is about 2 cm higher compared to the temperature-independent parameter based simulation (Profiles A–A´ and B–B´ in Figure 5). Due to only minor temperature-dependent variations in elastic modulus and tensile strength, the stability of the sandstone layer is not affected even at high temperature conditions. Hence, none of the other investigated parameters is found to be sensitive to displacements in the sandstone layer. The simulated total displacements in the coal seam at 246 m to 250 m depth (Figure 5, Profiles B–B´ and C–C´) illustrate that tensile strength and elastic modulus are the parameters most sensitive to consideration of their temperature-dependency. Significant changes in total displacements at the reactor hanging wall can be observed (about 22 cm in total), where the relative difference compared to the simulations with temperature-independent properties is up to 10 cm. Considering the development of the nominal values in Figure 3, it becomes obvious that the simulated displacements are related to a significant decrease in strength at temperatures above 200 °C.
The sensitivity analysis shows that maximum total displacements resulting from the consideration of temperature-dependent parameters are generally higher compared to those without temperature-dependent parameters. This is further influenced by the dynamic development of the spatial temperature distribution in the reactor vicinity, and thus the related changes in thermo-mechanical material properties affecting rock strength as well as the in situ stress regime. Furthermore, the sensitivity analysis shows that thermo-mechanical behavior of the given rocks is mainly influenced by the linear thermal expansion coefficient, tensile strength and elastic modulus. Nevertheless, for the 50 day simulation, specific heat capacity and thermal conductivity were maintained as temperature-dependent to account for a maximum realistic spatial temperature distribution in the reactor vicinity.

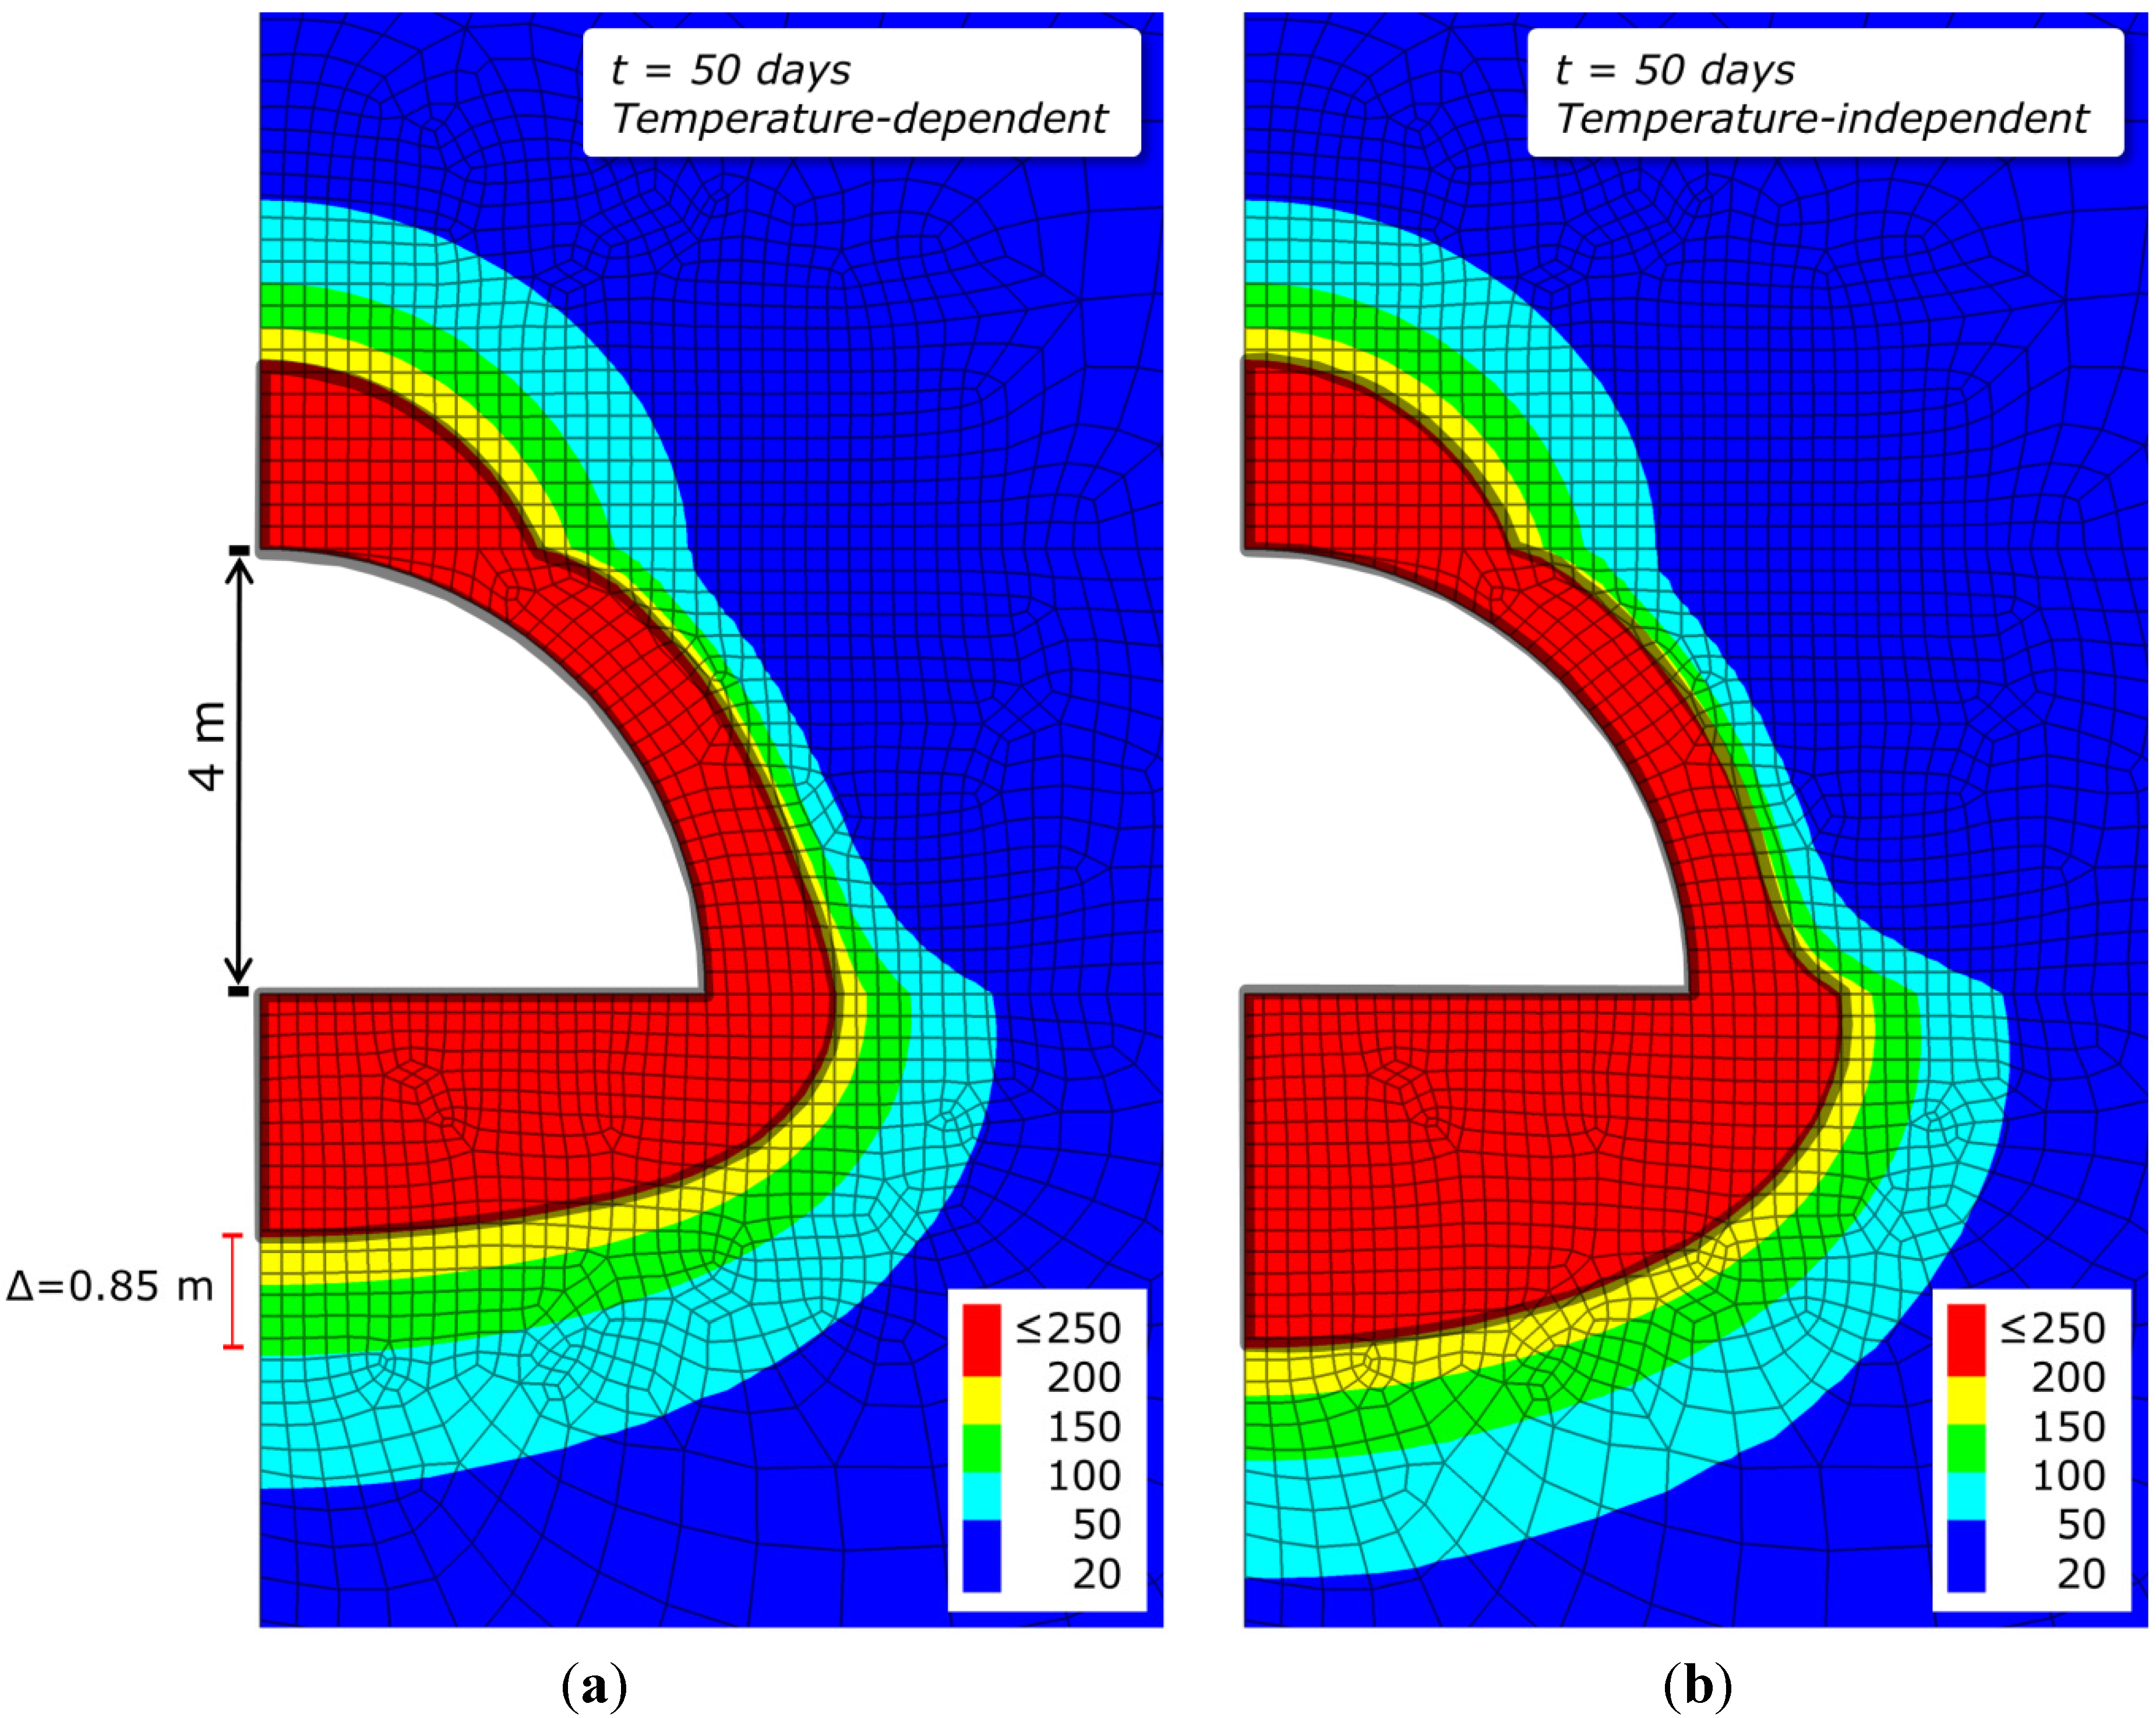
3.2. Distribution of Temperature with Temperature-Dependent and -Independent Material Properties

Heat transport in the present simulations is driven by heat conduction only. Since heat conductivity and heat capacity are determined by low values in both lithological layers (Table 1), their change with increasing temperature is in the range of one order of magnitude, and thus induces a significant temperature increase (≥200 °C) in the close reactor vicinity only. Figure 6 shows the distribution of the temperature in the reactor vicinity after 50 days simulation with temperature-dependent and temperature-independent properties. For both simulations, the maximum of the high temperature (≥200 °C) distance to the reactor boundary is in the range of the coal seam thickness and even larger (0.85 m), if temperature-dependent parameters are not considered.
Figure 6. Temperature distribution in the reactor vicinity after 50 days of simulation with (a) temperature dependent and (b) temperature-independent material properties. The grey solid line represents the 200 °C isotherm.
Energies 08 05800 g006
A comparison of the distribution of the thermal conductivity for temperature-dependent and temperature-independent parameters is shown in Figure 7. Due to the decrease in thermal conductivity with increasing temperature for sandstone, the magnitudes are reduced to about the half (1.2 W/m/K) of the initial value in reactor vicinity due to high temperature impact. The temperature of 1000 °C at the reactor boundary is applied at each reactor growth step, at especially results in the formation of a broader temperature field at the reactor bottom in the temperature-independent simulation (increase by 0.85 m at temperatures ≥200 °C). The influence of the exposure of the reactor underburden to high temperatures is significantly longer compared with that experienced by the reactor overburden in that case.
The increase in thermal conductivity of coal by about one order of magnitude in regions with temperatures above 900 °C is observed close to the reactor boundary only. Hence, the effect of considering temperature-dependent parameters is very limited for the resulting temperature distribution.
Figure 7. Distribution of the thermal property thermal conductivity (W/m/K) after 50 days of simulation with (a) temperature-dependent and (b) temperature-independent properties (initial values). The grey solid line represents the 200 °C isotherm.
Energies 08 05800 g007

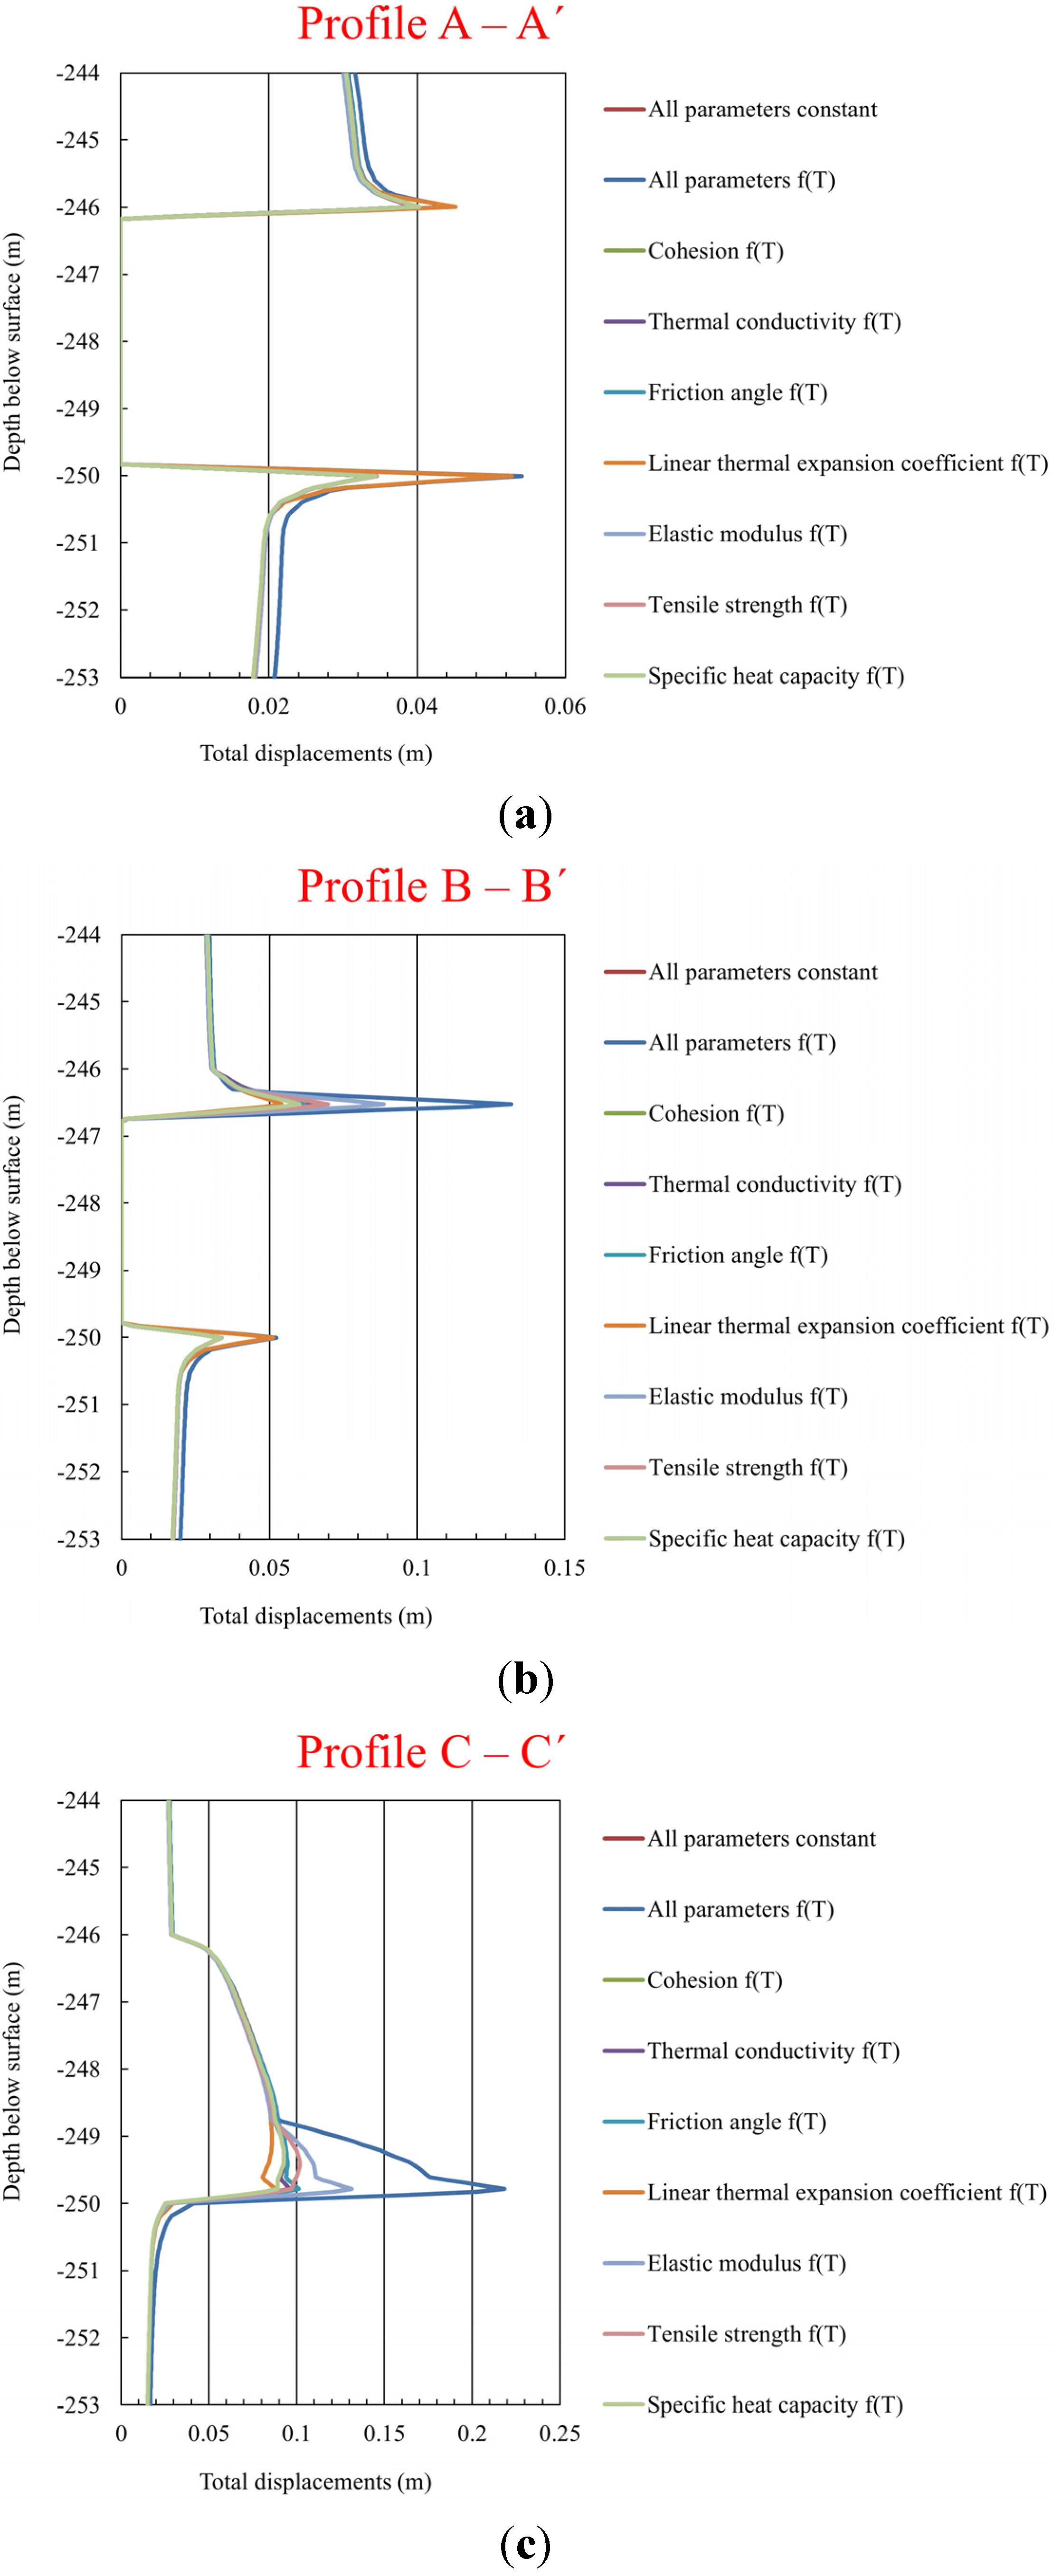
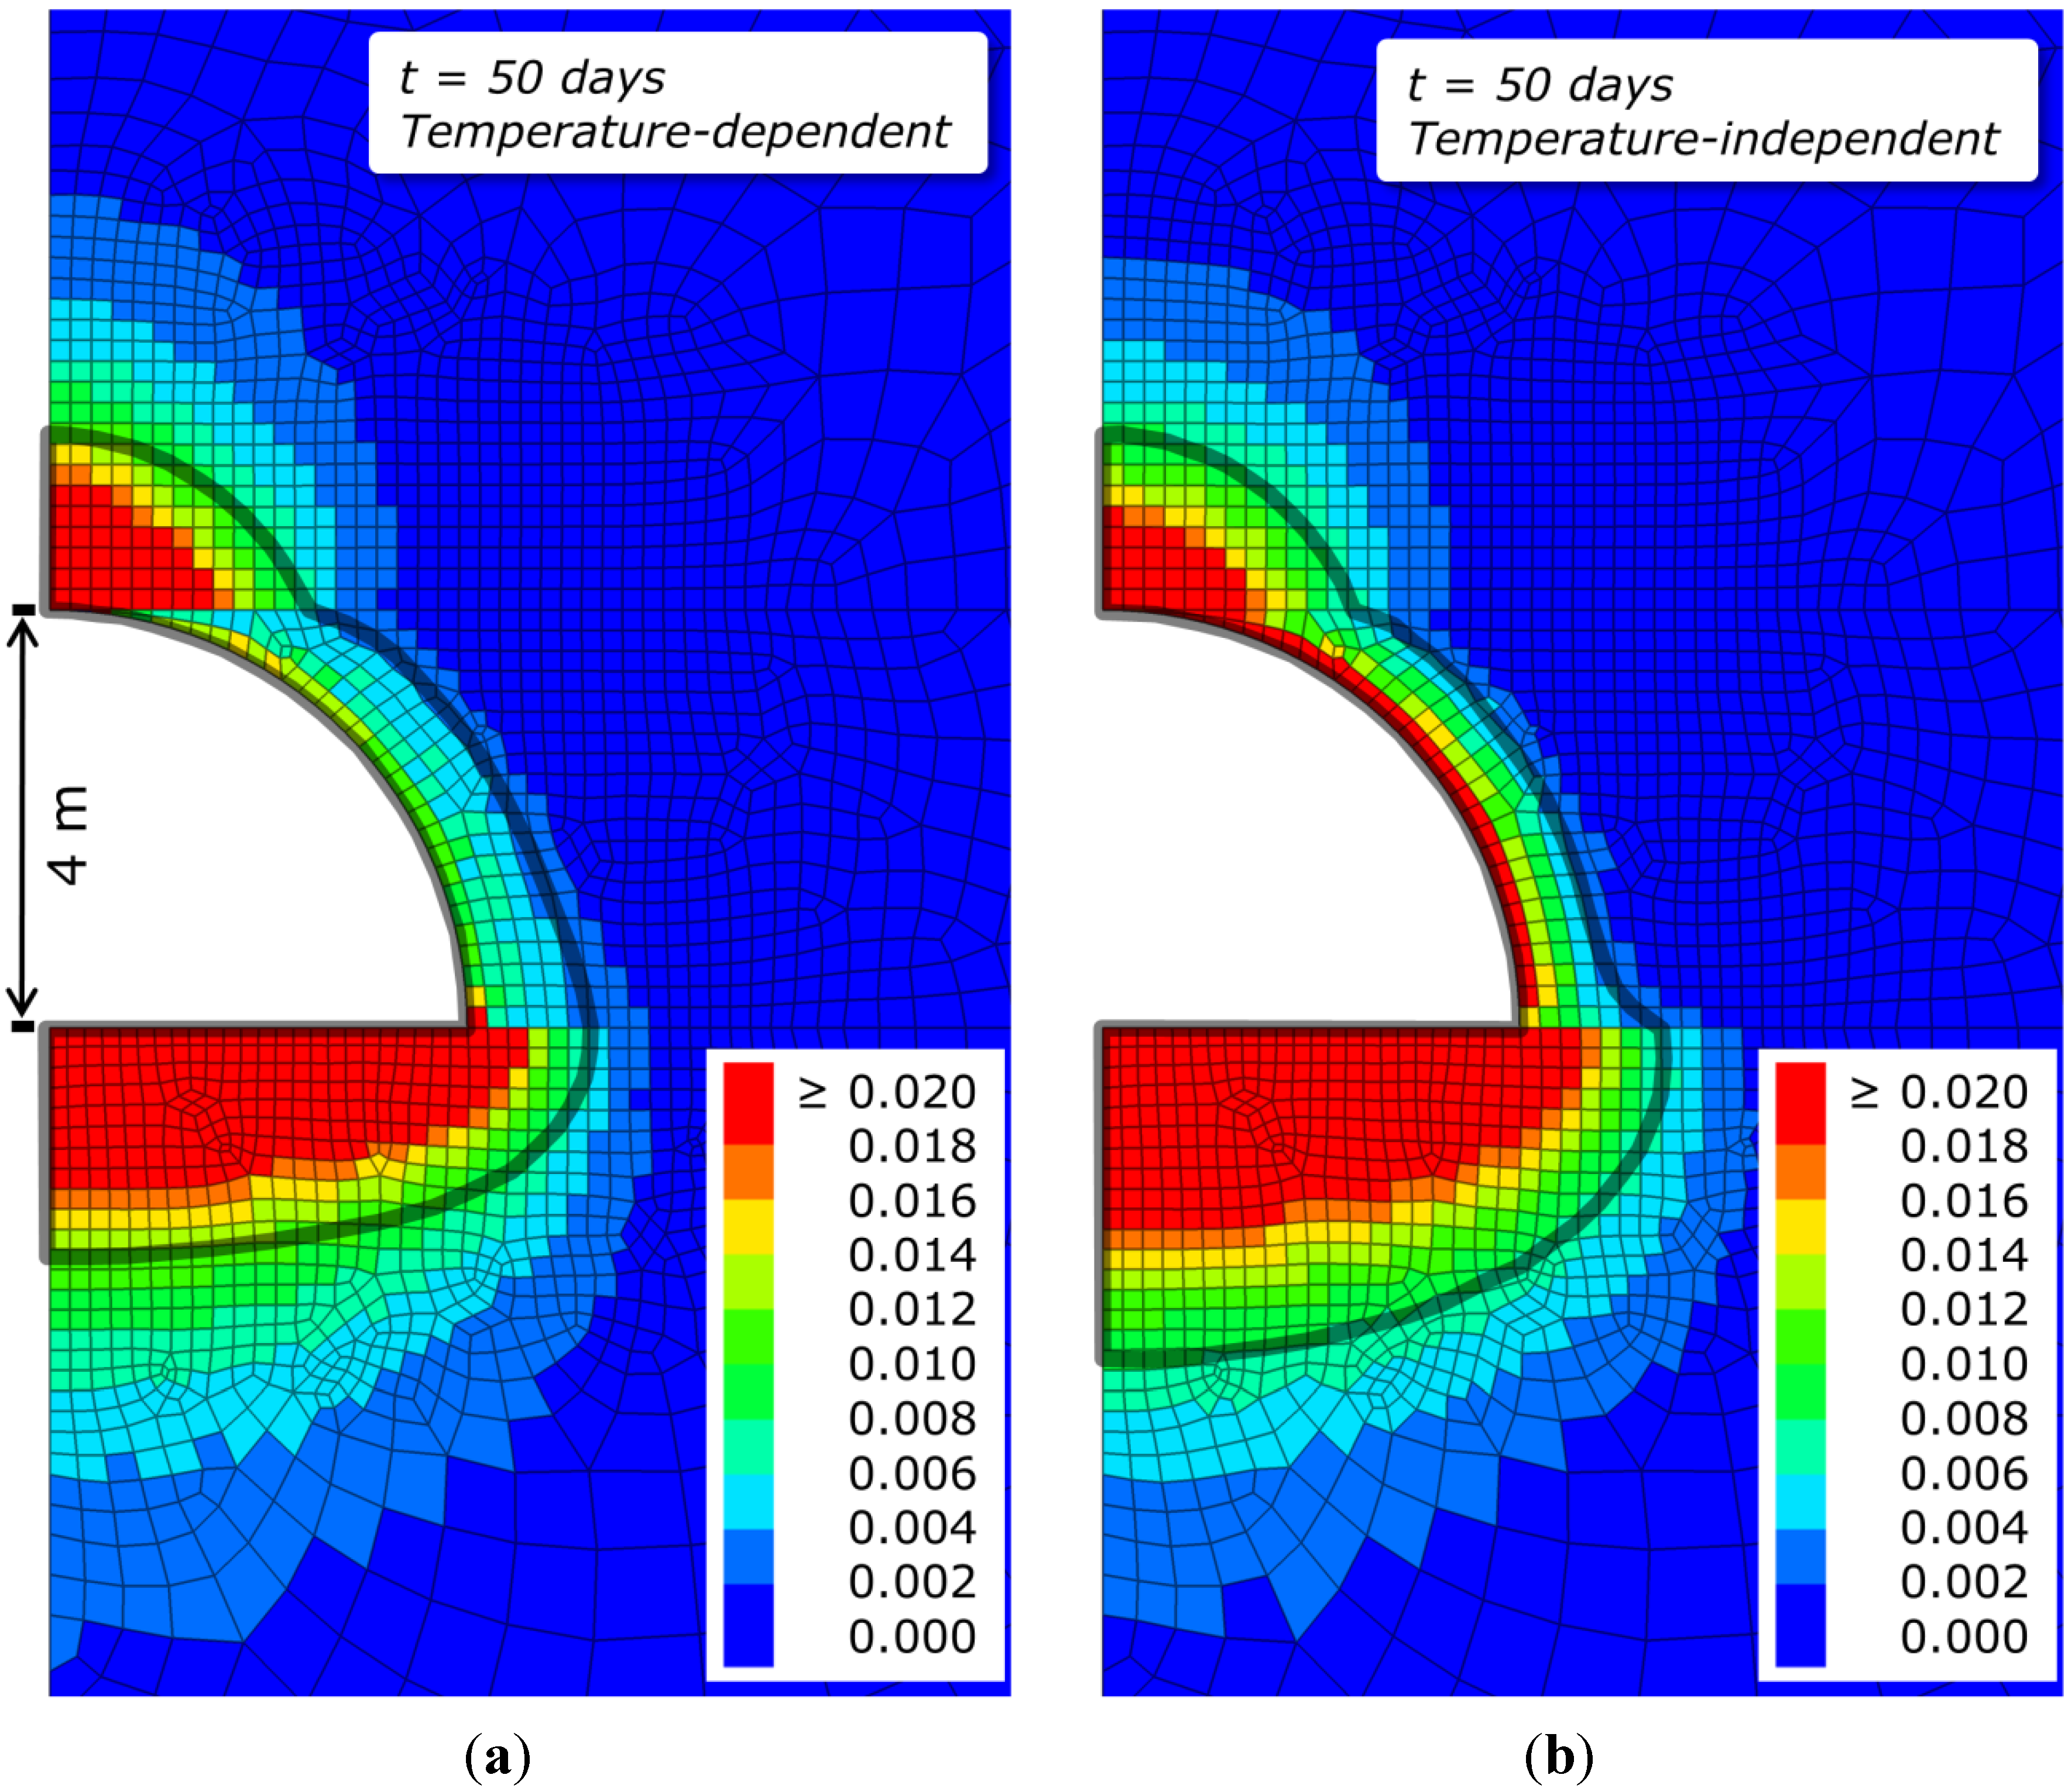
3.3. Distribution of Total Displacements in the UCG Reactor Vicinity

A stepwise reactor zone excavation can minimize the overestimation of mechanical excavation effects (high grid point velocities at the simulation start), and was therefore applied in the displacement analysis considering temperature-dependent and -independent rock and coal parameters. Total displacements after 50 days of simulations show notably higher displacement magnitudes for the stepwise reactor excavation with temperature-dependent compared with temperature-independent material properties. Due to the high temperature present at the reactor boundary, temperature-dependent tensile strength and elastic modulus of coal drop significantly. The coal strength tends towards zero inducing high displacement magnitudes above 0.25 m (Figure 8). The observed vertical distribution of total displacements using temperature-dependent properties is twice as high with more than 0.05 m in the hanging wall. Here, the spatial distributions of the total displacements mainly differ for the coal seam in the lateral extent. Major property changes of coal due to increasing temperature result in a loss of strength, and thus a different displacement pattern. Simulations using temperature-independent parameters show a larger zone of total displacements in the foot wall compared to the temperature-dependent ones. The mechanical properties of sandstone exhibit significantly lower changes with temperature compared to coal and are mainly influenced by the thermal expansion coefficient. Although the trend of this property is increasing with temperature, our sensitivity analysis reveals rather minor changes (2–4 mm) in total displacements.
Figure 8. Distribution of total displacements of surrounding rocks in the UCG reactor vicinity after stepwise reactor zone excavation with (a) temperature-dependent properties and (b) temperature-independent material properties after 50 days of simulation. The grey solid line represents the 200 °C isotherm.
Energies 08 05800 g008

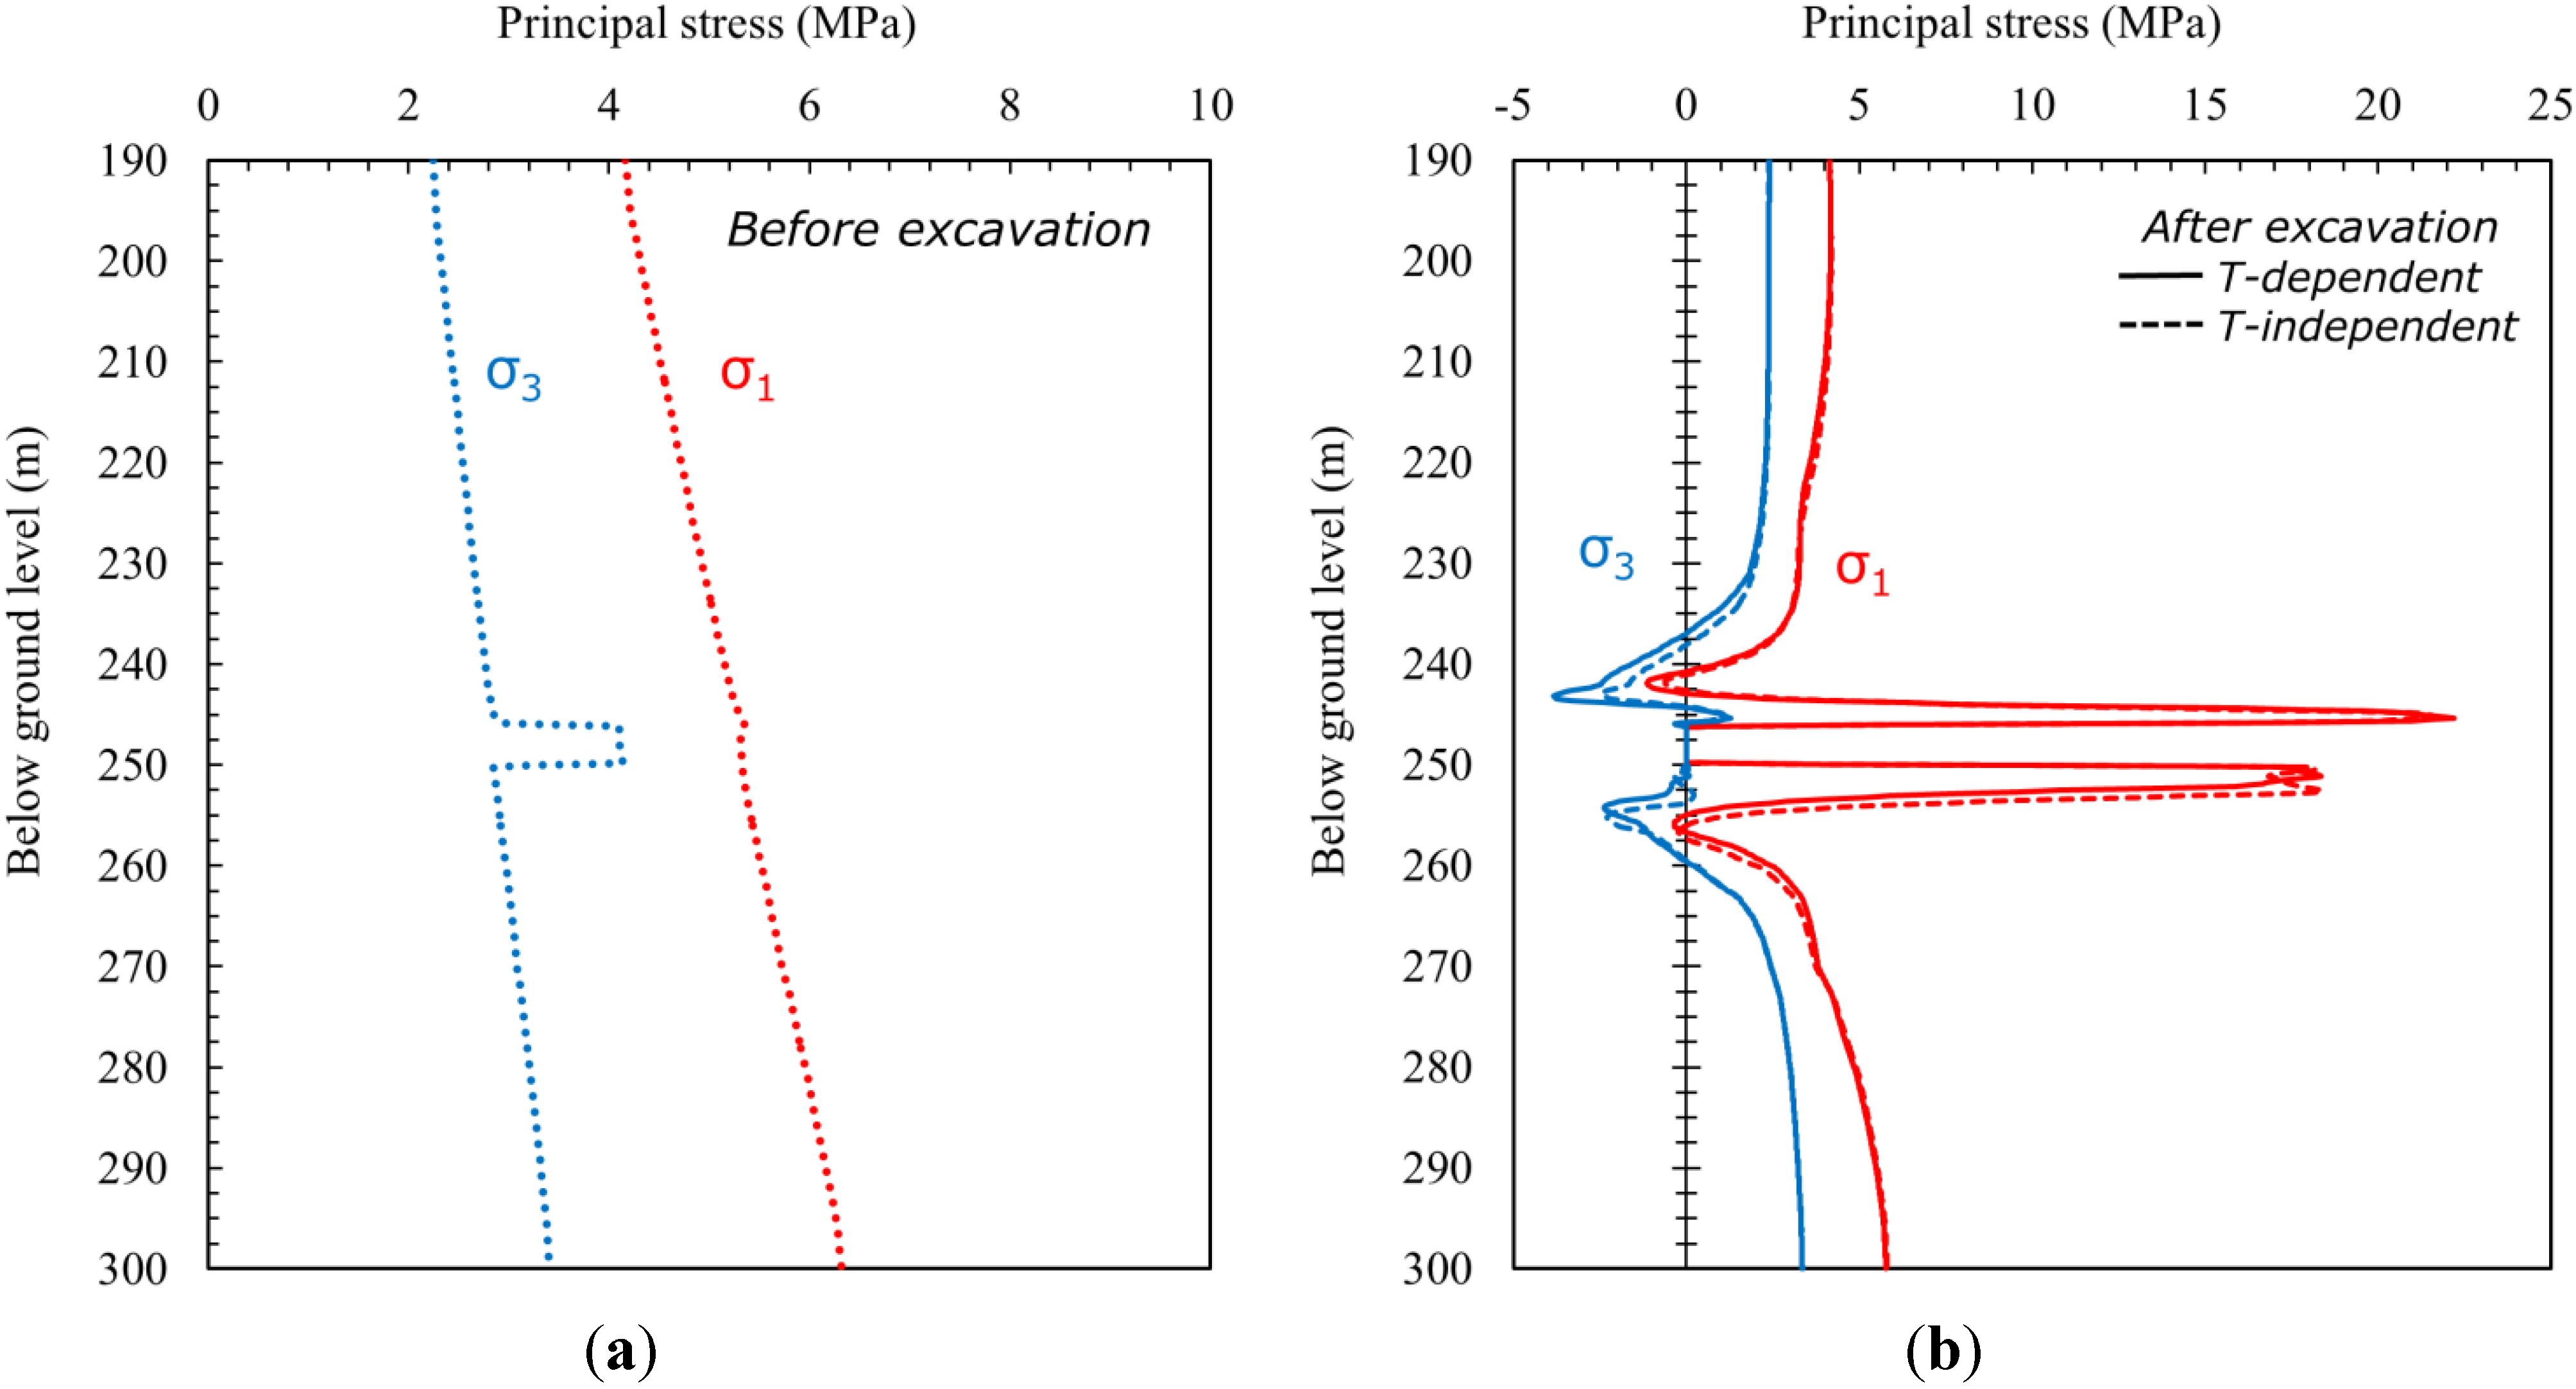
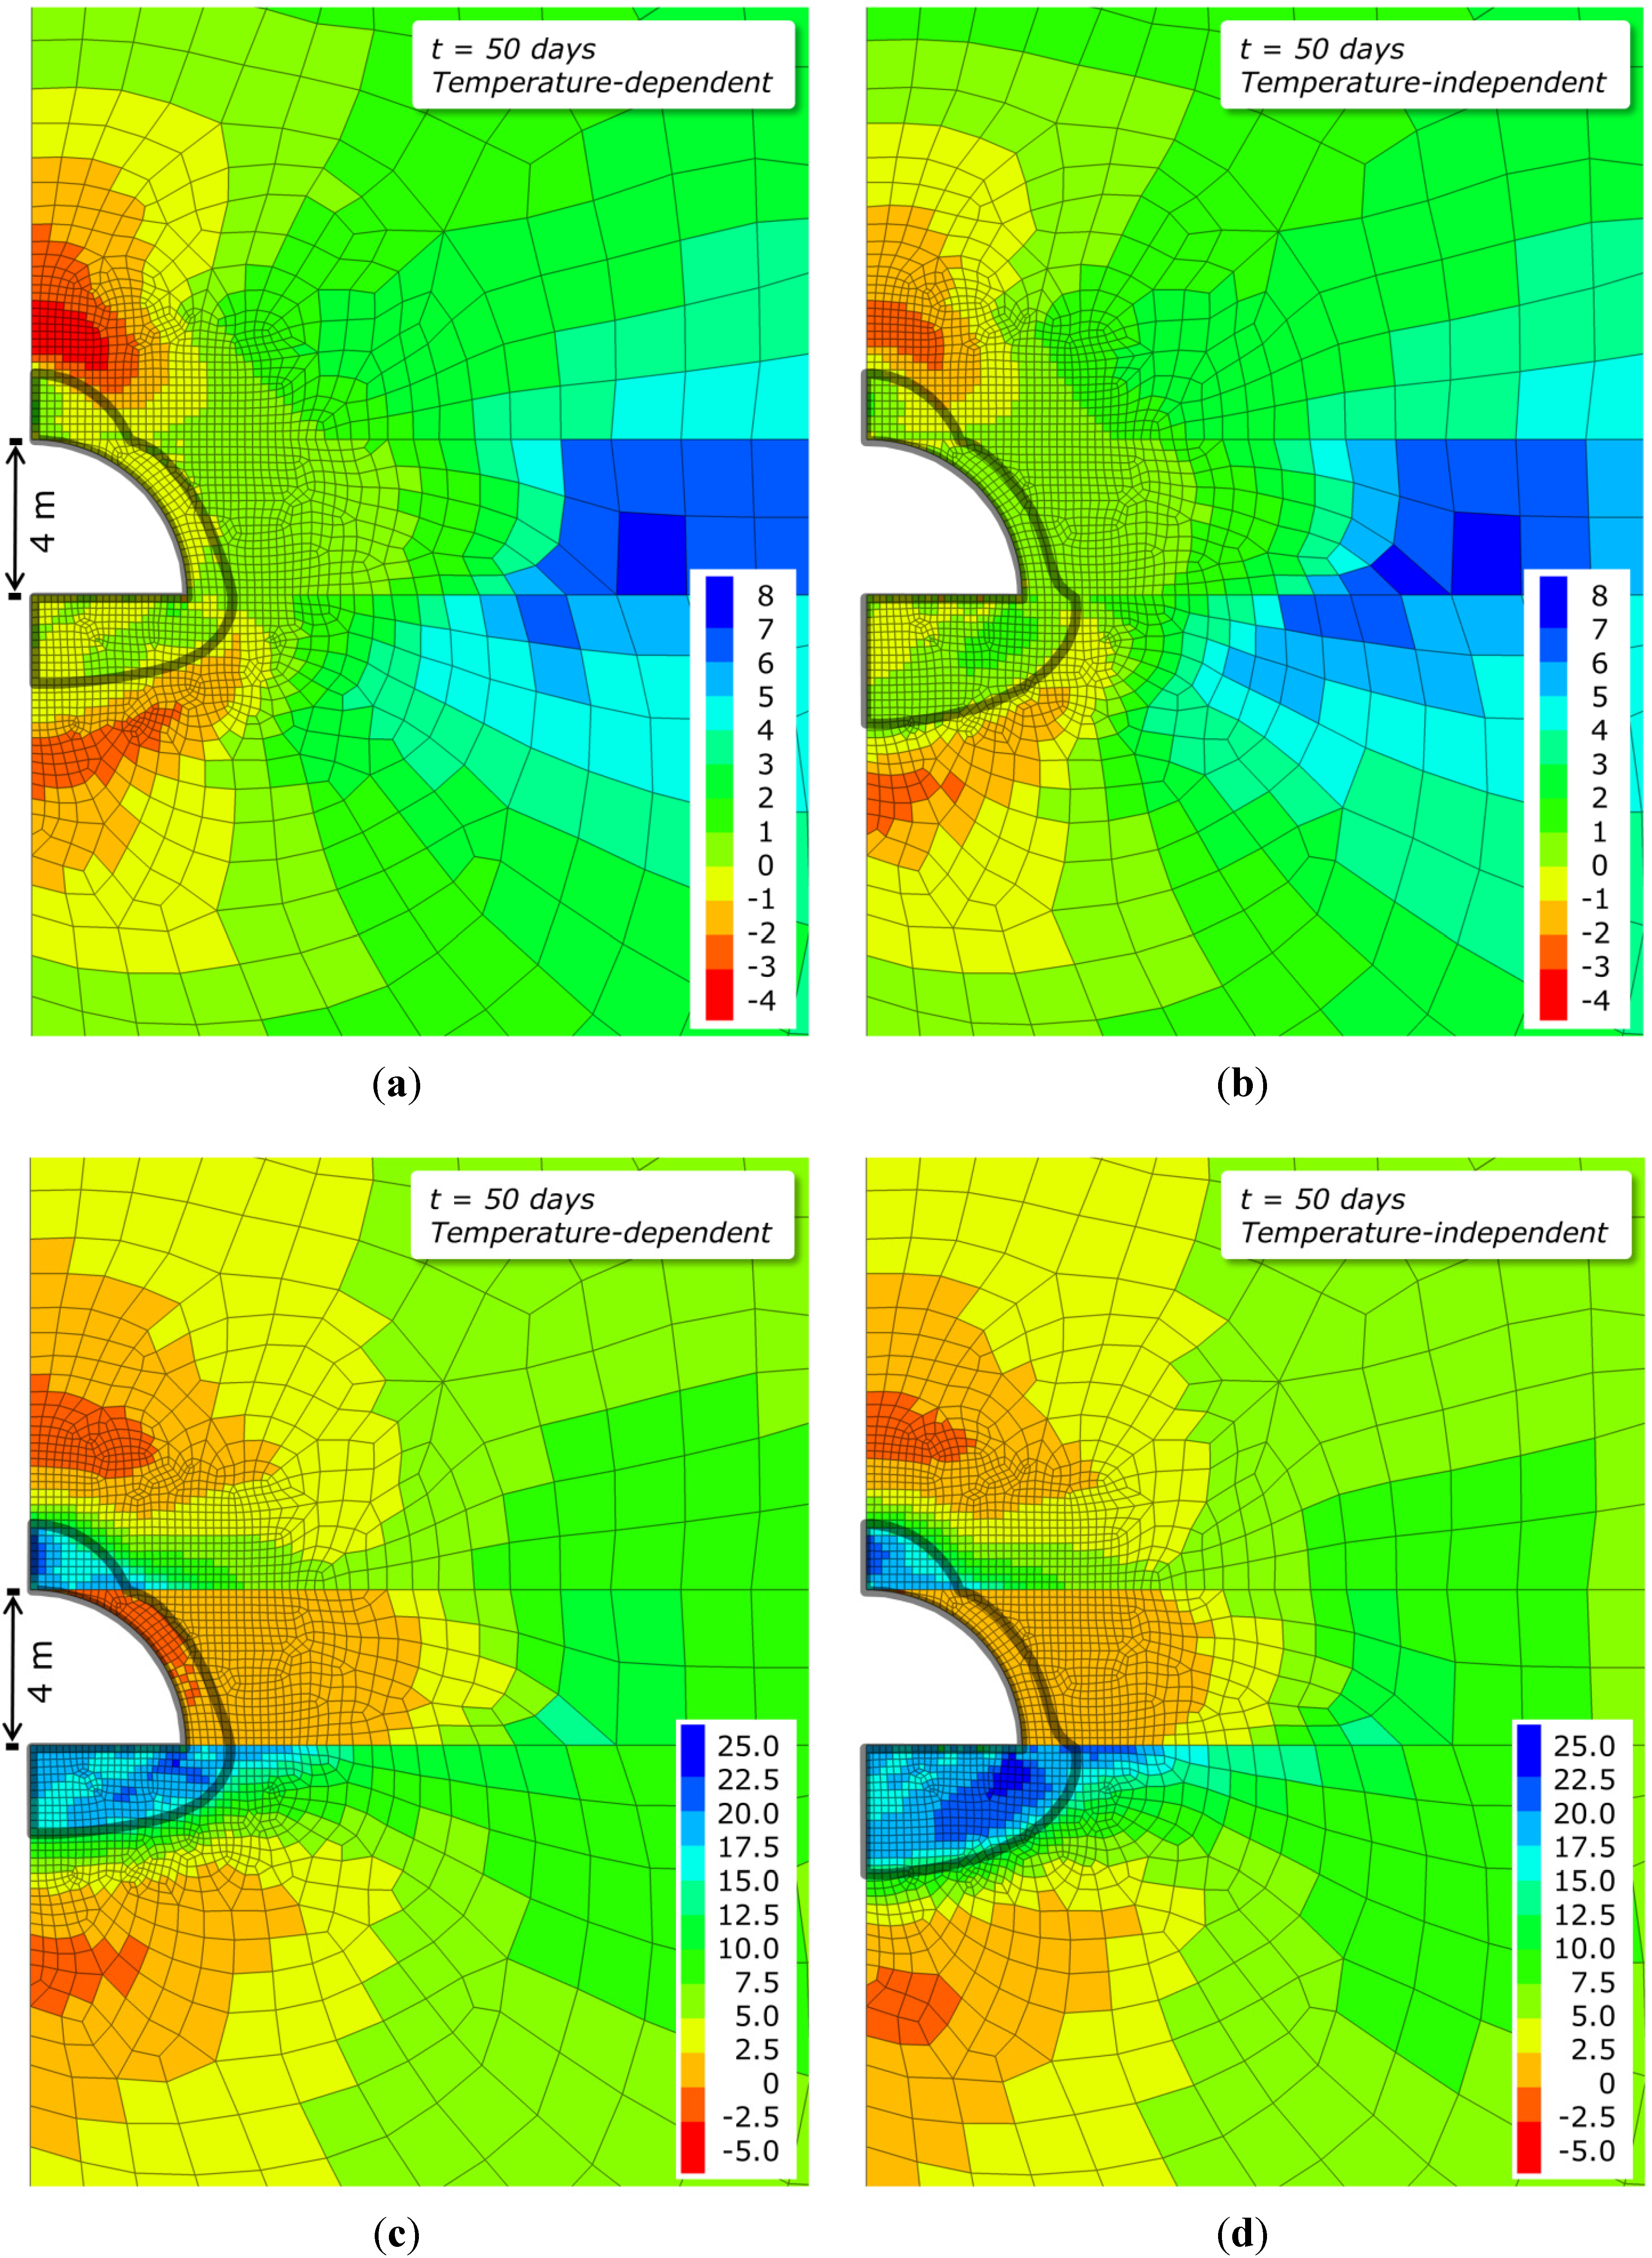
3.4. Principal Stress Distribution in the UCG Reactor Vicinity

During the UCG process, the experienced high temperatures generate a high thermal gradient of limited spatial extent for temperature-dependent as well as -independent properties, and thus induce thermal stresses in the surrounding rock masses. Rock strength and behavior under high temperatures differ notably from those at initial conditions. Therefore, the assigned thermo-mechanical parameters in the model are essential to analyses of stress distribution in the reactor vicinity. The present simulations were carried out neglecting pore pressure, and thus pore fluid heat capacity and thermal conductivity were not taken into account. Figure 9 shows the vertical profiles of the minimum (σ3) and maximum (σ1) principal stresses along the horizontal reactor center from the model top to its bottom (190–300 m below ground level), after reaching the state of equilibrium (before excavation) and after 50 days of simulation (following the excavation). The initial principal stresses increase linearly with depth and show a significant peak in the coal seam region due to the coal’s higher Poisson’s ratio. The maximum principal stress after the excavation is in the order of 20 to 22 MPa for temperature-dependent and -independent parameters. A significant stress increase in the sandstone surrounding the reactor develops due to the excavation process and temperature effects.
Figure 9. Profile of maximum (σ1 = σV) and minimum (σ3 = σH) principal stresses at the left model boundary plotted against depth (a) before excavation (initial stress state) and (b) after 50 days of simulation with temperature-dependent and -independent parameters.
Energies 08 05800 g009
The rock plasticity behavior is shown and discussed in detail below; however, local stress field changes occur, if rock strength (Table 1) is exceeded. Figure 10 shows the distribution of the minimum and maximum principal stresses in the reactor vicinity. An arching effect evolving due to a temperature-induced reduction in coal strength in the close reactor vicinity shifts the main load-bearing section of the coal seam to about 10 m lateral distance from the reactor boundary, where a minimum principal stress of 8 MPa (compressive regime) is observed (Figure 10). The same lateral stress-pattern is found for temperature-dependent and -independent properties. For the temperature-dependent simulation, in response to changes in the stress field of the growing reactor zone and increase in spatial temperature distribution, minimum principal stresses are in the order of −4 MPa (tensile regime) above the cavity. Although stress differences are in the order of maximum 2 MPa in the affected region above the reactor, pure tensile failure is observed in the simulations for temperature-dependent simulations only (Figure 11a). Due to the lower temperature distribution below the reactor, the temperature-induced stress increase is overestimated for the simulation using temperature-independent parameters.
Apart from the differences in principal stresses above and below of the reactor vicinity, stress changes are negligible in simulations using temperature-dependent and -independent parameters. However, stress distribution is strongly dependent on the reactor growth and design, and therefore may induce higher impacts with temperature-dependent parameters for UCG channel or even parallel multi-channel design.
Figure 10. Minimum (σ3 = σH) principal stress (in MPa) with (a) temperature-dependent and (b) -independent properties and maximum (σ1 = σV) principal stress (in MPa) with (c) temperature-dependent and (d) -independent properties after 50 days of simulation. The grey solid line represents the 200 °C isotherm.
Energies 08 05800 g010
Figure 11. Distribution of shear and tensile rock failure experienced by rocks surrounding the UCG reactor after stepwise reactor zone excavation with (a) temperature-dependent and (b) -independent properties after 50 days of simulation. The grey solid line represents the 200 °C isotherm.
Energies 08 05800 g011

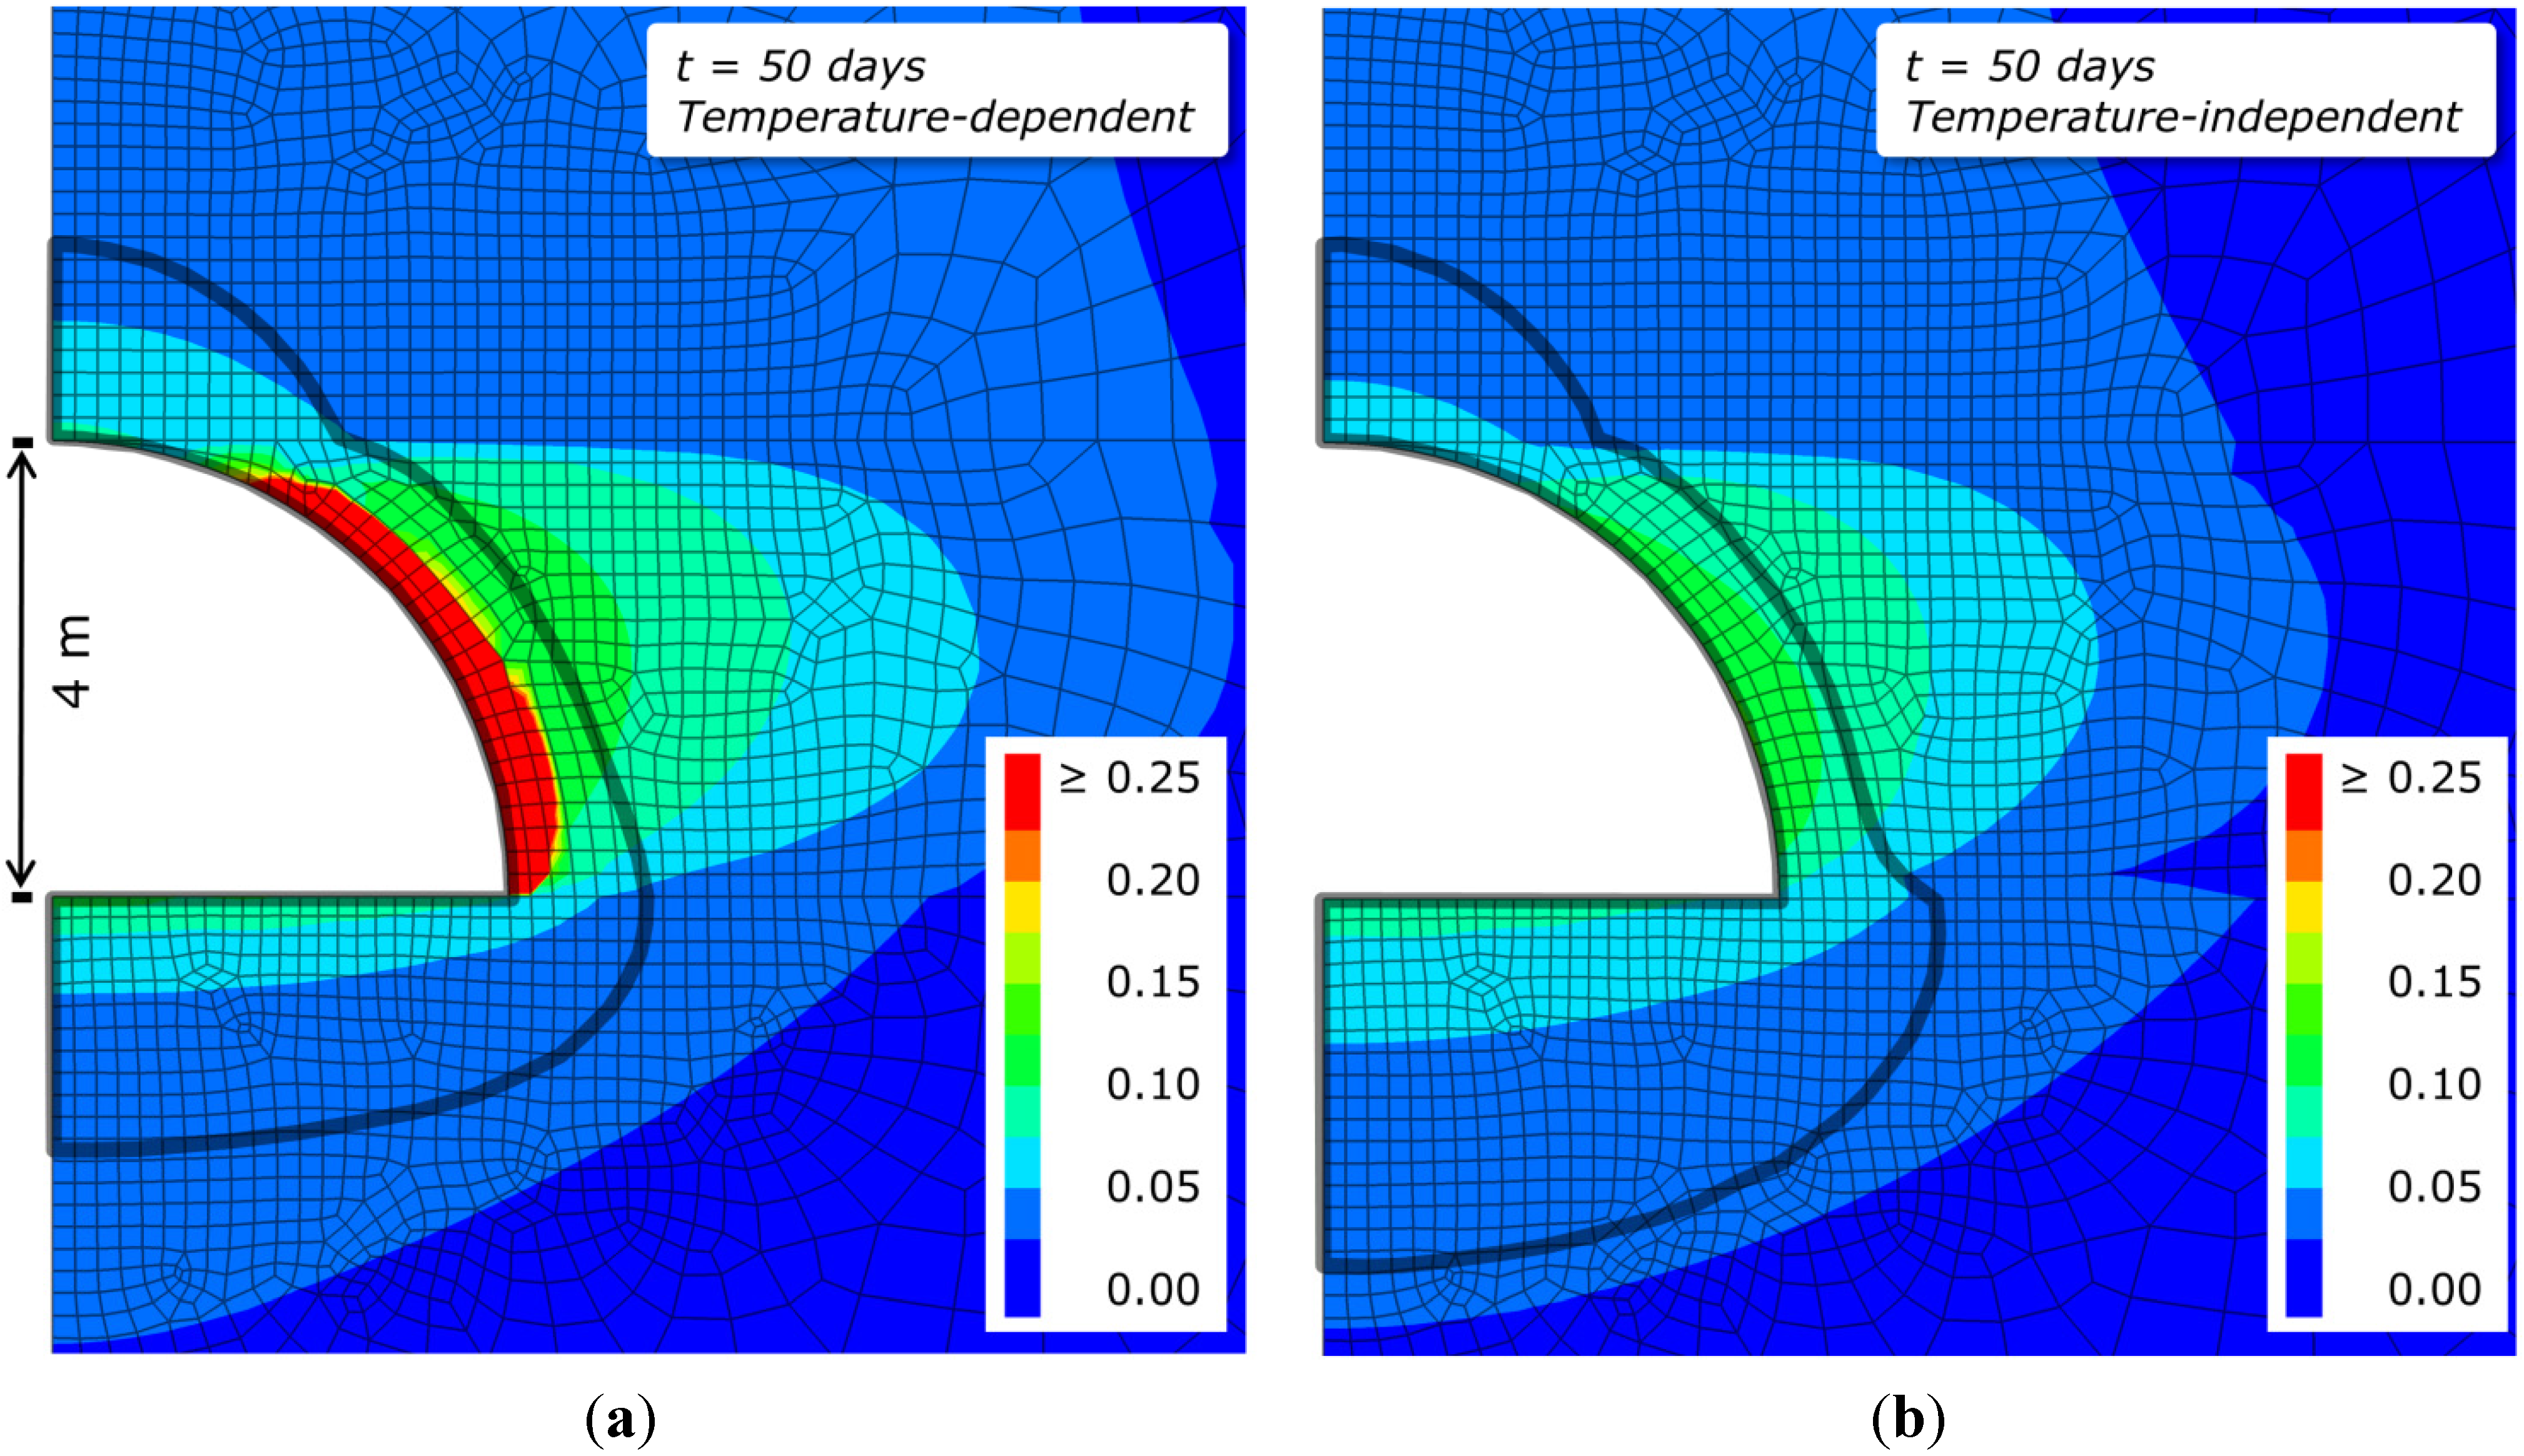
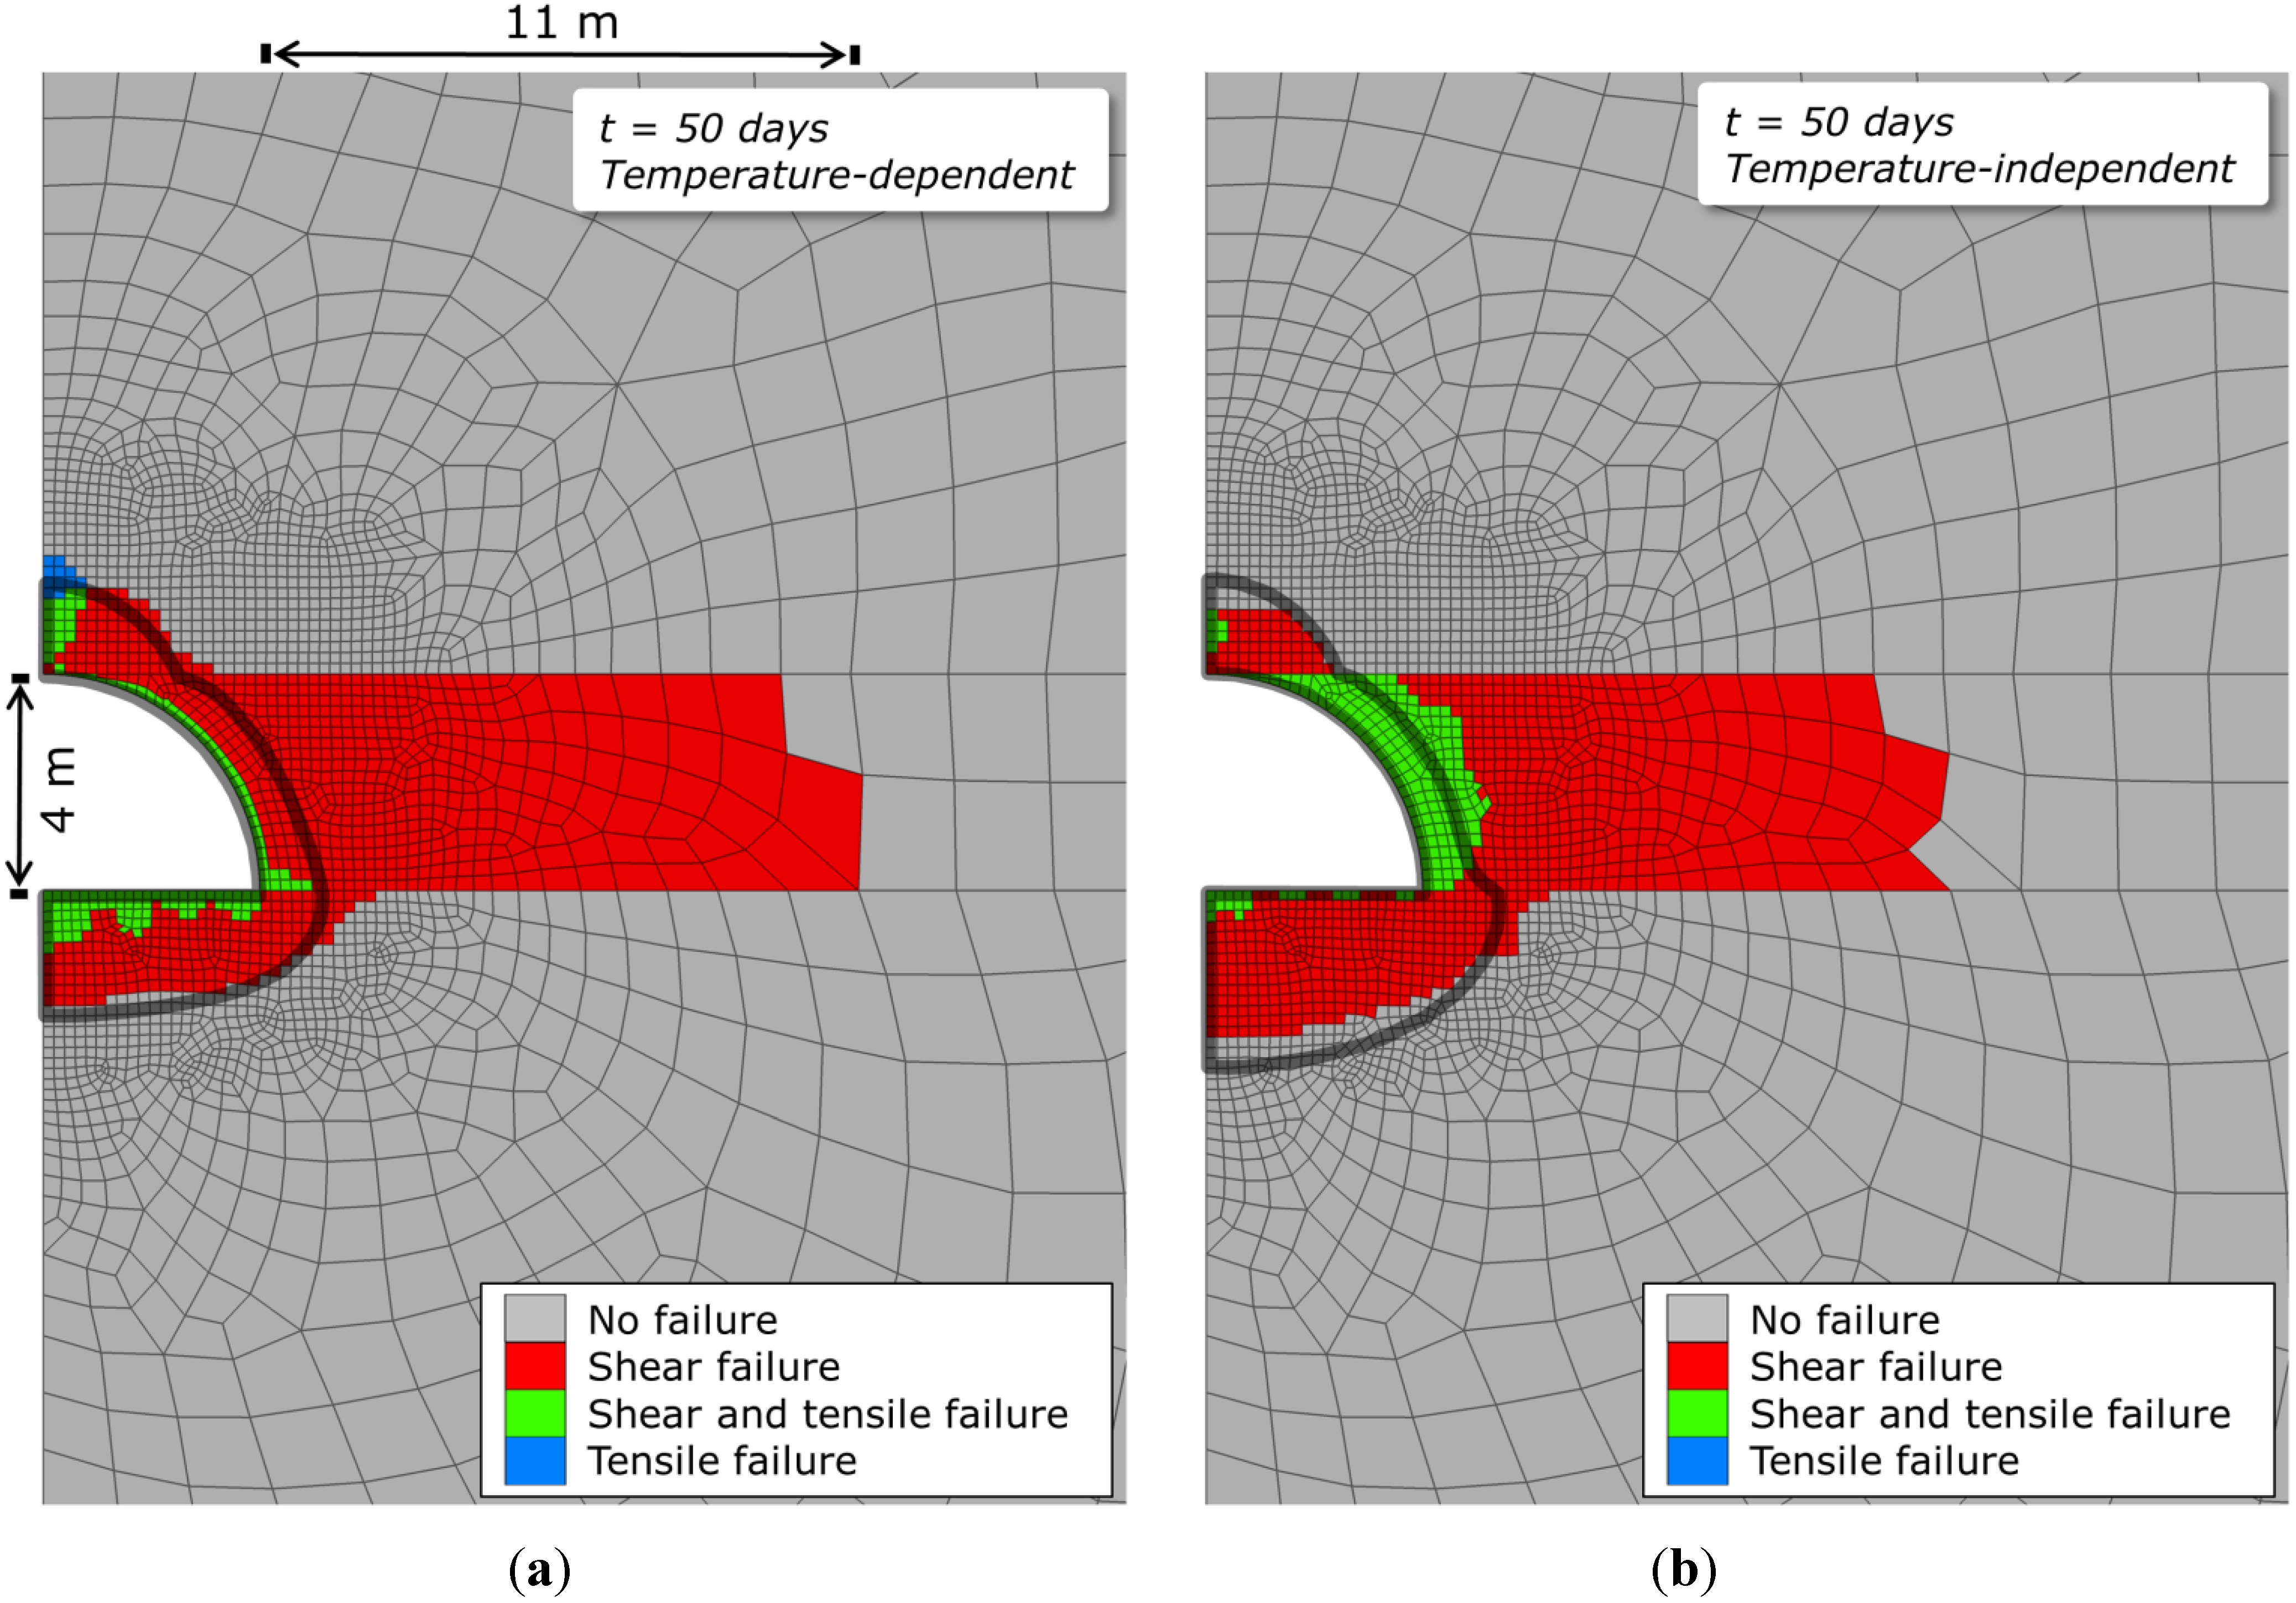
3.5. Plasticity Behavior of Rocks Surrounding the UCG Reactor

In the numerical computation, the Mohr-Coulomb failure criterion is applied, which can be expressed as:
τ = σ n tan ( ϕ ) + c
Where τ is the rock shear strength; σn the effective normal stress; and c and ϕ the cohesion and internal friction angle, respectively. If failure in the rock matrix occurs, the stress state for that element is recalculated and the updated stress state then applied for further failure assessment. Shear and tensile failure (green) dominate at the reactor boundary after 50 days of simulation, followed by a region of pure tensile failure (blue) (Figure 11a). Tensile failure mainly occurs in the hanging wall above the reactor, and is dominant in the simulation using temperature-dependent parameters. This region is strongly influenced by the increase in temperature, and thus reduced rock strength and associated changes in stresses as plotted in Figure 9 and Figure 10. Coal mainly experiences shear failure (red) exhibiting about three times the length of the coal seam thickness in the simulations with and without temperature-dependent parameters (Figure 11). The region of shear failure is determined by stress changes induced by excavation effects. If coal is heated, it becomes softer and plasticity increases allowing for higher displacements and volumetric strain increments. However, the temperature increate is limited to the close reactor vicinity (about 2 m in maximum for for simulations using temperature-dependent parameters) due to the lower thermal conductivity of coal compared with sandstone at temperatures below 600 °C.

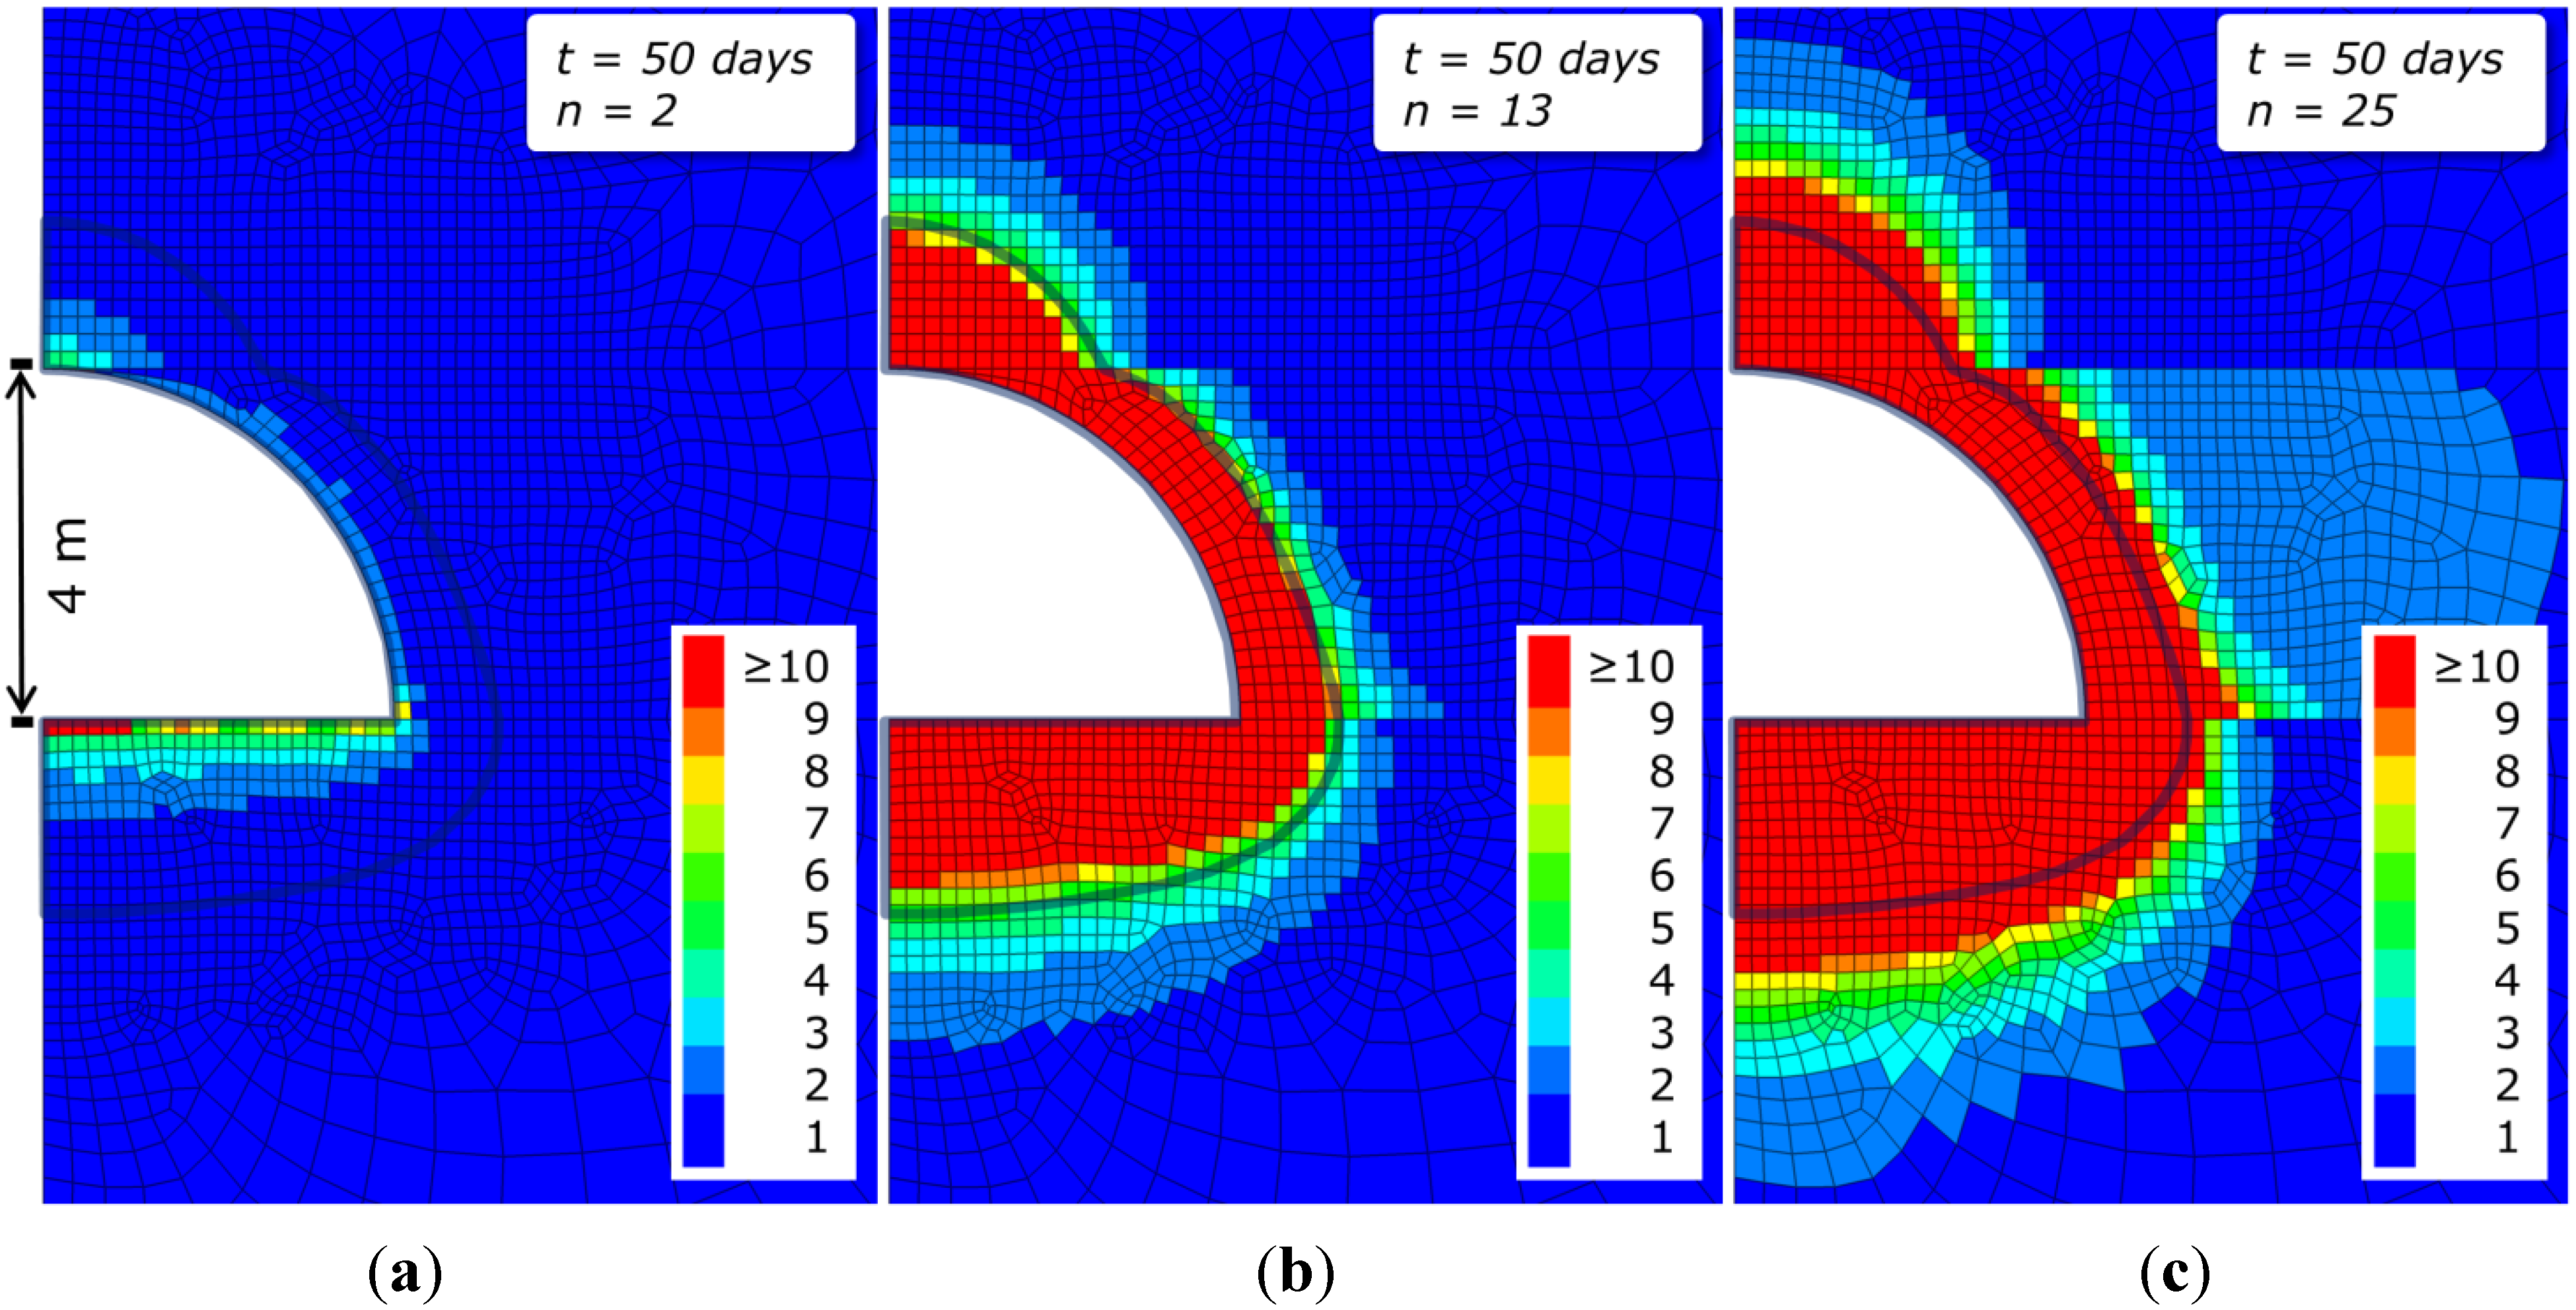
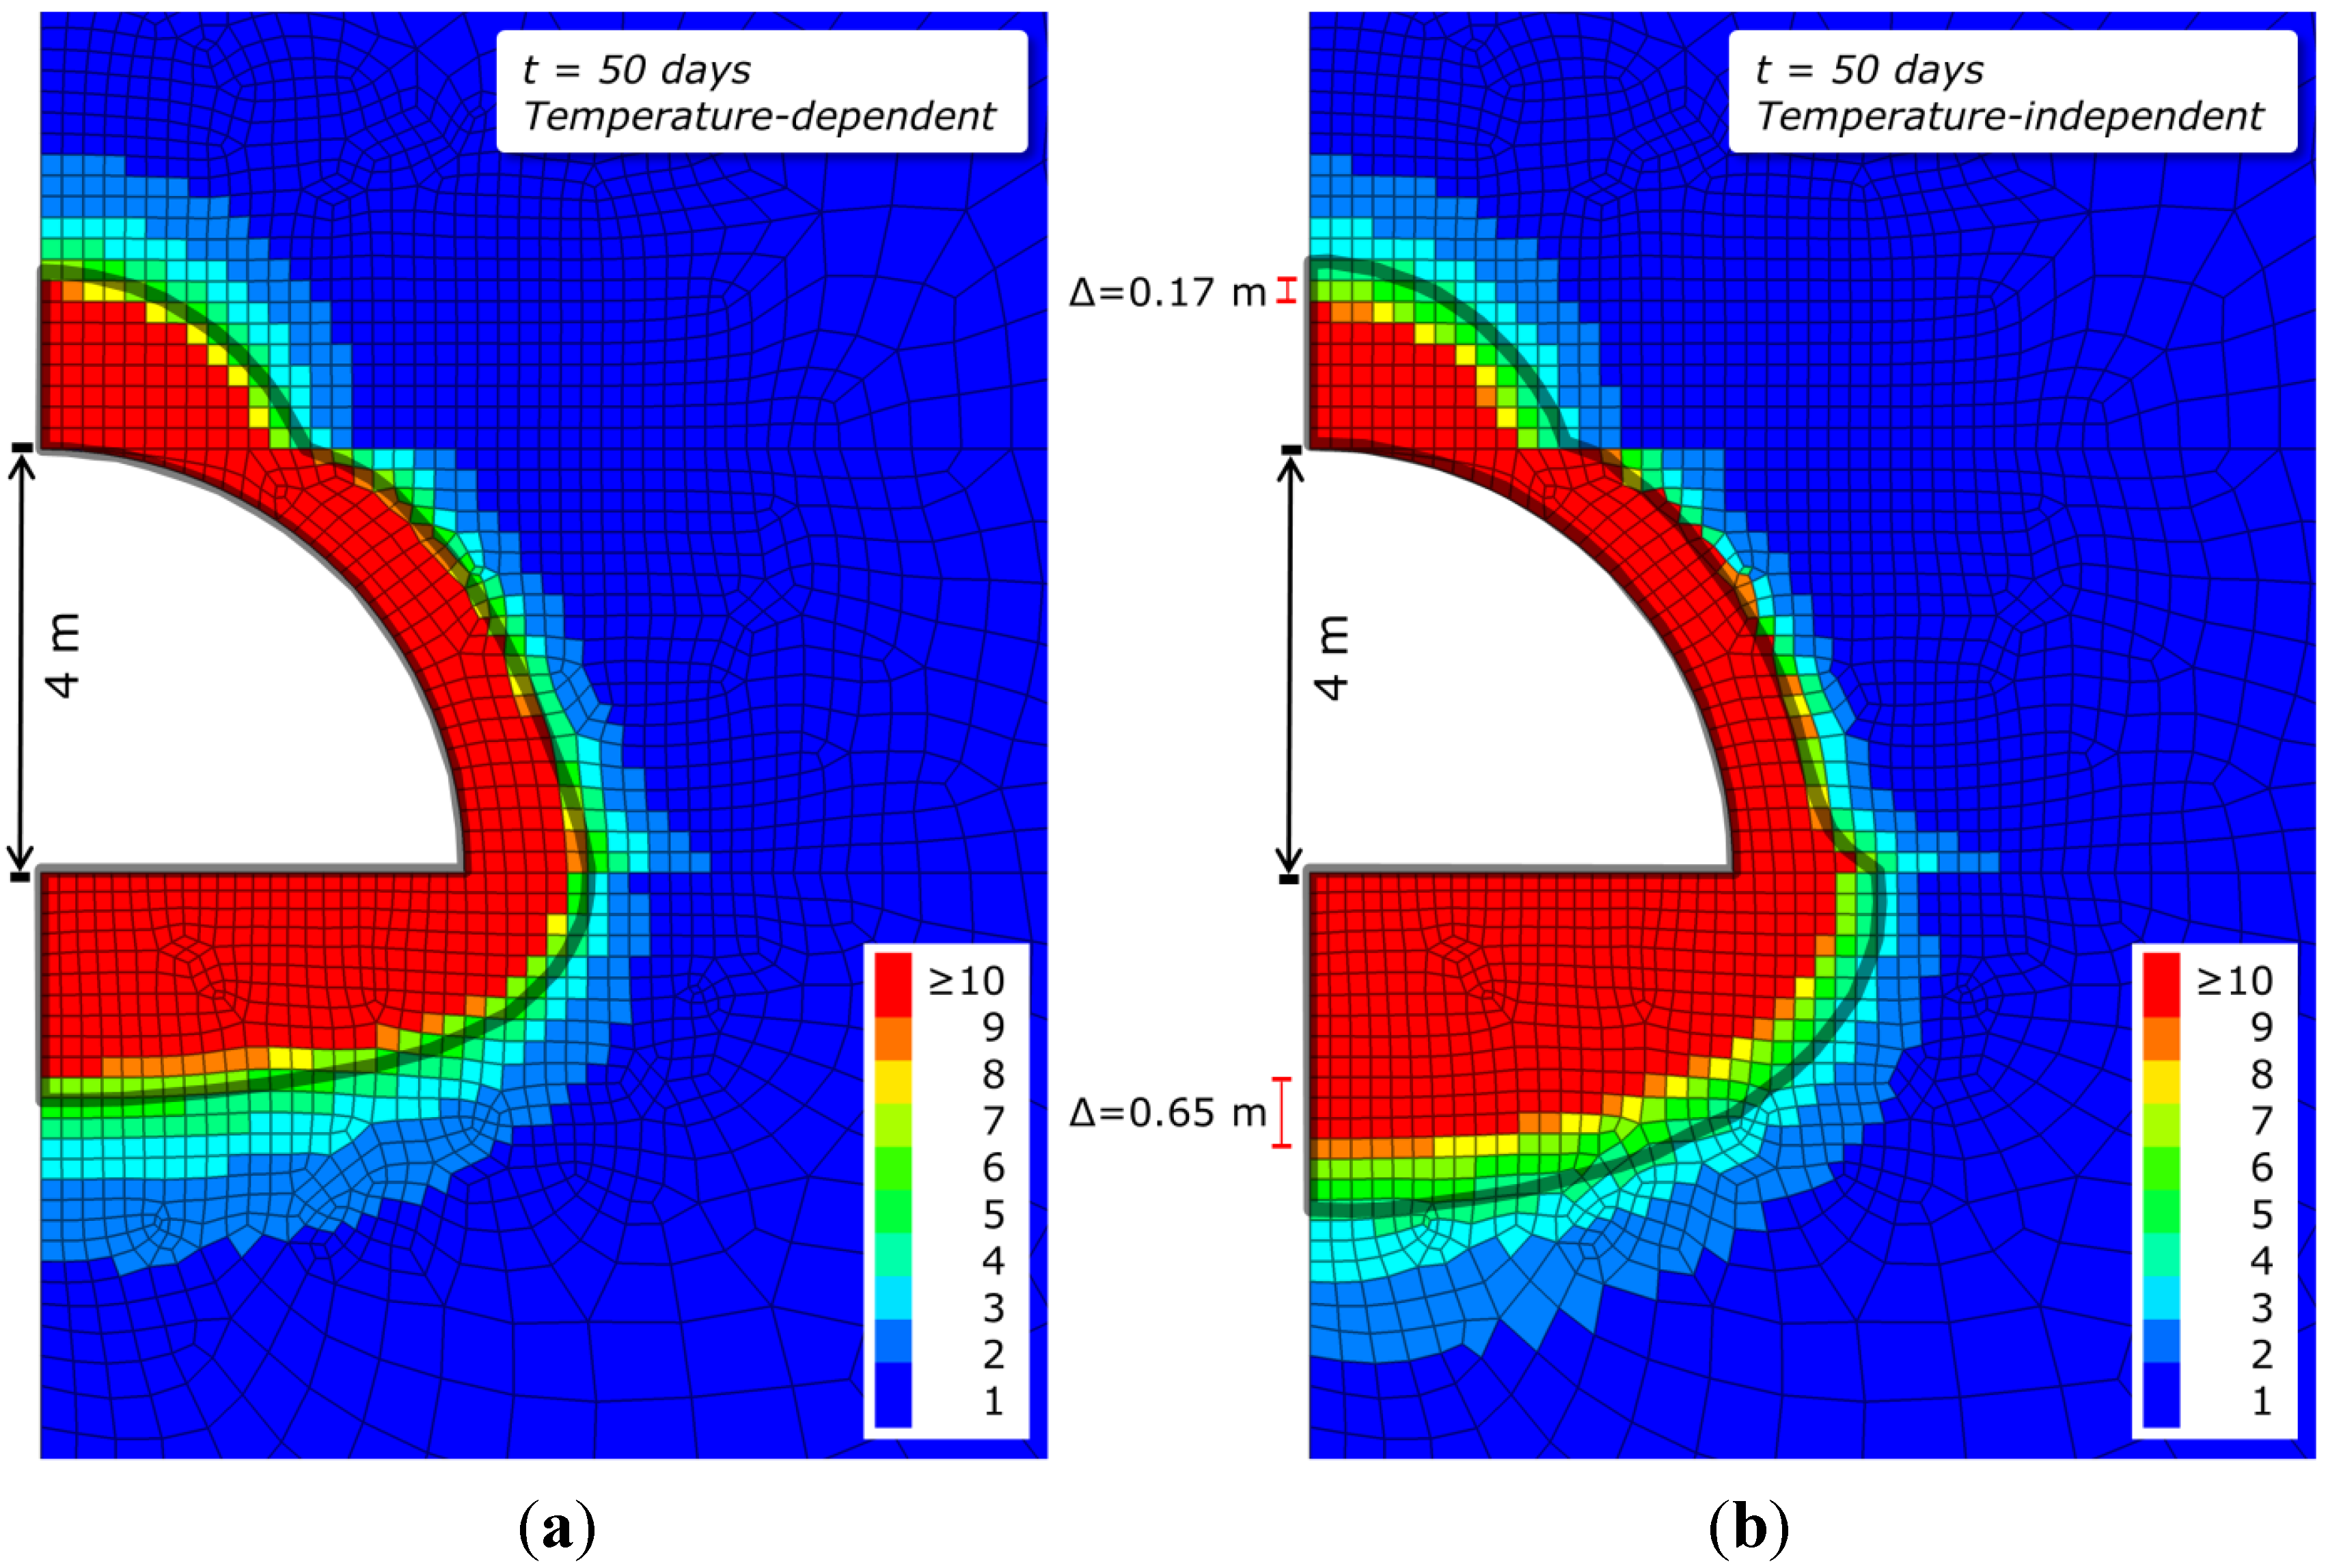
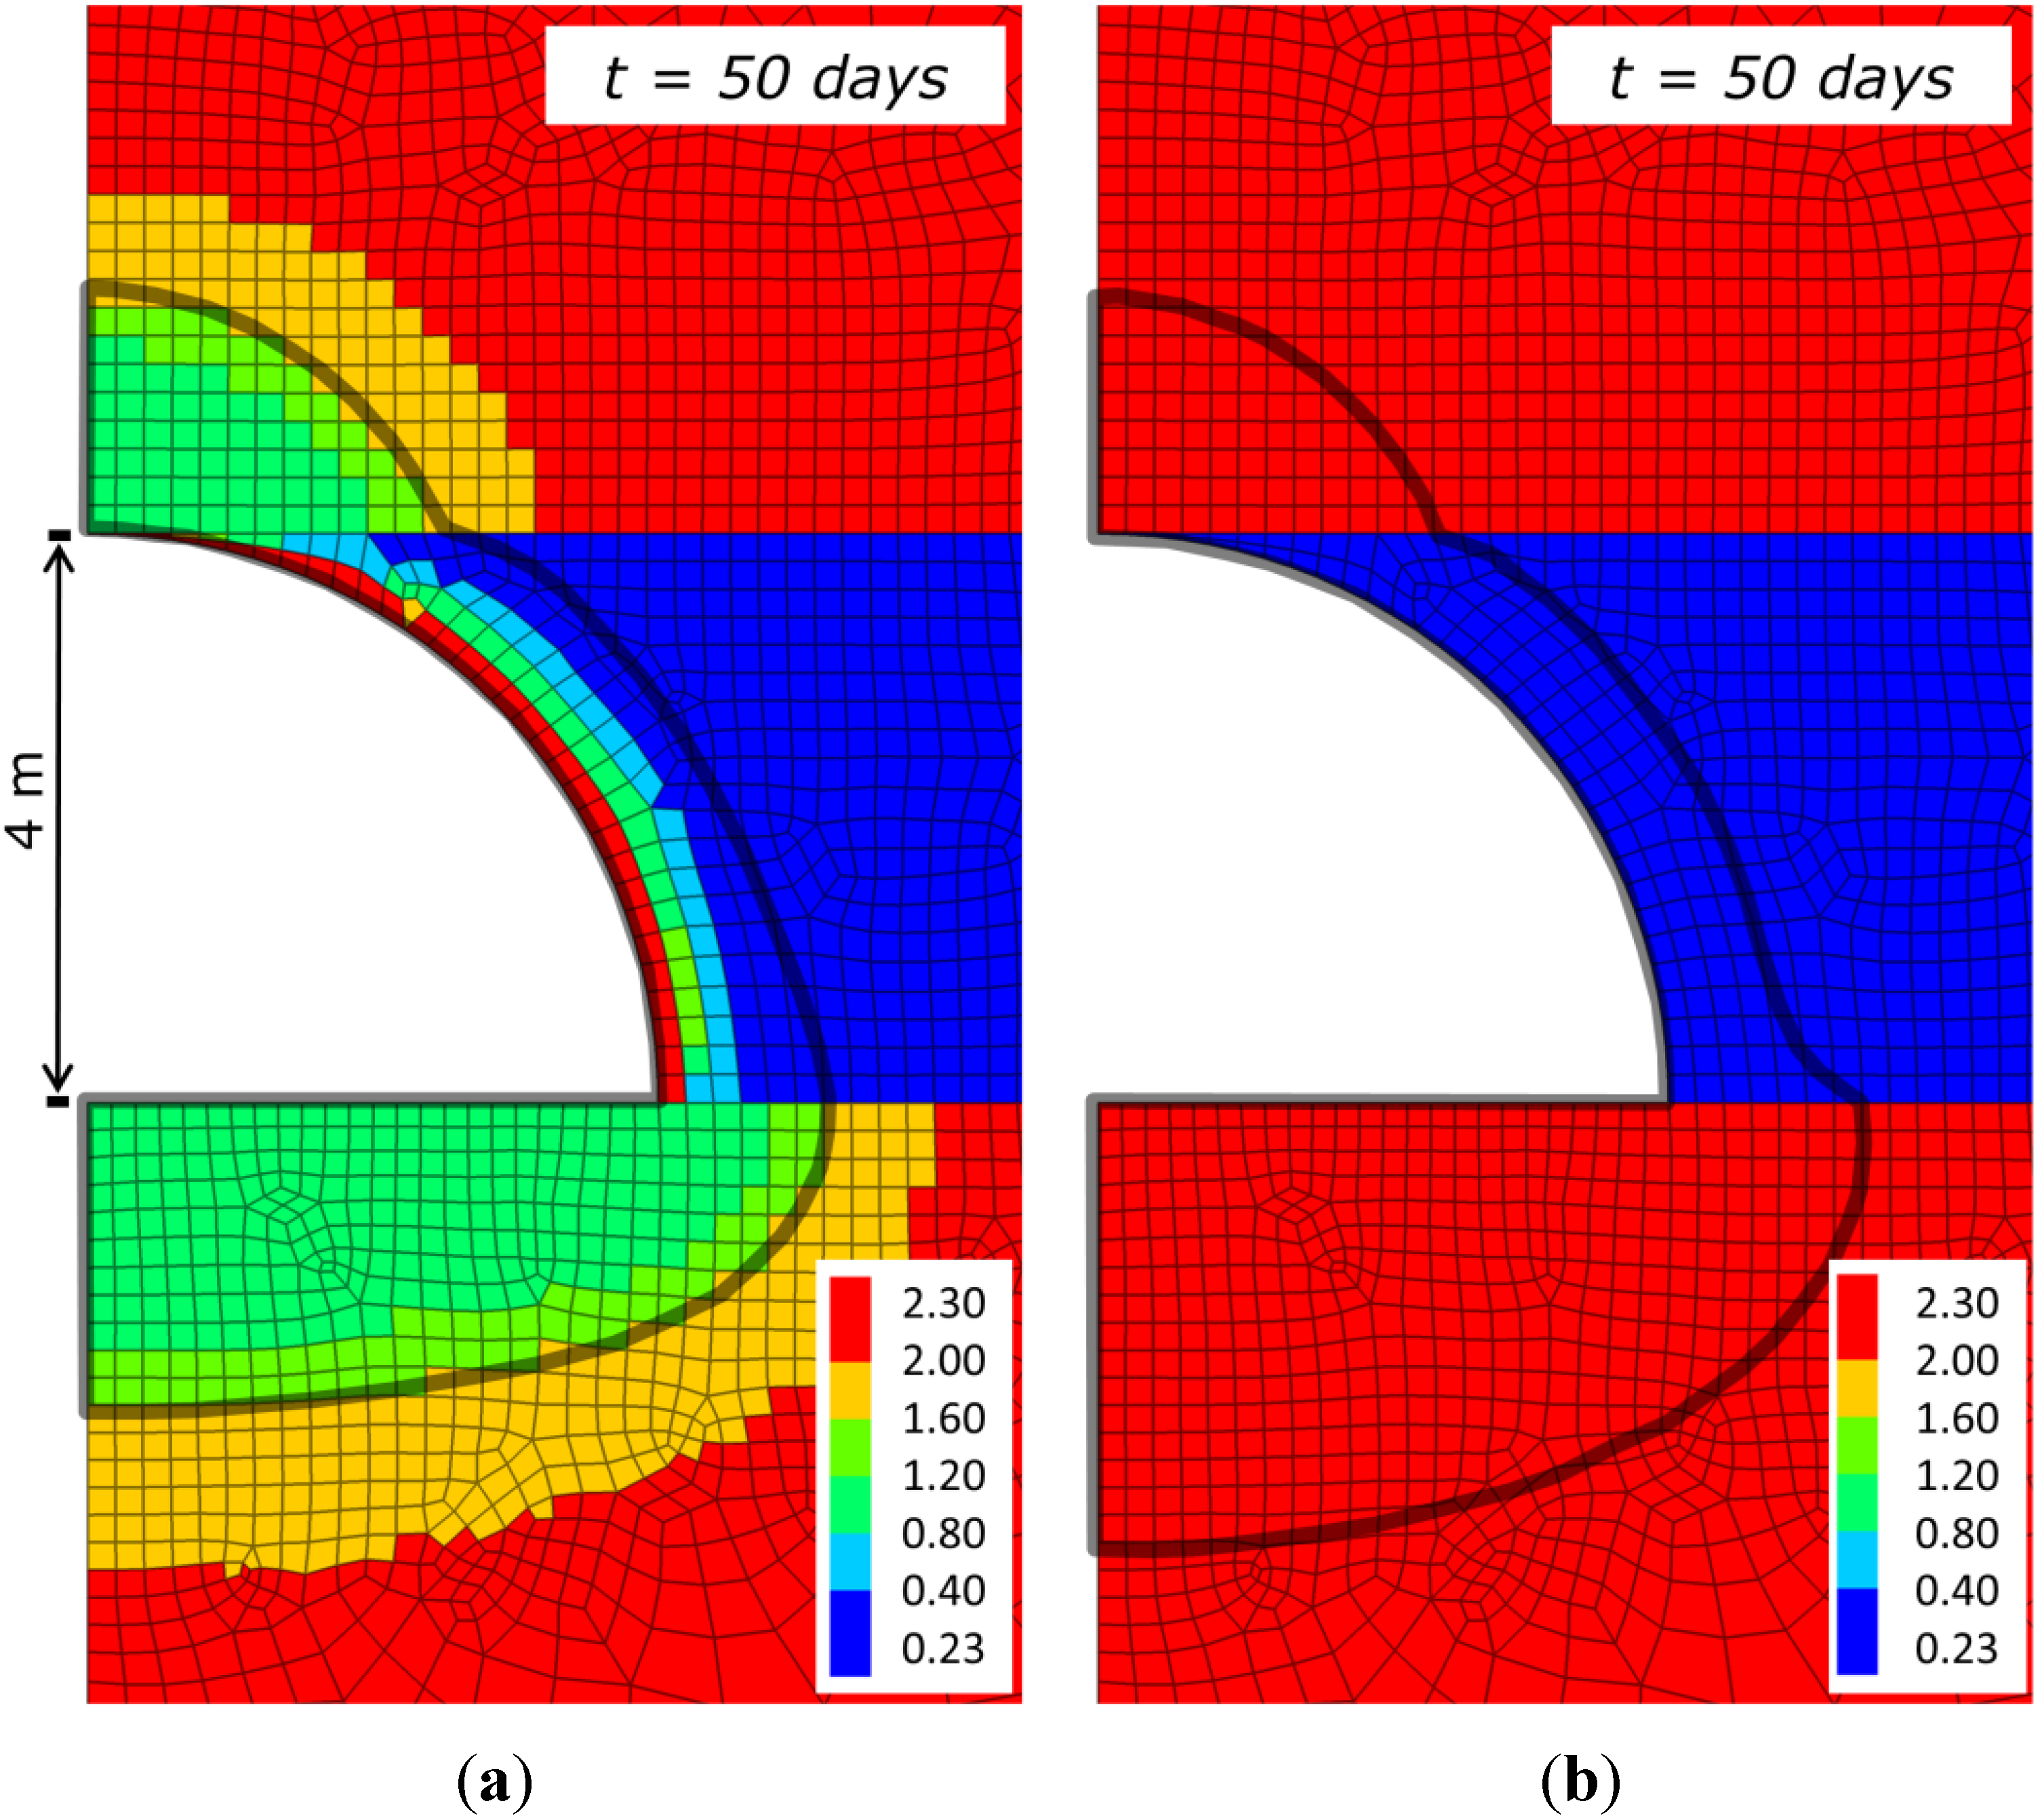
3.6. Permeability Distribution in Rocks Surrounding the UCG Reactor Vicinity

The distribution of temperature and stresses in the UCG reactor vicinity is of utmost interest for the mechanical rock behavior and stability as well as the development of spatial permeability distribution in time. The latter may affect the potential flow of gasification educts and products as well as of fluids present in the reactor vicinity potentially determining the gasification process efficiency. Figure 12 shows the resulting volumetric strain increment distribution around the reactor after 50 days of simulation and the corresponding high temperature field (≥200 °C) distribution for simulations using temperature-dependent and temperature-independent material parameters.
Figure 12. Distribution of positive volumetric strain increments with (a) temperature-dependent and (b) -independent properties in UCG reactor vicinity. The grey solid line represents the 200 °C isotherm.
Energies 08 05800 g012
The magnitude of spatial changes in volumetric strain increments correlate with those of temperature increase (≥200 °C) for both simulation runs. However, this is discussed later in this manuscript. Elements exhibiting more than 2% volumetric strain increment are highlighted in red in Figure 12. The magnitude and distribution of volumetric strain increments cannot be directly compared to the total displacements presented in Figure 8, which are accumulated displacements at each gridpoint of the model; volumetric strain increments are the sum of the elastic and plastic components of strain of each element. Furthermore, the implemented model considers the different porosity data assigned to the coal and sandstone units, used in the calculation of permeability changes.
For the assessment of permeability changes, normalized permeabilities with an initially uniform distribution in the model were applied, while average rock-specific porosity values were derived from literature and assigned to the respective units (Table 2) [54]. Based on the calculated volumetric strain increments, the new permeability distribution is derived using Equation (2). Depending on the porosity and grain size of sandstones tested by David et al. [74] and Yale [75], these exponents are ranging from 2 to 25 for sandstones. In the present model, data were assigned to represent sandstones with porosities below 10%. To understand and investigate the effect of the porosity sensitivity of permeability, we compare the results for three different permeability sensitivity exponents (namely n = 2, 13 and 25) within the given range (Figure 13).
Table 2. Initial averaged data applied for permeability change analysis (from Somerton [54] and Min [42]).
Initial ValuesCoalSandstone
ϕi0.020.06
Normalized ki11
n13
Figure 13. Porosity and permeability is expressed as function of volumetric strain increment following Chin et al. [40] with porosity sensitivity exponents of (a) n = 2; (b) n = 13; and (c) n = 25. The grey solid line represents the 200 °C isotherm.
Energies 08 05800 g013
For an improved illustration of permeability changes, the values are limited to one order of magnitude permeability increase (red elements). For the smallest exponent value, a limited radius around the reactor is affected (<0.5 m) only, concentrated at the reactor top and bottom. In contrast, the effect of the exponent is notably higher for the exponents n = 13 and 25. The permeability increase of more than one order of magnitude is evenly distributed around the reactor and up to about 1.5 m in the sandstone lithology. In that radius, fluid flow may be significantly affected by the local permeability increase, while relevant permeability changes in the coal seam exhibit only 50% of that radius.
The positive volumetric strain increment is strongly temperature-induced in the surrounding sandstones as shown in Figure 12, what is confirmed by the calculated permeability changes in the simulations using temperature-dependent and -independent parameters. Figure 14 illustrates that the comparison of permeability changes resulting from simulations using temperature-dependent and temperature-independent parameters exhibit only minor lateral differences (0.65 m) of about one order of magnitude in the reactor near-field. Particularly at the top of the reactor, these differences are negligibly small (0.17 m). Therefore, using temperature-dependent parameters affects the magnitude of the local total displacements and volumetric strain increments in the reactor near-field, but almost not their spatial distribution; hence, also not the resulting permeability distribution. Nevertheless, neglecting the temperature-dependent development of parameters may result in an overestimation of permeability changes in the close reactor vicinity.
Figure 14. Permeability changes (−) show negligible differences for (a) temperature-dependent and (b) temperature-independent parameters. The difference in regions of high permeability increase is only marginal, extending to 0.17 m above and 0.65 m below the reactor. The grey solid line represents the 200 °C isotherm.
Energies 08 05800 g014
While various mechanisms have been investigated to explain the processes causing permeability changes in rocks experiencing variations in normal and shear stresses, the effect of mechanical stress on permeability in the context of a geotechnical excavation has been found to be confined mainly to the near-field of deposition holes, tunnels or boreholes [76,77]. Permeability changes calculated under consideration of the given thermo-mechanical material properties are mainly mechanically-induced in the simulations carried out in the present study.

4. Summary and Conclusions

In the present study, we investigated the coupled thermo-mechanical impact of temperature-dependent parameters on permeability changes in the vicinity of a hypothetical underground coal gasification reactor by comparing simulation results based on thermo-mechanical parameters determined in recently published data from high-temperature experimental results. For that purpose, a 2D thermo-mechanical numerical model was implemented comprising three geological units as, e.g., given in the former Hanna UCG field trial in the USA. An elasto plastic constitutive law was assigned to the coal and sandstone units in the model. The spatial development of the UCG reactor with time was realized by a stepwise excavation in order not to overestimate the mechanical excavation effects, which would result in unreasonably high grid point velocities. At each excavation step, a constant temperature of 1000 °C was applied at the reactor boundaries to represent the heat generated by the gasification process in the coupled thermo-mechanical simulations. A parameter sensitivity analysis identified the parameters most sensitive to temperature. Then, a simulation time of 50 days was applied to compute the average time-dependent heat impact experienced by a 1 m long section of a typical CRIP-based UCG reactor.
Our simulation results demonstrate that the temperature-dependent thermo-mechanical properties elastic modulus, tensile strength and linear thermal expansion coefficient have a notable direct influence on stress changes and deformation, while thermal conductivity mainly influences the spatial temperature distribution around the UCG reactor, and thus only indirectly affects stress changes and deformation. Especially the temperature distribution in cavity vicinity is determined by the thermal conductivity and may result in overestimating the size of areas with high permeability changes unless temperature-dependent properties are considered. Therefore, it is obvious that the thermo-mechanical rock behavior is mainly influenced by the parameters thermal expansion coefficient, tensile strength and elastic modulus.
In the close reactor vicinity, the high temperatures induce positive volumetric strains. However, permeability changes calculated based on volumetric strain show only negligible differences between simulations using temperature-dependent and temperature-independent parameters. Hence, near-field models employed for the assessment of reactor growth induced by the thermodynamic gasification processes require temperature-dependent parameters for simulations, while far-field models can benefit from neglecting temperature dependence, which in turn increases the computational efficiency significantly by not adapting the thermo-mechanical parameters of each model element after each calculation step.
Shear and tensile failure occur at multiple locations in the reactor near-field in the thermo-mechanical model due to stepwise excavation effects applied to simulate the reactor growth and thermally induced stresses. The region of shear failure in lateral direction is about three times the length of the coal seam thickness in the present case and mainly stress-induced and independent of temperature, since an arching effect develops with time. At the reactor top, a field of pure tensile failure is observed in the sandstone for the temperature-dependent simulation results. High temperatures at the reactor boundary induce a decrease in rock strength and determine stress changes; thus, generate tensile failure mainly in the temperature-dependent simulations.
The present study considers sandstones as over- and underburden of the target coal seam. Other rock types usually present in geological coal deposits, such as claystones, siltstones and shales, were not specifically addressed due to the limited availability of experimental data on temperature-dependent thermal properties (linear thermal expansion, specific heat capacity and thermal conductivity).
3D modelling will be applied in the next step to enable the assessment of complex site-scale geological models with regard to environmental UCG impacts. The model presented here will be thereto extended by a thermo-hydro-mechanical coupling to include fluid flow out of and into the UCG reactor. Detailed knowledge on site geology as well as permeability of potentially existing discontinuities is generally not available. Therefore, coupled numerical models allow for the assessment of potential permeability changes and mechanical integrity of UCG reactors, what is of uttermost importance for a safe and environmental-friendly UCG operation.

Acknowledgments

The authors gratefully acknowledge the funding received from the EU-FP7 TOPS project (grant 608517) funded by the European Union (EU). The second author is further very grateful for the scientific discussions and cooperation with Jan Rogut (Central Mining Institute, GIG, Poland), who left us far too early.

Author Contributions

Christopher Otto and Thomas Kempka designed research; Christopher Otto performed research; Christopher Otto and Thomas Kempka analyzed data; and Christopher Otto and Thomas Kempka wrote the paper.

Conflicts of Interest

The authors declare no conflict of interest.

References

  1. Klimenko, A.Y. Early Ideas in Underground Coal Gasification and Their Evolution. Energies 2009, 2, 456–476. [Google Scholar] [CrossRef]
  2. Blinderman, M.S.; Saulov, D.N.; Klimenko, A.Y. Forward and reverse combustion linking in underground coal gasification. Energy 2008, 33, 446–454. [Google Scholar] [CrossRef]
  3. Nakaten, N.; Kötting, P.; Azzam, R.; Kempka, T. Underground Coal Gasification and CO2 Storage Support Bulgaria’s Low Carbon Energy Supply. Energy Procedia 2013, 40, 212–221. [Google Scholar] [CrossRef]
  4. Bhutto, A.W.; Bazmi, A.A.; Zahedi, G. Underground coal gasification: From fundamentals to applications. Prog. Energy Combust. Sci. 2013, 39, 189–214. [Google Scholar] [CrossRef]
  5. Kempka, T.; Plötz, M.L.; Schlüter, R.; Hamann, J.; Deowan, S.A.; Azzam, R. Carbon dioxide utilisation for carbamide production by application of the coupled UCG-urea process. Energy Procedia 2011, 4, 2200–2205. [Google Scholar] [CrossRef]
  6. Prabu, V.; Jayanti, S. Simulation of cavity formation in underground coal gasification using bore hole combustion experiments. Energy 2011, 36, 5854–5864. [Google Scholar] [CrossRef]
  7. Friedmann, S.J.; Upadhye, R.; Kong, F.M. Prospects for underground coal gasification in carbon-constrained world. Energy Procedia 2009, 1, 4551–4557. [Google Scholar] [CrossRef]
  8. Burton, E.; Friedmann, J.; Upadhye, R. Best Practise in Underground Coal Gasification; Technical Report; Lawrence Livermore National Lab: Livermore, CA, USA, 2007. [Google Scholar]
  9. Hewing, G.; Hewel-Bundermann, H.; Krabiell, K.; Witte, P. Post-1987 R & D Studies of Underground Coal Gasification; Research Association for Second-Generation Coal Extraction: Essen, Germany, 1987. [Google Scholar]
  10. Nakaten, N.C.; Azzam, R.; Kempka, T. Sensitivity analysis on UCG–CCS economics. Int. J. Greenh. Gas Control 2014, 26, 51–60. [Google Scholar] [CrossRef]
  11. Nakaten, N.C.; Islam, R.; Kempka, T. Underground Coal Gasification with Extended CO2 Utilization—An Economic and Carbon Neutral Approach to Tackle Energy and Fertilizer Supply Shortages in Bangladesh. Energy Procedia 2014, 63, 8036–8043. [Google Scholar] [CrossRef]
  12. Nakaten, N.C.; Schlüter, R.; Azzam, R.; Kempka, T. Development of a techno-economic model for dynamic calculation of cost of electricity, energy demand and CO2 emissions of an integrated UCG–CCS process. Energy 2014, 66, 779–790. [Google Scholar] [CrossRef]
  13. Budzianowski, W.M. Value-added carbon management technologies for low CO2 intensive carbon-based energy vectors. Energy 2012, 41, 280–297. [Google Scholar] [CrossRef]
  14. Eftekhari, A.A.; van Der Kooi, H.; Bruining, H. Exergy analysis of underground coal gasification with simultaneous storage of carbon dioxide. Energy 2012, 45, 729–745. [Google Scholar] [CrossRef]
  15. Durucan, S.; Korre, A.; Shi, J.Q.; Idiens, M.; Stańczyk, K.; Kapusta, K.; Rogut-Dabrowska, A.; Kempka, T.; Wolf, K.H.; Younger, P.; et al. TOPS: Technology Options for Coupled Underground Coal Gasification and CO2 Capture and Storage. Energy Procedia 2014, 63, 5827–5835. [Google Scholar] [CrossRef]
  16. Couch, G.R. Underground Coal Gasification; CCC/151 IEA Clean Coal Centre ISBN 978-92-9029-471-9; John Topper: London, UK, July 2009. [Google Scholar]
  17. Sury, M.; White, M.; Kirton, J.; Carr, P.; Woodbridge, R.; Mostade, M.; Chappell, R.; Hartewell, D.; Douglas, H.; Rendell, N. Review of Environmental Issues of Underground Coal Gasification; Report No. COAL R272 DTI/Pub URN 04/1880WS; Atkins Consultants Ltd.: Surrey, UK; University of Liège Belgium: Liège, Belgium; FWS Consultants Ltd.: Spennymoor, UK, 2004; pp. 1–126. [Google Scholar]
  18. Seifi, M.; Abedi, J.; Chen, Z. Application of porous medium approach to simulate UCG process. Fuel 2014, 116, 191–200. [Google Scholar] [CrossRef]
  19. Seifi, M.; Abedi, J.; Chen, Z. Numerical simulation of Underground coal gasification using the crip method. Can. J. Chem. Eng. 2011, 89, 1528–1535. [Google Scholar] [CrossRef]
  20. Kapusta, K.; Stańczyk, K. Pollution of water during underground coal gasification of hard coal and lignite. Fuel 2011, 90, 1927–1934. [Google Scholar] [CrossRef]
  21. Liu, S.; Li, J.; Mei, M.; Dong, D. Groundwater Pollution from Underground Coal Gasification. J. China Univ. Min. Technol. 2007, 17, 467–472. [Google Scholar] [CrossRef]
  22. Walters, E.A.; Niemczyk, T.M. The Effect of Underground Coal Gasification on Ground Water; EPA-600/S2-84-123; Lawrence Livermore National Lab: Livermore, CA, USA, 1984. [Google Scholar]
  23. Humenick, M.J.; Mattox, C.F. Groundwater pollutants from underground coal gasification. Water Res. 1978, 12, 463–469. [Google Scholar] [CrossRef]
  24. Kapusta, K.; Stańczyk, K.; Wiatowski, M.; Chećko, J. Environmental aspects of a field-scale underground coal gasification trial in a shallow coal seam at the Experimental Mine Barbara in Poland. Fuel 2013, 113, 196–208. [Google Scholar] [CrossRef]
  25. Stańczyk, N.; Howaniec, A.; Smolinski, J.; Swiadrowski, K.; Kapusta, M.; Wiatowski, J.; Grabowski, J.; Rogut, J. Gasification of lignite and hard coal with air and oxygen-enriched air in a pilot scale ex-situ reactor for underground gasification. Fuel 2011, 90, 1953–1962. [Google Scholar] [CrossRef]
  26. Stańzcyk, K.; Smolinski, A.; Kapusta, K.; Wiatowski, M.; Swiadrowski, J.; Kotyrba, A.; Rogut, J. Dynamic experimental simulation of hydrogen oriented underground gasification of lignite. Fuel 2010, 89, 3307–3314. [Google Scholar]
  27. Blinderman, M.S.; Anderson, B. Underground coal gasification for power generation: Efficiency and CO2-emissions. In Proceedings of the 12th International Conference on Coal Science, Cairns, Australia, 2–6 November 2003.
  28. Su, F.; Nakanowataru, T.; Itakura, K.I.; Ohga, K.; Deguchi, G. Evaluation of Structural Changes in the Coal Specimen Heating Process and UCG Model Experiments for Developing Efficient UCG Systems. Energies 2013, 6, 2386–2406. [Google Scholar] [CrossRef]
  29. Wolf, K.H.; Bruining, H. Modelling the interaction between underground coal fires and their roof rocks. Fuel 2007, 86, 2761–2777. [Google Scholar] [CrossRef]
  30. Buscheck, T.A.; Hao, Y.; Morris, J.P.; Burton, E.A. Thermal-Hydrological Sensitivity Analysis of Underground Coal Gasification. In Proceedings of the International Pittsburgh Coal Conference, Pittsburgh, PA, USA, 5–8 October 2009.
  31. Biezen, E. Modeling Underground Coal Gasification. Ph.D. Thesis, Delft University of Technology, Delft, The Netherlands, 1996. [Google Scholar]
  32. Hettema, M.H.H.; Wolf, K.H.A.A.; de Pater, C.J. The influence of steam pressure on thermal spalling of sedimentary rock: Theory and experiments. Int. J. Rock Mech. Min. Sci. 1998, 35, 3–15. [Google Scholar] [CrossRef]
  33. Bernabé, Y. The effective pressure law for permeability in Chelmsford granite and Barre granite. Int. J. Rock Mech. Min. Sci. Geomech. Abstr. 1986, 23, 267–275. [Google Scholar] [CrossRef]
  34. Tian, H. Development of a Thermo-Mechanical Model for Rocks Exposed to High Temperatures during Underground Coal Gasification. Ph.D. Thesis, RWTH Aachen University, Aachen, Germany, 8 May 2013. [Google Scholar]
  35. Mortazavi, H.R. Rubbling and Structural Stability of Underground Coal Gasification Reactors. Ph.D. Thesis, University of Washington, Seattle, WA, USA, 1989. [Google Scholar]
  36. Thompson, T.W.; Menezes, J.J.; Gray, K.E. Roof stability and subsidence in in-situ gasification of coal. In Proceedings of the 18th US Symposium on Rock Mechanics (USRMS), Golden, CO, USA, 22–24 June 1977.
  37. Najafi, M.; Jalali, S.M.E.; KhaloKakaie, R. Thermal-Mechanical Numerical Analysis of Stress Distribution in the vicinity of Underground Coal Gasification (UCG) Panels. Int. J. Coal Geol. 2014, 134–135, 1–16. [Google Scholar] [CrossRef]
  38. Yang, D.; Sarhosis, V.; Sheng, Y. Thermal–mechanical modelling around the cavities of underground coal gasification. J. Energy Inst. 2014, 87, 321–329. [Google Scholar] [CrossRef]
  39. Sarraf, A; Mmbaga, J.P.; Gupta, R.; Hayes, R.E. Modeling cavity growth during Underground Coal Gasification. In Proceedings of the 2011 COMSOL Conference, Boston, MA, USA, 13–15 October 2011; pp. 1–5.
  40. Nitao, J.J.; Camp, D.W.; Buscheck, T.A.; White, J.A.; Burton, G.C.; Wagoner, J.L.; Chen, M. Progress on a New Integrated 3-D UCG Simulator and its Initial Application. In Proceedings of the International Pittsburgh Coal Conference, Pittsburgh, PA, USA, 5–8 October 2011.
  41. Tan, Q.; Luo, X.; Li, S. Numerical modeling of thermal stress in a layered rock mass. In Proceedings of the 42nd US Rock Mechanics Symposium and 2nd U.S.–Canada Rock Mechanics Symposium, San Francisco, CA, USA, 29 June–2 July 2008.
  42. Min, O.K. Finite Element Modeling of Thermo-Mechanical Responses Associated with Underground Coal Conversion. Ph.D. Thesis, Ohio State University, Columbus, OH, USA, 1983. [Google Scholar]
  43. Sarhosis, V.; Yang, D.; Sheng, Y.; Kempka, T. Coupled Hydro-thermal Analysis of Underground Coal Gasification Reactor Cool Down for Subsequent CO2 Storage. Energy Procedia 2013, 40, 428–436. [Google Scholar] [CrossRef]
  44. Chin, L.Y.; Raghavan, R.; Thomas, L.K. Fully coupled geomechanics and fluidflow analysis of wells with stress-dependent permeability. SPE J. 2000, 5, 32–45. [Google Scholar] [CrossRef]
  45. Itasca Consulting Group, Inc. Advanced Three-Dimensional Continuum Modelling for Geotechnical Analysis of Rock, Soil and Structural Support. In FLAC3D Software Version 5.0. User’s Manual; Itasca Consulting Group, Inc.: Minneapolis, MN, USA, 2014. [Google Scholar]
  46. Luo, Y.; Coertzen, M.; Dumble, S. Comparison of UCG cavity growth with CFD model predictions. In Proceedings of the Seventh International Conference on CFD in the Minerals and Process Industries CSIRO, Melbourne, Australia, 7–9 December 2009.
  47. Tian, H.; Kempka, T.; Yu, S.; Ziegler, M. Mechanical Properties of Sandstones Exposed to High Temperature. Rock Mech. Rock Eng. 2015. [Google Scholar] [CrossRef]
  48. Tian, H.; Kempka, T.; Xu, N.; Ziegler, M. A Modified Mohr-Coulomb Failure Criterion for Intact Granites Exposed to High Temperatures. In Clean Energy Systems in the Subsurface: Production, Storage and Conversion, Proceedings of the 3rd Sino-German Conference “Underground Storage of CO2 and Energy”, Goslar, Germany, 21–23 May 2013; Hou, M.Z., Xie, H., Were, P., Eds.; Springer: Berlin/Heidelberg, Germany, 2013; pp. 379–393. [Google Scholar]
  49. Tian, H.; Kempka, T.; Xu, N.X.; Ziegler, M. Physical Properties of Sandstones after High Temperature Treatment. Rock Mech. Rock Eng. 2012, 45, 1113–1117. [Google Scholar] [CrossRef]
  50. Tian, H.; Ziegler, M.; Kempka, T. Physical and mechanical behavior of claystone exposed to temperatures up to 1000 °C. Int. J. Rock Mech. Min. Sci. 2014, 70, 144–153. [Google Scholar] [CrossRef]
  51. Tian, H.; Ziegler, M.; Kempka, T. Mechanical behavior of claystone exposed to high temperatures and its possible impacts on the stability of a deep nuclear waste repository. In Rock mechanics: Achievements and ambitions, Proceedings of the 2nd ISRM International Young Scholars’ Symposium on Rock Mechanics, Beijing, China, 14–16 October 2011; Cai, M., Ed.; Taylor & Francis: London, UK, 2011; pp. 193–197. [Google Scholar]
  52. Zhao, X.; Cai, M.; Cai, M. Considerations of rock dilation on modeling failure and deformation of hard rocks—A case study of the mine-by test tunnel in Canada. J. Rock Mech. Geotech. Eng. 2010, 2, 338–349. [Google Scholar]
  53. Geuzaine, C.; Remacle, J.F. Gmsh: A three-dimensional finite element mesh generator with built-in pre- and post-processing facilities. Int. J. Numer. Methods Eng. 2009, 79, 1309–1331. [Google Scholar] [CrossRef]
  54. Somerton, W.H. Thermal Properties and Temperature Related Behavior of Rock/Fluid Systems. In Developments in Petroleum Science, 37; Chilingarian, G.V., Ed.; Elsevier: Amsterdam, The Netherlands, 1992. [Google Scholar]
  55. Clauser, C.; Huenges, E. Thermal conductivity of rocks and minerals. In Thermal Conductivity of Rocks and Minerals ROCK Physics and Phase Relations: A Handbook of Physical Constants; Ahrens, T.J., Ed.; American Geophysical Union: Washington, DC, USA, 1995; pp. 105–126. [Google Scholar]
  56. Hajpál, M.; Török, Á. Petrophysical and mineralogical studies of burnt sandstones. In Proceedings of the 2nd International PhD Symposium in Civil Engineering, Budapest, Hungary, 6–8 August 1998; pp. 1–9.
  57. Yin, T.B.; Li, X.B.; Wang, B.; Yin, Z.Q.; Jin, J.F. Mechanical properties of sandstones after high temperature under dynamic loading. Chin. J. Geotech. Eng. 2011, 33, 777–784. [Google Scholar]
  58. Shoemaker, H.D.; Shuck, L.Z.; Haynes, R.R.; Advani, S.H. The mechanical properties of the Pittsburgh coal at elevated temperatures. J. Press. Vessel Technol. 1977, 99, 192–198. [Google Scholar] [CrossRef]
  59. Singer, J.M.; Tye, R.P. Thermal, Mechanical, and Physical Properties of Selected Bituminous Coals and Cokes; U.S. Department of Interior, Bureau of Mines: Washington, DC, USA, 1979; pp. 1–37. [Google Scholar]
  60. Badzioch, S.; Gregory, D.R.; Field, M.A. Investigation of the temperature variation of thermal conductivity and thermal diffusivity of coal. Fuel 1964, 43, 267–280. [Google Scholar]
  61. Somerton, W. Thermal Properties of Partially Liquid Saturated Rocks at Elevated Pressures and Temperatures; API Research Project 155 Final Report; University of California: Berkeley, CA, USA, 1973; p. 36. [Google Scholar]
  62. Gercek, H. Poisson’s ratio values for rocks. Int. J. Rock Mech. Min. Sci. 2007, 44, 1–13. [Google Scholar] [CrossRef]
  63. Bauer, S.J.; Johnson, B. Effects of slow uniform heating on the physical properties of the westerly and charcoal granites. In Proceedings of the 20th U.S. Symposium on Rock Mechanics, Austin, TX, USA, 4–6 June 1979; ASCE: New York, NY, USA, 1979; pp. 7–18. [Google Scholar]
  64. Hettema, M.H.H.; de Pater, C.J.; Wolf, K.H.A. A. High temperature properties of roof rock of coal. In Proceedings of the ISRM Symposium, Eurock’92, Chester, UK, 14–17 September 1992; Thomas Telford Services Ltd.: Chester, UK, 1992; pp. 93–98. [Google Scholar]
  65. Barrhowell, B.D.; Howell, J.M.; Peppas, N.A. Thermoplastic and viscoelastic properties of coals. Abstr. Pap. Am. Chem. Soc. 1985, 189, 64–70. [Google Scholar]
  66. Neuzil, C.E. Hydromechanical effects of continental glaciation on groundwater systems. Geofluids 2012, 12, 22–37. [Google Scholar] [CrossRef]
  67. Brown, S.R.; Bruhn, R.L. Fluid permeability of deformable fracture networks. J. Geophys. Res. 1998, 103, 2489–2500. [Google Scholar] [CrossRef]
  68. Zhang, J.; Standifird, W.B.; Roegiers, J.C.; Zhang, Y. Stress dependent fluid flow and permeability in fractured media: From lab experiments to engineering applications. Rock Mech. Rock Eng. 2007, 40, 3–21. [Google Scholar] [CrossRef]
  69. Min, K.B.; Rutqvist, J.; Tsang, C.F.; Jing, L. Thermally-induced mechanical and permeability changes around a nuclear waste repository—A far-field study based on equivalent properties determined by a discrete approach. Int. J. Rock Mech. Min. Sci. 2005, 42, 765–780. [Google Scholar] [CrossRef]
  70. Rutqvist, J.; Bäckström, A.; Chijimatsu, M.; Feng, X.T.; Pan, P.Z.; Hudson, J. A multiple-code simulation study of the long-term EDZ evolution of geological nuclear waste repositories. Environ. Geol. 2009, 57, 1313–1324. [Google Scholar] [CrossRef]
  71. Hudson, J.; Bäckström, A.; Rutqvist, J.; Jing, L.; Backers, T.; Chijimatsu, M. Characterising and modeling the excavation damaged zone in crystalline rock in the context of radioactive waste disposal. Environ. Geol. 2009, 57, 1275–1297. [Google Scholar] [CrossRef]
  72. Tsang, C.F.; Bernier, F.; Davies, C. Geohydromechanical processes in the excavation damaged zone in crystalline rock, rock salt, and indurated and plastic clays in the context of radioactive waste disposal. Int. J. Rock Mech. Min. Sci. 2005, 42, 109–125. [Google Scholar] [CrossRef]
  73. Min, K.B.; Rutqvist, J.; Tsang, C.F.; Jing, L. Stress-dependent permeability of fractured rock masses: A numerical study. Int. J. Rock Mech. Min. Sci. 2004, 41, 1191–1210. [Google Scholar] [CrossRef]
  74. David, C.; Wong, T.F.; Zhu, W.; Zhang, J. Laboratory Measurement of Compaction-induced Permeability Change in Porous Rocks: Implications for the Generation and Maintenance of Pore Pressure Excess in the Crust. Pure Appl. Geophys. 1994, 143, 425–456. [Google Scholar] [CrossRef]
  75. Yale, D.P. Network Modelling of Flow, Storage and Deformation in Porous Rocks. Ph.D. Thesis, Stanford University, California, CA, USA, 1984. [Google Scholar]
  76. Min, K.B.; Lee, J.; Stephansson, O. Implications of thermally-induced fracture slip and permeability change on the long-term performance of a deep geological repository. Int. J. Rock Mech. Min. Sci. 2013, 61, 275–288. [Google Scholar] [CrossRef]
  77. Zoback, M.D. Reservoir Geomechanics, 1st ed.; Cambridge University Press: New York, NY, USA, 2010; p. 461. [Google Scholar]

