Abstract
It is well known that the methane hydrate dissociation process may lead to unstable behavior such as large ground deformations, uncontrollable gas production, etc. A linear instability analysis was performed in order to investigate which variables have a significant effect on the onset of the instability behavior of methane hydrate-bearing soils subjected to dissociation. In the analysis a simplified viscoplastic constitutive equation is used for the soil sediment. The stability analysis shows that the onset of instability of the material system mainly depends on the strain hardening-softening parameter, the degree of strain, and the permeability for water and gas. Then, we conducted a numerical analysis of gas hydrate-bearing soil considering hydrate dissociation in order to investigate the effect of the parameters on the system. The simulation method used in the present study can describe the chemo-thermo-mechanically coupled behaviors such as phase changes from hydrates to water and gas, temperature changes and ground deformation. From the numerical results, we found that basically the larger the permeability for water and gas is, the more stable the simulation results are. These results are consistent with those obtained from the linear stability analysis.
1. Introduction
Recently, methane hydrates (MHs) have been viewed as a potential energy resource since a large amount of methane gas is trapped within ocean sediments and permafrost regions. A unit volume of methane hydrate dissociates into approximately 160–170 times the volume (at 0 °C and 1 atmosphere) of methane gas. However, we do not have enough knowledge about the behaviors of sediments caused by dissociation of hydrates in the ground. Some researchers have pointed out that gas hydrates may be a trigger of submarine geohazards which could impact global climate change.
Kvenvolden [1] presented several examples of a possible connection between gas hydrate dissociation and submarine slides, and slump surfaces were recognized. Many of these slides are on gentle slopes which should be stable. Other authors have also reported that gas hydrates, mostly methane hydrates, might affect submarine slides due to dissociation [2,3,4]. Submarine landslides can be caused by an increase in applied shear stress or a reduction in the strength of the soil. When gas hydrates form in sediments, the pore spaces are occupied by the solid phase of gas hydrates, although the gas hydrates themselves can act as a cementation (bonding) agent between soil particles. The reduction in hydrostatic pressure of the hydrate reservoir, or increases in the temperature of the reservoir leads to the dissociation of the gas hydrates. The solid phase of the gas hydrates is lost and the hydrates change into the fluid phase, i.e., water and gas. When this released fluid pressure is trapped inside an area of low permeability, the effective stress, which is one of the factors of describing strength of the sediments, should be reduced and slope failure can be triggered, resulting in submarine landslides. The submarine landslides may lead to even worse situation, for example, cutting submarine cables, and tsunami disasters. Figure 1 shows a schematic view of possible hazards in marine sediments induced by gas hydrate dissociation.
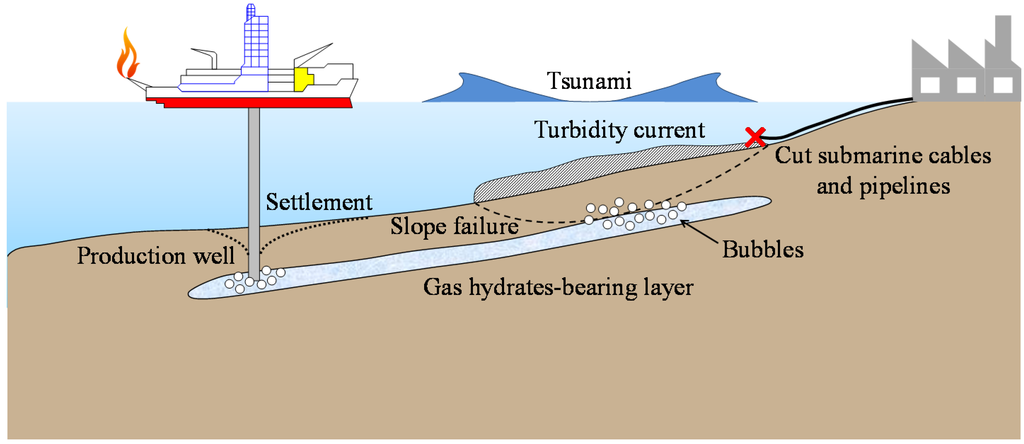
Figure 1.
Schematic view of possible hazards in marine sediments induced by gas hydrates dissociation.
Figure 1.
Schematic view of possible hazards in marine sediments induced by gas hydrates dissociation.
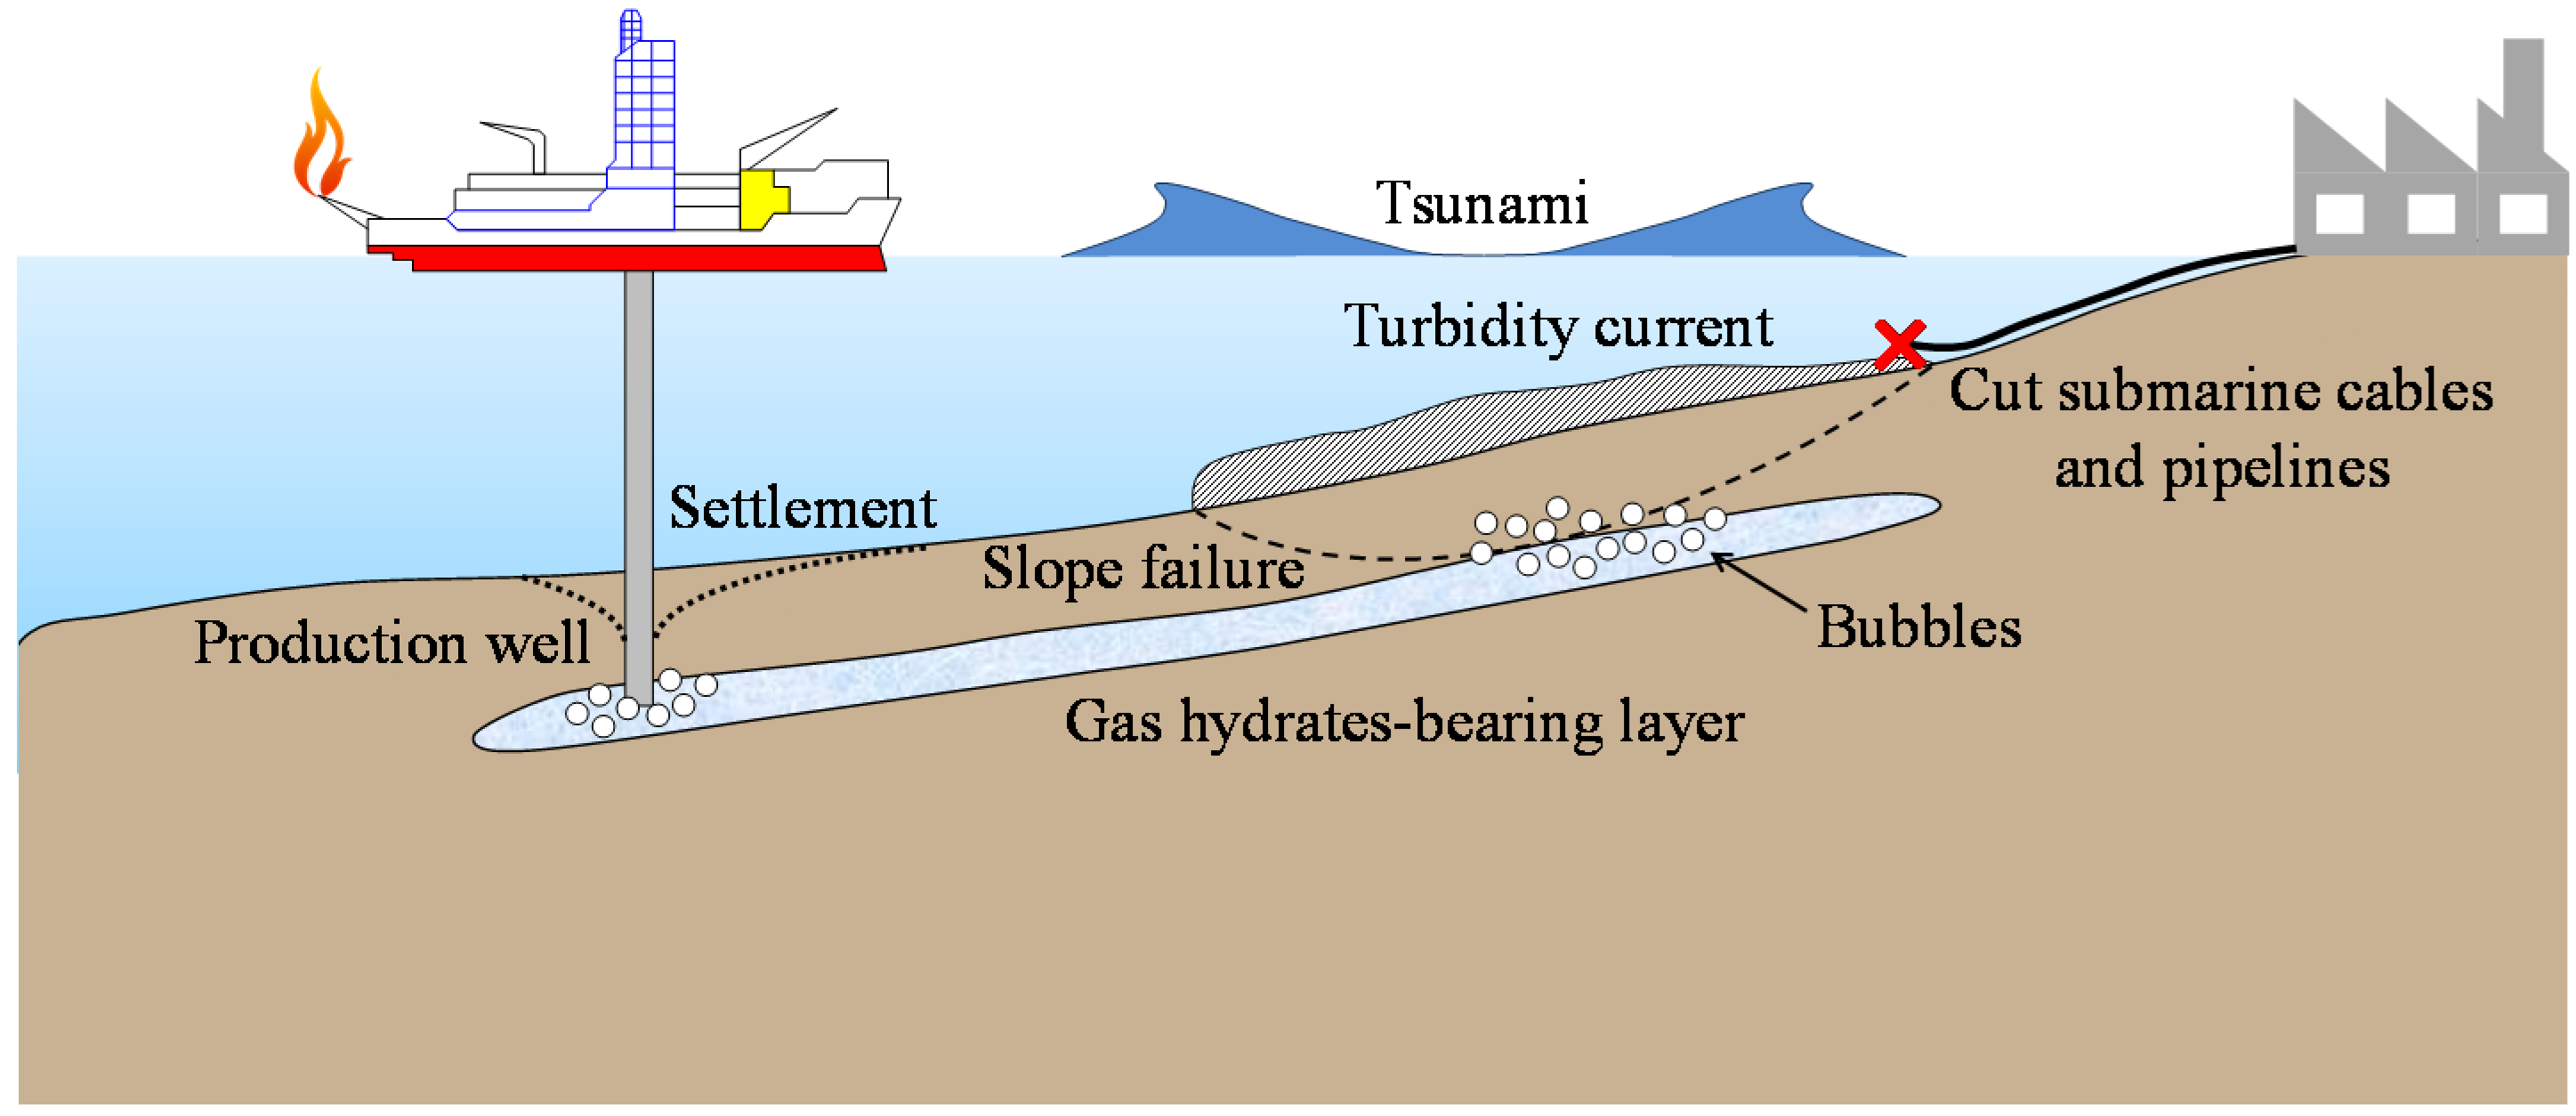
Slope failure in marine sediments can cause enormous turbidity current, and it may generate a tsunami. The tsunami produced by slope failure will hit coastal areas and offshore structures, and in the worst scenario, many people might be killed by a tsunami.
Many experimental and numerical studies have been conducted on the deformation behavior associated with methane hydrate dissociation [5,6,7,8,9,10]. Nevertheless, the behavior of methane hydrate-bearing soils during dissociation is still a subject of active research, and theoretical analyses to investigate the onset of instability, such as linear stability analyses, have not been performed.
It has been well recognized that strain localization in soil materials is closely related to the onset of material failure. Slope failure is one of the typical strain localization problems in which deformation occurs in a narrow area. Rice [11] indicated that the phenomena of this problem can be treated in a general framework of bifurcation problems. Rice [11] also indicated the importance of the influences of pore fluid on the instability, and investigated the stability of fluid-saturated porous material in quasi-static conditions. Anand et al. [12], and Zbib and Aifantis [13] conducted linear perturbation stability analyses for the onset of shear localization. Loret and Harireche [14] investigated the acceleration waves in inelastic porous media, and Benallal and Comi [15] showed material instabilities in saturated material under a dynamic state using a perturbation stability analysis. Oka et al. [16] have been dealing with the strain localization problem of water-saturated clay through the use of viscoplastic constitutive equations because of the rate-dependent nature of cohesive soil. Higo et al. [17] have studied the effect of permeability and initial heterogeneity on the strain localization of water-saturated soil. Kimoto et al. [18] have performed a linear instability analysis on the thermo-hydro-mechanical coupled material system, and have indicated that strain softening and temperature softening are the main reasons for the material instability. Recently, Garcia et al. [19] have performed a linear stability analysis in order to investigate which variables have a significant effect on the onset of the instability of an unsaturated viscoplastic material subjected to water infiltration. They have found that the onset of the growing instability of the material system mainly depends on the specific moisture capacity, the suction and the hardening parameter.
In a similar manner to the past researches, we regard the slope failure and submarine landslides as instability problems induced by gas hydrate dissociation. In the first part of the present study, we conduct a linear stability analysis to investigate the onset of instability during the dissociation process. Then, in second part, a series of numerical analysis has been conducted in order to confirm the effect of the parameters detected by the linear stability analysis on the material instability. Figure 2 shows an illustration of the stable and unstable regions of methane hydrate-bearing sediments with and without hydrate dissociation. We discuss which parameters or variables have a significant effect on the instability of methane hydrate-bearing materials when they are subjected to a dissociation process. In the linear stability analysis, we extend the method by Oka et al. [16], and Garcia et al. [19] to a chemo-thermo-mechanically coupled material considering hydrate dissociation.
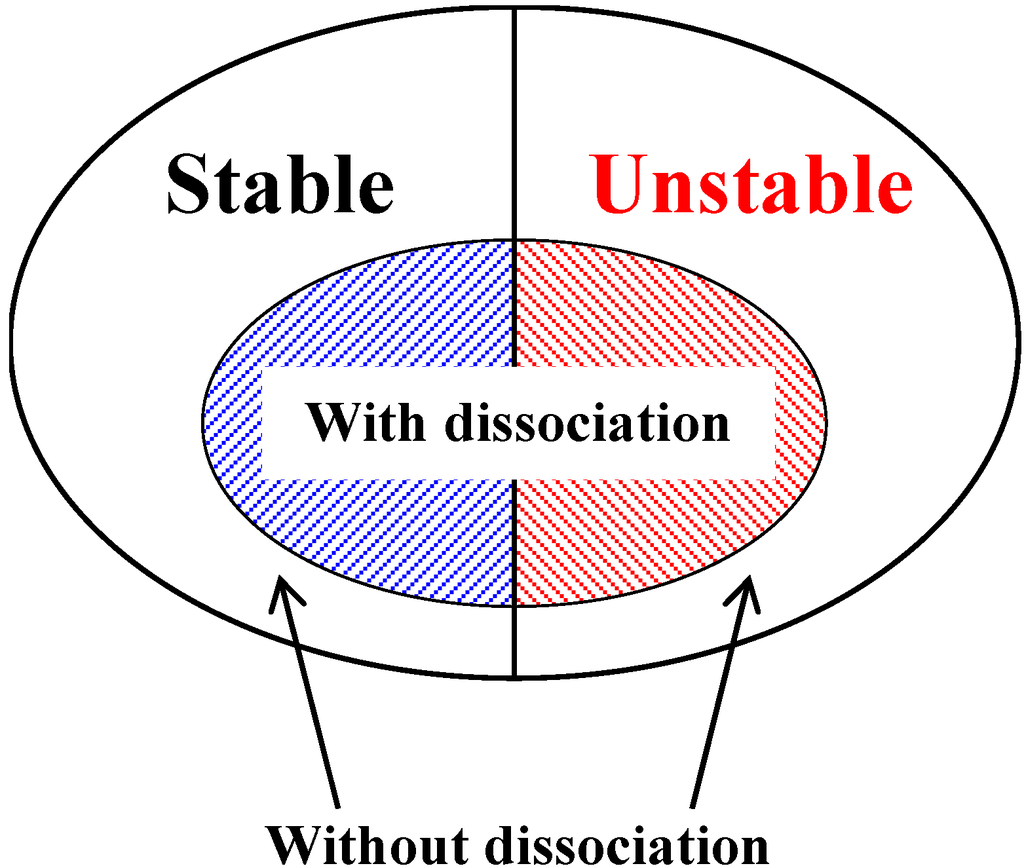
Figure 2.
Illustrative view of stable and unstable regions of methane hydrate-bearing sediments with and without dissociation.
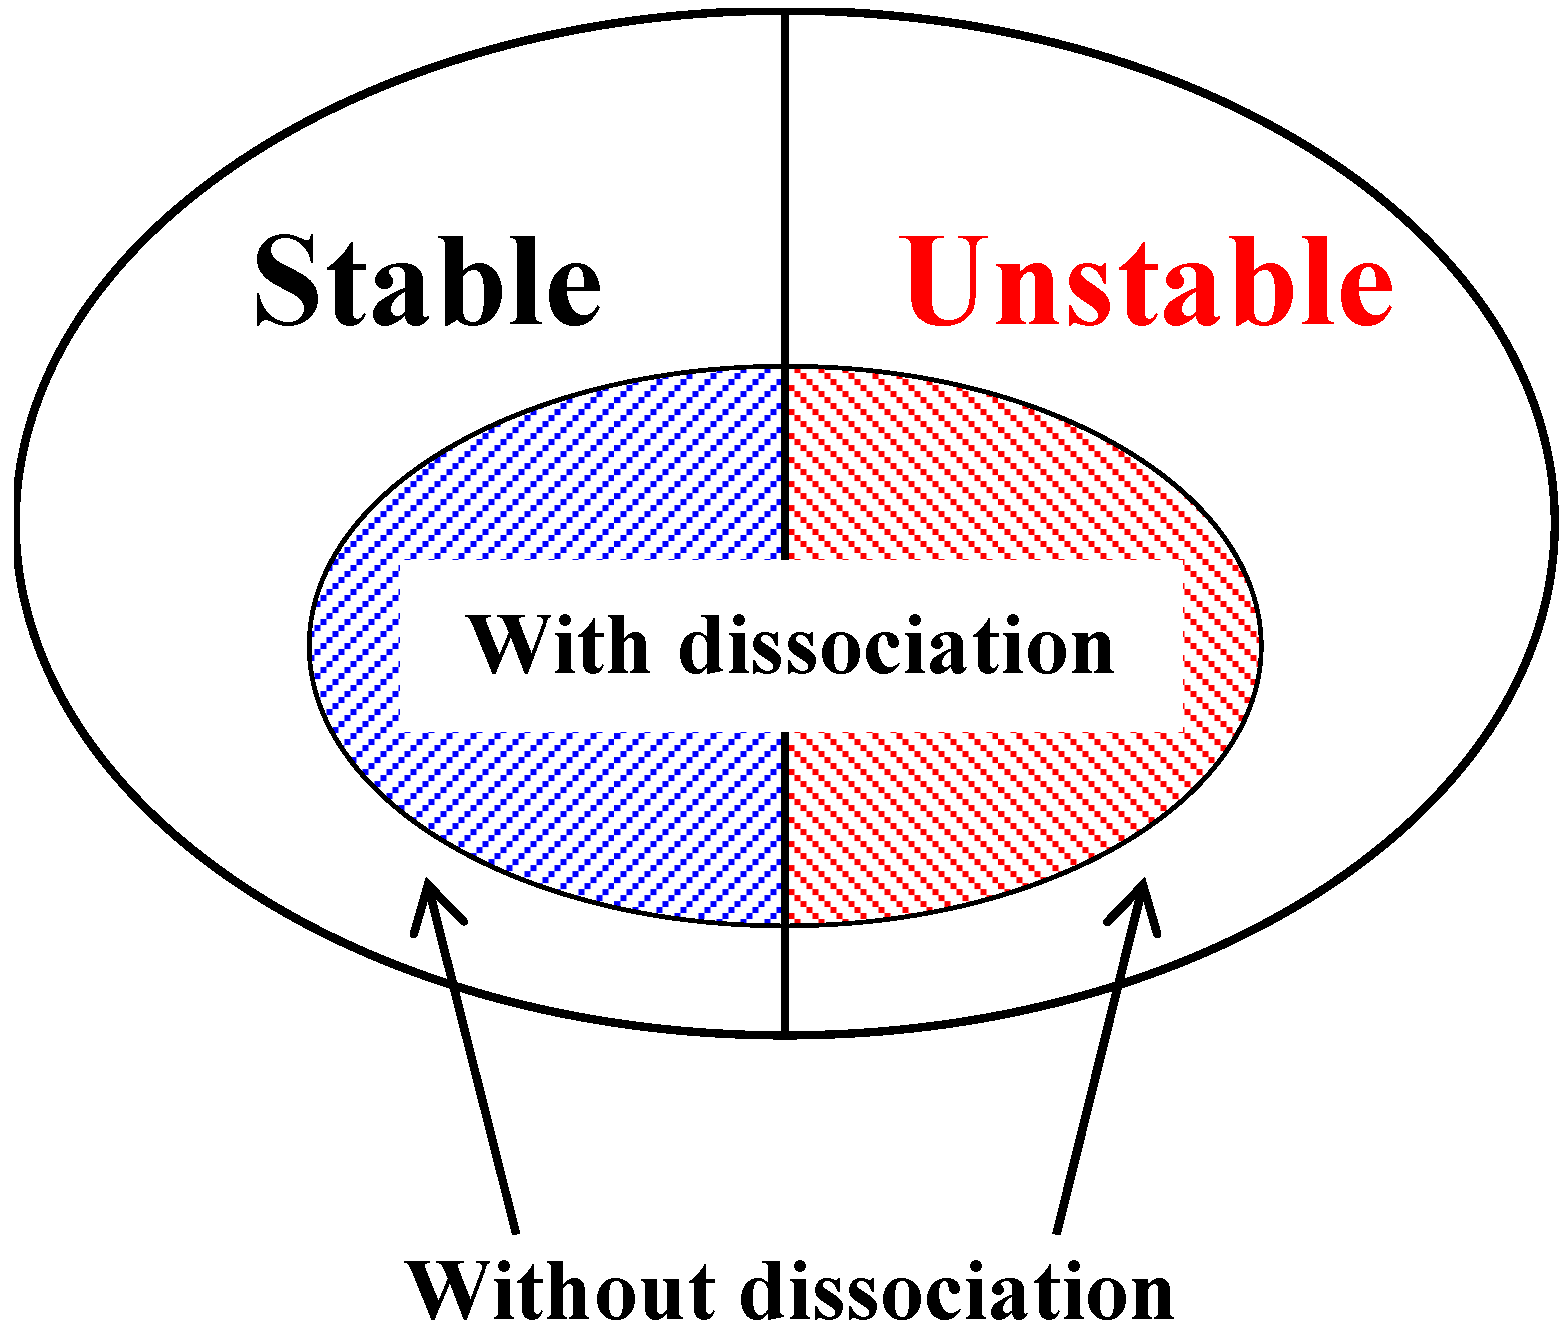
Figure 2.
Illustrative view of stable and unstable regions of methane hydrate-bearing sediments with and without dissociation.
2. One-Dimensional Instability Analysis of Methane Hydrate Bearing Viscoplastic Material
In this section, the linear stability analysis of methane hydrate-bearing soil considering dissociation is shown. We follow the method by Garcia et al. [19], and extend the method by considering the energy balance and hydrate reaction process(es) in order to deal with the dissociation phenomenon. The governing equations for the chemo-thermo-mechanically coupled behavior are based on Kimoto et al. [9], and a viscoplastic constitutive model is used for the soil skeleton. The details of the governing equations for the stability analysis are shown in the following sections.
2.1. Governing Equations
2.1.1. General Settings
The multiphase material Ψ is composed of four phases, namely, soil (S), water (W), gas (G), and hydrates (H) which are continuously distributed throughout space:
in which S is soil phase, W is water phase, G is gas phase and H is hydrate phase, respectively. For simplicity, we assume that hydrates move with soil particles, in other words, the solid phase, denoted as SH, is composed of soil and hydrates which exist around the soil particles. Total volume V is obtained from the sum of the partial volumes of the constituents, namely:
The water phase and gas phase are expressed as the fluid phase, and the total volume of fluids VF is given by:
The volume fraction nα is defined as the local ratio of the volume element with respect to the total volume given by:
The volume fraction of the void, n, is written as:
The volume fraction of the fluid, , is given by:
In addition, the fluid saturation is given by:
Hereafter, the water saturation sW will be denoted as s:
Density of each material ρα, and the total phase ρ is denoted by:
in which Mα is the mass of each phase α.
2.1.2. Stress Variables
The stress variables are defined in the following one-dimensional form. Total stress σ is obtained from the sum of the partial stresses, namely:
where superscripts S, H, W, G indicate the soil, hydrate, water, and gas phases, respectively. The partial stresses for the fluid phases can be written as:
where PW and PG are the pore water pressure and the pore gas pressure, respectively. Tension is positive for the stresses. For simplicity, we assume that the soil phase and the hydrate phase are in the same phase, namely, the solid phase. Thus, the partial stress of the solid phase is defined as:
where is called the skeleton stress in the present study; it acts on the solid phase and is used as the stress variable in the constitutive equation. The terms nS and nH are the volume fractions of the soil phase and the hydrate phase, respectively, and PF is the average fluid pressure given by:
where s is the water saturation. Substituting Equations (11)–(14) into Equation (10), the skeleton stress is obtained as:
Terzaghi [20] defined the effective stress for water-saturated soil. In the case of unsaturated soil, however, the effective stress needs to be considered in order to include a third phase, namely, the gas phase which is considered to be compressible. In general, we need the suction in the unsaturated soil model. Hence, we do not use the name of the effective stress. In the present formulation, the skeleton stress tensor is used; Jommi [21] defined it as the average soil skeleton stress.
2.1.3. Conservation of Mass
The conservation of mass for the soil, the water, the gas, and the hydrate phases are given by the following equations:
in which is the material density for α phase, is the velocity vector of each phase, and is the mass-increasing rate per unit volume due to hydrate dissociation. denotes the material time derivative following particles of phase. Assuming that the densities of the soil, the water and the hydrate are constant, that is, , where the superimposed dot denotes the material time derivative, Equation (16) yields:
in which the mass-increasing rate for the soil phase is zero, i.e., . We assume that the soil particles and hydrates move together, namely:
Under the small strain condition, the spatial gradient of velocity for the solid phase is equal to the strain rate:
According to Equation (5), the volume fraction of soil phase should be equal to , and the time derivative of can be written as follows:
Substituting Equations (5) and (23) into Equation (17) provides:
From Equations (7) and (8), the volume fractions for the water phase and gas phase can be expressed as:
Considering Equation (25), the time derivative of and are given by the following equations:
Substituting Equations (25)–(27) into Equations (18) and (19) gives:
Dividing both sides of Equation (20) by , and rearranging the equation, we obtain:
The apparent velocities of the water and the gas, with respect to the solid phase, are defined as:
In order to describe the changes in gas density, the equation for ideal gas is used, i.e.:
where M is the molar mass of gas and θ is the temperature. Multiplying Equation (24) by , adding Equation (28), and considering Equation (31), the continuity equation for the water phase can be written as:
Similarly, multiplying Equation (24) by , adding Equation (29), and considering Equation (31):
2.1.4. Balance of Momentum
The one-dimensional equilibrium equation can be written as:
in which the acceleration term is disregarded.
2.1.5. Darcy Type of Law
For gas-water-solid three phase materials, we adopt a Darcy type of law for the water and gas phases that can be obtained from the balance of linear momentum for each phase as described below. The Darcy type law for the flows of the water and the gas can be described as follows:
It should be noted that the above equations are only valid for creeping flow which has a small Reynolds number (Re). Some researchers have pointed it out that ground water flow can be treated as a laminar flow at Re < 1–10 [22,23]. In the case that the velocity becomes very high, especially for the gas flow, e.g., the Forchheimer law may describe the flow motion.
2.1.6. Conservation of Energy
In the present study, we consider heat conductivity and the heat sink rate as being associated with the hydrate dissociation. The one-dimensional equation of energy conservation is written as:
where is the specific heat of phase , is temperature for all phases, and is time rate of dissociation heat per unit volume due to the hydrate dissociation.
where is dissociation rate of hydrates. Heat flux h follows Fourier’s law as:
in which is the thermal conductivity for all phases. Substituting Equations (39) and (40) into Equation (38), and assuming that the term , which is related to the viscoplastic work, is very small and negligible, Equation (38) can be rewritten as:
2.1.7. Dissociation Rate of Methane Hydrates
Methane hydrates dissociate into water and methane gas according to the reaction expressed in Equation (42):
where n is a hydrate number and that is assumed to be equal to 5.75 in natural hydrates. For the methane hydrate dissociation rate , we use Kim-Bishnoi’s equation [24], namely:
where NH is the moles of hydrates in the volume V, NH0 is the moles of hydrates in the initial state, PF is the average pore pressure and Pe is an equilibrium pressure at temperature θ. When the dissociation occurs, the dissociation rate is negative, i.e., . The rates of generation of water and gas are given by:
The increasing mass rates for hydrates and the water and the gas phases, required in Equations (33) and (34), can be obtained from the above equations:
where MH, MW, and MG are the molar mass of the methane hydrates, the water, and the methane gas, respectively.
2.1.8. Simplified Viscoplastic Constitutive Model
In the analysis, a simplified viscoplastic constitutive model is used. The stress-strain relation can be expressed as:
where ε is the strain, is the strain rate, H is the strain hardening-softening parameter and is the viscoplastic parameter. We ignore the dependency of the hardening-softening parameter on the skeleton stress , namely, we assume that the strain hardening-softening parameter is a function of suction and hydrate saturation for simplicity. Viscoplastic parameter is a function of the temperature .
Suction and the hydrate saturation are defined as:
where is the volume of void.
2.2. Perturbed Governing Equations
Next, in order to estimate the instability of the material system, we consider the equilibrium equation, the continuity equation, the energy balance equation, the constitutive equations, and the equation of hydrate dissociation rate in a perturbed configuration. In Equations (33)–(35), (41), (43), and (46), the unknowns are pore water pressure , pore gas pressure , strain , temperature , and moles of hydrate . For each unknown, we suppose that:
where the first terms on right side in Equation (50) indicate the values which satisfy the governing equations and the second terms are the perturbations of each variable. For the perturbations, we assume the following periodic form:
where is the wave number , is the rate of the fluctuation growth, and superscript indicates the amplitude of each variable.
Disregarding the changes in material density and considering the body force as constant, the perturbation of the equilibrium equation, Equation (35), is expressed by:
where the perturbed variables are indicated by a tilde. From Equation (46), the perturbation of the skeleton stress can be written as:
Since the strain hardening-softening parameter H is a function of the suction and the hydrate saturation, and the viscoplastic parameter µ is a function of temperature, the perturbations of H and µ are given as:
The parameter increases with an increase in the suction ; consequently, the slope of the curve is positive, i.e., . Similarly, increases with an increase in hydrate saturation , i.e., . On the other hand, viscoplastic parameter decreases with an increase in the temperature θ due to thermo-viscoplasticity; hence, is negative. Consequently, the term in Equation (55) is positive. Using Equation (51), and Equations (53)–(56), and considering , we obtain a spatial gradient of perturbed skeleton stress as:
Similarly, the perturbation of average pore pressure can be written as
In Equation (58), the degree of water saturation s, is a function of the suction the perturbation of the saturation is given as:
where indicates the slope of the curve. Using Equations (51), (58), and (59), we have a gradient of the perturbed average pore pressure as:
By substituting Equations (57) and (58) into Equation (52) and rearranging the terms, we obtain:
In a similar manner to the perturbed equation of the equilibrium equation, the continuity equations of water and gas, Equations (33) and (34), can be rewritten in the perturbed configuration as follows:
Considering Equations (41) and (51) gives the perturbation of the conservation of energy as follows:
Since the dissociation rate of the methane hydrates is a function of temperature , average pore pressure , and the moles of hydrate the perturbation of the dissociation rate can be written as:
By substituting Equations (51) and (58) into Equation (65), we obtain:
Finally, we rewrite the perturbed governing equations, Equations (61)–(64), and (69), in matrix form as:
For nonzero values of the amplitude of the perturbations, that is, , , , , and in Equation (70), the determinant of the matrix has to be equal to zero. Under the condition that , we have a polynomial function of as:
The details of coefficients are noted in Appendix A. Note that in Equation (71) the sign for , , , , , , , , , , , , , , , , , , , , , , , , , , are always positive, whereas the sign for and is negative. The sign for strain is positive in expansion and negative in compression, and strain rate can be positive or negative. The srain softening-hardening parameter is positive in viscoplastic hardening and negative in viscoplastic softening. Considering that the sign of each term and Equation (A.1), the sign of is always positive.
2.3. Conditions of Onset of Material Instability
In the following, we discuss the instability of the material system. If the growth rate of the perturbations , which is the root of Equation (73), has a positive real part, the perturbation diverges, and finally, the material system is unstable. On the contrary, if the real part of is negative, the material system is stable. The necessary and sufficient conditions that the all roots have negative real parts are given by the Routh-Hurwitz criteria. The necessary and sufficient conditions whereby the all the roots have negative real parts are given by the Routh-Hurwitz criteria. When the coefficient of the highest order of is positive, that is, , the necessary and sufficient conditions that all the roots have negative real parts are to satisfy all the equations from (i) to (iv) expressed below.
Let us discuss the first condition (i), because the material system might be unstable if at least one of the conditions described above is not satisfied. As for the other conditions (ii)–(iv), the coefficients are quite complicated as shown in Appendix A, and hence we discuss Equation (74).
2.3.1. Sign for the Coefficients and
First, we will compare the sign of coefficients and , because it is relatively easy to compare the sign. Considering the sign for the terms described above, is always positive:
Hence, when becomes negative, the first conditions of Routh-Hurwitz criteria is not satisfied, namely, the material system may become unstable:
From Equation (79), the material stability depends on strain hardening-softening parameter , strain , and the volume fraction of void and hydrate . We will consider two cases; the first case is the compressive strain and the second is the expansive strain .
- (A)
- : compressive strain
- (1)
- When parameter is positive, that is, the viscoplastic hardening, the term in is always positive. The sign for always becomes positive:
- (2)
- When the parameter is negative, that is, the viscoplastic softening, becomes negative, if it satisfies the following inequality:The material instability might occur even if it is viscoplastic hardening material.
- (B)
- : expansive strain
- (3)
- When parameter is positive, that is, the viscoplastic hardening, the term in becomes negative, if it satisfies the following inequality:
- (4)
- When parameter is negative, that is, viscoplastic softening, the term is always negative. Thus, the sign for is always negative. This may lead to the material instability, because it does not satisfy the first condition of the Routh-Hurwitz criteria:
If there are no hydrates in the material, namely, , can be written as:
The sign of the coefficients depends on only whether the material is viscoplastic hardening or softening.
In general, the material system is likely to be stable when it is in the viscoplastic hardening regions [18,19]. Of course, conditions of the onset of the material instability depends on not only the sign for and but also the other coefficients. The main point of this analysis is that the material instability may occur even in the viscoplastic hardening regions, in the case of the expansive strain. In other words, the expansive strain will make the material system unstable.
2.3.2. Sign for the Coefficients and
Next, we will discuss the sign for . Coefficient is given in Equation (A.2), and it can be regarded as a second order polynomial of the wave number :
where and indicate the coefficients associated with and , respectively. The coefficient of the highest order term of always positive, that is, is always positive. When the term is positive, the sign for becomes positive. It is difficult, however, to clarify the sign for because of complexity. Even when is negative and the term is larger than , becomes positive, that is:
Considering Equations (86) and (87), the conditions for which can be positive are obtained as follows:
- In the case of large values for , , and , can become positive more easily. In contrast, low permeabilities for water and gas make the material system unstable.
In this section, we have discussed the conditions for the onset of the instability of methane hydrate-bearing sediments by means of an analytical method using a simplified viscoplastic model and linear instability analysis. From the analysis, we found that material instability may occur in the case of both viscoplastic hardening and softening, and that the parameters , , and the hydrate saturation have a significant effect on the onset of the material instability. Furthermore, the sign for strain, that is, compression or expansion also has a significant effect on material instability, and expansive strain will make the material system unstable. The permeabilities for water , and gas are also essential parameters for material instability.
Since it is rather difficult to discuss the sign of coefficients a1–a4 and the other conditions of Routh-Hurwitz criteria due to the complexity, the material instability will be studied numerically. In the next section, the results of various numerical simulations of the dissociation-deformation problem using the one-dimensional finite element mesh will be presented in order to study the material instability by using the chemo-thermo-mechanically coupled model proposed by Kimoto et al. [9,10]. The results will be compared to those of the instability analysis.
3. Numerical Simulation of Instability Analysis by an Elasto-Viscoplastic Model Considering Methane Hydrate Dissociation
The effect of material parameters, especially the permeability, should be investigated. This is because in the previous section it was found that larger permeability makes the material system more stable. In the linear stability analysis, only the first condition of Routh-Hurwitz criteria have been discussed, because the other conditions are too complicated to be analyzed theoretically due to the complexity of the coefficients. In order to compensate insufficiency of the instability analysis and confirm the effect of permeability on the material instability, a series of parametric studies on the permeability is conducted in this part. The detailed conditions for the numerical simulation are described in the following section.
3.1. One-Dimensional Finite Element Mesh and Boundary Conditions
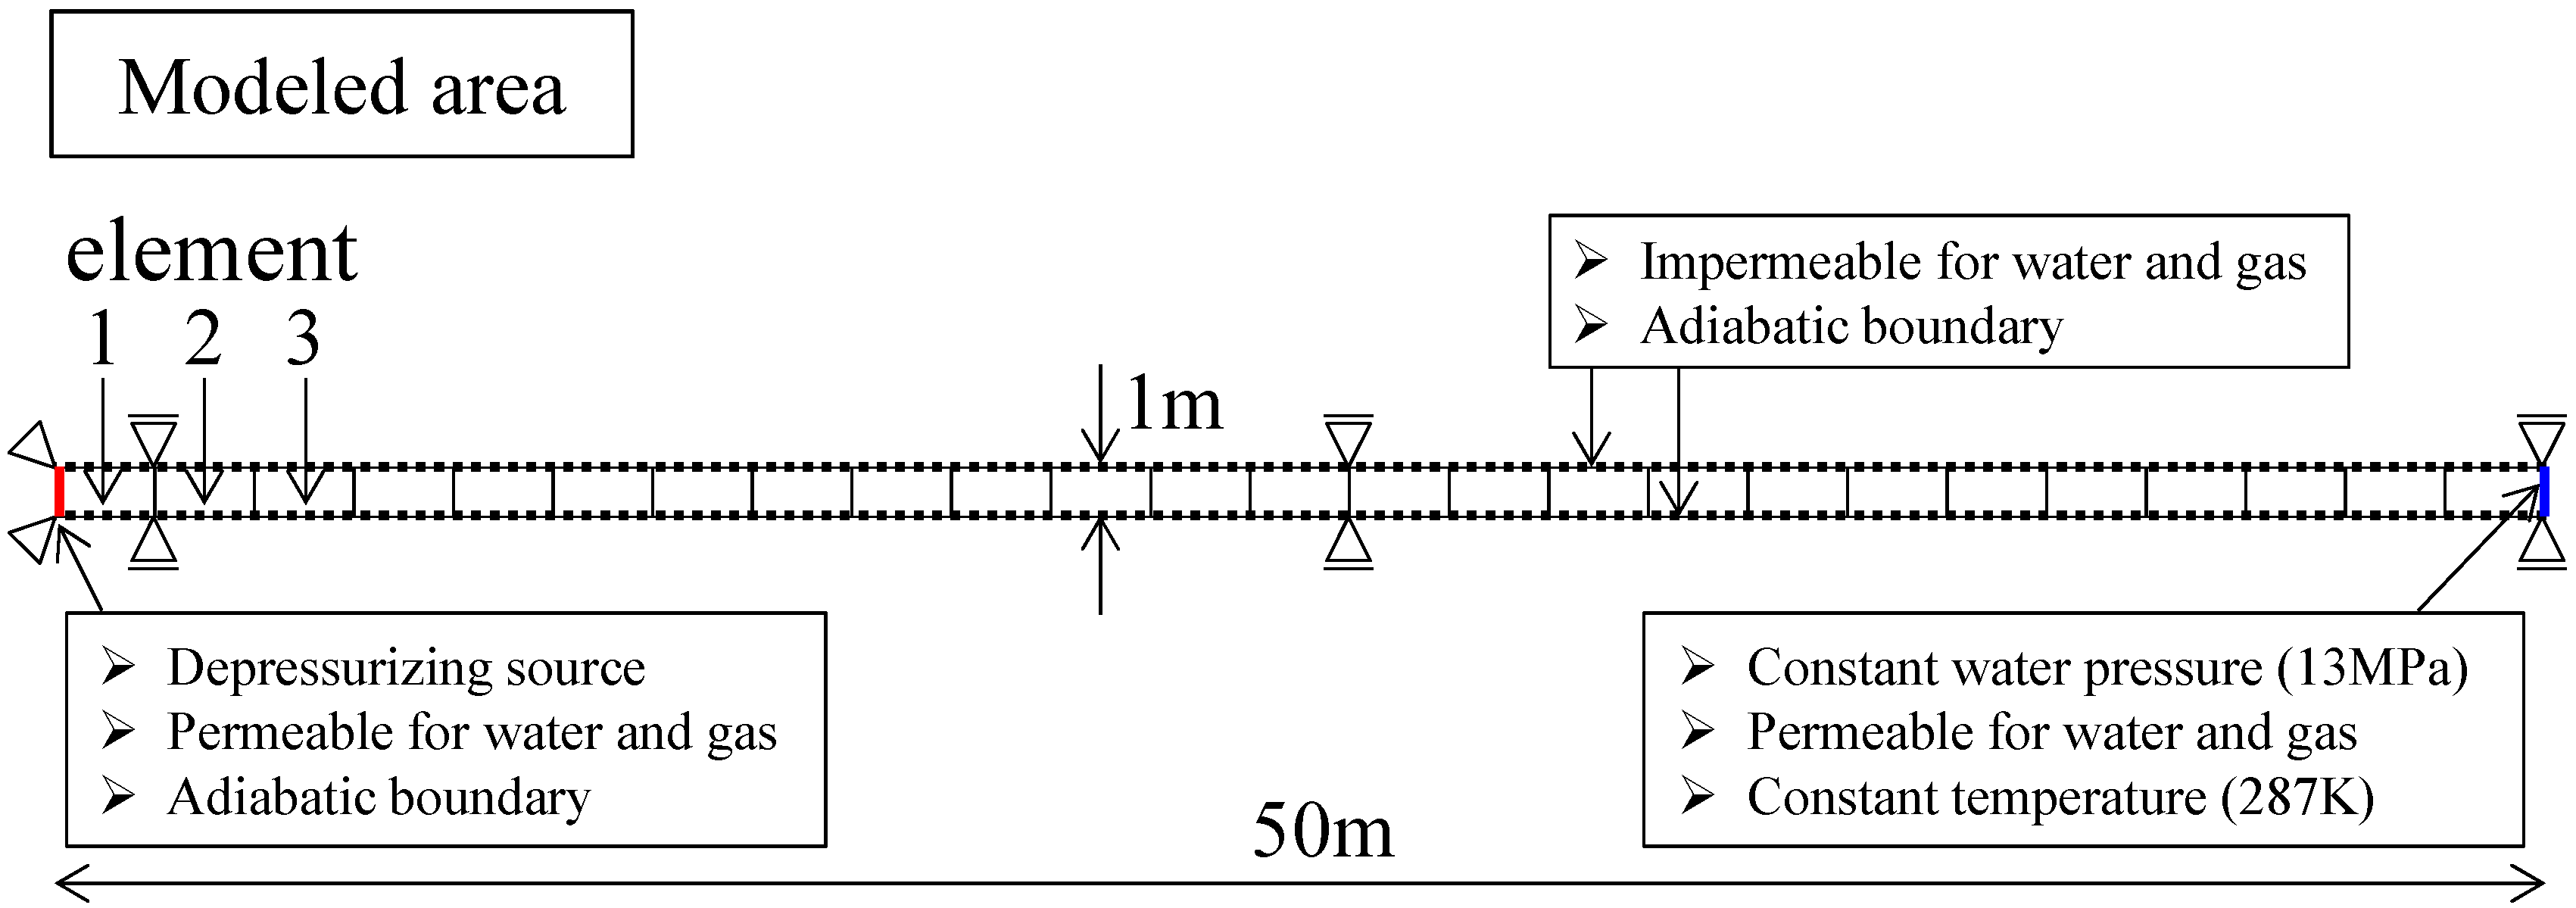
Figure 3 illustrates a schematic drawing of the target area of MH-bearing sediments for the numerical simulations, and the finite element meshes and boundary conditions used in the simulations are shown in Figure 4. The seabed ground, at a depth of about 350 m from the top of the seabed ground surface and at a water depth of 1010 m, is modeled. The MH-bearing layer lies at a depth of 290 m from the top of the ground surface with a thickness of 44 m. We assume the depressurization method for the hydrate dissociation, and the depressurizing source is set at the left boundary of the model from the surface of the seabed ground. For the finite element mesh, a homogeneous soil column in the horizontal direction with a thickness of 1 m is employed, as shown in Figure 4. The modelled seabed ground was just used to determine distributions of the initial stress, the initial temperature, and the initial pore pressure. The numerical simulations were performed to confirm the results of the linear stability analysis, not to fully simulate the real situation of the methane hydrate production.
The linear stability analysis was conducted under one-dimensional conditions for simplicity. In the numerical simulations part we have solved a one-dimensional problem in order to confirm the consistency of the results between the linear stability analysis and the numerical analysis, while the program code is written in two-dimensional plane-strain conditions. Consequently, the water and gas flow is limited to the one-dimensional flow by setting the no-flow boundary on the top and bottom surface. The left boundary is set to be permeable for water and gas and the adiabatic boundary. The top and bottom boundaries are set to be impermeable boundary so that the water and gas flow are limited to one-dimensional flow. The right boundary is also set to be permeable; however, the boundary conditions of the right boundary are set to be isothermal, namely, the temperature is kept constant at 287 K.
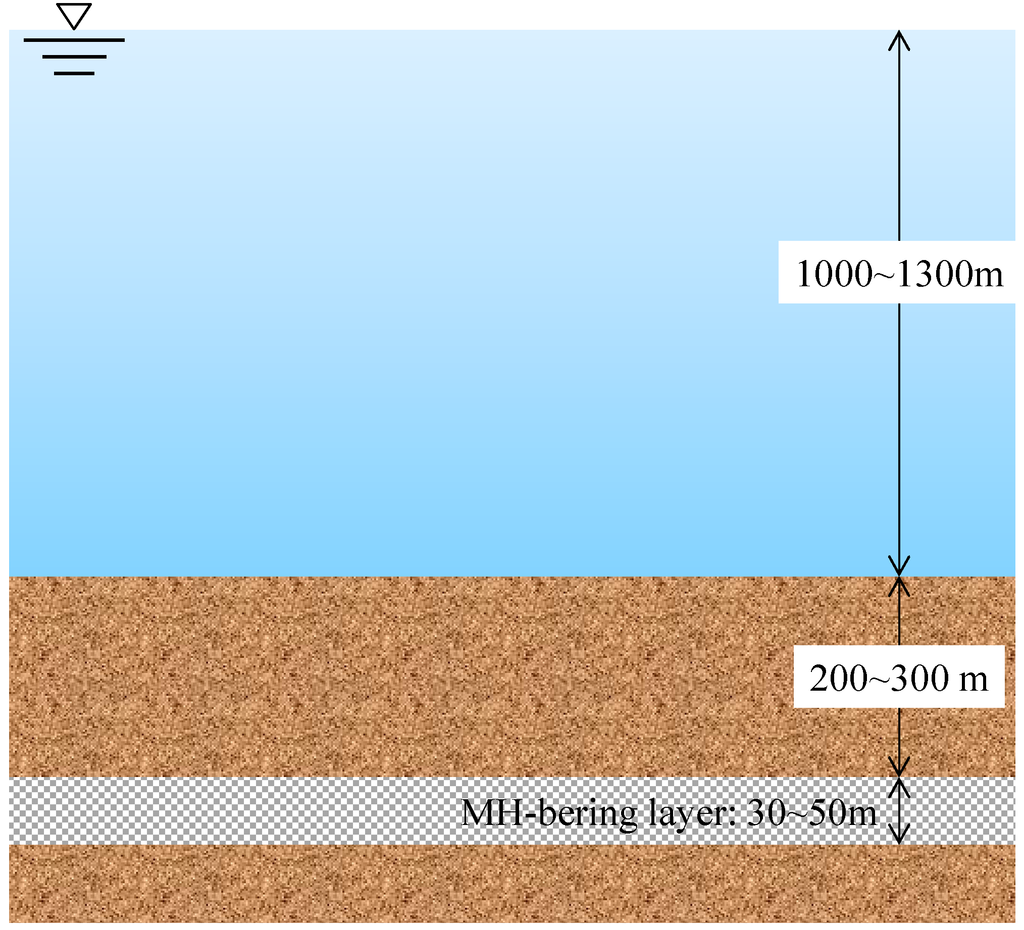
Figure 3.
Schematic view of the target area of MH-bearing sediments for the numerical simulations.
Figure 3.
Schematic view of the target area of MH-bearing sediments for the numerical simulations.
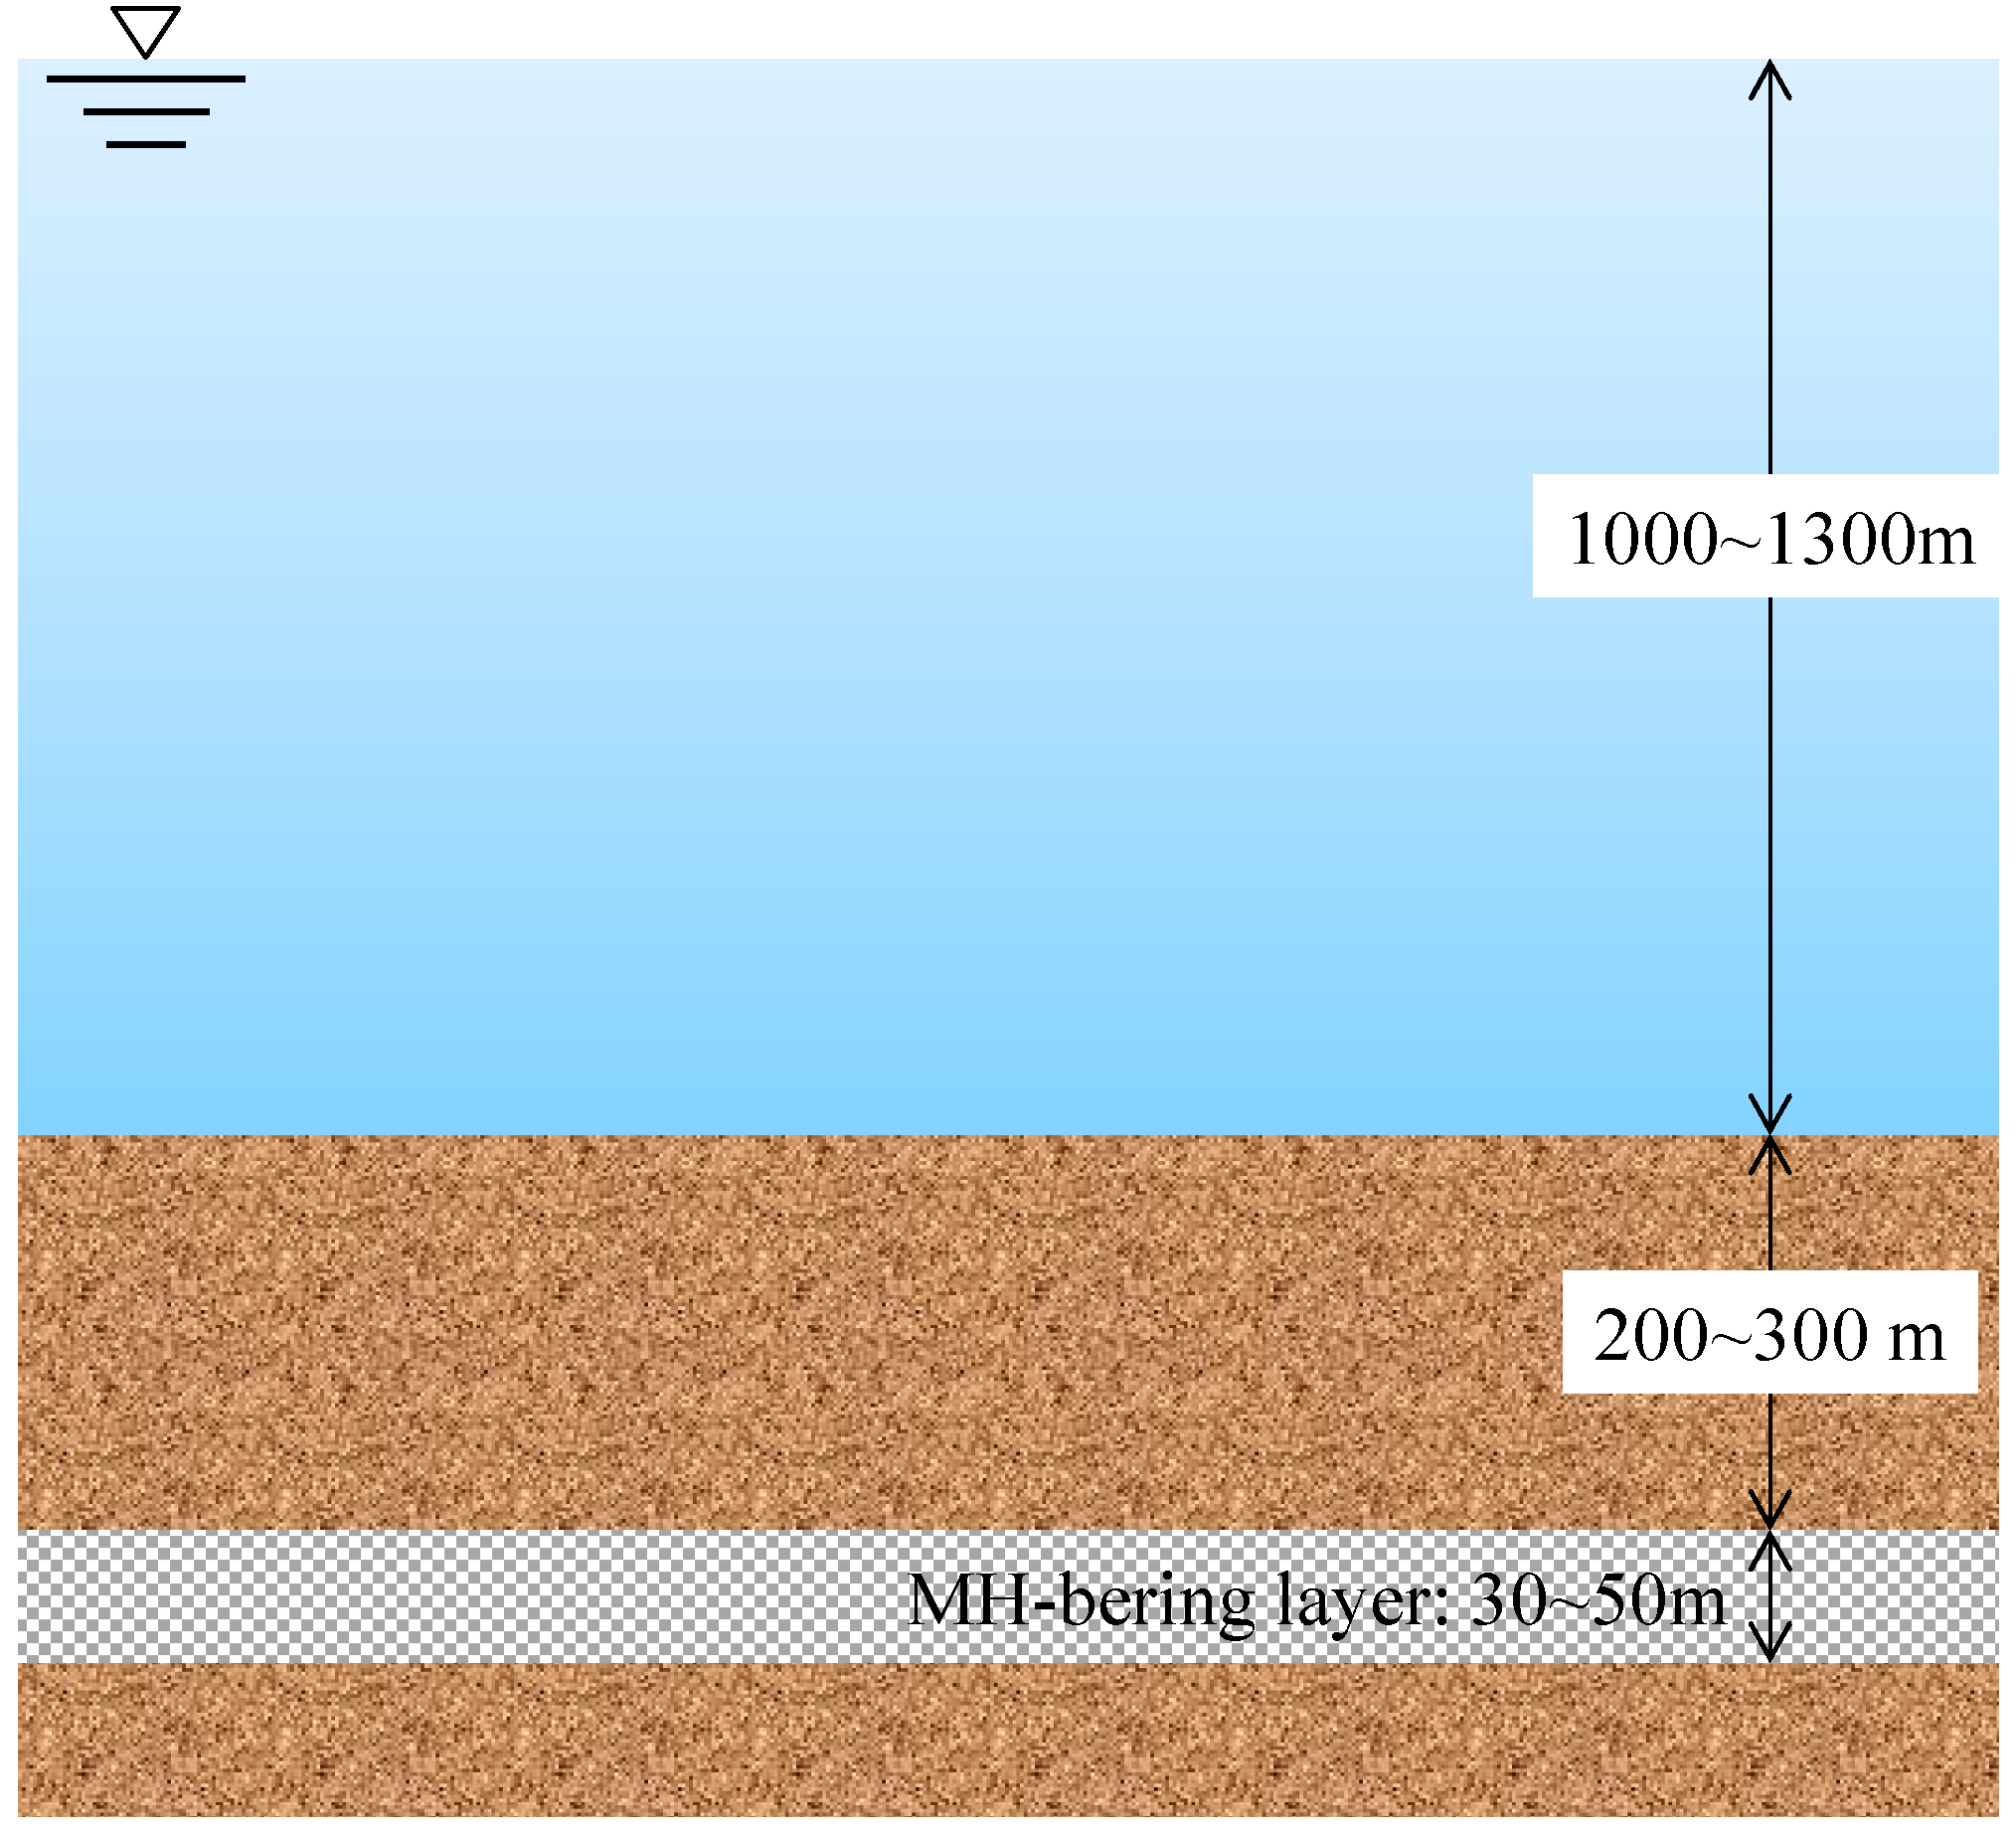
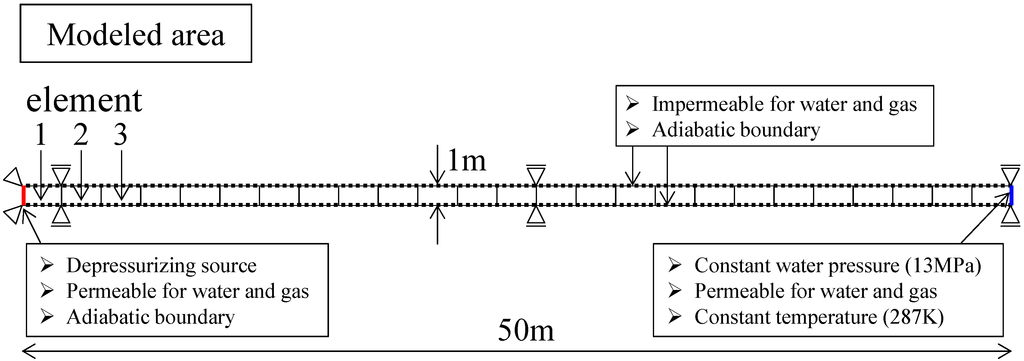
Figure 4.
Simulation model and boundary conditions.
Figure 4.
Simulation model and boundary conditions.
3.2. Initial and Simulation Conditions
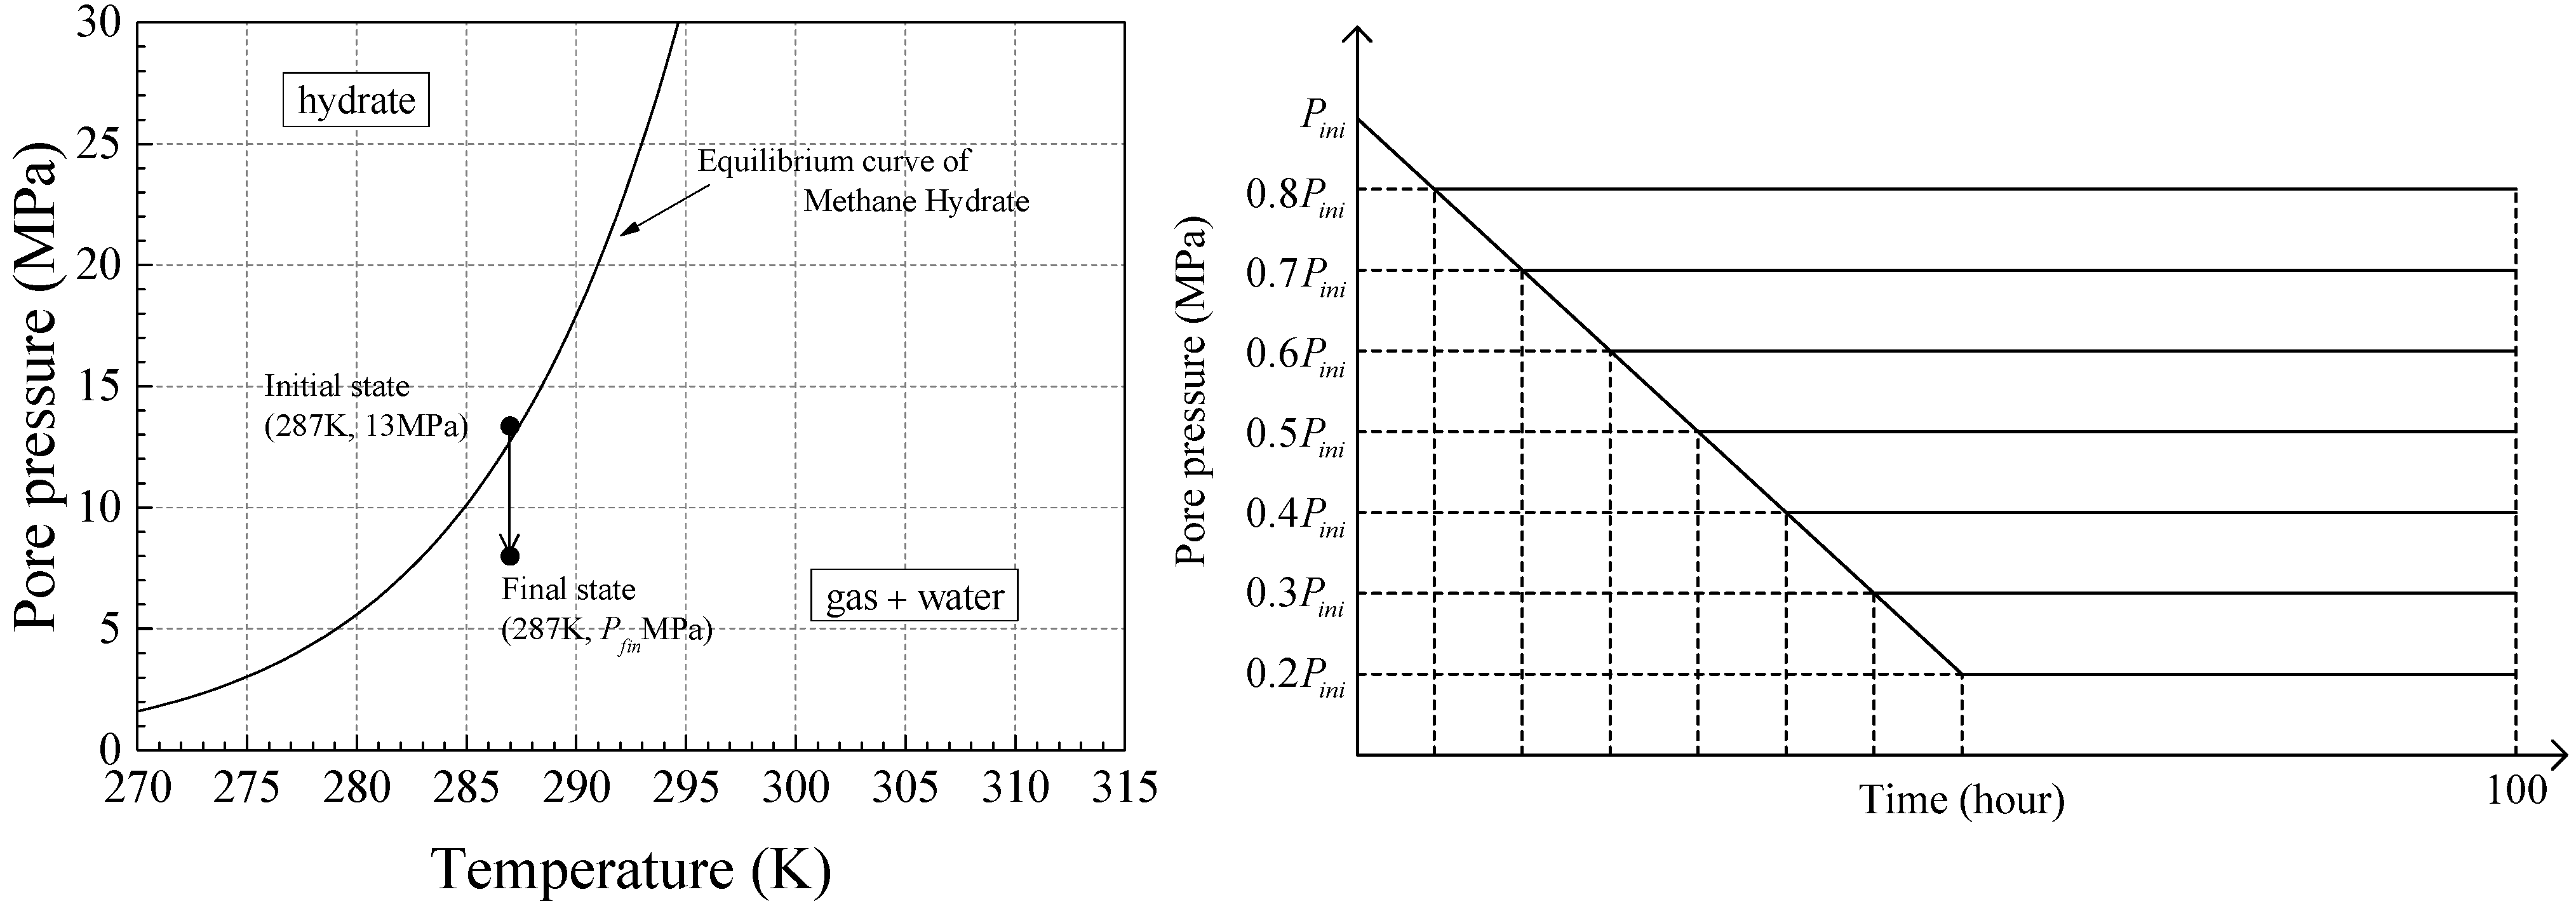
The initial state of the pore pressure and temperature at the depressurization source are shown in Figure 5 with the methane hydrate equilibrium curve. The initial pore water pressure is 13 MPa for all elements, which is the hydrostatic pressure, and the pore water pressure at the depressurization source is linearly reduced to the target pressure. The target value varies with respect to the initial pore pressure at depressurization source Pini; the degree of depressurization ΔP varies from 20% to 80% with increments of 10%, as shown in Figure 5. By changing the magnitude of the depressurization, it becomes possible to control the MH dissociation. The depressurizing rate for each case is the same, that is 0.116 kPa/s (10 MPa/day); thus, the time when the pore pressure at the depressurization source reaches the target value is different for the different cases. The total time of the simulation is 100 h for each case. In the simulations, the total calculation time (100 h) is determined by considering the depressurization rate and depressurization level. The depressurization rate is 0.116 kPa/s (10 MPa/day), which is almost the same as that of offshore methane hydrate production trial conducted by Japan Oil, Gas, and Metals National Corporation (JOGMEC) in March 2013 [25]. According to the rate, the depressurization will finish at about 6.2 h in the case of 20% of depressurization level, and even in the case of the maximum depressurization level, i.e., 80%, it will end at about 25 h. Another reason is that in each case the computation time takes more than 10 h, and we need vast amounts of h to calculate total 42 cases and more. Thus, the total simulation time is set to be 100 h.
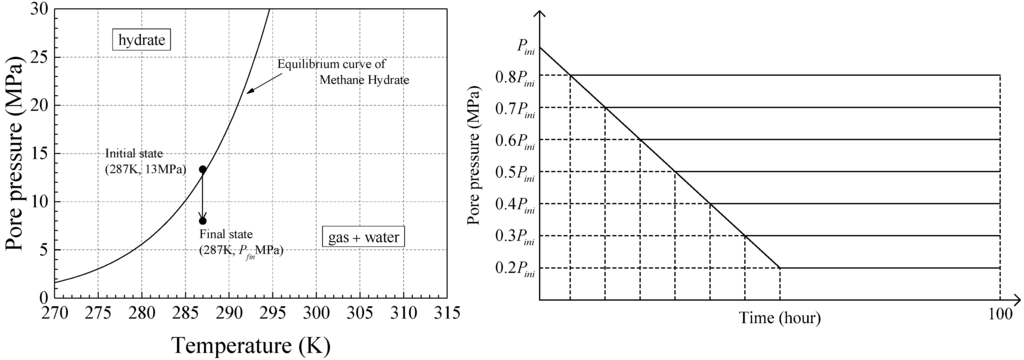
Figure 5.
Conditions of change in pore pressure change at the depressurization source.
Figure 5.
Conditions of change in pore pressure change at the depressurization source.
The initial conditions and material parameters are listed in Table 1 and Table 2, respectively. Initial void ratio is 1.00, and the initial hydrate saturation in the voids, , is 0.51, where the void ratio is defined by:

Table 1.
Initial conditions of the soil material.
| Name | Paremeter | Value |
|---|---|---|
| Initial Void Ratio | 1.00 | |
| Initial water saturation | 1.0 | |
| Initial hydrate saturation | 0.51 |

Table 2.
Material parameters for the constitutive equation.
| Name | Parameter | Value |
|---|---|---|
| Compression Index | 0.185 | |
| Swelling index | 0.012 | |
| Initial shear elastic modulus (kPa) | 53,800 | |
| Viscoplastic parameter (1/s) | 1.0 × 10⁻¹⁰ | |
| Viscoplastic parameter | 23.0 | |
| Stress ratio at critical state | 1.09 | |
| Compression yield stress (kPa) | 1882 | |
| Degradation parameter | 1.0 | |
| Degradation parameter | 0.0 | |
| Parameter for suction effect (kPa) | 100 | |
| Parameter for suction effect | 0.2 | |
| Parameter for suction effect | 0.25 | |
| Parameter for hydrate effect | 0.51 | |
| Parameter for hydrate effect | 0.6 | |
| Parameter for hydrate effect | 0.75 | |
| Thermo-viscoplastic parameter | 0.15 | |
| Permeability coefficient for water (m/s) | variable | |
| Permeability coefficient for gas (m/s) | ||
| Permeability reduction parameter | 7 |
The material parameters for the constitutive model are summarized in Table 2. The material parameters for the constitutive equation are mainly determined from the results of triaxial tests and its parametric studies, whose samples were obtained from the seabed ground at the Nankai Trough [26]. Constitutive equations used in this simulation follow the equations presented by Kimoto et al. [9], and details can be obtained in their paper.
In order to study the instability of the MH-bearing material system, different permeability values are considered as well as different levels of depressurization. The permeability for water changes from 1.0 × 10⁻³ to 1.0 × 10⁻⁸ (m/s), and the permeability for gas phases is set to 10 times the water permeability. The permeability coefficient for water and gas can be written as follows:
where g is gravity acceleration, is intrinsic permeability, μW and μG are the viscosity for water and gas, ρW and ρG are the density of water and gas, respectively. In the simulation, the seabed ground at 1300 m water depth is modelled, and the pore pressure at the initial state is around 13 MPa. Considering that the gas is treated as an ideal gas, the dynamic viscosity for gas phase vG becomes about 0.1 times that of the water phase, although it varies depending on the temperature. Consequently, the permeability coefficient for the gas phase becomes about 10 times larger than that of the water phase.
In addition, the permeability for water and gas depends on several parameters, i.e., phase saturation and , the void ratio , the hydrate saturation , and temperature. In the simulation, however, we especially focused on the effect of the void ratio and the hydrate saturation , and we used the following equations for the permeability. This is due to the fact that we do not consider the interaction between the air and the water, we only consider the interactions between air and solid skeleton, and water and solid skeleton:
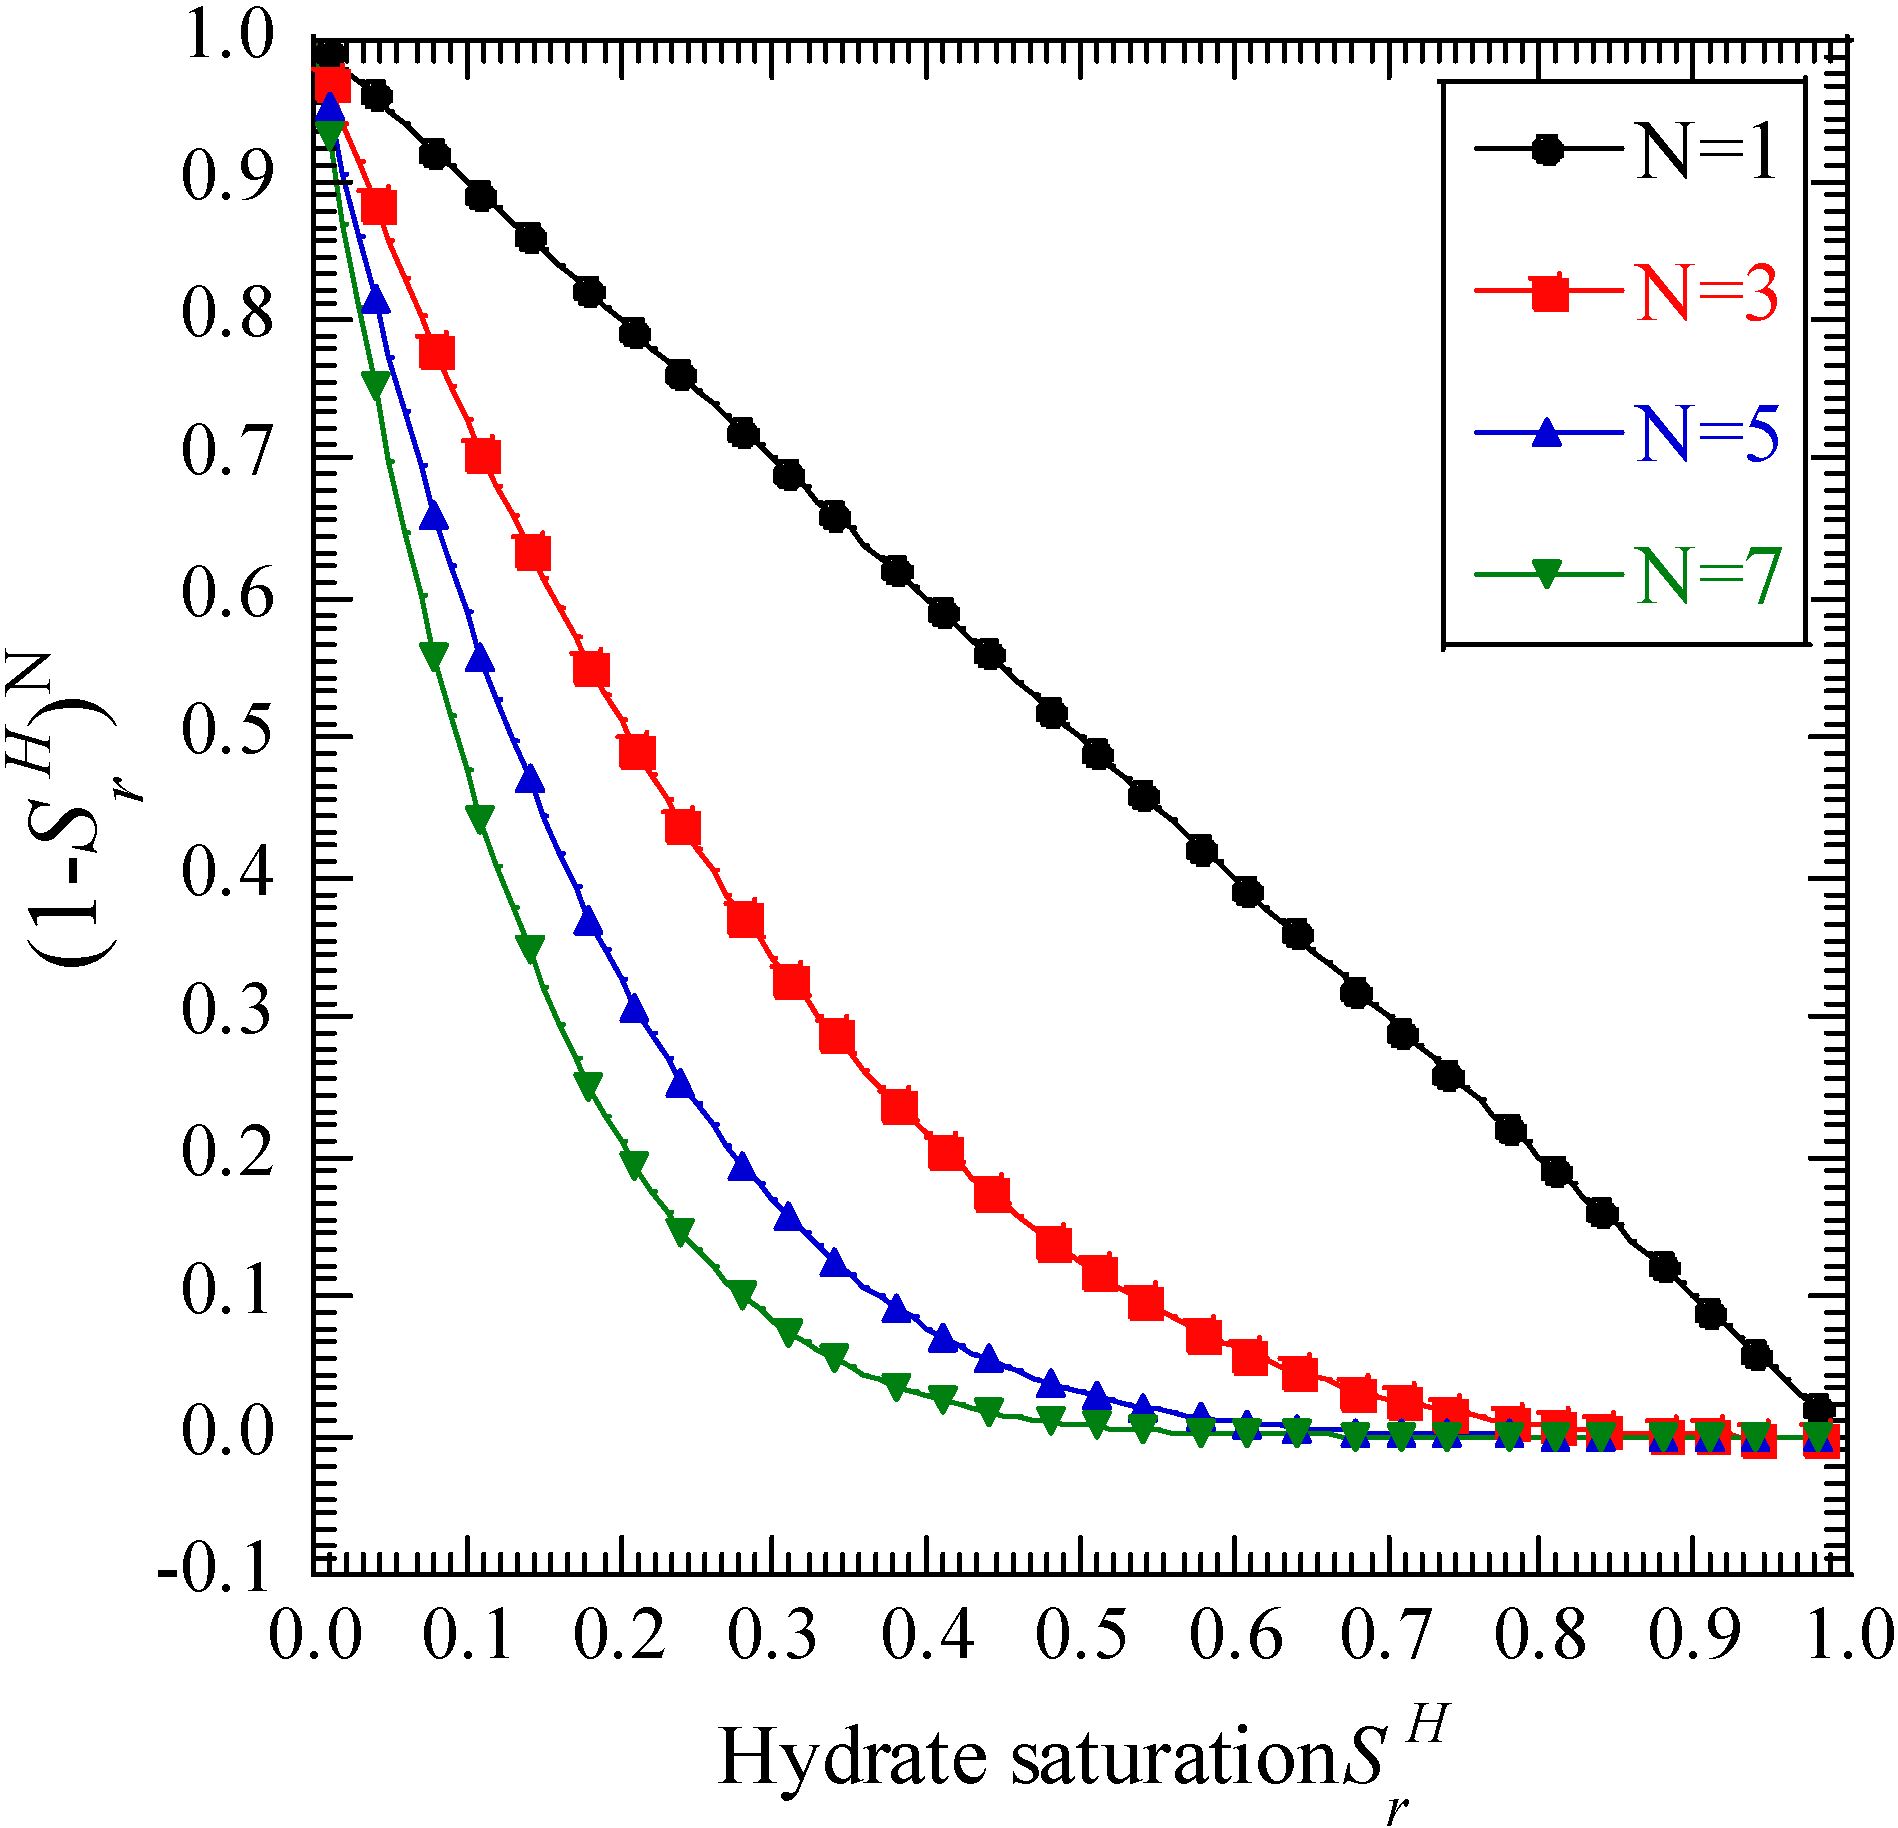
The permeability ratio can be defined as , and it varies from 1 to 0 with respect to the hydrate saturation as indicated in Figure 6.
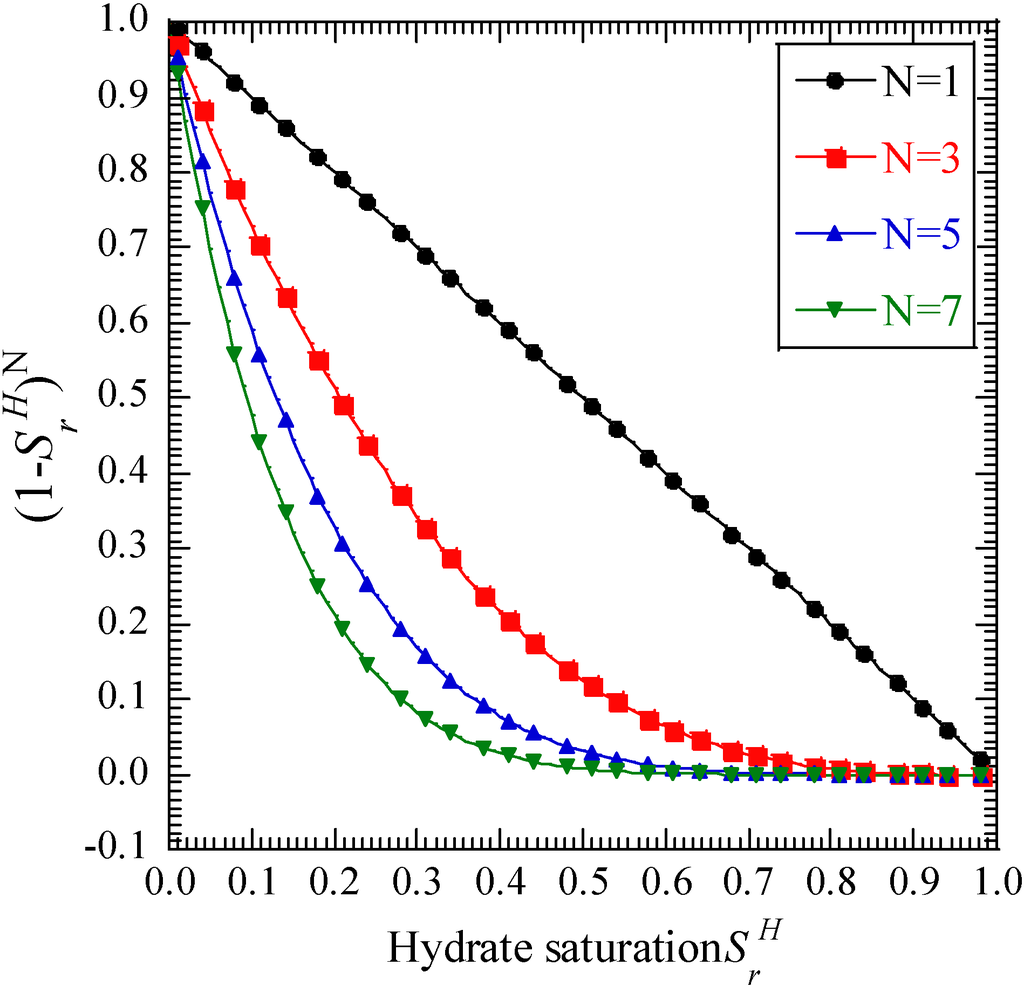
Figure 6.
Relationship between and the hydrate saturation with different values of N.
Figure 6.
Relationship between and the hydrate saturation with different values of N.
The initial state of the sediments is fully saturated by water, and it changes into unsaturated conditions due to the hydrate dissociation. In fact, there is little knowledge about how the gas behaves under fully or almost fully water saturated conditions. It may be quite a difficult problem and an important research subject to clarify the initiation of the gas flow in water-saturated ground. It is one of the reasons why the effect of the phase saturation is not considered.
The combinations of the permeability and the level of depressurization are listed in Table 3. The total number of cases is 42, that is, six permeability and seven depressurization levels. The case name “Case-i-j” indicates that the permeability for the water phase is 1.0 × 10−i (m/s) and the depressurization level is j (%). In the following section, the results of the numerical simulation and the discussion which intends to show a trend in the material instability will be presented.

Table 3.
Simulation conditions.
| Name | Values | Permeability (m/s) | |||||
|---|---|---|---|---|---|---|---|
| 1.0 × 10⁻³ | 1.0 × 10⁻⁴ | 1.0 × 10⁻⁵ | 1.0 × 10⁻⁶ | 1.0 × 10⁻⁷ | 1.0 × 10⁻⁸ | ||
| Degree of depressurization | 20% | Case-3-20 | Case-4-20 | Case-5-20 | Case-6-20 | Case-7-20 | Case-8-20 |
| 30% | Case-3-30 | Case-4-30 | Case-5-30 | Case-6-30 | Case-7-30 | Case-8-30 | |
| 40% | Case-3-40 | Case-4-40 | Case-5-40 | Case-6-40 | Case-7-40 | Case-8-40 | |
| 50% | Case-3-50 | Case-4-50 | Case-5-50 | Case-6-50 | Case-7-50 | Case-8-50 | |
| 60% | Case-3-60 | Case-4-60 | Case-5-60 | Case-6-60 | Case-7-60 | Case-8-60 | |
| 70% | Case-3-70 | Case-4-70 | Case-5-70 | Case-6-70 | Case-7-70 | Case-8-70 | |
| 80% | Case-3-80 | Case-4-80 | Case-5-80 | Case-6-80 | Case-7-80 | Case-8-80 | |
3.3. Simulation Results
Results of the Stable-Unstable Behavior during MH Dissociation
Figure 7 shows the results of the simulation for different values of the permeability and the depressurization levels. In the figure, the solid circles (●) indicates stable simulation results, while the (×) marks indicates unstable simulation results. The judgment of unstable or stable is given according to whether at least one mechanical, thermal or chemical variable diverges or not.
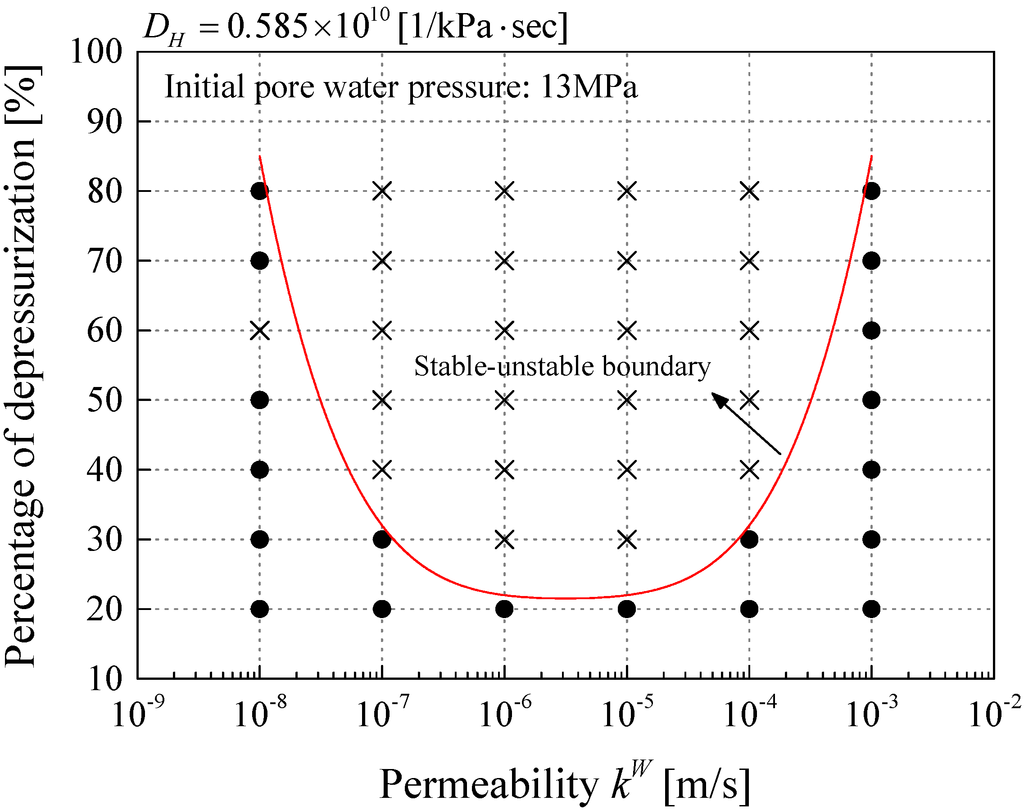
Figure 7.
Stable and unstable regions of permeability and the depressurization level during the MH dissociation process.
Figure 7.
Stable and unstable regions of permeability and the depressurization level during the MH dissociation process.
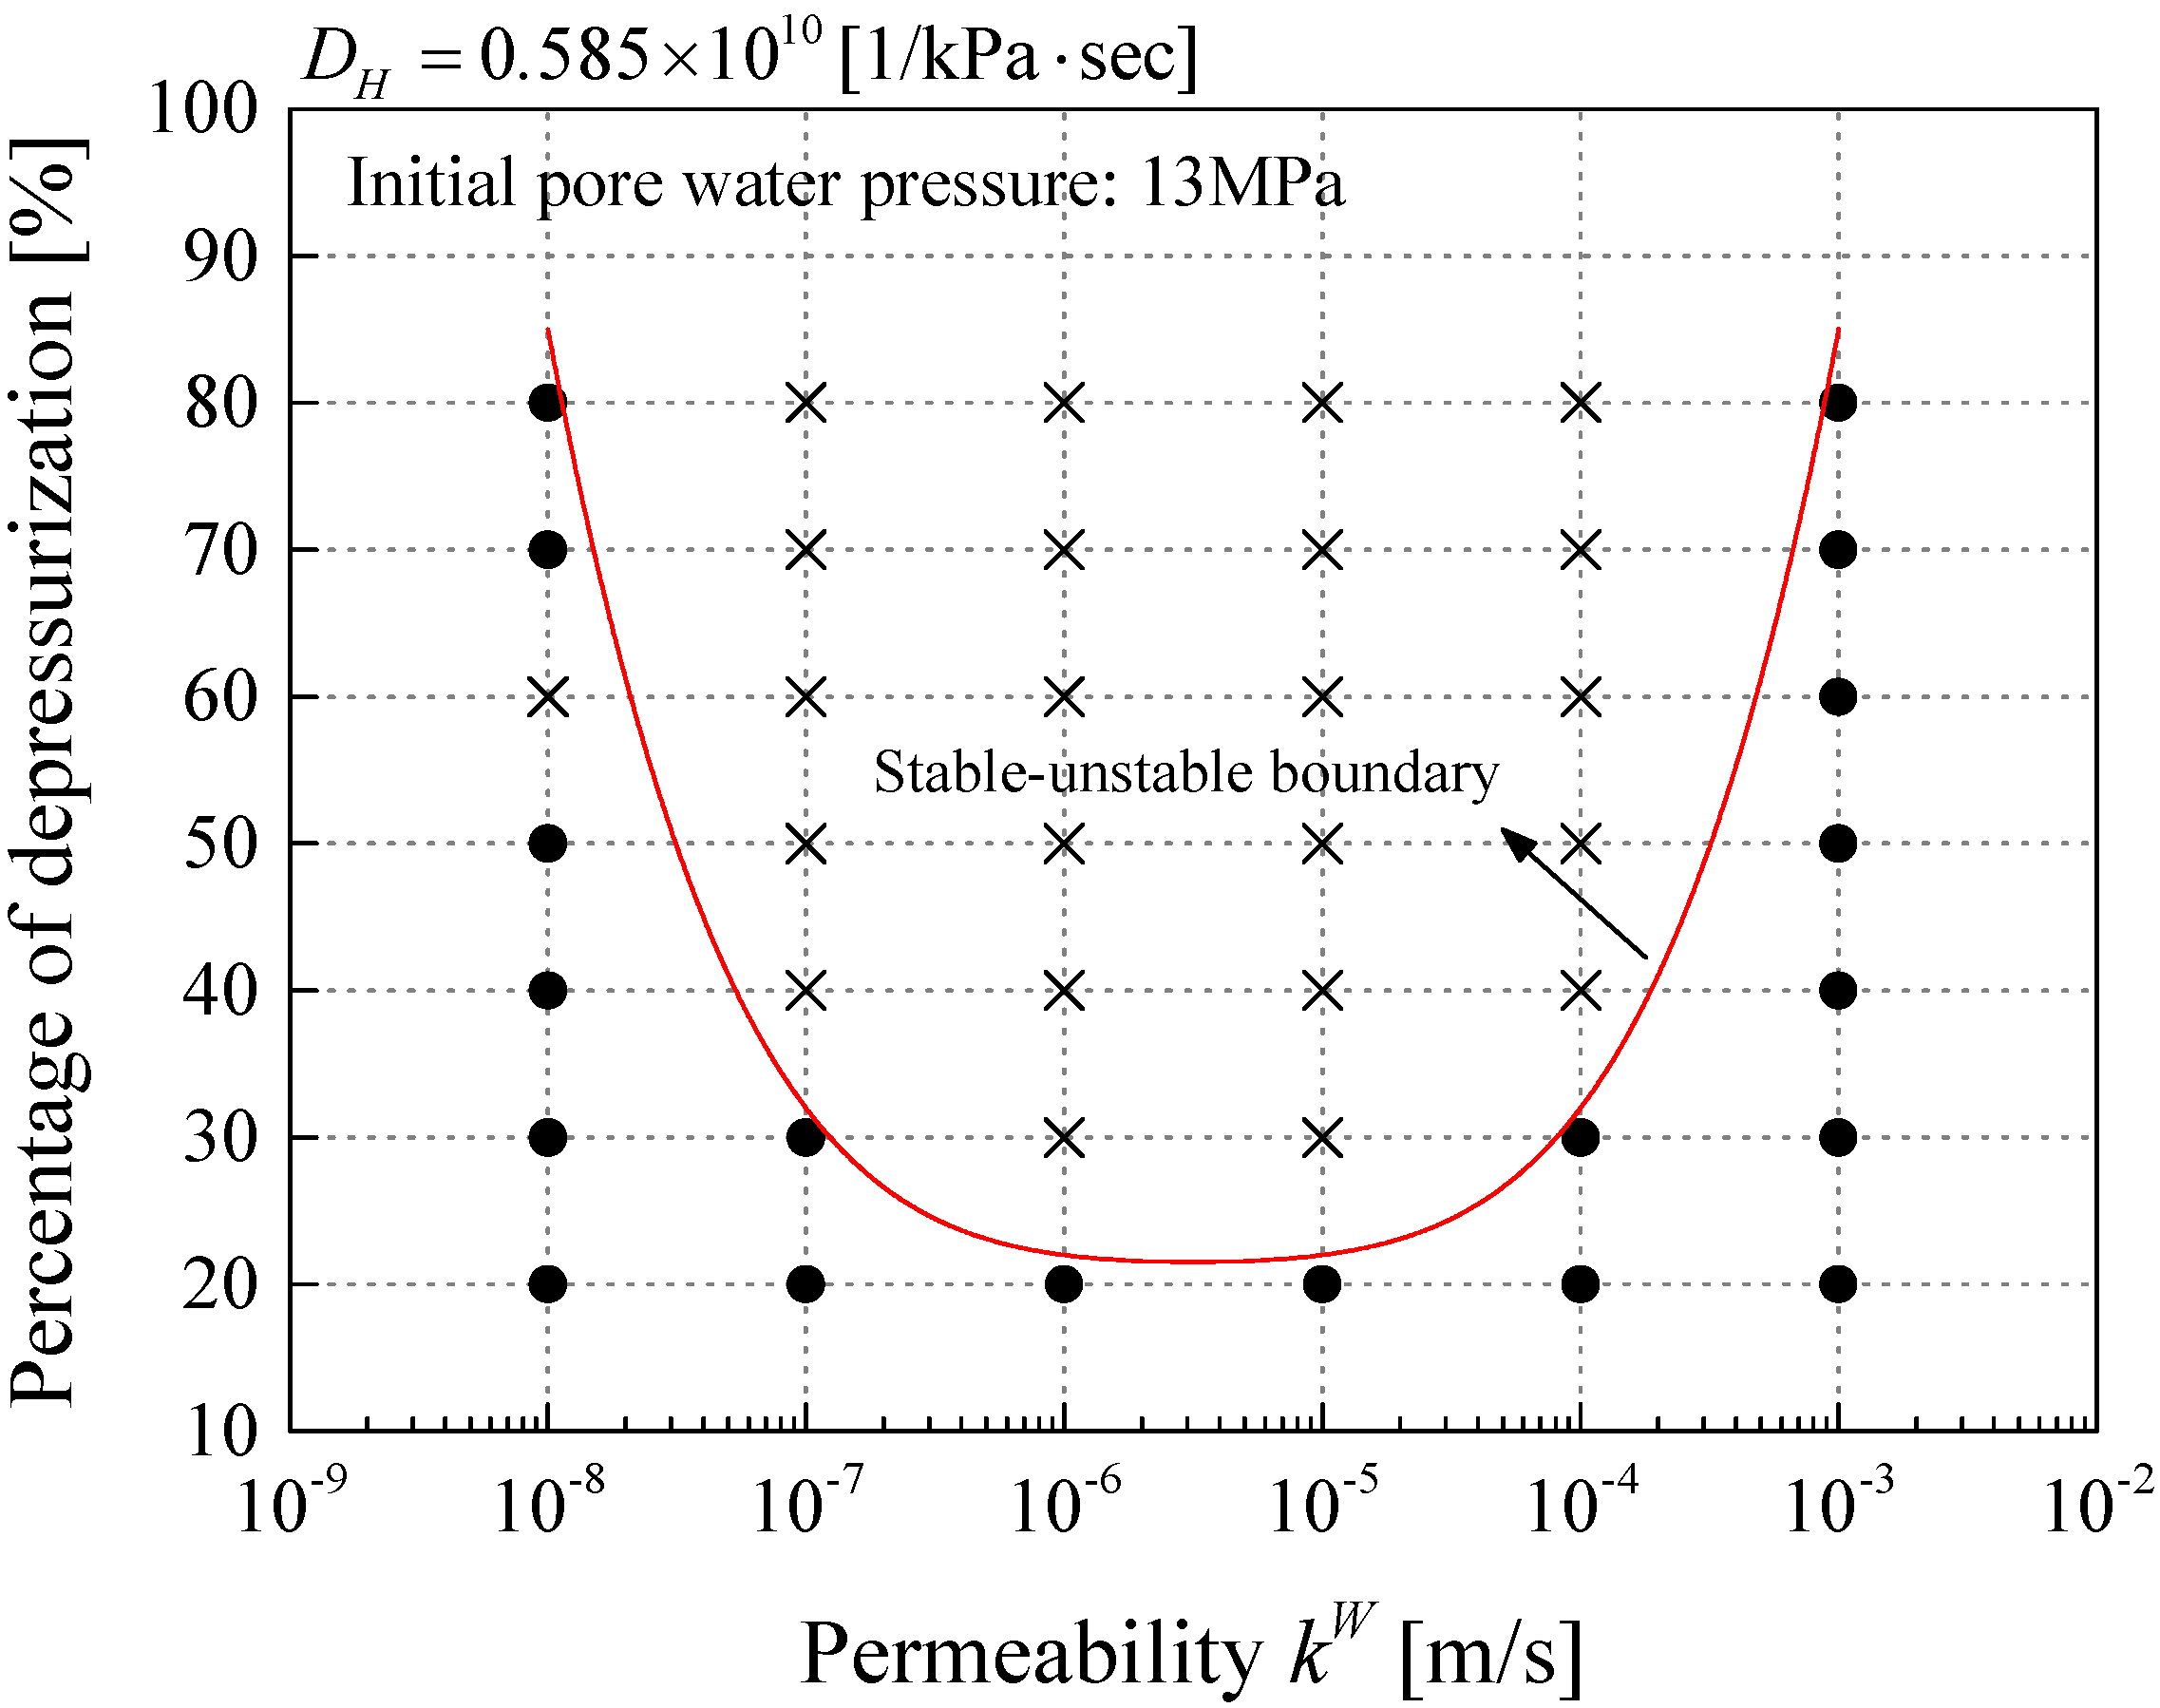
From Figure 7, it can be said that the material system basically becomes stable with an increase in permeability. That is because a large permeability will make the dissipation of the fluid pressure produced by the MH dissociation easier, while a reduction in pore pressure will reach farther away from the depressurization source and more MHs will dissociate due to the large permeability. In the case of relatively lower permeability, that is, kW = 1.0 × 10⁻⁷ and kW = 1.0 × 10⁻⁸, it becomes more stable for the large depressurization levels than in the cases of kW = 1.0 × 10⁻⁵ and kW = 1.0 × 10⁻⁶. The reason why the lower permeability makes the material system more stable is that the low permeability may limit the spreading of the depressurization; consequently, the area where the MHs dissociates becomes smaller and the production of the pore gas pressure is reduced. The balance between the permeability and the depressurization is one of the important factors in material instability. In order to investigate the details for the onset of material instability, several cases are selected, namely, two stable cases and two unstable cases. For the stable cases, we choose Case-4-30 and Case-7-30, which have the same depressurized level and different permeabilities, and for the unstable cases, Case-4-40 and Case-7-40 are chosen. In Case-4-30 and Case-7-30, the depressurization finishes after about 9.4 h, while in Case-4-40 and Case-7-40, it ends after 12.5 h.
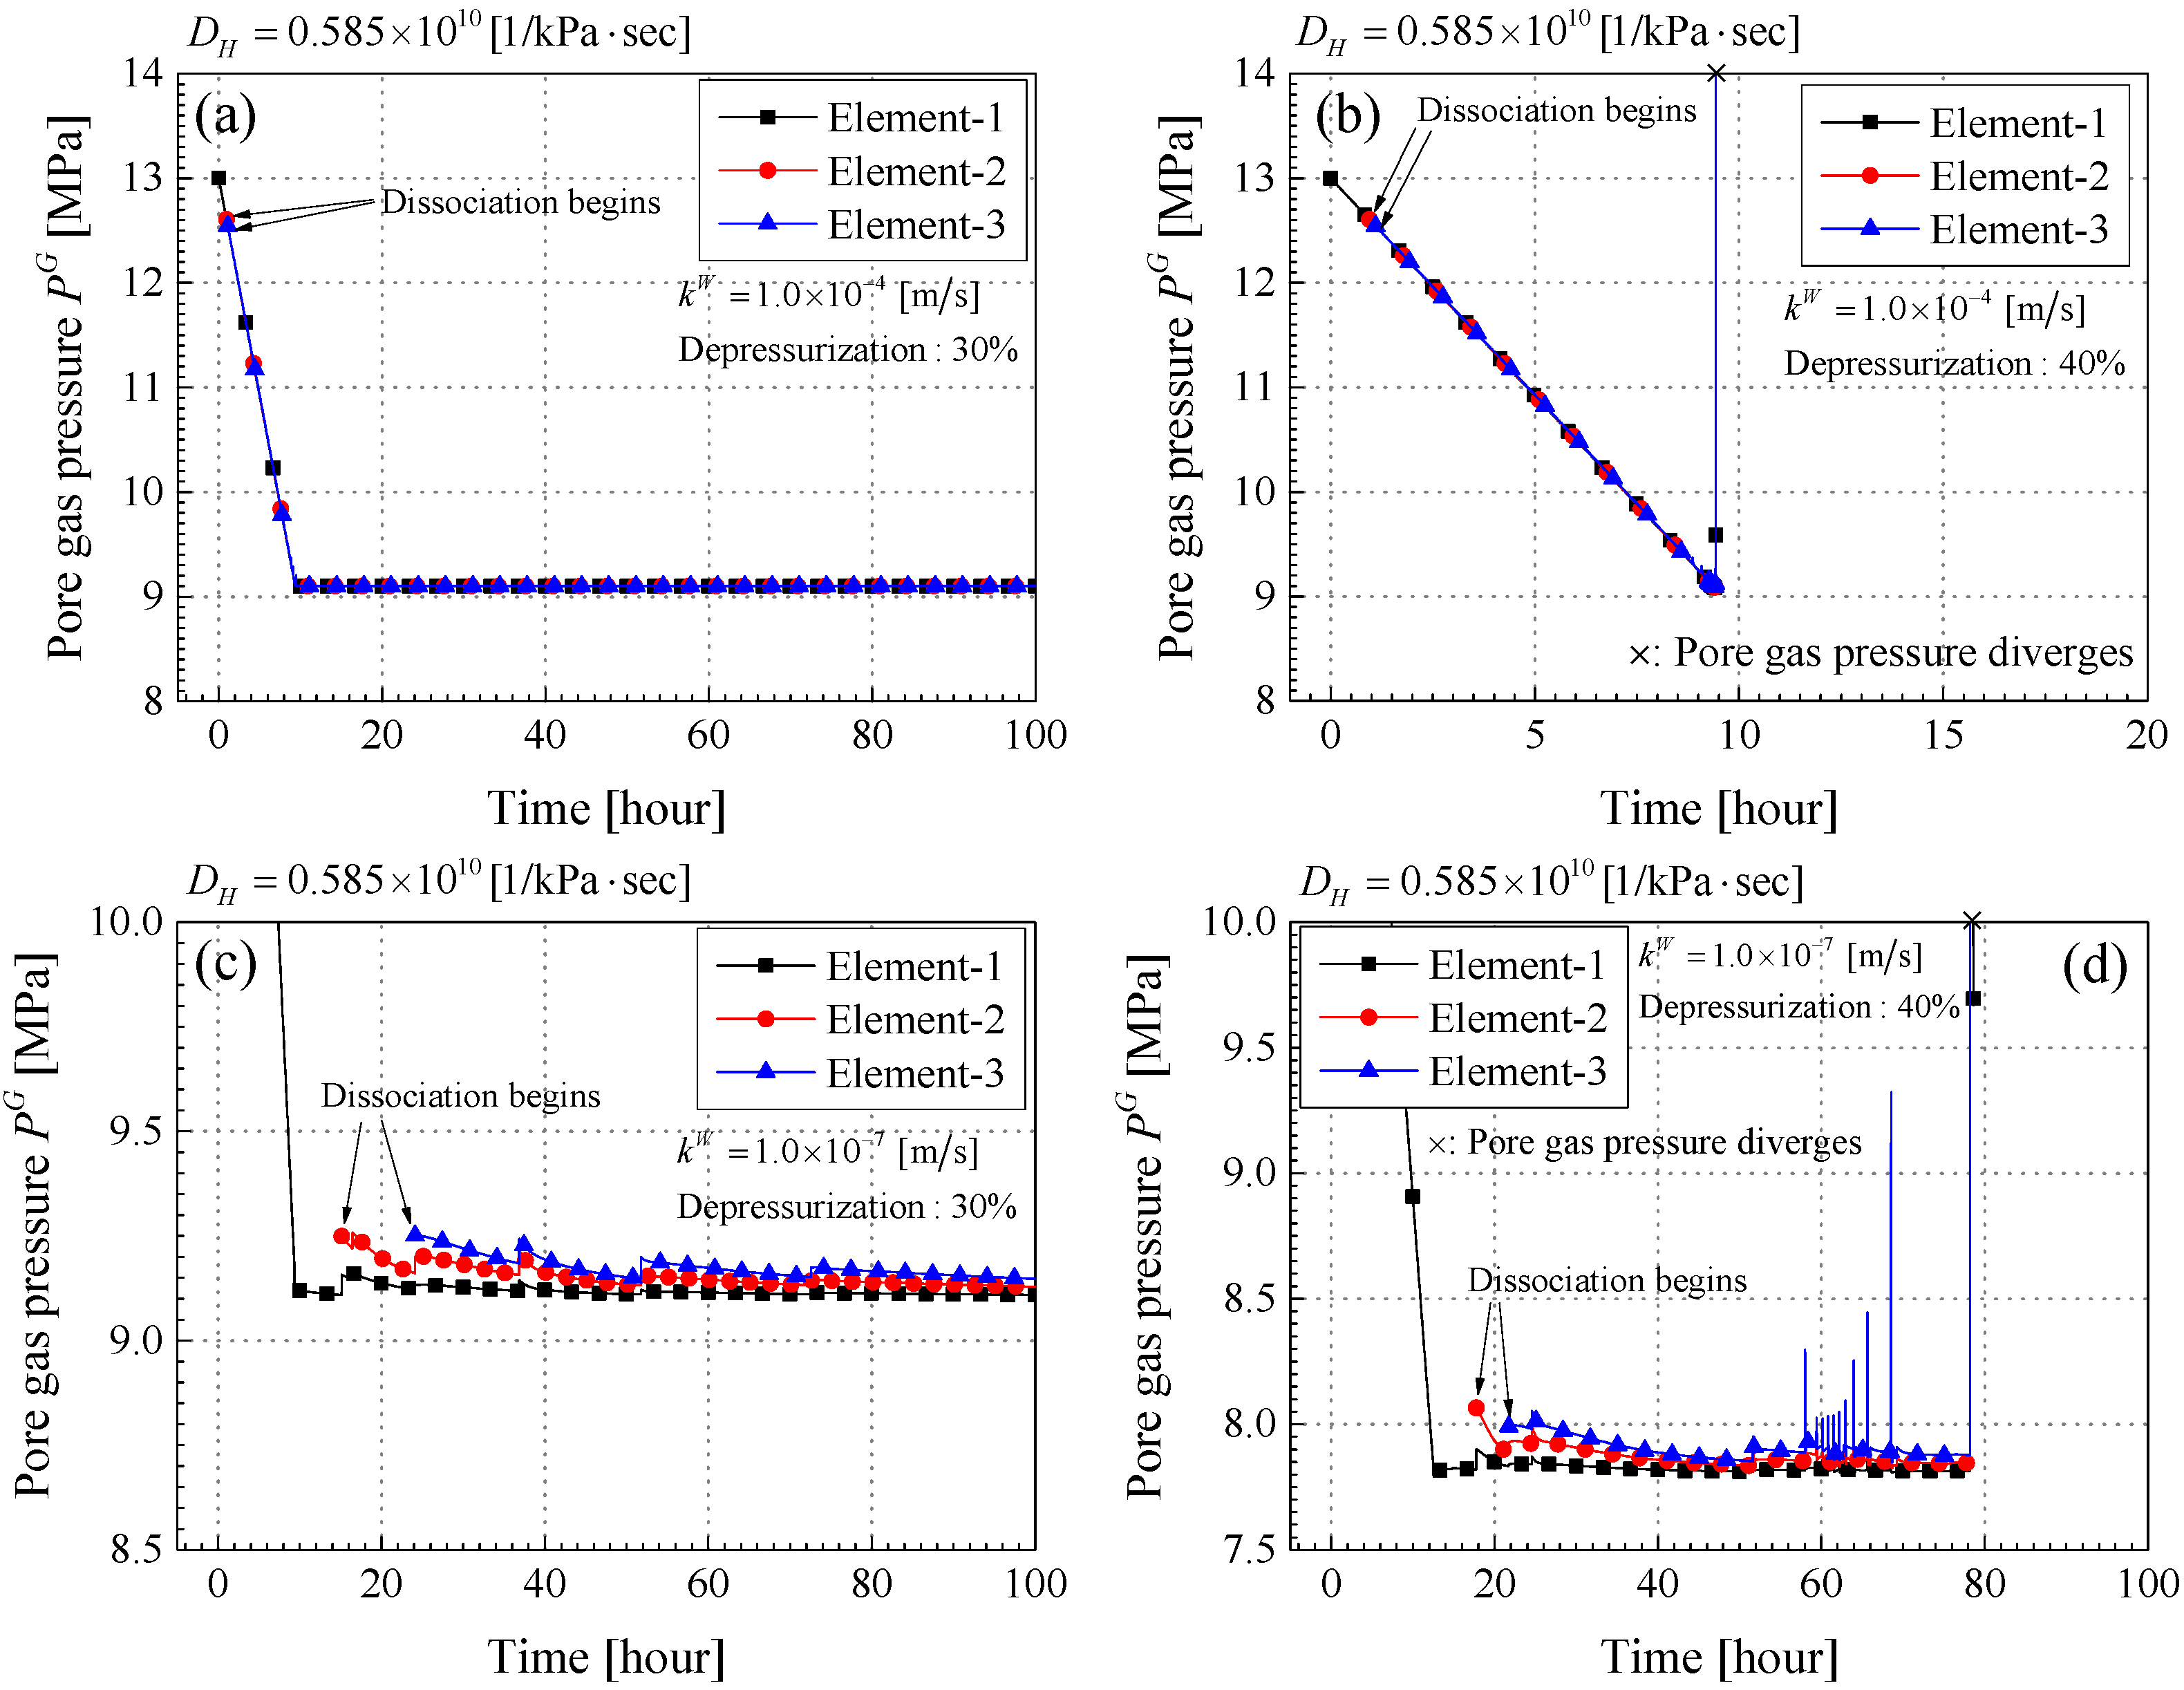
Figure 8a–d shows the time profiles of pore gas pressure PG (MPa) in elements-1, 2, and 3 for each case. The pore gas pressure is calculated in the elements where the MHs begin to dissociate. In Case-4-30, which is illustrated in Figure 8a, the pore gas pressure decreases with the progress of the depressurization. The production of pore gas pressure in elements-2 and 3 is initiated soon after that in element-1. This is because the depressurization spreads to the next element easily due to the large permeability. After that, the pore gas pressure in each element becomes the same value, which is consistent with the depressurized one. In Case-4-40, on the other hand, the pore gas pressure diverges just after 9.4 h, and the calculation stops as shown in Figure 8b. The large depressurization level may enhance gas production, and the permeability is not enough for the pore gas pressure to be allowed to dissipate. The time profiles of the pore gas pressure are the same as Case-4-30 until 9.4 h; the pore gas pressure in each element consists of the depressurized value due to the larger permeability.
The time profiles of the pore gas pressure in the case of low permeability, that is, Case-7-30 and Case-7-40, are different from those of larger permeability, as illustrated in Figure 8c,d. The pore gas pressure in both element-2 and element-3 is produced behind that of element-1, because it is difficult for the depressurization to spread due to the low permeability. In the case of large permeability, the pore gas pressure in each element decreased at the same level. In Case-7-30 and Case-7-40, however, the pore gas pressure becomes higher in the element farther away from the depressurization source. It sometimes increases rapidly, mainly because it is more difficult for the pore gas pressure to dissipate than in the case of large permeability. In Case-7-40, the pore gas pressure becomes the high pressure level after about 60 h. Finally, it diverges at 78 h and the calculation stops, as shown in Figure 8d. The behavior of the pore gas pressure is unstable. The large degree of the depressurization produces a larger amount of gas than in Case-7-30, and this makes the material unstable.
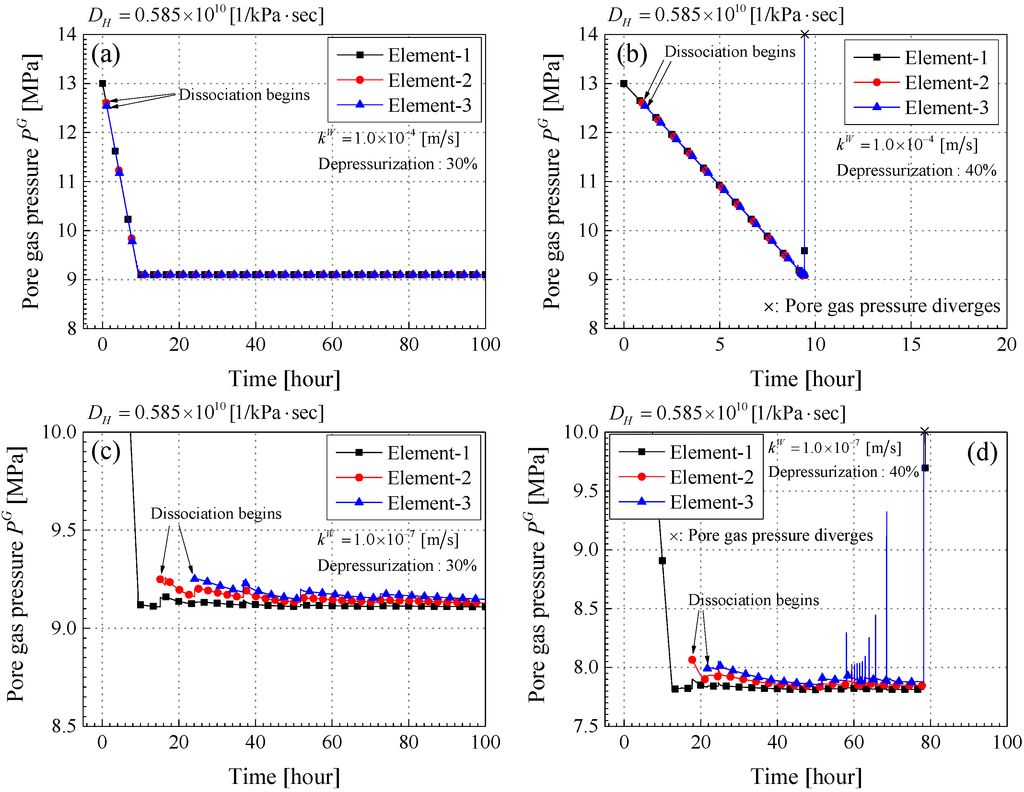
Figure 8.
Time profiles of the pore gas pressure PG (MPa) (a) Case-4-30; (b) Case-4-40; (c) Case-7-30; (d) Case-7-40.
Figure 8.
Time profiles of the pore gas pressure PG (MPa) (a) Case-4-30; (b) Case-4-40; (c) Case-7-30; (d) Case-7-40.
From the pore pressure and pore gas pressure results we calculated the Reynolds number of the water and the gas flow in Element-1 in Case-4-30. First, the water velocity becomes 8.4 × 10⁻⁴ (m/s), which can be estimated from the gradient of the pore pressure and the permeability indicated in Equation (90). As for a diameter of the groundwater flow, an average grain size is often used in the geomechanics field. Therefore, we use , which is the value of fine sand or silt. Dynamic viscosity for water is 1.52 × 10⁻⁶ (m2/s), at a temperature of 5 degrees. The Reynolds number parameters are listed in Table 4. Substituting those values into the Reynolds number equations, we obtain for the water flow.

Table 4.
Parameters for calculating Reynolds number of water flow.
| Variable | Value |
|---|---|
| vW | 8.4 × 10⁻⁶ m/s |
| D50 | 0.15 mm |
| vW (5 °C, 10 MPa) | 1.52 × 10⁻⁶ m2/s |
As for the gas flow, we have also calculated Reynolds number in the same manner as the water flow. Table 5 indicates the parameters for calculating Re of the gas flow. Reynolds number of the gas flow becomes . For both the water and the gas flow, Reynolds number becomes less than 1–10, although it is a rough estimation. Consequently, Darcy’s law introduced in Equations (36) and (37) is valid to describe the fluid flow.

Table 5.
Parameters for calculating Reynolds number of gas flow.
| Variable | Value |
|---|---|
| vG | 8.4 × 10⁻⁵ m/s |
| 0.15 mm | |
| vG (5 °C, 10 MPa) | 1.72 × 10⁻⁷ m2/s |
In order to see the behavior of MH dissociation, the time profiles of the MH remaining ratio are illustrated in Figure 9a–d. The MH remaining ratio is defined as the percentage of the current moles of MHs with respect to the initial moles, that is:
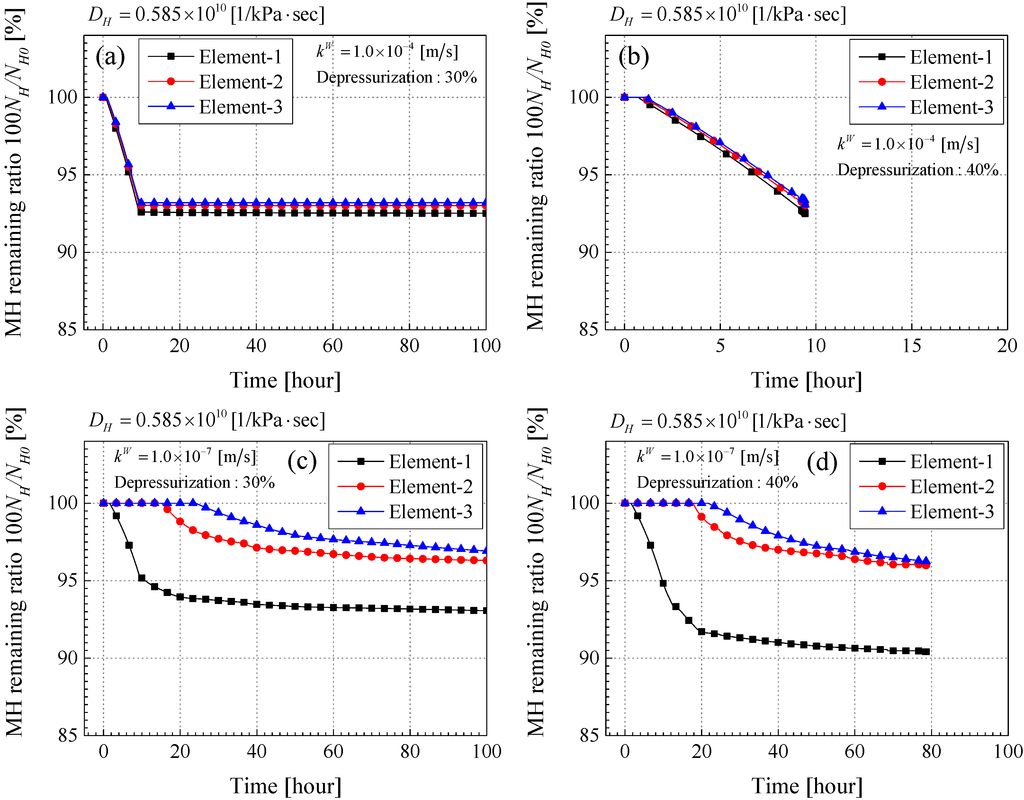
Figure 9.
Time profiles of the remaining MH ratio (%). (a) Case-4-30; (b) Case-4-40; (c) Case-7-30; (d) Case-7-40.
Figure 9.
Time profiles of the remaining MH ratio (%). (a) Case-4-30; (b) Case-4-40; (c) Case-7-30; (d) Case-7-40.
In the case of large permeability, the ratio decreases equally in each element. This means that the effect of the depressurization spreads to a similar extent because of the large permeability. When the depressurization stops at 9.4 h, the MH remaining ratio becomes almost constant in Case-4-30. In the case of lower permeability, on the other hand, the behavior of the ratio differs among the elements. As for the remaining MH ratio in element-2 and element-3, the dissociation starts behind that of element-1; the MH dissociation begins after 15 h in element-2 and after 24 h in element-3. This is because it is hard for the depressurized area to spread due to the low permeability and the amount of dissociated MHs is lowered. It may become evidence that the material system becomes more stable even in the case of the lower permeability. The reduction of the ratio continues moderately even after finishing the depressurization at 9.4 h in Case-7-30, meanwhile it becomes constant after 9.4 h in Case-4-30. This indicates that a lower permeability can reduce the total amount of MH dissociation more than that of a higher permeability. However, the dissociation will continue for a long term. Both Case-4-40 and Case-7-40 are the unstable results; the calculation stops after 9.4 h in Case-4-40 and after 78 h in Case-7-40. It can be said that the material instability may occur in the short term, namely, during dissociation in the case of the larger permeability, and in the lower one, the material instability has to be considered over a long span, namely, even after the depressurization. Figure 10a–d and Figure 11a–d show the time profiles of the average pore pressure and the mean skeleton stress , respectively.
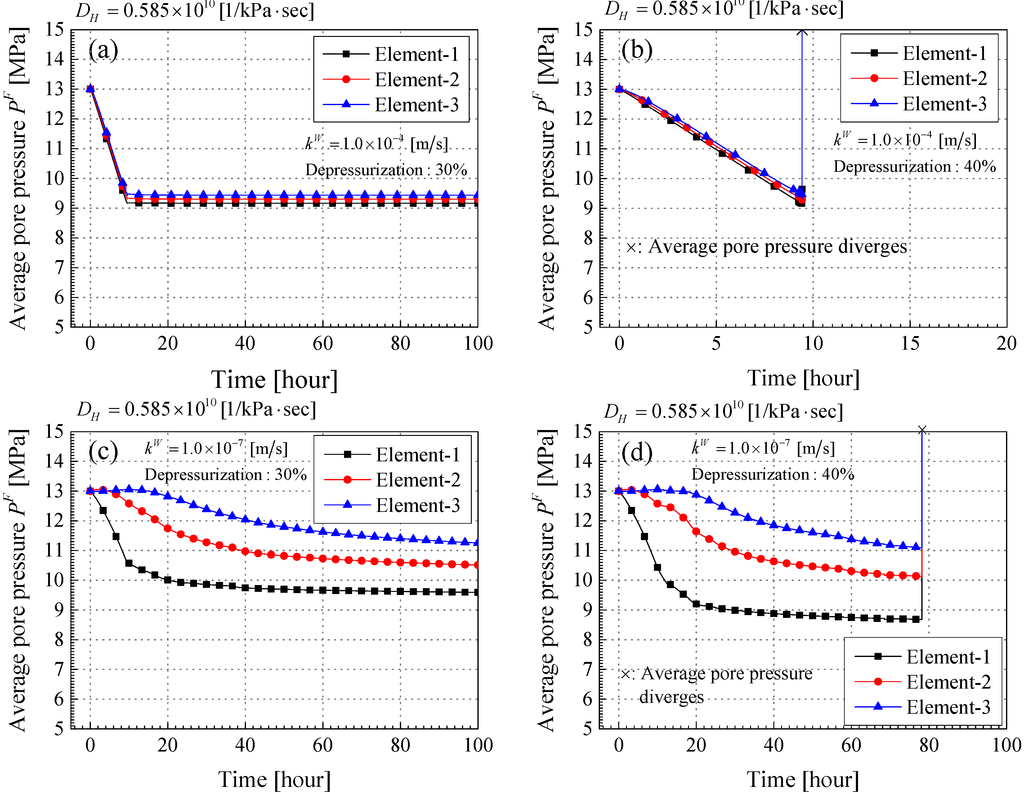
Figure 10.
Time profiles of the average pore pressure PF (MPa). (a) Case-4-30; (b) Case-4-40; (c) Case-7-30; (d) Case-7-40.
Figure 10.
Time profiles of the average pore pressure PF (MPa). (a) Case-4-30; (b) Case-4-40; (c) Case-7-30; (d) Case-7-40.
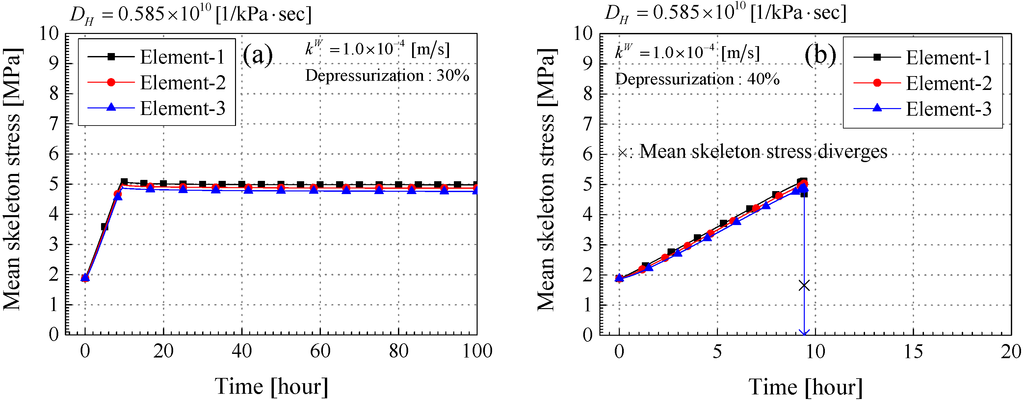
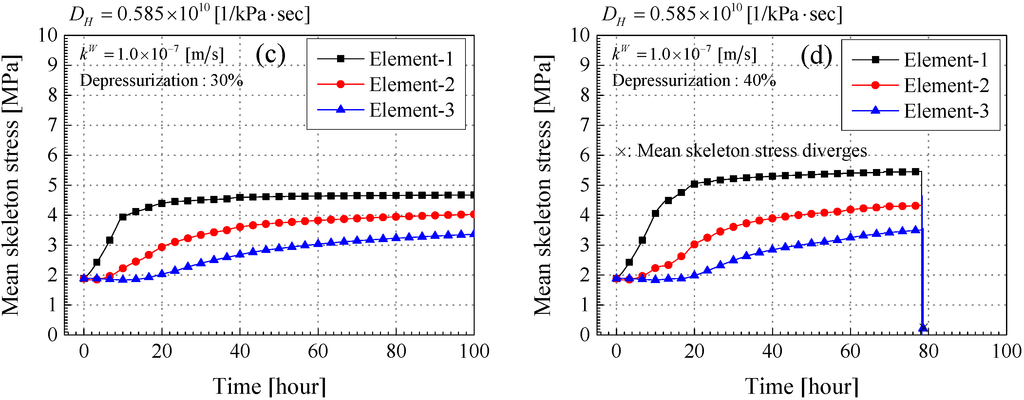
Figure 11.
Time profiles of the mean skeleton stress (MPa). (a) Case-4-30; (b) Case-4-40; (c) Case-7-30; (d) Case-7-40.
Figure 11.
Time profiles of the mean skeleton stress (MPa). (a) Case-4-30; (b) Case-4-40; (c) Case-7-30; (d) Case-7-40.
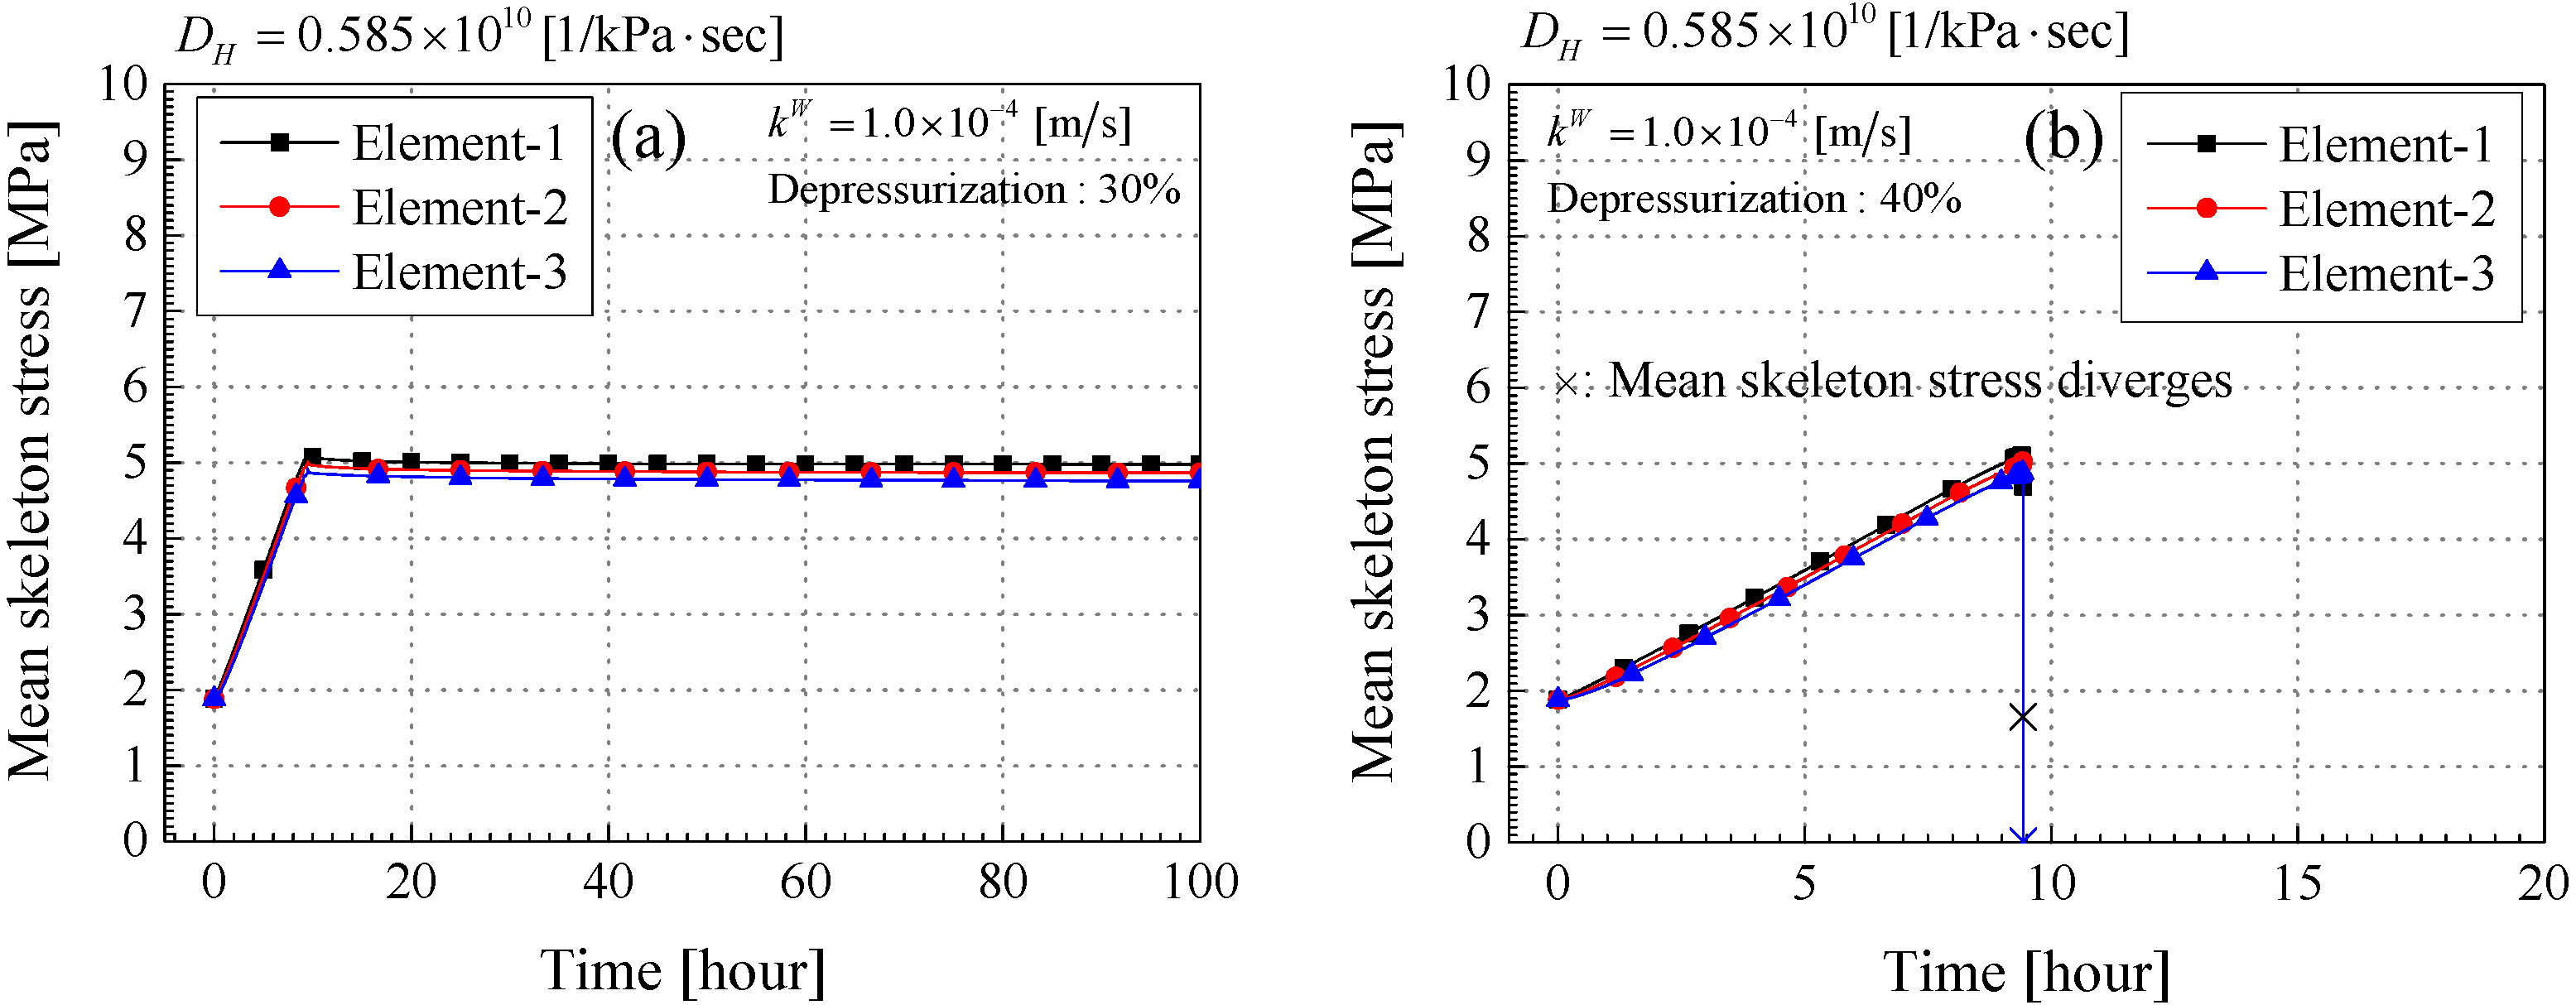
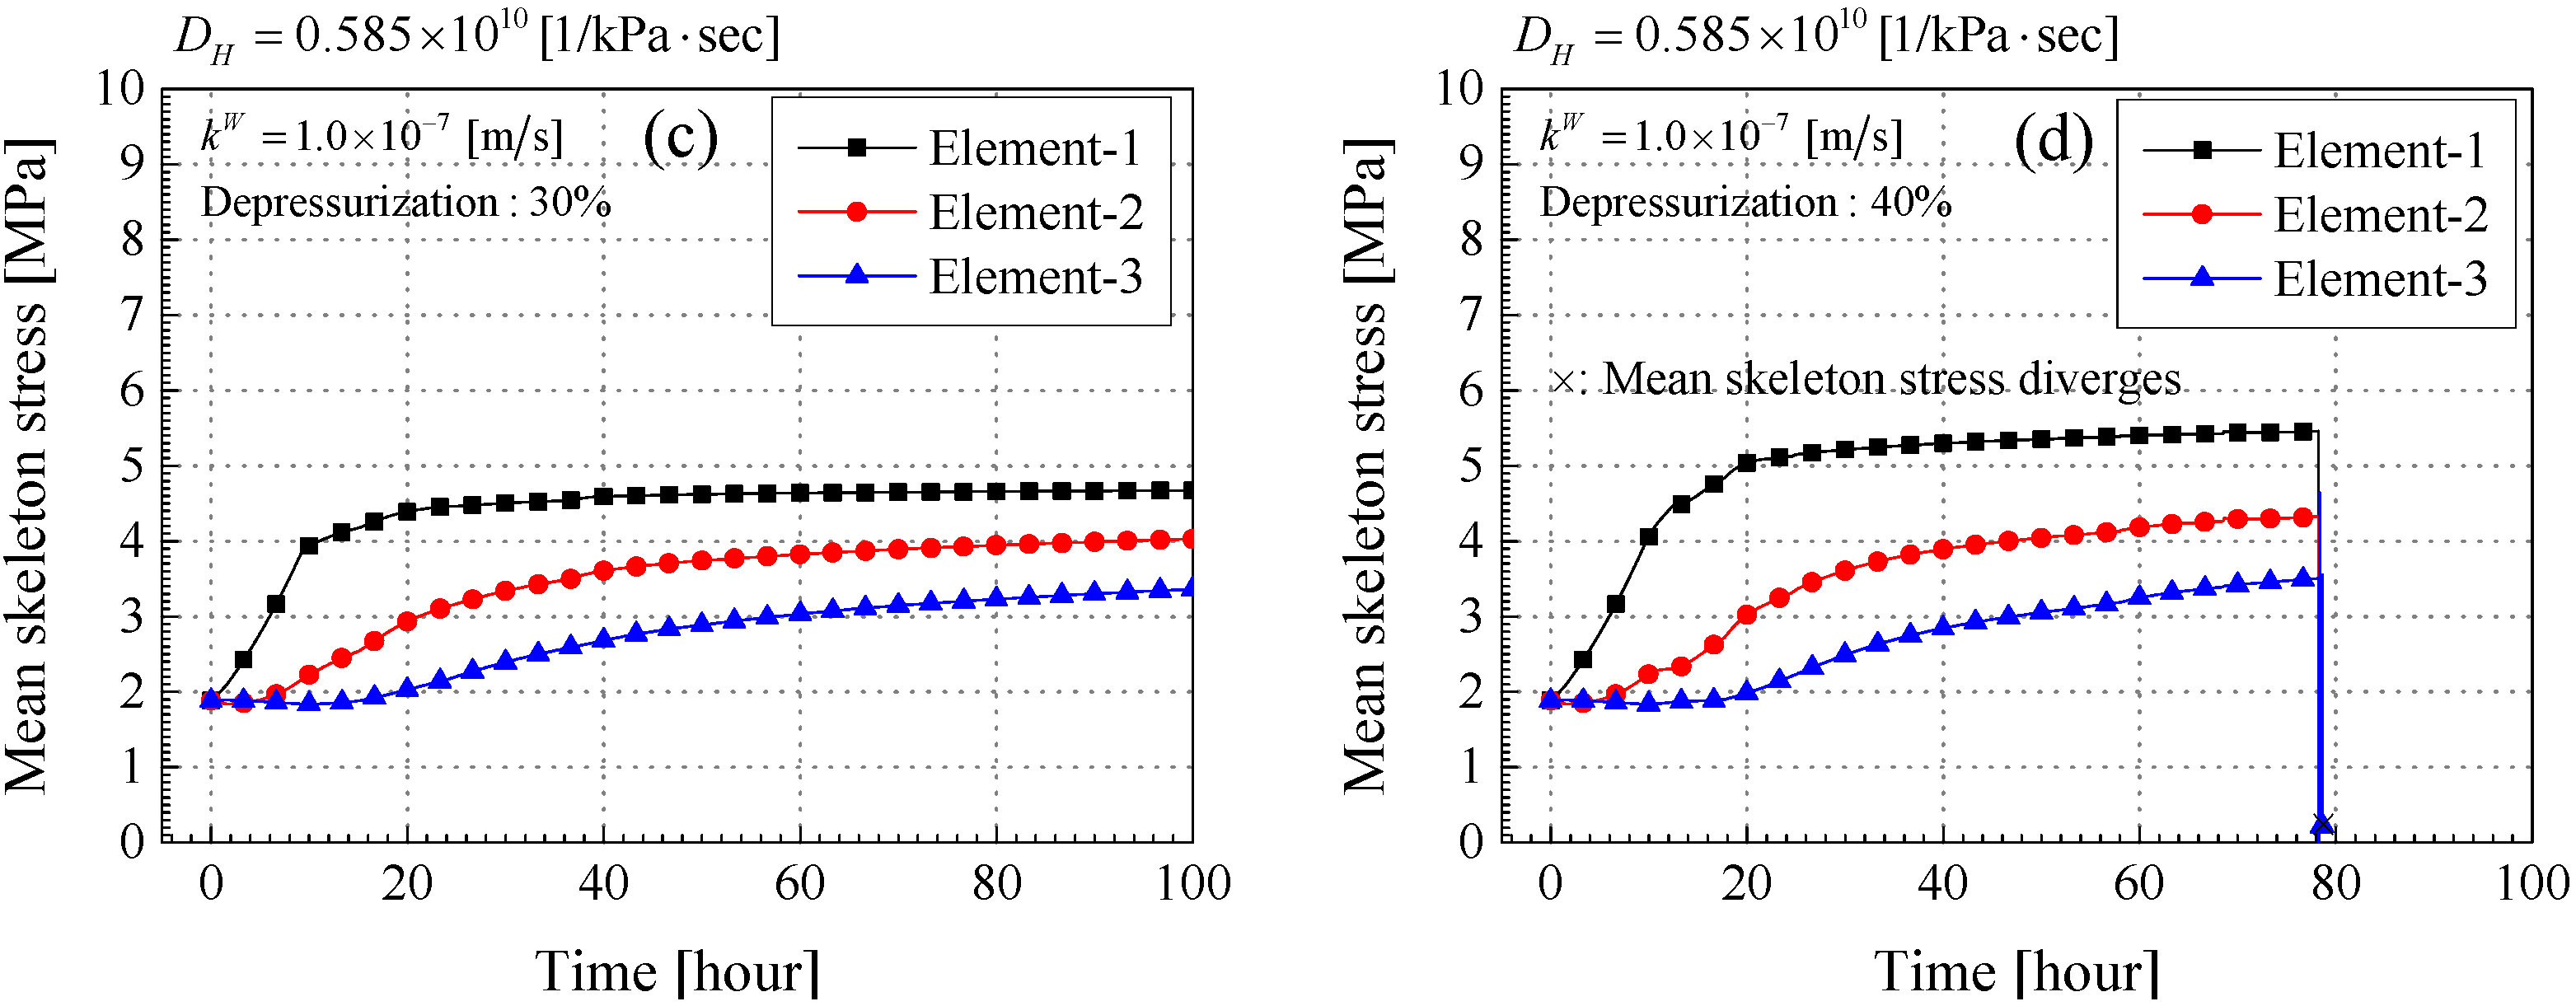
The average pore pressure PF is defined by Equation (14), and the mean skeleton stress are defined as follows:
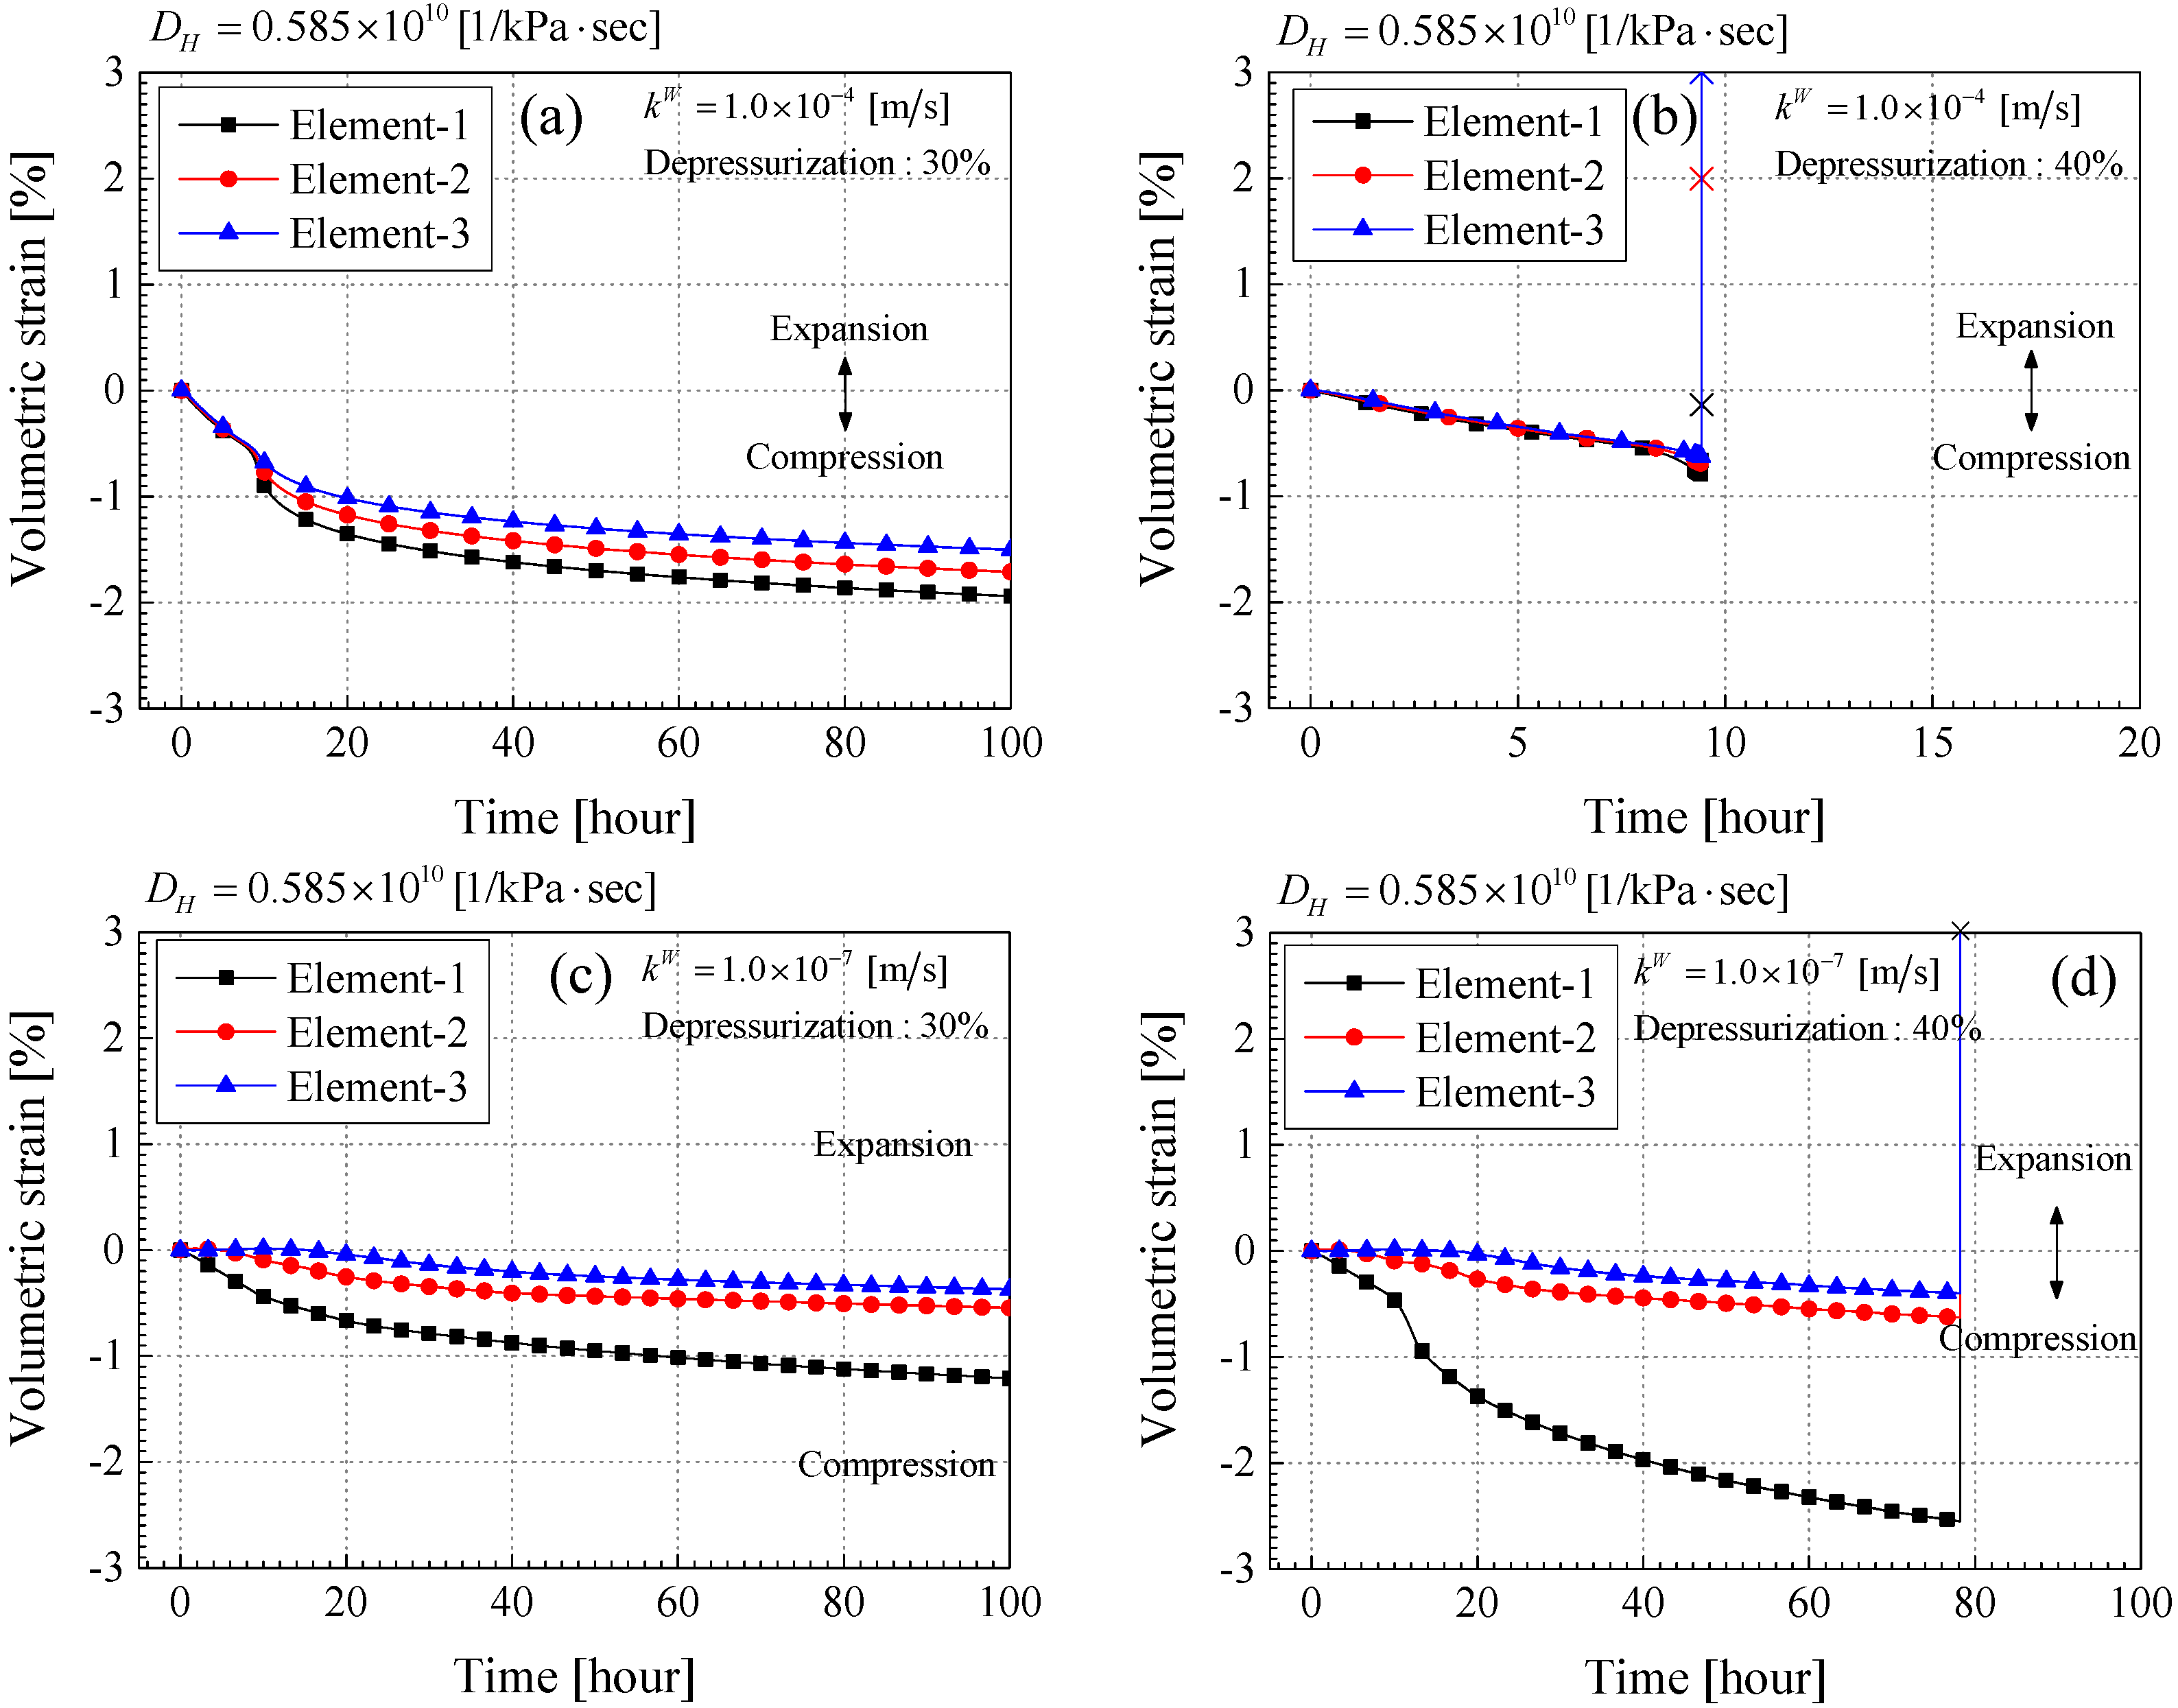
The average pore pressure decreases with increases in the depressurization in each case. In Case-4-30 and Case-4-40, it declines linearly, because the pore pressure at the depressurization source is reduced linearly. In Case-7-30 and Case-7-40, the average pore pressure in element-2 and element-3 decreases behind element-1, and the pressure gradient increases between element-1 and element-2 or element-3. When the material instability occurs in Case-4-40 and Case7-40, the average pore pressure diverges in the same manner as the pore gas pressure shown in Figure 8. This abrupt increases in pore gas pressure and average pore pressure leads to a drastic decrease in the mean skeleton stress, as illustrated in Figure 11. The result whereby the large pore fluid pressure produces a great reduction in the mean skeleton stress is the same as that obtained from the experiments [27]. Figure 12 indicates the time profiles of total volumetric strain for each element. It is worth noting that the volumetric strain is positive in expansion and negative in compression. In comparing Case-4-30 with Case-7-30, both cases are stable, and the total volumetric strain in Case-4-30 becomes larger than that in Case-7-30. This is because the amount of drained water in Case-4-30 is larger than that of Case-7-30 due to the large permeability. Finally, the total volumetric strain in elements-1, 2, and 3 become −2.0%, −1.7%, −1.5%, respectively in Case-4-30. In Case-7-30, the total volumetric strain in elements-1, 2, and 3 become −1.2%, −0.4%, and −0.5%, respectively. In Case-4-30, the depressurization stops at 9.4 h, and the changes in the average pore pressure and the mean skeleton stress are also small; however, the total volumetric strain keeps increasing until 100 h. The results indicate that the deformation is likely to continue increasing even after the changes in the pore pressure and the mean skeleton stress become small. In the unstable cases, that is, Case-4-40 and Case-7-40, the expansive volumetric strain is observed at the time the calculation stops. The large pore fluid pressure leads to the large expansive strain, and the material system becomes unstable. This results in the expansive strain making the material system more easily unstable, consistent with the results of the linear stability analysis.
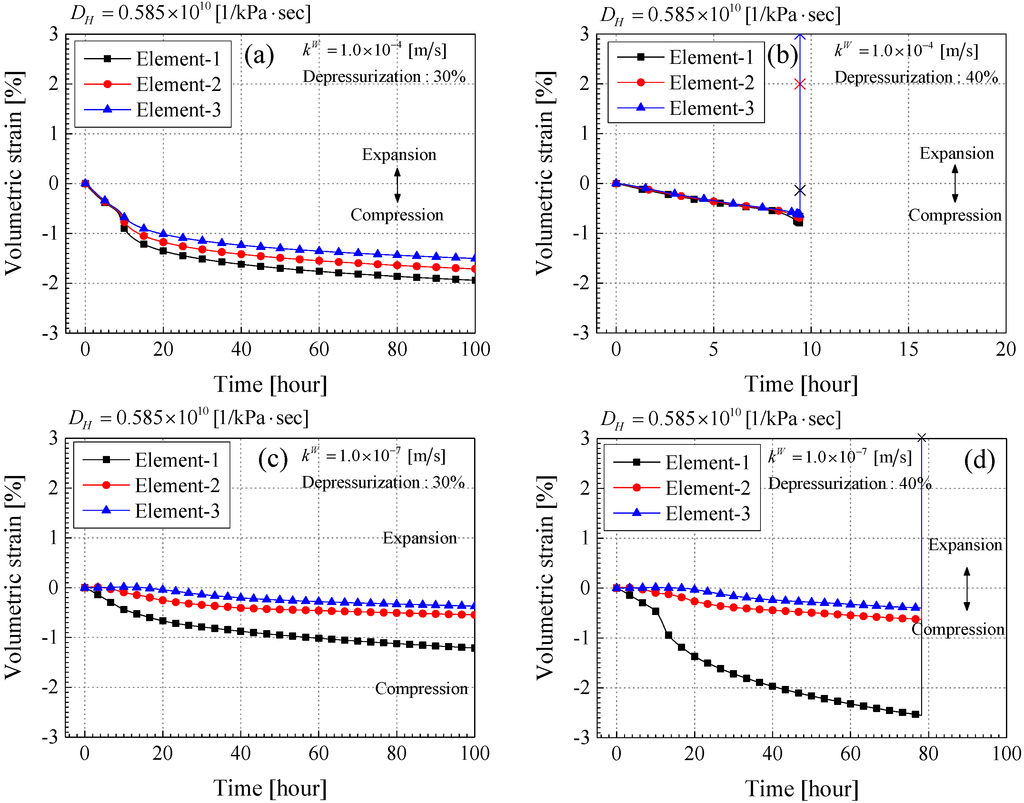
Figure 12.
Time profiles of the volumetric strain (%). (a) Case-4-30; (b) Case-4-40; (c) Case-7-30; (d) Case-7-40.
Figure 12.
Time profiles of the volumetric strain (%). (a) Case-4-30; (b) Case-4-40; (c) Case-7-30; (d) Case-7-40.
4. Conclusions
In the first part of this paper, a linear stability analysis was performed in order to investigate the effects of the parameters on the onset of the instability of MH-bearing sediments induced by dissociation. The governing equations of the MH-bearing sediments used in the section are based on the chemo-thermo-mechanically coupled model proposed by Kimoto et al. [9] and for the constitutive equation for the soil skeleton, we used a simplified viscoplastic constitutive model. The main conclusions obtained in the stability analysis are listed as follows:
- The parameters which have a significant influence on the material instability are the viscoplastic hardening-softening parameter, its gradient with respect to hydrate saturation, the permeability of the water and the gas, and the strain.
- Material instability may occur in both the viscoplastic hardening region and the softening region regardless of whether the strain is compressive or expansive. However, when the strain is expansive, material instability can occur even if it is in the viscoplastic hardening region. The expansive strain makes the possibility of the instability higher in the model.
- Permeability is one of the most important parameters associated with material instability. The larger the permeability for the water and the gas become, the more stable the material system becomes. In other words, the lower the permeability is, the higher the possibility is for material instability to occur. These results are consistent with the results obtained from the experimental studies.
In the second part of the section, some examples of the numerical simulation of the dissociation-deformation problem using the one-dimensional finite element mesh were presented in order to study the material instability by using the chemo-thermo-mechanically coupled model. The effect of the material parameters, especially the permeability, was investigated. In order to clarify the relationship between the permeability and the degree of hydrate dissociation, a series of parametric studies on the permeability was conducted. For the dissociation method, we adopted the depressurization method. The main results of the numerical simulations are summarized as follows:
- 4.
- Basically the simulation results become more stable with increases in permeability. However, they also become stable in the region of the lower permeability. This was because the depressurized area is limited due to the low permeability; and consequently, the amount of MH dissociation is also reduced.
- 5.
- When the calculation became unstable, the pore gas pressure diverged, and then the mean skeleton stress was decreased drastically. The larger expansive volumetric strain was also observed. These results are consistent with those obtained from the linear stability analysis.
- 6.
- In the case of a higher permeability and a larger depressurization level, the divergence occurred during depressurization and MH dissociation. On the other hand, in the case of the lower one, the instability was observed around the end part of the simulation when the MH dissociation almost converged. It is important to consider the material instability over the long term, that is, even after the dissociation calms down.
- 7.
- The compressive volumetric strain kept increasing after the depressurization finished and the changes in the pore pressure and the mean skeleton stress became small. It also proves the importance of considering the long term stability.
Acknowledgments
This work has been supported by Grant-in-Aid for JSPS Fellows 24-1274 for Hiromasa Iwai, a former Ph.D. student of Kyoto University. The authors are grateful for their financial support.
The content of the present paper is a part of the Ph.D. thesis of Kyoto University [28].
Author Contributions
Hiromasa Iwai carried out the formulation, the linear stability analysis, and the numerical simulation. Sayuri Kimoto engaged in the linear stability analysis and the numerical analysis. Toshifumi Akaki helped the numerical analysis. Fusao Oka worked on the linear stability analysis. All the authors participated in the discussion about the results, read the article, and approved the final manuscript.
Conflicts of Interest
The authors declare no conflict of interest.
Appendix A
The coefficients of the polynomial, Equation (73), are written as follows:
Appendix B
Routh-Hurwitz criteria of general n-th degree a polynomial equation is given by the following equation. Given an equation as shown below:
where is real, Routh-Hurwitz criteria can be written as follows:
where if . Then, the roots of Equation (B.1) have negative real parts if Dk> 0, for k = 1, …, n.
References
- Kvenvolden, K.A. Natural gas hydrate occurrence and issues. Ann. N. Y. Acad. Sci. 1994, 715, 232–246. [Google Scholar] [CrossRef]
- Nisbet, E.G.; Piper, D.J.W. Giant submarine landslides. Nature 1998, 392, 329–330. [Google Scholar] [CrossRef]
- Rothwell, R.G.; Thomson, J.; Kahler, G. Low-sea-level emplacement of a very large Late Pleistocene “megaturbidite” in the western Mediterranean Sea. Nature 1998, 392, 377–380. [Google Scholar] [CrossRef]
- Sultan, N.; Cochonat, P.; Canals, M.; Cattaneo, A.; Dennielou, B.; Haflidason, H.; Laberg, J.S.; Long, D.; Mienert, J.; Trincardi, F.; et al. Triggering mechanisms of slope instability processes and sediment failures on continental margins: A geotechnical approach. Mar. Geol. 2004, 213, 291–321. [Google Scholar] [CrossRef]
- Hyodo, M.; Li, Y.; Yoneda, J.; Nakata, Y.; Yoshimoto, N.; Nishimura, A. Effects of dissociation on the shear strength and deformation behavior of methane hydrate-bearing sediments. Mar. Pet. Geol. 2014, 51, 52–62. [Google Scholar] [CrossRef]
- Hyodo, M.; Yokoyama, N.; Nakata, Y.; Kato, A.; Yoshimoto, N. Shear behaviour of methane hydrate bearing sand. In Proceedings of the 13th Japan Symposium on Rock Mechanics & 6th Japan-Korea Joint Symposium on Rock Engineering, Okinawa, Japan, 9–11 January 2013; pp. 987–992.
- Miyazaki, K.; Masui, A.; Sakamoto, Y.; Aoki, K.; Tenma, N.; Yamaguchi, T. Triaxial compressive properties of artificial methane-hydrate-bearing sediment. J. Geophys. Res. 2011, 116. [Google Scholar] [CrossRef]
- Zhou, M.; Soga, K.; Xu, E.; Yamamoto, K. Effects of methane hydrate gas production on mechanical responses of hydrate bearing sediments in local production region at Eastern Nankai Trough. In Proceedings of the 14th IACMAG; Oka, F., Murakami, A., Uzuoka, R., Kimoto, S., Eds.; CRC Press: Kyoto, Japan, 2014; pp. 1707–1712. [Google Scholar]
- Kimoto, S.; Oka, F.; Fushita, T. A chemo-thermo-mechanically coupled analysis of ground deformation induced by gas hydrate dissociation. Int. J. Mech. Sci. 2010, 52, 365–376. [Google Scholar] [CrossRef]
- Kimoto, S.; Oka, F.; Fushita, T.; Fujiwaki, M. A chemo-thermo-mechanically coupled numerical simulation of the subsurface ground deformations due to methane hydrate dissociation. Comput. Geotech. 2007, 34, 216–228. [Google Scholar] [CrossRef]
- Rice, J.R. On the Stability of Dilatant Hardening for Saturated Rock Masses. J. Geophys. Res. 1975, 80, 1531–1536. [Google Scholar] [CrossRef]
- Anand, L.; Kim, K.H.; Shawki, T.G. Onset of shear localization in viscoplastic solids. J. Mech. Phys. Solids 1987, 35, 407–429. [Google Scholar] [CrossRef]
- Zibib, H.M.; Aifantis, E.C. On the Localization and Postlocalization Behavior of Plastic Deformation.1. On the Initiation of Shear Bands. Res Mech. 1988, 23, 261–277. [Google Scholar]
- Loret, B.; Harireche, O. Acceleration waves, flutter instabilities and stationary discontinuities in inelastic porous media. J. Mech. Phys. Solids 1991, 39, 569–606. [Google Scholar] [CrossRef]
- Benallal, A.; Comi, C. Material instabilities in inelastic saturated porous media under dynamic loadings. Int. J. Solids Struct. 2002, 39, 3693–3716. [Google Scholar] [CrossRef]
- Oka, F.; Adachi, T.; Yashima, A. A strain localization analysis using a viscoplastic softening model for clay. Int. J. Plast. 1995, 11, 523–545. [Google Scholar] [CrossRef]
- Higo, Y.; Oka, F.; Jiang, M.; Fujita, Y. Effects of transport of pore water and material heterogeneity on strain localization of fluid-saturated gradient-dependent viscoplastic geomaterial. Int. J. Numer. Anal. Methods Geomech. 2005, 29, 495–523. [Google Scholar] [CrossRef]
- Kimoto, S.; Oka, F.; Kim, Y.; Takada, N.; Higo, Y. A Finite element analysis of the thermo-hydro-mechanically coupled problem of a cohesive deposit using a thermo-elasto-viscoplastic model. Key Eng. Mater. 2007, 340–341, 1291–1296. [Google Scholar] [CrossRef]
- Garcia, E.; Oka, F.; Kimoto, S. Instability analysis and simulation of water infiltration into an unsaturated elasto-viscoplastic material. Int. J. Solids Struct. 2010, 47, 3519–3536. [Google Scholar] [CrossRef]
- Terzaghi, K. Theoretical Soil Mechanics; John Wiley: Hoboken, NJ, USA, 1943. [Google Scholar]
- Jommi, C. Remarks on the constitutive modelling of unsaturated soils. In Experimental Evidence and Theoretical Approaches in Unsaturated Soils; Tarantino, A., Mancuso, C., Eds.; Balkema: Rotterdam, The Netherlands, 2000; Volume 153, pp. 139–153. [Google Scholar]
- Bear, J. Dynamics of Fluids in Porous Media; Elsevier: New York, NY, USA, 1972; pp. 176–177. [Google Scholar]
- Sato, K.; Iwasa, Y. Groundwater Hydraulics; Springer: Berlin, Germany, 2003; pp. 20–21. [Google Scholar]
- Kim, H.C.; Bishnoi, P.R.; Rizvi, S.S. H.; Engineering, P. Kinetics of methane hydrate decomposition. Chem. Eng. Sci. 1987, 42, 1645–1653. [Google Scholar] [CrossRef]
- Yamamoto, K. Offshore methane hydrate resource development; from a viewpoint of geomechanics. In Proceedings of the 14th IACMAG; Oka, F., Murakami, A., Uzuoka, R., Kimoto, S., Eds.; CRC Press: Kyoto, Japan, 2014; pp. 1725–1730. [Google Scholar]
- Oka, F.; Kimoto, S. An Elasto-Viscoplastic Constitutive Model and Its Application to the Sample Obtained from the Seabed Ground at Nankai Trough. J. Soc. Mater. Sci. Jpn. 2008, 57, 237–242. [Google Scholar] [CrossRef]
- Wu, L.; Grozic, J.L.H.; Eng, P. Laboratory Analysis of Carbon Dioxide Hydrate-Bearing Sands. J. Geotech. Geoenviron. Eng. 2008, 134, 547–550. [Google Scholar] [CrossRef]
- Iwai, H. Behavior of Gas Hydrate-Bearing Soils during Dissociation and its Simulation. Ph.D. thesis, Kyoto University, Kyoto, Japan, 2015. [Google Scholar]
© 2015 by the authors; licensee MDPI, Basel, Switzerland. This article is an open access article distributed under the terms and conditions of the Creative Commons Attribution license (http://creativecommons.org/licenses/by/4.0/).
