Abstract
This paper focuses on the evaluation of theoretical and numerical aspects related to an original DC microgrid power architecture for efficient charging of plug-in electric vehicles (PEVs). The proposed DC microgrid is based on photovoltaic array (PVA) generation, electrochemical storage, and grid connection; it is assumed that PEVs have a direct access to their DC charger input. As opposed to conventional power architecture designs, the PVA is coupled directly on the DC link without a static converter, which implies no DC voltage stabilization, increasing energy efficiency, and reducing control complexity. Based on a real-time rule-based algorithm, the proposed power management allows self-consumption according to PVA power production and storage constraints, and the public grid is seen only as back-up. The first phase of modeling aims to evaluate the main energy flows within the proposed DC microgrid architecture and to identify the control structure and the power management strategies. For this, an original model is obtained by applying the Energetic Macroscopic Representation formalism, which allows deducing the control design using Maximum Control Structure. The second phase of simulation is based on the numerical characterization of the DC microgrid components and the energy management strategies, which consider the power source requirements, charging times of different PEVs, electrochemical storage ageing, and grid power limitations for injection mode. The simulation results show the validity of the model and the feasibility of the proposed DC microgrid power architecture which presents good performance in terms of total efficiency and simplified control.
1. Introduction
Plug-in electric vehicles (PEVs), whose growth is predicted in future years, represent an important step to achieve low-carbon transport transition [1]. Nevertheless, PEV charging increases the real-time power consumption. Due to the high current needed and depending on when and where the vehicles are plugged-in, the charging stations causes issues and constraints in the public grid. The indirect greenhouse gases emitted by the charging stations depend on the mix of the spinning reserve generation capacity of the electric power system. The spinning reserve is composed mainly by fossils-fuel power plants that are on-line but unloaded and can respond to the demand [2]. In order to accommodate the PEVs’ charging demand and requirements, the capacity of this spinning reserve should be expanded [3]. Furthermore, concerning the end-users, most of the end-users’ preferences are to charge PEV when it is convenient rather than during periods of lesser demand. Thus, during the daytime, in many local areas the public grid could be strongly stressed by a PEVs power demand threshold.
On the other hand, the energy transition leads to the incitation of policies that support the expansion of renewable energy sources, such as distributed energy generation, and their integration. However, the increasing distributed energy generation reveals an increasing complexity for grid managers by requiring better quality and reliability to regulate electricity flows and less mismatch between electricity generation and demand. To overcome this grid issue, the distributed renewable generation tends to be in favor of self-consumption and therefore less stress is applied on the public grid. Therefore, the microgrid concept, aggregating renewable and traditional energy sources, storage, and public grid connection, aims to actively operate for power balancing of the electricity system. Microgrids are reliable and efficient options to increase the small scale renewable energy penetration while minimizing the energy cost [4,5,6], especially in urban areas. Due to the negative impact of the total and permanent energy injection, incentive pricing policies dedicated to self-consumption have recently been proposed in many countries.
Thus, facing the emergence of AC or DC microgrids [7,8], on the one hand, and the increasing number of PEV charging stations, on the other hand, one of the solutions is the local microgrid [9,10]. In this context, dedicated charging station infrastructures, equipped with photovoltaic (PV) sources that are the most commonly used renewable sources in urban areas, can be built. This is a matter of PV-based microgrids, i.e., producer-consumer PEVs charging stations, aiming at achieving self-consumption. The PV sources’ intermittency can be relieved by a storage system well integrated in the microgrid [11,12]. These local microgrids become an alternative to the total and permanent energy injection and reduce the dependence on the power grid [13,14,15].
Nowadays many studies focus on the design, operation, optimization, and scheduling of PEV charging stations. Currently the most commonly used PEV batteries are based on Li-ion technology. A fast charger for this technology is presented in [16]; the proposed bidirectional AC/DC converter allows a maximum of 25 kWh charging in one hour. PEV charging stations based on PV sources with optimal energy management are presented in several studies [17,18,19,20,21], however, the proposed systems do not take into account either storage ageing or grid power limitations for injection mode. Related to optimal charging and considering the public grid tariffs to buy or sell energy, a day-ahead scheduling method is studied in [22], in which, according to vehicle-to-grid strategy, a long term cost minimization model is proposed. An interesting strategy based on random vehicle charging and taking into account the excess power is presented in [17]. A car parking PV-integrated and grid-connected system is proposed as a charging station in [18], where the power is controlled by a real-time energy management algorithm. For smart buildings equipped with PV generators, a charging strategy based on the multi-agent approach is proposed in [19].
In [23] the charging of the PEVs is controlled in order to eliminate or reduce the stress on the grid but the impact of energy efficiency and the grid power limitation for injection mode are not discussed. In this case the PV system is connected to the DC link by employing a DC/DC boost converter.
An original PEV charging station topology based on PV system, superconducting magnetic energy storage, and the public grid is presented in [24]. All these components are respectively connected to a common DC bus with the corresponding converters. The proposed energy management strategy focuses on the voltage stability of DC bus and the energy transfer among these units. The building-integrated DC microgrid proposed in [25] aggregates wind and PV sources, hybrid storage, and public grid connection on a DC common bus, which offers fast or smart PEV charging. Compared with the existing droop controls, the authors propose droop curves as a function of the storage state-of-charge (SOC). However, control and architecture of the power electronic interface either needed or not needed to implement the PV system are not discussed in these references.
Through the use of a grid-tied neutral-point-clamped converter, a novel power architecture for a PEV DC charging station is proposed in [26]. It concerns a bipolar DC structure which reduces the step-down effort on the DC/DC fast chargers. Regarding the control, this paper proposes a balancing mechanism that allows handling any difference on the DC loads while keeping the midpoint voltage accurately regulated; however, the grid power limitation for injection mode is not taken into account.
Considering these different PEV charging station concepts, which aim to support direct PEV charging (i.e., not for swapping batteries), it is noted that different requirements and constraints are taken into account to develop energy management strategies. Nevertheless, the studies mentioned above do not consider the overall topology efficiency. This work aims to improve the existing PEVs charging stations with a threefold scheme: (i) a novel DC microgrid power architecture to improve overall efficiency; (ii) an original and easily comprehensible model with the aid of Energetic Macroscopic Representations (EMR) and Maximum Control Structure (MCS); (iii) a realistic approach for considering the effects of electrochemical storage ageing and the public grid power injection limitations.
The proposed DC microgrid is based on a photovoltaic array (PVA), electrochemical storage, and grid connection; and it allows self-consumption according to PVA production and storage constraints, while the public grid is seen only as a back-up. To increase the overall efficiency, improve the utilization efficiency of PVA energy, and decrease the cost and losses of converters, as opposed to conventional power architecture designs, the PVA is coupled directly with the DC link without a static converter, which implies no DC voltage stabilization and less control complexity. It is also assumed that PEVs have direct access to their DC charger input. However, the fluctuation of PVA output and the change of charging power vary randomly and in this case will influence the power transfer among components of the PEV charging station. To cope with this problem while dealing with storage ageing, a real-time rules-based algorithm is proposed.
Following the presented considerations, the DC microgrid special power architecture for PEVs charging station is described in Section 2. The global energetic modelling of the DC microgrid based on EMR is presented in Section 3. Different energetic configurations of the available power and energy sources are given. Then, the DC microgrid control modeling using MCS, which is deduced from the EMR, is introduced in Section 4. The simulation results performed with MATLAB Simulink are given and discussed in Section 5. Conclusions and further discussions on advantages and limitations of the proposed control are presented in Section 6.
2. DC Microgrid Special Power Architecture for an Electric Vehicle Charging Station
The PEV charging station is designed based on the DC microgrid technology. As illustrated in Figure 1a, it is composed of a PVA, public grid connection, PEVs’ batteries, and electrochemical storage. These components are connected directly or indirectly to the DC link. The proposed local grid connected DC microgrid can be car parking integrated, with PV panels installed on sun-shading roofs as shown in Figure 1b [27,28].
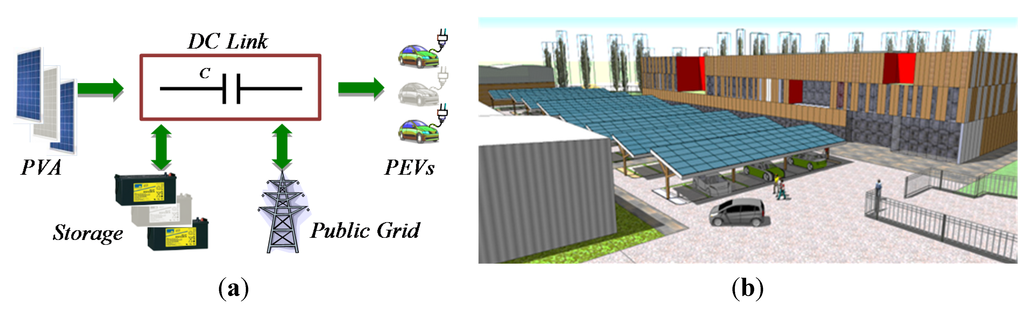
Figure 1.
(a) DC microgrid for an electric vehicle charging station; (b) Computer graphic picture.
Expecting that the locally generated power is used where, when, and how it is generated, the DC microgrid energy management system operates with self-supply. The produced PV electricity is intended primarily for charging of PEVs. The storage represents an additional energy source to supply the PEVs or to absorb the excess of the produced PVA energy. The public grid connection is used as back-up and to sell the excess energy. For low PVA power, the needed complementary power to charge the PEVs is provided primarily by the storage, and then by the public grid. In contrast, if PVA power is higher than the power demanded by PEVs, the DC microgrid primarily feeds the storage and then injects excess power into the public grid. A bidirectional smart meter could be implemented for information about grid availability and dynamic pricing. Note that the operating mode called “vehicles to grid” is not developed in this work.
The electrical scheme of the DC microgrid power architecture is given in Figure 2. Since the energy efficiency may be improved by eliminating energy conversion, the PVA is directly connected to the DC link without a static converter. However, PEVs and storage are connected to the same DC bus link through their dedicated static converters whose switching functions are fPEVs and fSTO, respectively. This power architecture is due to the fact that the DC link voltage is estimated to be about 1000 VDC; hence, in order to correctly feed the PEVs and to charge the storage, static converters are required. The public grid connection is carried out by a three-phase bidirectional AC/DC converter with the following switching functions: fA, fB and fC.
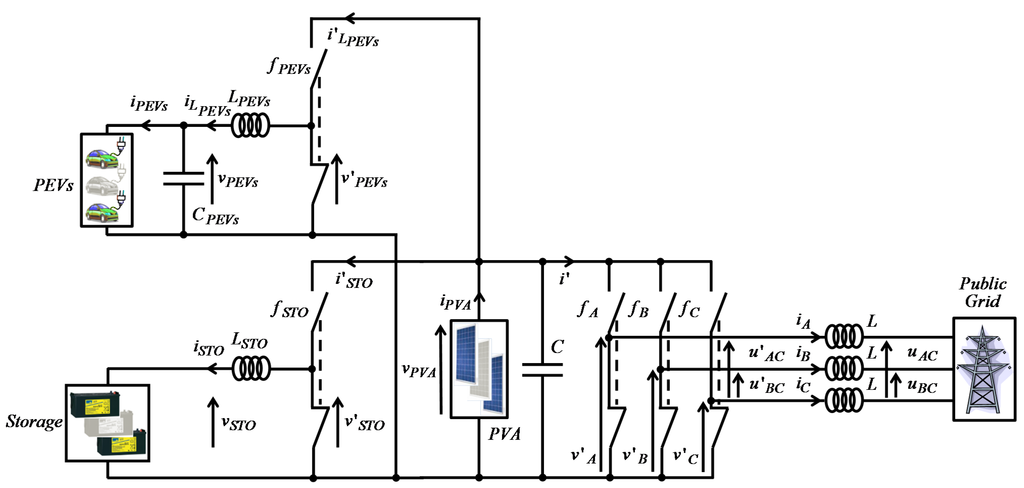
Figure 2.
Electrical scheme of the DC microgrid power architecture.
All these switching functions are equal to 0 or 1. Inductors and capacitors are used in order to interface with the different elements. Assuming that there are no losses through the inductors, capacitors, and cables, and neglecting the total losses of power converter legs, the DC microgrid power balancing is given by Equation (1):
where pPG, pSTO and pPEVs are the power of the public grid, storage, and PEV charging system, respectively, νPVA is the PVA voltage, and C the DC link capacitor. The power balancing shows that the adjustment variables are the public grid and storage powers, within their physical and functional limitations.
The required power reference p* for power balancing is calculated by Equation (2):
where the public grid power reference pPG* and the storage power reference pSTO* are calculated by Equation (3) according to the previously proposed strategy. For this, a distribution coefficient is introduced and defined as given by Equation (3):
3. Energetic Macroscopic Representation Modeling of the Electric Vehicle Charging Station
The DC microgrid power architecture for the PEV charging station is modeled by EMR, which is an energy-based graphical tool for a global energetic view. As the PEV charging station is preeminently an energetic system, it is obvious that the considerations of energy should be emphasized in EMR. EMR modeling could be compared with Bond Graph formalism introduced successfully since 1950s, but bond graphs cannot help the control design directly, while EMR focuses on both system function and system structure. The EMR advantages lie in its clarity of physical concepts, as well as its functional modeling; EMR contributes significantly to the design of the control, and leads to energy management of systems.
EMR is a synthetic graphic tool that uses causal or functional representation. EMR allows a systematic approach to design all the interactions between the different subsystems of a complex system. The system representation is based on four basic elements as illustrated in Figure 3.
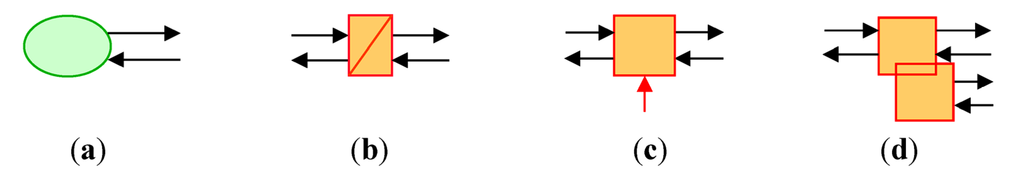
Figure 3.
(a) Source of energy; (b) Element with energy accumulation; (c) Electrical converter (without energy accumulation); (d) Electrical coupling (without energy accumulation).
These pictograms represent: energy sources, accumulation elements, conversion elements, and coupling elements for energy distribution. They are interconnected following the action and reaction principle using exchange variable and respecting the integral causality. The instantaneous power exchanged between two elements is the result of the product of action and reaction variables represented by arrows (inputs and outputs).
The integral causality considered in EMR defines an accumulation element by a time-dependent relationship between its variables, in which case the output is an integral function of the inputs. Other elements are described using relationships without time dependence. In order to respect the integral causality, specific associated rules are defined. Each element is internally described using transfer functions, mathematical relations, or other modeling tool. EMR allows the representation of multi-physic systems and the systematic deduction of control structures. The EMR formalism has been already used in many real applications [29,30,31]; the implementation is usually performed on MATLAB Simulink.
Following the electrical scheme of the DC microgrid given in Figure 2, all elements are electrically connected to DC link represented by the capacitor noted C. This electrical coupling is modeled by Equation (4):
where , , , and i' are the currents of PVA, storage system, PEV charging system, and the current of the inverter input side. The DC link is modeled by the EMR formalism as one accumulation element and one electrical coupling (without energy accumulation).
3.1. Photovoltaic Array Modeling
The proposed PEV charging station is based on 560 PV panels (60M250, SILLIA, Lannion, France), whose power is estimated to be 140 kW under standard test conditions. In consideration of the maximum 1000 V voltage, the 560 PV panels are arranged in parallel and series: 20 parallel branches of 28 serial panels by branch. By applying the EMR formalism, the PVA is modeled as a power source which provides the current iPVA when the voltage vPVA is imposed, i.e., the power pPVA (pPVA = vPVA · iP'VA). The voltage is imposed by a maximum power point tracking (MPPT) algorithm. However, for stringent cases, a limited PVA power control could also be applied. In this work, when a MPPT control is required, the well-known method “Perturb & Observe” (P&O) is used to extract the maximum power of PVA for any value of solar irradiance and PV cell temperature [32,33]. The evolution of pPVA and iPVA under the solar irradiance g = 1000 W/m2 and for different PV cell temperatures are shown as simulation results in Figure 4.
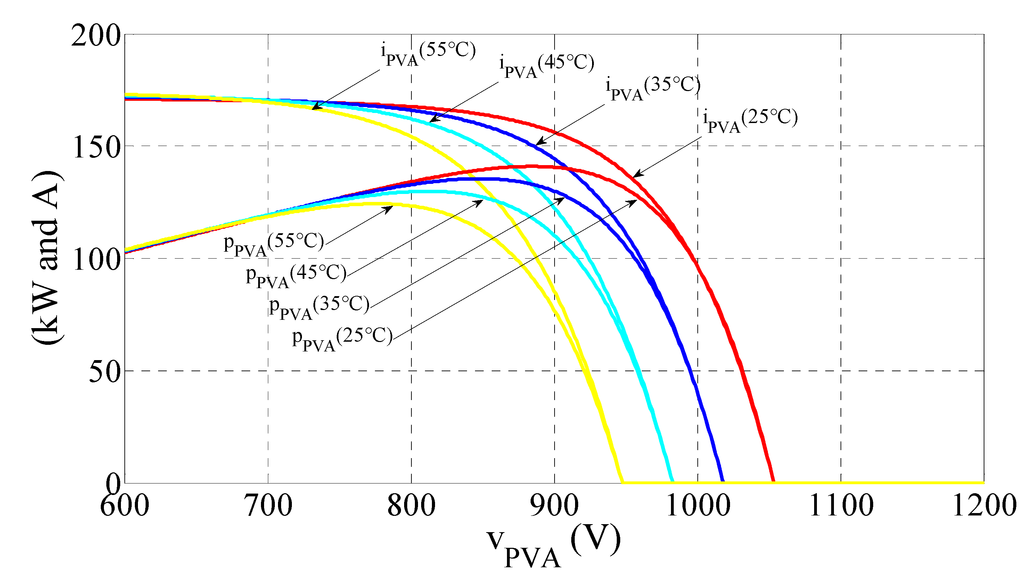
Figure 4.
PVA power and current under 1000 W/m2 irradiance and for different PV cell temperatures.
The PVA system is modeled by the EMR formalism as a power source, denoted PVA, to be connected to an electrical coupling element.
3.2. Modeling of PEVs Batteries Charging
In this work, the batteries of all PEVs are considered based on Li-ion technology. The Li-ion battery charging is performed by a constant current (CC) mode followed by a constant voltage (CV) mode, i.e., CC/CV procedure [34]. During the CC mode, the charging current stays constant until the voltage rises to a cut-off voltage. During the CV mode, the voltage remains constant while the current drops. This CC/CV procedure is supposed to be controlled by a battery management system already integrated in PEV battery system.
To emulate the PEV charging, a CC/CV procedure has been applied to a 26650 LiFePO4 cell (A123 Systems LLC, Waltham, MA, USA) and recorded. The PEV charging CC/CV profile is considered proportional to the profile recorded on one cell. According to some end-user’s utilization models, the PEV charging profiles proposed in this study are:
- -
- fast charging time for a period of about 30 min;
- -
- average charging time for a period of about 1 h and 30 min;
- -
- slow charging time for a period of about 4 h.
For one vehicle and for these three charging profiles, the PEV battery power, denoted as pPEV, and its state of charge, noted SOCPEV, are presented in Figure 5.
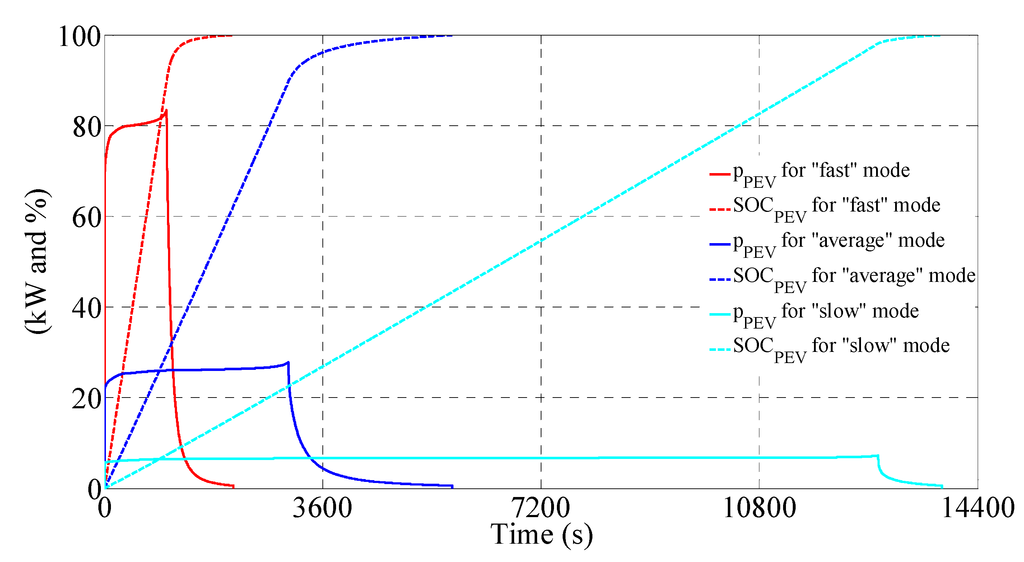
Figure 5.
Power pPEV and state of charge SOCPEV for one PEV.
These characteristics are obtained by coupling 28 parallel branches of 120 serial cells; with the voltage of 3.6 V per cell. The total stored energy is about 24 kWh. Depending on the type of vehicles, state of charge of battery, charging voltage level, charging current level, and the demanded charging time, the total PEV charging power flow varies roughly. Regarding the electrical scheme presented in Figure 2, the PEV charging modelling is given by Equation (5):
where and are the voltage and current of the PEV converter’s output side, vPEVs and are the voltage and current of PEVs converter input side, mPEVs the PEV control variable, iPEVs the PEVs current, LPEVs and CPEVs the PEVs inductor and capacitor, respectively, T the period, and the time variable.
In order to simplify the numerical simulation, the PEV charging system’s assumptions considered in this study are:
- -
- arbitrarily it is considered that 15 vehicles could be recharged simultaneously;
- -
- for each PEV, charging operation starts from zero SOCPEV limit;
- -
- all PEVs remain in plug-in position to fulfill the battery (to achieve the complete CC/CV charging procedure).
Figure 6 shows PEVs flow evolution and corresponding absorbed power (pPEVs = vPEVs · iPEVs). The PEVs charging system is modeled by EMR formalism as a power source, noted PEVs, associated with two accumulation elements and one conversion element.
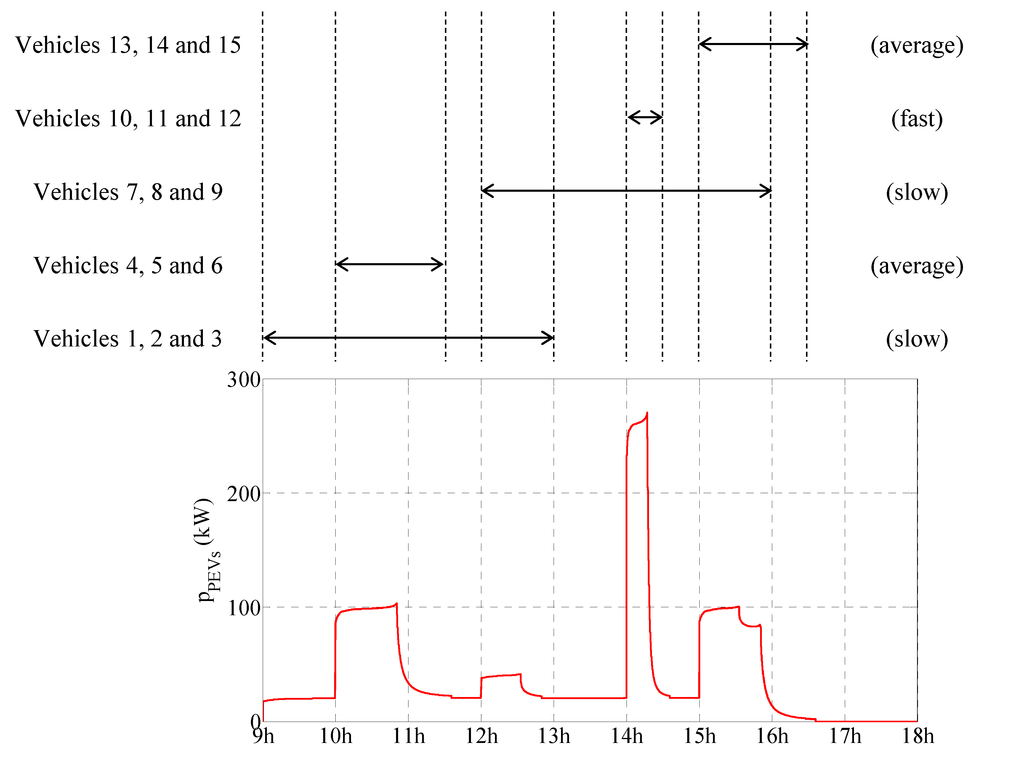
Figure 6.
Plug-in electric vehicles’ total power flow.
3.3. Storage Modeling
The electrochemical storage is a complementary energy source for the DC microgrid; it is a system composed by 35 serial batteries, characterized by 12V/230A each. Therefore, the whole storage system is characterized by 420 V/230 Ah. The storage system modeling equations are expressed by Equation (6):
where v'STO and i'STO represent the voltage and current of the storage DC link side (after converter), vSTO and iSTO are the voltage and current of the storage before the converter, mSTO the storage control variable, and LSTO the storage inductor.
The storage system is modeled by EMR formalism as a power source, denoted STO, associated with one accumulation element and one conversion element.
3.4. Public Grid Connection Modeling
The considered public grid is a low voltage network, characterized by 400 V phase-to-phase and 50 Hz. The public grid connection modeling is based on the inverter model. Thus, the simple voltages of the three phases, v'A, v'B and v'C, and corresponding inverter switching functions, fA, fB, fC are used as shown by Equation (7):
where u'AC and u'BC are the output’s inverter voltages between the phases A and C, and B and C respectively, mA and mB the inverter control variables. The inverter current i' is expressed by using the currents of the three phases, iA, iB, and iC, following Equation (8):
The connection between the inverter and the public grid is made by power lines, with no mutual inductor but a self-inductance L and an internal resistance R. The relationship between voltages and currents of power lines is given in Equation (9):
where uAC and uBC represent the public grid voltages between the phases A and C, and B and C, respectively. The public grid system is modeled by EMR formalism as a power source, denoted PG, associated with one accumulation element and one conversion element.
3.5. Energetic Macroscopic Representation of the DC Microgrid
Based on the model of each component described above, the global EMR of the DC microgrid designed for PEVs charging station is obtained and shown in Figure 7.
This system has six state variables (vPEVs, , iSTO, vPVA, iA, and iB) and four control variables (mPEVs, mSTO, mA and mB). A control structure adapted to the operating system strategy is needed and described below.
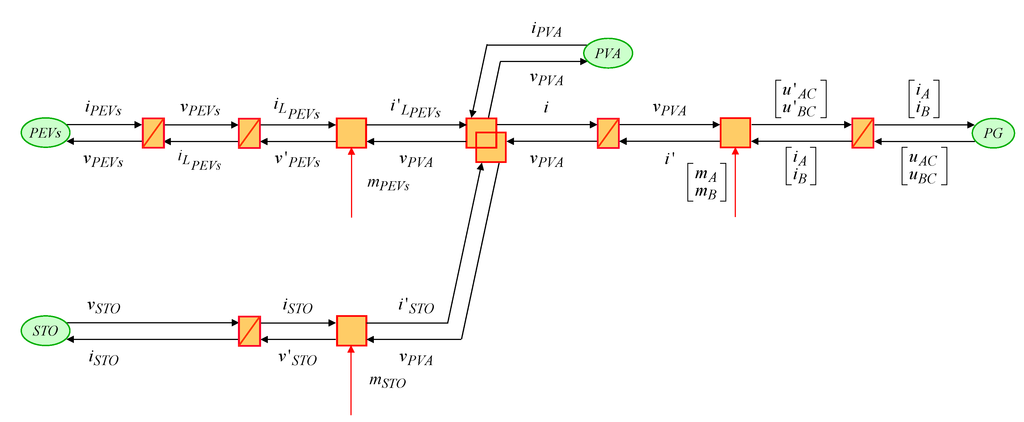
Figure 7.
Energetic macroscopic representation of a DC microgrid for a PEV charging station.
4. DC Microgrid Control Modeling Using the Maximum Control Structure
The inversion-based control theory was introduced in 2000s. The control structure of a system is considered as an inversion model of the system. From EMR modeling, a MCS graphical representation can be obtained, which easily leads to a practical control structure. Generally, it is considered that the plant inversion is not robust to variations in the system parameters, but the MCS approach inherently assumes that the control structure can be obtained under the assumption that all variables are measurable. The merit of EMR/MCS modeling is highlighted by its systemic approach which involves the principle of holism that leads to studying the impact of subsystems association: Interconnected basic control blocks, dynamical performances, interest of the closed loop and so on.
To design control structures based on the EMR formalism, a corresponding Maximum Control Structure (MCS) can be deduced through specific inversion rules [28,29]. Indeed, the system’s control computes the system’s inputs for which the desired output is obtained. Therefore, system’s control structure can be considered as an inversion model of the system. Thus, on one hand, the direct inversion, i.e., without controller, is applied for items that are not time dependent, such as the conversion elements. But, on the other hand, as EMR formalism does not allow the derivative causality, a direct inversion of time dependent item is not possible. For this reason an indirect inversion, i.e., the controller, is proposed for items that are time dependent. The accumulation elements are inverted using a close-loop control.
The MCS representation is based on three basic elements as shown in Figure 8: control bloc without controller, control bloc with controller, and bloc strategy.
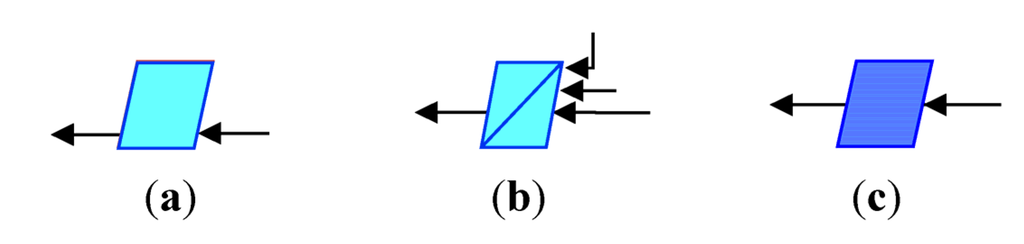
Figure 8.
(a) Control bloc without controller; (b) Control bloc with controller; (c) Bloc strategy.
The DC microgrid control structure model is deduced from the EMR described in Section 3 and represented by MCS. The control variable mPEVs imposes constant DC voltage (vPEVs) across the terminals of the vehicles. Using the aforementioned specific inversion rules, it is obtained:
where , are voltage references, is current reference, CIPEVs is an integral proportional corrector with a bandwidth of 500 Hz, and CVPEVs is a proportional corrector with a bandwidth of 50 Hz. The integral proportional corrector and the proportional corrector have been defined by the method of the pole placement.
The control variables mA, mB and mSTO impose a variable DC voltage vPVA across the terminals of PVA. The value of this reference voltage (vPVA*) is imposed by the MPPT algorithm. Inverting Equation (4) allows obtaining Equation (11):
where i'*, i'STO* and vPVA* are current reference and voltage reference respectively. The capacitor C is considered as a pure integrator and the disturbances related to iPVA and are assumed to be compensated; therefore, CV is a proportional controller.
Based on the assumption that there are no losses in the system and considering the power balancing, the active power reference of the public grid, modeled on two-phase alpha-beta or stationary frame, is equal to:
with:
where vA, vB and vC are the single phase public grid voltages respectively (not shown in Figure 2).
The reactive power reference is imposed arbitrarily to zero and is defined by:
Thus, the current references (iα*, iβ*) can be determined from Equations (12) and (14) as follows:
To simplify the currents control, the regulation is performed in dq reference or rotary frame using the transition matrix given by Equation (16):
where θ is the phase shift between the voltages (vA, vB and vC) and currents (iA, iB and iC).
Based on current references, the expression of the reference control variables mA* and mB* is following Equation (17):
Knowing that a power balancing is always performed, the power reference of storage is equal to:
with:
Inverting Equation (6) allows obtaining Equation (20):
where v'STO* and iSTO* are voltage reference and current reference respectively, CISTO is the same as CIPEVs and has the same settings.
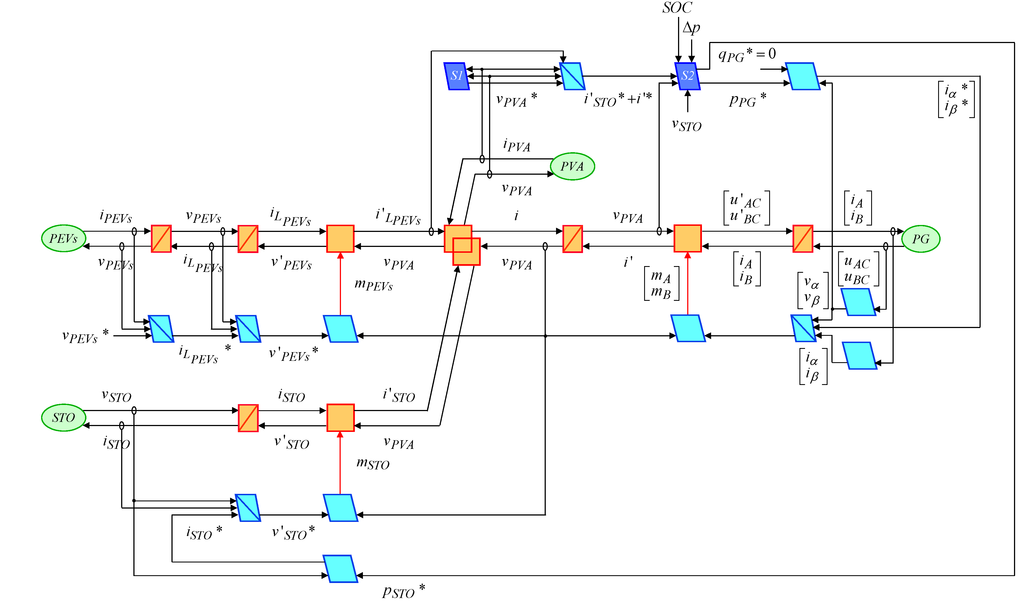
Figure 9.
Maximum Control Structure for the DC microgrid for PEVs charging station.
The four control variables are known, thus the MCS of the DC microgrid could be presented in Figure 9. This graphical description gives particularly the PVA control strategy (P&O or limited power control), symbolized by S1, and the secure operating system involving the storage and the public grid, symbolized by S2.
5. Simulation Results
To validate the DC microgrid for PEVs charging station modeling approach, the system simulation is performed with MATLAB Simulink. The simulation results are obtained with the following values: PEV charging station voltage vPEVs* = 200 V, C = CPEVs = 10 mF and L = LPEVs = LSTO = 1 mH (with 1 mΩ internal resistance). The calculation step is 5 kHz. The storage SOC evolution is considered between 20% and 80%, i.e., the low limit and the high limit respectively. The system simulation is based on real experimental tests concerning: PV panel under real solar irradiation and its control, CC/CV charging procedure for one PEV battery cell, electrochemical storage charge/discharge and SOC calculation.
If the storage ageing has to be taken into account, a current limitation should be imposed provided the operation time occurs during the off-peak period for the public grid. In this way, the DC microgrid for the PEV charging station is secured thanks to the power supplied by the public grid. On the other hand, if the public grid power injection has to be limited for some off-peak period, the implemented control should be able to take into consideration this power grid timed limitation. Thus, the simulation results are presented following three cases: the storage current is not limited, the storage current is limited, and the public grid power injection and the storage current are both limited by the implemented control.
5.1. DC Microgrid Simulation Based on Storage without Current Limitation
Figure 10a shows the real solar irradiance and PV cell temperature during the day of 2 June 2014 at Compiegne, France. It was a sunny day but with a lot of passing clouds. The power evolutions of PVA, of PEVs charging, and the difference between these two powers, Δp = pPVA – pPEVs, are given in Figure 10b. Figure 10a,b prove that the P&O algorithm work correctly since pPVA is proportional to solar irradiance evolution. Figure 10c presents the storage SOC and the distribution coefficient K evolution.
Figure 10d illustrates the variations of the power of public grid and storage. Figure 10e gives the storage current evolution facing to the current limitation of 230 A for the first charging curve of the considered storage.
For the period taken into account, it is observed that the strategy mentioned before is well respected at all the time. The PVA system is under MPPT control and the produced PVA energy is used primarily for self-feeding. Following the Figure 10b,d for Δp > 0 the storage and public grid receive energy, in contrast they provide when Δp < 0. In case of insufficient energy to supply the PEVs charging, the system security is provided by the storage system priorly. The storage charge and discharge operations have priority over the public grid. Once the storage has reached its upper or lower limit, the public grid takes over and provides or receives energy. The distribution coefficient K evolution shown in Figure 10c presents clearly the storage operation period for all durations when K = 1.
These results show that no matter the sign and the amplitude of the difference of power between pPVA and pPEVs, the function of this system is secured.
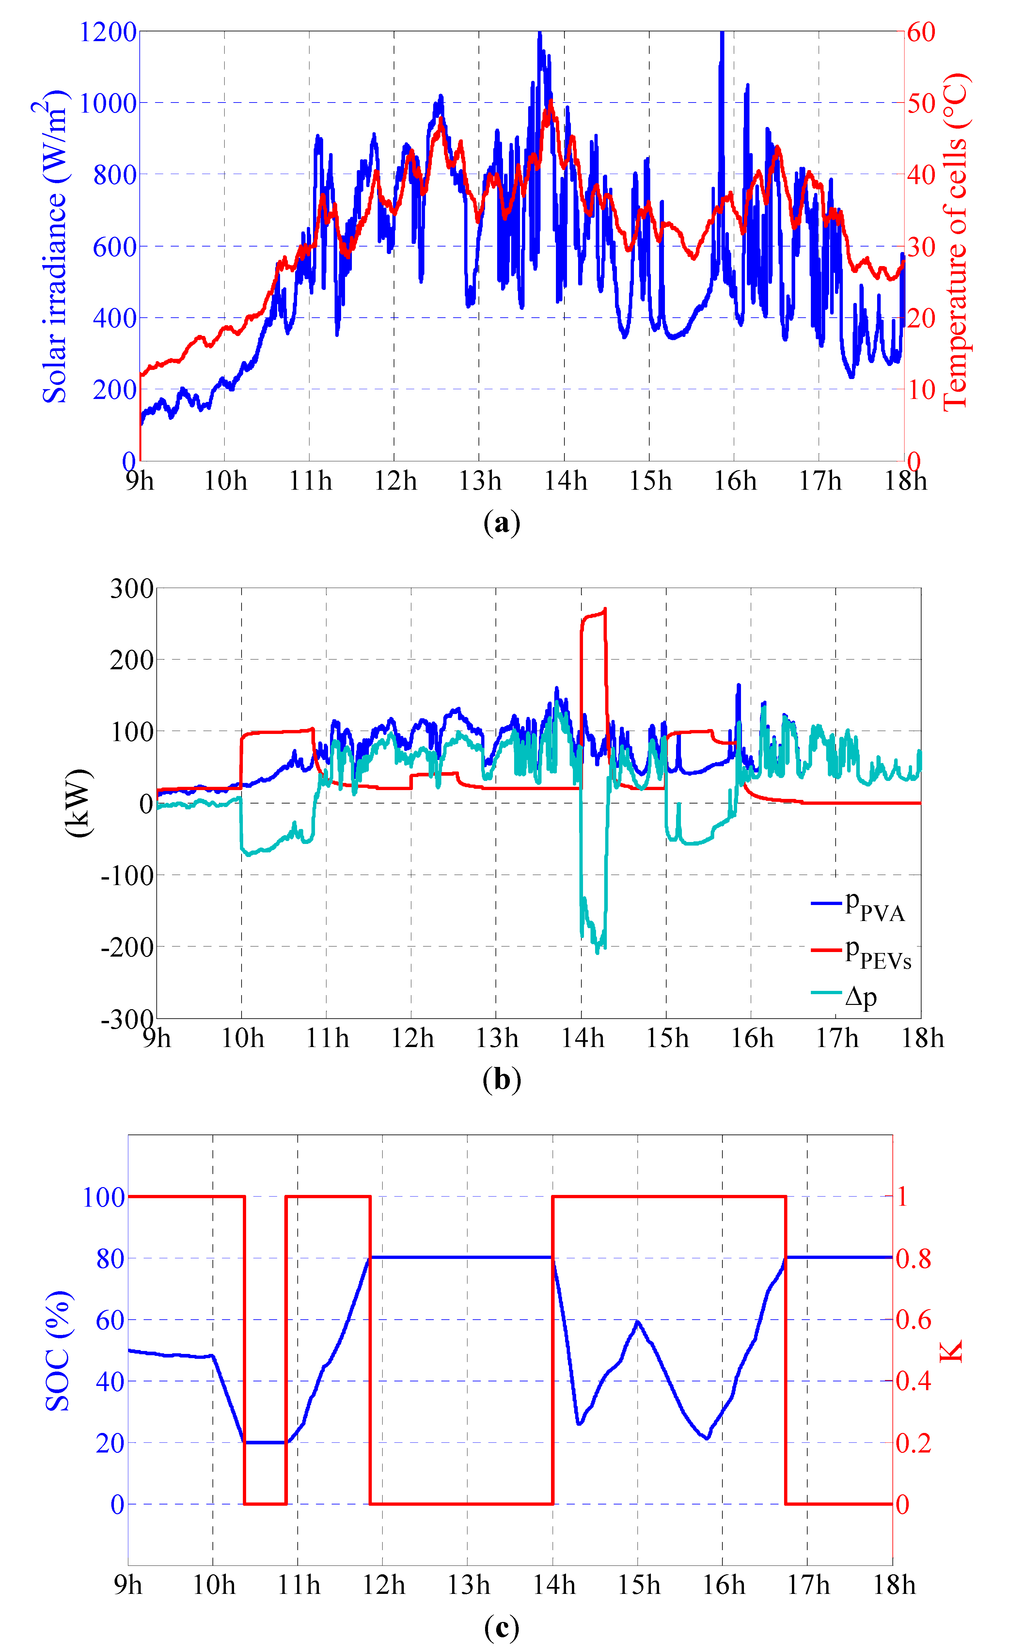
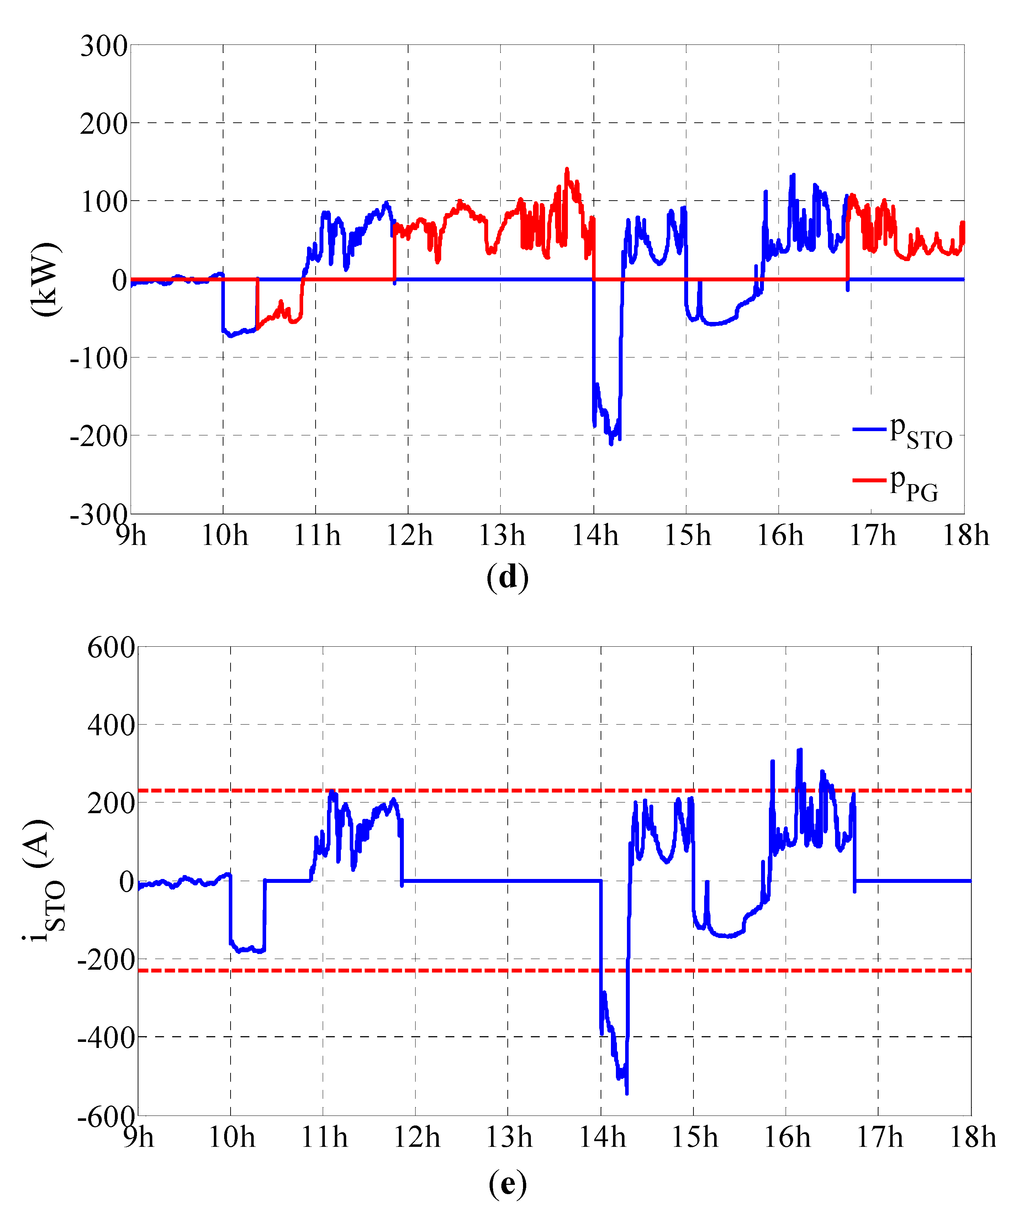
Figure 10.
DC microgrid without storage current limitation case: (a) Solar irradiance and PV cell temperature; (b) Power evolutions of PVA, PEVs, and the difference between these two powers; (c) Storage and distribution coefficient ; (d) Power evolutions of storage and public grid; (e) Storage current evolution.
5.2. DC Microgrid Simulation with Current Limitation for Storage
Based on the same meteorological conditions, this second simulation case presents the DC microgrid control with storage current limitation at 115 A while the PVA system is under MPPT control and the produced PVA energy is used primarily for self-feeding. Therefore, for this second case, the difference between PVA power and PEVs powers is the same as previously presented in Figure 10b. Figure 11 shows the storage current limitation case for a value of 115 A.
The distribution coefficient K given in Figure 11a does not take only binary values, but also fractional values between zero and one. Figure 11b shows clearly that during the current limitation periods the Δp is shared simultaneous between the storage and the grid, i.e., for all durations when 0 < K < 1. Figure 11c presents the storage current evolution facing to the 230 A limitation.
Figure 11.
Storage current limitation case: (a) Storage and distribution coefficient ; (b) Power evolutions of storage and public grid; (c) Storage current evolution.
5.3. DC Microgrid Simulation Based on Storage Current Limitation and Grid Power Injection Limitation
The same meteorological conditions are considered for this third case when the storage keeps the current limitation while the public grid power could be limited for injection. Figure 12 presents the storage current limitation for a value of 115 A and the public grid power limitation for the value of 80 kW between two time slots: 12:30–13:30 and 16:30–17:30.
The power evolutions of PVA, of PEV charging, and the difference between these two powers, Δp = pPVA − pPEVs, are given in Figure 12a. Different from the cases presented above, due to the fact that the storage is full and the public grid power is limited at 80 kW, the PVA power also has to be shed between the same time slots: 12:30–13:30 and 16:30–17:30. Therefore, for this third case, the difference between PVA power and PEVs power, Δp, is not the same as that presented in Figure 10b.
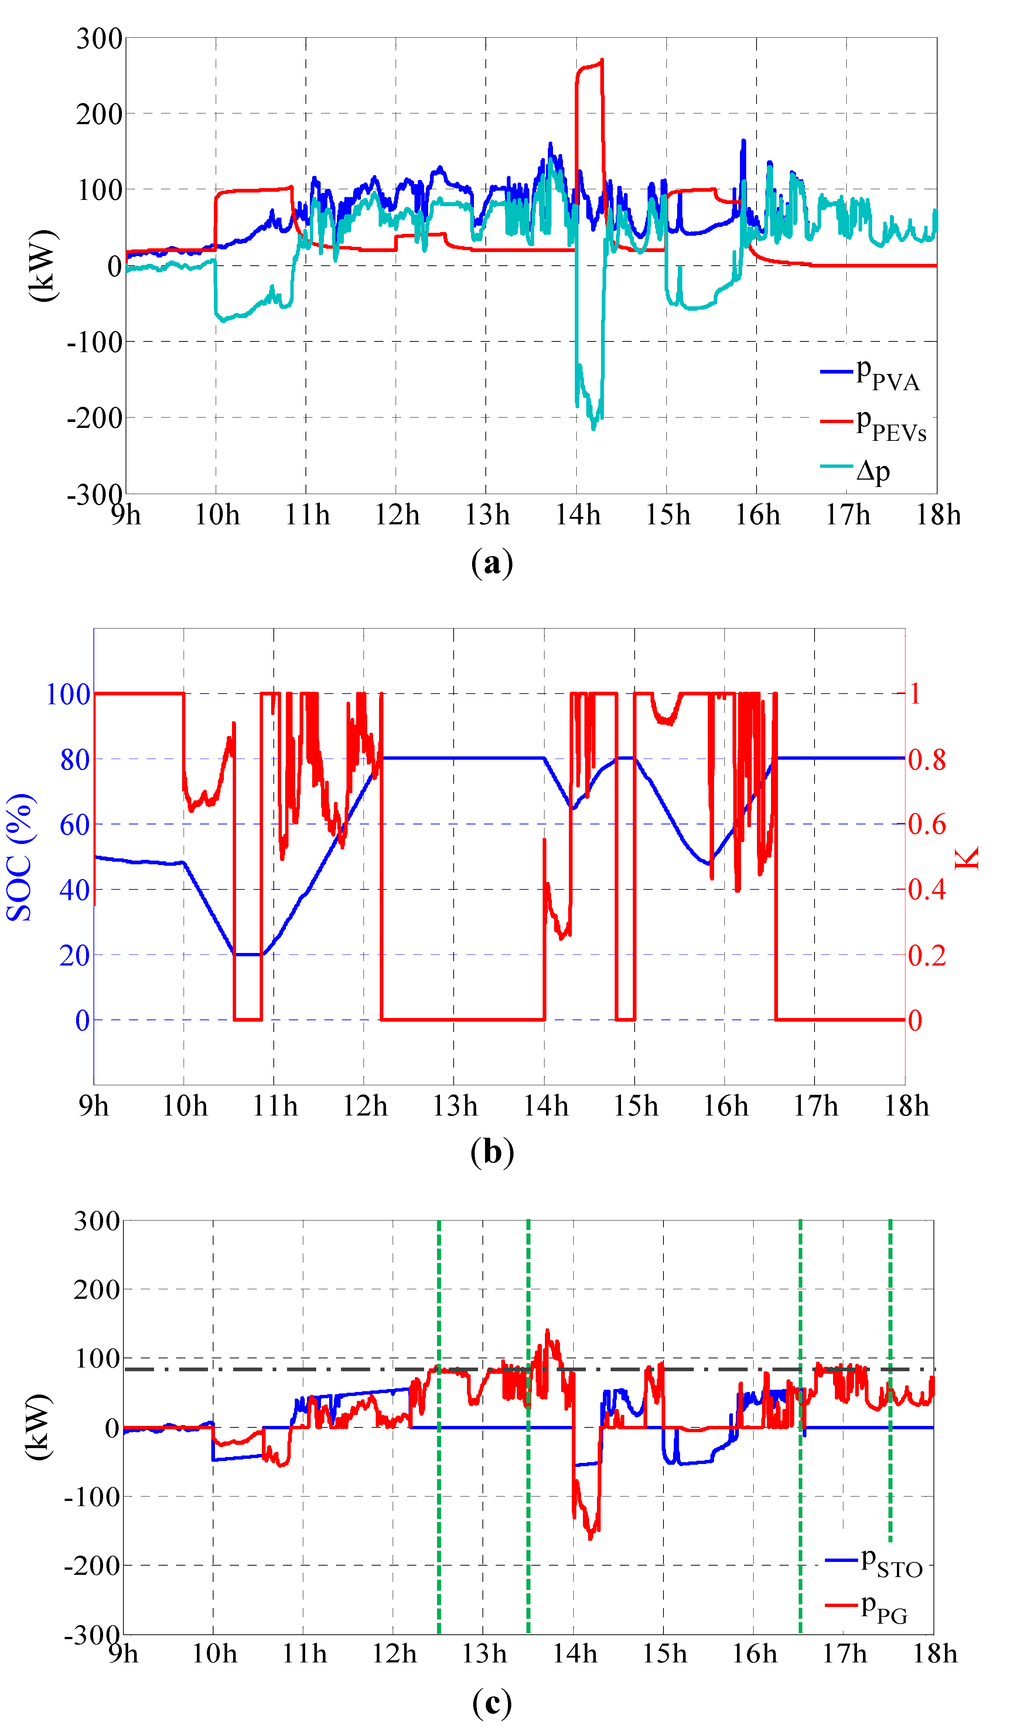
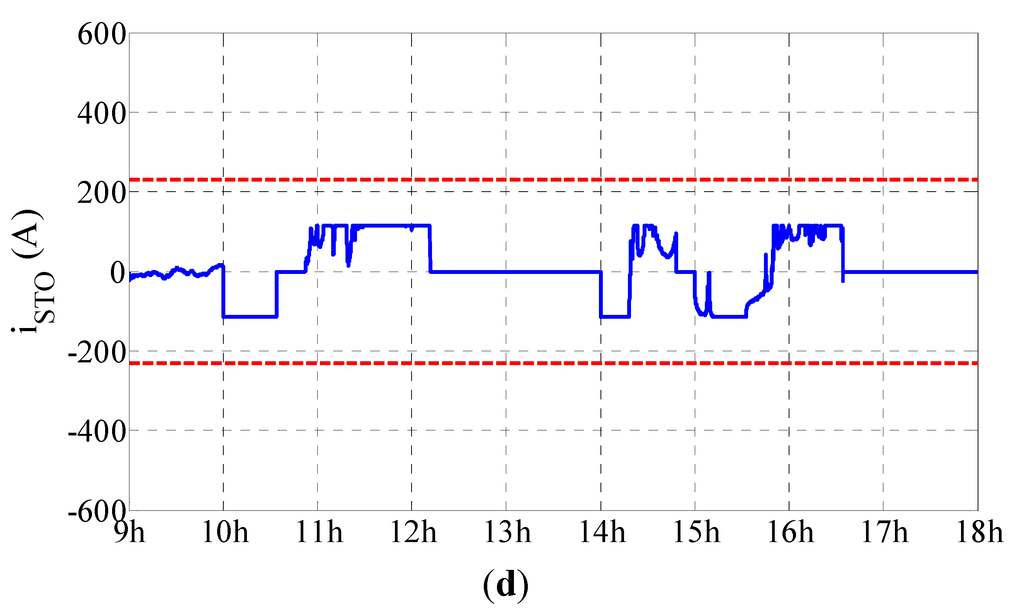
Figure 12.
Storage current limitation and public grid power injection limitation case: (a) Power evolutions of PVA, PEVs, and the difference between these two powers; (b) Storage and distribution coefficient ; (c) Power evolutions of storage and public grid; (d) Storage current evolution.
During the mentioned time slots, a PVA power shedding algorithm is applied for the PVA control as developed in [35]. The PVA power limitation is operated according to PEVs power demand and the public grid power limitation. At the end of each limitation time slot, the classical P&O MPPT control of the PVA takes over.
The distribution coefficient given in Figure 12b is almost the same as that given in Figure 11a, while the storage current evolution shown in Figure 12d is almost the same as that given in Figure 11c. These similarities can be explained by the fact that the time slots limitation of the public grid power occur during K = 0, i.e., when the storage is not involved. Nevertheless, due to calculus implied by the simulation, here presented as new case, some very slight fluctuations make some very slight differences, almost imperceptible.
Figure 12c gives the evolution of the storage power and the public grid power. Compared to Figure 11b, this figure shows clearly the public grid power limitation that occurs during the considered time slots: 12:30–13:30 and 16:30–17:30.
Taking into account that the goal was to verify the feasibility of the suggested system control, finally, it can be stated that the overall DC microgrid system, as designed and modeled, responds satisfactorily to the outlined strategy.
However, in order to fully and correctly use the available storage, its control may be improved. In addition, in our further work, values will be calculated according to techno-economic criteria such as weather, energy pricing, dynamic pricing, PEVs charging duration demand, etc.
6. Conclusions
Local renewable power production by microgrids becomes increasingly complex and selective for many types of loads. In this paper a DC microgrid special power architecture for a PEV charging station was presented. The proposed microgrid structure aims to maximize the efficiency of the PVA- produced energy by proposing self-feeding and direct coupling of the PVA to the DC link without a static converter. The study develops an original easy to comprehend EMR model that is very and helpful for the analysis of the DC microgrid operation and the energy management strategies.
The EMR formalism is one of the most efficient methodologies to describe a complex system based on scientific fields and allows obtaining a unified graphical representation and a physical modeling. Based on inversion rules applied to EMR model, the system’s control structure is easily deduced using the MCS representation. So, by using the EMR formalism, the DC microgrid physical integral modeling based on the interaction principle becomes an attractive and very comprehensible graphical description. The inversion-based control structure represented by MCS allows also a quick graphical description.
The simulation results, given for one workday, show the feasibility of the DC microgrid control for different PEV charging scenarios. The results show that by using the PVA-produced energy within the microgrid, the power demand from the public grid can be lowered or avoided entirely. Furthermore, this study showed a realistic approach for considering the electrochemical storage ageing and the public grid power injection limitation. For larger amount of PEVs, the system will require improvements and optimization while taking into account constraints given by the PVA, the load and the public grid. Based on the simulation model described in this study, future research will focuses on the impact of more than fifteen PEVs and analyze the limits of this model of DC microgrid.
Author Contributions
Both authors have designed the system, performed the research project, and analyzed the data; both authors have contributed to writing and preparing revision of this manuscript.
Conflicts of Interest
The authors declare no conflict of interest.
References
- Hajimiragha, A.; Cañizares, C.A.; Fowler, M.W.; Elkamel, A. Optimal transition to plug-in hybrid electric vehicles in Ontario, Canada, considering the electricity-grid limitations. IEEE Trans. Ind. Electron. 2010, 57, 690–701. [Google Scholar] [CrossRef]
- Jansen, K.H.; Brown, T.M.; Samuelsen, G.S. Emissions impacts of plug-in hybrid electric vehicle deployment on the US western grid. J. Power Sour. 2010, 195, 5409–5416. [Google Scholar] [CrossRef]
- Richardson, D.B. Electric vehicles and the electric grid: A review of modeling approaches, impacts, and renewable energy integration. Renew. Sustain. Energy Rev. 2013, 19, 247–254. [Google Scholar] [CrossRef]
- Patterson, B.T. DC, Come Home: DC microgrids and the birth of the “Enernet”. IEEE Power Energy Mag. 2012, 10, 60–69. [Google Scholar] [CrossRef]
- Guerrero, J.M.; Chandorkar, M.; Lee, T.-L.; Loh, P.C. Advanced control architectures for intelligent microgrids—Part I: Decentralized and hierarchical control. IEEE Trans. Ind. Electron. 2013, 60, 1607–1618. [Google Scholar]
- Schmitt, L.; Kumar, J.; Sun, D.; Kayal, S.; Venkata, S.S.M. Ecocity upon a Hill: Microgrids and the future of the European city. IEEE Power Energy Mag. 2013, 11, 59–70. [Google Scholar] [CrossRef]
- Lasseter, R.H. Smart distribution: Coupled microgrids. Proc. IEEE 2011, 99, 1074–1082. [Google Scholar] [CrossRef]
- Guerrero, J.M.; Vasquez, J.C.; Matas, J.; de Vicuna, L.G.; Castilla, M. Hierarchical control of droop-controlled AC and DC microgrids—A general approach toward standardization. IEEE Trans. Ind. Electron. 2011, 58, 158–172. [Google Scholar] [CrossRef]
- Sechilariu, M.; Wang, B.C.; Locment, F.; Jouglet, A. DC microgrid power flow optimization by multi-layer supervision control. Design and experimental validation. Energy Convers. Manag. 2014, 82, 1–10. [Google Scholar] [CrossRef]
- Sechilariu, M.; Wang, B.; Locment, F. Building integrated photovoltaic system with energy storage and smart grid communication. IEEE Trans. Ind. Electron. 2013, 60, 1607–1618. [Google Scholar]
- Francesco, M.; Yang, G.Y.; Traeholt, C. EV Charging facilities and their application in LV feeders with photovoltaics. IEEE Trans. Smart Grid 2013, 4, 1533–1540. [Google Scholar] [CrossRef]
- Traube, J.; Lu, F.; Maksimovic, D. Mitigation of solar irradiance intermittency in photovoltaic power systems with integrated electric vehicle charging functionality. IEEE Trans. Power Electron. 2013, 28, 3058–3067. [Google Scholar] [CrossRef]
- Wi, Y.M.; Lee, J.U.; Joo, S.K. Electric vehicle charging method for mart homes/buildings with a photovoltaic system. IEEE Trans. Consum. Electron. 2013, 59, 323–328. [Google Scholar] [CrossRef]
- Sechilariu, M.; Wang, B.; Locment, F. Building-integrated microgrid: Advanced local energy management for forthcoming smart power grid communication. Energy Build. 2013, 59, 236–243. [Google Scholar]
- Wang, B.C.; Sechilariu, M.; Locment, F. Intelligent DC microgrid with smart grid communications: Control strategy consideration and design. IEEE Trans. Smart Grid 2012, 3, 2148–2156. [Google Scholar] [CrossRef]
- Kuperman, A.; Levy, U.; Goren, J.; Zafransky, A.; Savernin, A. Battery charger for electric vehicle traction battery switch station. IEEE Trans. Ind. Electron. 2013, 60, 5391–5399. [Google Scholar] [CrossRef]
- Van Roy, J.; Leemput, N.; Geth, F.; Buscher, J. Electric vehicle charging in an office building microgrid with distributed energy resources. IEEE Trans. Sustain. Energy 2014, 99, 1–8. [Google Scholar]
- Mohamed, A.; Salehi, V.; Tan, M.; Mohammed, O. Real-time energy management algorithm for plug-in hybrid electric vehicle charging parks involving sustainable energy. IEEE Trans. Sustain. Energy 2014, 5, 577–586. [Google Scholar] [CrossRef]
- Zhu, W.; Wang, L.F.; Dounis, A.I.; Yang, R. Integration of plug-in hybrid electric vehicles into energy and comfort management for smart building. Energy Build. 2012, 47, 260–266. [Google Scholar] [CrossRef]
- Byeon, G.; Yoon, T.; Oh, S.; Jang, G. Energy management strategy of the DC distribution system in buildings using the EV service model. IEEE Trans. Power Electron. 2013, 28, 1544–1554. [Google Scholar] [CrossRef]
- Jin, C.; Wang, P.; Xiao, J.; Tang, Y. Implementation of hierarchical control in DC microgrids. IEEE Trans. Ind. Electron. 2014, 61, 4032–4042. [Google Scholar] [CrossRef]
- Armstrong, M.; El Hajj Moussa, C.; Adnot, J.; Galli, A.; Rivière, P. Optimal recharging strategy for battery-switch stations for electric vehicles in France. Energy Policy 2013, 60, 569–582. [Google Scholar] [CrossRef]
- Goli, P.; Shireen, W. PV integrated smart charging of PHEVs based on DC link voltage sensing. IEEE Trans. Smart Grid 2014, 5, 1421–1428. [Google Scholar] [CrossRef]
- Liu, Y.; Tang, Y.; Shi, J.; Shi, X. Application of small-sized SMES in an EV charging station with DC bus and PV system. IEEE Trans. Appl. Supercond. 2015, 25, 5700406. [Google Scholar]
- Strunz, K.; Abbasi, E.; Huu, D.N. DC microgrid for wind and solar power integration. IEEE J. Emerg. Sel. Top. Power Electron. 2014, 2, 115–126. [Google Scholar] [CrossRef]
- Rivera, S.; Wu, B.; Kouro, S.; Yaramasu, V.; Wang, J. Electric vehicle charging station using a neutral point clamped converter with bipolar DC bus. IEEE Trans. Ind. Electron. 2015, 62, 1999–2009. [Google Scholar] [CrossRef]
- Locment, F.; Sechilariu, M.; Forgez, C. Electric vehicle charging system with PV grid-connected configuration. In Proceedings of the IEEE Vehicle Power and Propulsion Conference, Lille, France, 1–3 September 2010.
- Locment, F.; Sechilariu, M. DC microgrid for future electric vehicle charging station designed by energetic macroscopic representation and maximum control structure. In Proceedings of the IEEE International Energy Conference, Dubrovnik, Croatia, 13–16 May 2014; pp. 1454–1460.
- Wei, W.; Bouscayrol, A.; Ming, C. Comparison of two different traction systems for subway application using Energetic Macroscopic Representation. In Proceedings of the IEEE Vehicle Power and Propulsion Conference, Seoul, Korea, 9–12 October 2012; pp. 984–989.
- Lhomme, W.; Delarue, P.; Giraud, F.; Lemaire-Semail, B.; Bouscayrol, A. Simulation of a photovoltaic conversion system using Energetic Macroscopic Representation. In Proceedings of the European Power Electronics and Power Electronics and Motion Control Conference, Novi Sad, Serbia, 4–6 September 2012. [CrossRef]
- Yu, H.; Lu, R.; Wang, T.; Zhu, C. Energetic Macroscopic Representation based modeling and control for battery/ultra-capacitor hybrid energy storage system in HEV. In Proceedings of the IEEE Vehicle Power and Propulsion Conference, Dearborn, MI, USA, 7–11 September 2009; pp. 1390–1394.
- Houssamo, I.; Locment, F.; Sechilariu, M. Experimental analysis of impact of MPPT methods on energy efficiency for photovoltaic power systems. Int. J. Electr. Power Energy Syst. 2013, 46, 98–107. [Google Scholar] [CrossRef]
- Houssamo, I.; Locment, F.; Sechilariu, M. Maximum power tracking for photovoltaic power system: Development and experimental comparison of two algorithms. Renew. Energy 2010, 35, 2381–2387. [Google Scholar] [CrossRef]
- Bergveld, H.J.; Notten, P.H.L.; Kruijt, W.S. Battery Management Systems: Design by Modeling; Philips Research Book Series; Kluwer Academic Publishers: Boston, MA, USA, 2002. [Google Scholar]
- Wang, B.C.; Sechilariu, M.; Locment, F. A simple PV Constrained Production Control Strategy. In Proceedings of the IEEE International Symposium on Industrial Electronics (ISIE), Hangzhou, China, 28–31 May 2012; pp. 969–974.
© 2015 by the authors; licensee MDPI, Basel, Switzerland. This article is an open access article distributed under the terms and conditions of the Creative Commons Attribution license (http://creativecommons.org/licenses/by/4.0/).