1. Introduction
Depending on specific mission objectives and performance requirements, unmanned aerial vehicles (UAVs) can be equipped with cameras, sensors, communications equipment, and other payloads. UAVs are widely used in civil, commercial, military, and science applications. The development of UAVs is expected to continue to receive attention from researchers in the future [
1,
2]. A key area of UAV design is the endurance capabilities of such vehicles. Solar power could potentially redefine the endurance capabilities of UAVs because sunlight is an inexhaustible energy source. Since the successful flight of the first solar-powered aircraft, Sunrise [
3], in 1974, designing solar-powered aircraft has been a topic of interest for the general public and UAV communities [
4,
5,
6,
7,
8,
9]. Solar-powered airplanes are used in developing scientific technology and for commercial exploitation purposes. The effectiveness of using solar energy depends on the efficiency of how solar power management systems handle the acquisition and distribution of solar energy.
The solar power delivered from the photovoltaic (PV) cells depends on environmental conditions (solar irradiation changes, incident angle of sunlight, and cell temperature) and load conditions. Maximum power point tracking (MPPT) schemes are typically employed in such systems to ensure that the maximum power is obtained from the PV system. Common MPPT techniques include perturbing and observing [
10], incremental conductance [
11], and fuzzy logic-based MPPT [
12,
13,
14,
15,
16,
17,
18,
19]. For continuous operation and safety considerations, hybrid power systems are typically designed to power electric motors for a long endurance UAV. Hybrid power systems incorporate several different but complementary power sources. PV system is the basic power source of the hybrid system. Analysis and design of power management system for hybrid power systems received great attention recently [
20,
21,
22,
23,
24,
25]. A comprehensive power management function including the MPPT to manage and control the power flow among the hybrid system is critical for maximizing the efficiency of energy usage. Results using combination of neural network and fuzzy logic algorithms for energy management for hybrid power systems were reported in [
22,
23,
24]. In this study, solar and battery hybrid power systems are considered. Typical solar power management systems contain solar power MPPT and power conversion functions [
26,
27]. The MPPT function obtains the maximum power from the PV system, and the power conversion function converts the voltage from the MPPT stage to a required voltage level to support motor operation. Both functions are typically accomplished using a certain type of power converter, resulting in additional power consumption.
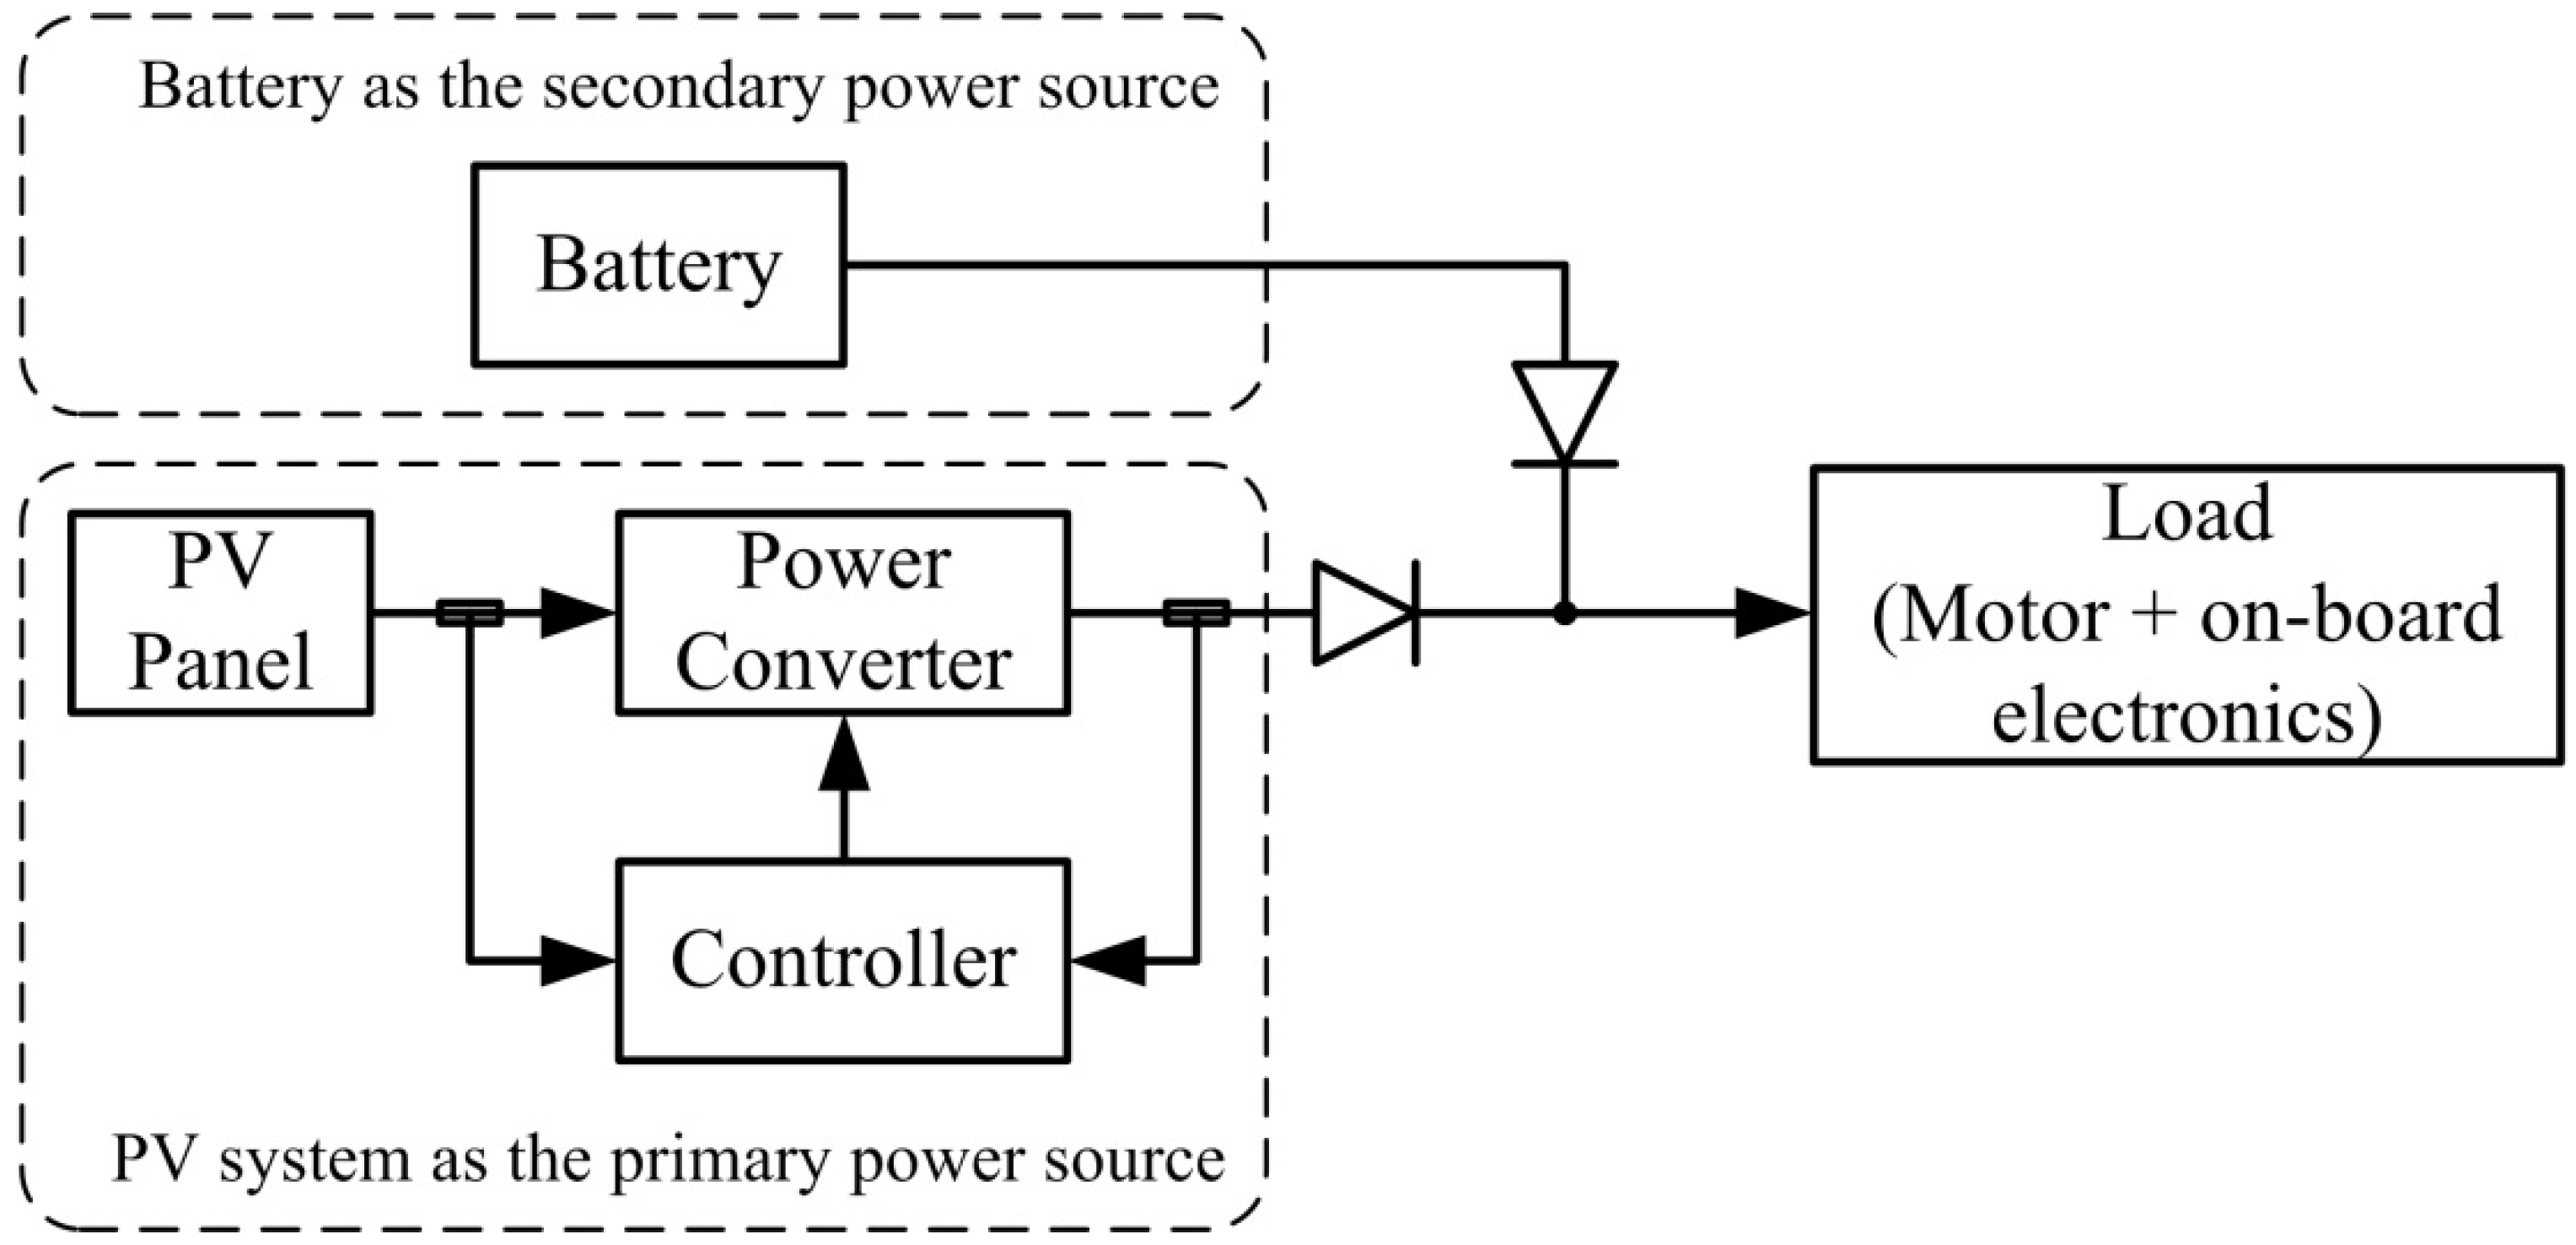
Motivated by the design of a small solar powered UAV, this study designed a novel voltage-regulated solar power MPPT system. The system contains a solar power system and battery as the primary and secondary power sources, respectively. The main purpose was to combine the MPPT and power converter functions as an integrated module and use only one power converter for the solar and battery hybrid-power system. The solar system alone supplied power for the electric motor and maintains the output voltage at a predetermined level when it has sufficient power for motor operation. When the power was insufficient, the solar system was operated at its maximum power point (MPP) and the battery was engaged to compensate for the insufficiency.
Three major accomplishments are presented in this paper. First, the voltage-regulated MPPT system was formulated as a feedback control system, where the MPP condition and voltage regulation are used as the control system inputs. To define the feedback control system, a variant of the incremental conductance MPP condition was first established. Instead of computing the sum of conductance and incremental conductance, the sum of the arctangent of the conductance and the arctangent of the incremental conductance [
16] was investigated. At MPP, the sum was 180°. In addition, the range of the sum was confined to 90° to 270°; thus, the voltage-regulated MPPT system was formulated as a feedback control system with two reference inputs (
i.e., 180° as the reference for the MPPT function and a reference voltage for the desired output voltage). Second, a buck-boost converter based fuzzy controller was successfully designed for the voltage-regulated MPPT system. The error of the MPP condition and the error of the voltage regulation were used as input variables for the fuzzy controller. MPPT and voltage regulation were achieved through continuously adjusting the duty ratio of the power switch of a buck-boost converter. Finally, this research successfully developed a simulation model for the system. In the proposed algorithm, the MPPT and voltage regulation functions are integrated into a single standard feedback control system that requires only one power converter. With this standard feedback formulation, not only the efficiency of the solar energy is increased, but design and implementation of the real time control system is also simpler.
A simulation model based on MATLAB/SIMULINK and a piecewise linear electric circuit simulation (PLECS) tool for controlling the velocity of the dc motor was developed to verify the voltage-regulated solar power MPPT system. Three cases were selected for the computer simulation, namely, varying the regulation voltages, solar irradiation, and motor speed. The system was also used to power two motors that were operated at different speeds. The results demonstrated the success of the proposed fuzzy controller design for the voltage-regulated MPPT system.
3. PV Characteristics and MPPT Conditions
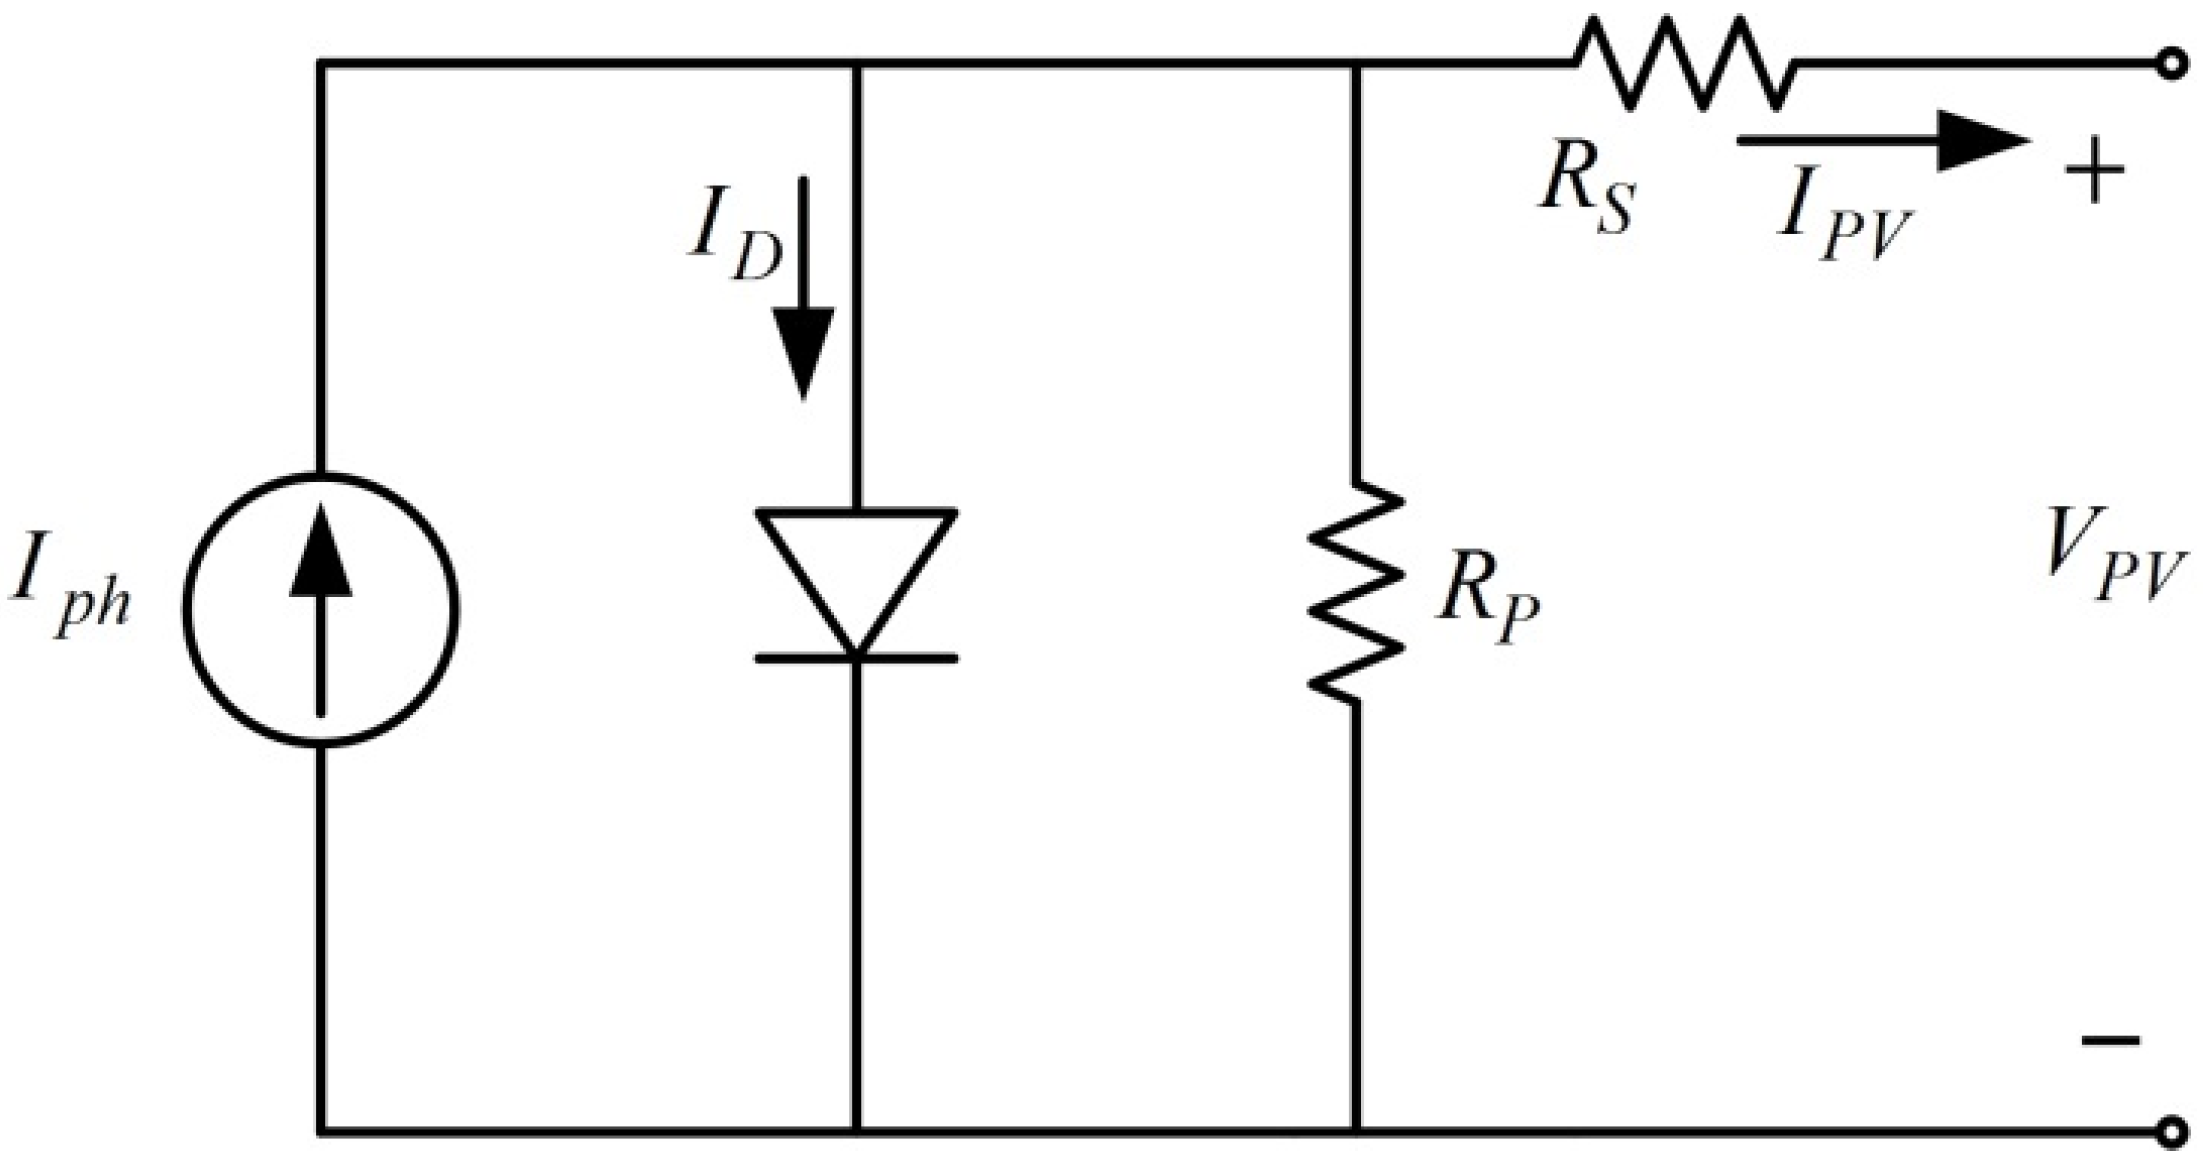
A single-diode equivalent circuit (
Figure 2) was selected as the PV model in this study. The circuit model comprised a current source
Iph, diode, shunt resistor
RP, and series of resistor
RS. The relationship between the current
IPV and voltage
VPV from the PV panel is expressed in the following equations:
The parameters are defined as follows:
Iph: Current generated by incident light;
ID: Diode current;
I0: Reverse saturation current;
q: Electron charge (1.602 × 10⁻¹⁹ C);
K: Boltzmann constant (1.38 × 10⁻²³ J/K);
T: Cell’s operating temperature in Kelvins (K);
A: Diode ideality constant;
n: Number of diodes in series to form the single-diode model.
Figure 2.
Single-diode equivalent circuit model.
Figure 2.
Single-diode equivalent circuit model.
Based on the parameters in [
28] for the Solarex MSX60 PV module,
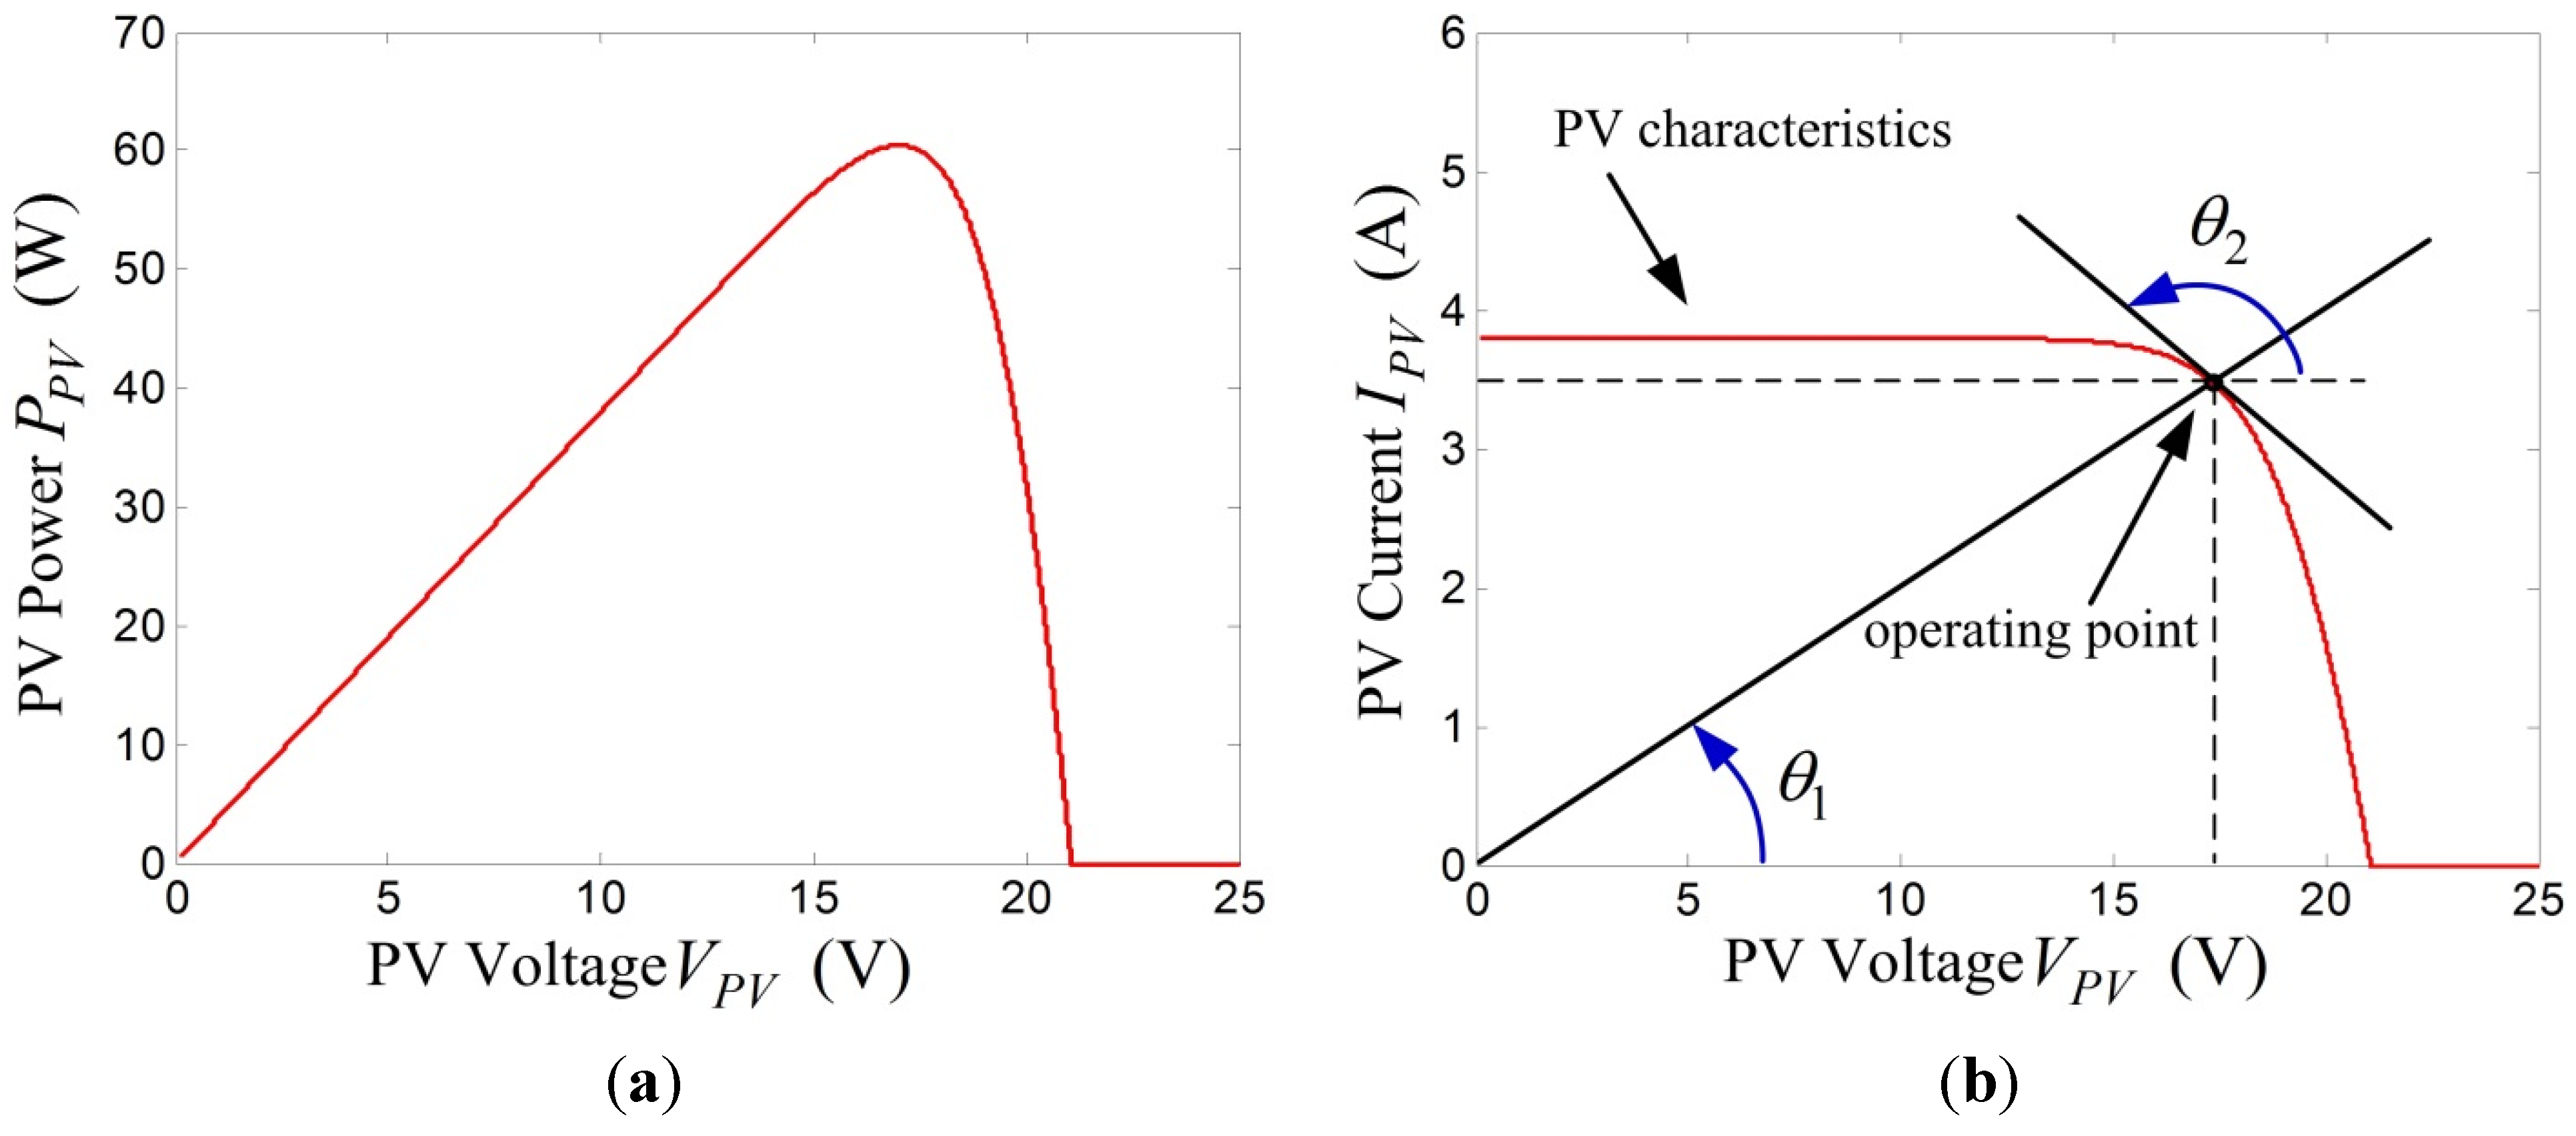
Figure 3 shows the characteristics of the PV model at 25 °C where irradiation level
G = 1. These characteristics were used as the power source for the buck-boost converter and establish the MPPT condition and design of a voltage-regulated MPPT algorithm by using fuzzy logic.
Figure 3.
PV characteristics. (a) PV power versus voltage; and (b) PV current versus voltage.
Figure 3.
PV characteristics. (a) PV power versus voltage; and (b) PV current versus voltage.
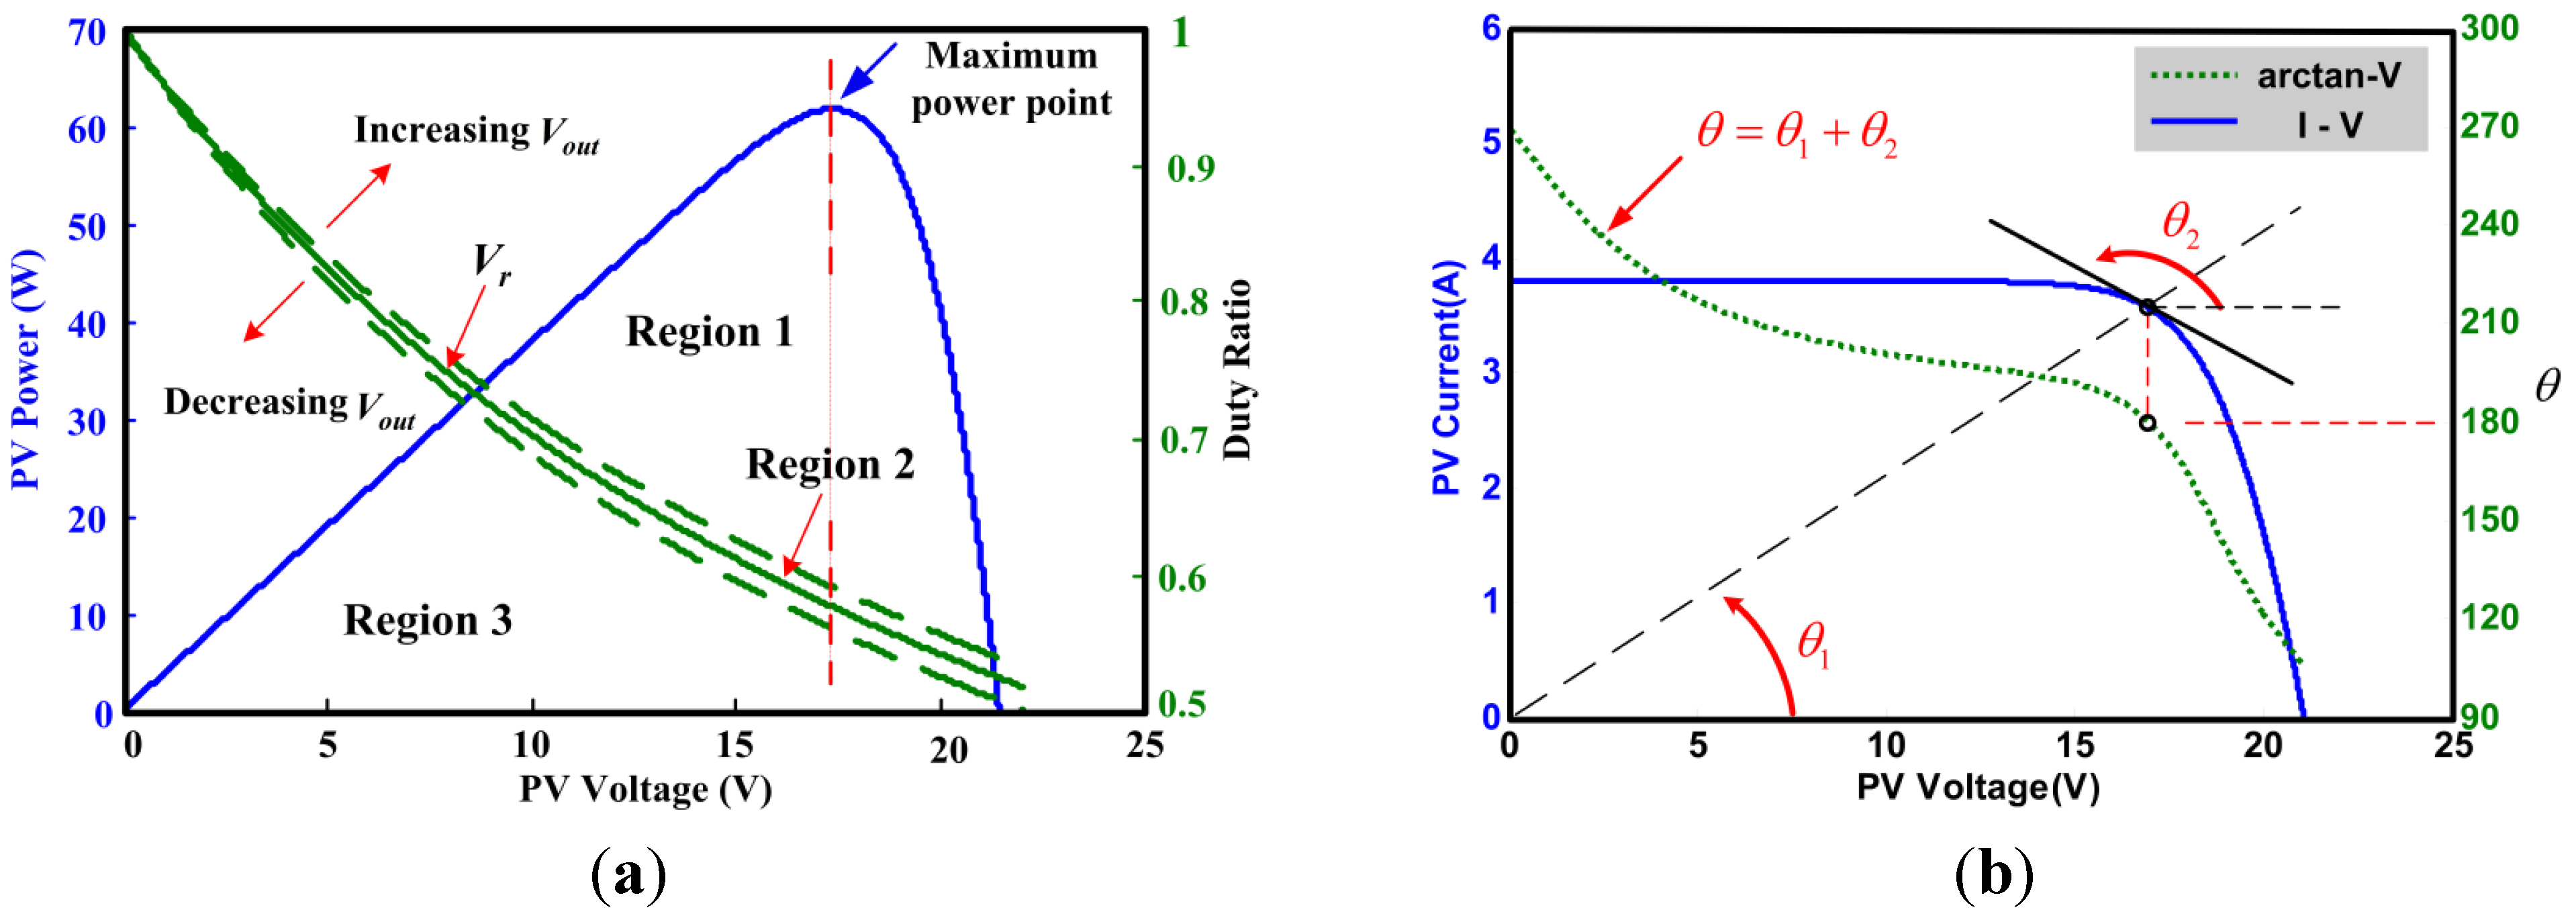
Figure 3a shows that the MPP occurs when the derivative of PV power with respect to PV voltage is zero (
i.e., at the MPP):
The condition of the MPP in Equation (3) has been widely used for designing MPPT algorithms. In this study, we aimed at establishing an alternative representation for the condition of MPP. Given:
as indicated in
Figure 3b, fundamental trigonometric functions were used to obtain:
From Equations (3) and (5), the condition tan(
θ1 +
θ2) = 0 is satisfied at MPP. In addition, from the current–voltage characteristics (
Figure 3b), we have the following constraints for
θ1 and
θ2:
Hence, from the constraints shown in Equation (6), an alternative condition of the PV system to operate at MPP is
θ1 +
θ2 = 180°, which is expressed as follows:
The range of the θ1 + θ2 was confined to the interval (90°, 270°) rather than (−∞, ∞) for the range of the MPP evaluation condition (IPV/VPV + dlPV/dVPV) as given in Equation (3). The MPP condition in Equation (7) was used in conjunction with the voltage regulation requirement for the voltage-regulated MPPT design in this study.
Compared to the other artificial intelligent MPPT algorithms [
22,
23,
24], the MPP condition of the proposed algorithm is well defined and the range of the MPP evaluation condition is confined to a finite interval (90°, 270°) that simplifies the design for determining the range of the input membership functions. Besides, the process of this algorithm in locating the operating point was more direct and would not require the use of variations of the input variables or search algorithms to predict operating point locations, allowing for a fast tracking speed.
4. Fuzzy Controller for Voltage-Regulated MPPT System
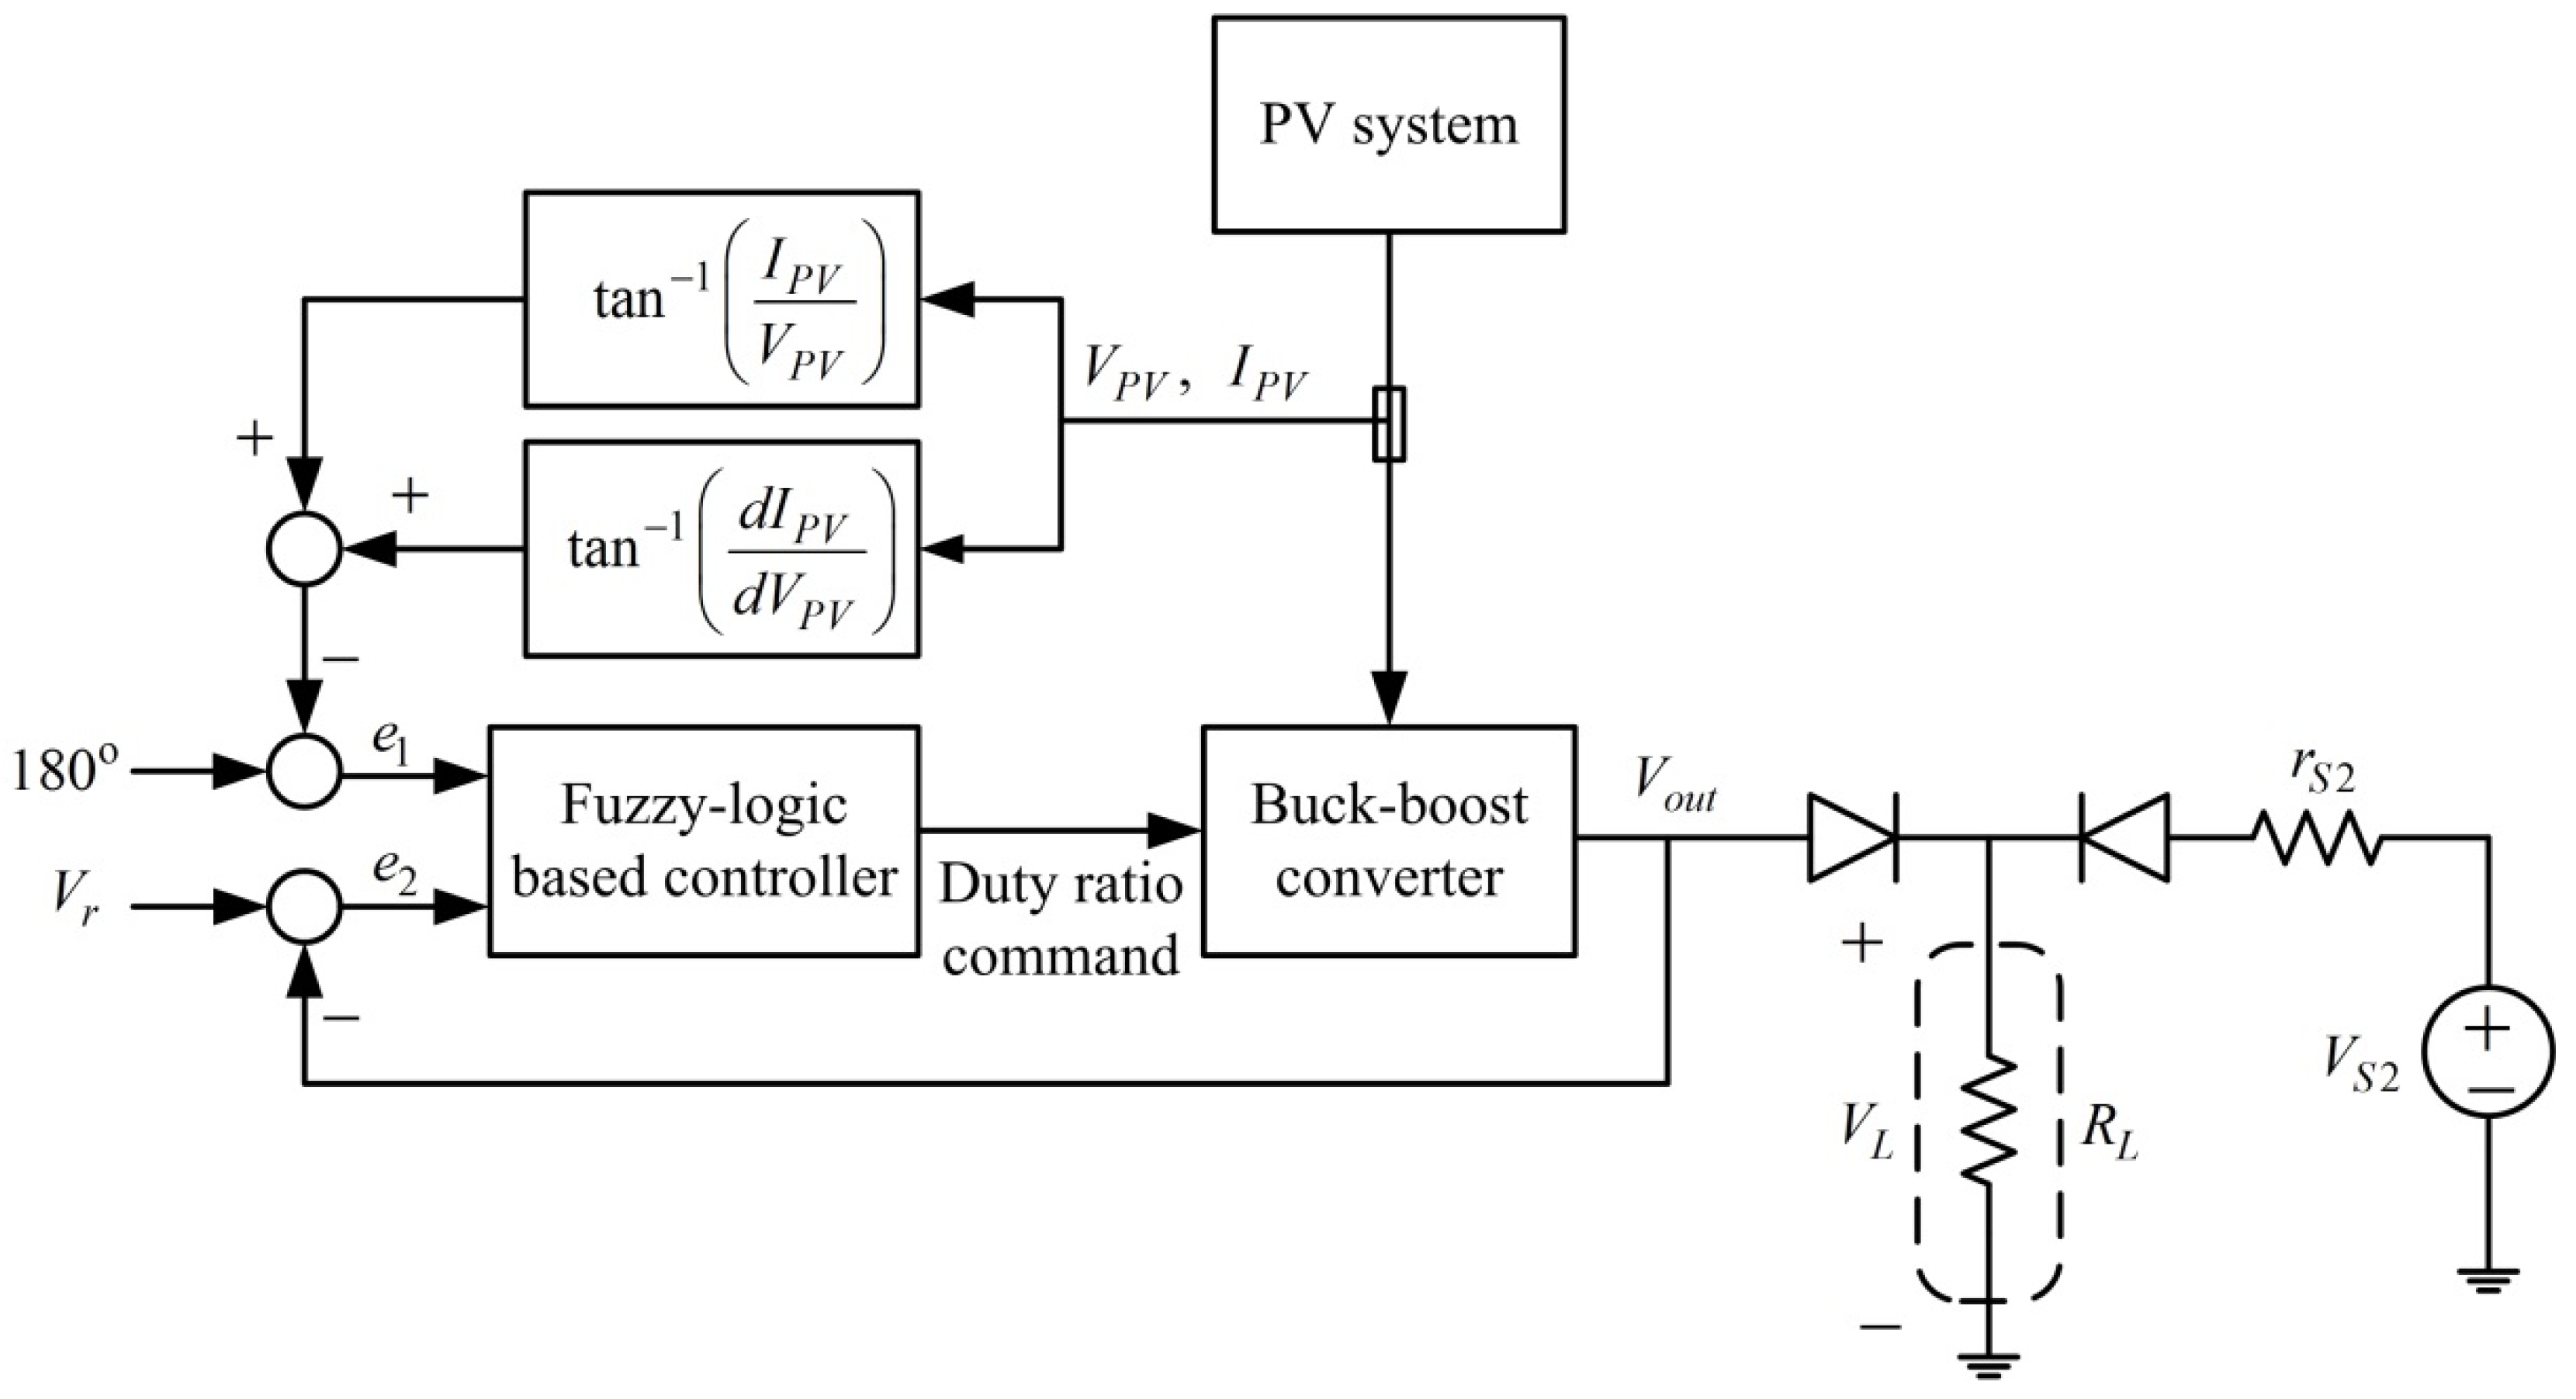
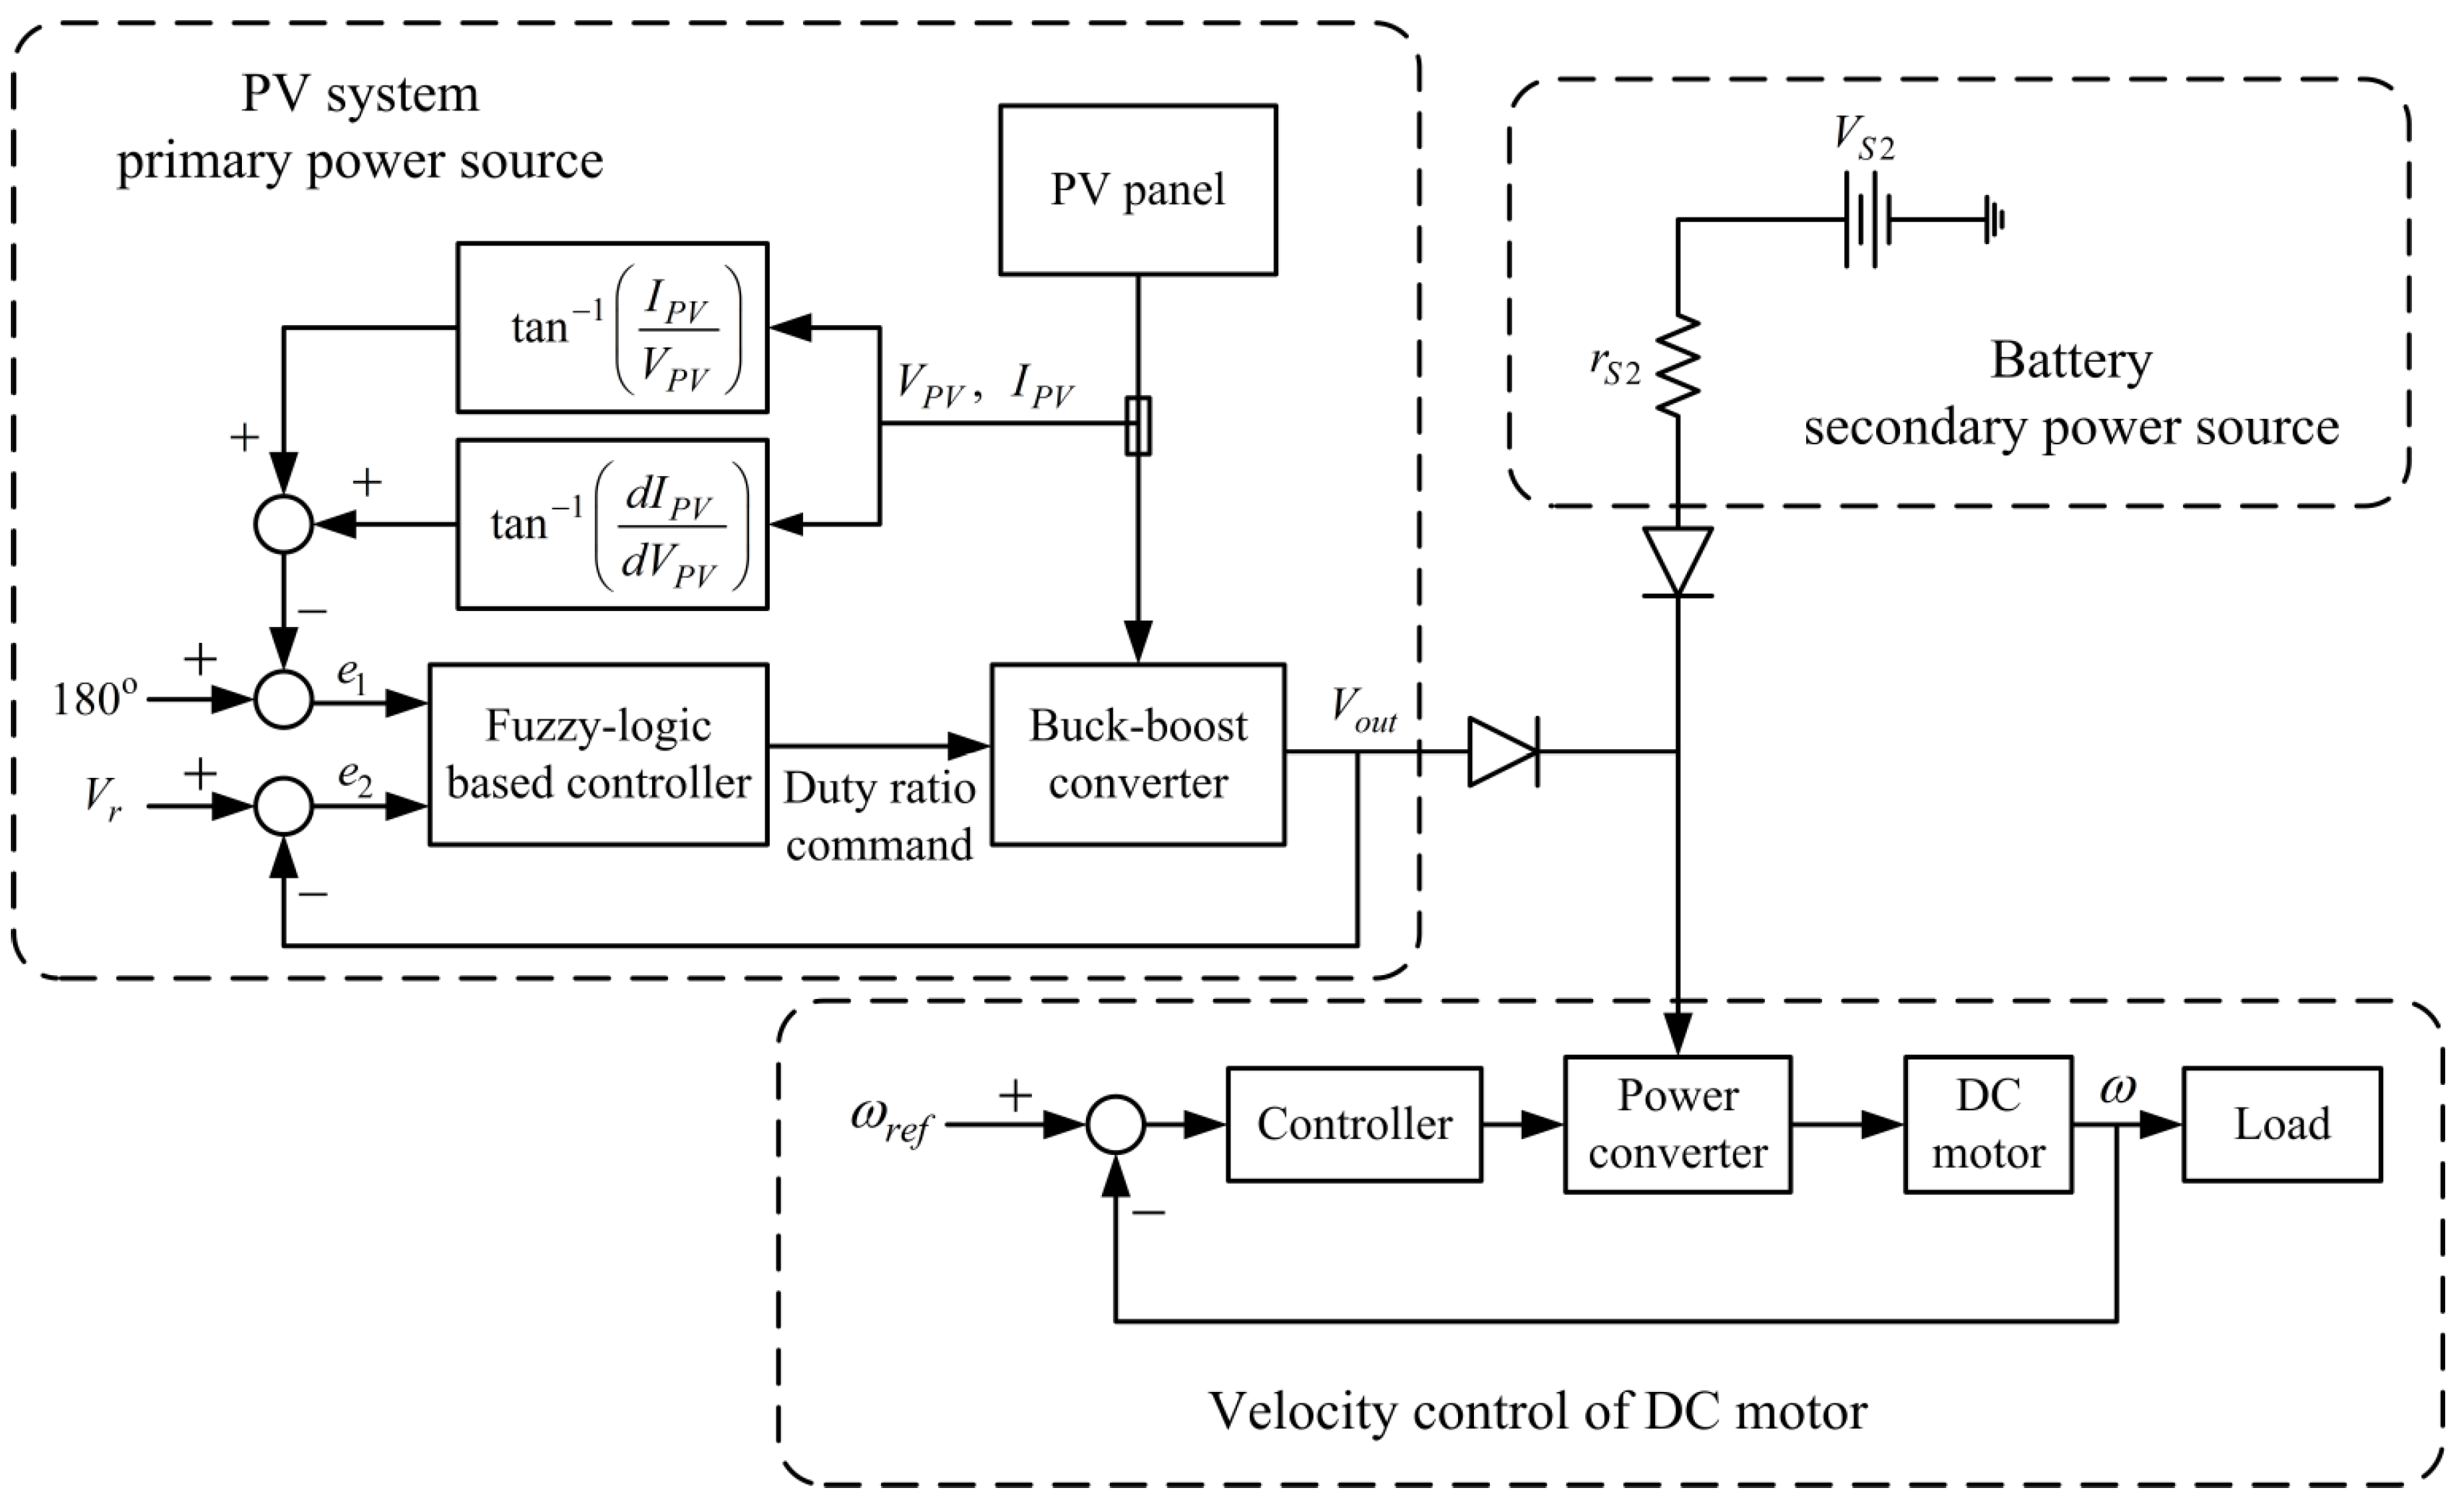
Figure 4 depicts the voltage-regulated MPPT system considered in this study. The system contains a PV system and battery as the primary and secondary power sources, respectively. The goal was to obtain as much power as possible from the PV system while maintaining the output voltage at a designated voltage level. The PV system alone powered the motor when it had sufficient power. Otherwise, the secondary power source was engaged to power the motor. To ensure that the PV system supplied maximal power to the motor, we implemented both MPP tracking and voltage regulation simultaneously. To optimize the performance, a compromise between the MPP operation and voltage regulation was required. The MPP condition in Equation (7) was used for the MPPT design. The MPP condition enabled formulation of the voltage-regulated MPPT system in the form of feedback control (
Figure 4). The inputs of the feedback control system were tan
−1(
IPV/
VPV) + tan
−1(
dIPV/
dVPV) and output voltage
Vout (
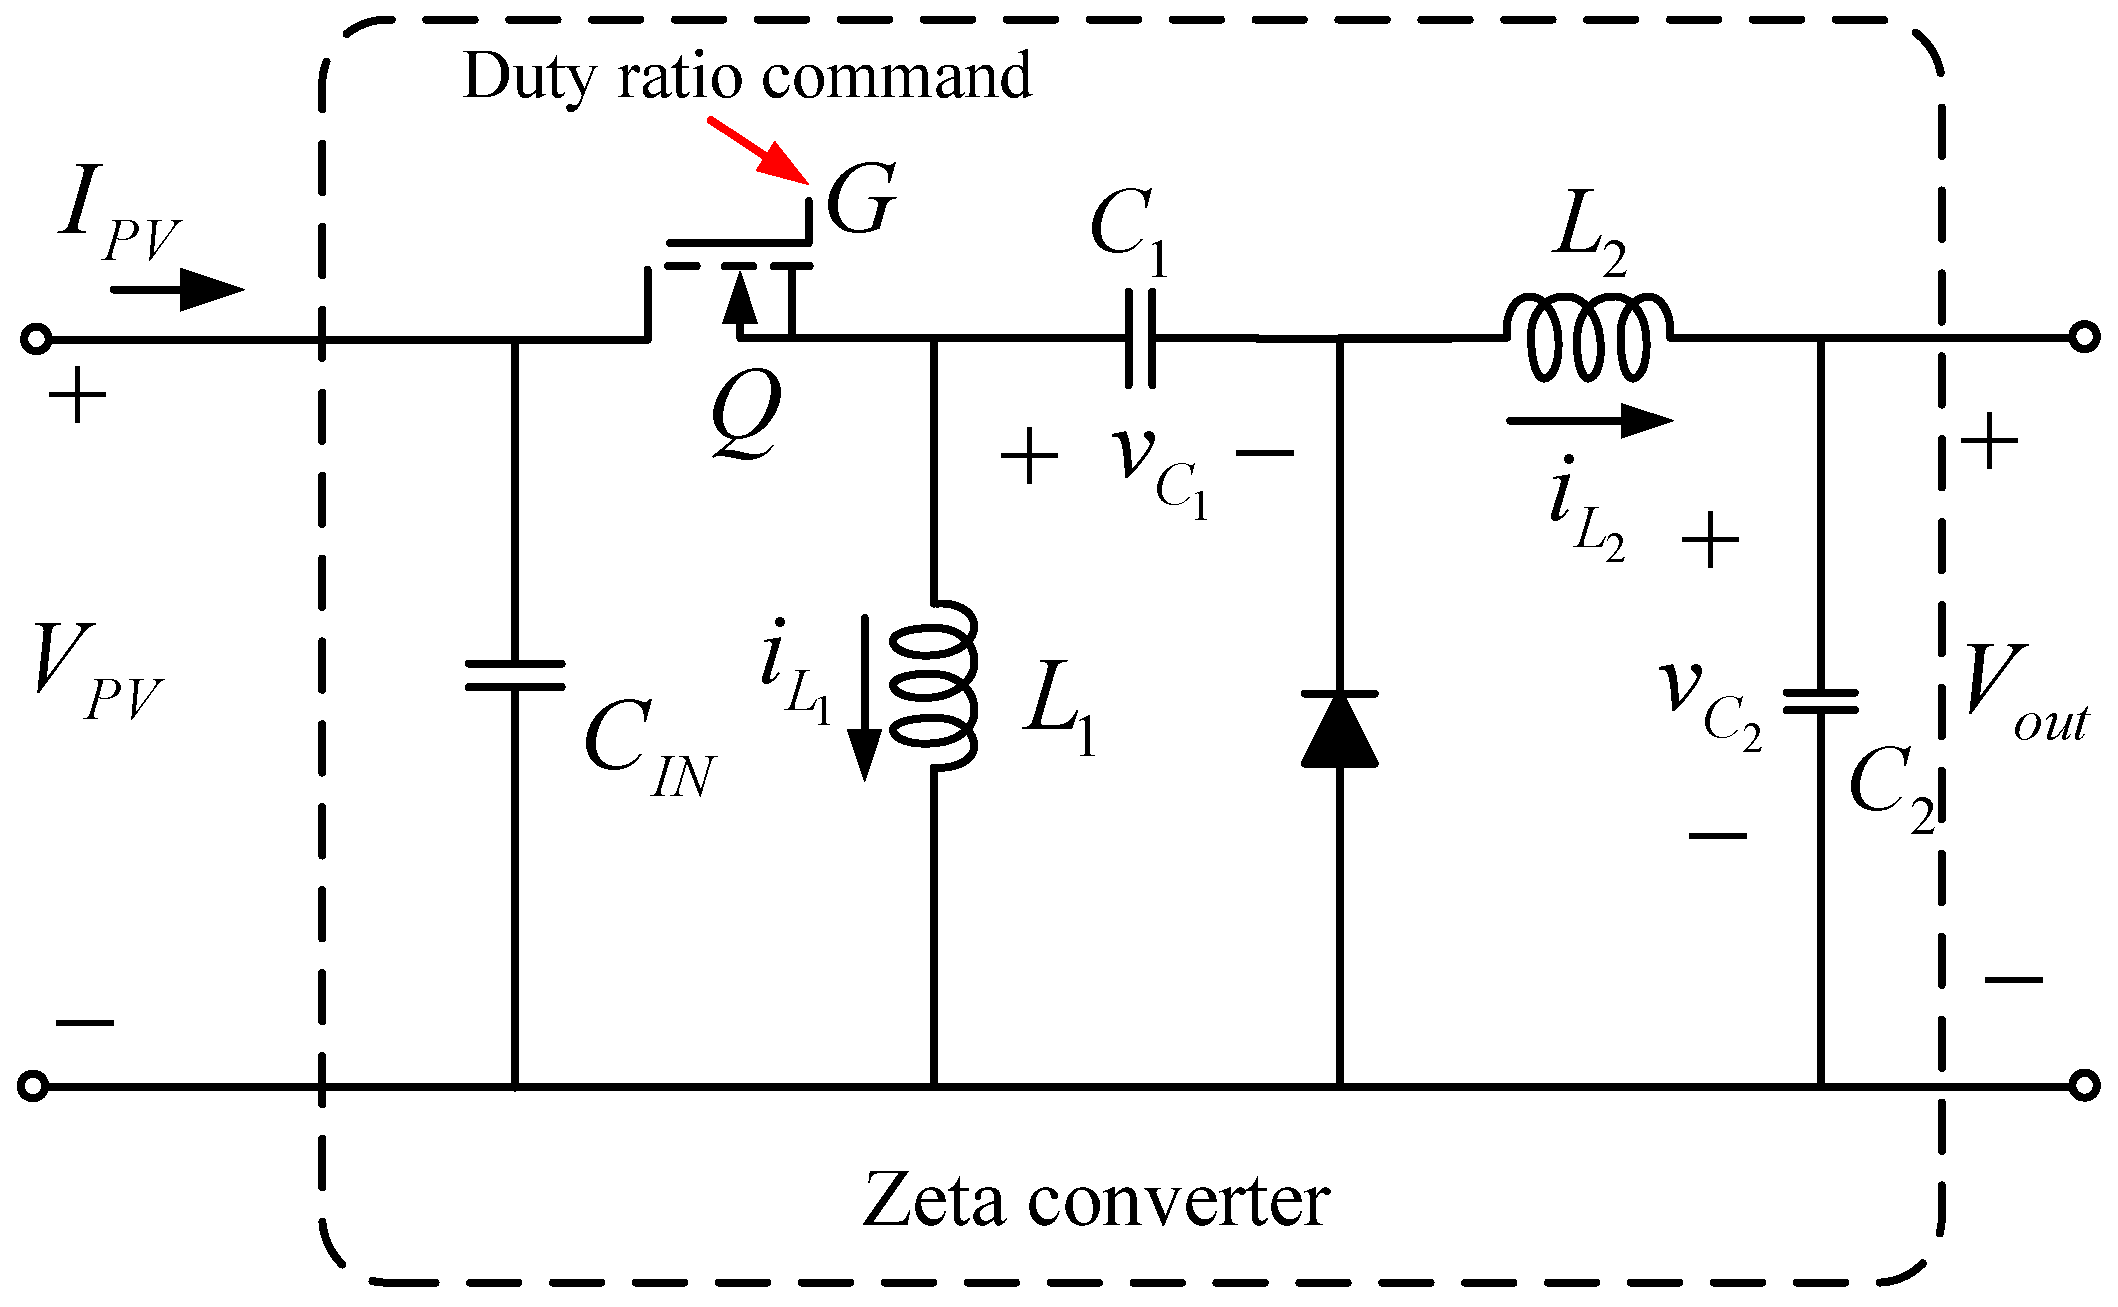
Figure 4). The reference inputs of the feedback control system are 180° (the MPP condition) and the desired output voltage. A Zeta type buck-boost converter in [
29] (
Figure 5) was used to achieve the MPPT and voltage regulation functions. The controller continuously adjusted the duty ratio command for the buck-boost converter to maintain the voltage regulation and MPPT function. The converter parameters were selected such that the converter was operated in continuous conducting mode. The terminal voltage of the PV system, denoted by
VPV, was highly sensitive to variation in the duty ration command D for power-switching of the buck-boost converter. Increasing the duty ratio command resulted in a decrease in the PV voltage and vice versa. Thus, maximum power was obtained by adjusting the duty ratio command. The output voltage of the converter depended on the converter input voltage. Neglecting the internal resistances of the components, the relationship of the input and output voltages in steady state is given as:
The input–output relation in Equation (8) was used for the design of the fuzzy controller for the voltage-regulated MPPT system.
Figure 4.
Block diagram of the voltage-regulated MPPT system.
Figure 4.
Block diagram of the voltage-regulated MPPT system.
Figure 5.
Zeta-type buck-boost converter.
Figure 5.
Zeta-type buck-boost converter.
As indicated in
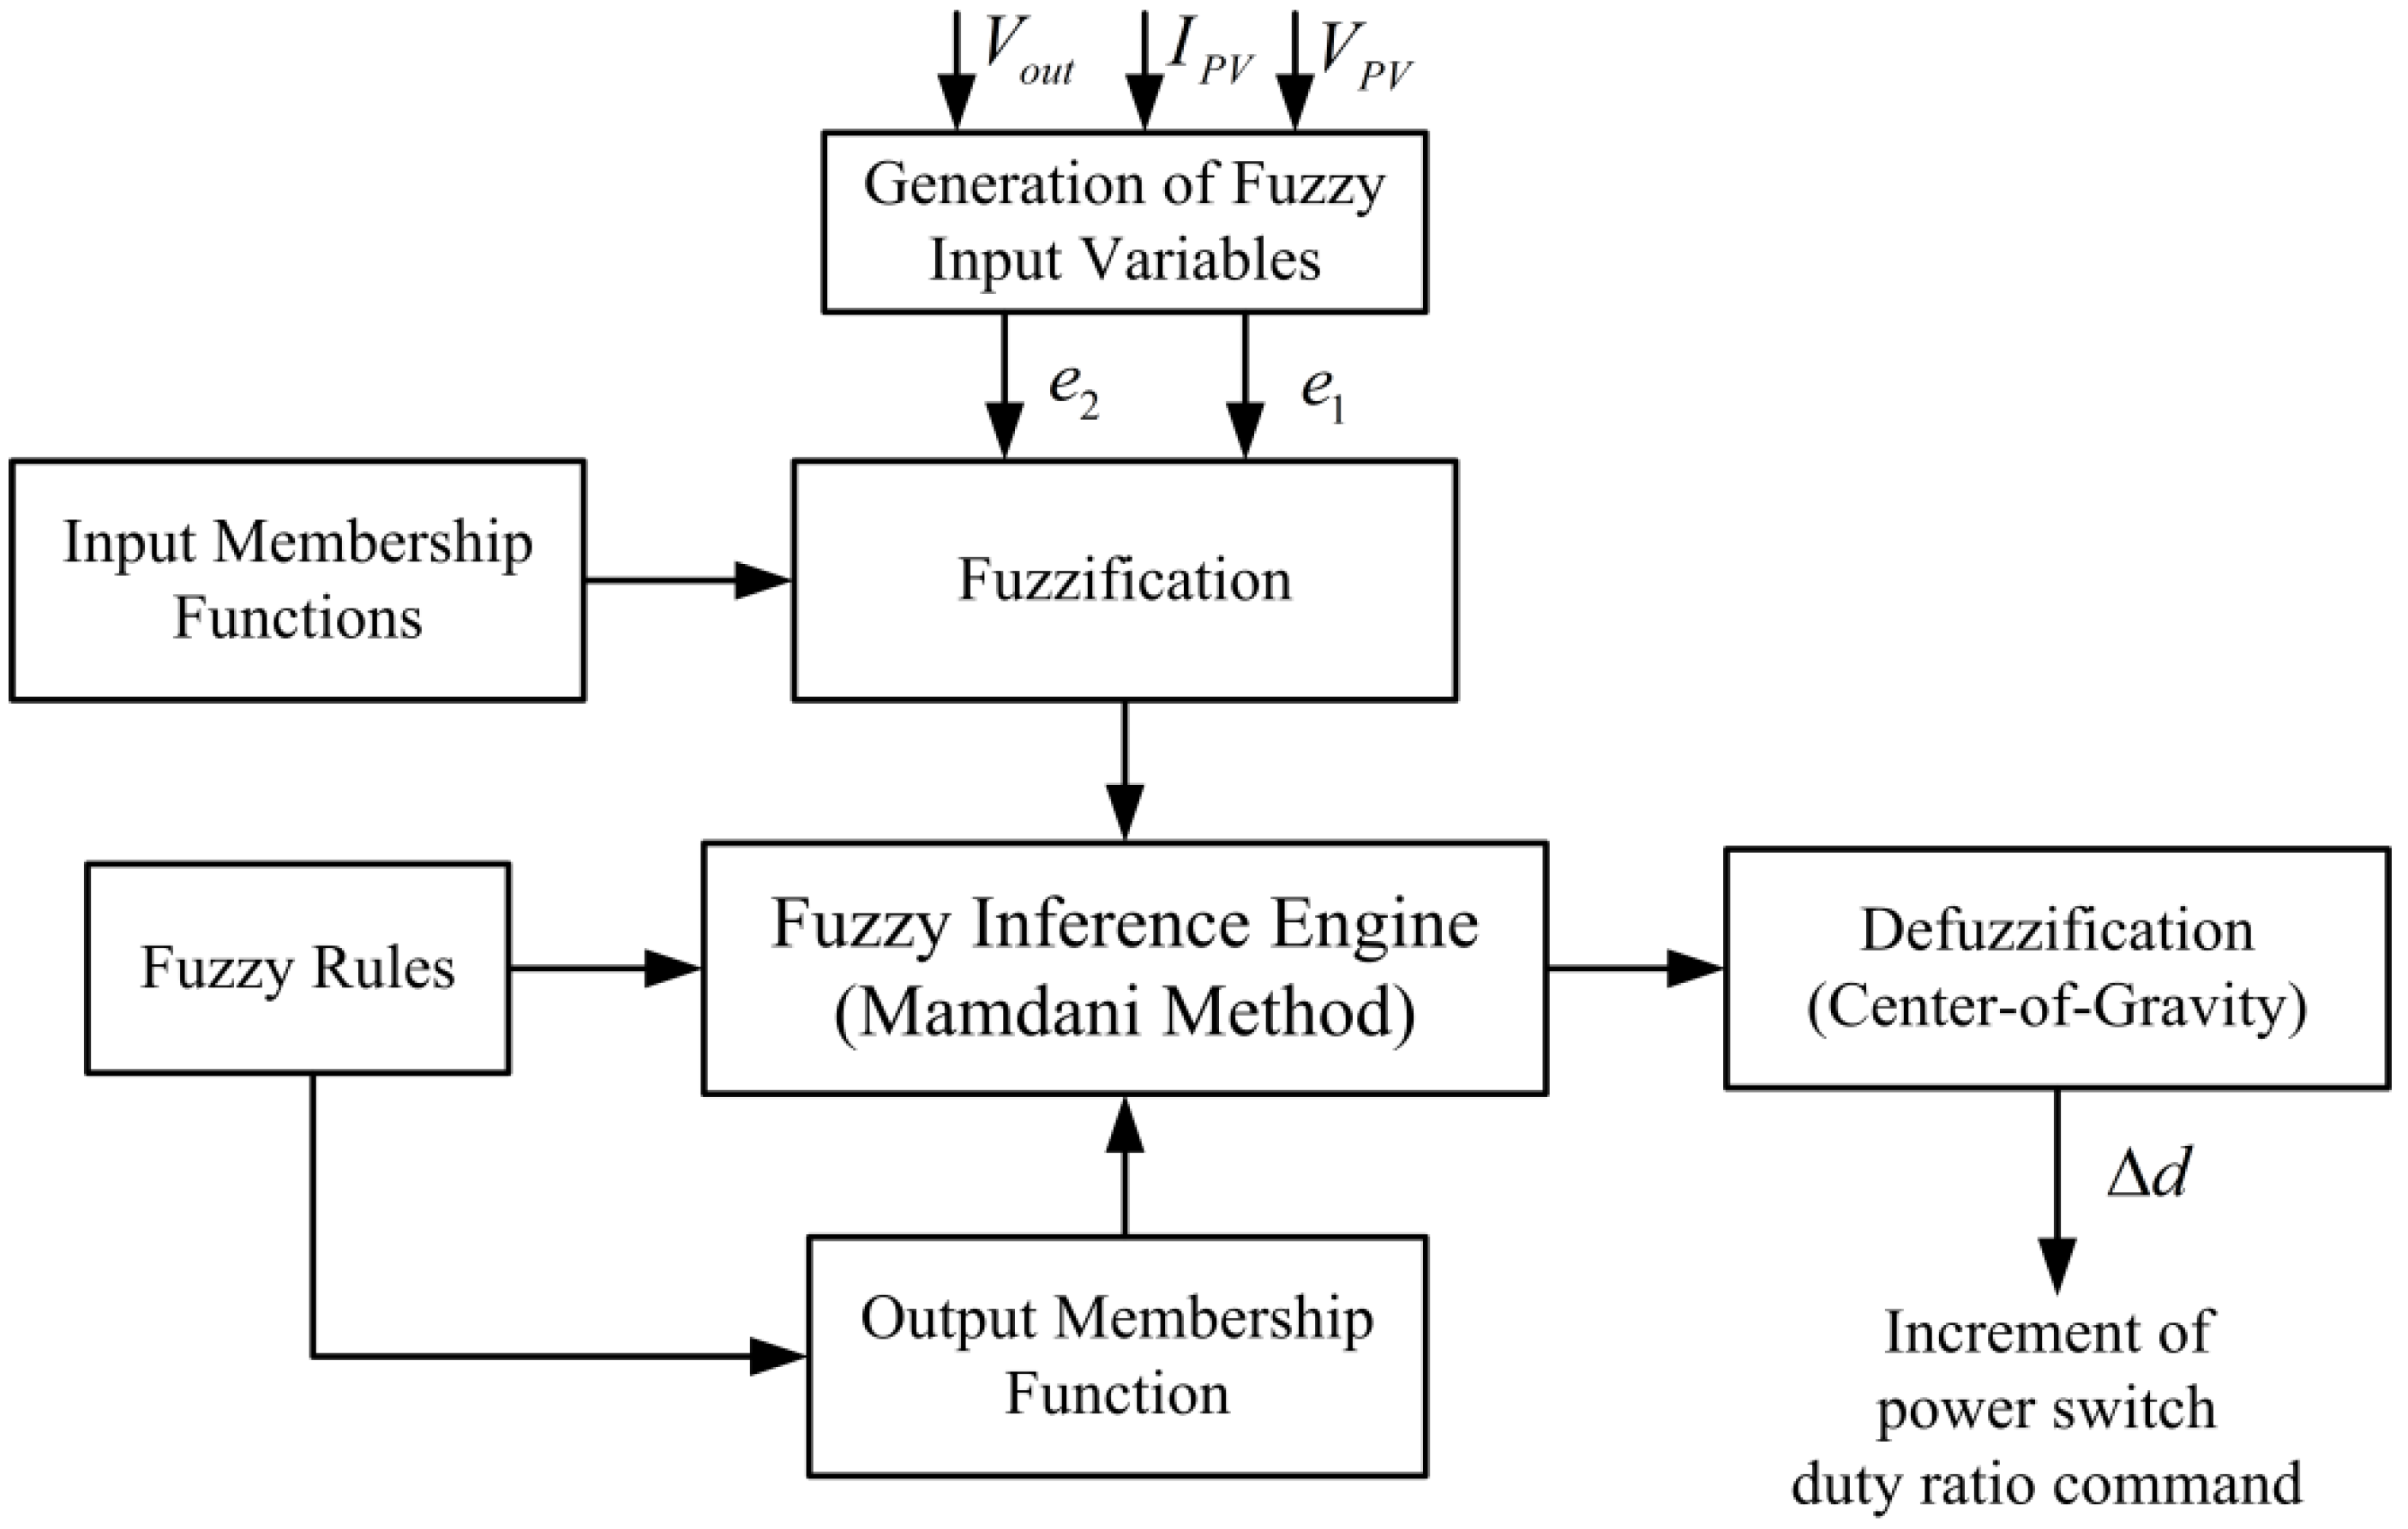
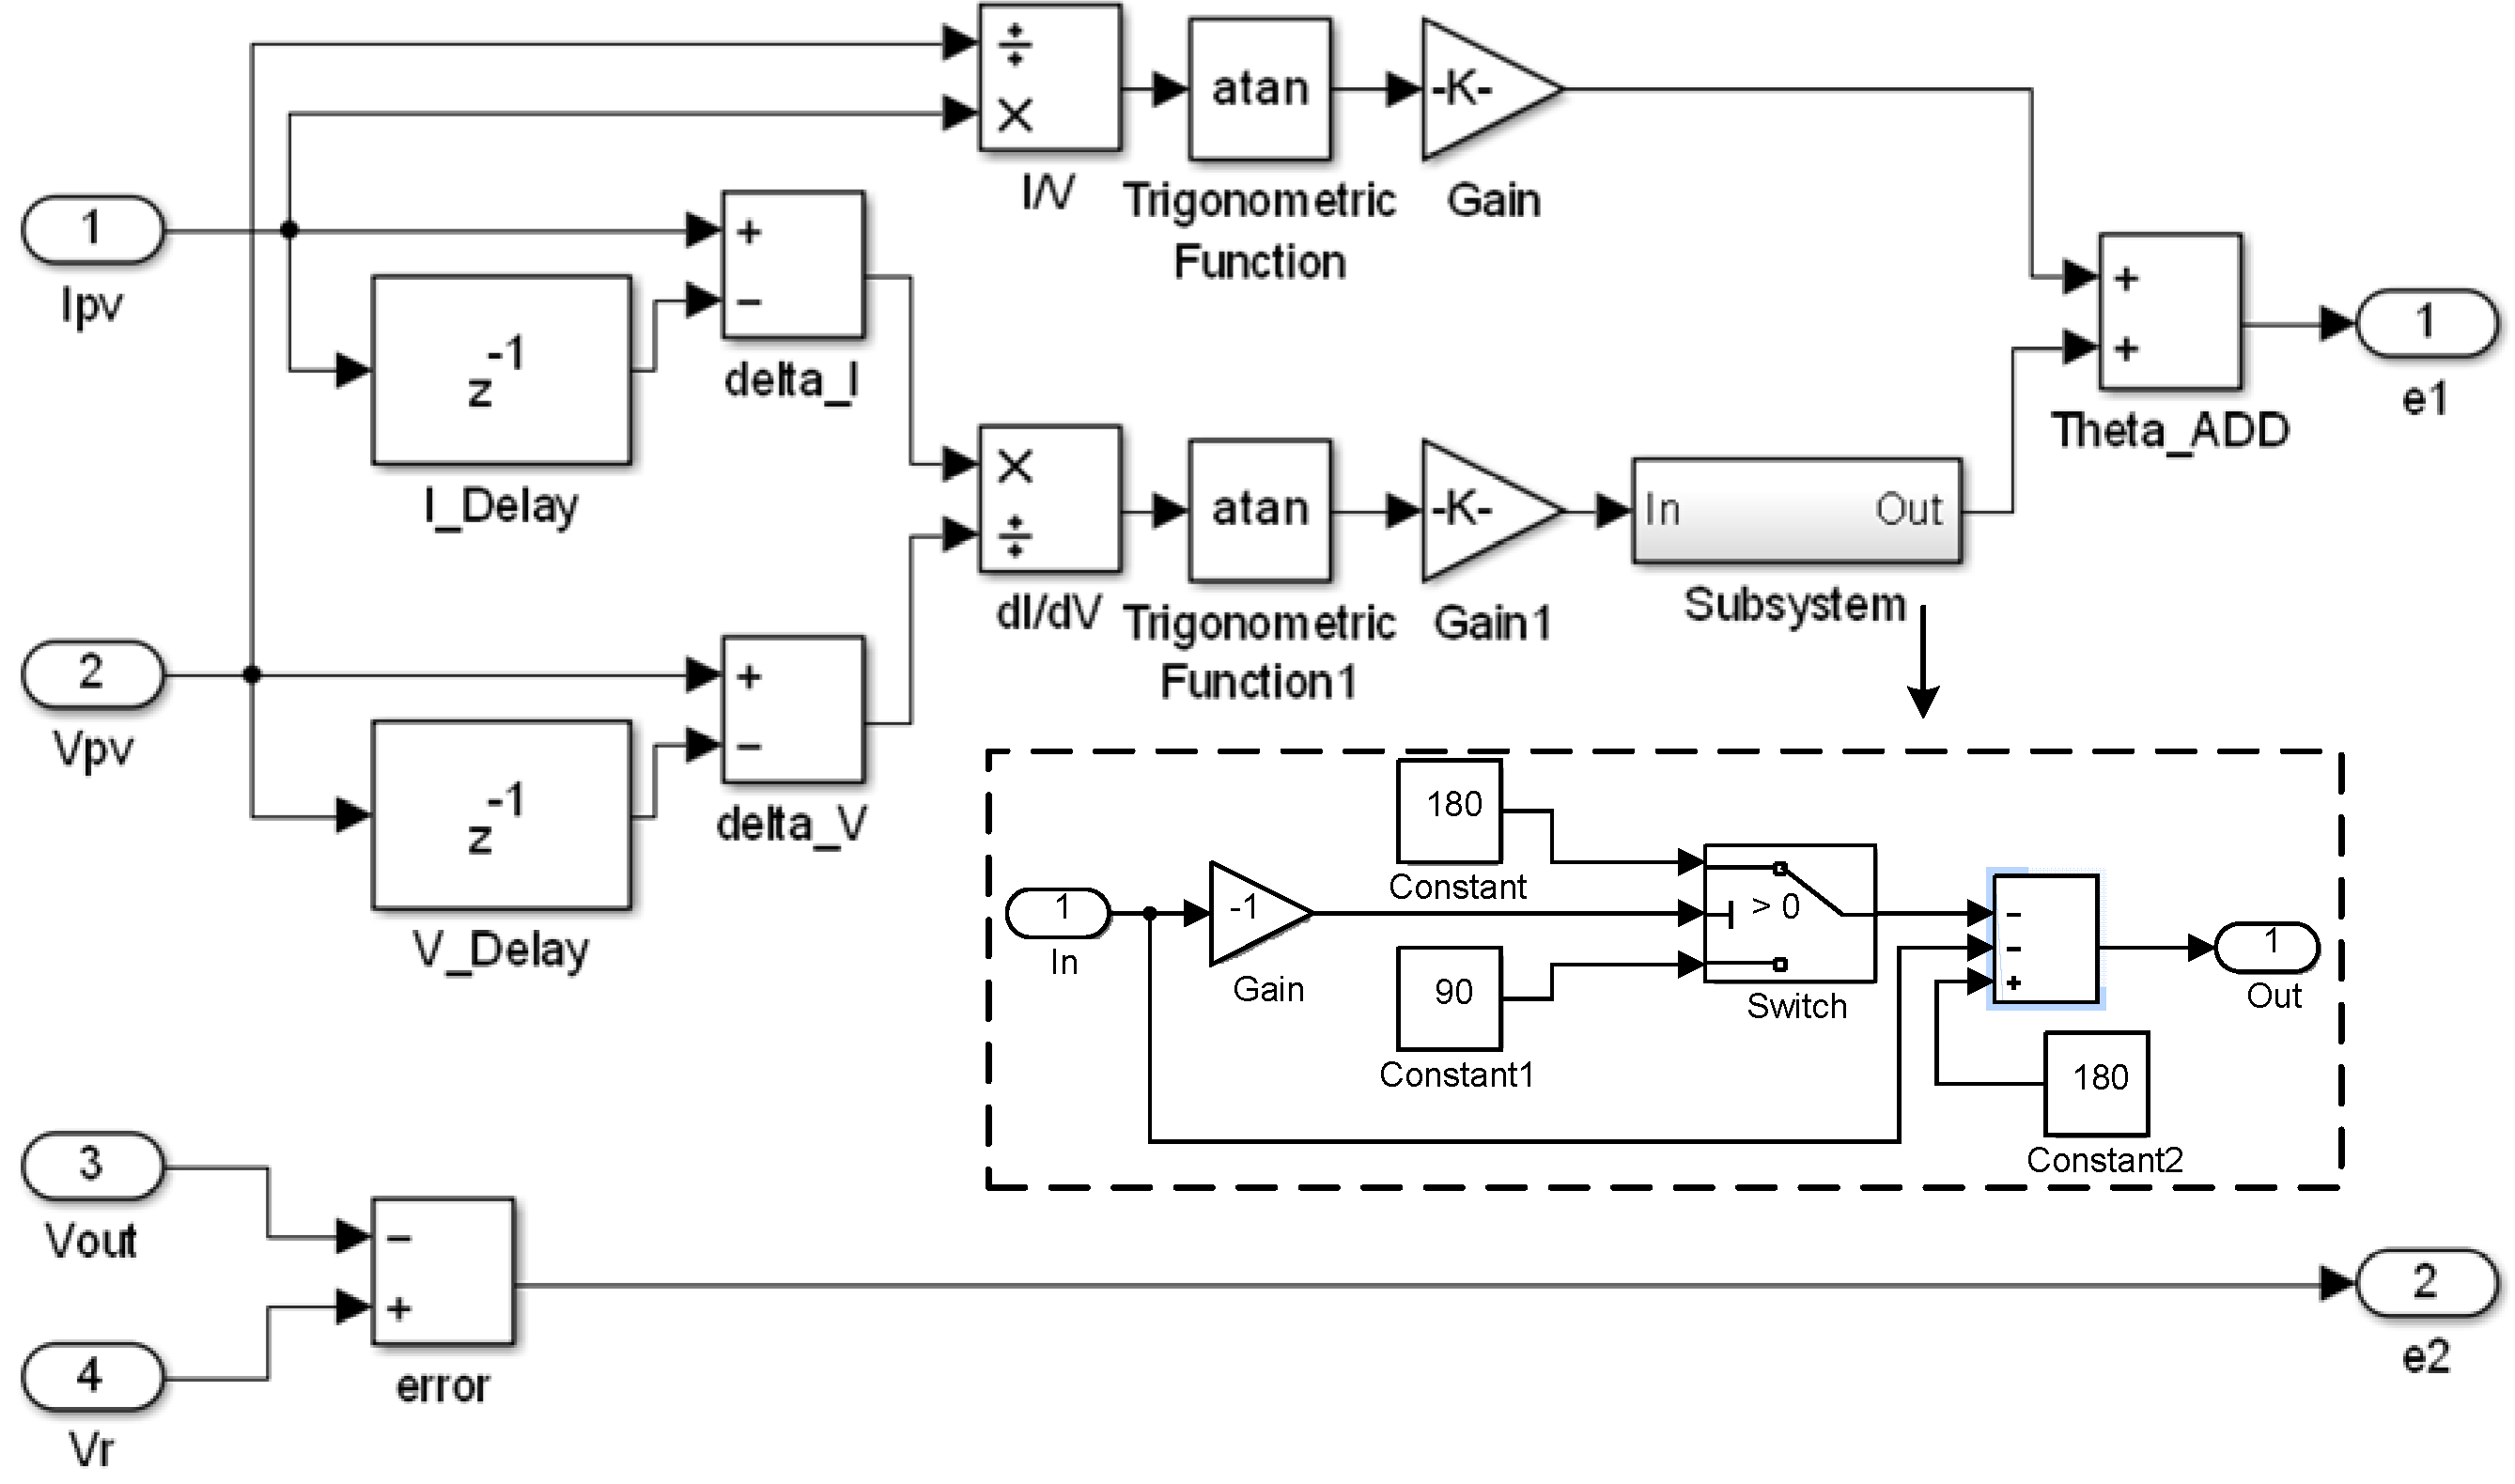
Figure 4, the voltage-regulated MPPT requirement was achieved using a fuzzy controller, the computation flowchart of which is shown in
Figure 6. The variables required for the fuzzy controller are voltage
VPV and current
IPV (from the PV system) and output voltage
Vout (from the buck-boost converter). The fuzzy input variables
e1 and
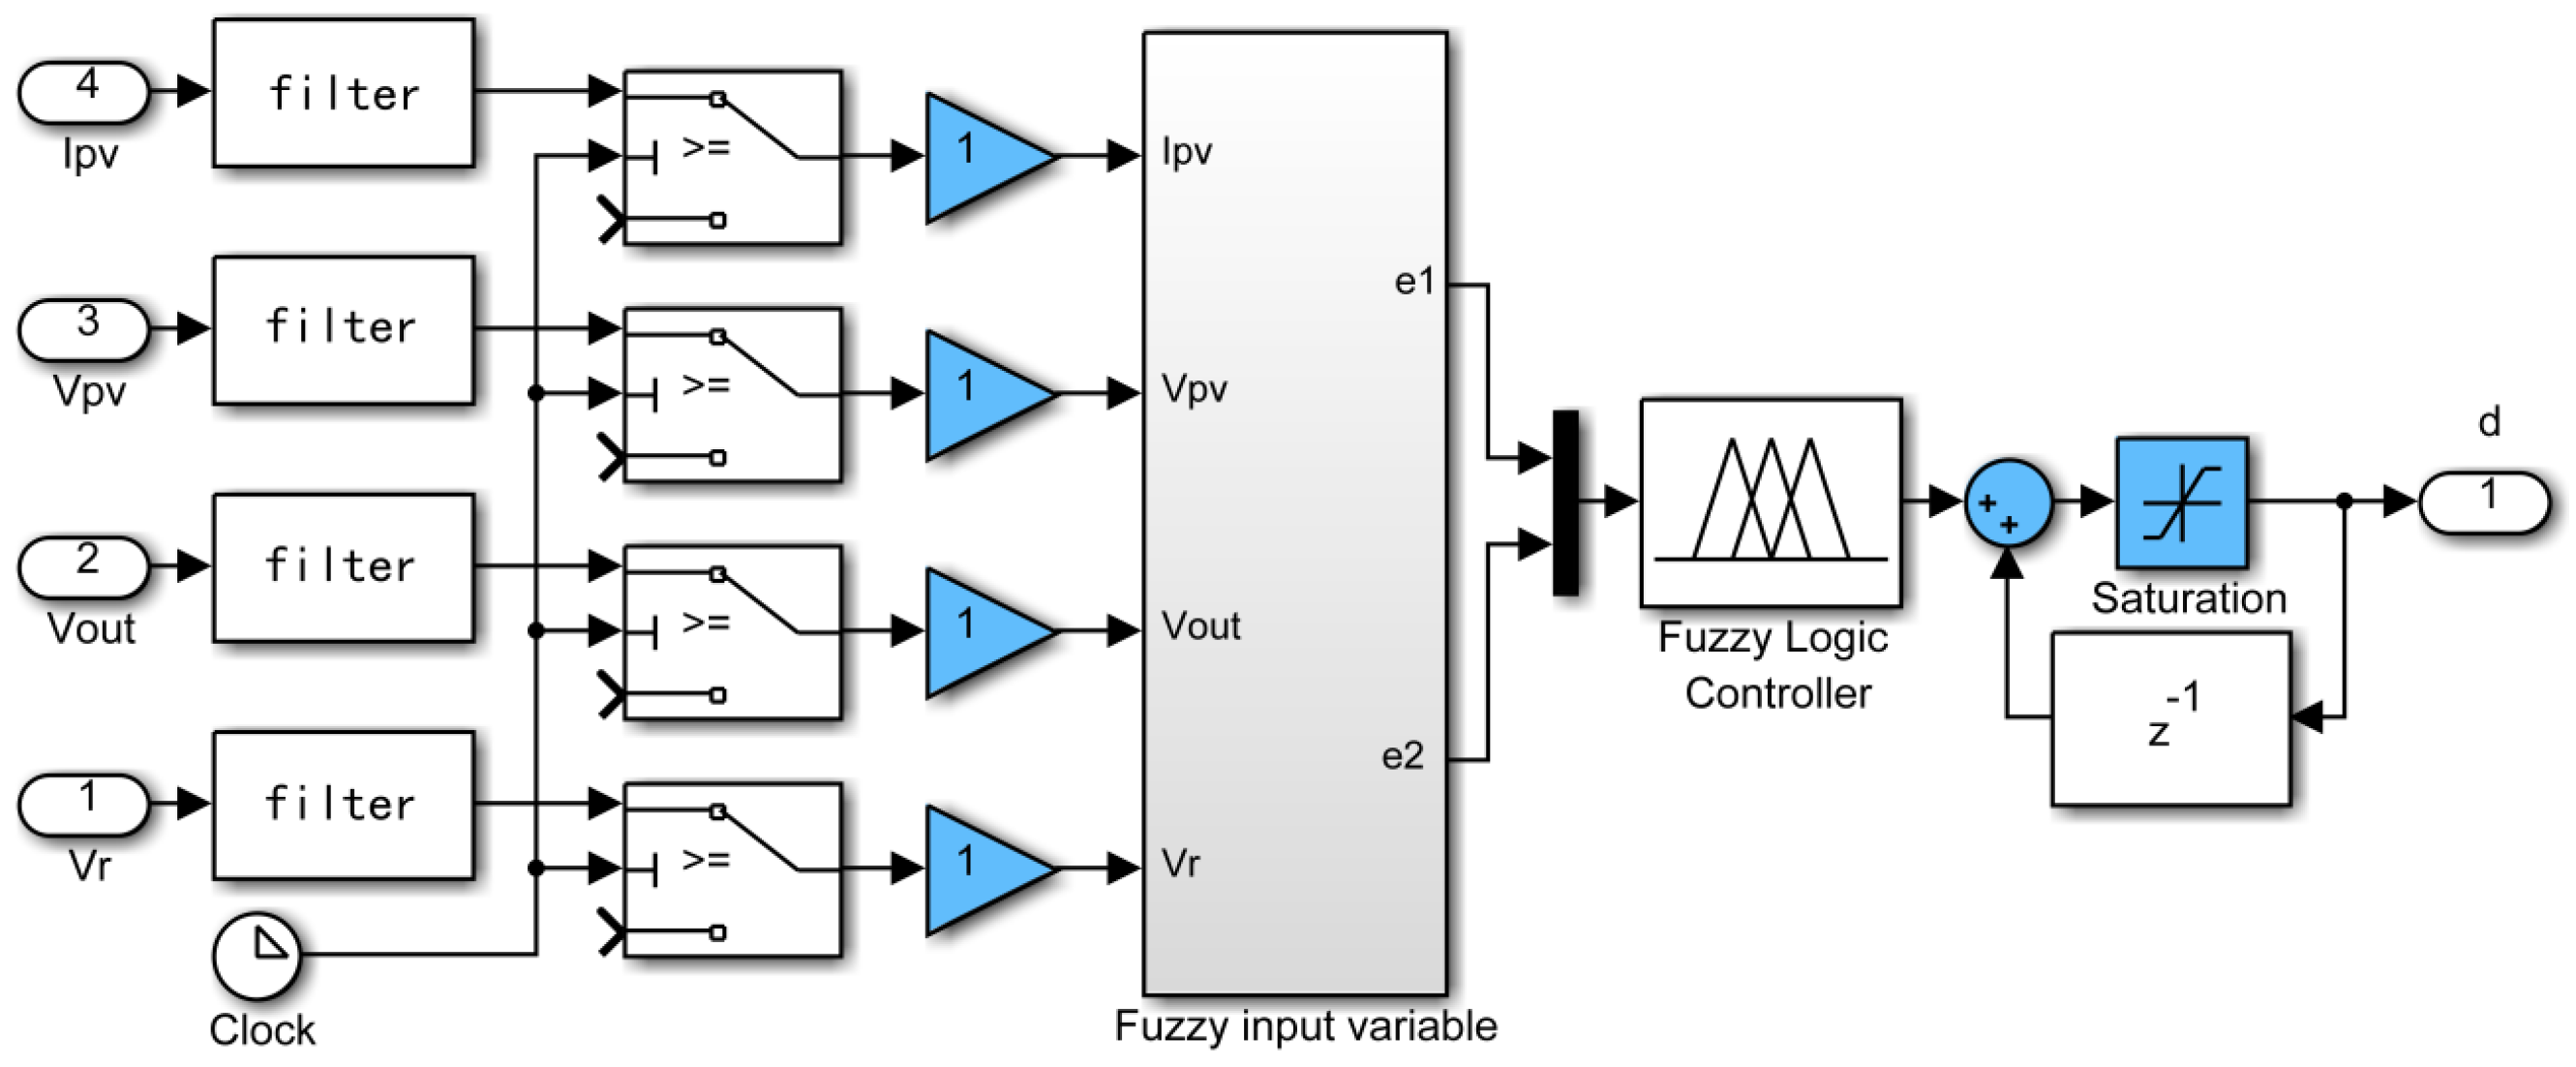
e2 are defined as follows:
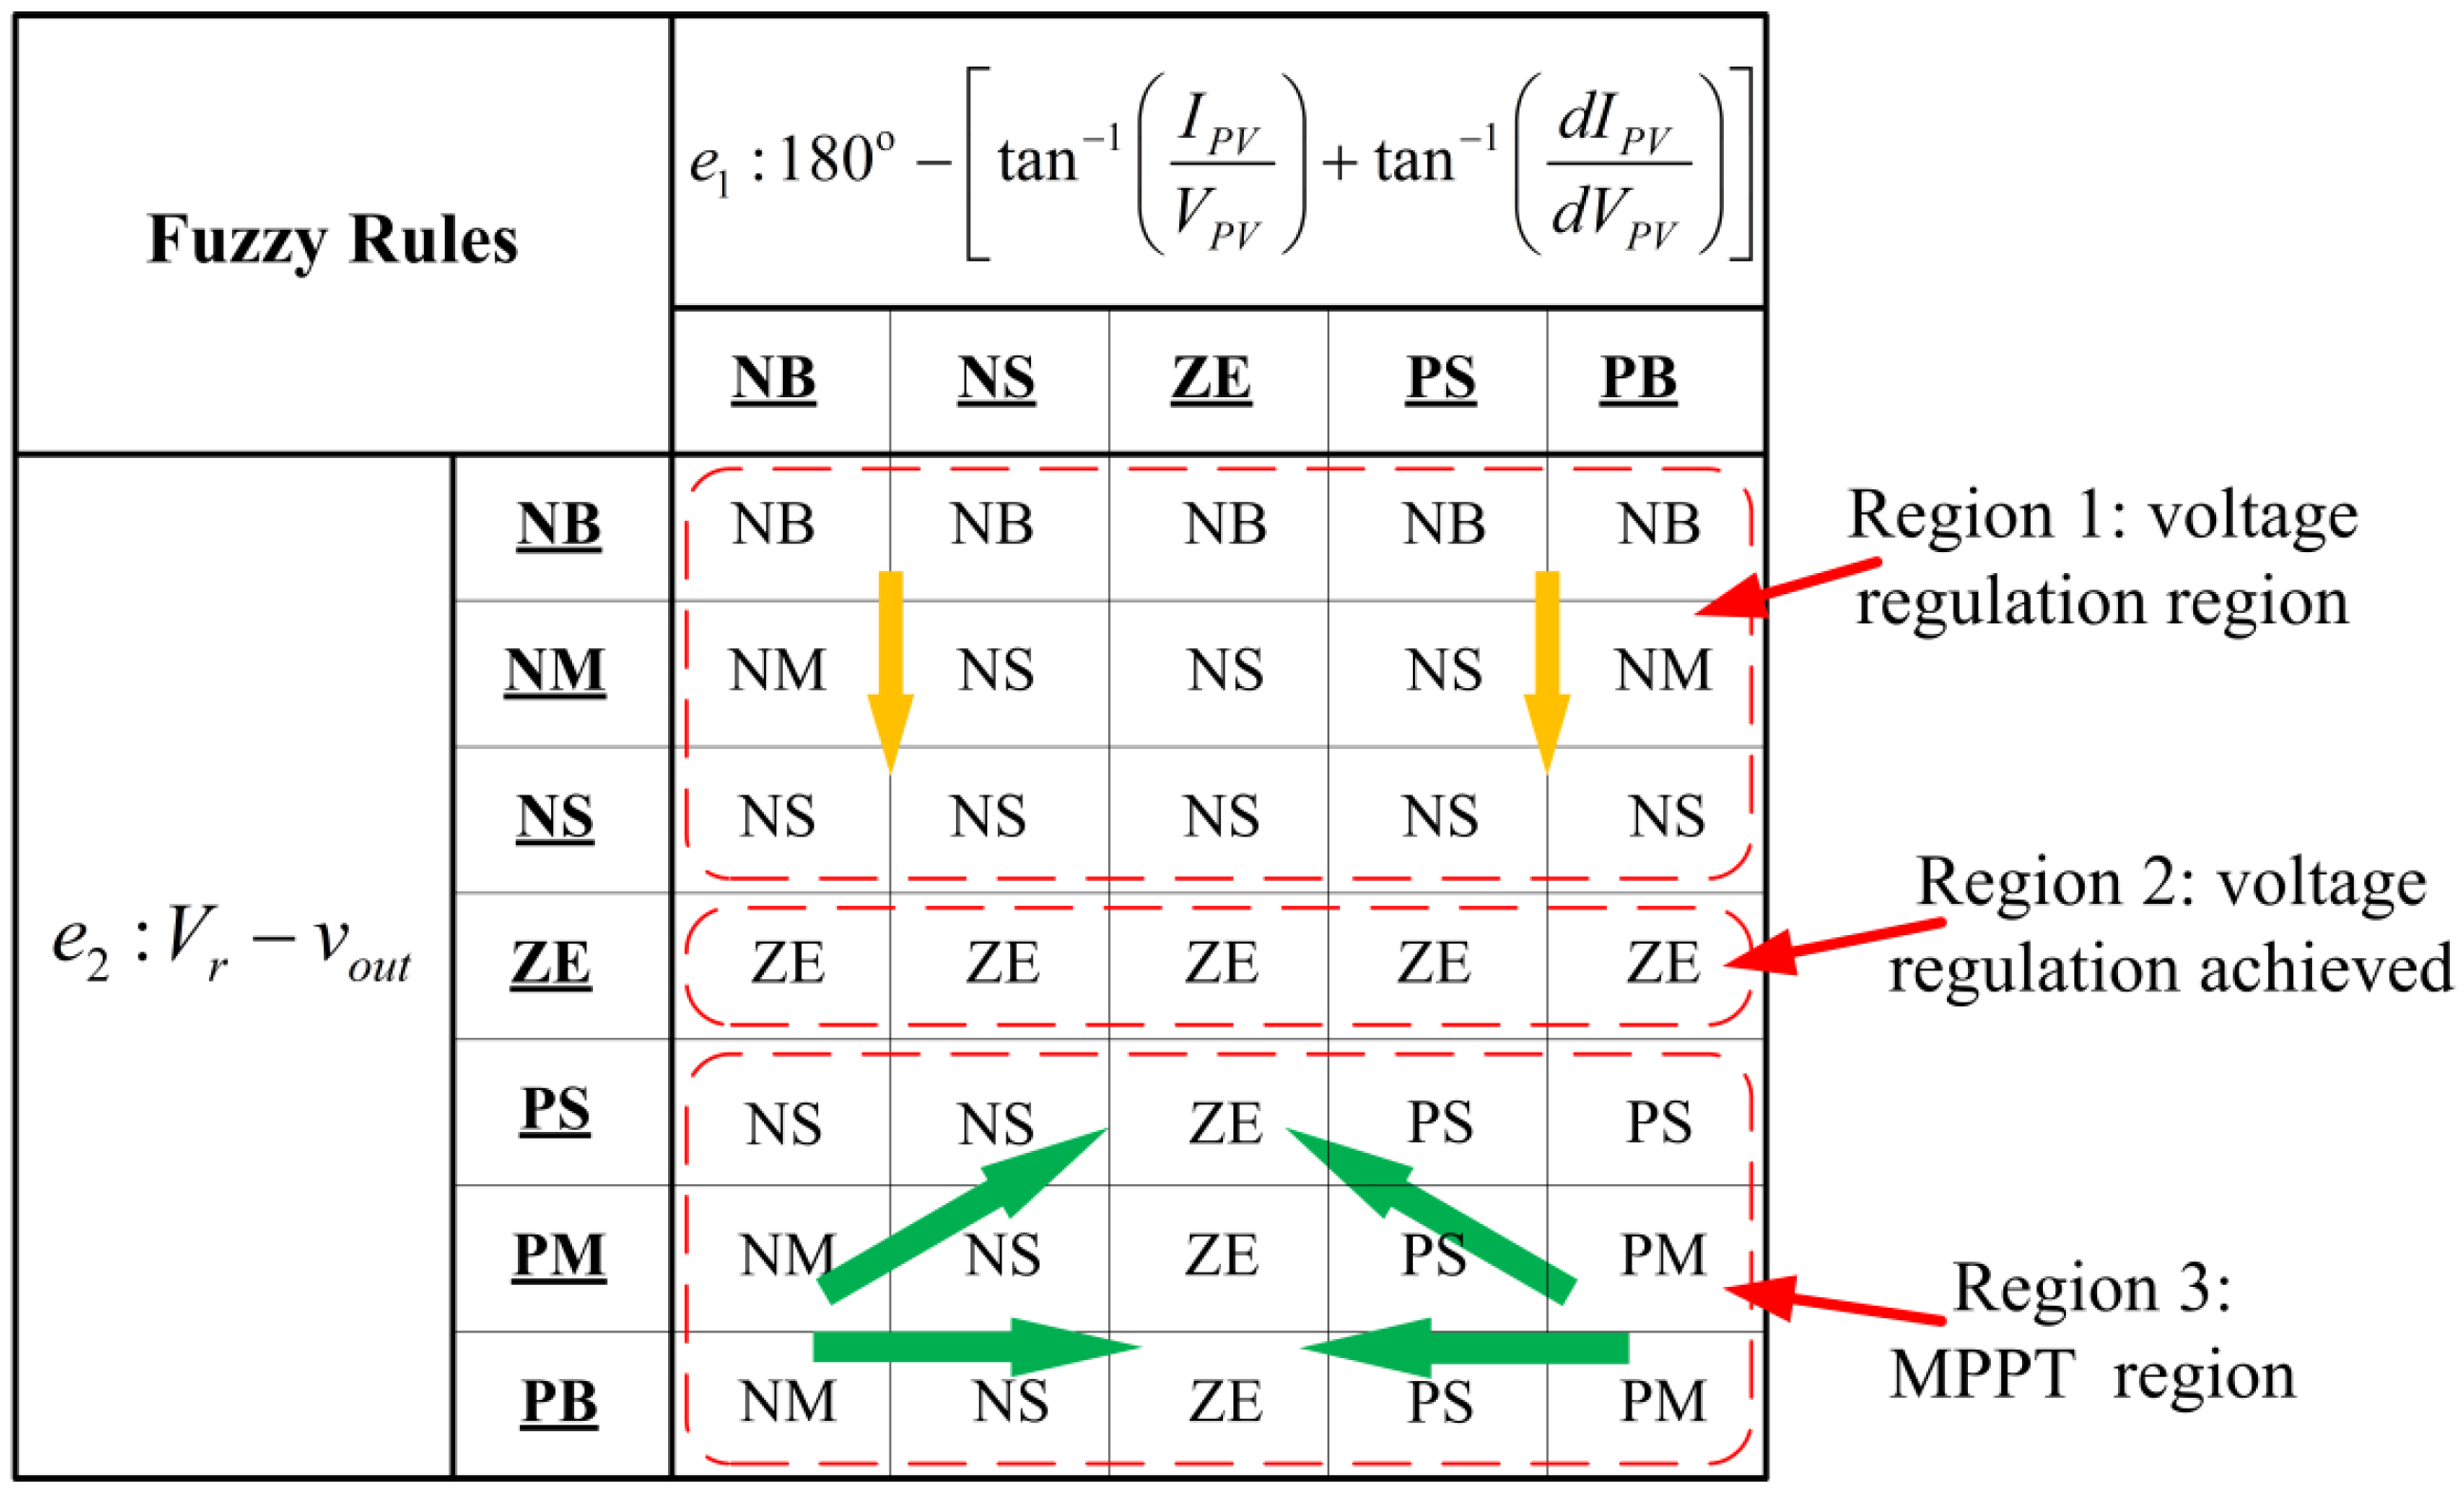
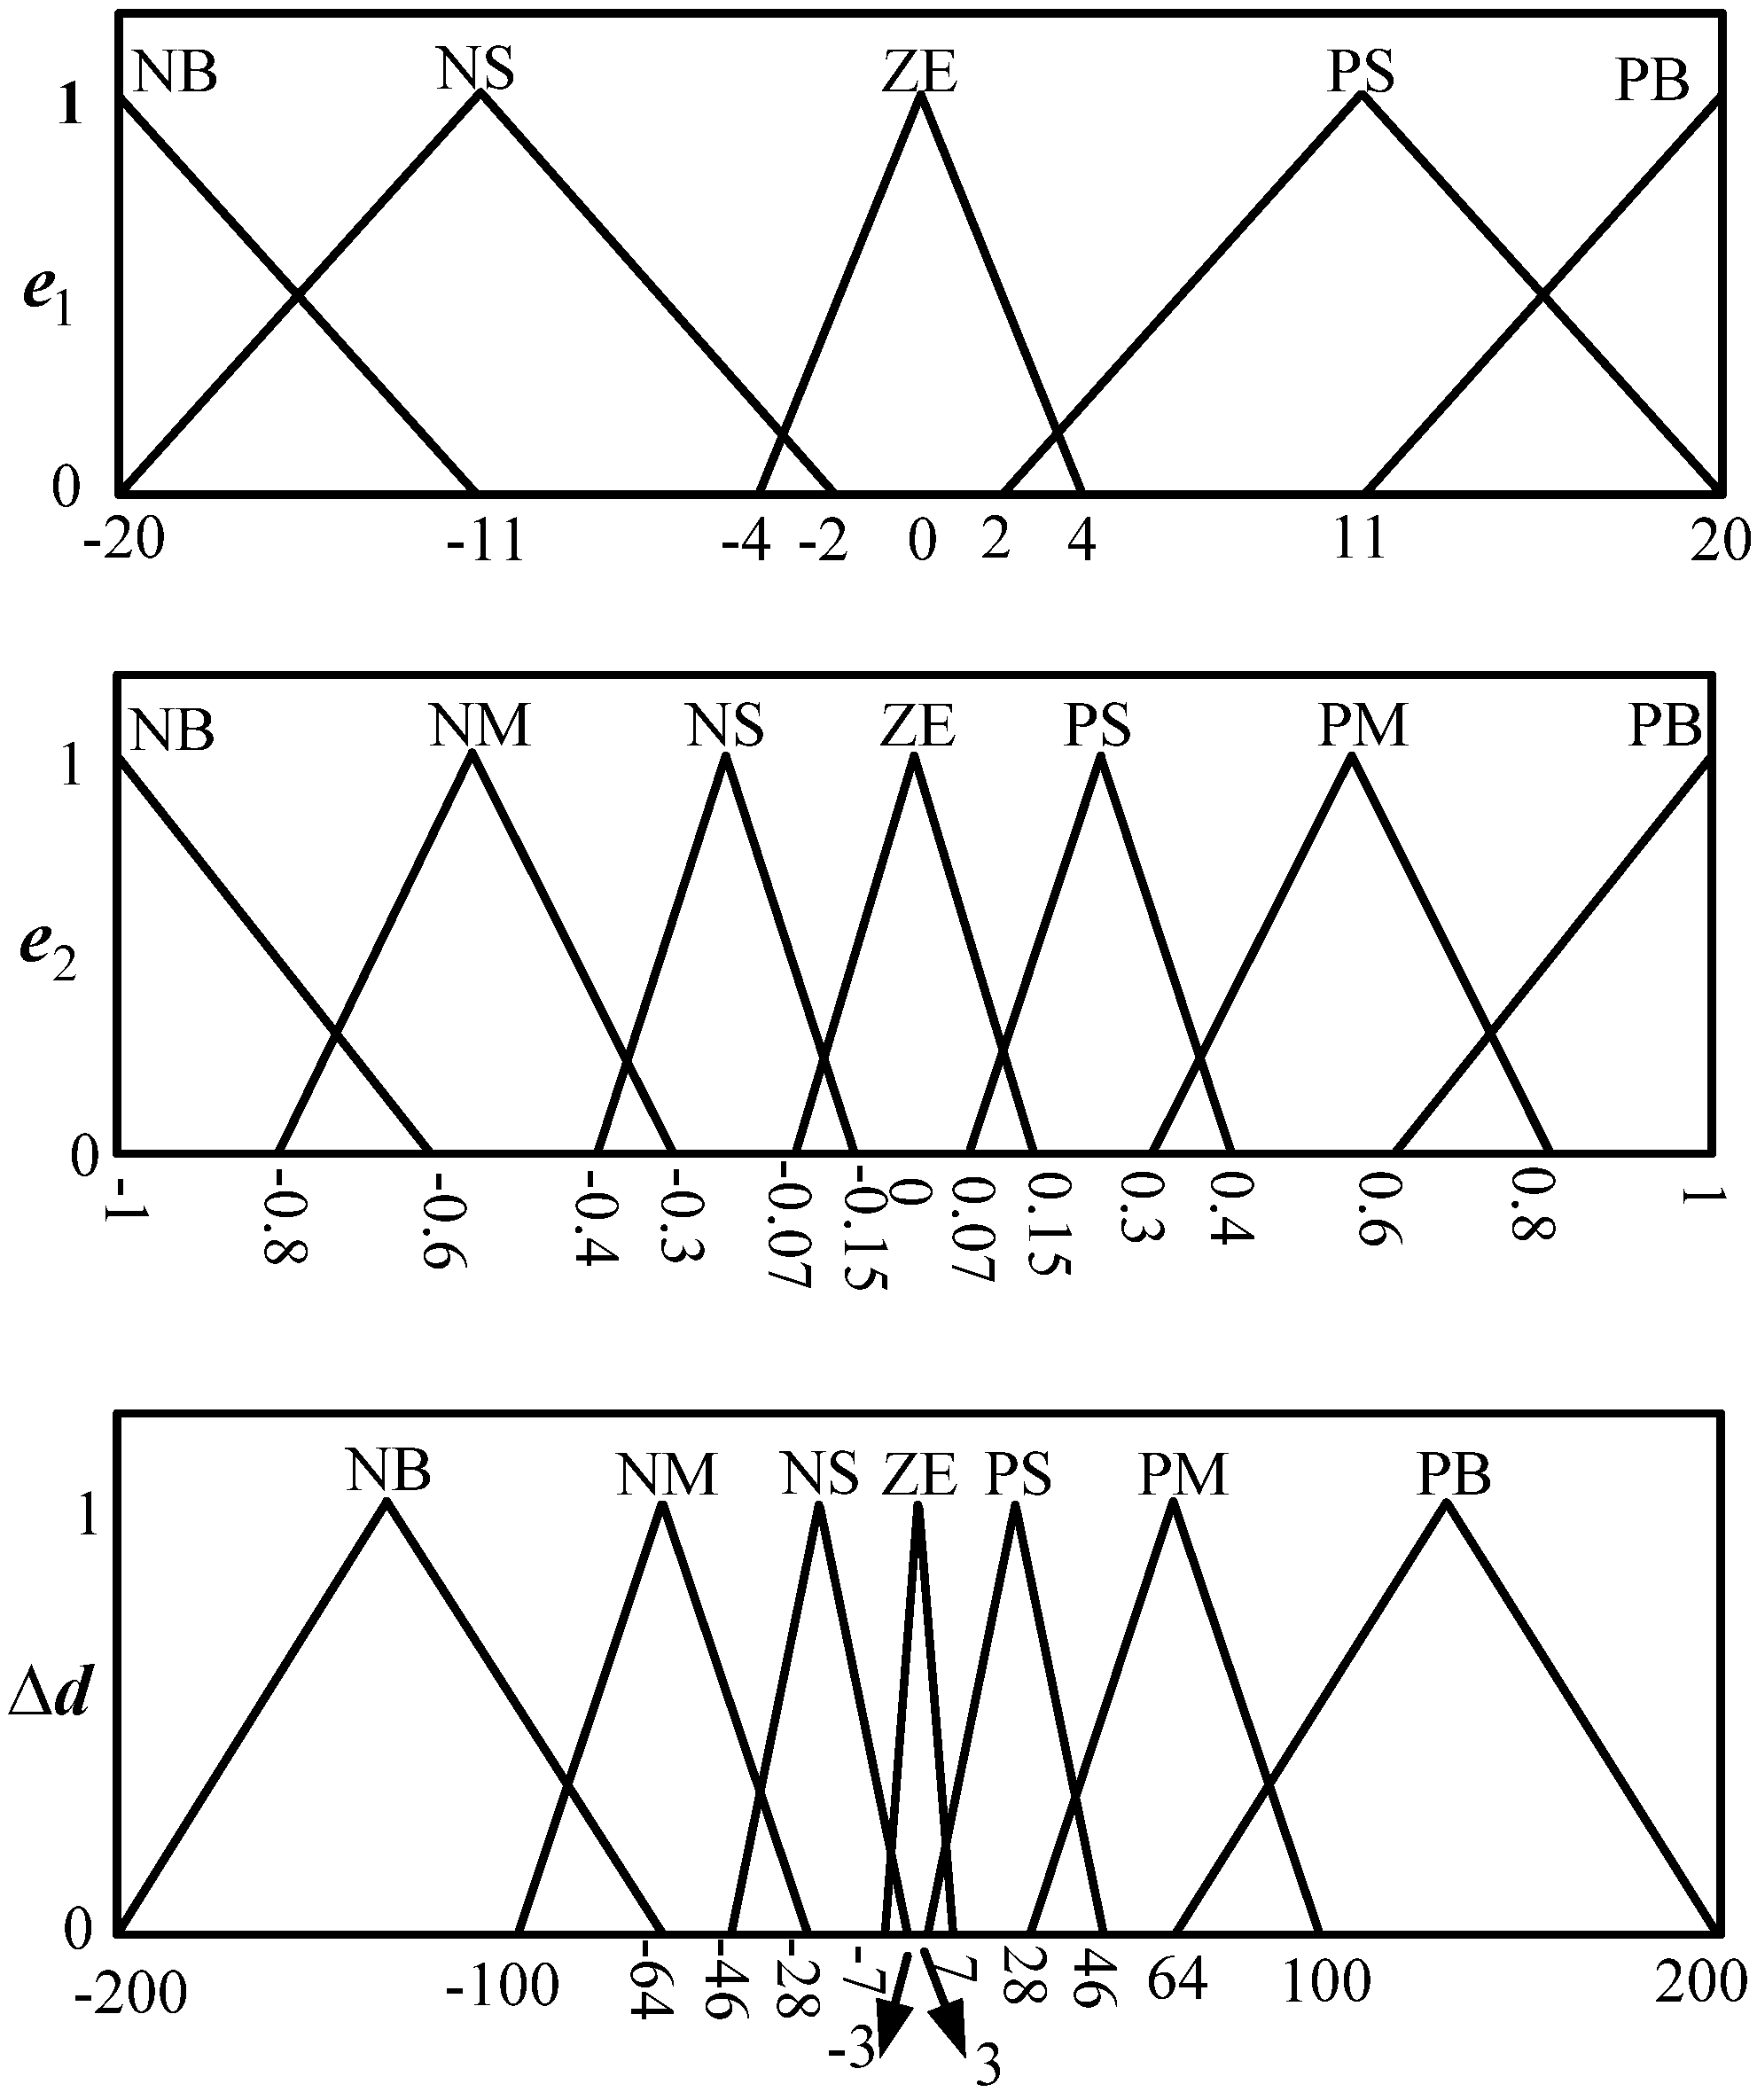
The output variable of the fuzzy controller is the increment Δd of the duty ratio command for the power switch of the buck-boost converter. The linguistic variables
e2 and Δd were described using the following seven-term fuzzy set: Positive big (PB), positive medium (PM), positive small (PS), zero (ZE), negative small (NS), negative medium (NM) and negative big (NB). The variable
e1 was described using the following five-term fuzzy set: PB, PS, ZE, NS, and NB. The fuzzy rules defined for the fuzzy computation (
Figure 7) were divided into three regions (Regions 1–3). The rules in Region 1 were mainly defined to regulate the voltage. In this region, the output voltage was higher than the desired voltage, implying that the PV system alone can supply sufficient power to the motor. Thus, the MPPT function was not critical for this condition. The rules in Region 2 were for the condition of voltage regulation being achieved. The rules for Region 3 were mainly for the MPPT operation. In Region 3, the output voltage
Vout was lower than the reference voltage
Vr. Thus, the secondary power source, the battery, started supplying current to the motor. Under this condition, the output voltage was maintained at the battery’s terminal voltage. Hence,
Vout was almost fixed. Under a constant
Vout, the output voltage from the PV system, denoted by
VPV, was adjusted by controlling the duty ratio of the power switch of the buck-boost converter.
Figure 6.
Computation flowchart of the fuzzy controller.
Figure 6.
Computation flowchart of the fuzzy controller.
Figure 7.
Fuzzy rules for the voltage-regulated MPPT system. The green and yellow arrows are the direction of state transition.
Figure 7.
Fuzzy rules for the voltage-regulated MPPT system. The green and yellow arrows are the direction of state transition.
The relationship in a steady state condition is expressed as:
Thus, the MPP can be reached through appropriate control of the duty ratio.
Figure 8a shows the PV power-voltage relation along with the relation of Equation (11). When
Vout was fixed (the green-line in
Figure 8a), increasing the duty ratio caused a decrease in
VPV, and
vice versa. MPP was determined by examining the MPP condition established in Equation (7).
Figure 8b shows the relationship between the PV current–voltage and MPP condition. Therefore, we continuously controlled the PV voltage by adjusting the duty ratio and examining the MPP condition to ensure that the PV system supplied maximum power to the system as necessary.
Figure 8.
PV characteristics and MPP condition. (a) PV power-voltage curve (blue) and duty ratio versus PV voltage for fixed a fixed output voltage (green); and (b) PV current-voltage curve (blue) and MPP condition using angle information. The black dashed line is the I–V characteristic of the resistive load.
Figure 9 shows the membership functions for the input and output variables. The most commonly used fuzzy inference systems are Mamdani and Sugeno procedures [
30]. The main difference is the way the crisp output is computed. The Sugeno method uses weighted average to generate the crisp output. It is computationally efficient and works well with optimization and adaptive techniques. On the other hand, Mamdani method uses defuzzification procedure to obtain the crisp output. Mamdani procedure is widely accepted for capturing expert knowledge. It allows us to describe the expertise in more intuitive, more human-like manner [
31]. Thus, Mamdani fuzzy inference is selected for this study. The common forms of the composition operation are maximum of minimum composition and maximum of product composition. Max-min composition is computationally simpler. This method of composition effectively expresses the approximate and interpolative reasoning used by humans when they employ linguistic propositions for deductive reasoning [
30]. Most commonly used techniques for defuzzifying fuzzy output function are center of gravity and weighted average method. The weighted average method is more computationally efficient. However, it is usually restricted to symmetrical output membership functions. The center of gravity method is the most prevalent and physically appealing of all the defuzzification methods [
30]. Therefore, the maximum of minimum composition technique was used for the inference, and the center of gravity was selected for the defuzzification process in this study.
The fuzzy controller presented here was employed to control the dc motor velocity by using the described solar and battery hybrid-power system. The details of the simulation and results are presented in the following section.
Figure 9.
Membership function for the voltage-regulated MPPT system.
Figure 9.
Membership function for the voltage-regulated MPPT system.
5. Simulation Model
A dc motor velocity control scheme powered by solar and battery hybrid system was formulated based on the described fuzzy controller.
Figure 10 shows a block diagram of the hybrid powered motor control system. The system contains a PV system and battery as the primary and secondary power sources, respectively, and a dc motor velocity control system. The two power sources were diode ORed to supply power to the motor control. The goal was to have the PV system supply maximum power while using the battery as a back-up power source. The PV system included a PV panel, buck-boost converter, and fuzzy logic controller to regulate the voltage and perform the MPPT functions. The secondary power source contains an ideal voltage source
VS2 with a series output resistance
rS2 (
Figure 10).
Using the PV model described in
Section 3 and the proposed fuzzy controller, a simulation model for the hybrid solar-powered motor control system was developed (
Figure 11). The top-level block diagram of the simulation model (
Figure 11a) mainly contains the PV model, fuzzy controller, PLECS circuit model for the buck-boost converter, secondary power source, and motor control system. The PLECS circuit simulation model is delineated in
Figure 11b.
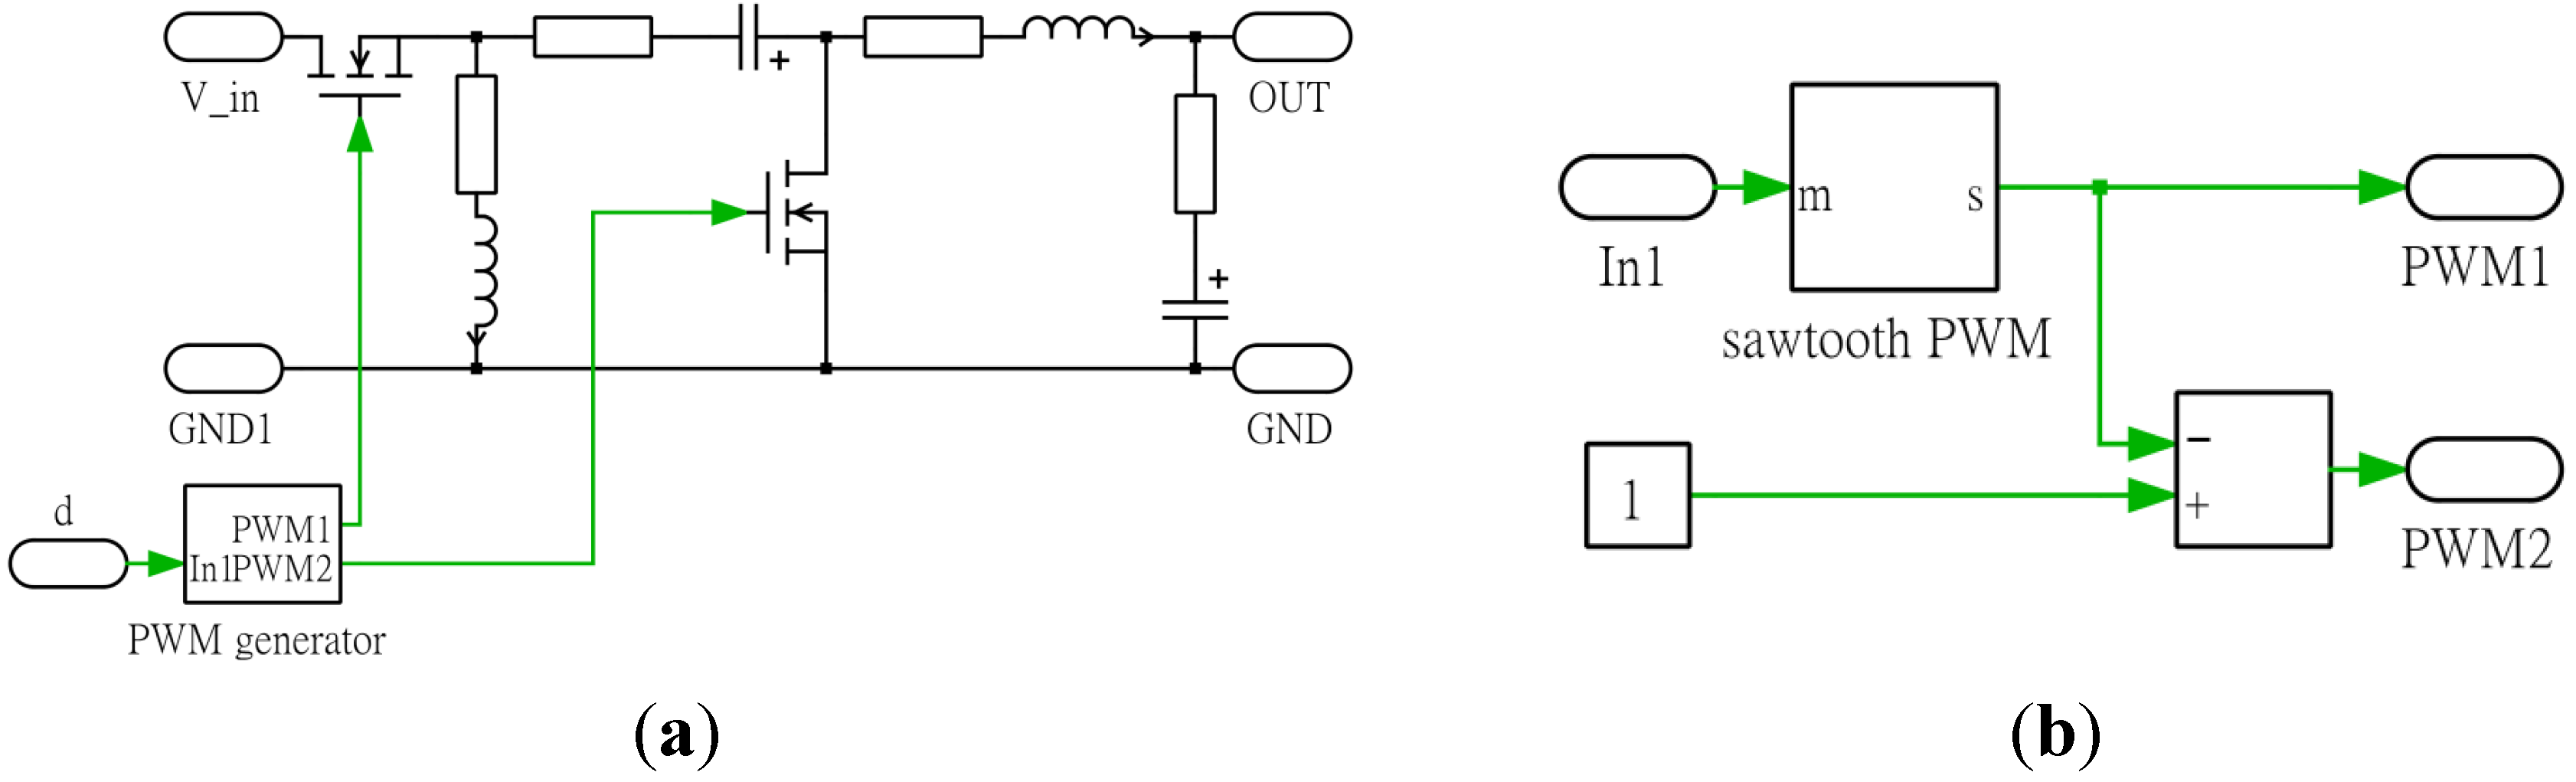
Figure 12 and
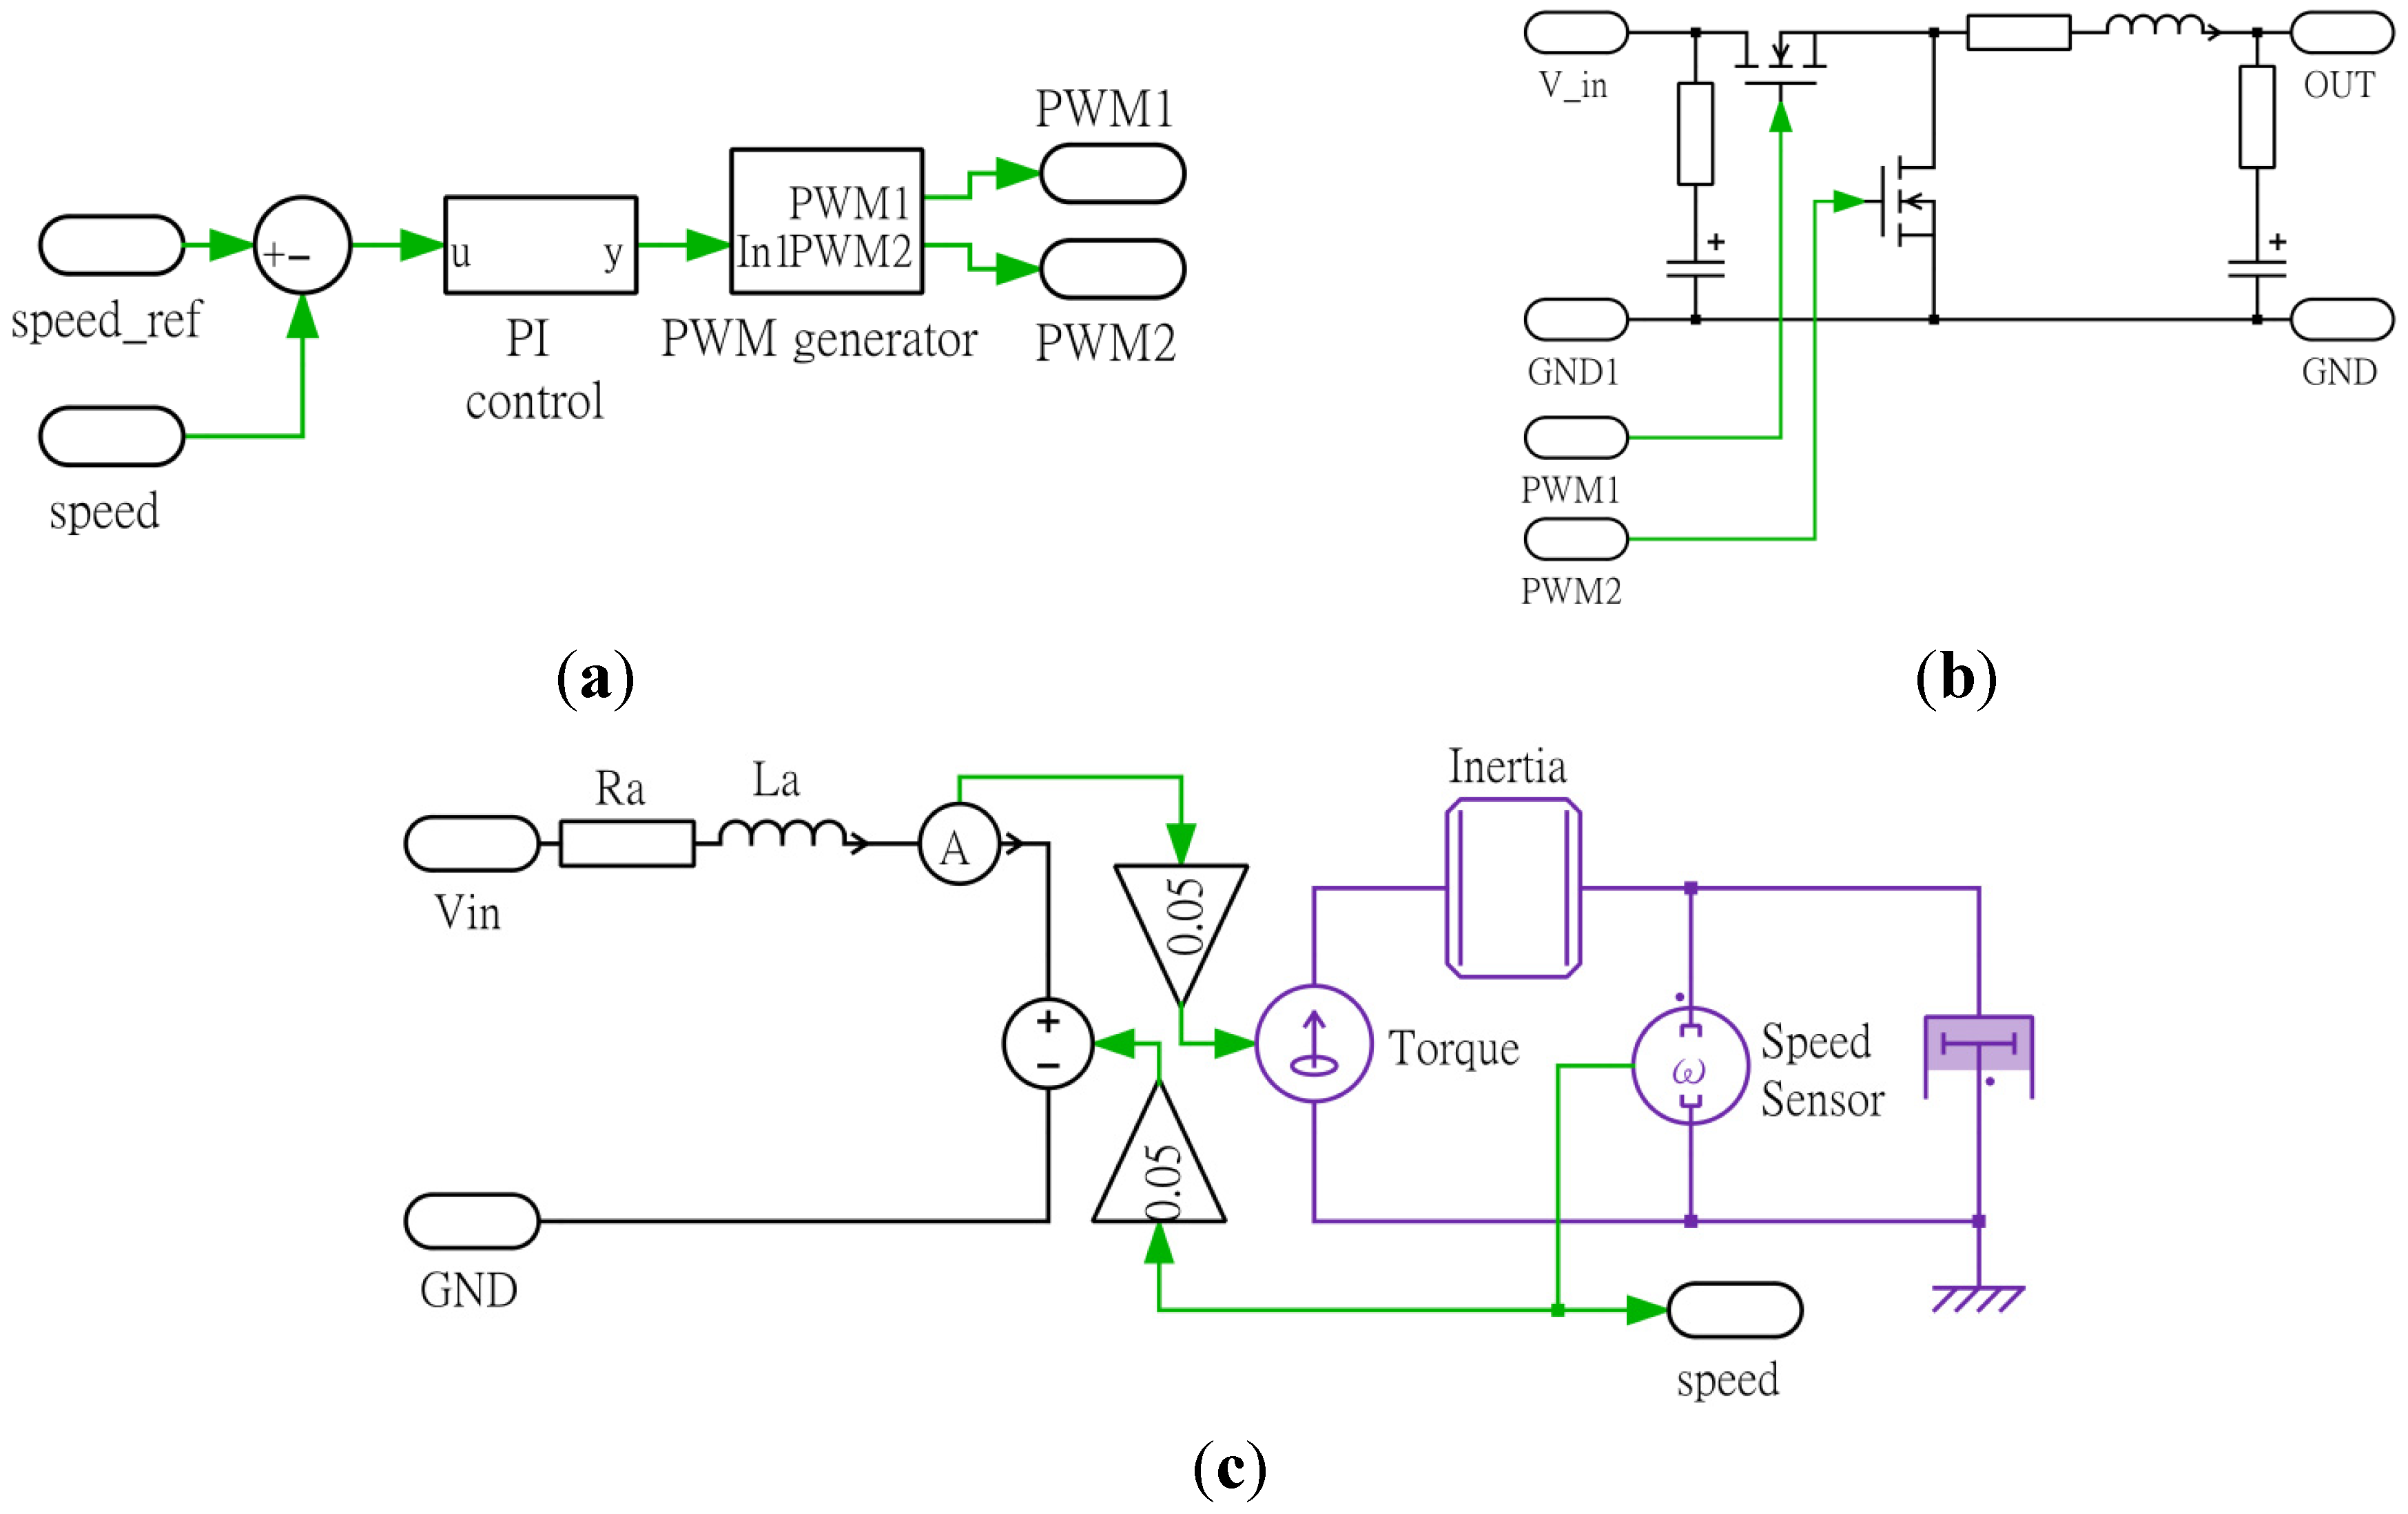
Figure 13 respectively show the details of the circuit model for the buck-boost converter and motor control system. The motor control system comprises a simulation model of the dc motor, PI controller, and buck power converter for power amplification.
Figure 10.
Block diagram of the hybrid powered motor control system.
Figure 10.
Block diagram of the hybrid powered motor control system.
Figure 11.
Simulation model of the hybrid powered motor control system. (a) Top level functions of the simulation model; and (b) Piecewise linear electric circuit simulation (PLECS) circuit simulation model.
Figure 11.
Simulation model of the hybrid powered motor control system. (a) Top level functions of the simulation model; and (b) Piecewise linear electric circuit simulation (PLECS) circuit simulation model.
The governing equations of the DC motor are:
where
ea is the applied voltage;
ia is the armature current;
Ra is the armature resistance;
La is the armature inductance;
ea is the back electromotive force (emf);
Tm is the motor torque;
ki is the torque constant;
kb is the back emf constant;
θm is the rotor displacement;
ωm is rotor angular velocity;
J is moment of inertia of the motor rotor with attached mechanical load;
B is the viscous-friction coefficient of motor rotor with attached mechanical load.
In this simulation, the PV model was operated in the voltage-to-current mode. In other words, the PV voltage
VPV was fed back to the PV model to compute the PV current
IPV, which was then supplied to the buck-boost converter. The induced voltage at the input terminal of the buck-boost converter was returned to the PV model to compute the PV current for subsequent iterations. To achieve the design goal, the fuzzy controller obtained the PV voltage and current from the PV model and determined the duty ratio command for controlling the power switch of the buck-boost converter.
Figure 14 shows a simulation block diagram of the fuzzy controller. The proposed fuzzy controller described in
Section 4 was implemented in this simulation.
Figure 15 details the generation of the fuzzy input variables.
Figure 12.
Circuit model for a buck-boost converter. (a) Buck-boost converter; (b) PWM generator. The green arrows are the control signals.
Figure 12.
Circuit model for a buck-boost converter. (a) Buck-boost converter; (b) PWM generator. The green arrows are the control signals.
Figure 13.
Circuit simulation model for the motor control system. (a) Motor control; (b) Buck converter; and (c) DC motor. The green arrows are the control signals.
Figure 13.
Circuit simulation model for the motor control system. (a) Motor control; (b) Buck converter; and (c) DC motor. The green arrows are the control signals.
Figure 14.
Simulation model of the fuzzy controller.
Figure 14.
Simulation model of the fuzzy controller.
Figure 15.
Preprocessing of the fuzzy input variable.
Figure 15.
Preprocessing of the fuzzy input variable.
6. Computer Simulation and Results
Based on the proposed fuzzy controller and the simulation model presented in
Section 4 and
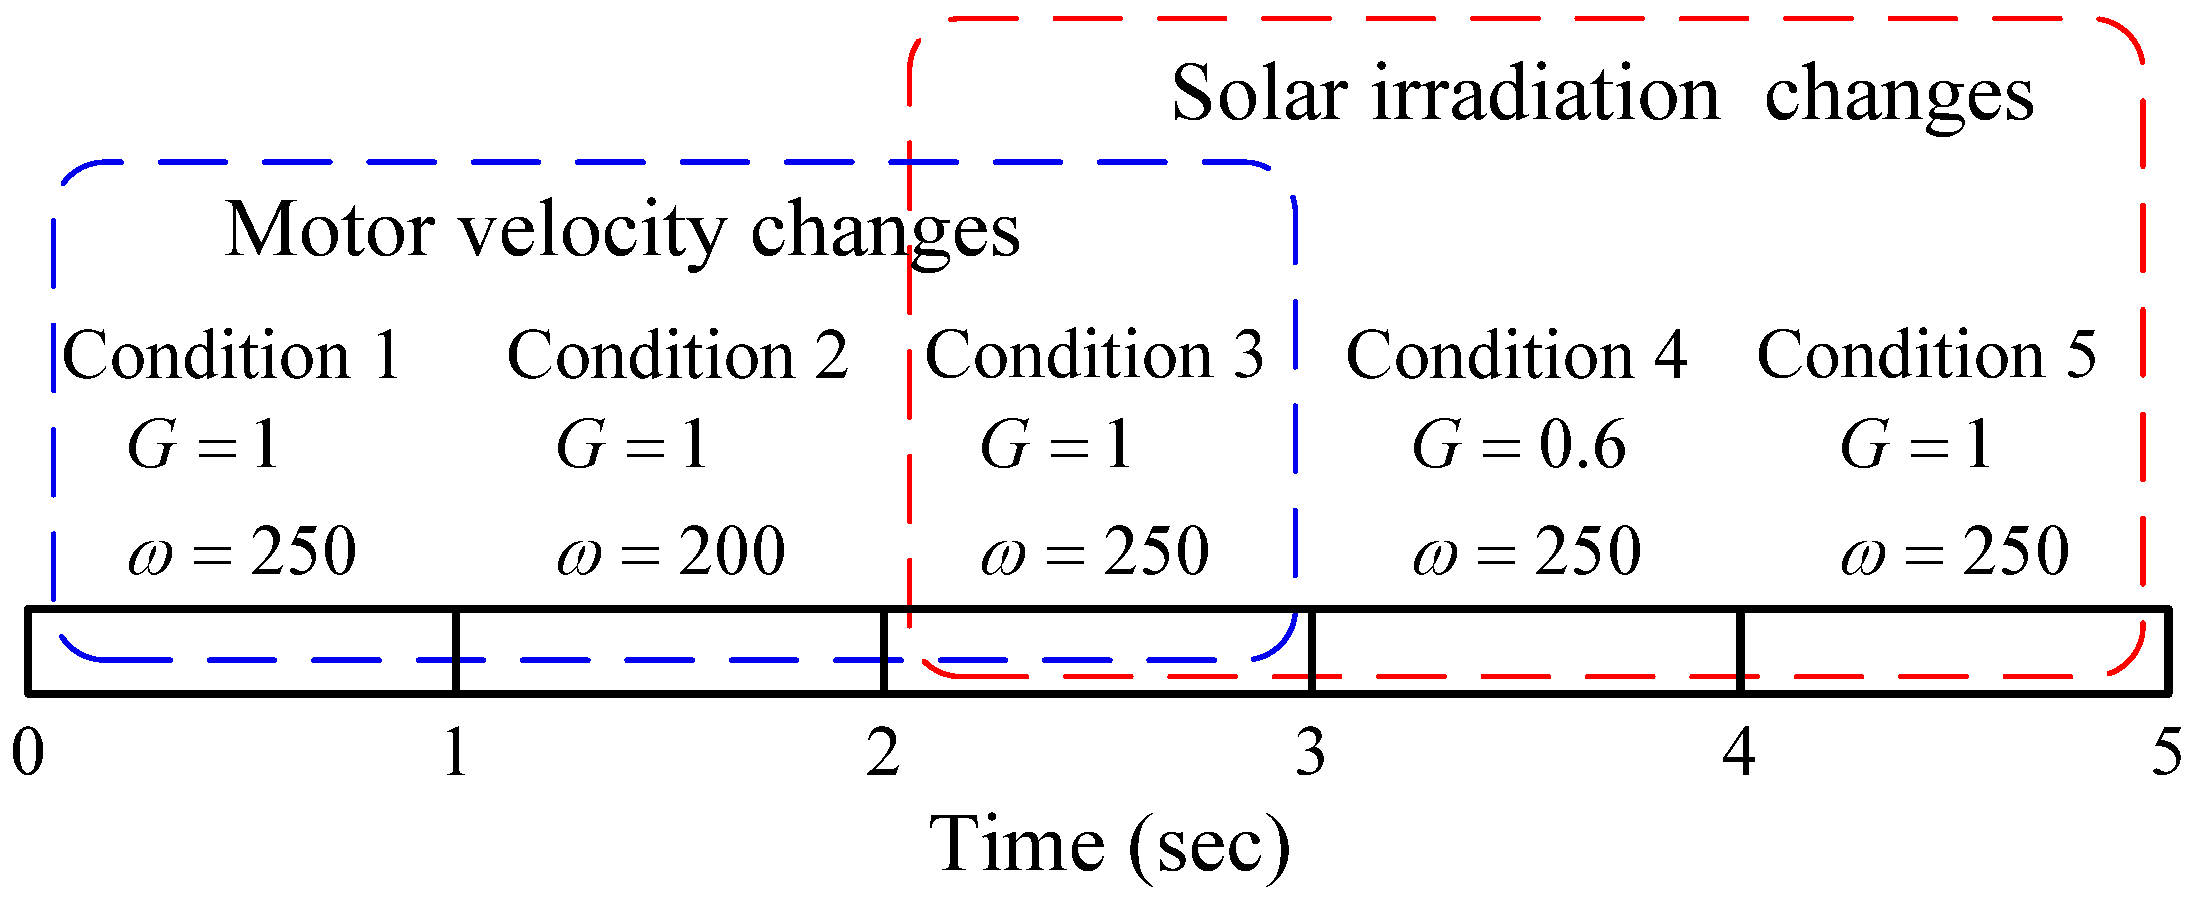
Section 5, three cases were selected to demonstrate the design results. In Case 1, we set the regulated voltage to
and the battery voltage to 23.76 V (assuming six Li-ion battery cells in a series with a terminal voltage of 3.96 V for each battery). The solar irradiation conditions and motor velocity were subjected to changes according to the sequence (
Figure 16). The total duration of the simulation was 5 s. The test conditions were designated as Conditions 1–5, with each condition lasting for 1 s. In the first 3 s (
i.e., Conditions 1–3), the solar irradiation was fixed to
, the motor velocity was controlled to start from
for 1 s, adjusted to
for a further 1 s, and then adjusted back to
. During the final 3 s (
i.e., Conditions 3–5), the motor velocity was fixed at 250 rad/s and the solar irradiation level was adjusted from
to
, and then back to
. In Case 2, the regulated voltage was set to
and the battery voltage was set to 15.84 V (four cells in series). The test conditions for the solar irradiation and motor velocity were the same as for Case 1. In Case 3, two motors powered by the hybrid power system were operated at different speeds (
and
). The test duration for this case was 3 s. The solar irradiation level was adjusted from
to
, and then back to
. For this simulation, the parameters used for the buck-boost converter were
, input and output capacitors
, and coupling capacitor
. The parameters of the buck converter for the motor control were
and
.
Table 1 shows the parameters of the dc motor. The parameters of the PI controller for DC motor velocity control are
and
. For the simulations, the update rate of the fuzzy controller was set to 100 Hz.
Figure 16.
Solar radiation and motor velocity conditions for simulation.
Figure 16.
Solar radiation and motor velocity conditions for simulation.
Table 1.
Motor parameters.
Table 1.
Motor parameters.
| Parameters | Value | Unit |
|---|
| Armature resistance (Ra) | 0.3 | Ω |
| Armature inductance (La) | 0.006 | H |
| Electromotive force constant | 0.05 | V/rad/s |
| Motor torque constant | 0.05 | Nm/A |
| Moment of inertia of the rotor | 4 × 10⁻⁵ | Kgm2 |
| Motor viscous friction constant | 0.001 | Nms |
Regarding the simulation results,
Figure 17 shows the voltage, current, and power output from the PV system,
Figure 18 shows the voltage, current, and power from the output of the buck-boost converter,
Figure 19 shows the battery outputs, and
Figure 20 shows the motor power and velocity. For Condition 1, the solar irradiation was
G = 1 and the desired motor speed was 250 rad/s, and the maximum power of the PV system was 61.77 W. However, because the power required for the motor to maintain 250 rad/s was 71.91 W, the PV system had insufficient power for the motor. Thus, the battery must be engaged to compensate for this insufficiency.
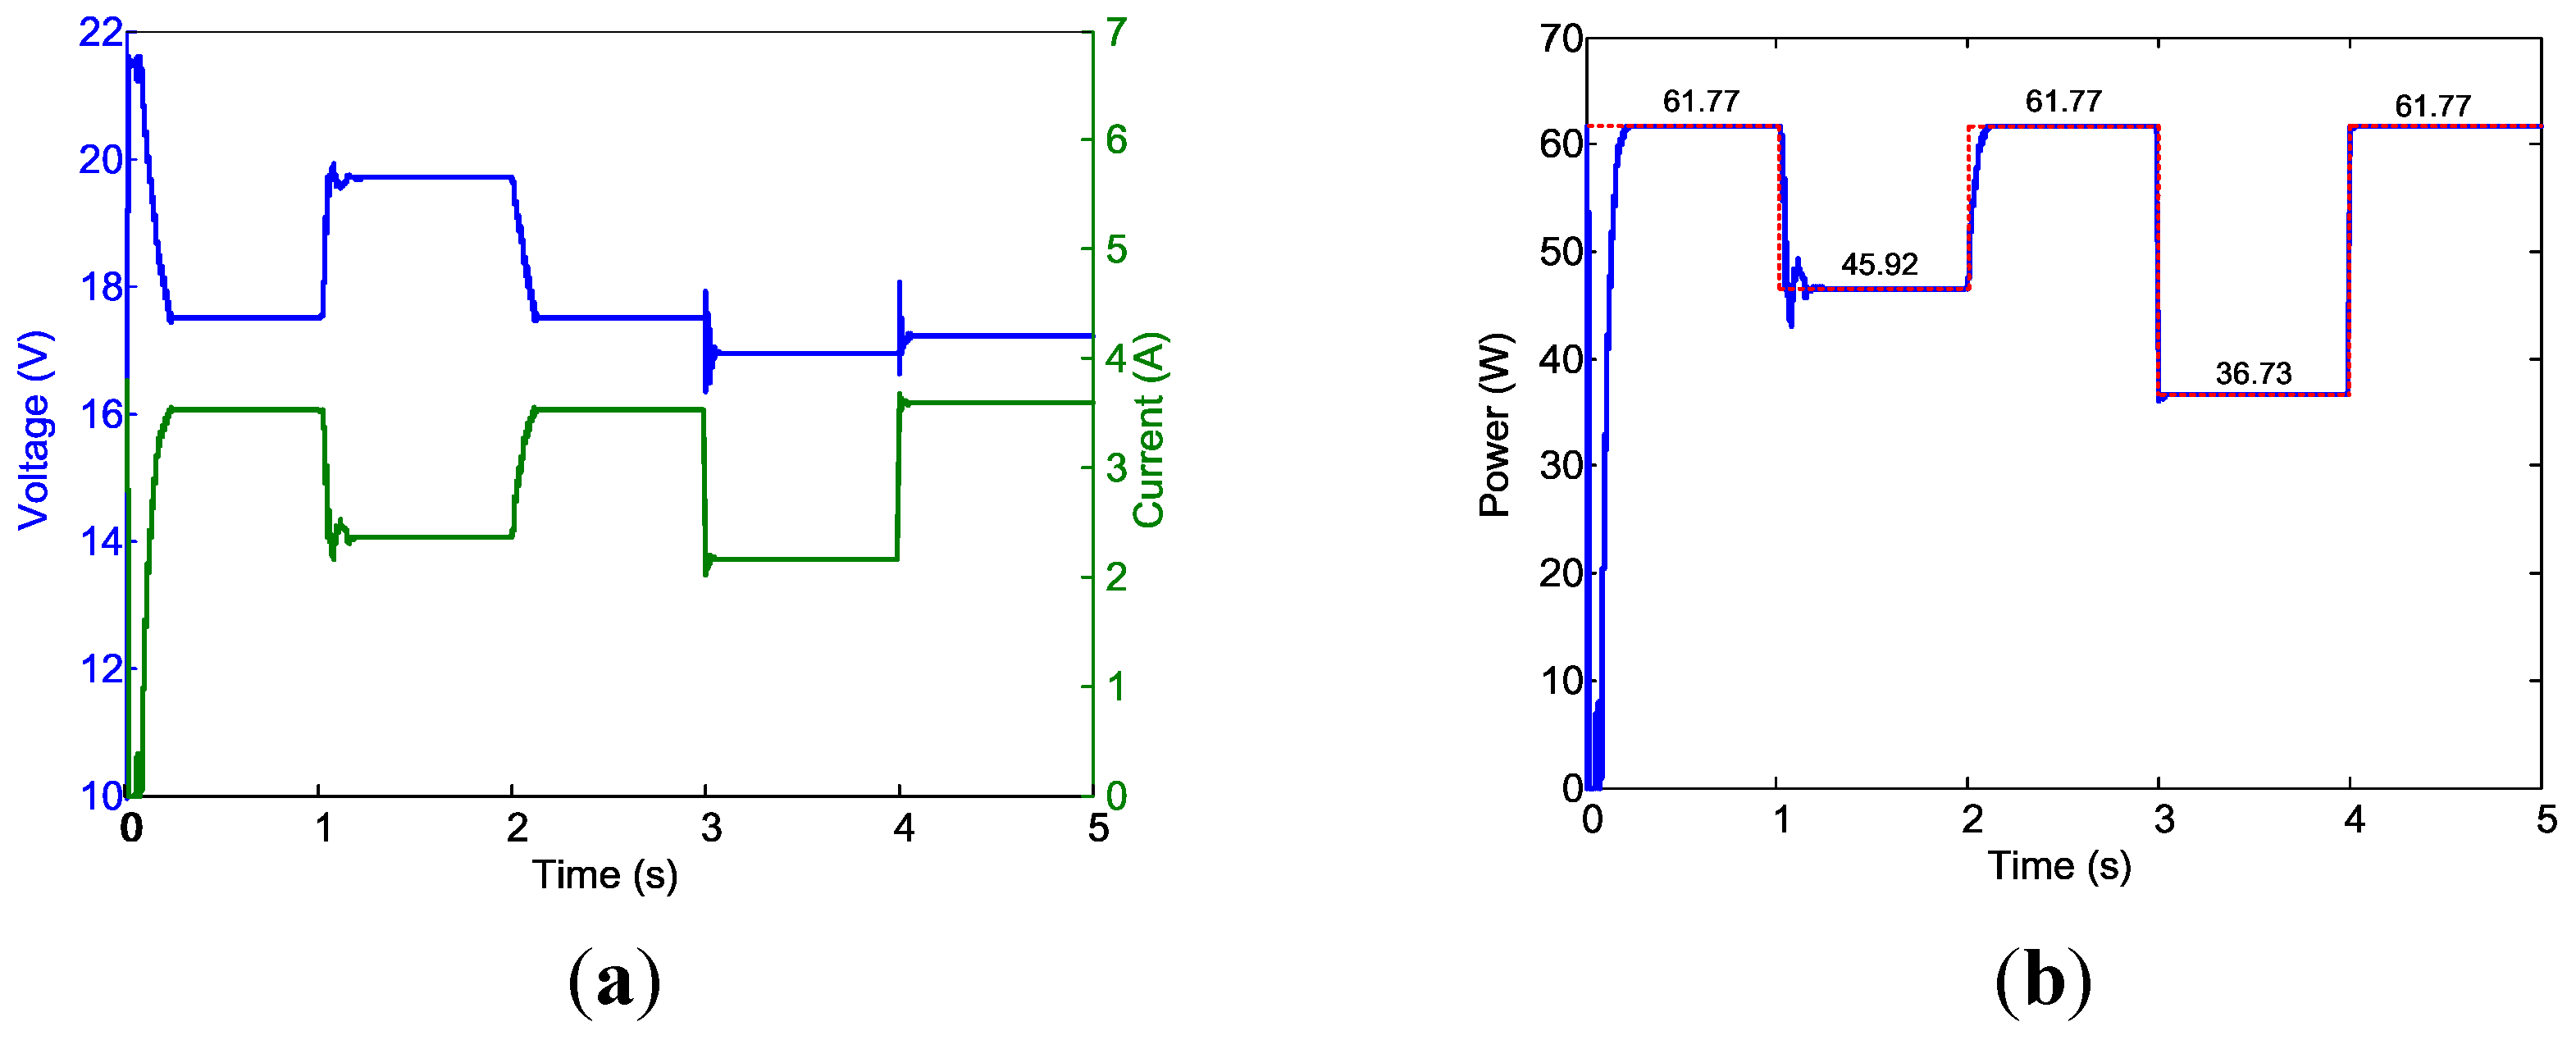
Figure 17.
PV system outputs for Case 1. (a) PV voltage and PV current; and (b) PV power output. Dotted line (red) is the ideal PV output power.
Figure 17.
PV system outputs for Case 1. (a) PV voltage and PV current; and (b) PV power output. Dotted line (red) is the ideal PV output power.
Figure 18.
Buck-boost converter outputs for Case 1. (a) Buck-boost converter output voltage and current; and (b) Buck-boost converter output power.
Figure 18.
Buck-boost converter outputs for Case 1. (a) Buck-boost converter output voltage and current; and (b) Buck-boost converter output power.
Figure 19.
Battery output for Case 1. (a) Battery output voltage and current; and (b) Battery output power.
Figure 19.
Battery output for Case 1. (a) Battery output voltage and current; and (b) Battery output power.
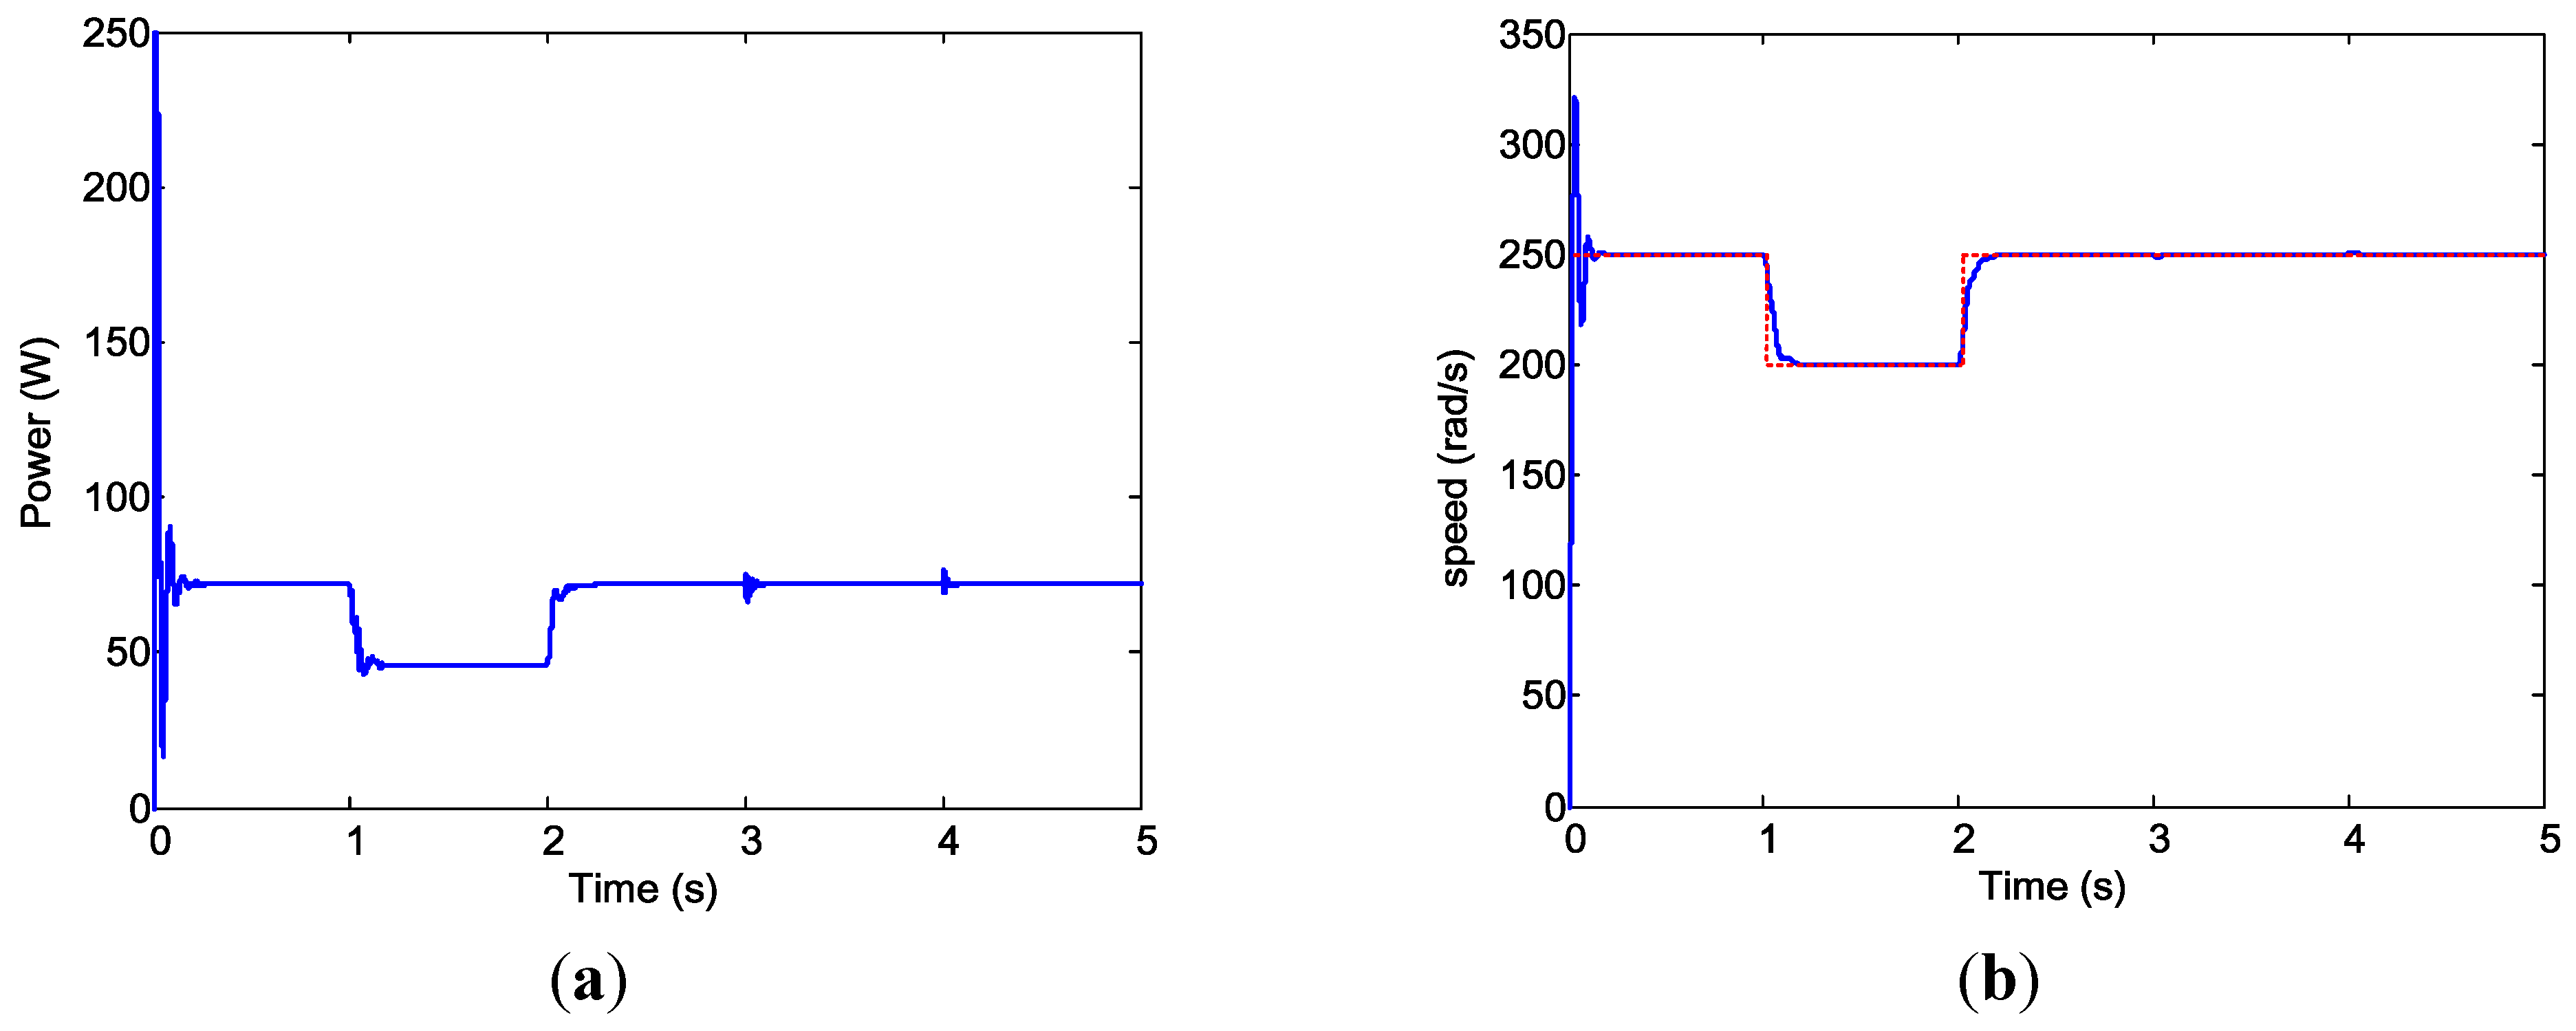
Figure 20.
Motor input power and speed for Case 1. (a) Motor input power; and (b) Motor speed. Dotted line (red) is the motor command.
Figure 20.
Motor input power and speed for Case 1. (a) Motor input power; and (b) Motor speed. Dotted line (red) is the motor command.
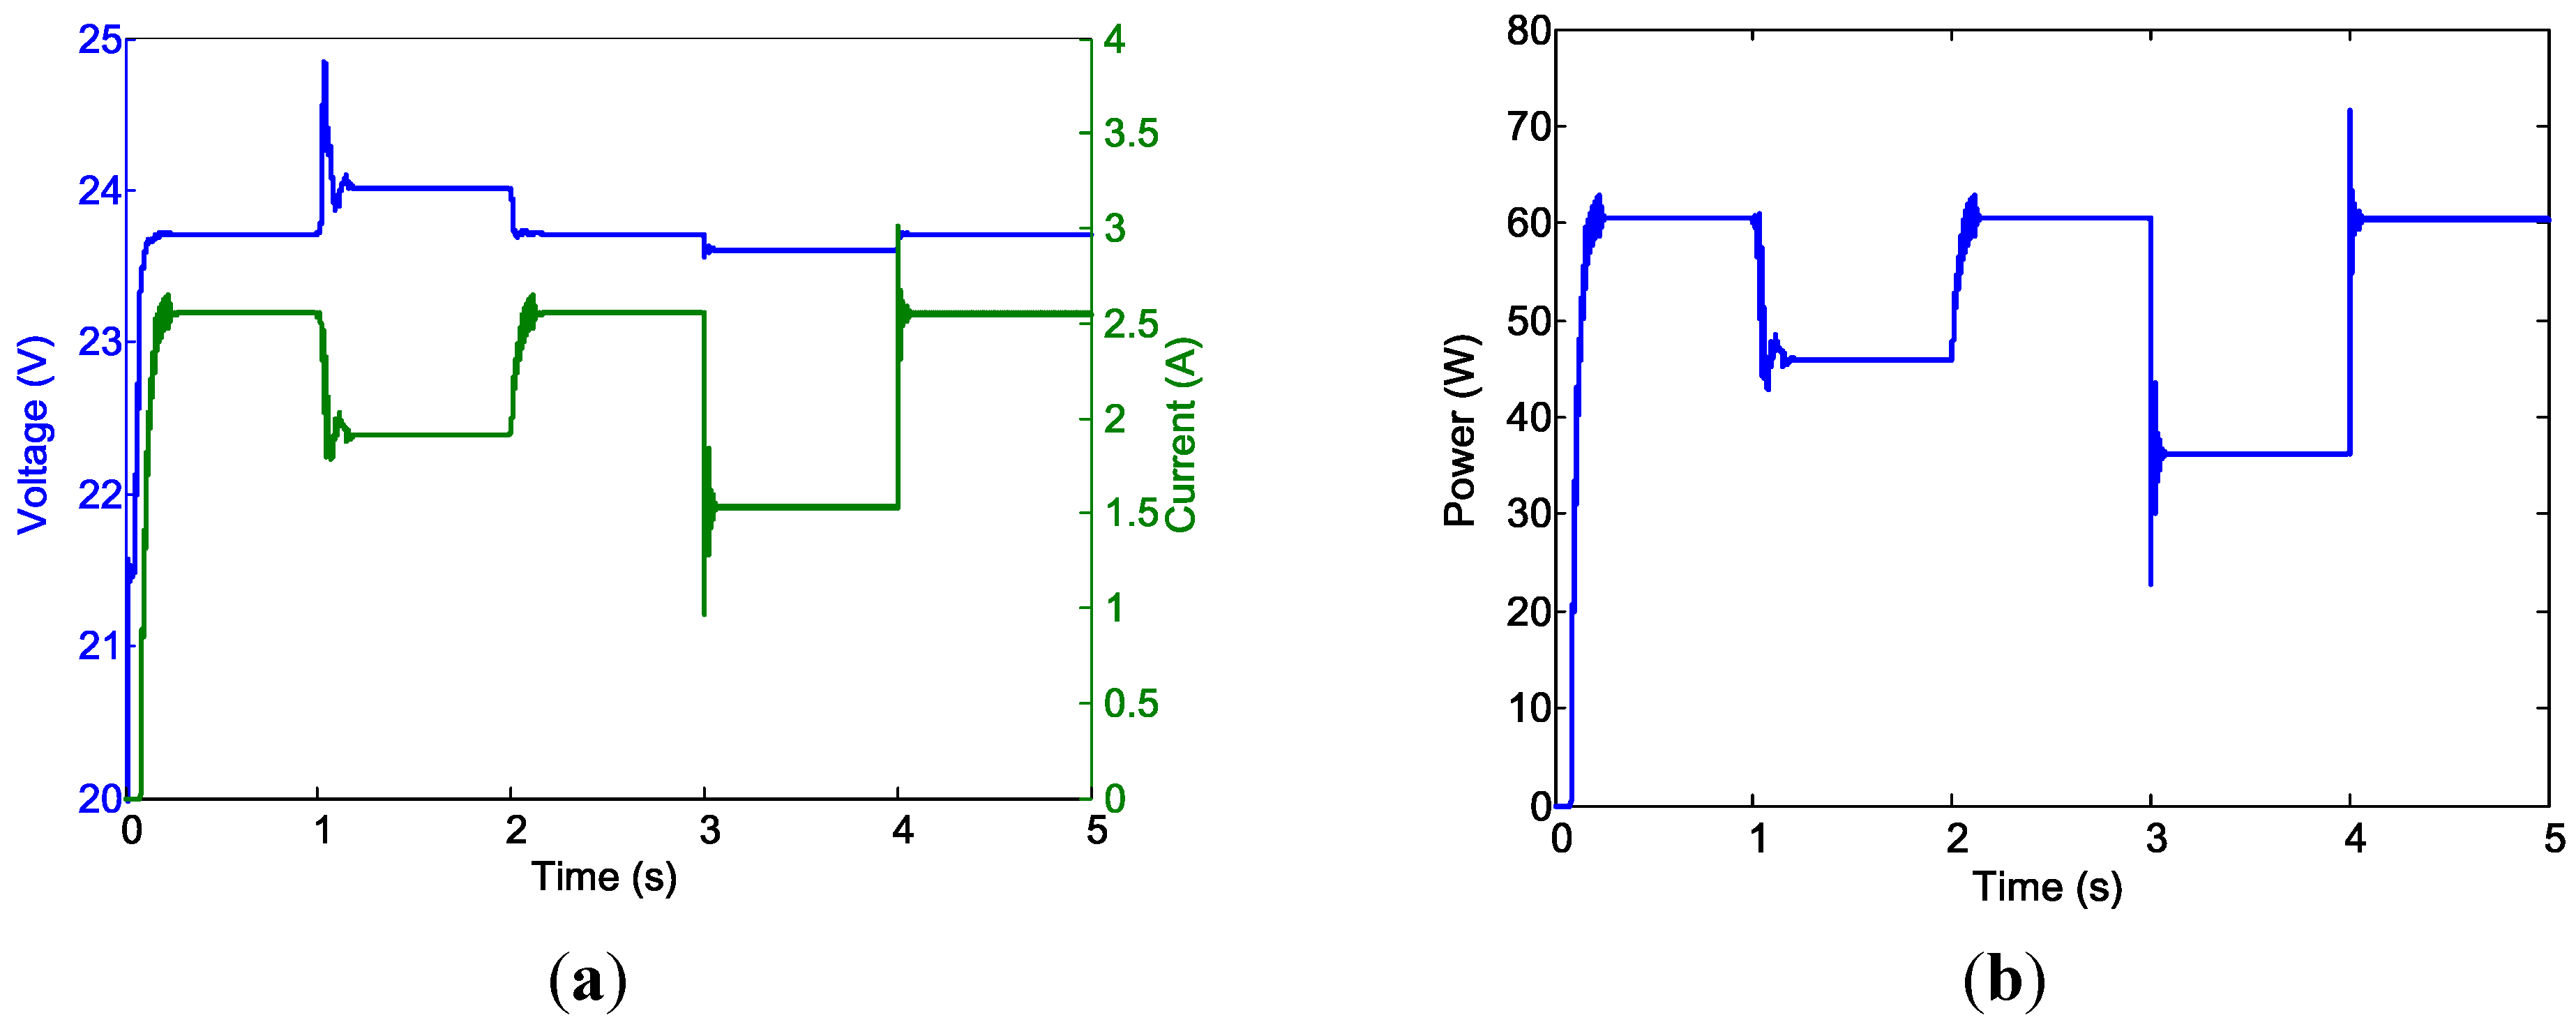
As indicated in
Figure 17b, after the power-up transient phase, the PV panel outputs 61.75 W steadily, as anticipated. The power output from the buck-boost converter was 60.5 W (
Figure 18b). A 2.02% power loss in the buck-boost converter was caused by the internal resistance modeled for the inductors and capacitors. Because the PV system alone cannot supply sufficient power, it would be unable to maintain the converter output voltage of 24 V. When the battery was added to the system, the output voltage of the buck-boost converter was in agreement with the output voltage of the battery, which was slightly less than the battery source voltage (23.76 V) because of the voltage drop of the modeled internal resistance (
in this simulation).
Figure 19b shows that following the motor’s power-up transient phase, the battery supplied a steady 11.41 W to the motor to compensate for the aforementioned insufficiency. The voltage from the battery and buck-boost converter achieved equilibrium at 23.71 V.
Figure 20b shows that the motor speed was regulated at
after the short transient phase. For Condition 2, the required motor speed was reduced to
, requiring only 45.91 W for proper operation. This indicated that the PV system alone supplied sufficient power for the motor, and thus did not require the MPP condition; thus, no power was drawn from the battery to operate the motor.
Figure 19 confirms this situation. The output voltage of the power converter was regulated at 24 V (
Figure 18a). In the transient instant at
t = 1 (
i.e., the moment where the motor speed was adjusted from
to
), a voltage peak appeared at the buck-boost converter output (
Figure 18a). The occurred because the power required for the motor was reduced, resulting in the PV operating point moving away from its MPP and increasing the PV output voltage. The buck-boost converter output voltage increased accordingly because the converter was operated in boost mode for this condition. The voltage was soon regulated to the desired voltage of 24 V approximately 0.14 s after the control actions were initiated.
For test Condition 3, the motor speed was switched back to ω = 250 rad/s. The simulation revealed that a steady state (identical to that in Condition 1) was achieved within 0.11 s. For Condition 4, the solar irradiation was adjusted from
G = 1 to
G = 0.6. At the instant when the condition changed, the PV system falls off from the MPP, and competition between the PV system and battery occurred (the battery was activated in both conditions). Reducing the power from the PV system caused the battery to deliver more power (and current) to the motor, which caused an increase in the voltage drop on the resistance
rs2 on the battery side. The controller then adjusted the duty ratio for the converter so that maximum power was delivered to the motor and reach voltage balance on converter and battery outputs. Similar actions occurred for test condition changes from Condition 4 to 5. The results in
Figure 20 show that the motor speed was regulated following the short power-up transient phase. The steady state results of the Case 1 simulation (
Table 2) clearly indicate the success of the design.
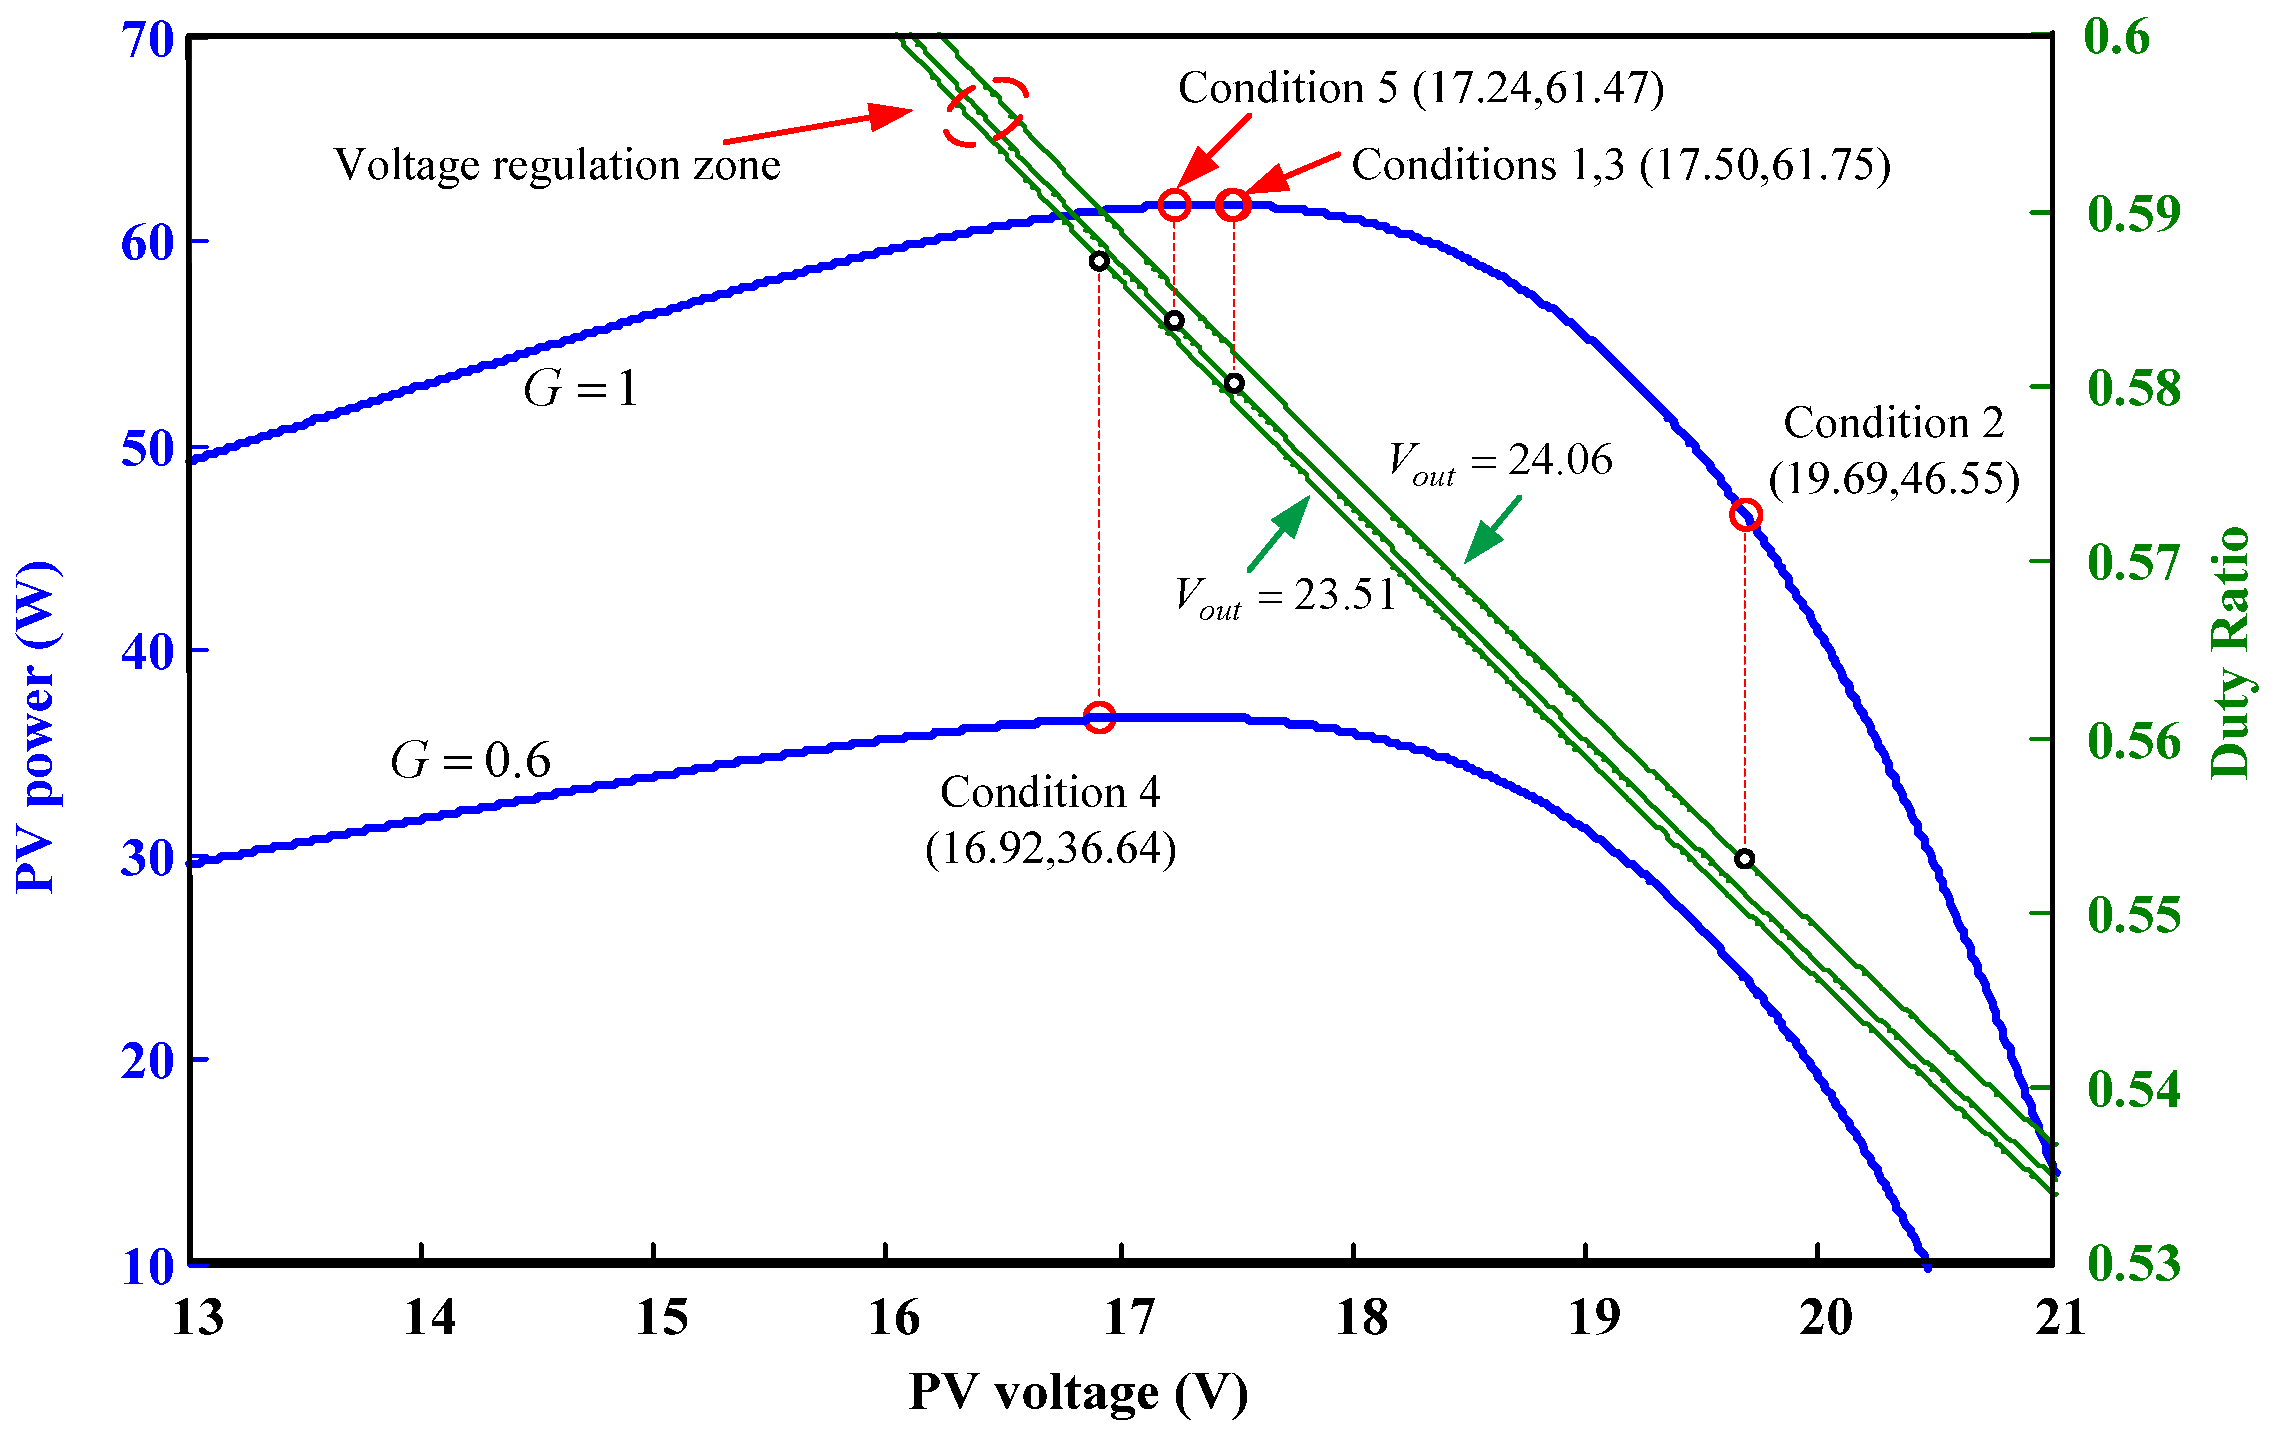
Figure 21 shows the steady-state operating points of the PV system, including the steady-state PV voltage and power, duty ratio commands, and output-voltage regulation zone.
For the Case 2 simulation, the output reference voltage was set to to ensure that the converter operated in the buck mode under the steady-state condition. The battery voltage was set to 15.84 V. The solar irradiation and motor speed conditions were identical to those in the Case 1 simulation. The simulation results were similar to those obtained for Case 1.
Table 2.
Case 1 simulation results.
Table 2.
Case 1 simulation results.
| Test Condition | PV Outputs | Converter Outputs | Battery Outputs | Motor |
|---|
| V (V) | I (A) | P (W) | V (V) | I (A) | P (W) | V (V) | I (A) | P (W) | P (W) | ω (rad/s) |
|---|
| Condition 1: | 17.49 | 3.53 | 61.75 | 23.71 | 2.55 | 60.50 | 23.71 | 0.48 | 11.41 | 71.91 | 250 |
| Condition 2: | 19.69 | 2.36 | 46.53 | 24.02 | 1.91 | 45.91 | 23.76 | 0 | 0 | 45.91 | 200 |
| Condition 3: | 17.49 | 3.53 | 61.76 | 23.71 | 2.55 | 60.50 | 23.71 | 0.48 | 11.41 | 71.91 | 250 |
| Condition 4: | 16.94 | 2.16 | 36.66 | 23.61 | 1.53 | 36.19 | 23.61 | 1.51 | 35.73 | 71.91 | 250 |
| Condition 5: | 17.22 | 3.59 | 61.72 | 23.71 | 2.55 | 60.45 | 23.71 | 0.48 | 11.47 | 71.91 | 250 |
Figure 21.
Steady-state operating points of the PV system (Case 1 simulation).
Figure 21.
Steady-state operating points of the PV system (Case 1 simulation).
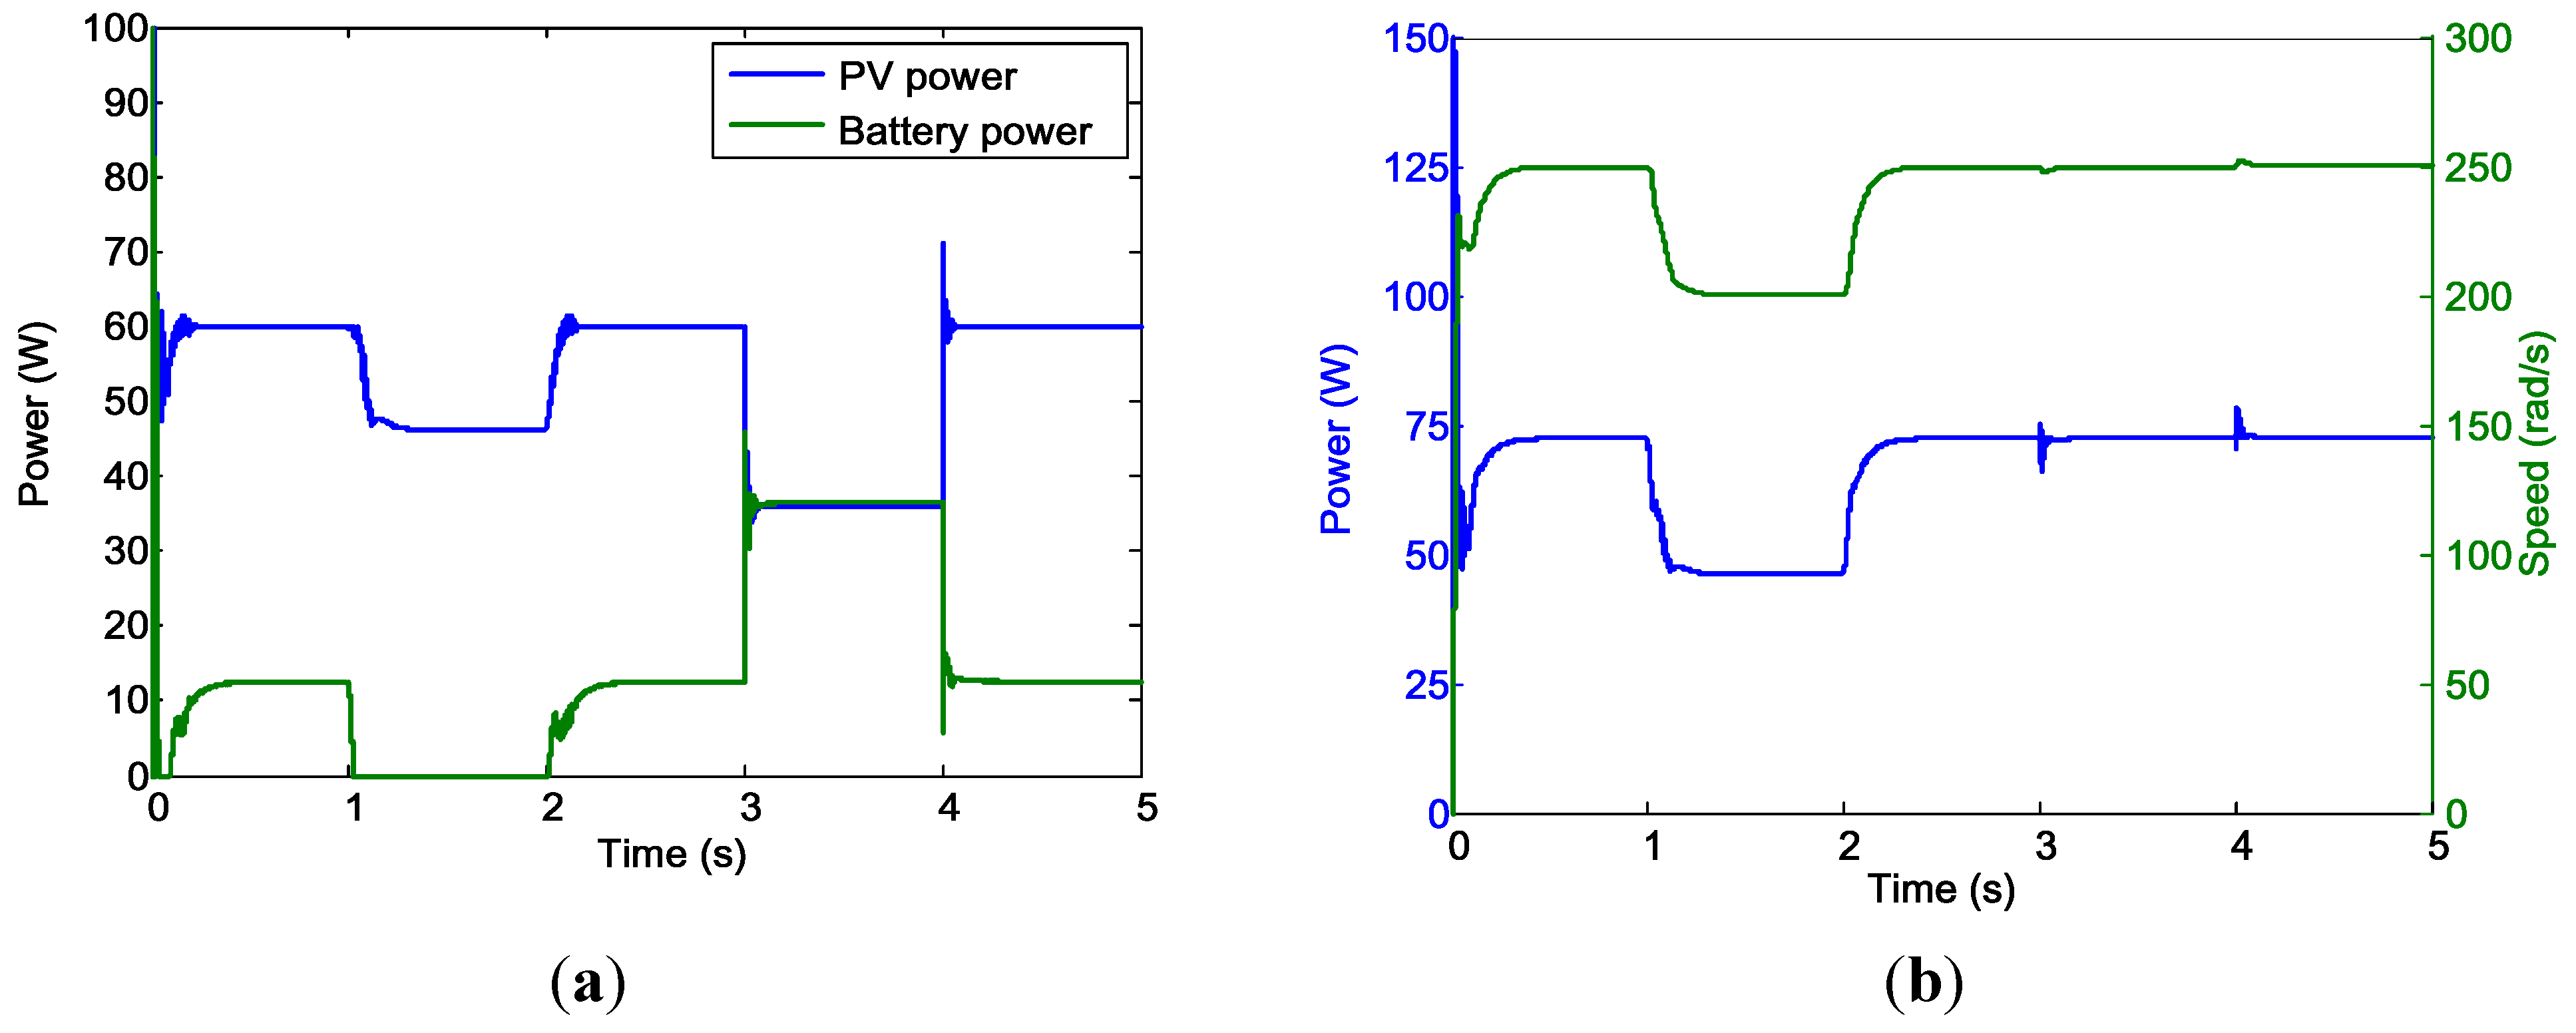
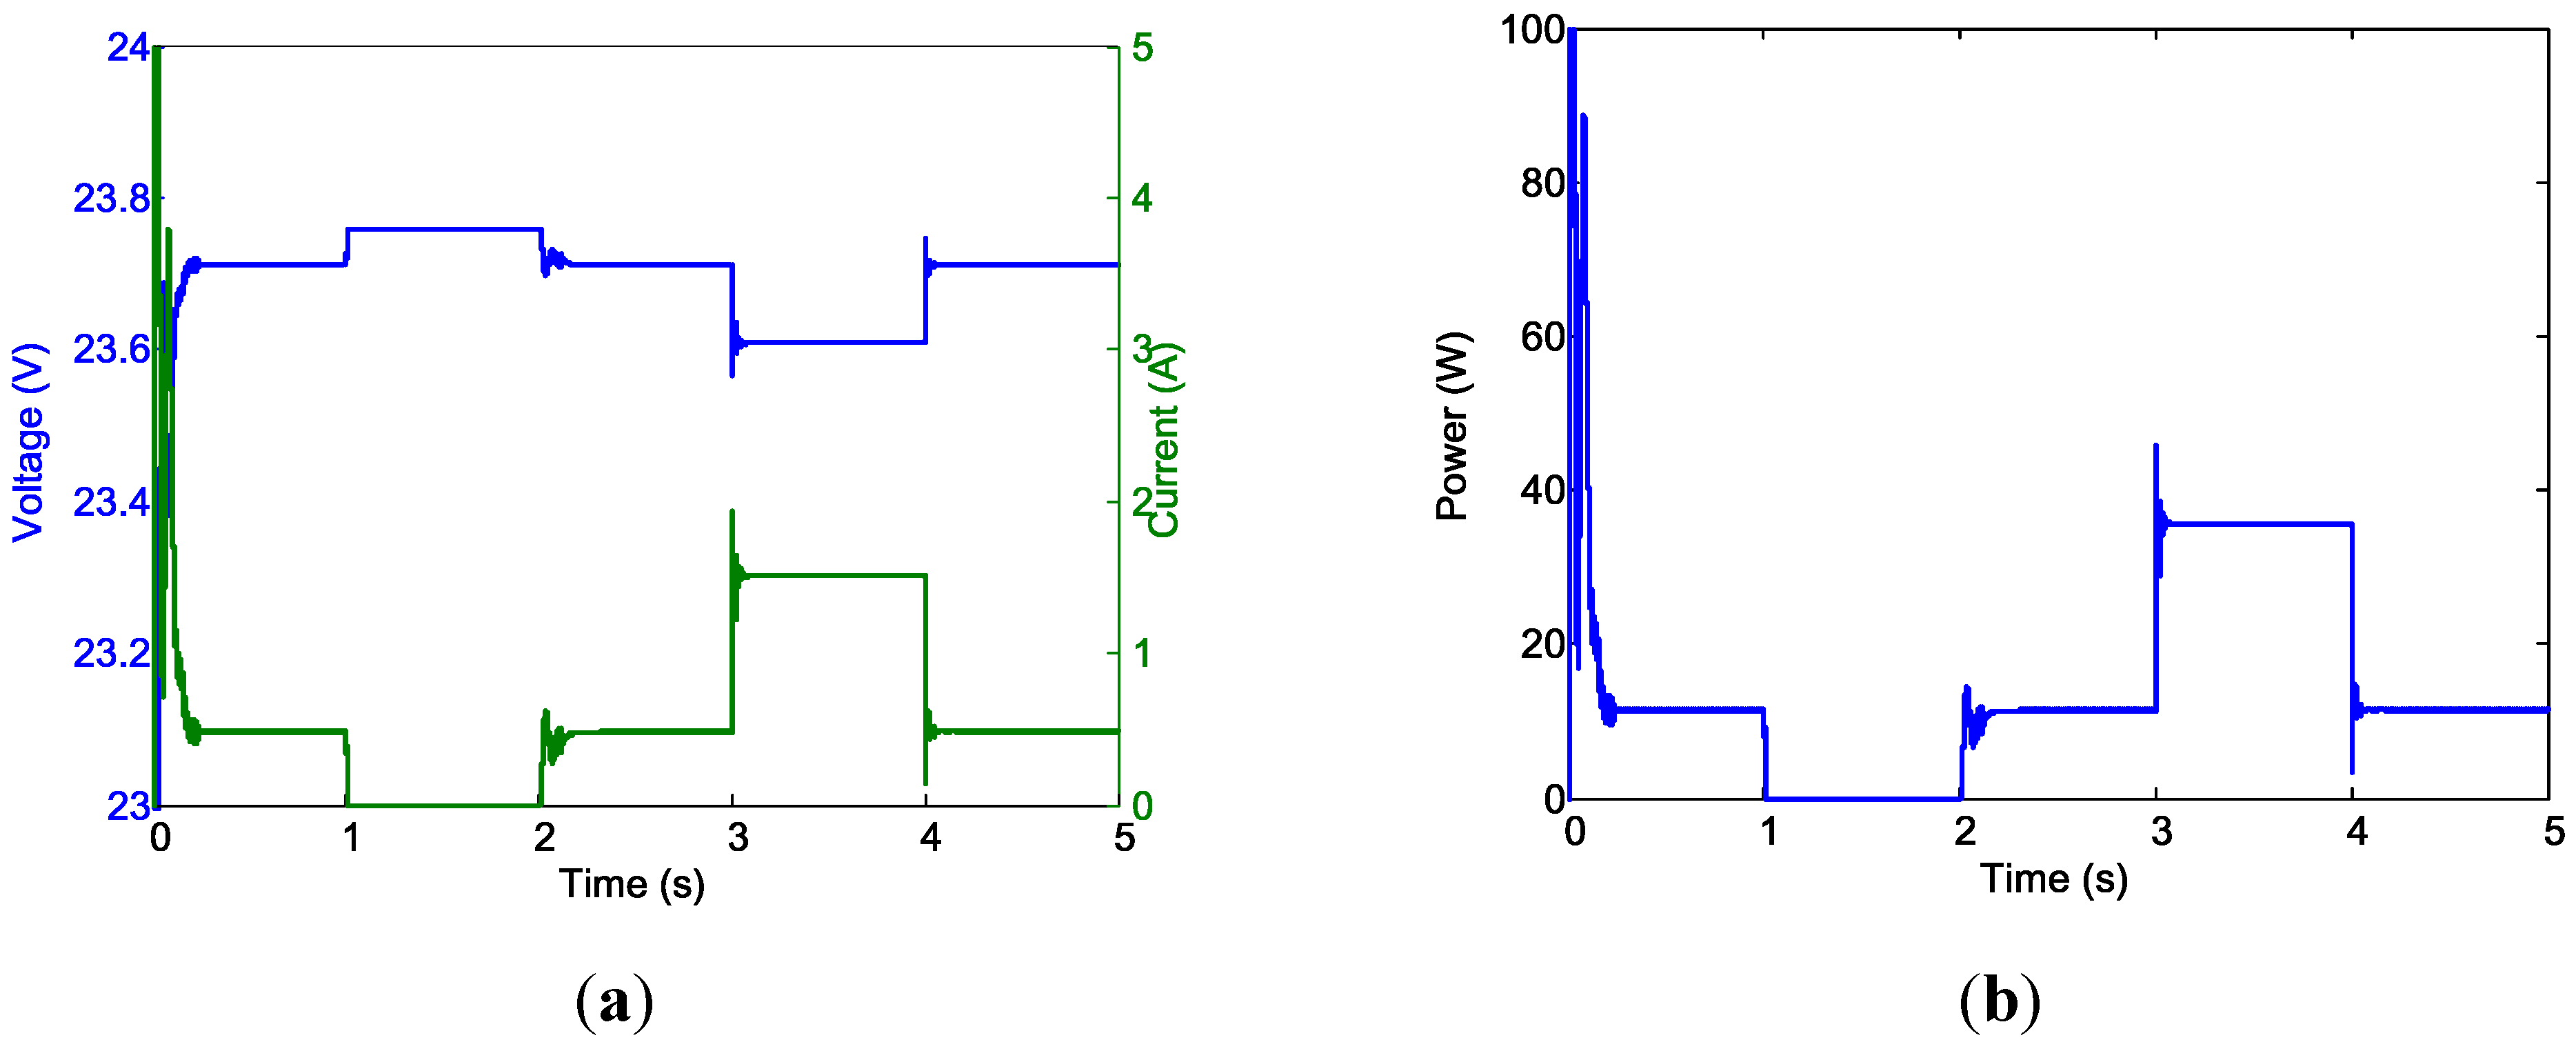
Figure 22.
Case 2 simulation results. (a) PV system and Battery power outputs; and (b) Motor power (blue) and speed (green).
Figure 22.
Case 2 simulation results. (a) PV system and Battery power outputs; and (b) Motor power (blue) and speed (green).
Figure 22 shows the results for PV system and battery power outputs (
Figure 22a) and motor power and speed (
Figure 22b). The steady-state results of the Case 2 simulation (
Table 3) clearly indicate the success of the design.
Table 3.
Simulation results for Case 2.
Table 3.
Simulation results for Case 2.
| Test Condition | PV Outputs | Converter Outputs | Battery Outputs | Motor |
|---|
| V (V) | I (A) | P (W) | V (V) | I (A) | P (W) | V (V) | I (A) | P (W) | P (W) | ω (rad/s) |
|---|
| Condition 1: | 17.54 | 3.52 | 61.73 | 15.76 | 3.80 | 59.95 | 15.76 | 0.80 | 12.53 | 72.49 | 250 |
| Condition 2: | 19.66 | 2.39 | 47.07 | 16.07 | 2.87 | 46.14 | 15.84 | 0 | 0 | 46.14 | 200 |
| Condition 3: | 17.41 | 3.55 | 61.77 | 15.76 | 3.81 | 59.97 | 15.76 | 0.79 | 12.52 | 72.49 | 250 |
| Condition 4: | 16.91 | 2.17 | 36.64 | 15.61 | 2.31 | 35.97 | 15.61 | 2.34 | 36.54 | 72.49 | 250 |
| Condition 5: | 17.25 | 3.58 | 61.74 | 15.76 | 3.80 | 59.93 | 15.76 | 0.80 | 12.56 | 72.49 | 250 |
For the Case 3 simulation, the hybrid power system was used to power two motors that were operated at different speeds (
i.e.,
and
). The duration of this test was 3 s. The solar irradiation level was adjusted from
to
, and then back to
. The simulation results were similar to those obtained for Cases 1 and 2.
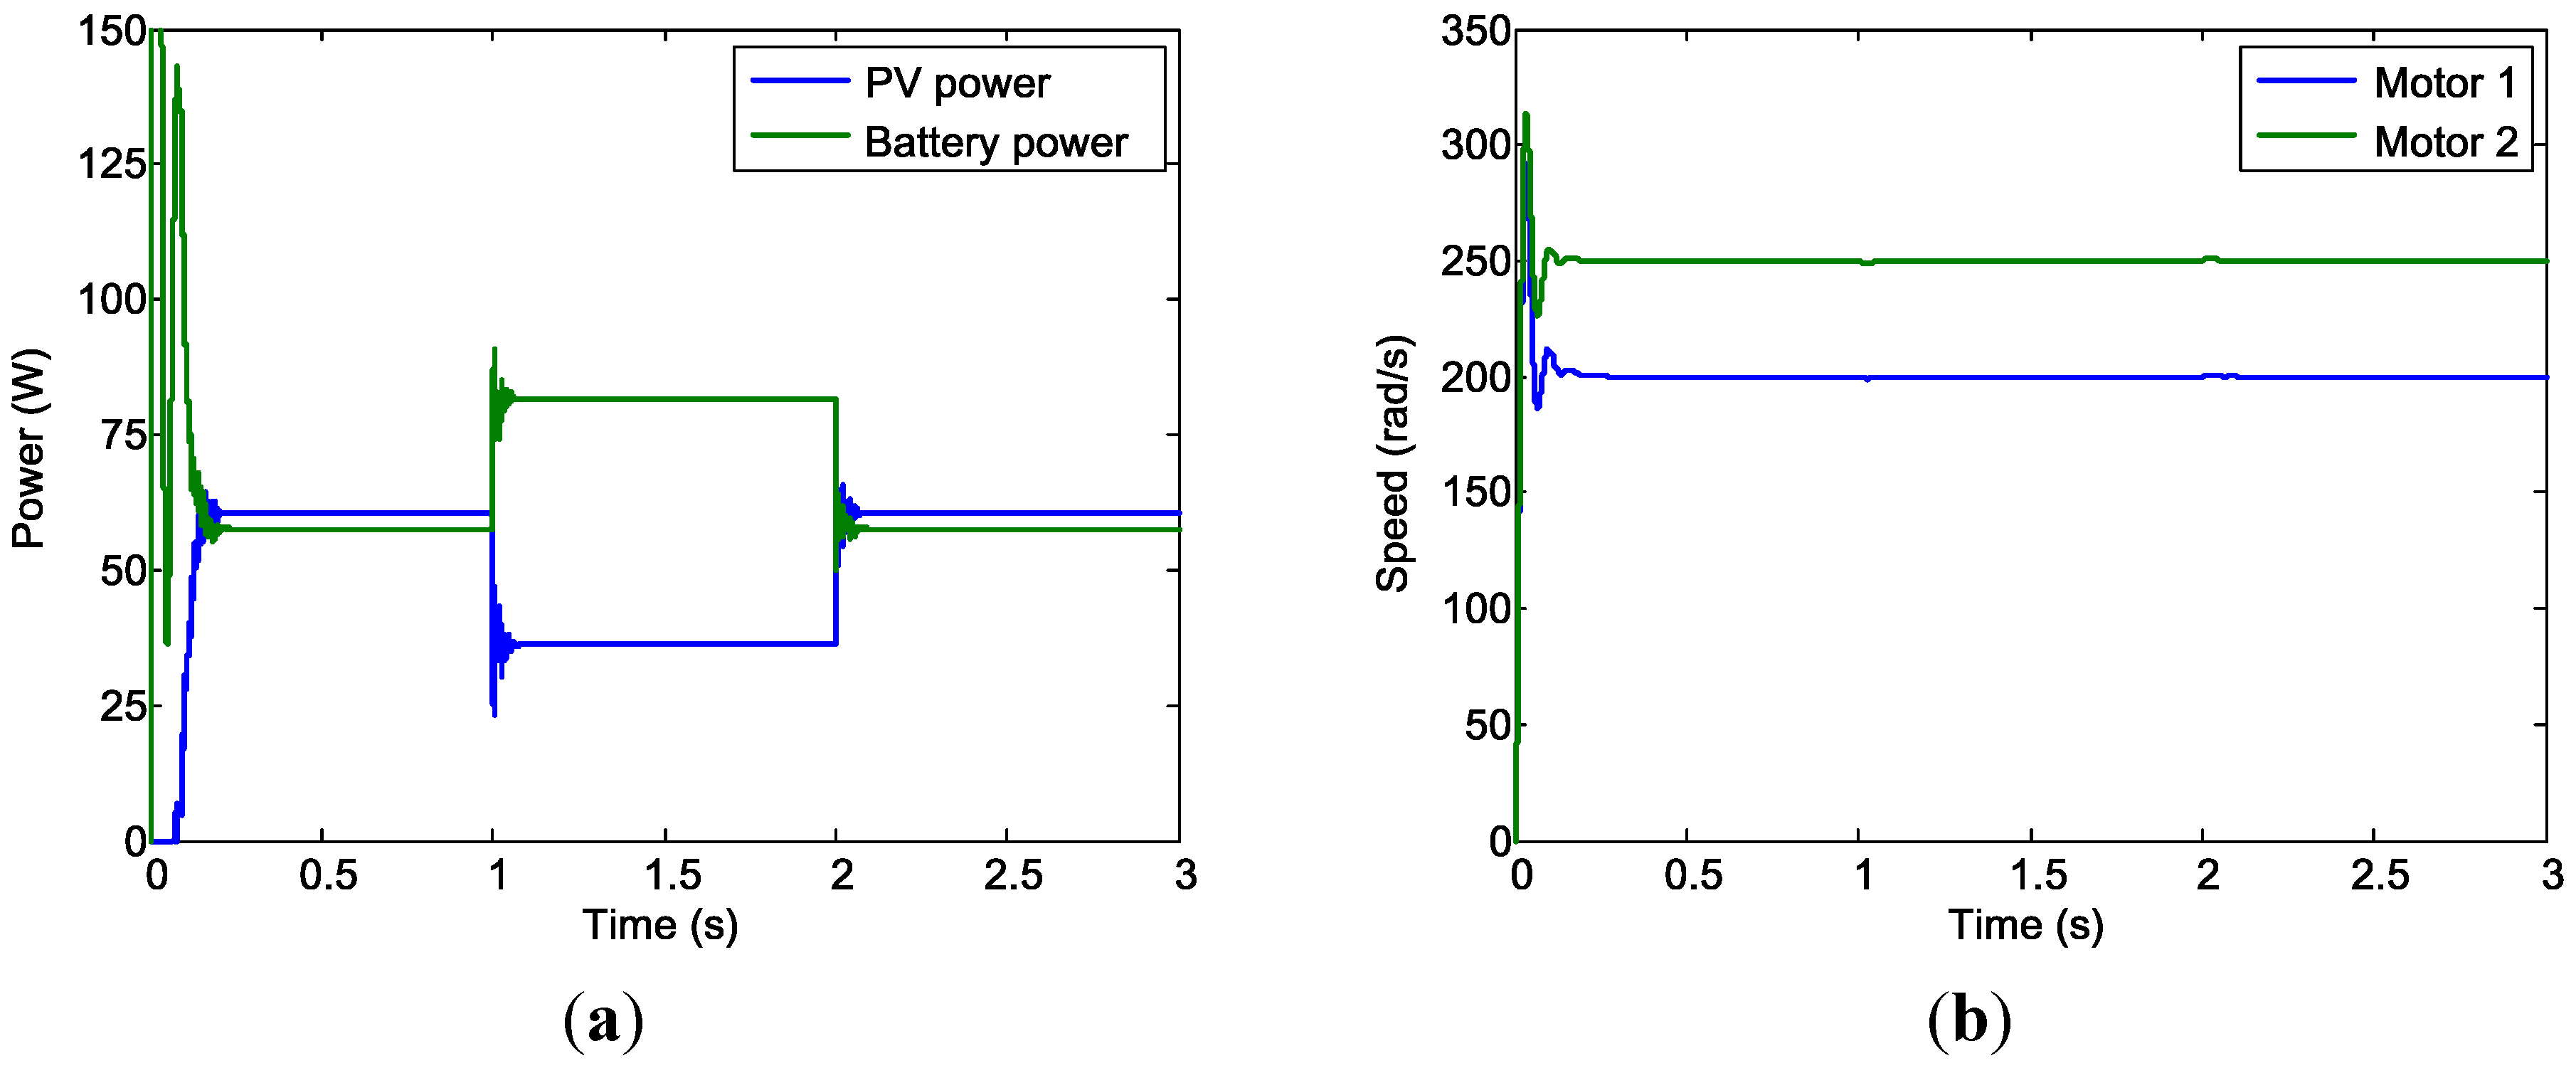
Figure 23 shows the results for the PV system, battery power output (
Figure 22a), and motor speed (
Figure 22b). The steady-state results of the Case 3 simulation (
Table 4) clearly indicate the success of the design.
Figure 23.
Case 3 simulation results. (a) PV and battery power; and (b) Motor speed.
Figure 23.
Case 3 simulation results. (a) PV and battery power; and (b) Motor speed.
Table 4.
Case 3 simulation results.
Table 4.
Case 3 simulation results.
| Test Condition | PV Outputs | Converter Outputs | Battery Outputs | Motor |
|---|
| V (V) | I (A) | P (W) | V (V) | I (A) | P (W) | V (V) | I (A) | P (W) | P (W) | ω1 (rad/s) | ω2 (rad/s) |
|---|
| Condition 1: | 17.49 | 3.53 | 61.76 | 23.52 | 2.57 | 60.50 | 23.52 | 2.44 | 57.35 | 143.84 | 200 | 250 |
| Condition 2: | 16.93 | 2.17 | 36.65 | 23.41 | 1.55 | 36.18 | 23.41 | 3.49 | 81.67 | 143.84 | 200 | 250 |
| Condition 3: | 17.23 | 3.58 | 61.73 | 23.52 | 2.57 | 60.45 | 23.52 | 2.44 | 57.40 | 143.84 | 200 | 250 |
In summary, we successfully developed a voltage-regulated MPPT system for a solar and battery hybrid-power system. The proposed control system was verified through three simulation cases that included buck and boost operations. Changes in solar irradiation and motor speed were also successfully demonstrated in the simulations.
The proposed system is formulated in a standard feedback control system. The measurement inputs to the control system are PV voltage, PV current, and regulated output voltage. The MPPT and voltage regulation functions have been integrated into a single voltage-regulated MPPT algorithm and verified through circuit simulation using PLECS tool. The simple and standard control structure and integrated computation algorithm allow us to implement the proposed system using microcontroller as the core with only voltage and current inputs. The proposed system will be used for the power management for our subsequent development of solar-powered UAV.


