Article

Multi-Objective Optimization Design for a Hybrid Energy System Using the Genetic Algorithm

1
Urban Development Institute, Incheon National University, Incheon 406-772, Korea
2
Division of Architecture & Urban Planning, Incheon National University, Incheon 406-772, Korea
3
Centre for Sustainable Architecture and Building System Research, School of Architecture, Chung-Ang University, Seoul 156-756, Korea
4
Department of Architectural Engineering, Suwon University, Hwaseong 445-743, Korea
*
Author to whom correspondence should be addressed.
Energies 2015, 8(4), 2924-2949; https://doi.org/10.3390/en8042924
Submission received: 3 February 2015 / Revised: 20 March 2015 / Accepted: 3 April 2015 / Published: 16 April 2015

Abstract

:
To secure a stable energy supply and bring renewable energy to buildings within a reasonable cost range, a hybrid energy system (HES) that integrates both fossil fuel energy systems (FFESs) and new and renewable energy systems (NRESs) needs to be designed and applied. This paper presents a methodology to optimize a HES consisting of three types of NRESs and six types of FFESs while simultaneously minimizing life cycle cost (LCC), maximizing penetration of renewable energy and minimizing annual greenhouse gas (GHG) emissions. An elitist non-dominated sorting genetic algorithm is utilized for multi-objective optimization. As an example, we have designed the optimal configuration and sizing for a HES in an elementary school. The evolution of Pareto-optimal solutions according to the variation in the economic, technical and environmental objective functions through generations is discussed. The pair wise trade-offs among the three objectives are also examined.

1. Introduction

In many countries, the energy consumption of buildings accounts for 40% of the total energy consumption and 40% of all greenhouse gas emissions [1,2]. To solve these energy and environmental issues, new and renewable energy systems (NRESs) are being introduced rapidly. These energy systems reduce the consumption of fossil fuel energy by enabling energy to be self-produced at buildings and sites. However, such systems use natural energy, the production of which is intermittent and volatile, and they have relatively high initial investment costs.
To overcome these issues, many researchers have been interested in the optimal design for hybrid renewable energy systems. Diaf et al. [3] studied the technical-economic optimization of the stand-alone hybrid PV/wind system (HPWS). Koutroulis et al. [4] presented a methodology for optimal sizing of a stand-alone electric system comprised photovoltaic (PV), wind turbine and battery storage. To design the HPWS, Yang et al. [5] studied the optimal sizing method to calculate the optimum system configuration that can achieve the loss of power supply probability (LPSP) with a minimum annualized cost of system and Yang et al. [6] have applied the method to the analysis of a HPWS which supplies power for a telecommunication relay station.
Nevertheless, the use of NRESs is not as economically feasible as fossil fuel energy systems (FFESs). Thus, to secure a stable supply of renewable energy within a reasonable cost range, hybrid energy systems (HESs) that integrate both FFESs and NRESs must be designed and applied. In recent years, studies on the optimal design of these HESs have been carried out by a number of researchers. Dufo-López et al. [7] presented an optimization method that designs the sizing and operation control of a PV-Battery-Diesel system with the minimum total net present cost by a genetic algorithm. Then, the research team, including Dufo-López, [8,9,10] studied the optimal design of a PV-Wind-Battery-Diesel system according to the objective functions, the operation strategies and characteristics for load profiles. Chen [11] researched on an optimization methodology for the installation capacity of a stand-alone PV-Wind-Battery-Diesel system, taking into consideration the cost and reliability. Zhao et al. [12] studied an optimal unit sizing method for the aforementioned system and applied the method to a real micro-grid system on Dongfushan Island, China. Moreover, the role of the internal combustion generator in a hybrid electric system has been discussed by Perera et al. [13,14,15,16] by using multi-objective optimization. Furthermore, a number of research works had been done dealing with the optimal design and the sizing of HESs composed of energy technologies, such as fuel cells and bio-diesel generators [17,18,19].
Most HESs in the aforementioned literatures are stand-alone hybrid electric systems that just supply electricity to a building. Because of this, growing attention has been placed on HESs providing the entire building energy load. Nosrat et al. [20] combined trigeneration with PV, cogeneration and absorption chiller. Rubio-Maya et al. [21] studied the design optimization of a polygeneration plant comprised of a solar thermal system, biomass gasification, gas turbine, fuel cell, absorption chiller, compression chiller and boiler. Jing et al. [22] studied the combination of PV and solar thermal, gas engine, absorption chiller and boiler. In addition, the optimization for various HES configurations comprised of NRESs and FFESs was studied by Morini et al. [23], Barbieri et al. [24] and Buoro et al. [25].
As previously stated, studies on the optimal design for HESs have been increasing, but studies on the optimization of HESs supplying both electricity and heat to a building are still lacking. Furthermore, most of previous studies optimized particular HESs that generally feature enhancement of applicability of NRESs and were composed beforehand by researchers. However, components using fossil fuels, such as boilers, refrigerators and heat pumps are still installed as part of the primary energy system and are unlikely to change for a considerable amount of time. To apply reasonable and appropriate HESs in buildings, development of novel methodologies are required to design an optimal size or configuration according to the design criteria among the alternative, practicable HESs that can be made up of different types of energy conversion technologies.
Therefore, this paper presents a methodology to design a HES using a multi-objective optimization with the following characteristics: this methodology determines the optimal size and configuration for hybrid cooling, heating, hot water and power systems consisting of NRESs (photovoltaic, solar collector and ground source heat-pump) and FFESs (boiler, chiller and air source heat-pump). The optimal design will differ depending on the design objectives that the researcher, investor or operators regard as the key factors in the design of an energy system. Thus, the optimal design objectives can be selected by users in the beginning of the implementation of the methodology. In addition, the results obtained with this method describe the applicable optimal size and configuration of a HES satisfying the constraints established to reflect practical design considerations such as energy balance, available space to install NRESs and the penetration of renewable energy.
Meanwhile, various optimization methods for the design of HESs have been reported in the literature such as genetic algorithm (GA), particle swarm optimization (PSO) and simulated annealing (SA) [26]. GA is a popular meta-heuristic that is particularly well suited for the optimal design problems of HESs [27] and has been proved to be a good method to solve large scale and combinatorial optimization problems [4,5,6,7,9,10,11,12,17,18,19,23,24,28,
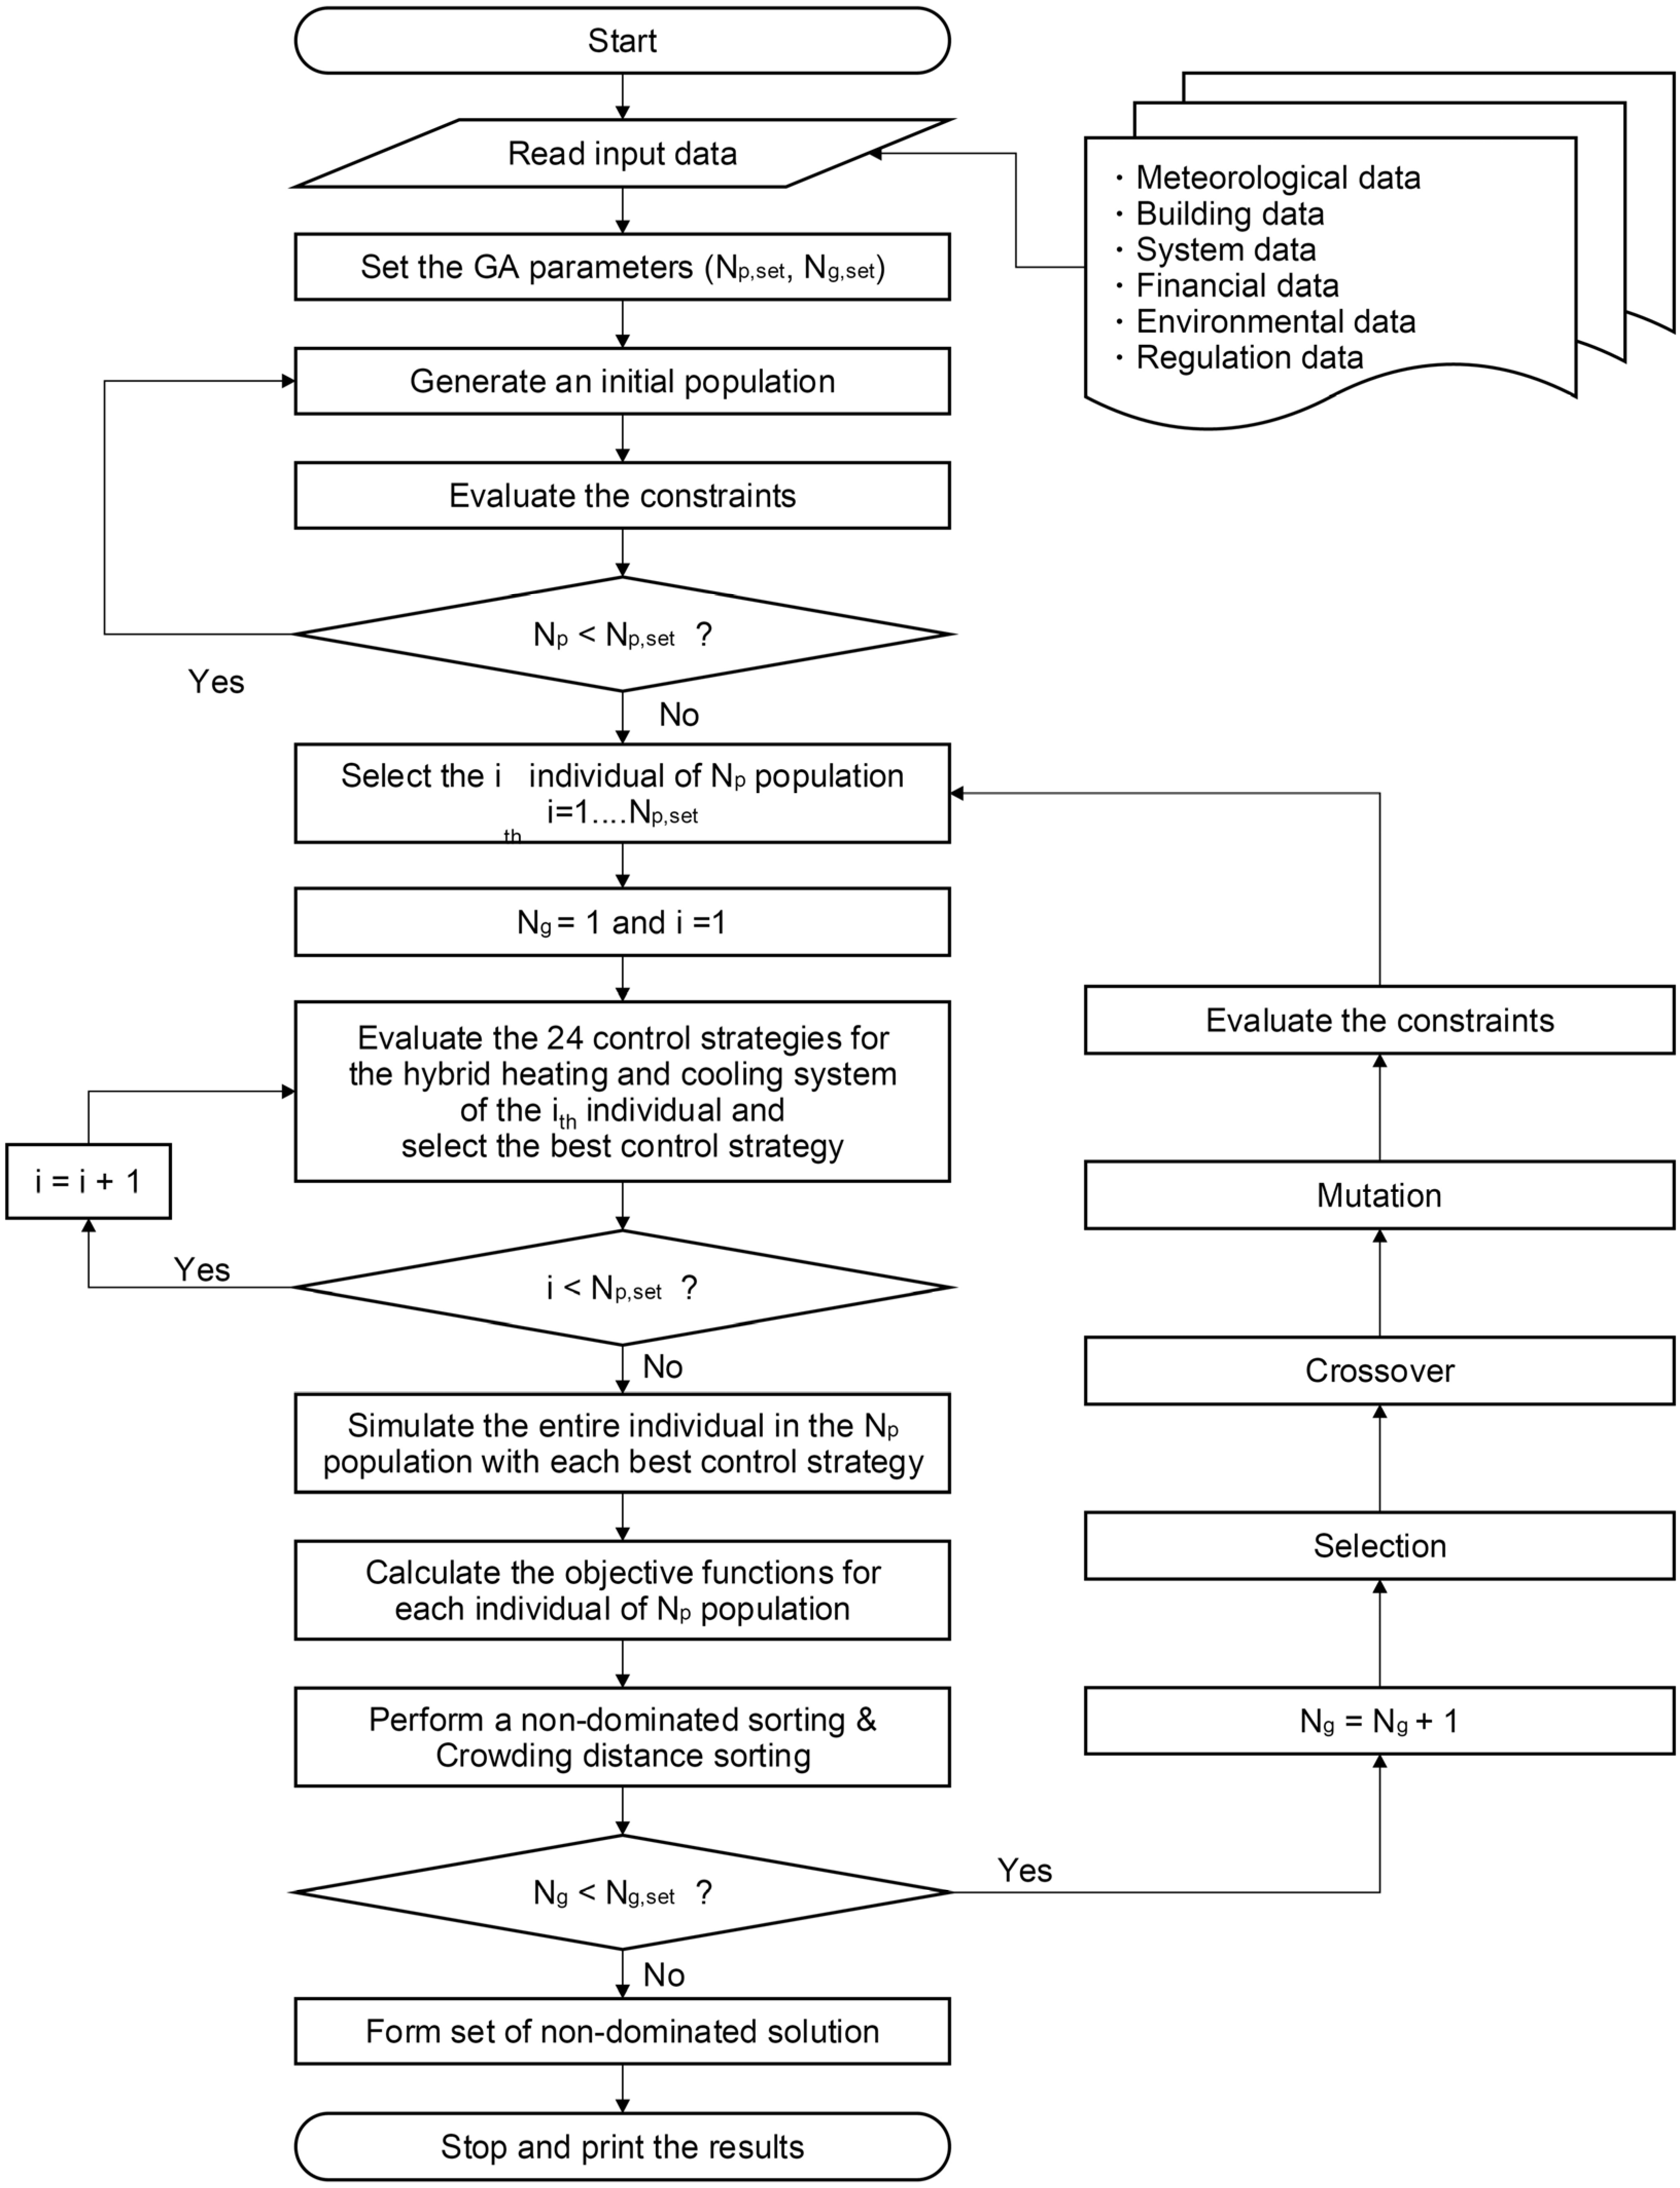
29]. Therefore, in this paper, an elitist non-dominated sorting genetic algorithm (NSGA-II) is utilized for multi-objective optimization.
This paper is organized as follows: Section 2 presents the composition, component models and the operation strategies of the HES by classifying them into heating and cooling, hot water and electricity. In Section 3, after explaining the decision variable, the three objective functions and the three constraints, the proposed optimization method was constructed using the modified NSGA-II to keep the discrete variables during the optimization. 
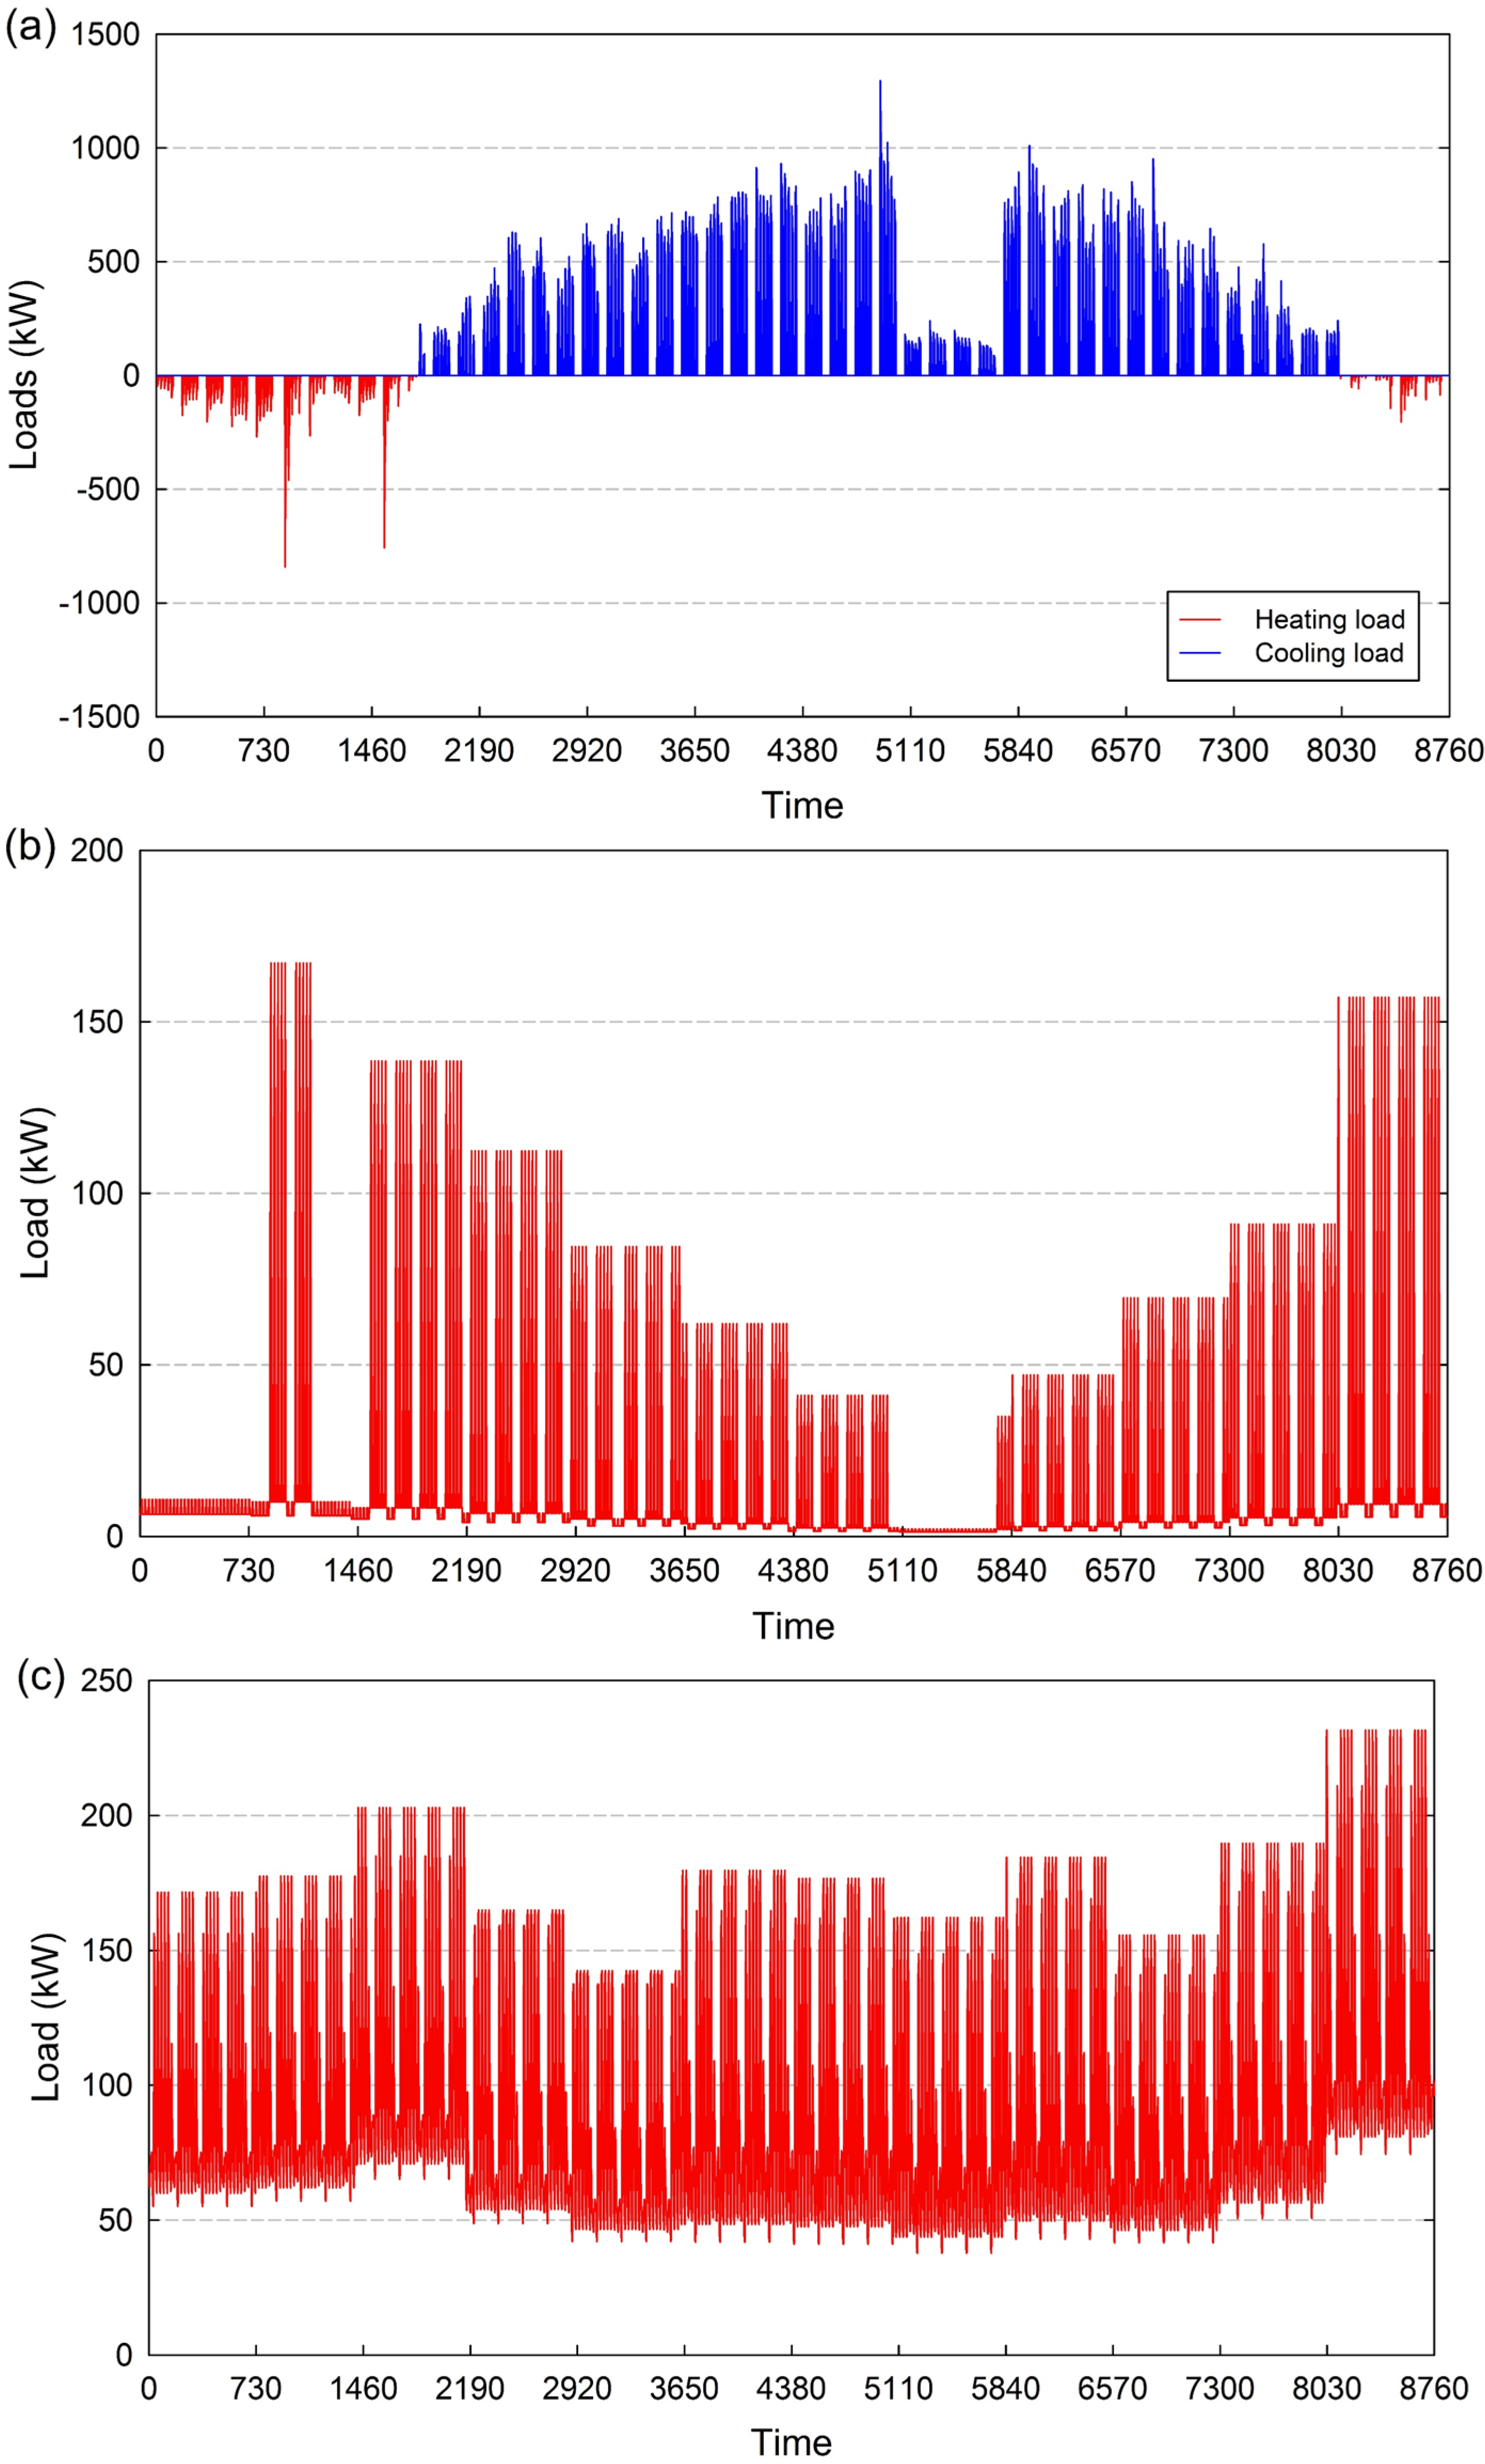
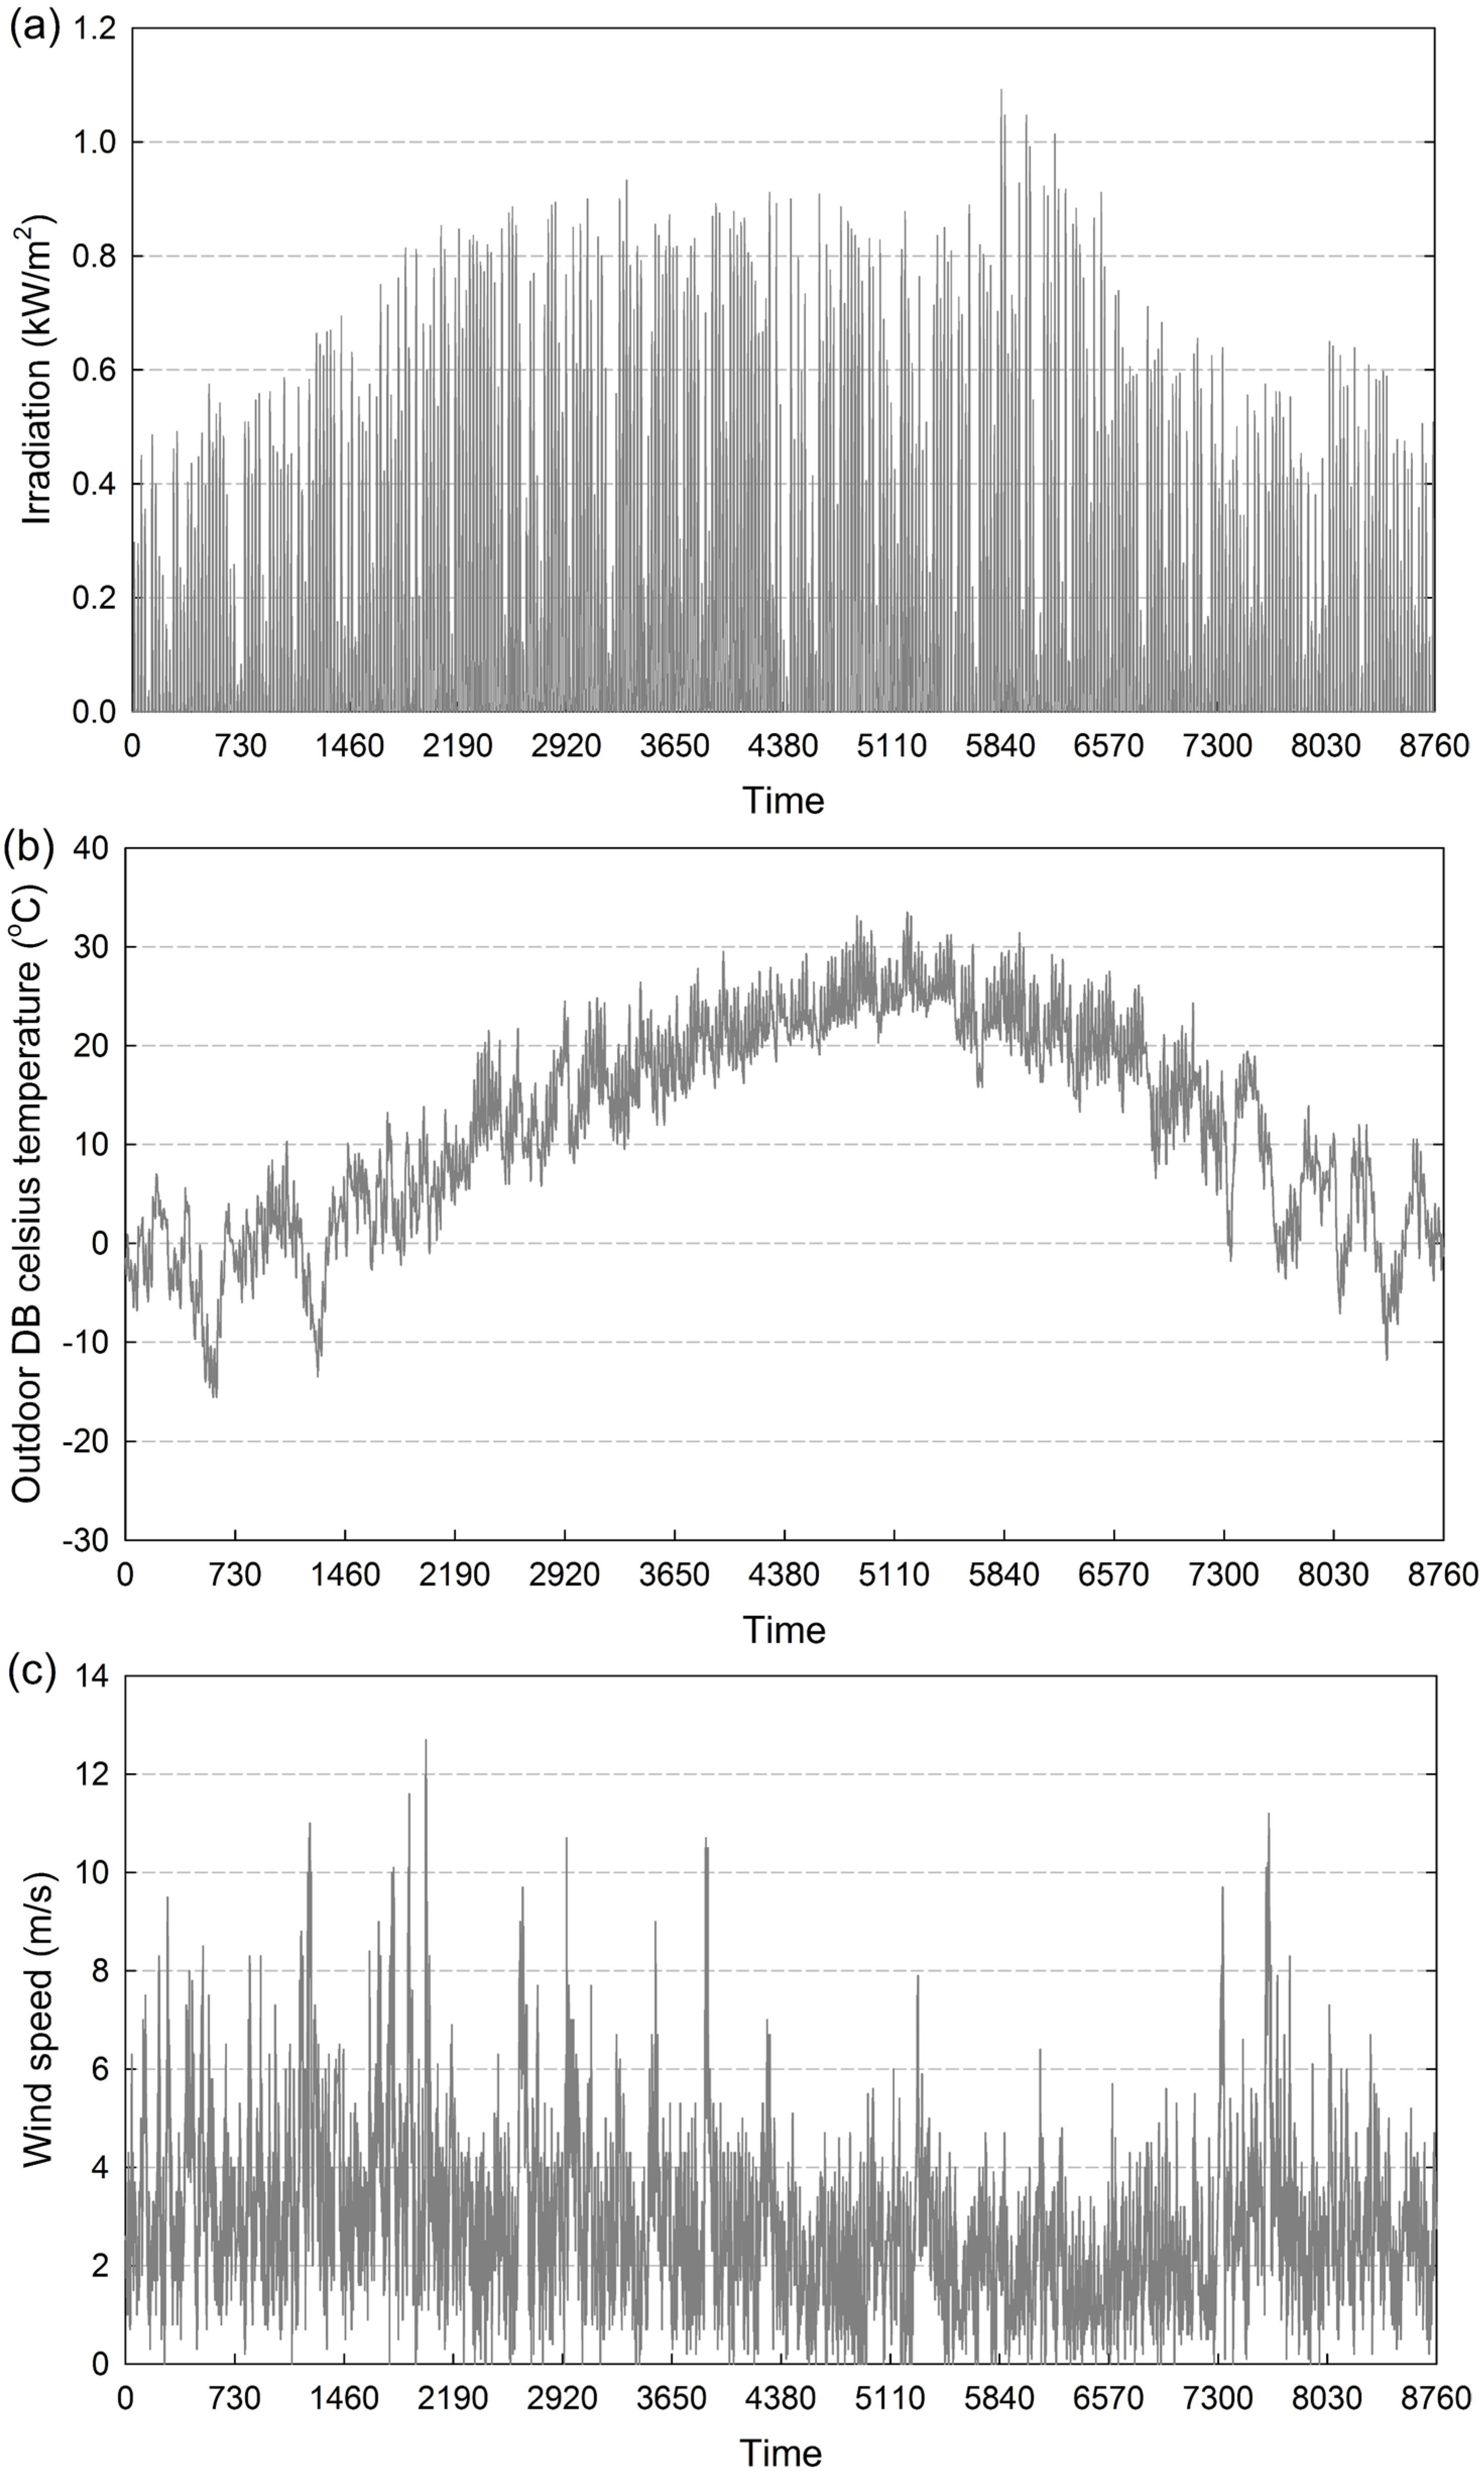
Section 4 applies the proposed method to optimize the HES simultaneously considering the economic, technical and environmental objectives relevant to an educational facility in Gimpo, South Korea. Finally, some concluding remarks are provided in Section 5.

2. HES Composition, Model and Operation Strategy

2.1. Composition of HES

In this study, the HES is defined as the system consisting of both FFESs and NRESs, providing the entire building energy load. 
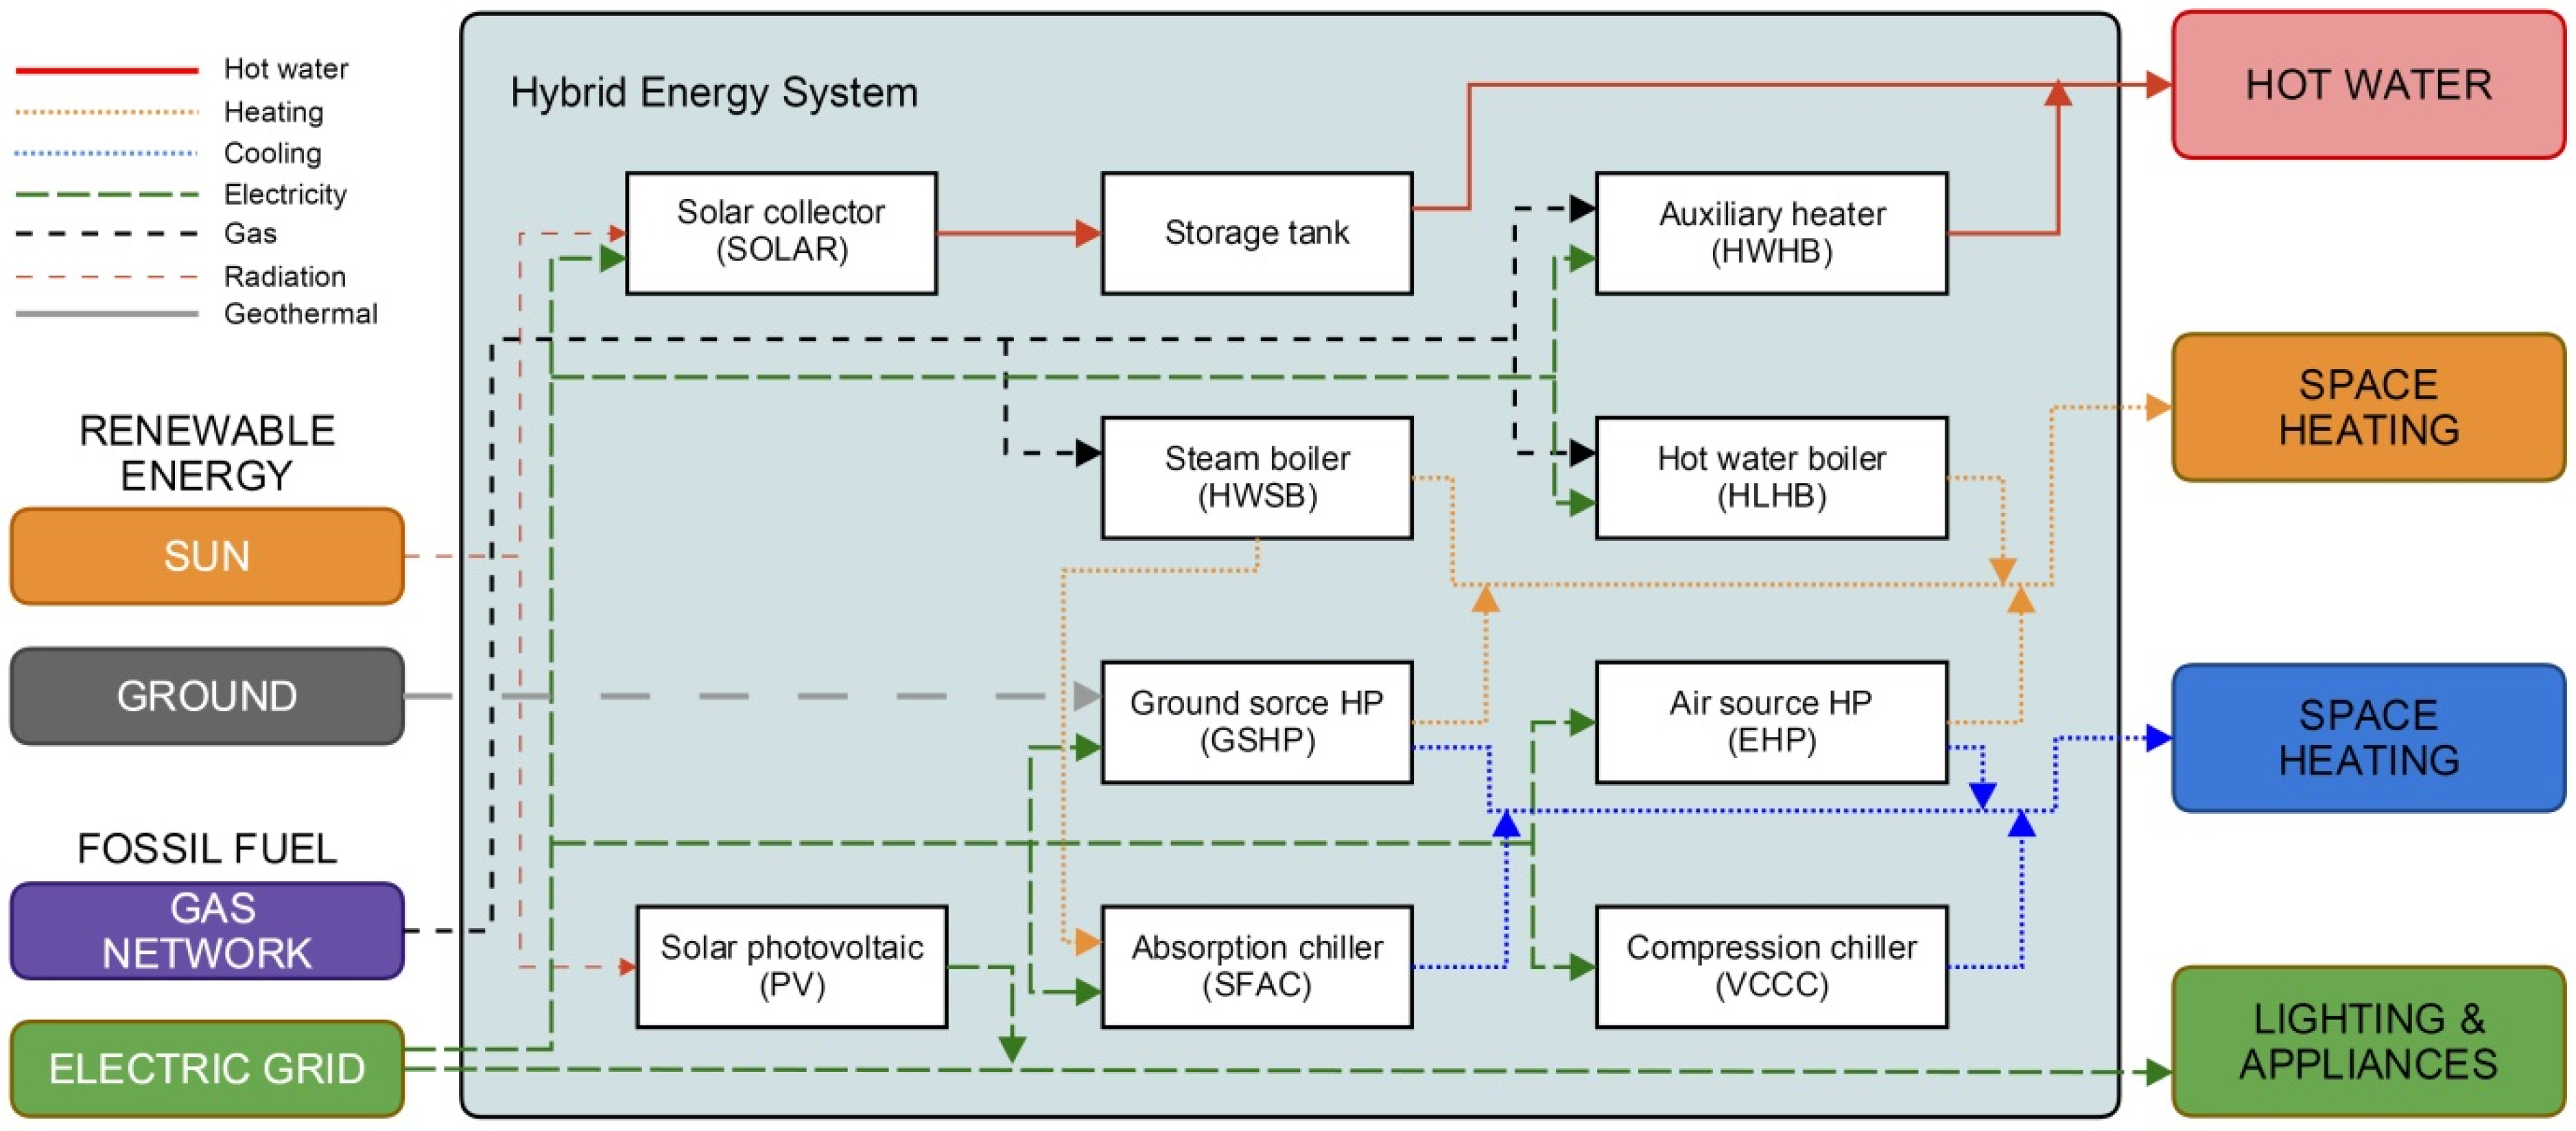
Figure 1 shows the composition of a HES comprised of nine different types of energy conversion technologies. According to the type of energy demand, a HES is divided into the heating, cooling, hot water and electricity systems. The heating system of a HES is comprised of the following components: ground source heat pumps (GSHPs), electrically driven heat pumps (EHPs), steam boilers for heating (HLSBs) and hot water boilers for heating (HLHBs). The cooling system is comprised of four different cooling devices: GSHP, EHP, steam-fired absorption chillers (SFACs) and vapor compression style water-cooled chillers (VCCCs). The GSHP and EHP provide for both heating and cooling. For the hot water system, there are solar collectors (SOLARs), heat storage tanks and auxiliary hot water boilers (HWHBs). Electricity is supplied to the building through photovoltaics (PVs) and the electricity grid. Thus, HES is composed of three types of NRESs and six types of FFESs. Meanwhile, not all of the aforementioned components are necessarily included in the optimal configuration for the HES. The components that can achieve good performance objectives are selected through the optimization design.
Figure 1. HES made up of renewable and fossil fuel energy conversion devices.
Energies 08 02924 g001

2.2. Component Models of HES

We utilized mathematical models of the components of HES that are widely used and recognized in the literature. A more detailed model can be found in the relevant references. In this paper, only a brief description of these mathematical models is provided below.
We used an empirical equivalent circuit model detailed by Duffie and Beckman [30] to predict the electrical characteristics of a photovoltaic module. The electrical performance of a photovoltaic array is predicted through extrapolation of the results for a single module equivalent circuit. The current-voltage characteristic of PV modules and its dependence on irradiation and cell temperature are input into the methodology from the catalog data provided by the manufacturers. Meanwhile, the thermal performance of the solar collector is determined according to the information available from the manufacturers and the following calculation steps: calculations of the incidence angle, solar irradiation at tilted collectors, incidence angle modifier and useful heat gain based on the collector’s series and parallel connections at each time step [30].
This paper utilizes the performance-curve based models for the GHSP and EHP heat-pumps. These models are popular and have been widely used in recent years because of their easily accessible inputs and fairly accurate simulation results [31]. Additionally, not only are strategic level simulation tools such as MERIT being used, but detailed building analysis programs such as TRNSYS are also being applied for a schematic performance-based model. Thus, the heat-pump performance features such as the heating and cooling capacities and power consumptions at specific heat source temperatures, are predicted through curve fitting of the manufacturer’s catalog data. The ground temperature for GSHP is calculated according to the Kasuda model [32], and the hourly average ambient air temperature of the input meteorological conditions is used as the source temperature.
Energy performance for SFAC and VCCC is also evaluated through the performance-based model used with normalized performance data in TRNSYS [33]. Because normalized data are utilized, this method allows users to model any size of chiller using a given set of data. For the thermal performance of HLHB and HLSB, we model a simple boiler with its overall efficiency and part load ratio from the device capacity and the energy required to meet the load [33].

2.3. Operation Strategy of HES

In recent years, more building energy systems have included various energy conversion devices. In these HESs, even if the configuration and sizing are the same, the economic, energetic and environmental performance of the systems may vary depending on the operation strategy. Thus, it is necessary to determine the feasible operation strategy of HESs. In this optimization method, the heating, cooling, hot water and electricity systems are operated to meet the each energy demand using on-off control on an hourly basis. Hourly energy demands and weather conditions are required as input data.
Hot water systems consist of SOLARs and HWHBs and the details of their operation are described as follows: provided the useful heat gain from SOLARs cannot fulfill the hot water load, or if energy production from SOLARs is not possible, the heat energy stored in the thermal storage tank is used first and the rest is supplied by the HWHBs. On the other hand, if the energy that can be produced by SOLARs is greater than the energy demand for hot water, SOLARs produce as much energy as the sum of the energy for hot water and the energy that can be stored in the storage tank. In other words, SOLARs are operated to minimize production of excess heat.
In the system discussed in this paper, the heating and cooling system may consist of between one and four different types of components. There are 24 possible strategies for those systems depending on operation sequence (on-off control). Thus, by calculating the annual energy consumption of all possible strategies over the identical system and comparing their energy cost, the operation strategy with the minimum energy cost is selected as the best control method for each system. Meanwhile, the switch-on logic of the heating and cooling system is outlined as follows: each hour, the first component contributes to the energy demand within the range of its capacity at the beginning. If there is any residual demand, the following components switch on according to the set order. The energy production of the earlier operated components is equal to the maximum energy production of each component. In the electrical system, the total amount of electric energy produced by PVs is delivered to the building and energy required in excess of that is provided by an electric power utility.

3. Optimization Methodology of HES

3.1. Decision Variable

The optimization methodology in this paper is developed to determine the configuration and sizing for a HES composed of nine different types of energy conversion devices using renewable and fossil fuel. Here, the configuration means the combination of the selected components and the sizing of each component is computed using its quantity and unit capacity. The difference between being selected and not selected can be described as the number of devices. Therefore, a HES is expressed as a decision vector composed of 18 integer variables that represent the type and number of each component as shown below:
x = ( a , b , c , d , e , f , g , h , i , j , k , l , m , n , o , p , q , r ) T
where a is the type of SOLARs; b is the number of SOLARs; c is the type of HWHBs; d is the number of HWHBs; e is the type of EHPs; f is the number of EHPs; g is the type of GSHPs; h is the number of GSHPs; i is the type of VCCCs; j is the number of VCCCs; k is the type of SFACs; l is the number of the SFACs; m is the type of HLSBs; n is the number of HLSBs; o is the type of HLHBs; p is the number of HLHBs; q is the type of PVs; r is the number of PVs.

3.2. Objective Function

3.2.1. Economic Objective

An economic objective function is defined as minimization of LCC and is widely used to evaluate the feasibility of energy systems. It can be formulated as follows:
O F e c o n o m i c = m i n ( C H E S I n i t i a l + C H E S R e p l a c e m e n t + C H E S M a i n t e n a n c e + C H E S E n e r g y C H E S S u b s i d y )
where C H E S I n i t i a l , C H E S R e p l a c e m e n t , C H E S M a i n t e n a n c e , C H E S E n e r g y , C H E S S u b s i d y represent the initial, replacement, maintenance, energy and subsidy cost respectively, for the HES.
The initial cost is related to the purchase cost of the components and pumps, except for installation cost, as follows:
C H E S I n i t i a l = [ A S O R L A R , j × N S O R L A R × C S O L A R r e f + C H W H B , j × N H W H B × ( 1 + R p u m p I n i t i a l ) ] + ( S P V , j × N P V × C P V r e f ) + [ C G S H P , j × N G S H P × ( 1 + R p u m p I n i t i a l ) + S G S H P , j × N G S H P × C G S H P r e f ] + (   C E H P , j × N E H P ) + { [ ( C H L S B , j × N H L S B ) + ( C H L H B , j × N H L H B ) ] × ( 1 + R p u m p I n i t i a l ) } + [ ( C S F A C , j × C S F A C , C T , j ) × N S F A C × ( 1 + R p u m p I n i t i a l ) ] + [ ( C V C C C , j × C V C C C , C T , j ) × N V C C C × ( 1 + R p u m p I n i t i a l ) ]
where, C D e v i c e ,   j and N D e v i c e are the purchase price and the number of the j th device of each component; A S O L A R , j , S P V , j , S G S H P , j are the area (m2) for the jth type of SOLARs, and unit capacity (kW) for the jth type of PVs and GSHPs, respectively; C S O L A R r e f (KRW/m2), C P V r e f (KRW/kW) and C G S H P r e f (KRW/kW) are the initial cost according to unit capacity of SOLARs, PVs and GSHPs; R p u m p I n i t i a l is the purchase cost of the pump as a percentage of the initial cost for each component.
The replacement costs are incurred depending on each system’s lifetime during the project period and are described as follows:
C C o m p o n e n t R e p l a c e m e n t = a D e v i c e = 1 a D e v i c e [ C C o m p o n e n t I n i t i a l × 1 ( 1 + i ) ( n D e v i c e × a D e v i c e ) ]
a D e v i c e = I N T ( n P r o j e c t 1 n D e v i c e )
where C C o m p o n e n t R e p l a c e m e n t and C C o m p o n e n t I n i t i a l are the replacement and initial cost for each component; n P r o j e c t , n D e v i c e , a D e v i c e and i are the planning period, life time of the each device, the number of times for replacement and the discount rate, respectively.
In this paper, the maintenance cost is calculated as a percentage of the initial cost for each component, described as follows:
C C o m p o n e n t M a i n t e n a n c e = C C o m p o n e n t I n i t i a l × R C o m p o n e n t M a i n t e n a n c e × U P A
U P A = ( 1 + i ) n P r o j e c t 1 i × ( 1 + i ) n P r o j e c t
where C C o m p o n e n t M a i n t e n a n c e and R C o m p o n e n t M a i n t e n a n c e are the maintenance cost and a percentage of the annual maintenance of each component; U P A is the uniform present value factor.
The energy cost is computed by applying the electricity and liquid natural gas (LNG) escalation rate and is described as follows:
C H E S E n e r g y = [ t = 1 8 , 760 C H E S e l e ( t ) ] × U P A e l e * + [ t = 1 8 , 760 C H E S g a s ( t ) ] × U P A g a s *
U P A f u e l * = ( 1 + e f u e l 1 + i ) × [ ( 1 + e f u e l 1 + i ) n p r o j e c t 1 ] ( 1 + e f u e l 1 + i ) 1
where C H E S e l e and C H E S g a s are the hourly electricity and gas cost for HES; U P A f u e l * is the uniform present value factor adjusted to reflect the fuel price escalation rate; e f u e l is the fuel price escalation rate.
When the NRESs are obligatorily or spontaneously installed, depending on the related regulations, part of the initial cost may be supported by the government. This study calculates the subsidy cost of installation of NRESs using the government support system in South Korea, as described in Equations (10)–(12):
C S O L A R S u b s i d y = { A S O L A R m a x × C S O L A R r e f × R S O L A R S u b s i d y ,   A S O L A R m a x < A S O L A R , j × N S O L A R A S O L A R , j × N S O L A R × C S O L A R r e f × R S O L A R S u b s i d y ,   A S O L A R m a x A S O L A R , j × N S O L A R
C P V S u b s i d y = { S P V m a x × C P V r e f × R P V S u b s i d y ,   S P V m a x < S P V , j × N P V S P V , j × N P V × C P V r e f × R P V S u b s i d y ,   S P V m a x S P V , j × N P V
C G S H P S u b s i d y = { S G S H P m a x × C G S H P r e f × R G S H P S u b s i d y ,   S G S H P m a x < S G S H P , j × N G S H P S G S H P , j × N G S H P × C G S H P r e f × R G S H P S u b s i d y ,   S G S H P m a x S G S H P , j × N G S H P
where C C o m p o n e n t S u b s i d y and R C o m p o n e n t S u b s i d y are the subsidy cost and its support range for the components, namely SOLARs, PVs and GSHPs; A S O L A R M a x (m2), S P V M a x (kW) and S G S H P M a x (kW) are the maximum capacity available to receive the subsidy cost for SOLARs, PVs and GSHPs.

3.2.2. Technical Objective

As mentioned earlier, the HES was considered as a single building energy system comprised of nine different types of energy conversion technologies. The HES can also stably contribute to the entire building energy demands using FFESs connected to the electric grid or gas network when the energy production from NRESs is intermittent or lacking. Thus, using the technical objectives, such as the reliability of energy supply and the matching rate between demand and supply considered in previous studies that dealt only with renewable energy systems or stand-alone energy systems, is not effective. Considering that the use of renewable energy will be increased, it is necessary to investigate the economic and environmental impacts caused by the variation of renewable energy supplies for HESs. Therefore, this study takes the maximization of the energy supplied by NRES as the technical objective, which is represented as:
O F t e c h n i c a l = m a x { t = 1 8 , 760 [   E S O L A R ( t ) + E P V ( t ) + E G S H P ( t ) ] }
where E S O L A R , E P V and E G S H P are the hourly energy production for SOLARs, PVs and GSHPs (kWh).

3.2.3. Environmental Objective

We use the minimization of annual greenhouse gas emissions from the HES as the environmental objective. In this paper, the main potential global-warming pollutants include CO2, CH4 and N2O. Quantities of CH4 and N2O emissions are converted into equivalent quantities of CO2 emission because CO2 is the most significant of substances contributing to the greenhouse effect. Consequently, the total greenhouse gas emissions caused by electricity and gas consumption can be defined as:
O F e n v i r o n m e n t a l = m i n { t = 1 8 , 760 [ F H E S e l e ( t ) × G H G C O 2 e q e l e + F H E S g a s ( t ) × G H G C O 2 e q g a s ] }
where F H E S e l e and F H E S e l e are the energy consumption from electricity and gas, respectively (kWh); G H G C O 2 e q e l e and G H G C O 2 e q g a s are the CO2-equivalent emissions by electricity and gas respectively (kgCO2eq./kWh).

3.3. Constraint Conditions

The constraints restrict each decision variable to take a value within a lower and an upper bound [34]. These bounds constitute a decision variable space. In this paper, the bounds of the decision variables that indicate the types of components are set automatically as the number of the types in the inputted data tables. On the other hand, if any decision vector satisfies constraints, such as the energy balance, it is a feasible solution. Therefore, the bounds of the decision variables that indicate the number of components are not set. The practical design problems contain one or more constraints that must also be satisfied. If these constraints are violated, the solution is not feasible as a design for a HES. In this study, the constraints are categorized into three parts, namely a balance between energy supply and demand in HES operation, the available space to install NRESs, and the penetration of new and renewable energy, which are detailed, respectively as follows.

3.3.1. Energy Balance

In general, engineers design the energy system considering the safety factor as the ratio of a component’s capacity to the maximum expected demand. In addition, the heating, cooling and hot water system of the HES must satisfy their respective energy demands. Therefore, the energy balance of the HES is formulated by Equations (15)–(17). However, the energy balance constraint on the electric power system was not applied because the grid should supply insufficient electric power. Meanwhile, we consider that the designer can establish the fraction of SOLARs and PVs to reflect the design practice as below in Equations (18) and (19):
L H L , p e a k × R p e a k m i n S H L , E H P + S H L , G S H P + S H L , H L S B + S H L , H L H B L H L , p e a k × R p e a k m a x
L C L , p e a k × R p e a k m i n S C L , E H P + S C L , G S H P + S C L , S F A C + S C L , V C C C L C L , p e a k × R p e a k m a x
L H W , p e a k × R p e a k m i n S H L , H W H B L H W , p e a k × R p e a k m a x
0 S S O L A R L H W , p e a k × R S O L A R f r a c t i o n
0 S P V L E L , n o n H V A C , p e a k × R P V f r a c t i o n
where S H L , c o m p o n e n t and S C L , c o m p o n e n t are the installed heating and cooling capacity of each component (kW); S S O L A R and S P V are the installed capacity of a SOLAR and a PV (kW); L H L , p e a k , L C L , p e a k , L H W , p e a k and L E L , n o n H V A C , p e a k are the peak loads of heating, cooling, hot water and non-HVAC electricity, respectively (kW); R p e a k m i n and R p e a k m a x are the minimum and maximum safety factor to the peak load; R S O L A R f r a c t i o n and R P V f r a c t i o n are the amount of energy provided by the SOLARs and PVs each divided by the total energy required.

3.3.2. Available Space to Install NRES

Available space is needed to install new and renewable components such as solar collectors, PV modules and ground heat exchangers. These constraints make the solutions obtained by the optimization method reasonable for practical designs. Available space is defined as:
A S O L A R & P V I n p u t N S O L A R × L S O L A R , j w i d t h × { L S O L A R , j h e i g h t × [ c o s ( β S O L A R ) + s i n ( β S O L A R ) t a n ( h s , w i n t e r ) ] }   + N P V × L P V , j w i d t h × { L P V , j h e i g h t × [ c o s ( β P V ) + s i n ( β P V ) t a n ( h s , w i n t e r ) ] }
A G S H P I n p u t ( L G S H P I n p u t ) 2 × r o u n d u p ( S G S H P , j Q G S H P I n p u t )
where A S O L A R & P V I n p u t and A G S H P I n p u t are the available space to install solar energy systems (SOLARs and PVs) and GSHPs (m2); L S O L A R , j w i d t h , L S O L A R , j h e i g h t , L P V , j w i d t h and L P V , j h e i g h t are the width and height of a certain type of each solar collector and photovoltaic module (m); β S O L A R and β P V are the slope of solar collectors and PV arrays (°); h s , w i n t e r is the meridian altitude in winter season (°);   L G S H P I n p u t and Q G S H P I n p u t are the borehole spacing (m) and the ground thermal conductivity per borehole (kW/m·°C).

3.3.3. Penetration of New and Renewable Energy

In many countries worldwide, the use of NRESs in buildings is becoming obligatory due to the increasing number of regulations. In addition, more building owners and planners automatically install NRESs to construct environmentally friendly buildings or receive incentives from the government. Therefore, the proposed optimization method allows users to select the penetration of renewable energy arbitrarily. Using the mandatory renewable energy program of South Korea, it is defined as:
R H E S R E , m i n t = 1 8 , 760 [ E S O L A R R E ( t ) + E P V R E ( t ) + E G S H P R E ( t ) ] L t o t a l R E × 100 R H E S R E , m a x
where E S O L A R R E , E S O L A R R E and E S O L A R R E are the energy production (kWh), calculated by the mandatory renewable energy program of South Korea, for SOLARs, PVs and GSHPs; R H E S R E , m i n and R H E S R E , m a x are the minimum and maximum penetration rates; L t o t a l R E is the annual total building load predicted by the regulation (kWh).

3.4. Optimization Algorithm

3.4.1. Modified Genetic Algorithm

To optimize the configuration and sizing for HES, real coded NSGA-II [34,35] was used. As mentioned above, the decision variables must be treated as a discrete variable because it represents the type and the number of components. However, in real coded NSGA-II, the discrete variables are able to return to the real variables by genetic operators such as simulated binary crossover (SBX) and polynomial mutation during the evolutionary process [34].
Therefore, this study has suggested a modified crossover and mutation to keep the decision variables discrete while also maintaining the function of the genetic operators as shown in Figure 2. The modified procedure is as follows: first, from the parent chromosome, two genes that show the type and number of each component are changed into one gene that describes the installation capacity. Next, the changed gene is used to perform the existing SBX and polynomial mutation. The method “A” and method “B” indicate the transformation processes of the “number” gene and “type” gene of the parent chromosomes respectively. Here, T n e w is randomly selected among the device types in proximity to the parent’s device type in the inputted data table of each component. Then, it is reverted back to the genes that represent the type and number of component. In the reverting process, the type and number are all changed to guarantee the solution’s variability.
Figure 2. The modified crossover and mutation process.
Energies 08 02924 g002

3.4.2. Implementation of the Optimization Algorithm

The optimization methodology to determine the configuration and sizing for a HES, simultaneously considering economic, technical and environmental objectives as well as satisfying three constraint conditions, was developed using the modified NSGA-II. The developed optimization algorithm is then implemented using a hierarchical structure as shown in Figure 3. The top-down instructions are described as follows:

Step 1: reading input data

In the initial step, required input data are provided. This information includes the system specifications of the HES, hourly weather and load profiles, data to calculate the economic, technical and environmental objective functions and data to evaluate the constraint conditions.

Step 2: initialization of the optimization algorithm

At the second step, genetic algorithm parameters such as the population size, evolutionary generation, crossover probability and mutation probability are presented.
Figure 3. Optimization algorithm scheme to determine the configuration and sizing for HES.
Energies 08 02924 g003

Step 3: generation of an initial population

A random set of Np,set possible individuals are generated corresponding to the decision vectors.

Step 4: evaluation of the constraints

The generated individuals in Step 3 are evaluated by the three constraint conditions described in Section 3.3. The individuals that violate the constraints are removed and the possible individuals are randomly regenerated. Then, an initial population is formed with the set of Np,set possible individuals.

Step 5: select ith individual in the population

Step 6: determine the best control strategy

Each individual of the population codifying the HES is simulated according to the 24 control strategies with order of priority operation as described in Section 2.2. The optimal control strategy using the hybrid heating and cooling system of the individual to minimize LCC is obtained. This process must be implemented for the each individual.

Step 7: calculate the energy consumption of the HES using the mathematical model of each component and their corresponding best control strategy obtained in Step 6.

Step 8: calculate the economic, technical and environmental objective functions of each individual in the population using the simulation results of the HES in step 7 as described in Section 3.2.

Step 9: perform a non-dominated sorting and crowding distance sorting

To sort the population according to the level of non-domination, each individual must be compared with every other individual in the population. The most widely spread individuals are included in the offspring population as many again of parent population by using the crowding distance values from starting with individuals of the first non-dominated front.

Step 10: examine the termination condition

If the maximum number of generations indicated in Step 2 has been reached, the non-dominated solutions at the last generation was obtained as the optimal configurations and sizing for the HES. After that, the execution of the algorithm stops. Otherwise, the individuals in the population then go through a process of evolution such as selection, crossing and mutation and the algorithm is repeated from Step 5.

4. Simulation Results and Discussion

4.1. Simulation Parameters

The proposed optimization methodology, presented in Section 2 and Section 3, was applied for the design and optimal sizing of a HES of an elementary school located in Gimpo at Latitude 22°01'24'' N and Longitude 121°33'26'' E, South Korea.
The annual cooling and heating loads were calculated using the TRNSYS software, and the results are shown in Figure 4a. The annual load for the hot water supply was examined using a data profile of hot water use in elementary school buildings [36], as illustrated in Figure 4b. Meanwhile, this paper separates the electric energy consumed by the devices of the HES from the total consumption of electric energy in a building because they may differ depending on the operation strategy, configuration, type and sizing of the devices. Thus, this algorithm directly calculates the annual electric energy consumption by the HES based on a time-series energetic evaluation. The hourly profile for the rest of the electric energy consumption was obtained using the statistical data for educational buildings [37], as presented in Figure 4c.
Figure 4. Hourly (a) heating and cooling loads; (b) hot water load and (c) electricity load over one year in a case study building located in Gimpo, South Korea.
Energies 08 02924 g004
The meteorological conditions during the year, i.e., the hourly solar irradiation, temperature and wind speed of the location, are illustrated in Figure 5. The average daily solar irradiation is 3.38 kW/m2 and the average hourly air temperature and wind speed are 12.18 °C and 2.83 m/s, respectively.
Figure 5. Hourly (a) solar irradiation; (b) outdoor air temperature and (c) wind speed over one year in Gimpo, South Korea.
Energies 08 02924 g005
The HES of the case study comprises nine types of energy conversion technologies, namely five SOLARs and five HWHBs for hot water supply, seven EHPs and ten GSHPs for heating and cooling, fifteen VCCCs and thirty SFACs for cooling, eighteen HLSBs for heating and heat source of SFACs, nine HLHBs for heating and twenty PVs for electricity production. The types and the respective technical and economical characteristics of the HES components used in the optimization design are shown in the Supplementary Materials (Components and their specification); see Table 1, Table 2, Table 3, Table 4 and Table 5.
Table 1. Technical and economic parameters of the solar collectors for the case study.
ParametersType 0Type 1Type 2Type 3Type 4
Useful gain (kWh/m2 day)2.2282.3612.4172.4442.556
Intercept of the collector efficiency (-)0.72000.72080.74450.70430.7203
Negative of the slope of the collector efficiency (W/m2·°C)4.094.79994.84834.53683.9488
Flow rate of the fluid at standard condition (kg/s)0.04000.03730.03810.03680.0533
Overall height (m)22222.4
Overall width (m)1110.991.18
Lifetime (years)2020202020
Initial cost (1000 KRW/m2)10121012101210121012
Maintenance ratio against the initial cost (%)22222
Table 2. Technical and economic parameters of the PV panels for the case study (at standard test conditions).
ParametersType A (Six) aType B (Six)Type C (Four)Type D (Four)
Maximum power (W)230–255275–300240–255290–305
Open circuit voltage (V)36.8–37.444.1–45.037.3–38.044.7–45.6
Short circuit current (A)8.34–8.858.35–8.608.58–8.848.58–8.92
Voltage at maximum power (V)30.0–30.536.1–36.530.0–30.936.2–36.5
Current at maximum power (A)7.67–8.357.62–8.228.02–8.278.02–8.36
Module efficiency (%)13.9–15.414.0–15.214.4–15.314.6–15.4
Normal operating cell temperature (°C)45 ± 345 ± 345 ± 345 ± 3
Temperature coefficient of power (%/°C)−0.45−0.45−0.43−0.43
Temperature coefficient of voltage (%/°C)−0.32−0.32−0.31−0.31
Temperature coefficient of current (%/°C)0.040.040.050.05
Overall height (m)1.6521.9661.6651.985
Overall width (m)1.0001.0000.9990.999
Lifetime (years)20202020
Initial cost (1000 KRW/kW)4972497249724972
Maintenance ratio against the initial cost (%)1111
Notes: a Type G (Number); G = the group of devices; Number: the number of devices included each group.
Table 3. Technical and economic parameters of the EHPs and GSHPs for the case study.
ParametersEHPGSHP
Types 0–6Types 0–9
Rated cooling capacity (kW)21.5–51.995.9–297.6
Rated heating capacity (kW)25.9–65.094.7–301.8
Rated power consumption in cooling mode (kW)5.6–16.319.3–68.5
Rated power consumption in heating mode (kW)6.5–16.524.4–87.1
Rated COP in cooling mode (-)3.19–3.874.34–5.20
Rated COP in heating mode (-)3.73–4.193.46–4.23
Lifetime (years)1015
Initial cost (1000 KRW/ea.)5,769–10,79622,170–78,650
Maintenance ratio against the initial cost (%)1.51.5
Table 4. Technical and economic parameters of the VCCCs and SFACs for the case study.
ParametersVCCCSFAC
Types 0–14Type A (Fifteen)Type B (Fifteen)
Rated cooling capacity (kW)259–936352–2461352–2461
Rated COP (-)6.181–6.8691.211.36
Lifetime (years)202020
Initial cost (1000 KRW/ea.)126,720–255,42095,481–275,99094,380–287,650
Maintenance ratio against the initial cost (%)222
Table 5. Technical and economic parameters of the HWHBs, HLHBs and HLSBs for the case study.
ParametersHWHBHLHBHLSB
Types 0–4Types 0–8Type A (Six)Type B (Six)Type C (Six)
Rated heating capacity (kW)58–232116–139575–450600–2245600–2245
Rated efficiency (%)83–8691889199
Lifetime (years)1515151515
Initial cost (1000 KRW/ea.)2.629–4.55218,975–44,0229614–29,85430,866–60,27838,203–69,449
Maintenance ratio against the initial cost (%)1.51.51.51.51.5
These devices are commercially available and they are typically used in building energy system applications. Moreover, all devices shown in Table 1, Table 2, Table 3, Table 4 and Table 5 do not have constant size increments as manufactured goods in the actual market. The list of devices included in these tables can be extended by the designer according to the availability of system devices in the commercial marketplace.
The surface of solar collectors is tilted 45° from the horizontal and pointed 55° east of south. The PV panels are assumed to be installed at a slope of 20° and a surface azimuth of 35°, with the ground reflectance of 0.2.
Economic and environmental parameters and assumptions required for the optimization process are summarized in Table 6. Table 7 shows the educational electricity and natural gas tariff for the HES. These data are based on the actual conditions in South Korea. Table 8 shows the values of the three constraint conditions considered the case study. The NSGA-II parameters used for the implementation of the optimization algorithm are: number of generations Ng,set = 2000, Population size Np,set = 50, simulated binary crossover probability = 0.9 and polynomial mutation probability = 0.1.
Table 6. Economic and environmental parameters considered the case study.
ParametersValue
Project lifetime ( n P r o j e c t ) (years)40
Real discount rate ( i ) (%)2.96
Nominal interest rate (%)6.17
Inflation rate (%)3.12
Electricity cost escalation rate ( e e l e ) (%)4.37
Gas cost escalation rate ( e g a s ) (%)6.87
Purchase cost ratio of the pump against the initial cost ( R p u m p I n i t i a l ) (%)10
Maximum SOLAR capacity available to receive the subsidy cost ( A S O L A R M a x ) (m2)1000
Maximum PV capacity available to receive the subsidy cost ( S P V M a x ) (kW)50
Maximum GSHP capacity available to receive the subsidy cost ( S G S H P M a x ) (kW)1000
CO2-equivalent emission by electricity grid (kgCO2eq./MWh)468.92
CO2-equivalent emission by liquid natural gas (kgCO2eq./MWh)202.45
Table 7. Electricity and natural gas tariffs.
ClassificationValue
ElectricityBasic charge6090
Energy charge (KRW/kW)Summer (June, July and August)96.6
Spring/Fall (March, April, May, September, and October)59.8
Winter (November, December, January and February)82.6
Natural gasEnergy charge (KRW/MJ)Summer (May, June, July, August and September)13.7
Spring/Fall (April, October and November)21.7
Winter (December, January, February and March)21.2
Table 8. Constraints values considered the case study.
ClassificationParametersValue
Energy balanceMinimum safety factor to the peak load ( R p e a k m i n ) (%)110
Maximum safety factor to the peak load ( R p e a k m a x ) (%)200
The amount of energy provided by SOLAR ( R S O L A R f r a c t i o n ) (%)60
The amount of energy provided by PV ( R P V f r a c t i o n ) (%)60
Available space to install NRESAvailable space to install SOLAR and PV ( A S O L A R & P V I n p u t ) (m2)1000
Available space to install GSHP ( A G S H P I n p u t ) (m2)3600
Borehole spacing ( L G S H P I n p u t ) (m)6
Ground thermal conductivity per borehole ( Q G S H P I n p u t ) (kW/m·°C)11
Meridian altitude in winter season ( h s , w i n t e r ) (°)29
Penetration of renewable energyMinimum penetration rate ( R H E S R E , m i n ) (%)10
Maximum penetration rate ( R H E S R E , m a x ) (%)100

4.2. Results of Multi-Objective Optimization

By using the developed optimization methodology, a HES for an elementary school located in Gimpo, South Korea has been designed and optimized. Using an Intel(R) Core(TM) i5-2310 @2.90GHz_CPU, and 4 GB memory computer equipped with the Windows 7 operating system, the developed method requires approximately 440 min to optimize the HES of the case study. This computation performance indicates that approximately 55 solutions can be evaluated per second. The solutions obtained by the proposed methodology for a case study are shown in the Supplementary Materials. Figure 6 shows the evolution of the 3D Pareto front for different numbers of GA generation (first, 50th, 100th, 500th, 1000th, 1500th and last Pareto front or generation).
Figure 6. 3D Pareto front evolution through many generations.
Energies 08 02924 g006
The obtained Pareto fronts present the optimum solutions of the design problem for the HES using the objective function indicated in Equations (2), (13) and (14) and the constraints represented in Equations (15)–(22). The variation in the economic, technical and environmental objective functions during the optimization process for a total of 2000 generations can be observed in Figure 7. The objective functions of non-dominated solutions belongings to the first front are plotted against every 20 generations where each generation consists of 50 individuals.
Figure 7. Variation of the objective functions of non-dominated solutions belongings to the first front during 2000 generations: (a) economic objective function; (b) technical objective function; (c) environmental objective function.
Energies 08 02924 g007
As indicated in Figure 6 and Figure 7, it can be seen that there are a wide range of values for objective functions at the beginning of the optimization process (until approximately the 800th generation), which mainly identified and assessed the various possible HESs. In the subsequent generations, the probabilities of identifying new solutions decrease as the recently obtained solutions are unlikely to improve the objective functions. Thus, in the optimization process, the objective function is improved by minutely adjusting the capacity and quantity of the components that form each combination. Subsequently, as generations evolve through genetic operators, the offspring population is continuously generated and Pareto-optimal solutions that are superior to those of the parent population are unlikely to be found. Hence, most Pareto-optimal solutions of the parent population reform the offspring population, thereby leading to an insignificant improvement in values for the objective function. Finally, the algorithm is terminated at the last generation. The values of the economic, technical and environmental objective functions for the last generation are 7717.9–8288.8 million KRW (about 7.142–7.671 million USD), 184.4–243.6 MWh and 456.0–464.6 thousand kgCO2eq., respectively.
As an example, characteristics of the three solutions of the Pareto front for the last generation can be observed in Table 9: Solution 1 is the one with the lowest LCC and RES, Solution 2 is the one with the highest RES and Solution 3 is the one with the lowest GHG emission.
Table 9. Three solutions of the Pareto front for the last generation.
CharacteristicsSolution 1 Lowest LCCSolution 2 Highest RESSolution 3 Lowest Emission
Capacity of SOLAR (m2)291.1 (3 × 147) a291.1 (3 × 147)291.1 (3 × 147)
Heating capacity of HWHB (kW)244.2 (1 × 3)244.2 (1 × 3)244.2 (1 × 3)
Cooling capacity of EHP (kW)684.0 (3 × 18)666.5 (0 × 31)817.0 (0 × 38)
Heating capacity of EHP (kW)822.6 (3 × 18)802.9 (0 × 31)984.2 (0 × 38)
Cooling capacity of GSHP (kW)237.6 (2 × 2)229.4 (1 × 2)229.4 (1 × 2)
Heating capacity of GSHP (kW)223.4 (2 × 2)218.8 (1 × 2)218.8 (1 × 2)
Cooling capacity of VCCC (kW)0.0 (14 × 0)548.0 (8 × 1)259.0 (0 × 1)
Cooling capacity of SFAC (kW)527.4 (4 × 1)527.4 (5 × 1)351.6 (1 × 1)
Heating capacity of HLSB (kW)149.7 (1 × 1)149.7 (1 × 1)149.7 (1 × 1)
Heating capacity of HLHB (kW)0.0 (8 × 0)0.0 (8 × 0)0.0 (8 × 0)
Capacity of PV (kWp)32.5 (11 × 116)39.5 (15 × 134)40.7 (16 × 138)
Operation strategy for heating systems (-)E→G→S bG→E→SG→E→S
Operation strategy for cooling systems (-)E→G→A cE→G→C→AE→G→C→A
Peak hot water load (kW)167.1167.1167.1
Peak heating load (kW)841.5841.5841.5
Peak cooling load (kW)1295.51295.51295.5
Peak electricity load (kW)432.2423.8424.5
Annual hot water load (kWh/year)153,946.1153,946.1153,946.1
Annual heating load (kWh/year)51,466.551,466.551,466.5
Annual cooling load (kWh/year)825,723.9825,723.9825,723.9
Annual electricity load (kWh/year)1,002,324.71,001,201.1999,299.1
Annual gas consumption (m3/year)3937.53729.83729.8
Annual electricity consumption (kWh/year)965,277.5956,533.8953,046.4
Penetration rate of renewable energy (%)10.113.411.9
Life cycle cost (1000 KRW)7,717,885.48,262,113.38,190,571.5
Renewable energy supply (kWh/year)184,386.5243,612.2215,092.9
Greenhouse gas emission (kgCO2eq./year)462,200457,595455,959
Installation space of SOLAR (m2)576576576
Installation space of GSHP (m2)792756756
Installation space of PV (m2)353408424
Notes: a (T × N); T = the type of devices; N: the number of devices; b Operation strategy for heating system depending on sequence (on-off control); E: EHP; G: GSHP; S: HLSB; H: HLHB; c Operation strategy for cooling system depending on sequence (on-off control); E: EHP; G: GSHP; C: VCCC; A: SFAC.
To gain a better insight into the optimal design for the HES, pairwise trade-offs among the objectives were investigated. Note that the economic and environmental objectives were minimized and the technical objective was maximized in this design problem. Figure 8 shows the plot of economic and technical objectives for the last generation. It appears that because the technical objective is maximized and the economic objective is minimized, there is not much of a trade-off between the two objectives for LCC smaller than approximately 7850 million KRW. Thus, for relatively smaller LCC, it is considered that an increase in capacity of the renewable energy system will cause a monotonic increase in LCC in operating the HES. However, a good trade-off occurs for the larger LCC solutions. The plot of economic and environmental objectives is depicted in Figure 9, which show a wide spread of solutions. It is interesting to note that decreasing the annual amount of GHG emissions leads to an increase in the LCC of the HESs and vice versa. Figure 10 shows a trade-off between technical and environmental objectives. It is found that increasing the penetration of renewable energy systems generally leads to decreasing GHG emissions, but a high penetration of renewable energy systems does not necessarily indicate a reduction of GHG emissions. This phenomenon is mainly caused by differences in operation orders and allocated capacities among the components, especially EHP and GSHP. Under HESs of the identical sizing and configuration, if the EHP is operated prior to the GSHP, the amount of energy supplied by the GSHP (the technical objective) decreases. However, given that the working principle for both is the same, the variation in power consumption is insignificant and as a result, changes in greenhouse gas emission (the environmental objective) are also insignificant. Instead, greenhouse gas emissions are more strongly affected by changes in power consumption according to the heat-pump efficiencies of EHP and GSHP.
Therefore, designers can obtain optimum solutions of the design problem for a HES considering economic, technical, and environmental objectives using the optimization method developed in this study and the design parameters of their projects. Then, they can select the solution that represents the most appropriate configuration and sizing for a HES by balancing the competing priorities in the decision-making process, which involves reviewing the characteristics of the suggested solutions.
Figure 8. 2D Pareto front for the last generation: life cycle cost vs. renewable energy supply.
Energies 08 02924 g008
Figure 9. 2D Pareto front for the last generation: life cycle cost vs. CO2-eq. emissions.
Energies 08 02924 g009
Figure 10. 2D Pareto front for the last generation: CO2-eq. emissions vs. renewable energy supply.
Energies 08 02924 g010

5. Conclusions

This paper has presented a methodology to optimize a HES consisting of NRESs and FFESs operated under full-load (heating, cooling, electricity and hot water loads) conditions. A modified genetic algorithm has been applied to the multi-objective design of HES simultaneously considering three objectives: life cycle cost, penetration of renewable energy and greenhouse gas emissions. As an application example, we carried out a design for determining the configuration and sizing of a HES for an elementary school in Gimpo, South Korea. With the case study, a set of trade-off optimal solutions was derived from a number of possible solutions within a reasonable computation time, compared to the prohibitive time required using the complete enumeration method. The trade-offs between multiple conflicting objectives were expounded. It could be helpful to select the best compromise design of a HES by comparing the values of the economic, technical and environmental objective functions of the Pareto-optimal solutions obtained by the proposed optimization methodology. Future work includes a further investigation of characteristics of the different Pareto-optimal solutions and sensitivity analysis of parameters such as the energy charge and the discount rate. Furthermore, additional energy conversion devices, such as wind turbines, fuel cells and combined heat and power, as well as different types of buildings, will have to be considered.

Supplementary Materials

Supplementary materials can be accessed at: https://www.mdpi.com/1996-1073/8/4/2924/s1.

Acknowledgments

This work was supported by the National Research Foundation of Korea (NRF) grant funded by the Korea government (MSIP) (No. 2011-0028990).

Author Contributions

The author Myeong Jin Ko defined the mathematical models, developed the methodology and wrote the full manuscript. The authors Yong Shik Kim, Min Hee Chung and Hung Chan Jeon analyzed and double-checked the results and the whole manuscript.

Conflicts of Interest

The authors declare no conflict of interest.

References

  1. Chwieduk, D. Towards sustainable-energy buildings. Appl. Energy 2003, 76, 211–217. [Google Scholar] [CrossRef]
  2. United State Environmental Protection Agency. EPA Green Building Strategy. Available online: http://www.epa.gov/greenbuilding/pubs/about.htm (accessed on 29 January 2015).
  3. Diaf, S.; Notton, G.; Belhamel, M.; Haddadi, M.; Louche, A. Design and techno-economical optimization for hybrid PV/wind system under various meteorological conditions. Appl. Energy 2008, 85, 968–987. [Google Scholar] [CrossRef]
  4. Koutroulis, E.; Kolokotsa, D.; Potirakis, A.; Kalaitzakis, K. Methodology for optimal sizing of stand-alone photovoltaic/wind-generator systems using genetic algorithms. Sol. Energy 2006, 80, 1072–1088. [Google Scholar] [CrossRef]
  5. Yang, H.; Zhou, W.; Lu, L.; Fang, Z. Optimal sizing method for stand-alone hybrid solar-wind system with LPSP technology by using genetic algorithm. Sol. Energy 2008, 82, 354–367. [Google Scholar] [CrossRef]
  6. Yang, H.; Zhou, W.; Lou, C. Optimal design and techno-economic analysis of a hybrid solar-wind power generation system. Appl. Energy 2009, 86, 163–169. [Google Scholar] [CrossRef]
  7. Dufo-López, R.; Bernal-Agustín, J.L. Design and control strategies of PV-Diesel systems using genetic algorithms. Sol. Energy 2005, 79, 33–46. [Google Scholar] [CrossRef]
  8. Bernal-Agustín, J.L.; Dufo-López, R. Design of isolated hybrid systems minimizing costs and pollutant emissions. Renew. Energy 2006, 31, 2227–2244. [Google Scholar] [CrossRef]
  9. Bernal-Agustín, J.L.; Dufo-López, R. Multi-objective design and control of hybrid systems minimizing costs and unmet load. Electr. Power Syst. Res. 2009, 79, 170–180. [Google Scholar] [CrossRef]
  10. Dufo-López, R.; Bernal-Agustín, J.L.; Yusta-Loyo, J.M.; Domínguez-Navarro, J.A.; Ramírez-Rosado, I.J.; Lujano, J.; Aso, I. Multi-objective optimization minimizing cost and life cycle emissions of stand-alone PV-wind-diesel systems with batteries storage. Appl. Energy 2011, 88, 4033–4041. [Google Scholar] [CrossRef]
  11. Chen, H.C. Optimum capacity determination of stand-alone hybrid generation system considering cost and reliability. Appl. Energy 2013, 103, 155–164. [Google Scholar] [CrossRef]
  12. Zhao, B.; Zhang, X.; Li, P.; Wang, K.; Xue, M.; Wang, C. Optimal sizing, operating strategy and operational experience of a stand-alone microgrid on Dongfushan Island. Appl. Energy 2014, 113, 1656–1666. [Google Scholar] [CrossRef]
  13. Perera, A.T.D.; Wickremasinghe, D.M.I.J.; Mahindarathna, D.V.S.; Attalage, R.A.; Perera, K.K.C.K.; Bartholameuz, E.M. Sensitivity of internal combustion generator capacity in standalone hybrid energy systems. Energy 2012, 39, 403–411. [Google Scholar] [CrossRef]
  14. Perera, A.T.D.; Attalage, R.A.; Perera, K.K.C.K.; Dassanayake, V.P.C. Converting existing internal combustion generator (ICG) systems into HESs in standalone applications. Energy Convers. Manag. 2013, 74, 237–248. [Google Scholar] [CrossRef]
  15. Perera, A.T.D.; Attalage, R.A.; Perera, K.K.C.K.; Dassanayake, V.P.C. Designing standalone hybrid energy systems minimizing initial investment, life cycle cost and pollutant emission. Energy 2013, 54, 220–230. [Google Scholar] [CrossRef]
  16. Perera, A.T.D.; Attalage, R.A.; Perera, K.K.C.K.; Dassanayake, V.P.C. A hybrid tool to combine multi-objective optimization and multi-criterion decision making in designing standalone hybrid energy systems. Appl. Energy 2013, 107, 412–425. [Google Scholar] [CrossRef]
  17. Dufo-López, R.; Bernal-Agustín, J.L.; Contreras, J. Optimization of control strategies for stand-alone renewable energy systems with hydrogen storage. Renew. Energy 2007, 32, 1102–1126. [Google Scholar] [CrossRef]
  18. Dufo-López, R.; Bernal-Agustín, J.L. Multi-objective design of PV-wind-diesel-hydrogen-battery systems. Renew. Energy 2008, 33, 2559–2572. [Google Scholar] [CrossRef]
  19. Katsigiannis, Y.A.; Georgilakis, P.S.; Karapidakis, E.S. Multiobjective genetic algorithm solution to the optimum economic and environmental performance problem of small autonomous hybrid power systems with renewables. IET Renew. Power Gener. 2010, 4, 404–419. [Google Scholar] [CrossRef]
  20. Nosrat, A.; Pearce, J.M. Dispatch strategy and model for hybrid photovoltaic and trigeneration power systems. Appl. Energy 2011, 88, 3270–3276. [Google Scholar] [CrossRef]
  21. Rubio-Maya, C.; Uche-Marcuello, J.; Martínez-Gracia, A.; Bayod-Rújula, A.A. Design optimization of a polygeneration plant fuelled by natural gas and renewable energy sources. Appl. Energy 2011, 88, 449–457. [Google Scholar] [CrossRef]
  22. Wang, J.J.; Zhai, Z.J.; Jing, Y.Y.; Zhang, C.F. Particle swarm optimization for redundant building cooling heating and power system. Appl. Energy 2010, 87, 3668–3679. [Google Scholar] [CrossRef]
  23. Morini, M.; Pinelli, M.; Spina, P.R.; Venturini, M. Optimal allocation of thermal, electric and cooling loads among generation technologies in household applications. Appl. Energy 2013, 112, 205–214. [Google Scholar] [CrossRef]
  24. Barbieri, E.S.; Dai, Y.J.; Pinelli, M.; Spina, P.R.; Sun, P.; Wang, R.Z. Optimal sizing of a multi-source energy plant for power heat and cooling generation. Appl. Therm. Eng. 2014, 71, 736–750. [Google Scholar] [CrossRef]
  25. Buoro, D.; Pinamonti, P.; Reini, M. Optimization of a Distributed Cogeneration System with solar district heating. Appl. Energy 2014, 124, 298–308. [Google Scholar] [CrossRef]
  26. Erdinc, O.; Uzunoglu, M. Optimum design of hybrid renewable energy systems: Overview of different approaches. Renew. Sustain. Energy Rev. 2012, 16, 1412–1425. [Google Scholar] [CrossRef]
  27. Konak, A.; Coit, D.W.; Smith, A.E. Multi-objective optimization using genetic algorithms: A tutorial. Reliab. Eng. Syst. Saf. 2006, 91, 992–1007. [Google Scholar] [CrossRef]
  28. Alonso, M.; Amaris, H.; Alvarez-Ortega, C. Integration of renewable energy sources in smart grids by means of evolutionary optimization algorithms. Expert Syst. Appl. 2012, 39, 5513–5522. [Google Scholar] [CrossRef]
  29. Fadaee, M.; Radzi, M.A.M. Multi-objective optimization of a stand-alone hybrid renewable energy system by using evolutionary algorithms: A review. Renew. Sustain. Energy Rev. 2012, 16, 3364–3369. [Google Scholar] [CrossRef]
  30. Duffie, J.A.; Beckman, W.A. Solar Engineering of Thermal Processes, 3rd ed.; Willey: Hoboken, NJ, USA, 2006. [Google Scholar]
  31. Jun-Hong, B. The Development, Implementation, and Application of Demand Side Management and Control (DSM+c) Algorithm for Integrating Micro-Generation System within Built Environment. Ph.D. Thesis, University of Strathclyde, Glasgow, UK, 2009. [Google Scholar]
  32. Kasuda, T.; Archenbach, P.R. Earth Temperature and Thermal Diffusivity at Selected Stations in the United State; National Bureau of Standards: Washington, DC, USA, June 1965. [Google Scholar]
  33. A TRaNsient SYtems Simulation Program. Available online: http://sel.me.wisc.edu/trnsys (accessed on 29 January 2015).
  34. Deb, K. Multi-Objective Optimization Using Evolutionary Algorithms; Willey: Chichester, UK, 2009. [Google Scholar]
  35. Kanpur Genetic Algorithms Laboratory. Available online: http://www.iitk.ac.in/kangal/codes.shtml (accessed on 29 January 2015).
  36. National Renewable Energy Laboratory. Available online: http://www.nrel.gov/docs/fy11osti/46861.pdf (accessed on 29 January 2015).
  37. Korea Energy Management Corporation. Available online: http://www.kemco.or.kr (accessed on 29 January 2015).

