1. Introduction
Wind energy is a rapid growing industry in the renewable energy sector with large the potential to contribute significantly to future energy production. A main focus for wind turbine manufacturers and operators is how to increase the reliability of wind turbines and to decrease their cost. Hence, cheaper and more efficient wind turbine components have to be developed to have an optimal balance between initial costs related to required reliability level on the one hand and the cost of operation and maintenance on the other hand. In order to perform this optimization, it is important to be able to estimate the reliability of the components.
Wind turbines, depending on whether placed in offshore or onshore locations, are exposed to wave excitations, highly dynamic wind loads and the wakes from other wind turbines. Therefore, most components in a wind turbine experience highly dynamic and time-varying loads. These components may fail due to wear or fatigue and this can lead to unplanned shutdown repairs that are very costly. The design of mechanical components in the wind turbine drivetrain by deterministic methods using safety factors is generally unable to account for the many uncertainties. Thus, a reliability assessment should be based on probabilistic methods where stochastic modeling of failures is performed.
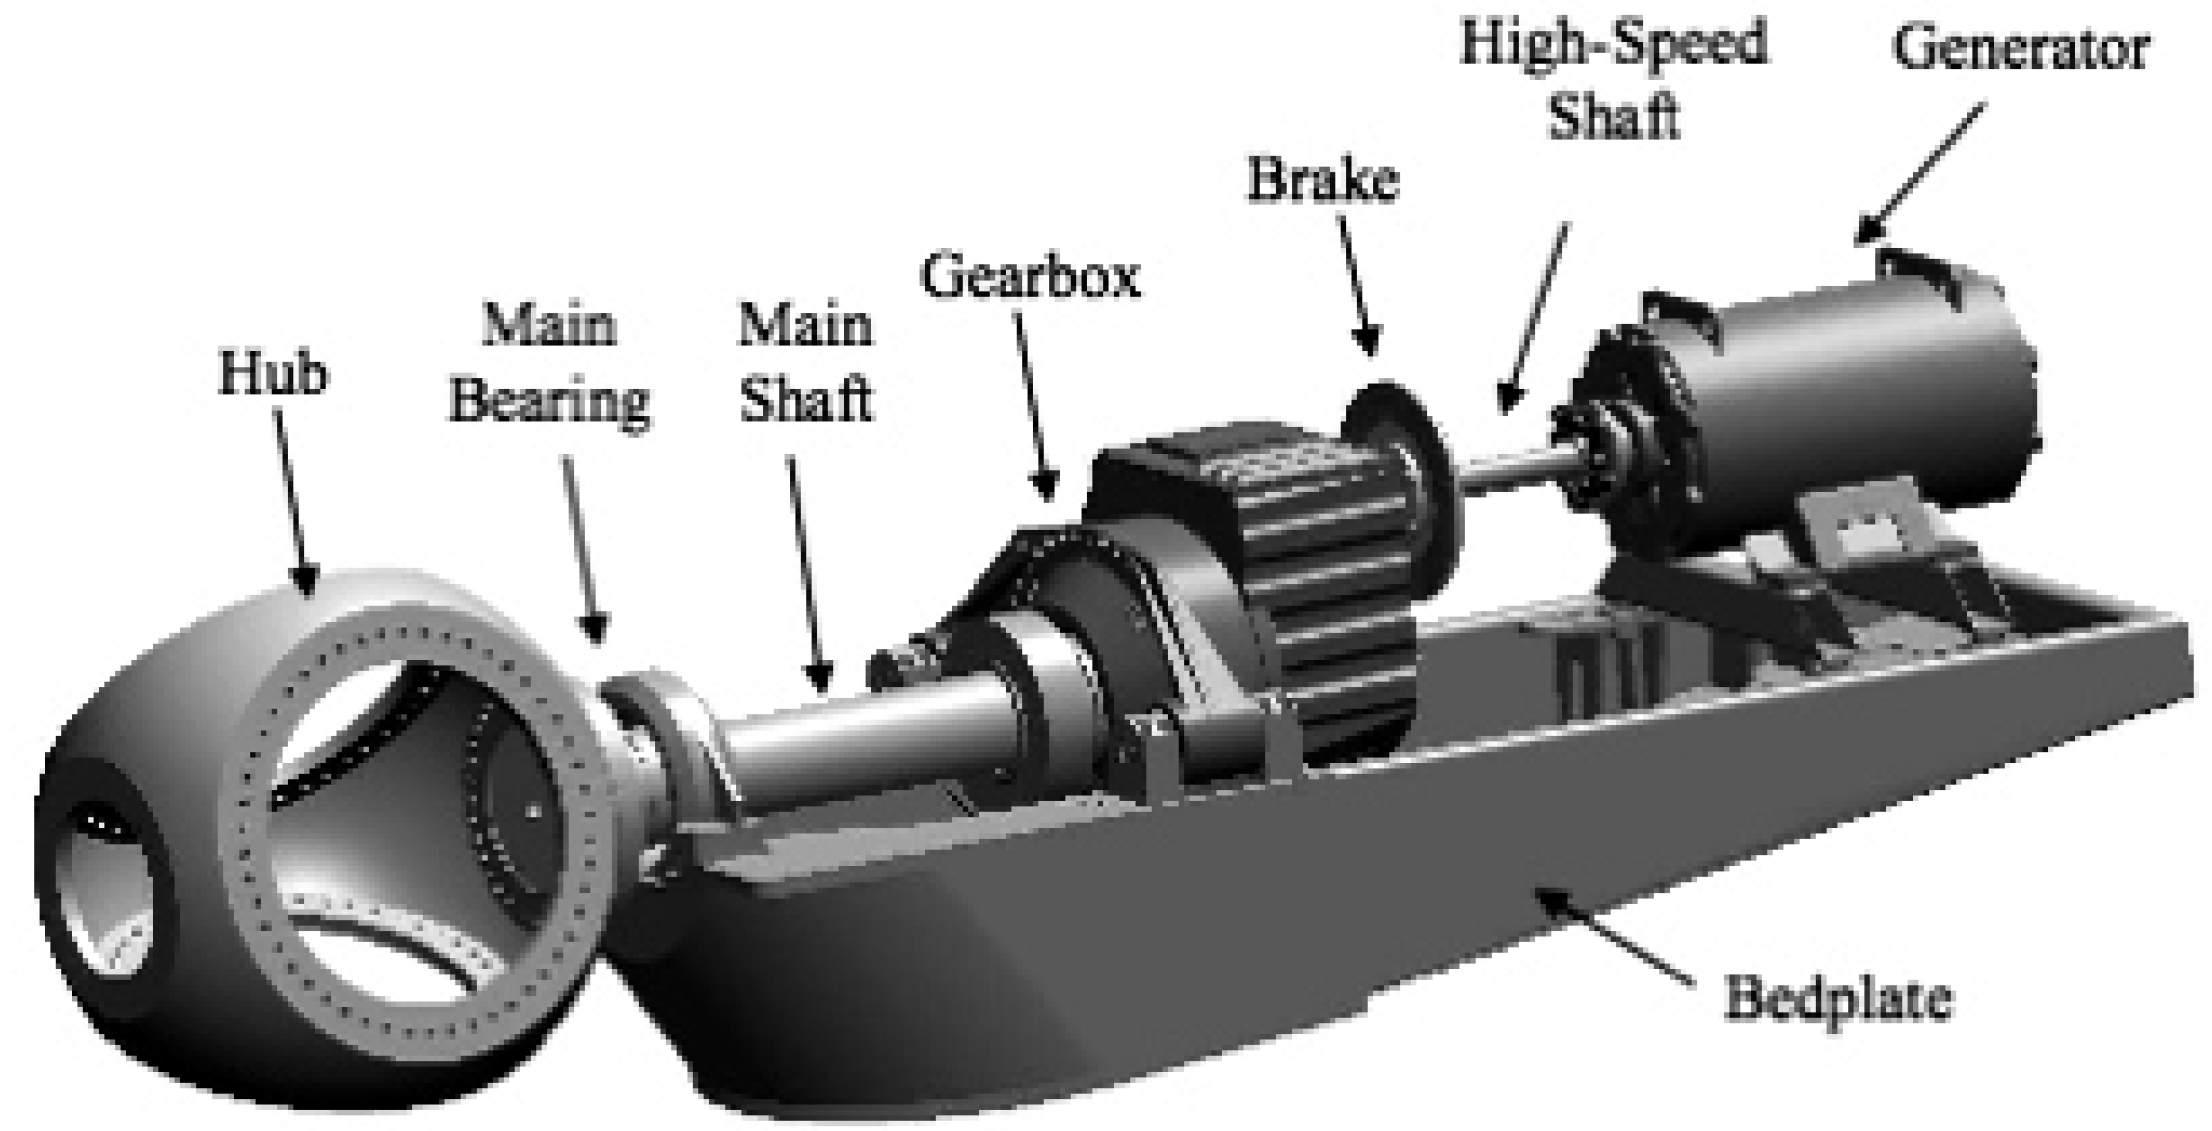
The most common drivetrain configuration consists of the main shaft, the main bearings, the gearbox and the generator, see [
1]. Modeling of the reliability of drivetrain component failures is important for predicting the expected time-to-failure which is an important indicator to be used in planning of operation and maintenance. In order to estimate the probability of failure of the drivetrain components careful modeling of the aleatory (physical) and epistemic (model, statistical and measurement) uncertainties has to be performed, see e.g., [
2,
3].
The reliability of wind turbine gearboxes has been studied in a number of research projects, e.g., the Gearbox Reliability Collaboration (GRC) project at the U.S. National Renewable Energy Laboratory (NREL) [
4]. This includes important research areas on fault diagnosis and condition monitoring. Several methods have been investigated, such as vibration and acoustic emissions [
5] and local mean decomposition [
6]. Some studies on probabilistic modeling of failures in wind turbine drivetrain components have been carried out, e.g., [
7,
8] but without a detailed stochastic modeling of the uncertainties related to the parameters in the limit state equations modeling each failure mode.
This paper focuses on probabilistic models and the stochastic modeling of fatigue lives in the wind turbine drivetrain using structural reliability methods, see [
9], allowing a rational modeling of all uncertainties. An important aspect in modeling fatigue failure of large cast steel components is to take into account scale effects. Two approaches are considered in this paper for stochastic modeling of the fatigue life including scale effects. One method is based on the classical Weibull approach and the other on application of a log-normal distribution as done, e.g., for the fatigue life of welded steel details. The statistical parameters in both models are estimated and applied in reliability assessments.
3. Fatigue Strength Modeled by a Log-Normal Distribution
Fatigue failures typically occur due to the application of fluctuating stresses much lower than the stress required to cause failure during a single application of the stress. The fatigue life is the number of cycles to failure at a specified stress level, while the fatigue strength is the stress level below which failure does not occur for the given number of cycles. As the applied stress level decreases, the number of cycles to failure increases. The fatigue strength of metals is often assumed to follow the Basquin equation (the equation is based on fully reversed fatigue (
R = −1), and the mean value is zero) [
12]:
where
σa is the alternating stress amplitude,
σf is the fatigue strength coefficient,
N is the number of load cycle, and 1/
m is the fatigue strength exponent.
The probability of failure increases when the volume of the component increases due to scale effects and because the probability of finding a critical micro-crack increases [
8]. Thus the geometrical size effect affects the resistance of materials against fatigue failure. Hence,
σa is affected by geometrical size effects and can be modeled by the following equation, see e.g., [
8]. According to this Equation (1) can be written as [
13]:
where
V0 is the reference volume and
is the alternative fatigue strength amplitude corresponding to reference volume of
V0. The exponent
bn determines the effect of the specimen size on the fatigue life and
V is the volume of component. In a log-log format Equation (2) is linear and can be rewritten introducing an uncertainty term
ε, see [
13]:
where
ε is assumed to be normal distributed with mean value = 0 and standard deviation =
σε.
ε models the scatter in fatigue life and can be considered here to cover both physical and model uncertainties related to imperfect knowledge or idealizations of the mathematical models used or uncertainty related to the choice of probability distribution types for the stochastic variables. It is noted that the test data applied in the example below do not allow a bilinear
SN curve to be fitted; but the above model can easily be extended to model a bi-linear
SN curve and a lower threshold.
The parameters in (3) can be estimated using available test data. In this paper, test data extracted from Shirani [
14] are used to exemplify the procedure for the stochastic modeling. Assuming that the Shirani data are representative the results of the statistical analysis can also be used to assess the reliability level for drivetrain components and to calibrate safety factors, see below.
In the following, the Maximum Likelihood Method is used for the statistical analysis. The log-likelihood function as a function of the statistical parameters
σf,
m, and
σε to be estimated is written as follows accounting both for tests results where failure occurs and test results where failure does not occur (run-outs) (note, the uncertainty related to
σf and
m model statistical uncertainties and
ε models model uncertainty):
where
ni is the number of stress cycles to failure or run-out (no failure) with stress range equal to
in test number
i.
nF is the number of tests where failure occurs, and
nR is the number of tests where failure does not occur after
ni stress cycles (run-outs).
n =
nF +
nR is the total number of tests.
σf,
m, and
σε are estimated solving the optimization problem: max
L(
σf,
m,
σε). This can be done using a standard nonlinear optimizer, e.g., the NLPQL algorithm, see [
15].
Since the parameters
σf,
m and
σε are estimated by the maximum-likelihood technique, they become asymptotically (number of data should be larger than 25–30) normally distributed stochastic variables with expected values equal to maximum-likelihood estimates and covariance matrix equal to, see [
16]:
where
is the Hessian matrix with second-order derivatives of the log-likelihood function.
,
σm and
denote the standard deviation of
σf,
m and
σε respectively and
indicates correlation coefficients. Alternatively to the log-normal model for the
SN curve a Weibull model can be used, as described in the next section.
5. Characteristic Values
In deterministic approaches, code-based design safety is introduced though application of deterministic values in terms of characteristic values and safety factors to obtain design values of both loads and strengths. In the following a probabilistic basis is used to estimate the characteristic values by modeling of physical, measurement, statistical and model uncertainties.
If statistical uncertainty is not taken into account then corresponding to a stress range, a characteristic value of the fatigue life, nc defined as the 5% quantile can be estimated directly from the distribution function of the fatigue life.
If statistical uncertainty is to be taken into account and the physical/model uncertainties for the fatigue life are modeled by a log-normal distribution then the characteristic value for the fatigue life,
nc corresponding to the stress range,
defined as a 5% quantile can obtained from by:
with a corresponding limit state equation written as:
Here,
ε,
m,
σε and
σf are modeled as stochastic variables as described above. For given
Equation (10) can be solved with respect to the characteristic fatigue life,
nc using e.g., First Order Reliability Methods (FORM, see [
9]).
Similarly, if the fatigue life is modeled by a Weibull distribution and statistical uncertainty is accounted for, and then the characteristic value can be estimated using the following limit state equation:
In equation (11), ε, σε, m and σf model the physical/model and statistical uncertainties, respectively. As mentioned before, these parameters can be obtained from test results.
6. Reliability Analysis
Reliability of a component can be defined as the probability that the component under consideration has a proper performance throughout its lifetime. Structural reliability methods can be used to estimate the probability of failure/reliability which next can be used for decision-making, e.g., with respect to design or planning of inspections, maintenance and repair.
The reliability estimated as a measure of the safety of a structure can be used in a decision process (for example Markov decision process [
17]). A lower level of the acceptable reliability can be used as a constraint in a reliability-based optimal design problem. The lower level of the reliability can be obtained by analyzing similar structures designed after current design practice or it can be determined as the reliability level giving the largest utility (benefits-costs) when solving a decision problem where all possible costs and benefits in the expected lifetime of the structure are taken into account. Further, the reliability and failure rate of components can be used for decision making for maintenance plans [
18].
Drivetrain components are typically exposed to complex loading conditions, [
12]. Often the fatigue load is due to a range of fluctuating loads, different mean stress levels and variable frequencies. Cumulative damage theories consider the fatigue process to be one of damage accumulation until the life of the component is exhausted. Cumulative damage during fatigue is often modeled by using the Palmgren-Miner rule, which assumes that the total life of a part can be estimated by adding up the percentage of life consumed by each stress level [
12] and can be written as follows if used in a deterministic code-based verification:
where
ni,S represent the number of cycles per year at a specific stress level
σa0,i and
TL is the design lifetime. It is assumed that for a wind turbine component the total number of stress ranges for a given fatigue critical detail can be grouped in
nσ groups/intervals such that the number of stress ranges in group
i is
ni,S per year. (
σa0,i,
ni,S) can be obtained by rain-flow counting and can be represented by so-called ‘Markov matrices’. Further,
is the 5% quantile of the number of cycles to failure given fatigue load equal to
and given the design fatigue strength
.
N0;0.05 can be obtained both without and with statistical uncertainty included.
z is a design / scaling parameter, e.g., related to a cross-sectional parameter;
is a partial safety factor for fatigue.
In this paper, the Level II method is used to measure the reliability of the components [
9]. The design parameter
z is obtained from (12) assuming that a fatigue partial safety factor
is given. Thereby the reliability analyses become normalized in the way that the reliability is linked to the partial safety factors and it is assumed that the structure is designed to the limit though the design parameter
z in the design equation. The corresponding limit state equation to be used in the reliability analysis is written:
where
t is time (in years), Δ models model uncertainty related to Miner’s rule for linear damage accumulation. The distribution function for number of cycles to failure,
N0;0.05 for given stress
σa,i can be obtained by equations (10) and (11) for log-normal and Weibull distributed fatigue lives. If statistical uncertainty is included then the statistical parameters are modeled by stochastic variables.
XW is a stochastic variable modeling model uncertainty related to determination of fatigue loads and
XSCF is a stochastic variable modeling model uncertainty related to determination of stresses given fatigue loads. For wind turbines the fatigue loads are typically estimated for mean wind speeds from 4 m/s to 25 m/s and are normally represented by time series of load effects or equivalently by Markov matrices obtained by rain-flow counting. In the example below these loads are extracted from simulated loads for the main shaft of a 5 MW wind turbine for each mean wind speed
Vj. The hub diameter is 3 meter and the rotor has a diameter of 126 meter. The hub height is 90 meter. The cut-in and cut-out wind speeds are 3 m/s and 25 m/s, respectively. Further information can be found in reference [
19].
Based on the geometry of the component (main shaft) and the load matrices, the stress amplitudes have been calculated. The calculated values are not fully reversed stress amplitude. Hence, the Goodman equation is used to find the effective fully reversed stress amplitudes for each mean speed.
Equation (12) is thus rewritten:
where,
Vj is the mean wind speed and
P(
Vj) is probability of occurrence of this mean wind speed, modelled by a Weibull distribution according to IEC 61400-1 [
20]. In the example below, the scale and shape parameters of Weibull distribution have been chosen to 11.48 [m/s] and 1.75, respectively [
21]. By substituting Equation (14) in Equation (13), the limit state equation can be written:
In Equation (15), Δ,
XW and
XSCF are assumed to be log-normal distributed with mean values equal 1 and coefficients of variation
COVΔ,
COVW and
COVSCF, respectively, following the recommendations in [
22]. The coefficient of variations are estimated based partly subjectively, but following generally the recommendations used as basis for the material partial safety factors in IEC 61400-1, and also considering information from e.g., DNV-RP-C203 [
23] although this is not directly related to the fatigue problem considered in this paper. The importance of the choices of the coefficient of variations is investigated by sensitivity analyses. It is noted that the reliability level obtained is in accordance with the target reliability corresponding to an annual probability of failure of the order 5 × 10
−4 (annual reliability index: 3.3) [
20].
Table 1 shows the representative stochastic model. Expected values and coefficient of variations for
m and
σf are extracted from tests results as described above. Based on Equation (15), the probability of failure in the time interval [0,
t] can be estimated by FORM/SORM techniques or simulation, see e.g., [
9]. The reliability index,
β(
t) corresponding to the accumulated probability of failure
PF(
t) is defined by:
where Φ( ) is the standardized normal distribution function. The annual probability of failure conditioned on survival up to time
t is obtained from:
where Δ
t is a time increment, typically 1 year. The reliability index, Δ
β corresponding to the probability Δ
PF is denoted the annual reliability index when Δ
t = 1 year.
Table 1.
Stochastic model.
Table 1.
Stochastic model.
| Variable | Definition | Distribution | Expected Value | Coefficient of variation |
|---|
| Δ | Model uncertainty related to Miner’s rule | LN * | 1 | 0.2 |
| XSCF | Model uncertainty related to determination of stresses given fatigue load | LN | 1 | 0.05 |
| XW | Model uncertainty related to determination of fatigue loads | LN | 1 | 0.1 |
| m | Statistical uncertainty | N ** | Extracted from test results |
| σf [MPa] | Statistical uncertainty | N | Extracted from test results |
7. Results
As mentioned above the test data by Shirani [
14] will be used to illustrate the above statistical analysis and reliability assessment for wind turbine drivetrain components. The test data follows the specifications listed in
Table 2. Two series of specimens were machined from T95 block (the cast block dimensions were 750 mm × 200 mm × 95 mm), and T150 block (the cast block dimensions were 150 mm × 300 mm × 150 mm), specimens with 21 mm diameter. Specimens were tested at load ratios
R = −1 (with
R defined by
) [
14].
Table 2.
The test plan [
14].
Table 2.
The test plan [14].
| Material | Load Ratio | Specimen [mm] | Number of specimens | Test frequency [Hz] |
|---|
| T95 | −1 | Ø21 | 12 | 10 |
| T150 | −1 | Ø21 | 18 | 10 |
The statistical analysis is performed following the methodology described in section 3 and 4 for estimation of the parameters in the log-normal and Weibull models. The results using the log-normal distribution model (Equations (6) and (7)) are shown in
Table 3.
Table 3.
Estimated statistical parameters from tests with log-normal model for fatigue life.
Table 3.
Estimated statistical parameters from tests with log-normal model for fatigue life.
| Test | σf [MPa] | m | σε |
|---|
| Mean | Std dev | mean | Std dev | mean | Std dev |
|---|
| D21 T95 R = −1 | 941 | 50.5 | 9.4 | 0.33 | 0.25 | 0.01 |
| D21 T150 R = −1 | 697 | 67.9 | 10.7 | 0.83 | 0.23 | 0.04 |
As mentioned in
Table 2, the tests “D21 T95 R = −1” and “D21 T150 R = −1” are done with the same frequency and the same load ratio. Hence, these two tests can be used to study the changes of volume/size effects on the fatigue strength. Moreover, the correlation matrixes of the statistical parameters for these two tests are shown below for illustration.
It is seen that
σf and
m are highly negative correlated (as expected). Next, the statistical uncertainties of fitted parameters using the Weibull distribution to model the fatigue life are extracted using the Maximum Likelihood Method. The results are shown in
Table 4.
Table 4.
Estimated statistical parameters from tests with Weibull model for fatigue life.
Table 4.
Estimated statistical parameters from tests with Weibull model for fatigue life.
| Test | σf [MPa] | m |
|---|
| mean | Std dev | mean | Std dev |
|---|
| D21 T95 R = −1 | 979 | 8.18 | 9.2 | 0.05 |
| D21 T150 R = −1 | 686 | 5.76 | 10.9 | 0.07 |
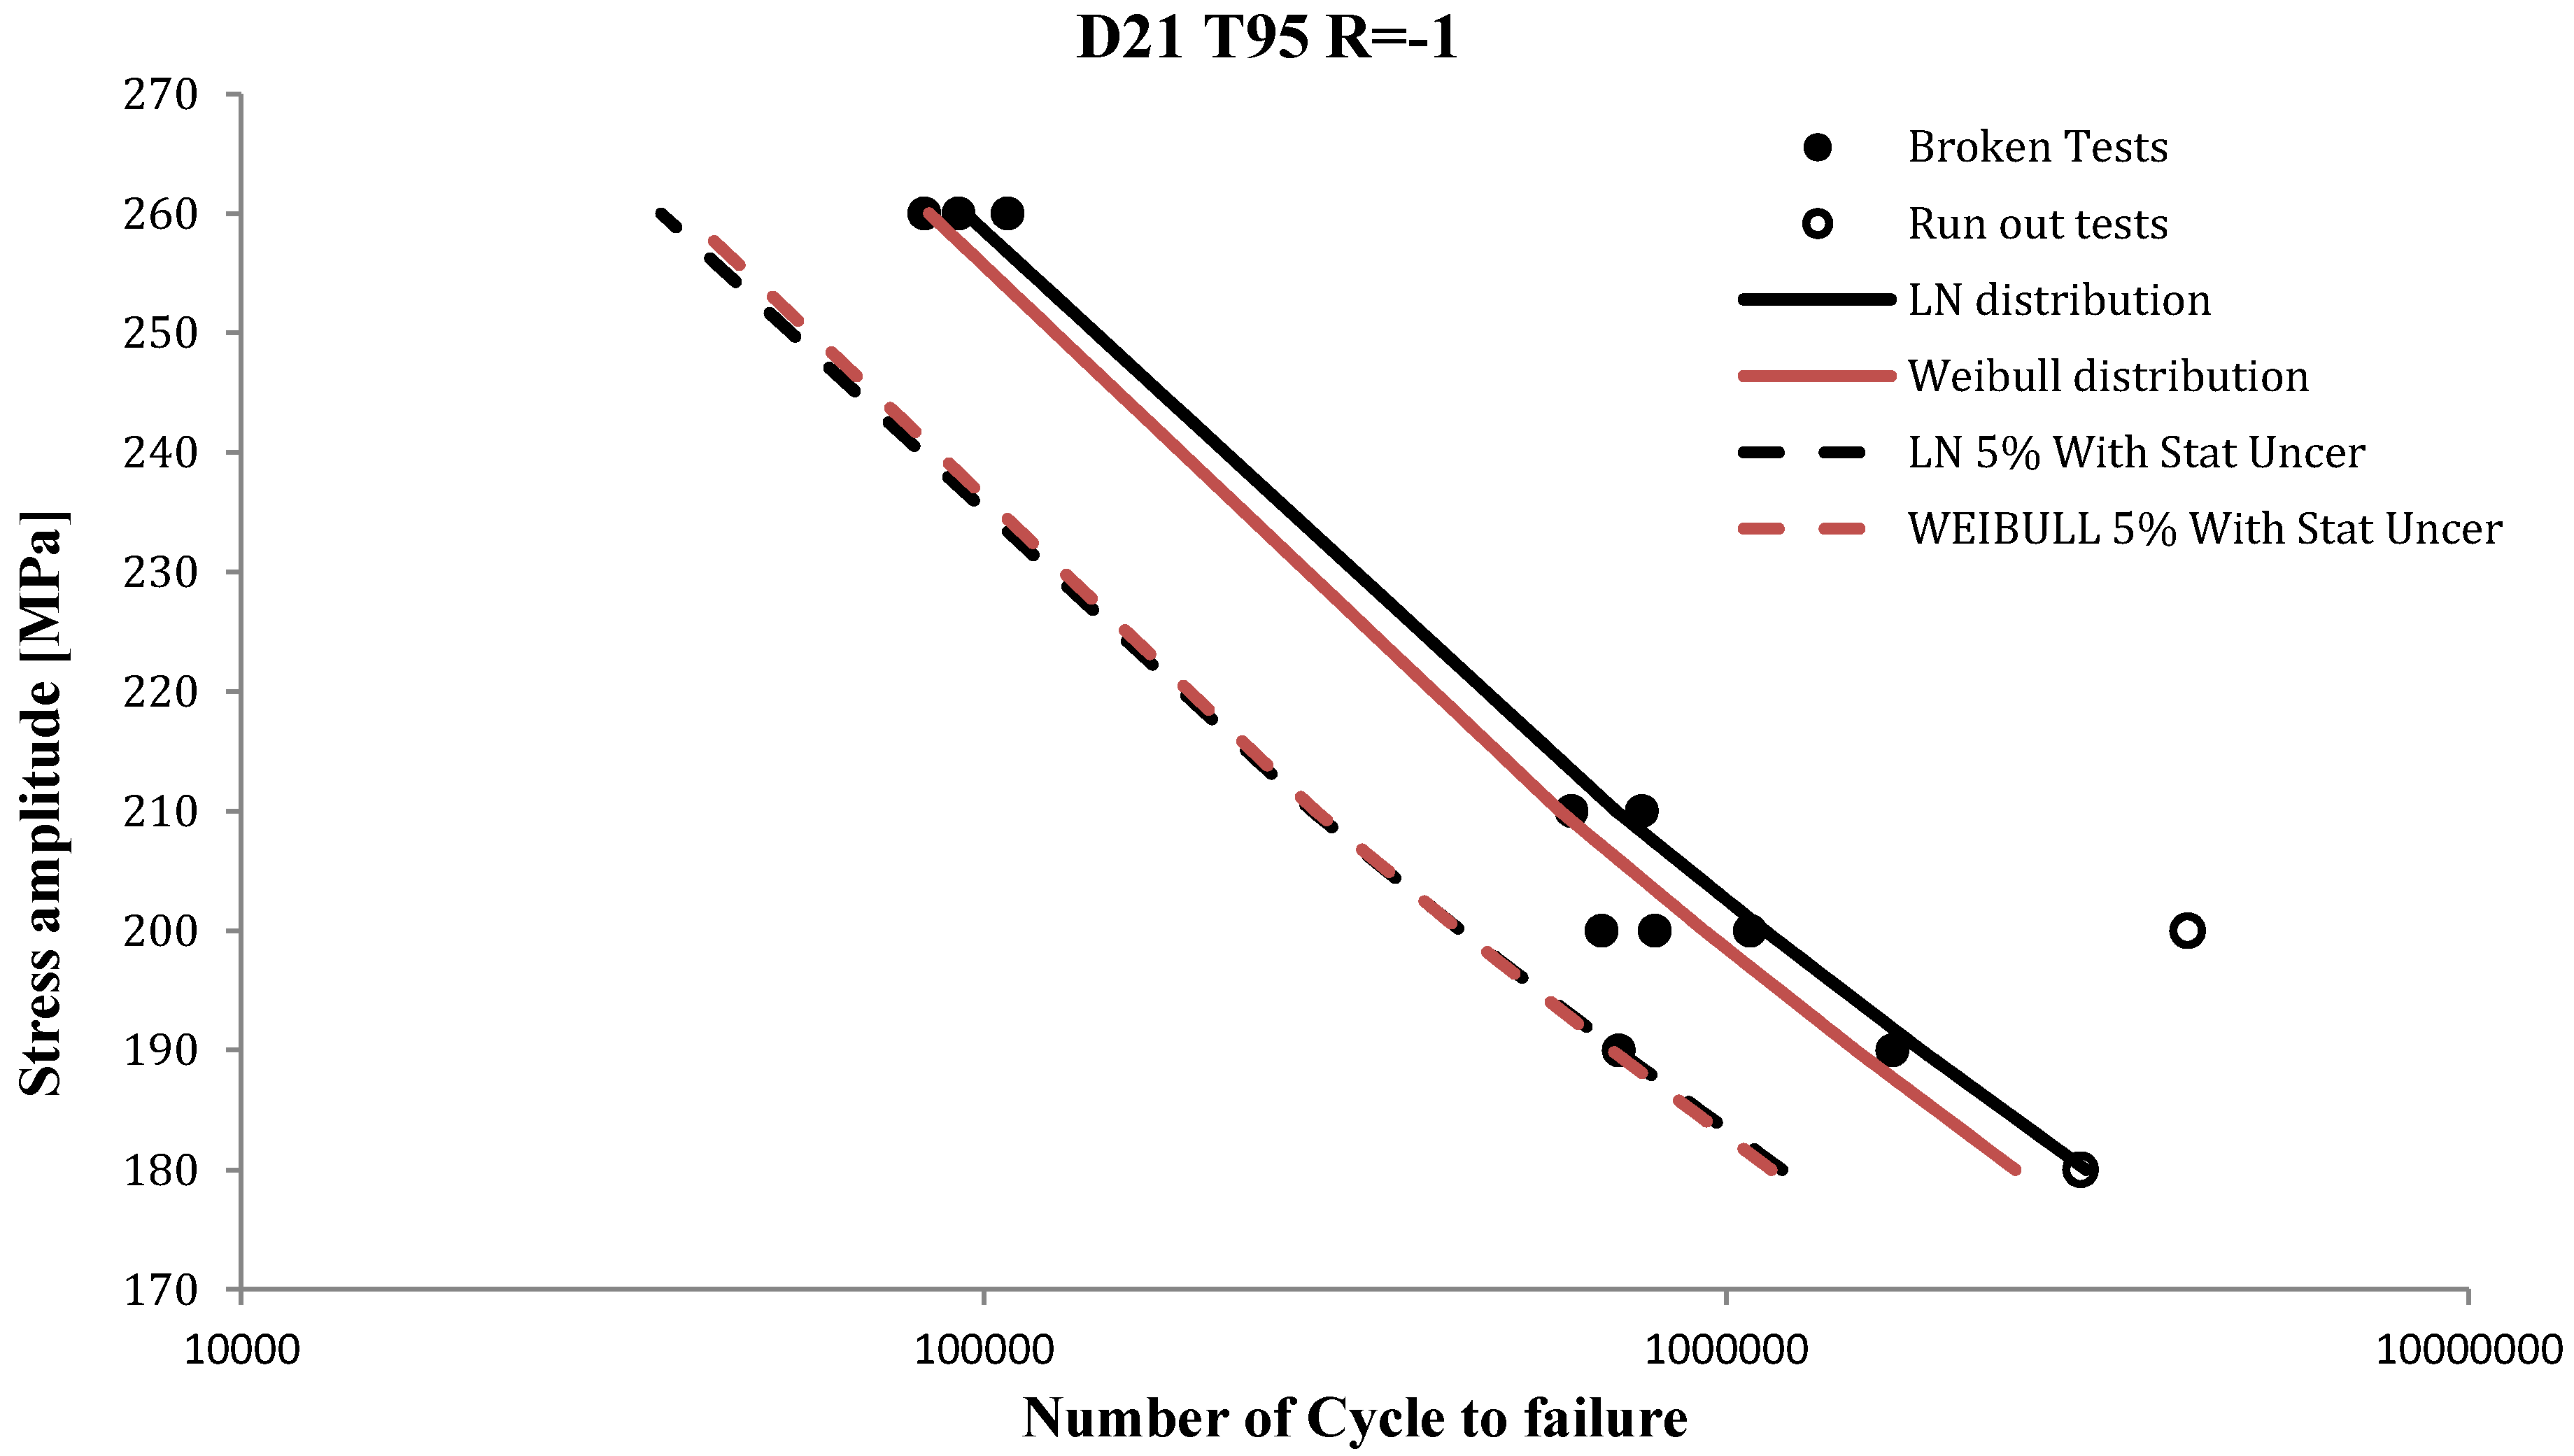
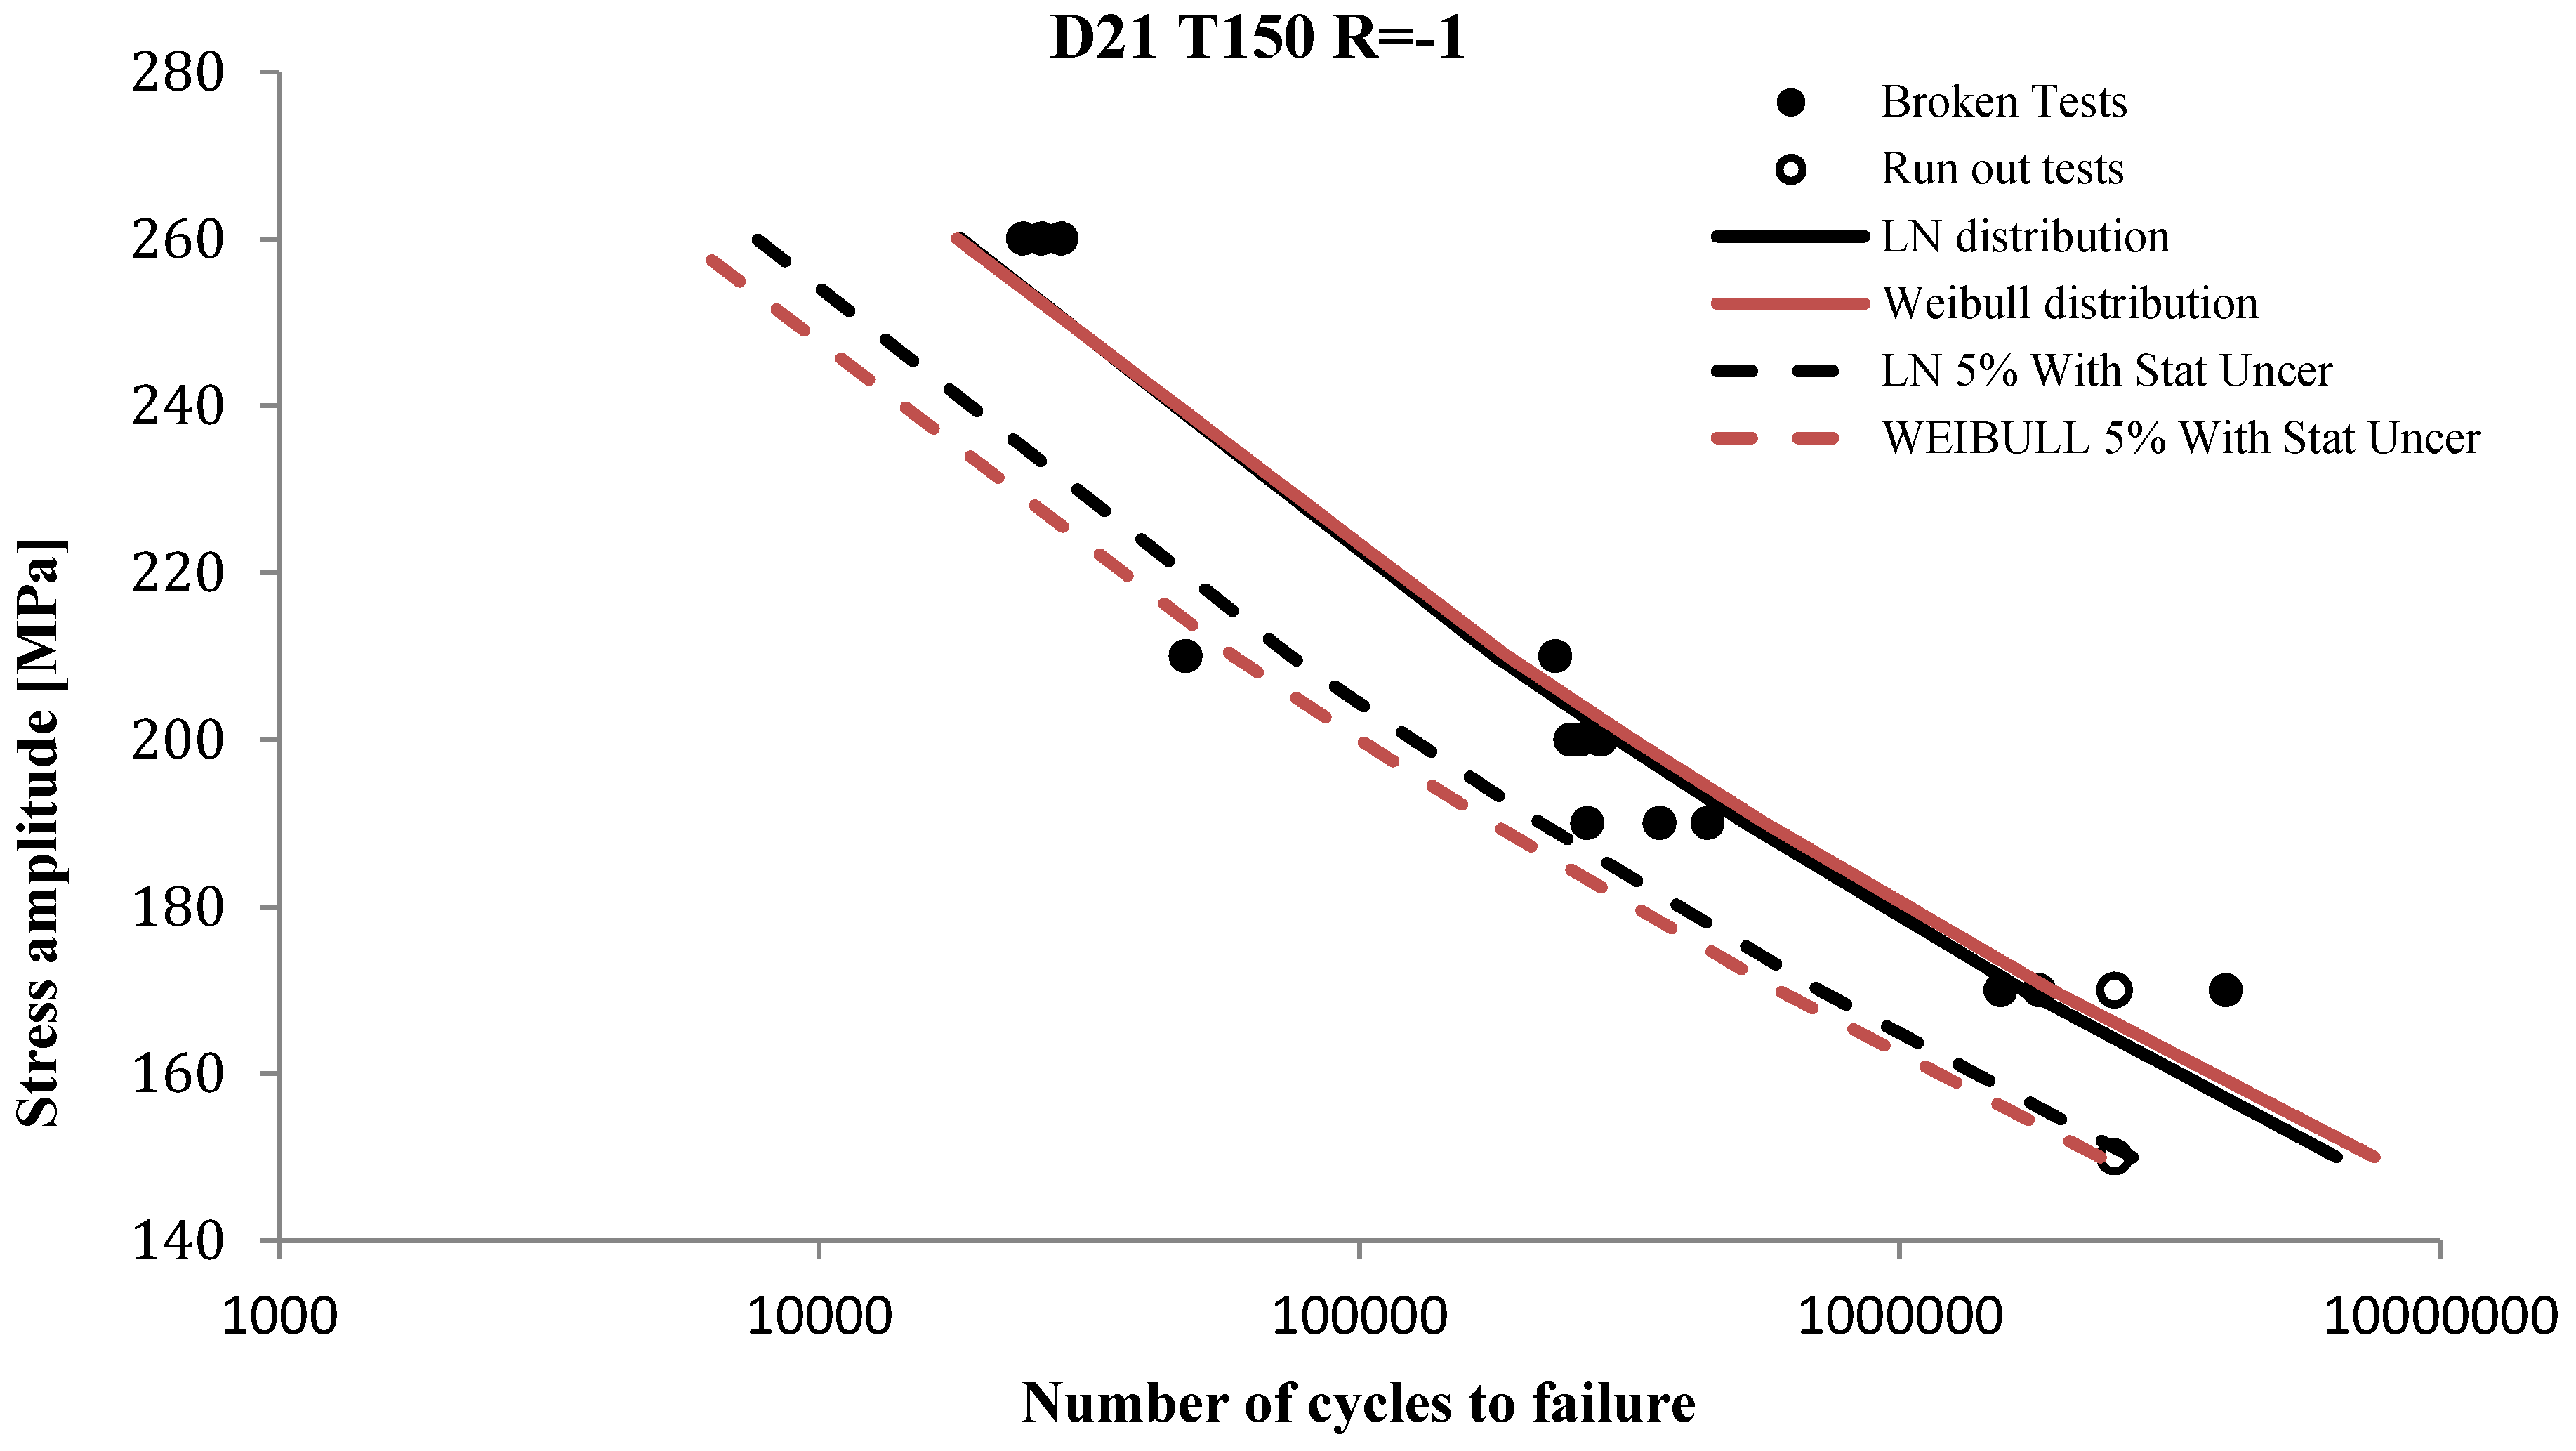
Figure 2 and
Figure 3 show the mean and characteristic
SN curves with log-normal and Weibull distributions for the fatigue life for tests “D21 T95 R = −1” and “D21 T150 R = −1” and with statistical uncertainties included. The figures show that the difference between the Weibull and log-normal models is small.
Figure 2.
SN data for test D21 T95 R = −1 with fitted mean and characteristic SN curves.
Figure 2.
SN data for test D21 T95 R = −1 with fitted mean and characteristic SN curves.
Figure 3.
SN data for test D21 T150 R = −1 with fitted mean and characteristic SN curves.
Figure 3.
SN data for test D21 T150 R = −1 with fitted mean and characteristic SN curves.
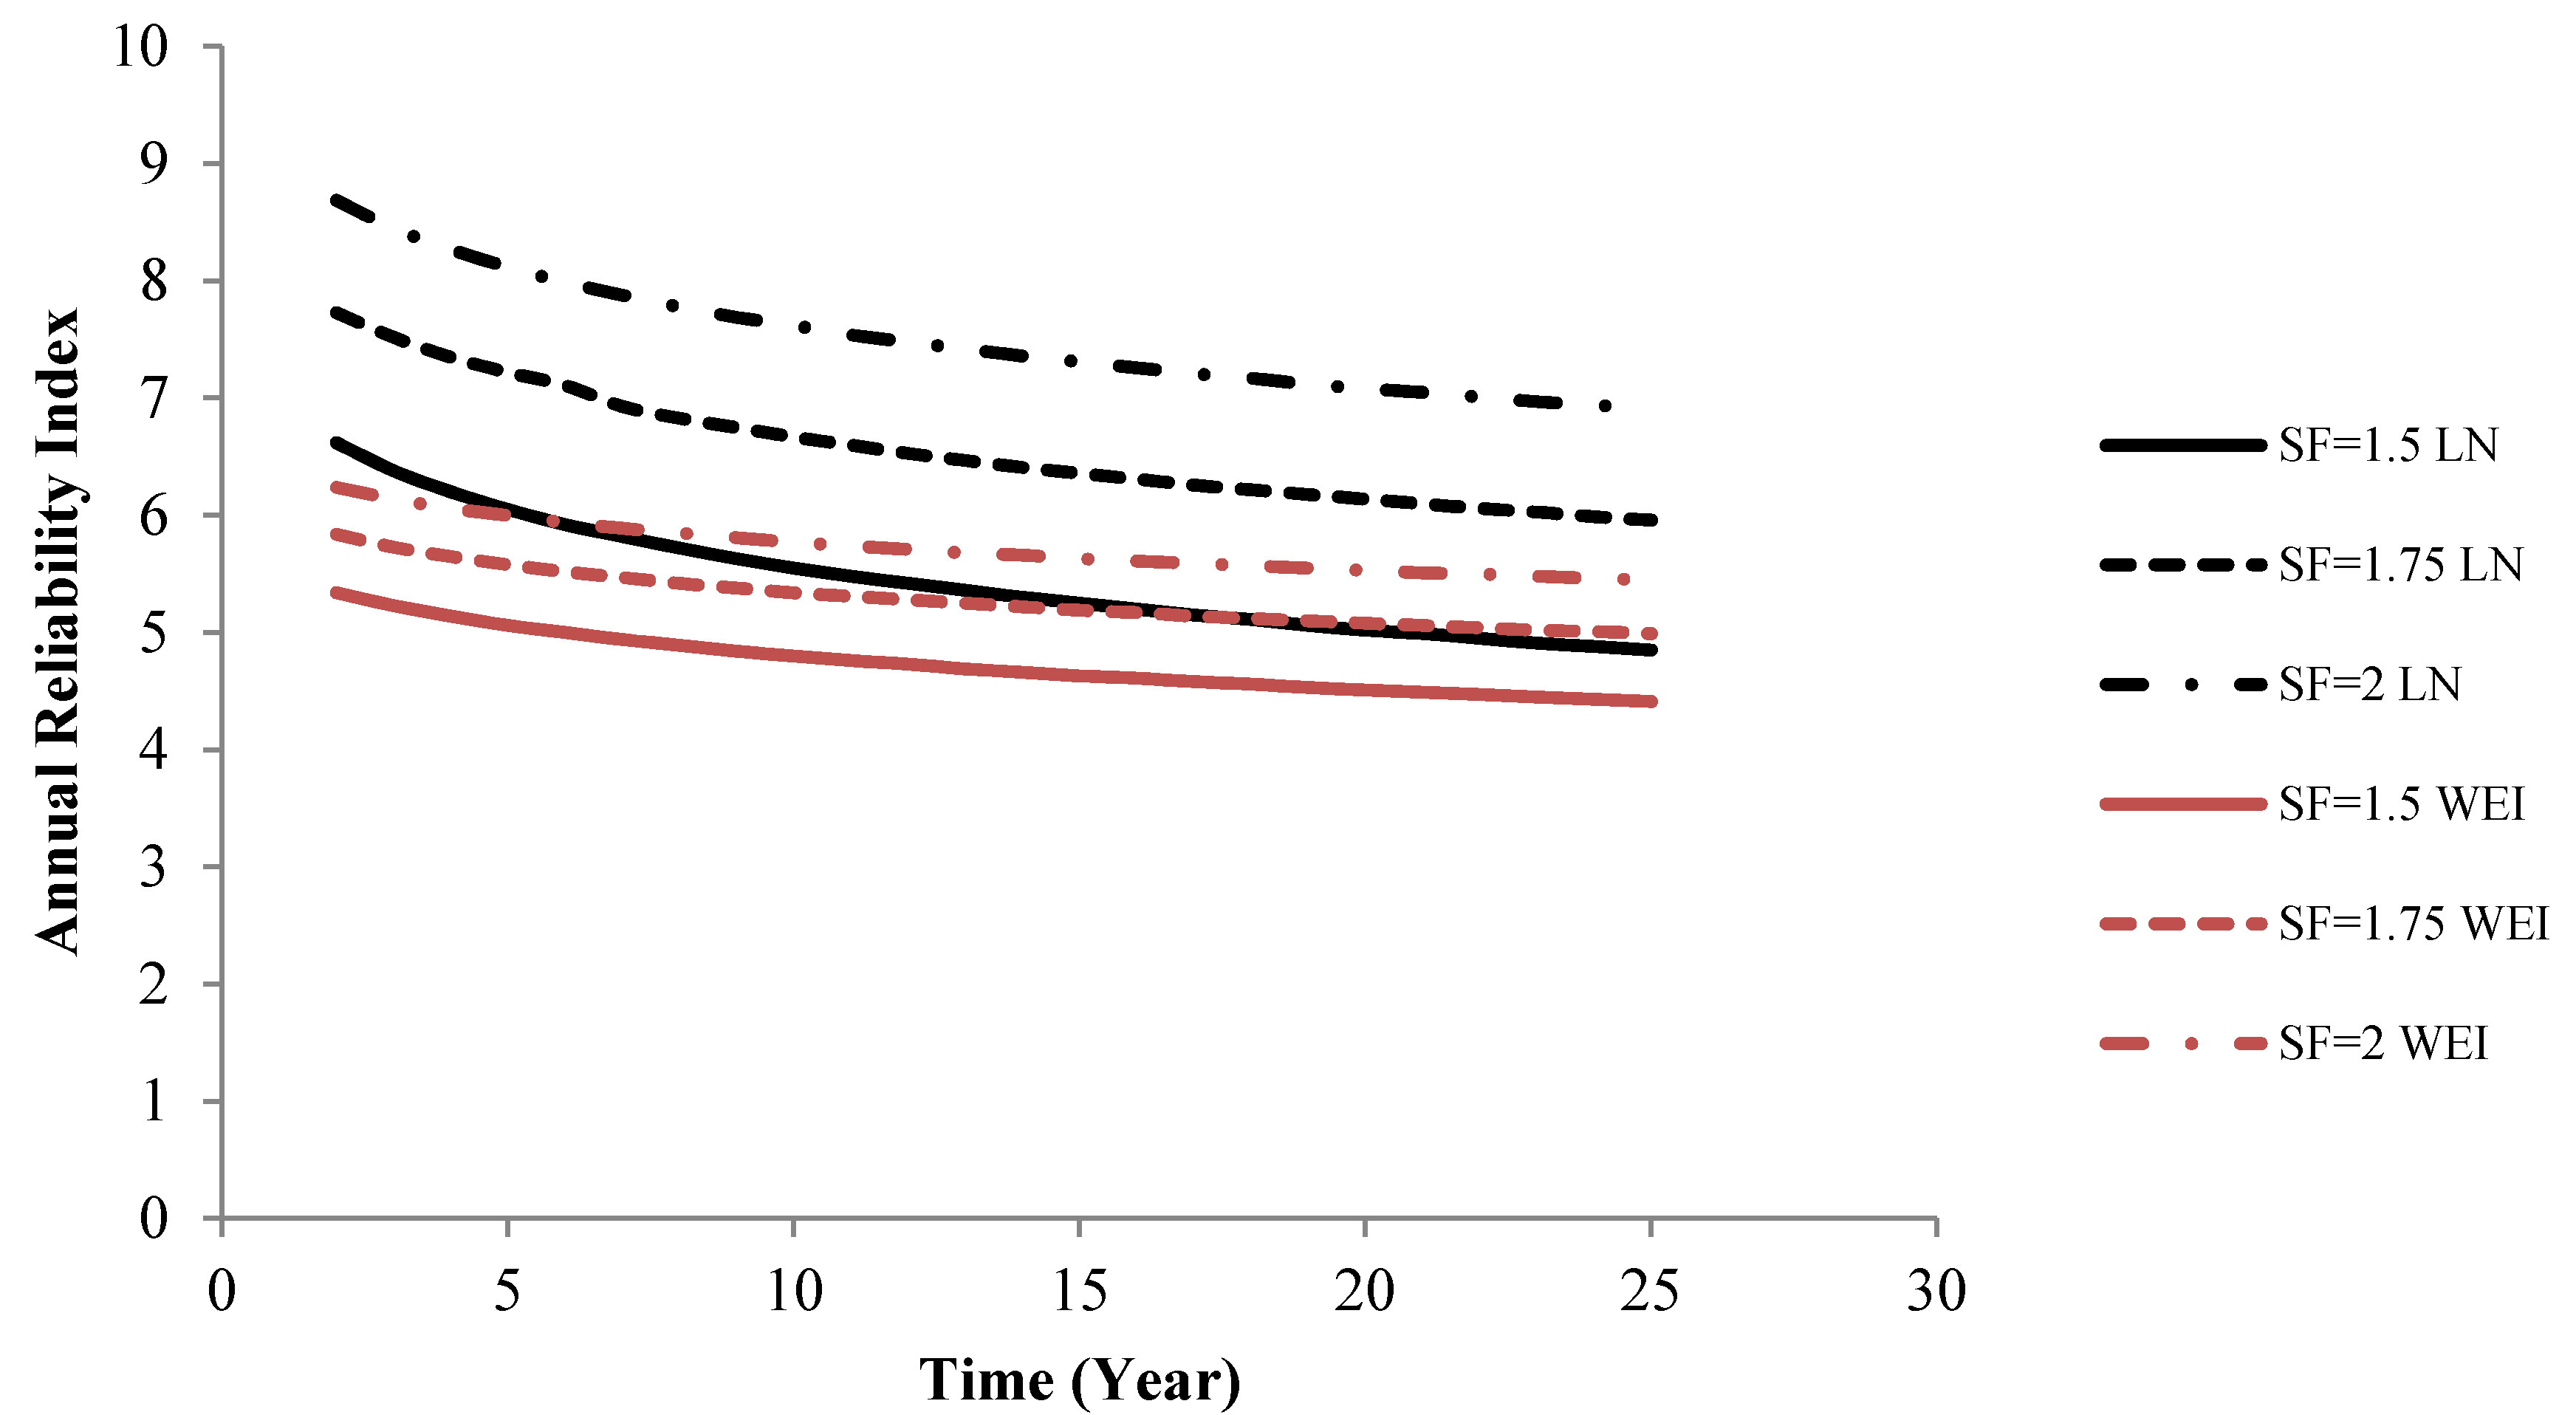
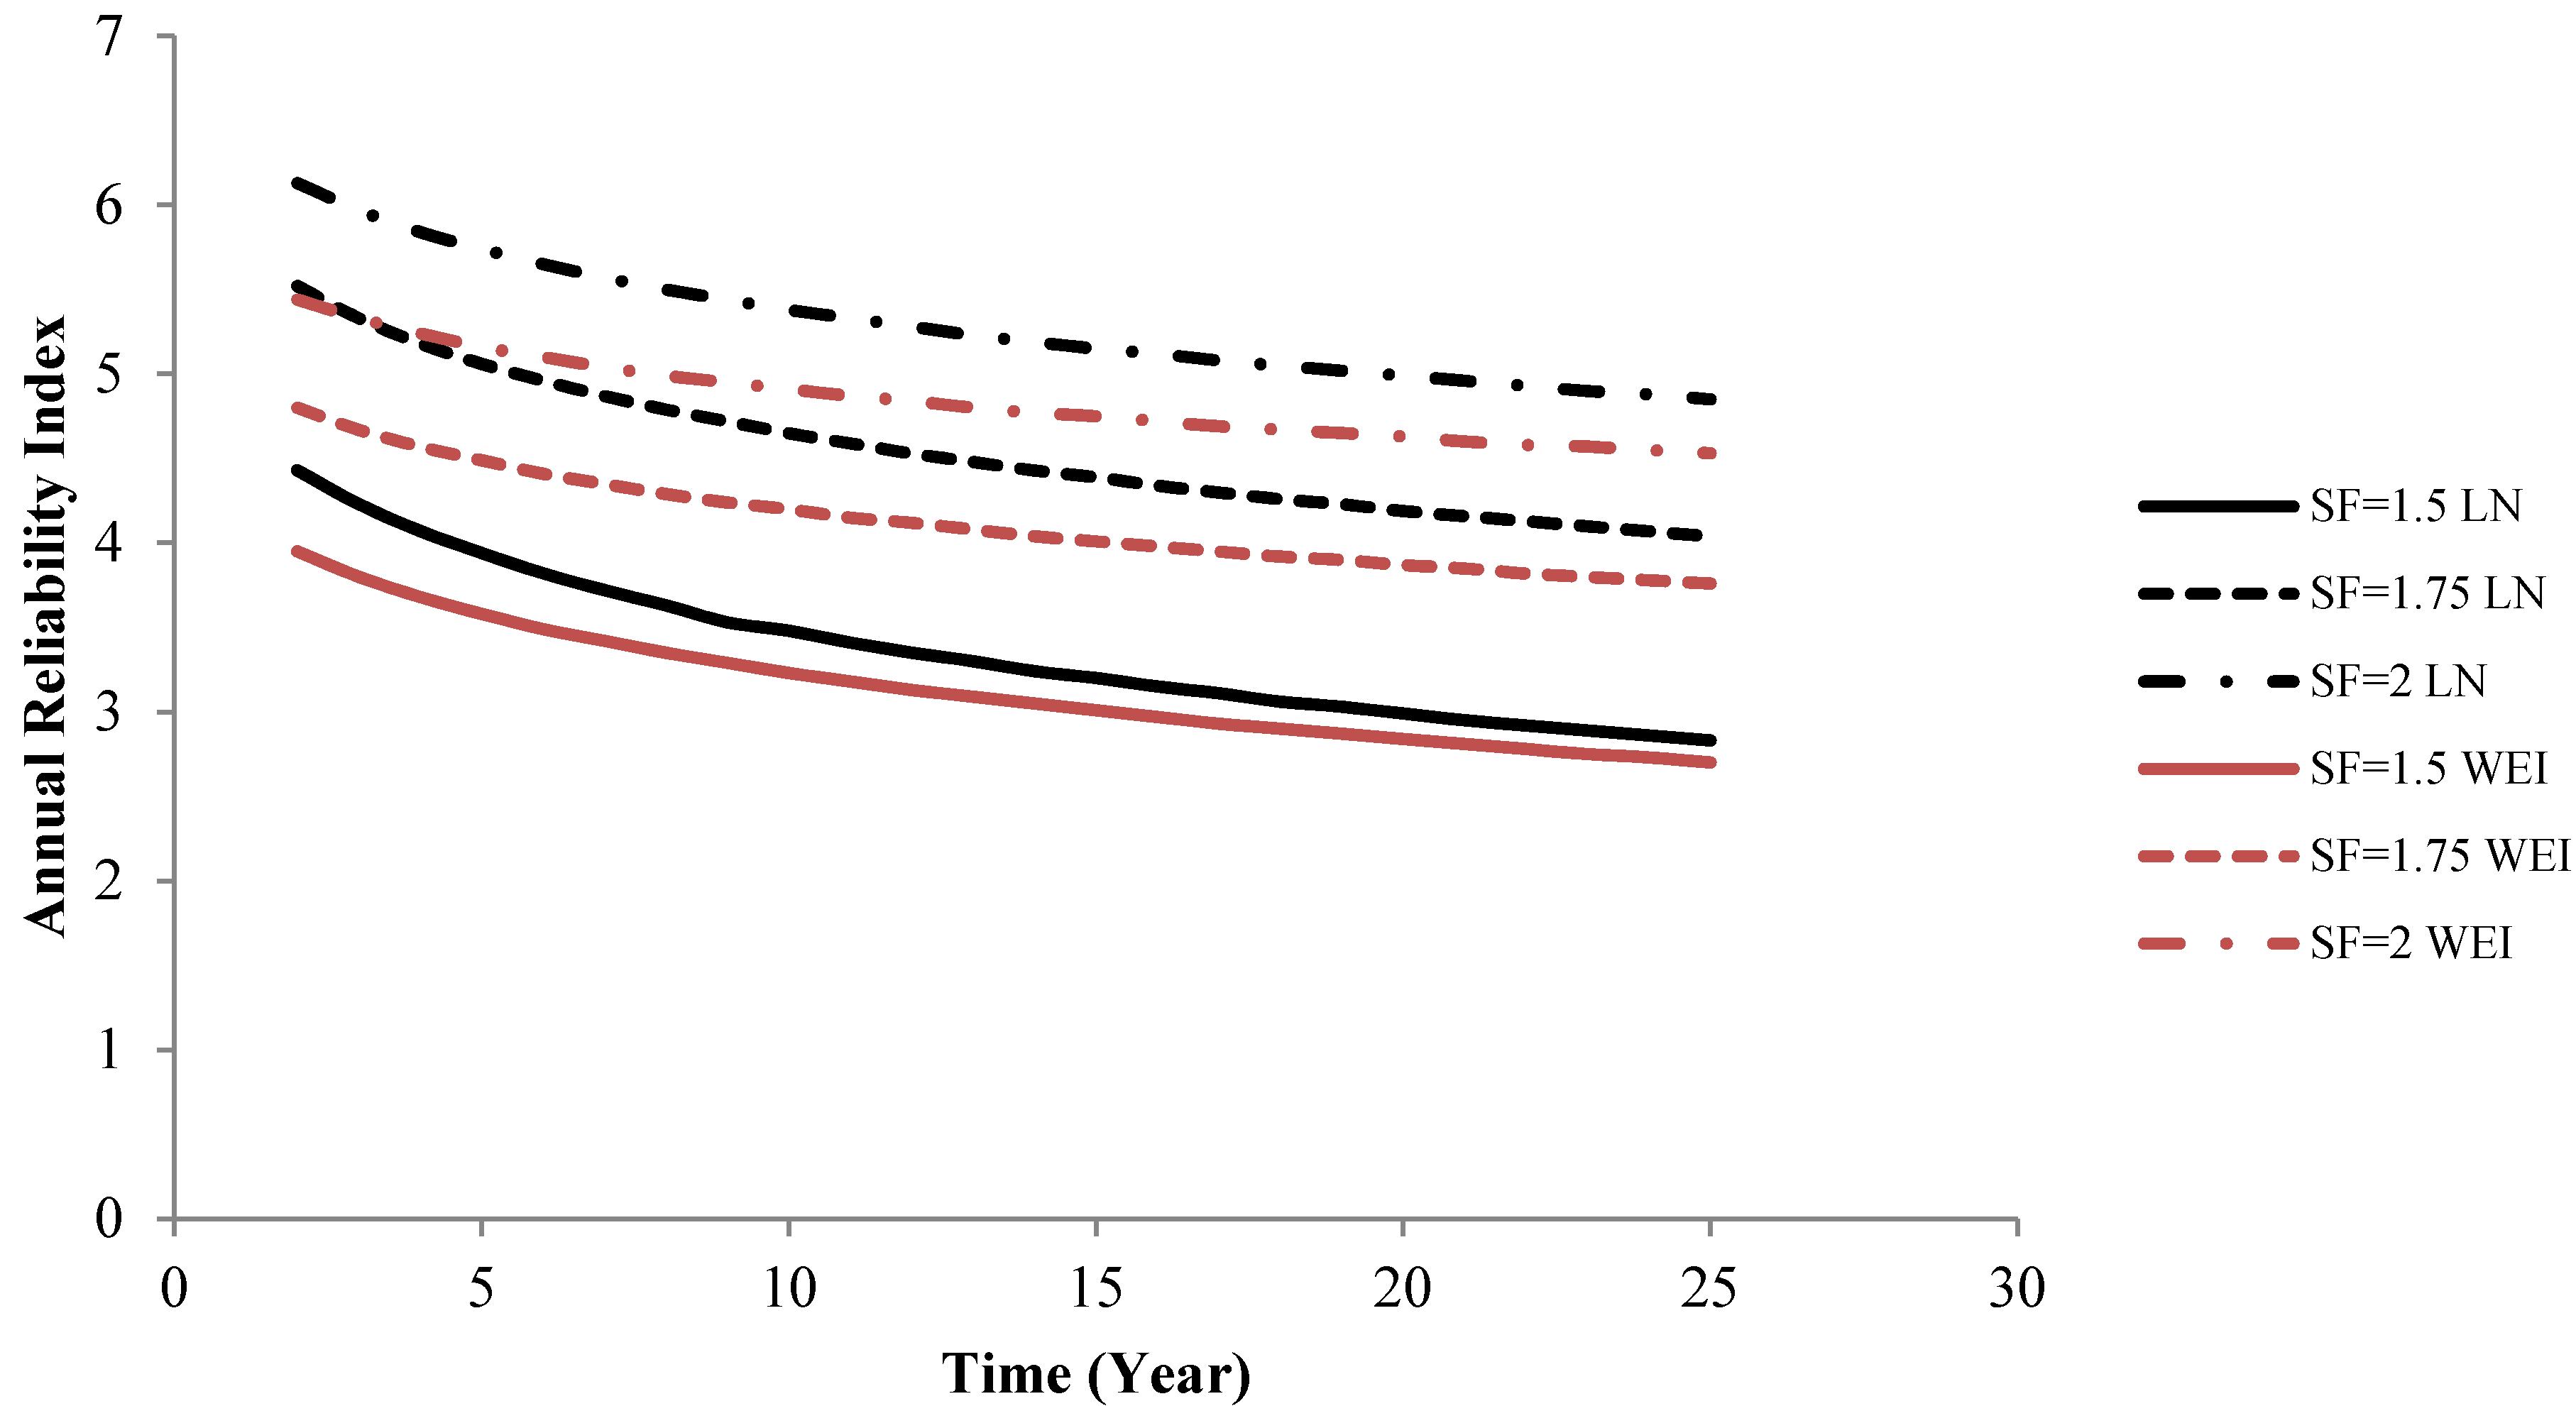
Next, using these estimated statistical parameters, the annual reliability index is estimated. First, the reliability index is determined with the partial safety factor,
varying between 1.5 and 2, see
Figure 4 and
Figure 5. It is seen that the Weibull distribution model has the lowest sensitivity with respect to changes of the partial safety factor when compared to log-normal distribution model. The target reliability level for wind turbines is typically in the interval from 3.1 to 3.8 for the annual reliability index corresponding to annual probabilities of failure between 10
−4 and 10
−3. From
Figure 4, it is seen as expected that when the partial safety factor increases, the reliability index increases.
Figure 4.
Annual reliability index for partial safety factor = 1.5, 1.75 and 2.0 using the Weibull and log-normal models. Test D21 T95 R = −1.
Figure 4.
Annual reliability index for partial safety factor = 1.5, 1.75 and 2.0 using the Weibull and log-normal models. Test D21 T95 R = −1.
Figure 5.
Annual reliability index for partial safety factor = 1.5, 1.75 and 2.0 using the Weibull and log-normal models. Test D21 T150 R = −1.
Figure 5.
Annual reliability index for partial safety factor = 1.5, 1.75 and 2.0 using the Weibull and log-normal models. Test D21 T150 R = −1.
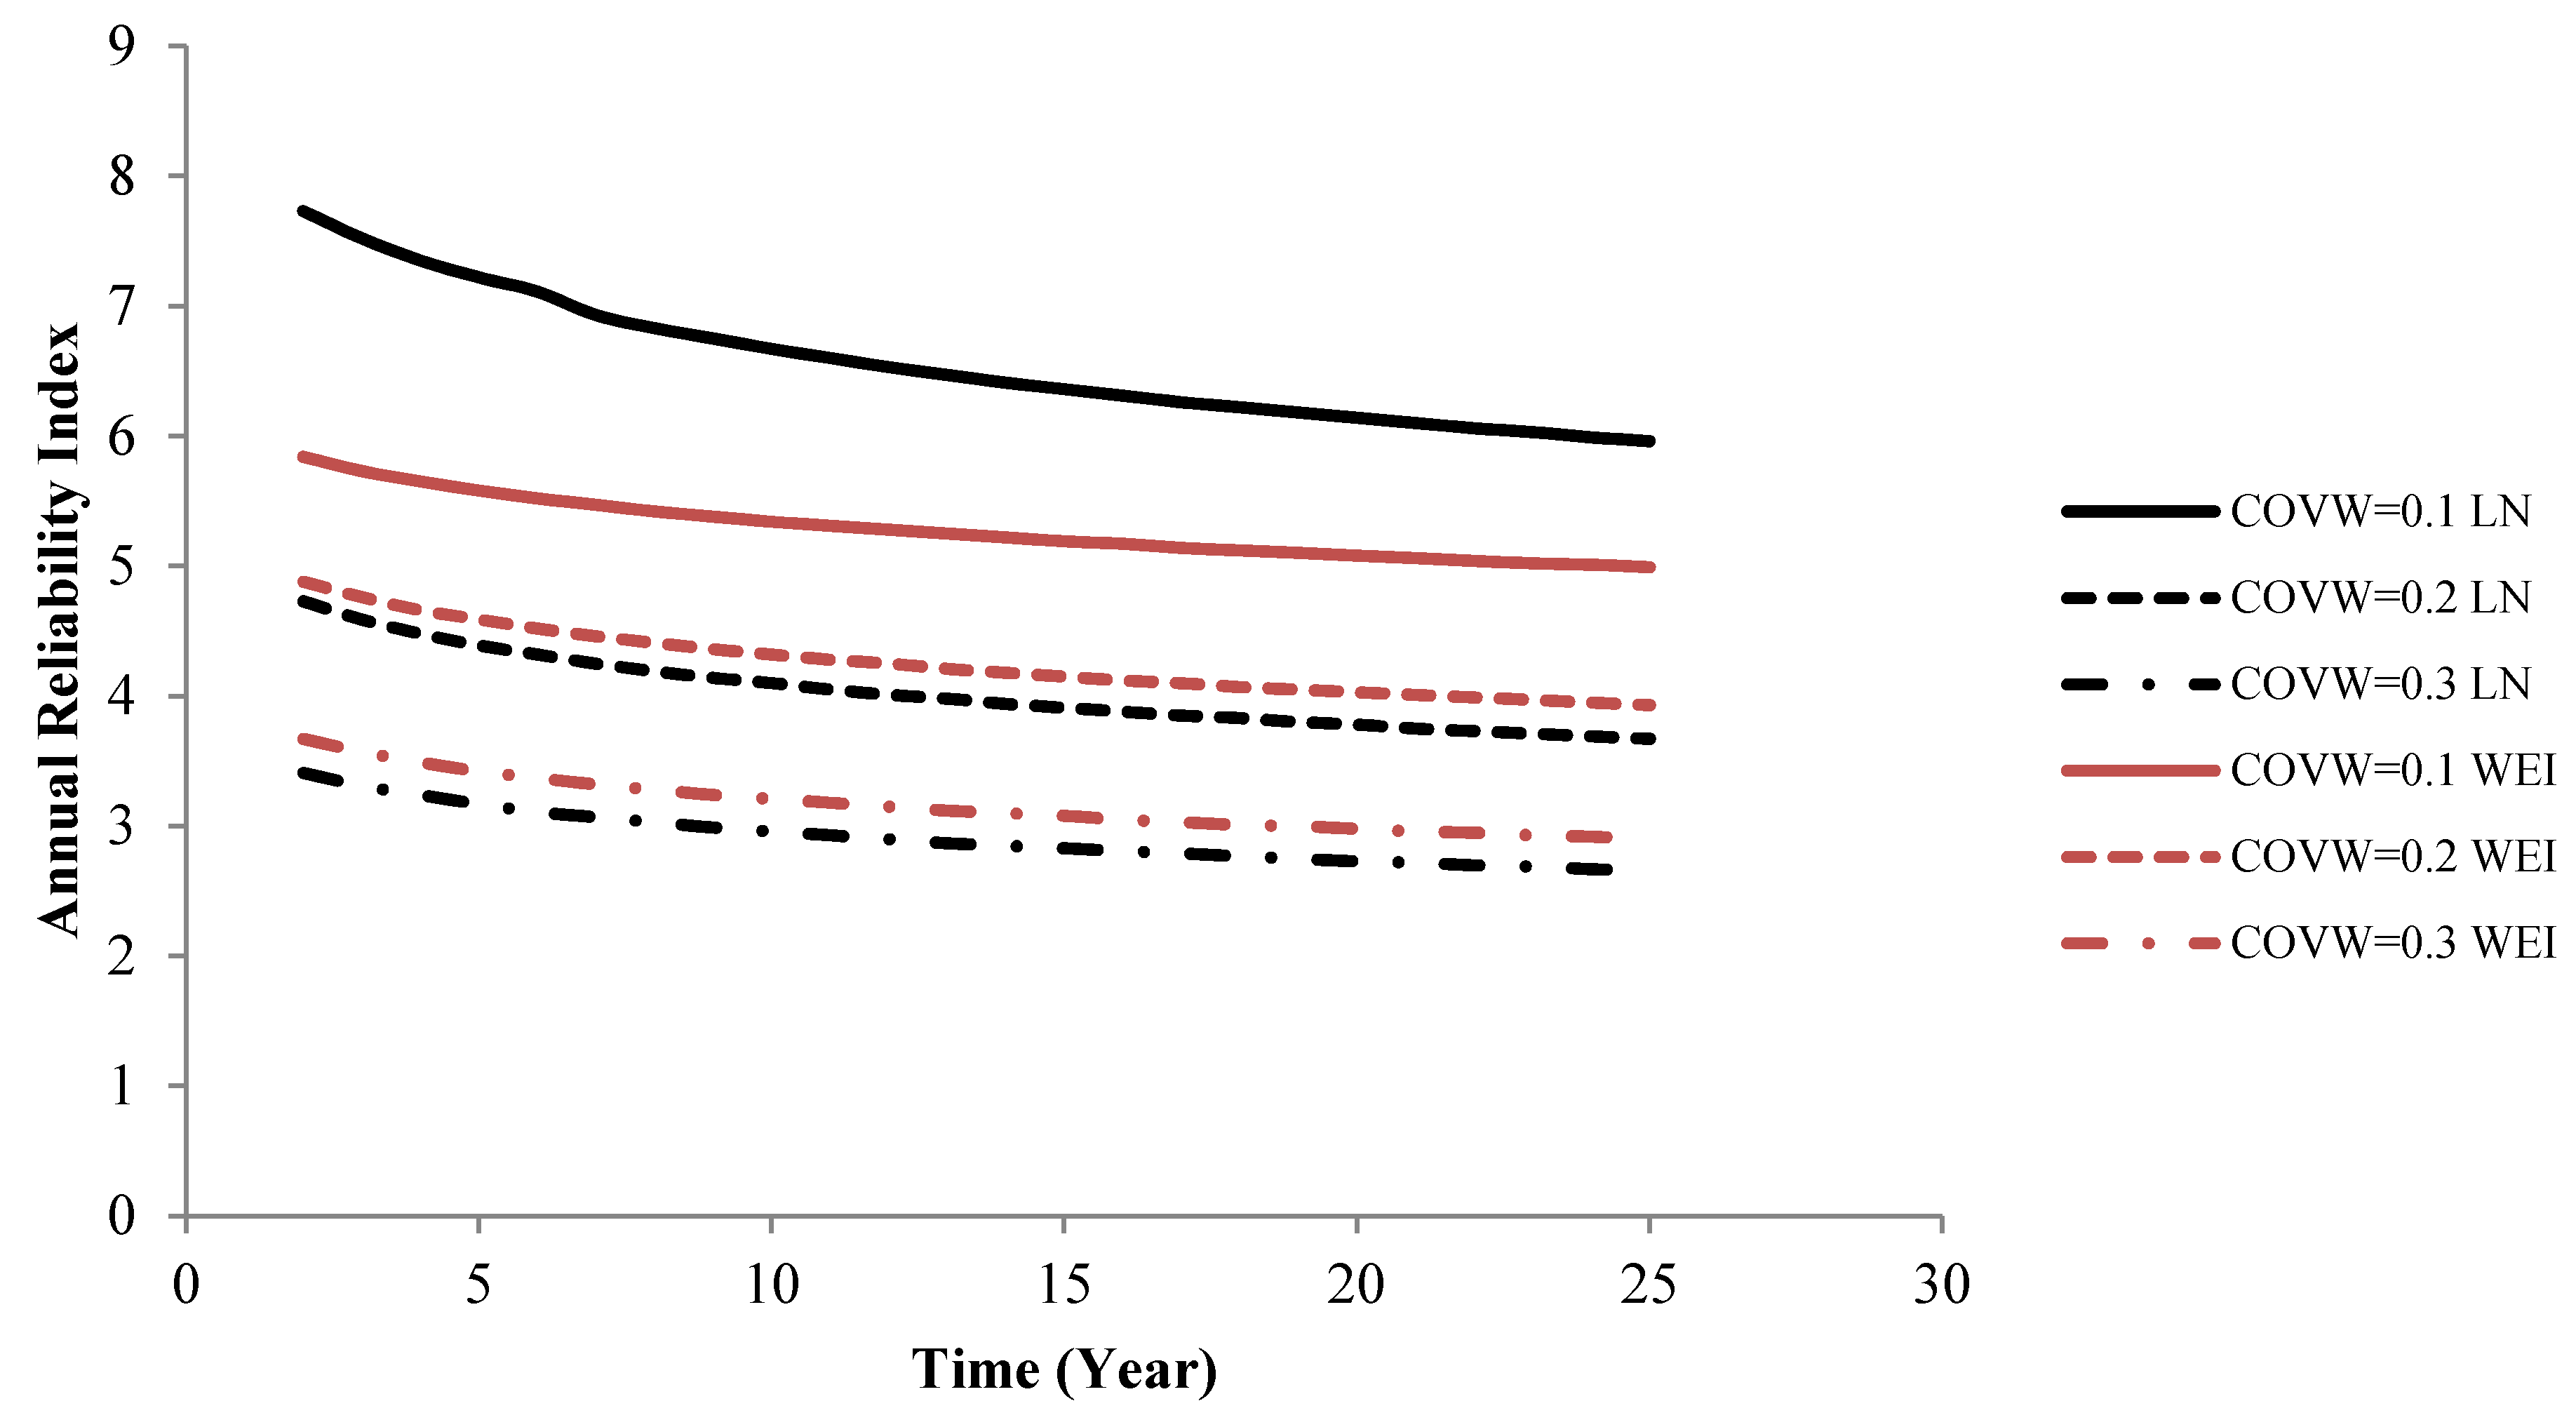
Next, the sensitivity of the reliability with respect to the uncertainty level of
XW and
XSCF is investigated. The partial safety factor, equal to 1.75 is used in all the following cases. The results for
XW are shown in
Figure 6 and
Figure 7. It is seen that when the uncertainty related to the fatigue loads increases, then the reliability index based on the log-normal distribution model decrease more than the reliability index based on the Weibull distribution model. It is also seen that the reliability index is quite sensitive to the coefficient of variation of
XW.
Figure 6.
Annual reliability index for different uncertainty models for XW. Test D21 T95 R = −1.
Figure 6.
Annual reliability index for different uncertainty models for XW. Test D21 T95 R = −1.
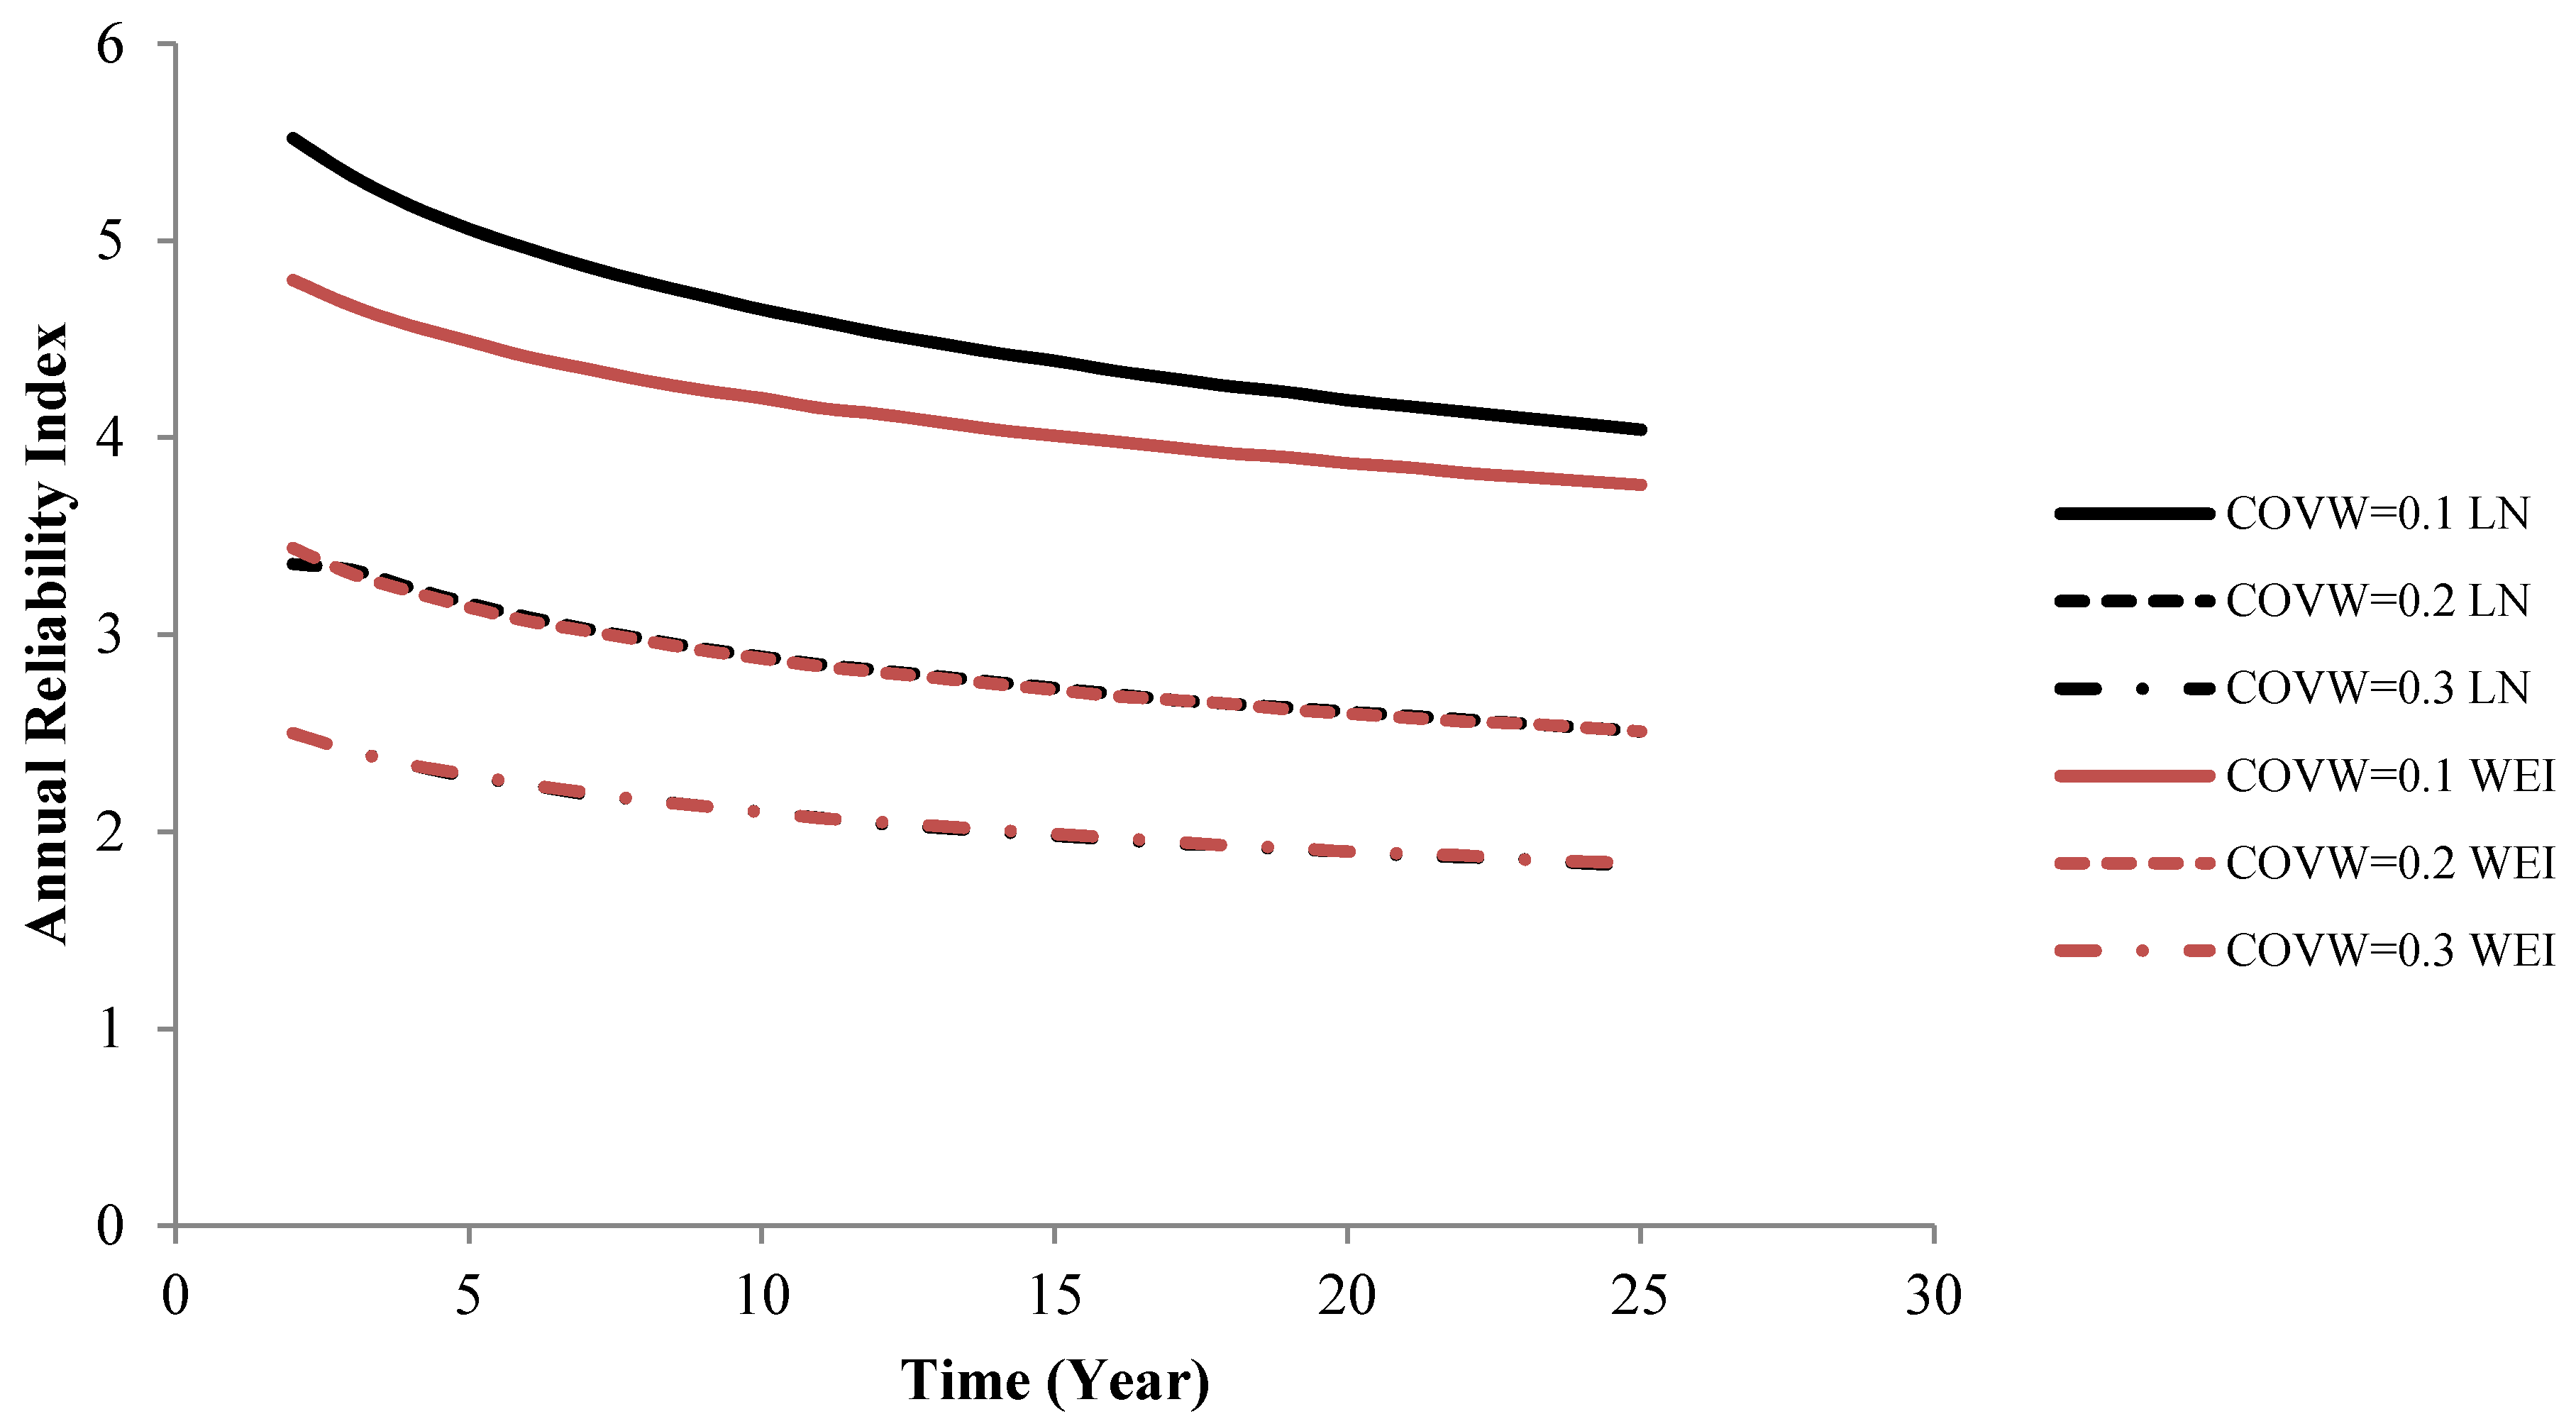
Figure 7.
Annual reliability index for different uncertainty models for XW. Test D21 T150 R = −1.
Figure 7.
Annual reliability index for different uncertainty models for XW. Test D21 T150 R = −1.
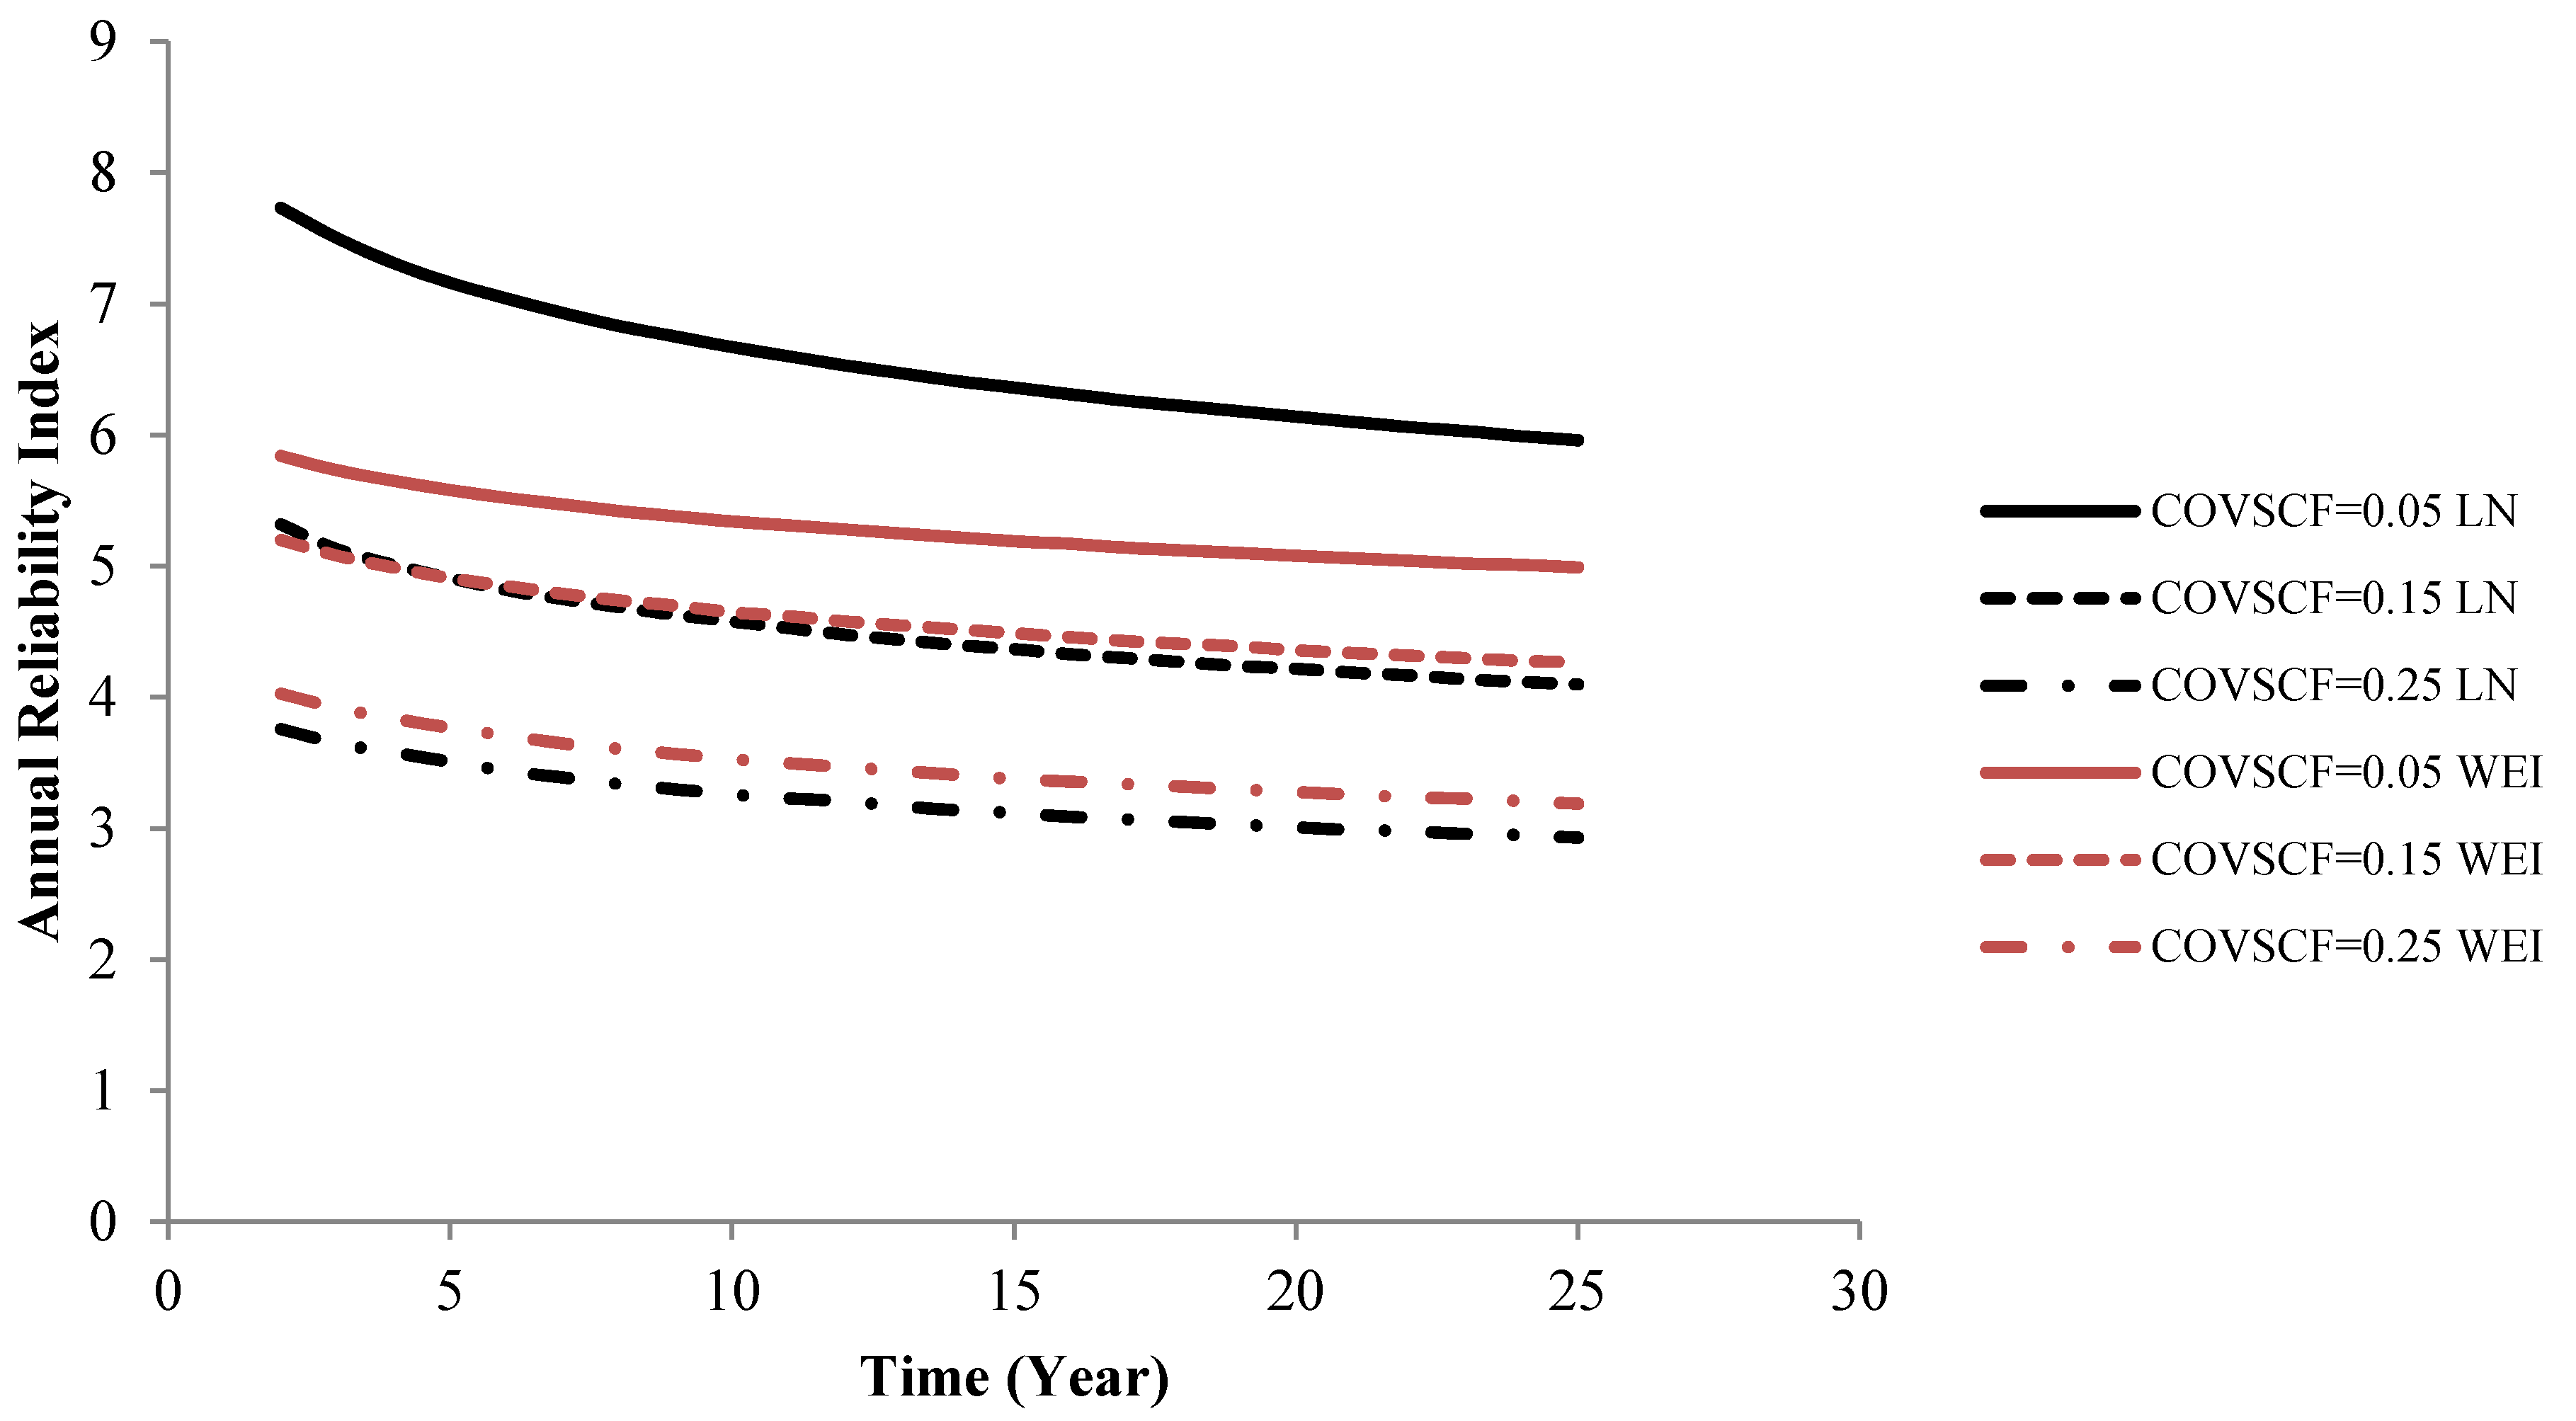
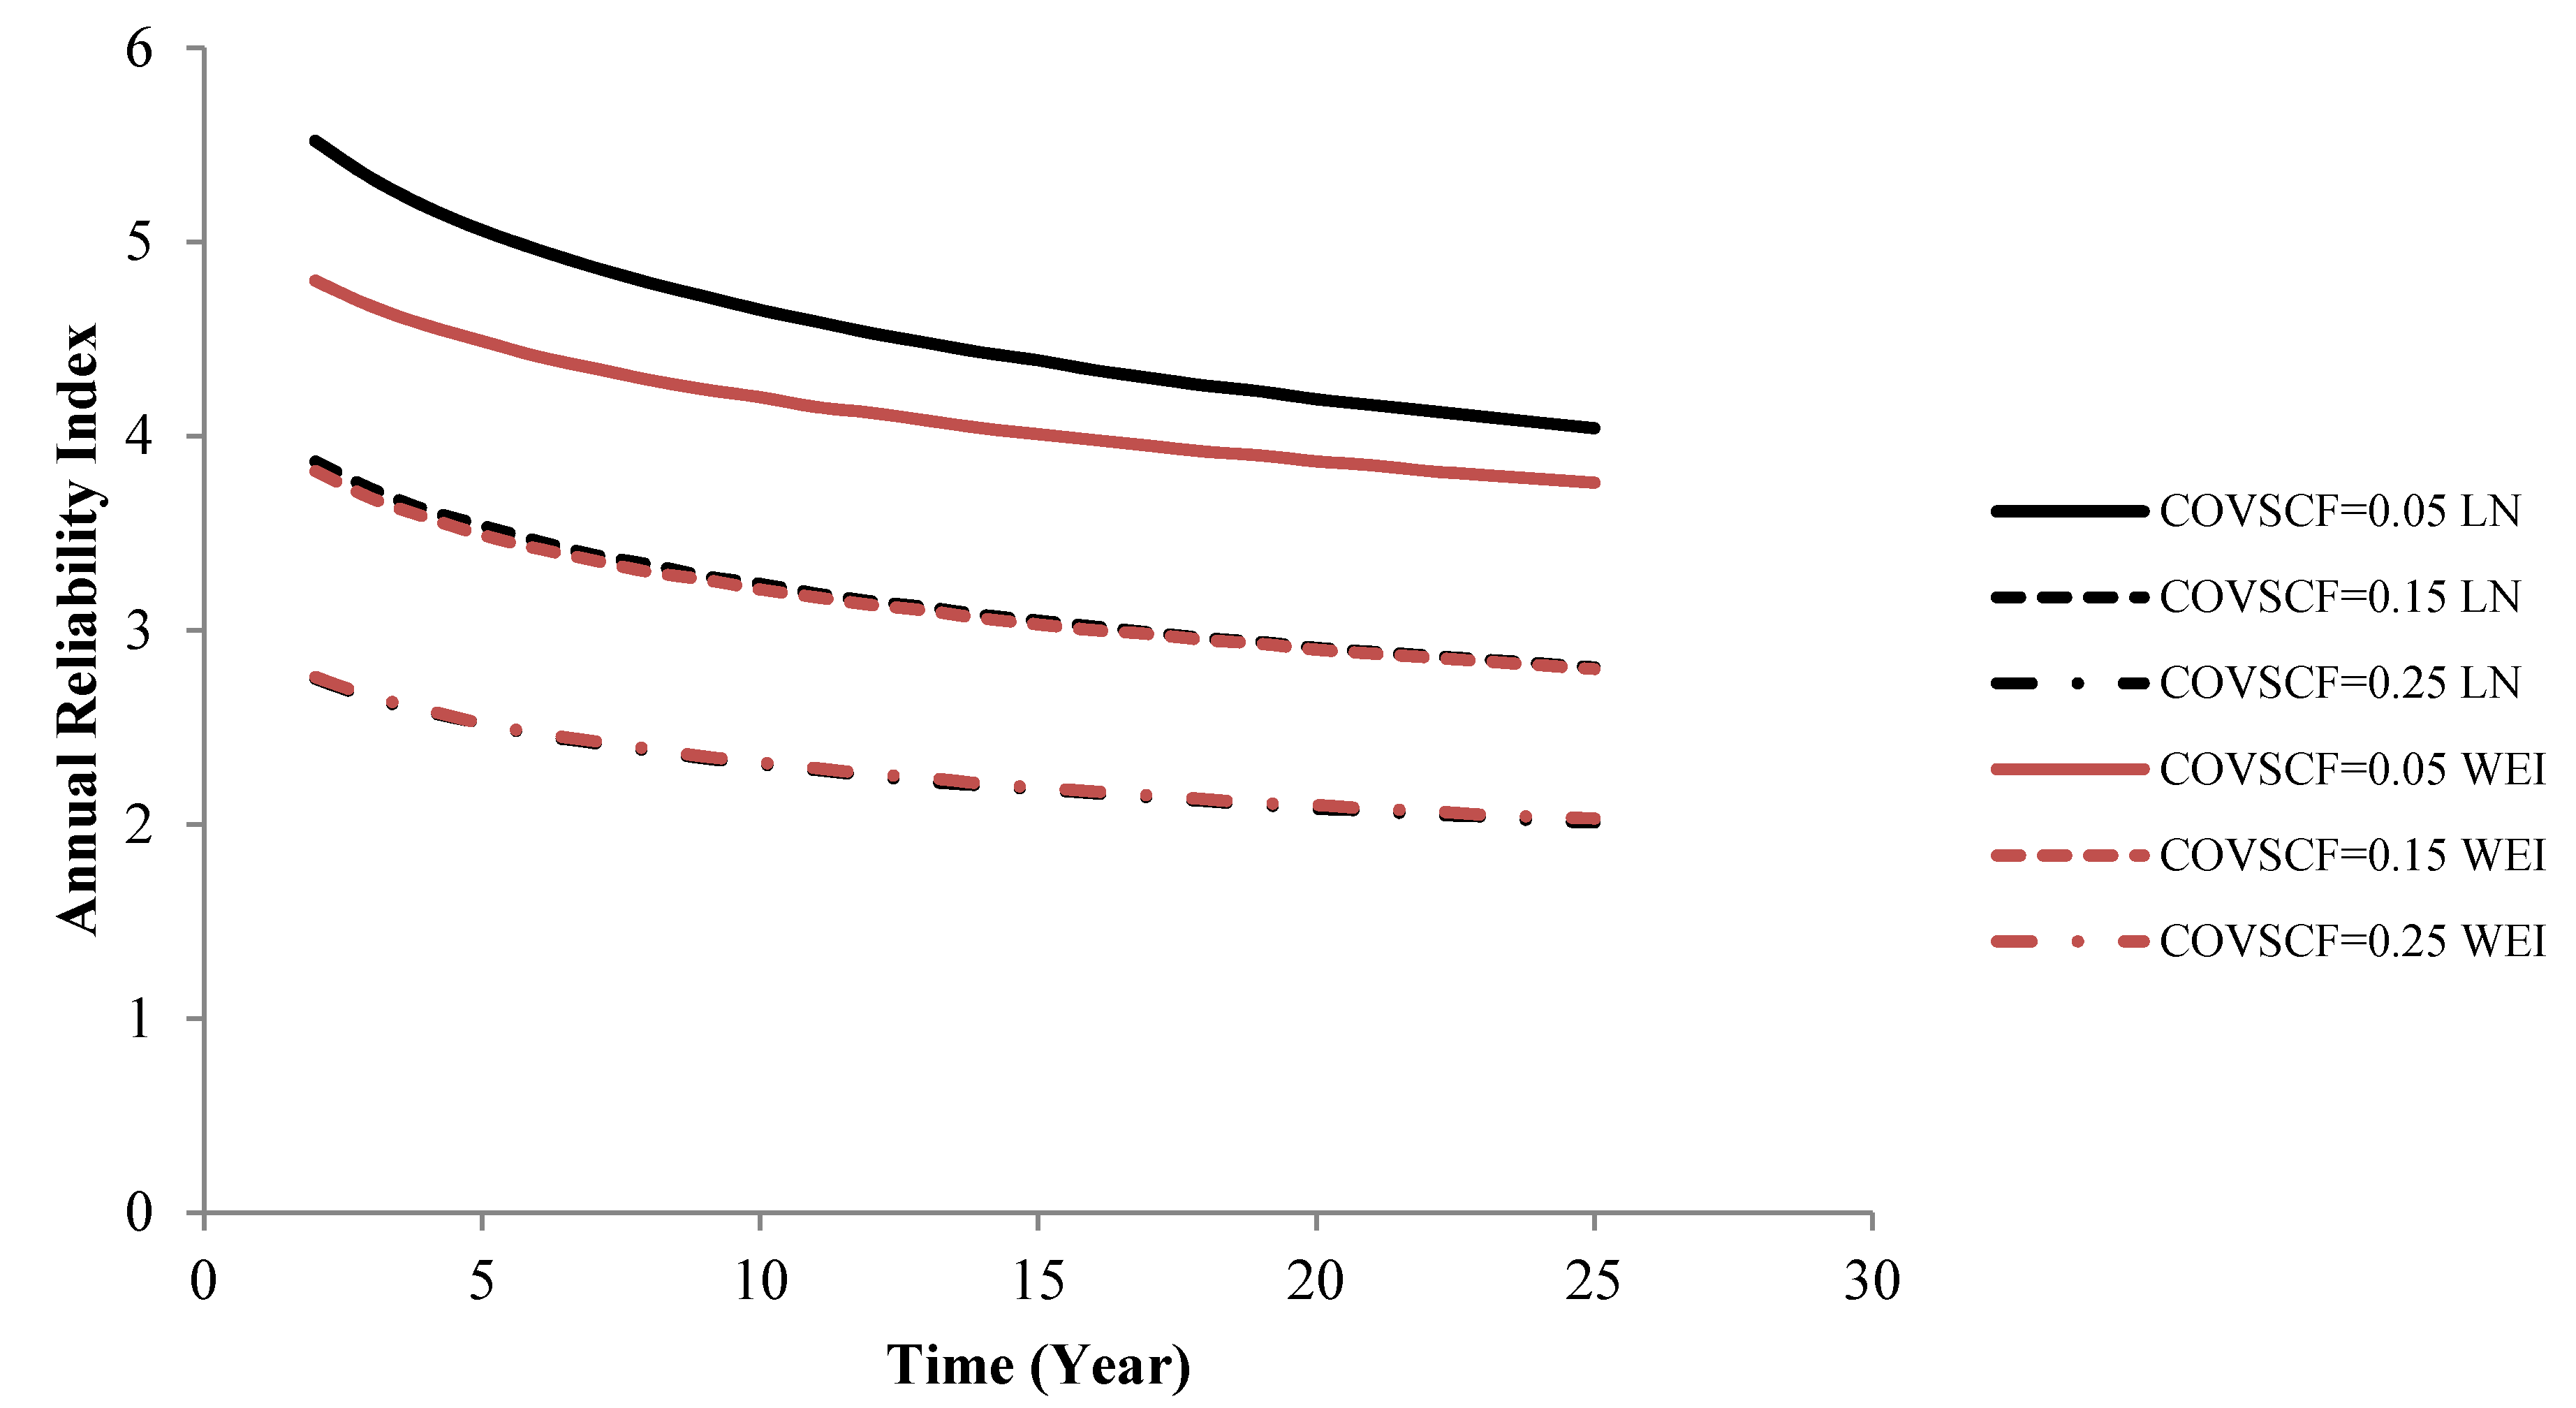
Next, the influence of the uncertainty of
XSCF is investigated.
Figure 8 and
Figure 9 show the results for the coefficient of variation of
XSCF equal to 0.05, 0.15 and 0.25. The results are similar to those obtained for
XW. Furthermore, the geometrical size effect affects the resistance of the material against fatigue failure. As mentioned above, the results of “D21 T95 R = −1” and “D21 T150 R = −1” are used as basis for investigating the geometrical size effects.
Figure 8.
Annual reliability index for different uncertainty models for XSCF. Test D21 T95 R = −1.
Figure 8.
Annual reliability index for different uncertainty models for XSCF. Test D21 T95 R = −1.
Figure 9.
Annual reliability index for different uncertainty models for XSCF. Test D21 T150 R = −1.
Figure 9.
Annual reliability index for different uncertainty models for XSCF. Test D21 T150 R = −1.
By comparing
Figure 2 and
Figure 3, the fatigue life of specimen “D21 T95 R = −1” is higher than the fatigue life of “D21 T150 R= −1” and it is seen that when the volume of a component increase, the fatigue life of the component decrease. This effect is important to include in reliability assessments. Moreover, by comparing the
Figure 6,
Figure 7 and
Figure 8,
Figure 9 for various assumptions of the uncertainties of
XW and
XSCF, it is seen that the annual reliability index of T150 is (as expected) lower than T95 in all cases. Consequently, higher safety factor must be applied in the design process for larger components and the geometrical size effect may affect the design significantly.


