
The Use of Energy in Malaysia: Tracing Energy Flows from Primary Source to End Use


Abstract
:1. Introduction
- (1)
- An introduction of the system approach for analyzing the use of energy in Malaysia and the methodology and data input for mapping the Sankey diagram of energy flows in Section 2;
- (2)
- A discussion of current status of the Malaysian energy supply and energy end-use based on the mapping results in Section 3;
- (3)
- A discussion of ongoing trends of Malaysia’s energy flows by analyzing the influencing factors in Section 4;
- (4)
- Conclusions and suggestions for future work in Section 5.
2. Methodology
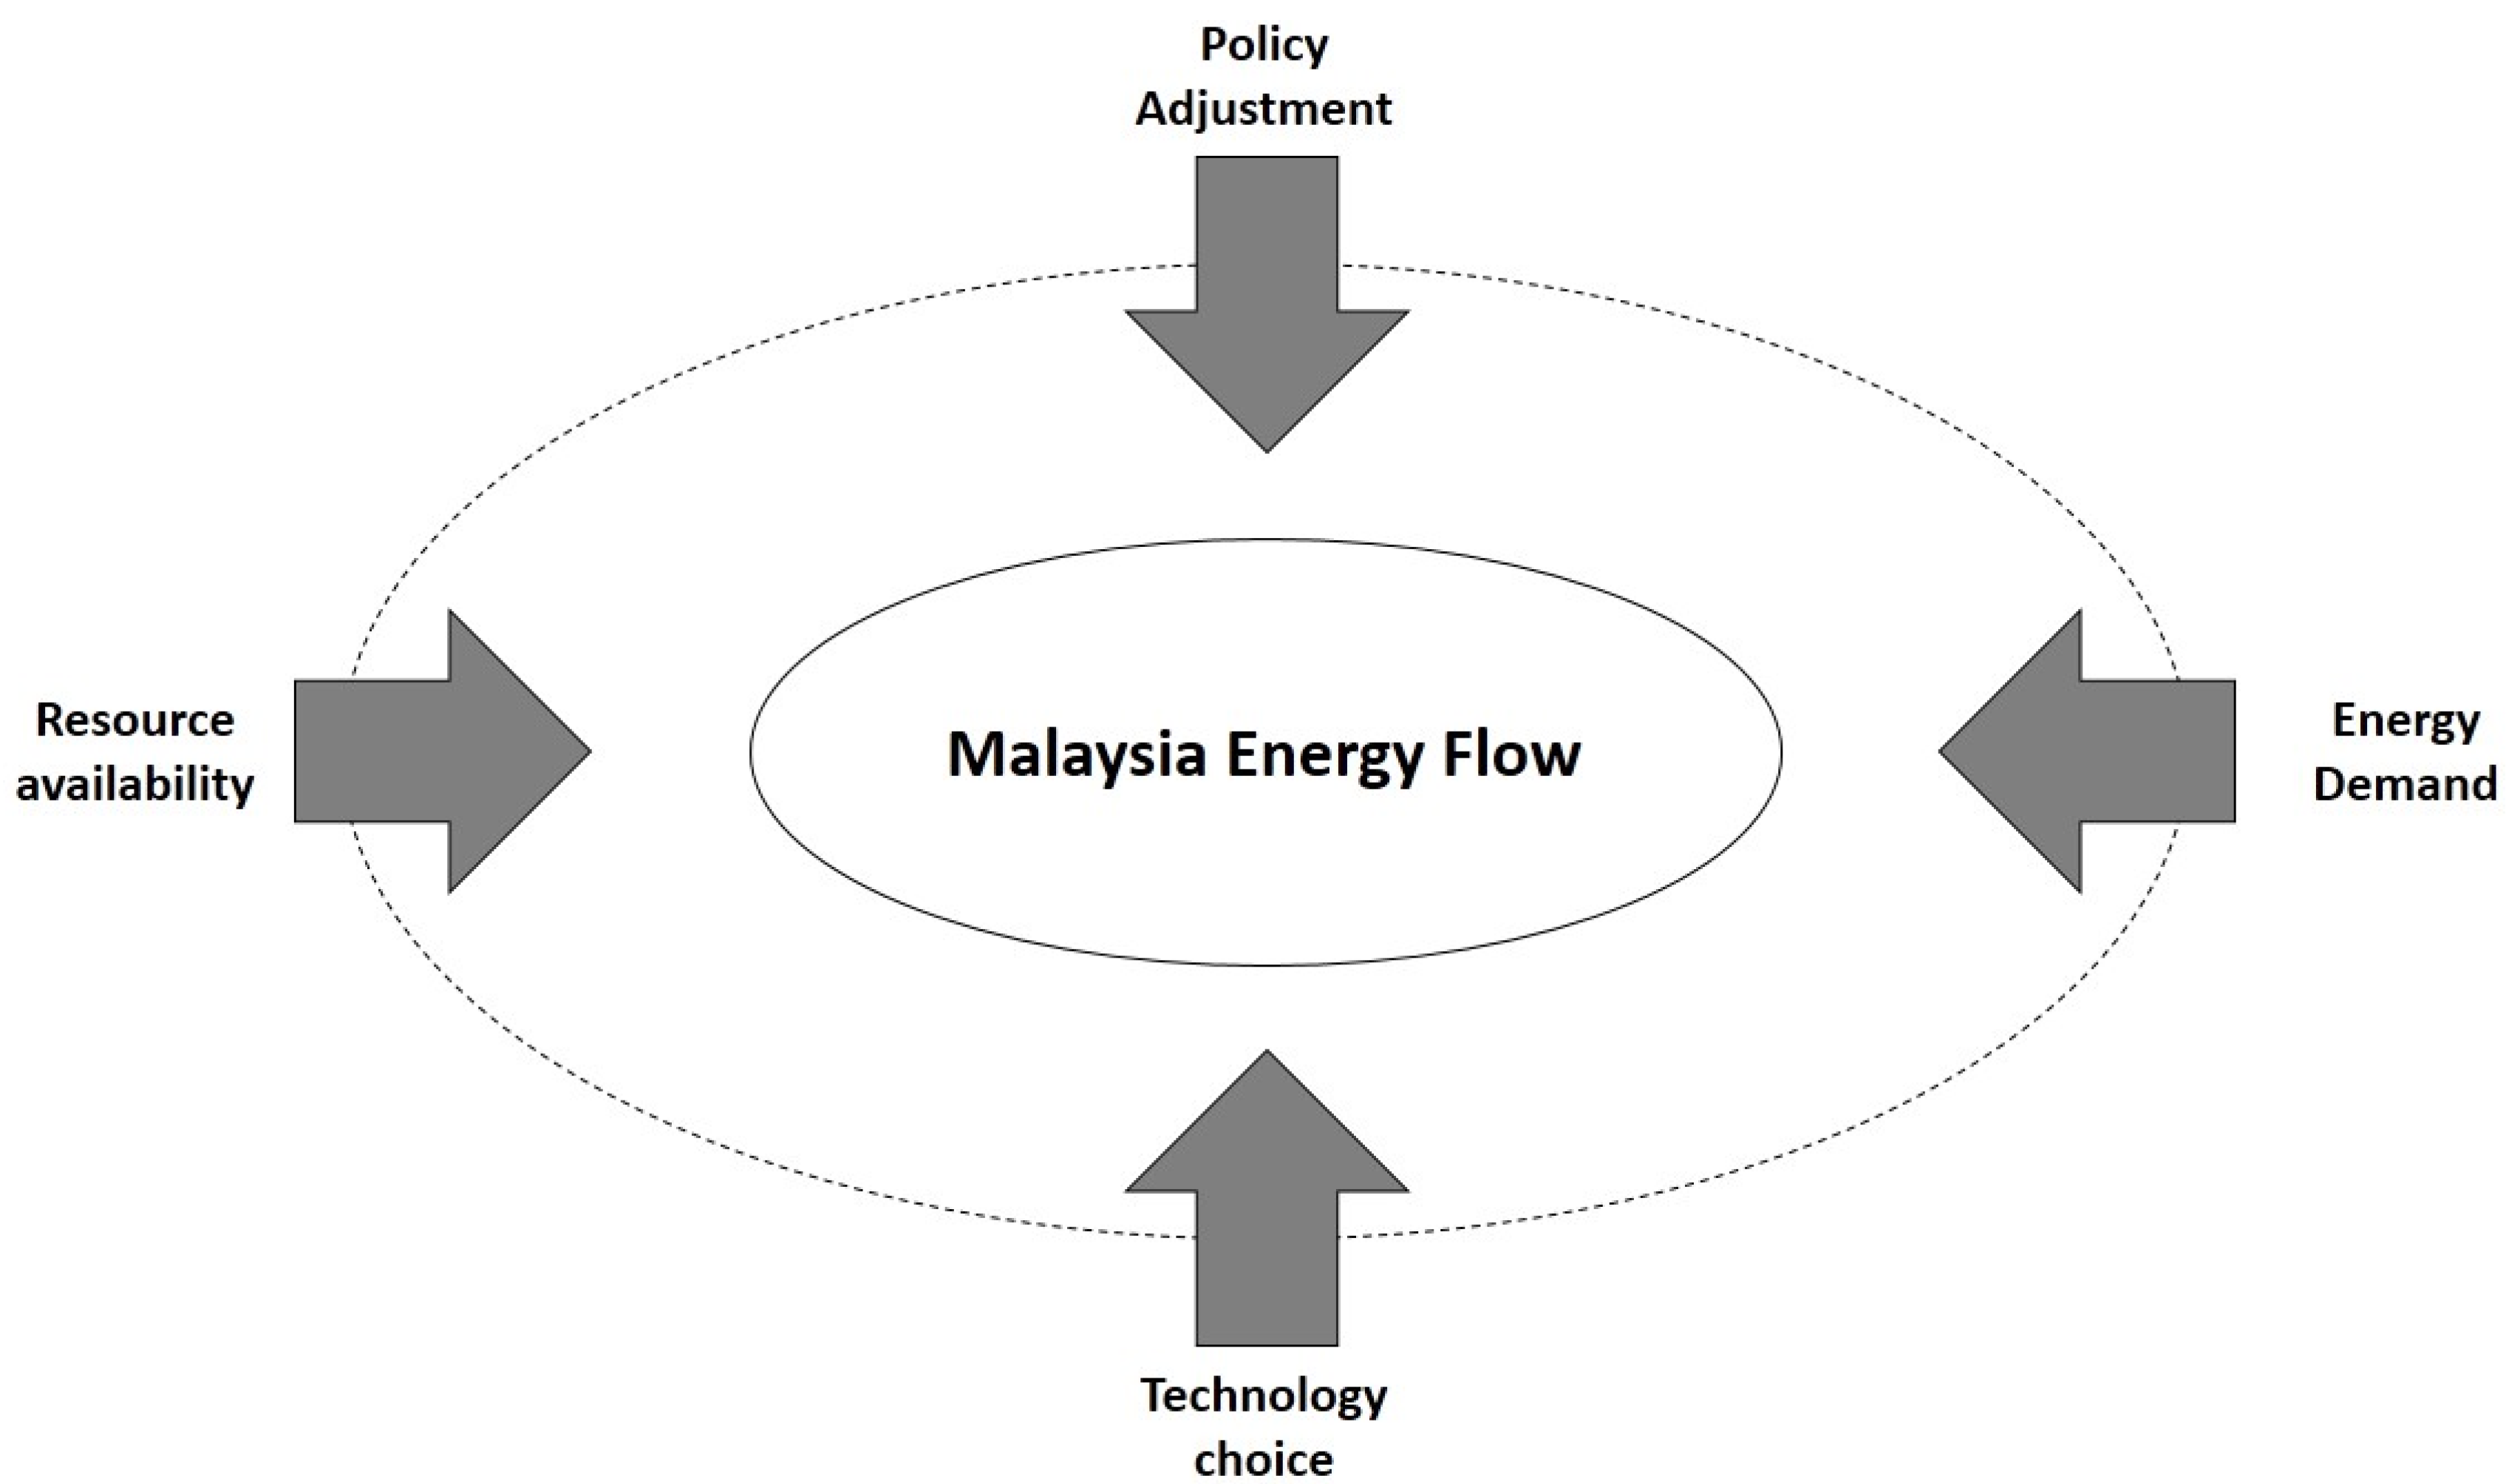
2.1. System Approach
- (1)
- Energy demand: In the end-use sector, energy is consumed to provide energy services, like passenger transport, cooling comfort and illumination. The variation of energy demand will influence energy supply. Currently, the manufacturing sector, transportation sector and domestic sector (residential, commercial and agriculture) are the major energy consumers in Malaysia.
- (2)
- Energy resource availability: The energy supply structure of a region is dependent on its energy resource availability, including domestic production and imports. The lack of energy resource availability will require restricting energy demand. Though Malaysia has abundant energy resources, to ensure more reliable energy supply and strategy purpose, some energy resources are imported.
- (3)
- Technology choice: Adoption of different technologies will not only influence the energy supply structure, but also the environmental emissions. The major uncertainty of technology choices in Malaysia is the future development of the electricity generation technologies, which will mainly be decided by the availability and the cost of energy resources. Besides, biodiesel may be an important alternative energy for vehicle fuels in Malaysia.
- (4)
- Policy adjustment: Policymakers can implement policies and enact acts to regulate or intervene in energy supply and energy consumption for strategic purposes. The main aim of the Malaysian energy policy is to ensure energy security. The previous policy adjustments have successfully optimized Malaysia’s energy structure. Along with the climate change issue, the development of renewable energy and nuclear power are hot topics.
2.2. Tools and Data Input for Mapping Energy Flows

| Stage | Energy flows | Description [22] |
|---|---|---|
| Primary Supply | Primary Production | Refers to the amount of primary energy resources extracted. Data for natural gas excludes the amount of re-injected and flared gas. Gross production of hydropower is calculated by primary energy equivalent quantity. |
| Gas Flaring and Reinjection Use | Refers to the amount of gas flared, re-injected into the gas fields and use for production purposes. | |
| Imports and Exports | Refers to the amount of primary and secondary energy obtained from or supplied to other countries. | |
| Bunkers | Refers to the amount of fuels delivered to ocean-going ships of all flags engaged in international traffic. | |
| Stock Changes | Refers to the difference between the amount of fuels in stocks at the beginning and end of the year and should ideally cover producers, importers, and industrial consumers. At this stage, however, only oil companies stocks are taken into account. | |
| Secondary Supply | Gas Plants | Refers to the input of natural gas into LNG, MDS and GPP-LPG plants and their respective outputs. |
| Refineries | Refers to the input of energy resources into refineries and their respective outputs. | |
| Power Plants | Refers to the input of energy resources into power plants and electricity outputs. | |
| End-use | Residential | Refers to energy used within households. |
| Commercial | Refers to energy used within commercial departments, including public buildings. | |
| Industrial | Industrial is a very broad-based sector, ranging from manufacturing to mining and construction. Diesel sales through distributors are assumed to be industrial consumers. | |
| Transportation | Refers to all sales of motor gasoline and diesel from gas stations and sales of aviation fuel. It also includes diesel and motor gasoline sold directly to the government and military. | |
| Agriculture | Covers agricultural, forestry and fishing. | |
| Non-energy Use | Refers to products resulting from the transform processes for non-energy purpose (bitumen/lubricants, asphalt/greases) and use of energy products (such as natural gas) as industrial feed stocks. | |
| Energy type | Definition [22] | |
|---|---|---|
| Primary energy | Crude oil | A natural product that is extracted from mineral deposits and that consists essentially of many different non-aromatic hydrocarbons. |
| Natural gas | A mixture of gaseous hydrocarbons (mainly methane), which occur in either gas fields or in association with crude oil fields. | |
| Coal and coke | Coal in the energy balance is mainly bituminous with some anthracite. Coke is obtained from coal by heating at high temperature. | |
| Hydropower | The inferred primary energy available for electricity. | |
| Secondary energy | Aviation gasoline (AV) | Aviation fuel. A special blended grade of gasoline for use in aircraft engine of the piston type. The distillation range is 30 °C to 250 °C. |
| Aviation turbine fuel (ATF) | Aviation Fuel. Fuel for use in aviation gas turbines mainly refined from kerosene. The distillation range is between 150 and 250 °C. | |
| Diesel | Distillation falls within 200 °C and 340 °C. Diesel fuel for high-speed diesel engines is more critical of fuel quality than diesel for stationary and marine diesel engines. Marine oil usually consists of a blend of diesel oil and some residual (asphaltic) materials. | |
| Electricity | Electricity generated. | |
| Fuel oil | Heavy distillates, residues or blends of these, used as fuel for production heat and power. Fuel oil production at the refinery is essentially a matter of selective blending of available components rather than of special processing. Fuel oil viscosities vary widely depending on the blend of distillates and residues. | |
| Kerosene | A straight-run fraction from crude oil, with a boiling range from 150 to 250 °C. Its main uses are for domestic lighting and cooking. | |
| Liquefied natural gas (LNG) | Natural gas that is liquefied for ocean transportation and export. | |
| Liquefied petroleum gas (LPG) | A mixture of propane and butane gases that are held in the liquid state by pressure or refrigeration. | |
| Motor gasoline (Petrol) | Petroleum distillate used as fuel in spark-ignition internal combustion engines. The distillation range is within 30 °C and 250 °C. | |
| Refinery gas | The gas released during the distillation of crude oil and contains methane, ethane, propane and butane. Most refinery gas is retained in the refinery and used as fuel in plant operations. | |
| Non-energy use | Non-energy products | Naphtha, bitumen and lubricants, which are obtained by the refinery process from petroleum but used for non-energy purposes. Naphtha is a refined or partly refined light distillate, which is further blended into motor gasoline or used as feedstock in the chemical industry. Bitumen is a viscous liquid or solid, non-volatile and possesses waterproofing and adhesive properties. Lubricating oil is used for lubricating purposes and has a distillation range from 380 to 500 °C. |
2.3. Data Input for Mapping Energy Flows
2.3.1. Malaysia National Energy Balance 2011 and the Data Treatment
| Energy source | Natural gas | LNG | Crude oil 1 | Petroleum products | Coal | Hydropower | Biodiesel | Electricity | |||||||
|---|---|---|---|---|---|---|---|---|---|---|---|---|---|---|---|
| Petrol | Diesel | Fuel oil | LPG | Kerosene | ATF AV | Non-Fuel | Refinery gas | ||||||||
| Primary supply, input (+) and output (−) | |||||||||||||||
| 1. Primary Production | 69.8 | 0.0 | 28.3 | 0.0 | 0.0 | 0.0 | 0.0 | 0.0 | 0.0 | 0.0 | 0.0 | 1.8 | 1.9 | 0.2 | 0.0 |
| 2. Gas Flaring | −13.1 | 0.0 | 0.0 | 0.0 | 0.0 | 0.0 | 0.0 | 0.0 | 0.0 | 0.0 | 0.0 | 0.0 | 0.0 | 0.0 | 0.0 |
| 3. Imports | 7.0 | 0.0 | 9.3 | 4.2 | 3.8 | 1.5 | 0.5 | 0.1 | 0.5 | 1.0 | 0.0 | 13.3 | 0.0 | 0.0 | 0.0 |
| 4. Exports | −1.1 | −26.9 | −11.5 | 0.0 | −4.5 | −0.3 | −1.0 | −0.7 | −0.7 | −2.3 | 0.0 | −0.1 | 0.0 | −0.1 | 0.0 |
| 5. Bunkers | 0.0 | 0.0 | 0.0 | 0.0 | 0.0 | −0.2 | 0.0 | 0.0 | 0.0 | 0.0 | 0.0 | 0.0 | 0.0 | 0.0 | 0.0 |
| 6. Stock Change | 0.0 | 0.0 | −1.7 | 0.0 | 1.5 | 0.0 | 0.0 | 0.0 | −0.8 | −0.6 | 0.0 | −0.4 | 0.0 | −0.1 | 0.0 |
| 7. Statistical | 0.0 | 0.0 | 0.3 | 0.0 | 0.0 | 0.0 | 0.0 | 0.0 | 0.0 | 0.0 | 0.0 | 0.1 | 0.0 | 0.0 | 0.0 |
| 8. Total Primary Supply | 62.6 | −26.9 | 24.8 | 4.2 | 0.8 | 0.9 | −0.5 | −0.5 | −1.0 | −1.9 | 0.0 | 14.8 | 1.9 | 0.0 | 0.0 |
| Transformation and secondary supply, input (+) and output (−) | |||||||||||||||
| 9. Gas Plants | |||||||||||||||
| 9.1 LNG | −35.8 | 27.9 | 0.0 | 0.0 | 0.0 | 0.0 | 0.2 | 0.0 | 0.0 | 0.0 | 0.0 | 0.0 | 0.0 | 0.0 | 0.0 |
| 9.2 MDS | −0.9 | 0.0 | 0.0 | 0.0 | 0.1 | 0.0 | 0.0 | 0.0 | 0.0 | 0.3 | 0.0 | 0.0 | 0.0 | 0.0 | 0.0 |
| 9.3 GPP-LPG 2,3 | −4.1 | 0.0 | 0.0 | 0.0 | 0.0 | 0.0 | 2.4 | 0.0 | 0.0 | 0.0 | 0.0 | 0.0 | 0.0 | 0.0 | 0.0 |
| 9. Gas Plant Subtotal | −40.7 | 27.9 | 0.0 | 0.0 | 0.1 | 0.0 | 2.6 | 0.0 | 0.0 | 0.3 | 0.0 | 0.0 | 0.0 | 0.0 | 0.0 |
| 10. Refineries | 0.0 | 0.0 | −24.8 | 3.6 | 8.9 | 0.6 | 0.7 | 0.4 | 3.5 | 4.6 | 1.7 | 0.0 | 0.0 | 0.0 | 0.0 |
| 11. Power station and self-generation | |||||||||||||||
| 11.1 Hydropower Stations | 0.0 | 0.0 | 0.0 | 0.0 | 0.0 | 0.0 | 0.0 | 0.0 | 0.0 | 0.0 | 0.0 | 0.0 | −1.9 | 0.0 | 0.7 |
| 11.2 Thermal Stations | −11.0 | 0.0 | 0.0 | 0.0 | −1.0 | −1.1 | 0.0 | 0.0 | 0.0 | 0.0 | 0.0 | −13.0 | 0.0 | 0.0 | 9.6 |
| 11.3 Self-Generation | −1.7 | 0.0 | 0.0 | 0.0 | −0.2 | 0.0 | 0.0 | 0.0 | 0.0 | 0.0 | 0.0 | 0.0 | 0.0 | 0.0 | 0.4 |
| 11. Power Station Subtotal | −12.7 | 0.0 | 0.0 | 0.0 | −1.2 | −1.1 | 0.0 | 0.0 | 0.0 | 0.0 | 0.0 | −13.0 | −1.9 | 0.0 | 10.7 |
| 12. Losses & Own Use | −0.6 | −1.1 | 0.0 | 0.0 | 0.0 | 0.0 | 0.0 | 0.0 | 0.0 | −1.7 | −1.6 | 0.0 | 0.0 | 0.0 | −1.1 |
| 13. Statistical Discrepancy | 0.0 | 0.0 | 0.0 | 0.4 | 0.0 | 0.0 | 0.0 | 0.1 | 0.1 | 0.0 | 0.0 | 0.0 | 0.0 | 0.0 | −0.3 |
| 14. Total Secondary Supply | −54.1 | 26.9 | −24.8 | 4.0 | 7.9 | −0.5 | 3.3 | 0.6 | 3.6 | 3.0 | 0.0 | −13.0 | −1.9 | 0.0 | 9.3 |
| End use | |||||||||||||||
| 15. Residential | 0.0 | 0.0 | 0.0 | 0.0 | 0.0 | 0.0 | 0.8 | 0.0 | 0.0 | 0.0 | 0.0 | 0.0 | 0.0 | 0.0 | 2.0 |
| 16. Commercial | 0.0 | 0.0 | 0.0 | 0.0 | 0.4 | 0.0 | 0.6 | 0.0 | 0.0 | 0.0 | 0.0 | 0.0 | 0.0 | 0.0 | 3.2 |
| 17. Industrial | 4.3 | 0.0 | 0.0 | 0.2 | 1.3 | 0.3 | 0.2 | 0.0 | 0.0 | 0.0 | 0.0 | 1.8 | 0.0 | 0.0 | 4.0 |
| 18. Transportation | 0.3 | 0.0 | 0.0 | 8.0 | 6.2 | 0.0 | 0.0 | 0.0 | 2.6 | 0.0 | 0.0 | 0.0 | 0.0 | 0.0 | 0.0 |
| 19. Agriculture | 0.0 | 0.0 | 0.0 | 0.0 | 0.9 | 0.0 | 0.0 | 0.0 | 0.0 | 0.0 | 0.0 | 0.0 | 0.0 | 0.0 | 0.0 |
| 20. Non-Fuel | 3.9 | 0.0 | 0.0 | 0.0 | 0.0 | 0.0 | 1.3 | 0.0 | 0.0 | 1.2 | 0.0 | 0.0 | 0.0 | 0.0 | 0.0 |
| 21. Total End Use | 8.5 | 0.0 | 0.0 | 8.2 | 8.7 | 0.4 | 2.9 | 0.0 | 2.6 | 1.2 | 0.0 | 1.8 | 0.0 | 0.0 | 9.2 |
| Energy carrier | |||||
|---|---|---|---|---|---|
| Primary energy | Crude oil | Natural gas | Coal | Hydropower | |
| LNG | 1.34 | 0 | 1.34 | 0 | 0 |
| Petrol | 1.17 | 1.17 | 0 | 0 | 0 |
| Diesel | 1.19 | 1.16 | 0.03 | 0 | 0 |
| Fuel Oil | 1.17 | 1.17 | 0 | 0 | 0 |
| LPG | 1.55 | 0.23 | 1.32 | 0 | 0 |
| Kerosene | 1.31 | 1.09 | 0.23 | 0 | 0 |
| ATF & AV | 1.17 | 1.17 | 0 | 0 | 0 |
| Non-Fuel | 1.27 | 1.11 | 0.16 | 0 | 0 |
| Electricity | 3.30 | 0.29 | 1.40 | 1.41 | 0.20 |
2.3.2. Other Energy Data
| Energy source | Natural gas | LNG | Crude oil | Others | Petroleum products | Coal | Hydropower | Electricity | ||||||
|---|---|---|---|---|---|---|---|---|---|---|---|---|---|---|
| Petrol | Diesel | Fuel oil | LPG | Kerosene | ATF AV | Non-Fuel | ||||||||
| Primary supply, input (+) and output (-) | ||||||||||||||
| 1. Primary Production | 69.8 | 0.0 | 28.7 | 0.0 | 0.0 | 0.0 | 0.0 | 0.0 | 0.0 | 0.0 | 0.0 | 1.9 | 1.9 | 0.0 |
| 2. Gas Flaring | −13.1 | 0.0 | 0.0 | 0.0 | 0.0 | 0.0 | 0.0 | 0.0 | 0.0 | 0.0 | 0.0 | 0.0 | 0.0 | 0.0 |
| 3. Imports | 7.0 | 0.0 | 9.2 | 0.2 | 4.9 | 4.5 | 1.7 | 0.8 | 0.2 | 0.6 | 1.3 | 13.4 | 0.0 | 0.1 |
| 4. Exports | −1.1 | −36.0 | −11.6 | −0.1 | 0.0 | −5.3 | −0.4 | −1.5 | −0.9 | −0.8 | −2.9 | −0.1 | 0.0 | 0.0 |
| 5. Bunkers | 0.0 | 0.0 | 0.0 | 0.0 | 0.0 | 0.0 | −0.2 | 0.0 | 0.0 | 0.0 | 0.0 | 0.0 | 0.0 | 0.0 |
| 6. Stock Change | 0.0 | 0.0 | −1.7 | 0.0 | 0.0 | 1.8 | 0.0 | 0.0 | 0.0 | −1.0 | −0.8 | −0.4 | 0.0 | 0.0 |
| 7. Total Primary Supply | 62.6 | −36.0 | 24.7 | 0.1 | 4.9 | 1.0 | 1.1 | −0.7 | −0.7 | −1.2 | −2.4 | 14.8 | 1.9 | 0.1 |
| Transformation, input (+) and output (-) | ||||||||||||||
| 8. Gas Plants | ||||||||||||||
| 8.1 LNG | −36.2 | 36.0 | 0.0 | 0.0 | 0.0 | 0.0 | 0.0 | 0.3 | 0.0 | 0.0 | 0.0 | 0.0 | 0.0 | 0.0 |
| 8.2 MDS | −0.9 | 0.0 | 0.0 | 0.0 | 0.0 | 0.2 | 0.0 | 0.0 | 0.1 | 0.0 | 0.5 | 0.0 | 0.0 | 0.0 |
| 8.3 GPP LPG | −4.1 | 0.0 | 0.0 | 0.0 | 0.0 | 0.0 | 0.0 | 4.1 | 0.0 | 0.0 | 0.0 | 0.0 | 0.0 | 0.0 |
| 8. Gas Plant Subtotal | −41.2 | 36.0 | 0.0 | 0.0 | 0.0 | 0.2 | 0.0 | 4.4 | 0.1 | 0.0 | 0.5 | 0.0 | 0.0 | 0.0 |
| 9. Refineries | 0.0 | 0.0 | −24.7 | −0.1 | 4.7 | 10.5 | 0.7 | 0.8 | 0.6 | 4.2 | 3.4 | 0.0 | 0.0 | 0.0 |
| 10. Power Station and Self-Generation | ||||||||||||||
| 10.1 Hydropower Stations | 0.0 | 0.0 | 0.0 | 0.0 | 0.0 | 0.0 | 0.0 | 0.0 | 0.0 | 0.0 | 0.0 | 0.0 | −1.9 | 1.9 |
| 10.2 Thermal Stations | −11.1 | 0.0 | 0.0 | 0.0 | 0.0 | −1.2 | −1.3 | 0.0 | 0.0 | 0.0 | 0.0 | −13.0 | 0.0 | 26.6 |
| 10.3 Self-Generation | −1.7 | 0.0 | 0.0 | 0.0 | 0.0 | −0.2 | 0.0 | 0.0 | 0.0 | 0.0 | 0.0 | 0.0 | 0.0 | 2.0 |
| 10. Power Station Subtotal | −12.9 | 0.0 | 0.0 | 0.0 | 0.0 | −1.4 | −1.3 | 0.0 | 0.0 | 0.0 | 0.0 | −13.0 | −1.9 | 30.4 |
| 11. Total Secondary Supply | −54.1 | 36.0 | −24.7 | −0.1 | 4.7 | 9.3 | −0.6 | 5.2 | 0.7 | 4.2 | 3.9 | −13.0 | −1.9 | 30.4 |
| End use | ||||||||||||||
| 15. Residential | 0.0 | 0.0 | 0.0 | 0.0 | 0.0 | 0.0 | 0.0 | 1.2 | 0.0 | 0.0 | 0.0 | 0.0 | 0.0 | 6.5 |
| 16. Commercial | 0.0 | 0.0 | 0.0 | 0.0 | 0.0 | 0.5 | 0.0 | 0.9 | 0.0 | 0.0 | 0.0 | 0.0 | 0.0 | 10.5 |
| 17. Industrial | 4.3 | 0.0 | 0.0 | 0.0 | 0.2 | 1.5 | 0.4 | 0.3 | 0.0 | 0.0 | 0.0 | 1.8 | 0.0 | 13.4 |
| 18. Transportation | 0.3 | 0.0 | 0.0 | 0.0 | 9.4 | 7.3 | 0.0 | 0.0 | 0.0 | 3.0 | 0.0 | 0.0 | 0.0 | 0.1 |
| 19. Agriculture | 0.0 | 0.0 | 0.0 | 0.0 | 0.0 | 1.0 | 0.0 | 0.0 | 0.0 | 0.0 | 0.0 | 0.0 | 0.0 | 0.1 |
| 20. Non-Fuel | 3.9 | 0.0 | 0.0 | 0.0 | 0.0 | 0.0 | 0.0 | 2.0 | 0.0 | 0.0 | 1.5 | 0.0 | 0.0 | 0.0 |
| 21. Total End Use | 4.6 | 0.0 | 0.0 | 0.0 | 9.5 | 10.3 | 0.5 | 2.5 | 0.0 | 3.0 | 0.0 | 1.8 | 0.0 | 30.5 |
| Item | Data |
|---|---|
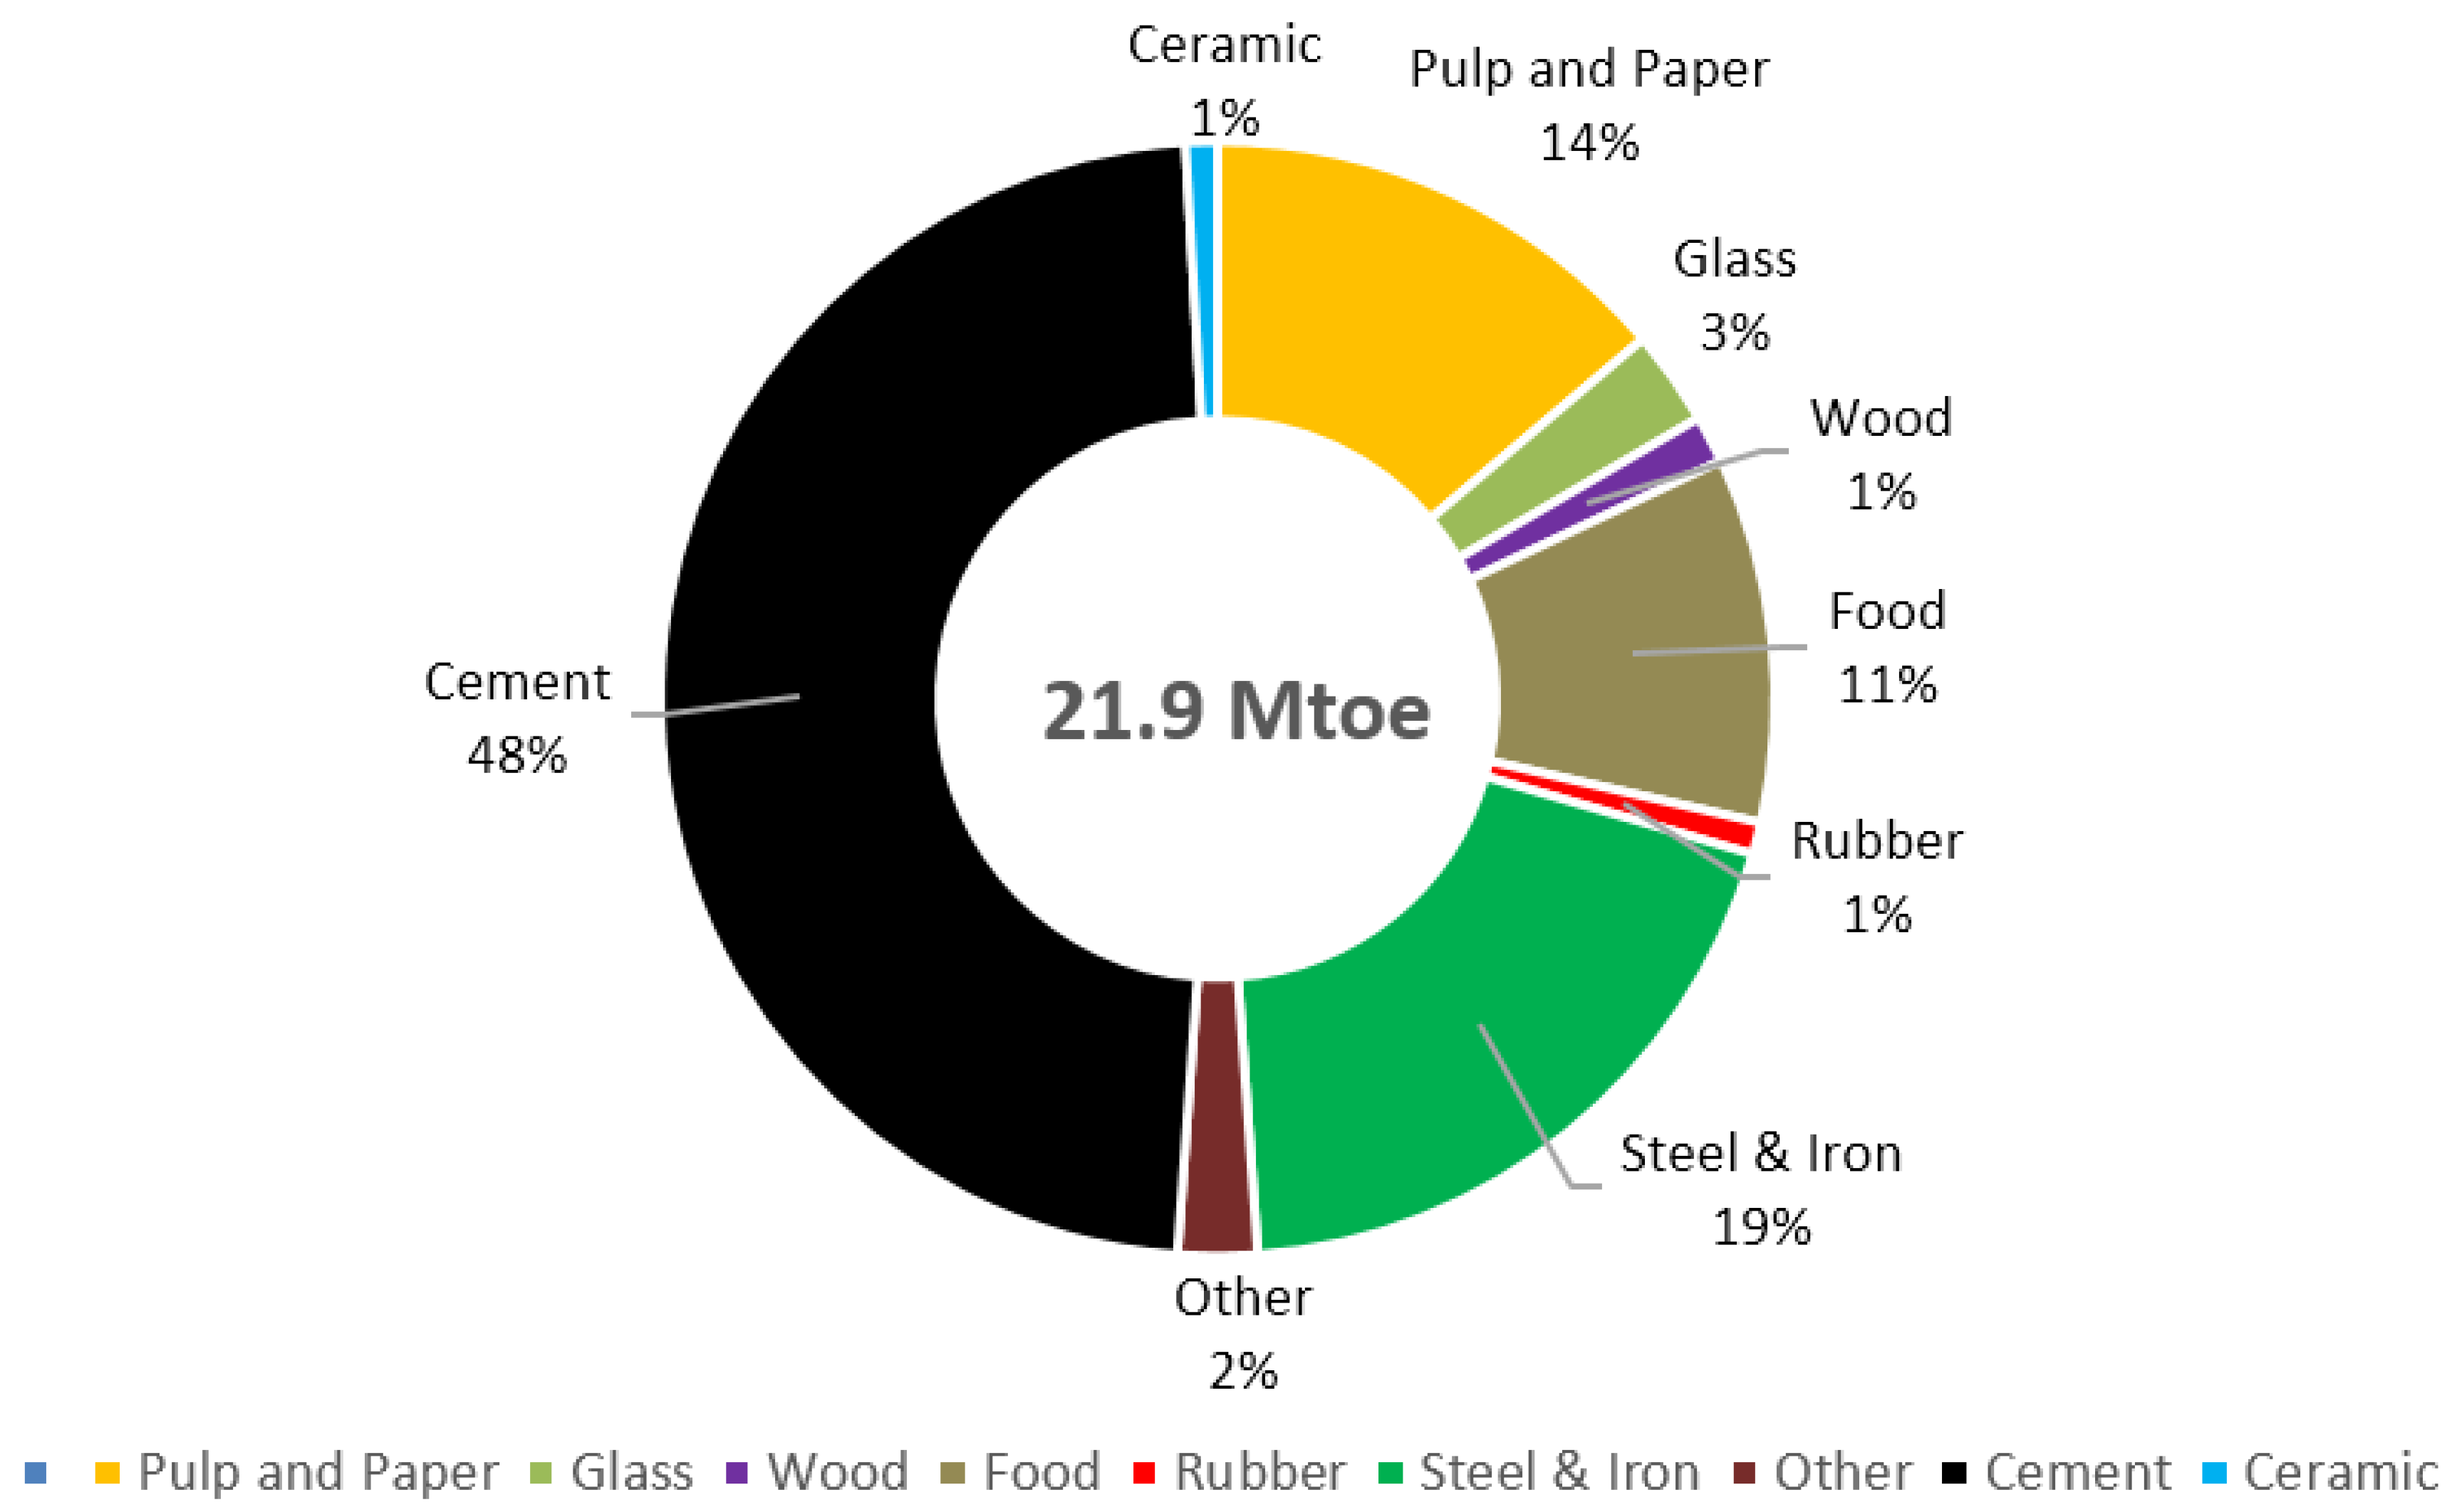
| Industrial | According to the energy audit launched under the Malaysian Energy Efficiency Improvement Program (MIEEIP) in 2005 [23], most of the energy input into the industrial sector was consumed by eight industries. Therefore, we could consider the industrial energy input equally based on these ratios: (1) Cement 47.6%; (2) Steel & iron 19.2%; (3) Pulp and paper 13.9%; (4) Food 10.6%; (5) Glass 2.9%; (6) Wood 1.4%; (7) Rubber 1.1%; (8) Ceramic 0.9%; and (9) Other 2.3%. |
| Commercial | Electricity and LPG were the main energy types consumed in the commercial sector. We assumed that LPG was used as cooking gas [12]. The end use of electricity could be allocated as (1) air-conditioning 64%; (2) illumination 12% and (3) others 24%. |
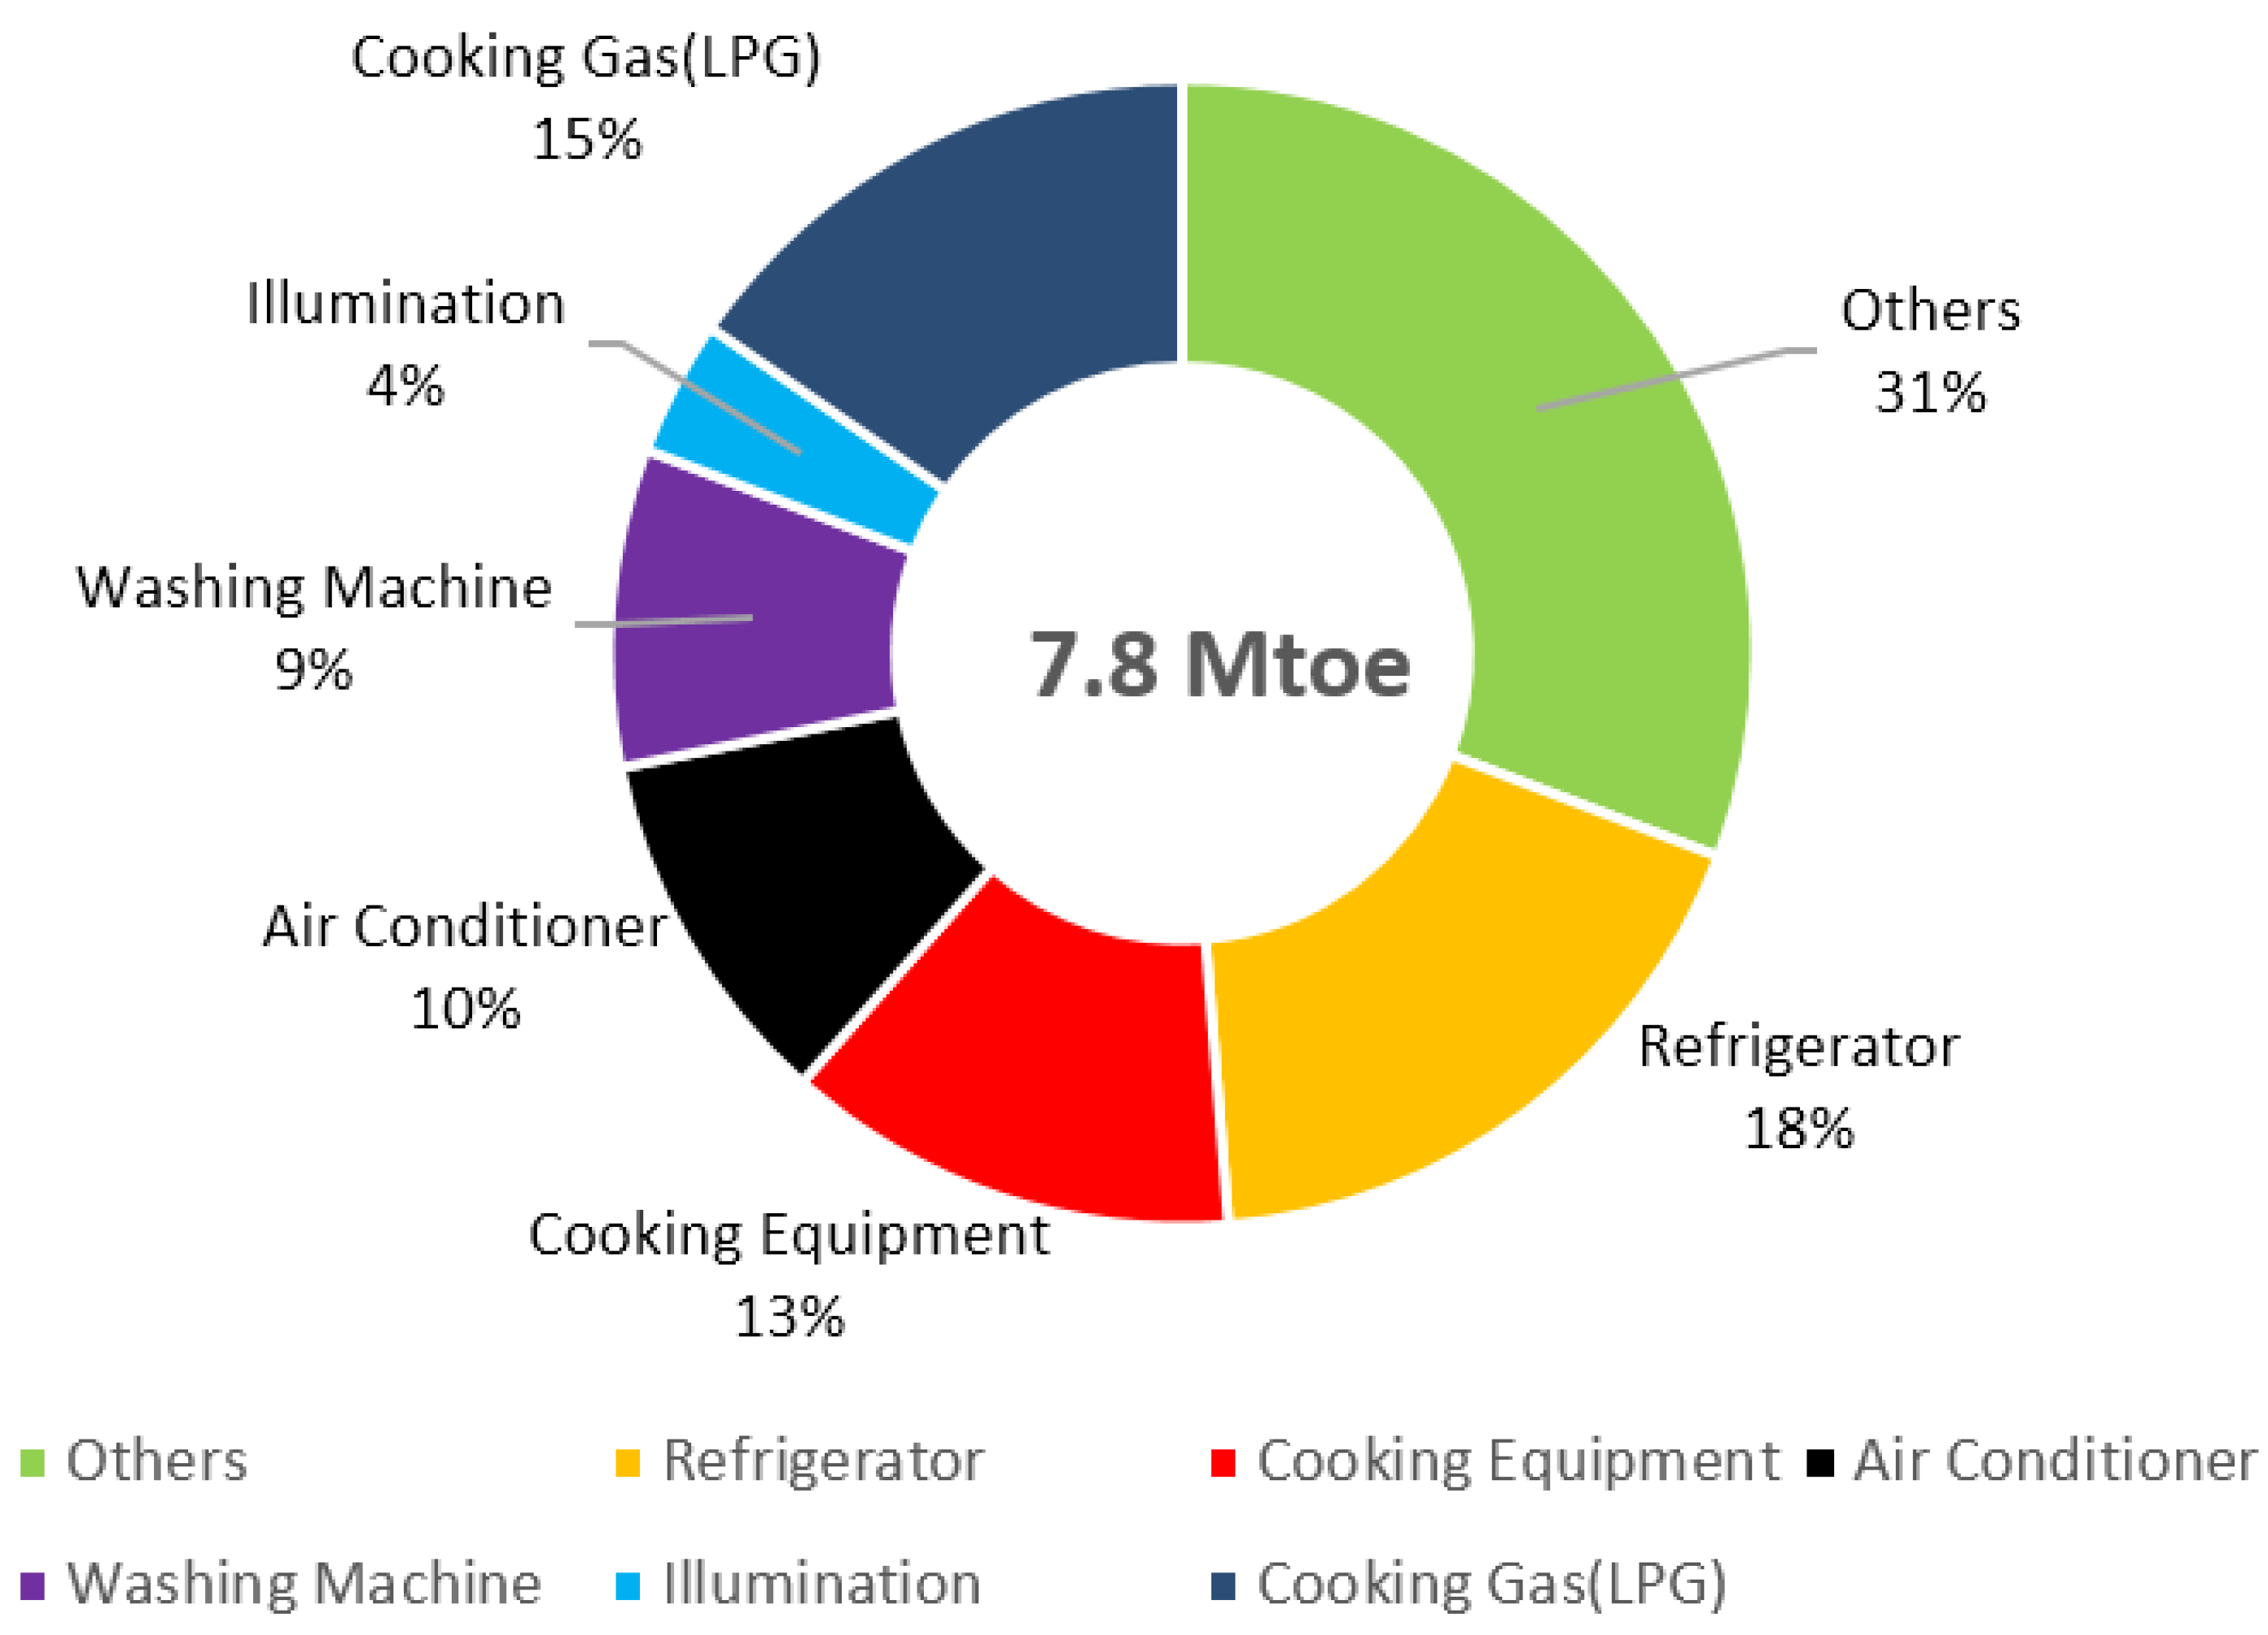
| Residential | Electricity and LPG were the main energy types consumed in the residential sector. We assumed that LPG was used as cooking gas [11]. The end use of electricity could be allocated as (1) refrigeration 21.1%; (2) cooking equipment 14.7%; (3) air-conditioning 11.9%; (4) washing machines 10.5%; (5) illumination 5.1% and others 36.7%. |
| Transportation | Four main vehicles were listed, including motorcars, trucks, buses and planes. Motorcycles, rail transport, and ships were ignored as they consume only a small portion of energy in Malaysia. We assumed that all petrol was consumed within gasoline cars. In addition, we also assumed diesel was consumed within only diesel cars, buses and trucks [24]: (1) motorcars (petrol) 100%; (2) motorcars (diesel) 6.6%; (3) buses (diesel) 5.5%; and (4) trucks (diesel) 87.9%. |
| Agriculture | Agricultural covers agricultural, forestry and fishing activity. This only contributes a very small portion of energy consumption in Malaysia. |
3. Current Status
- (1)
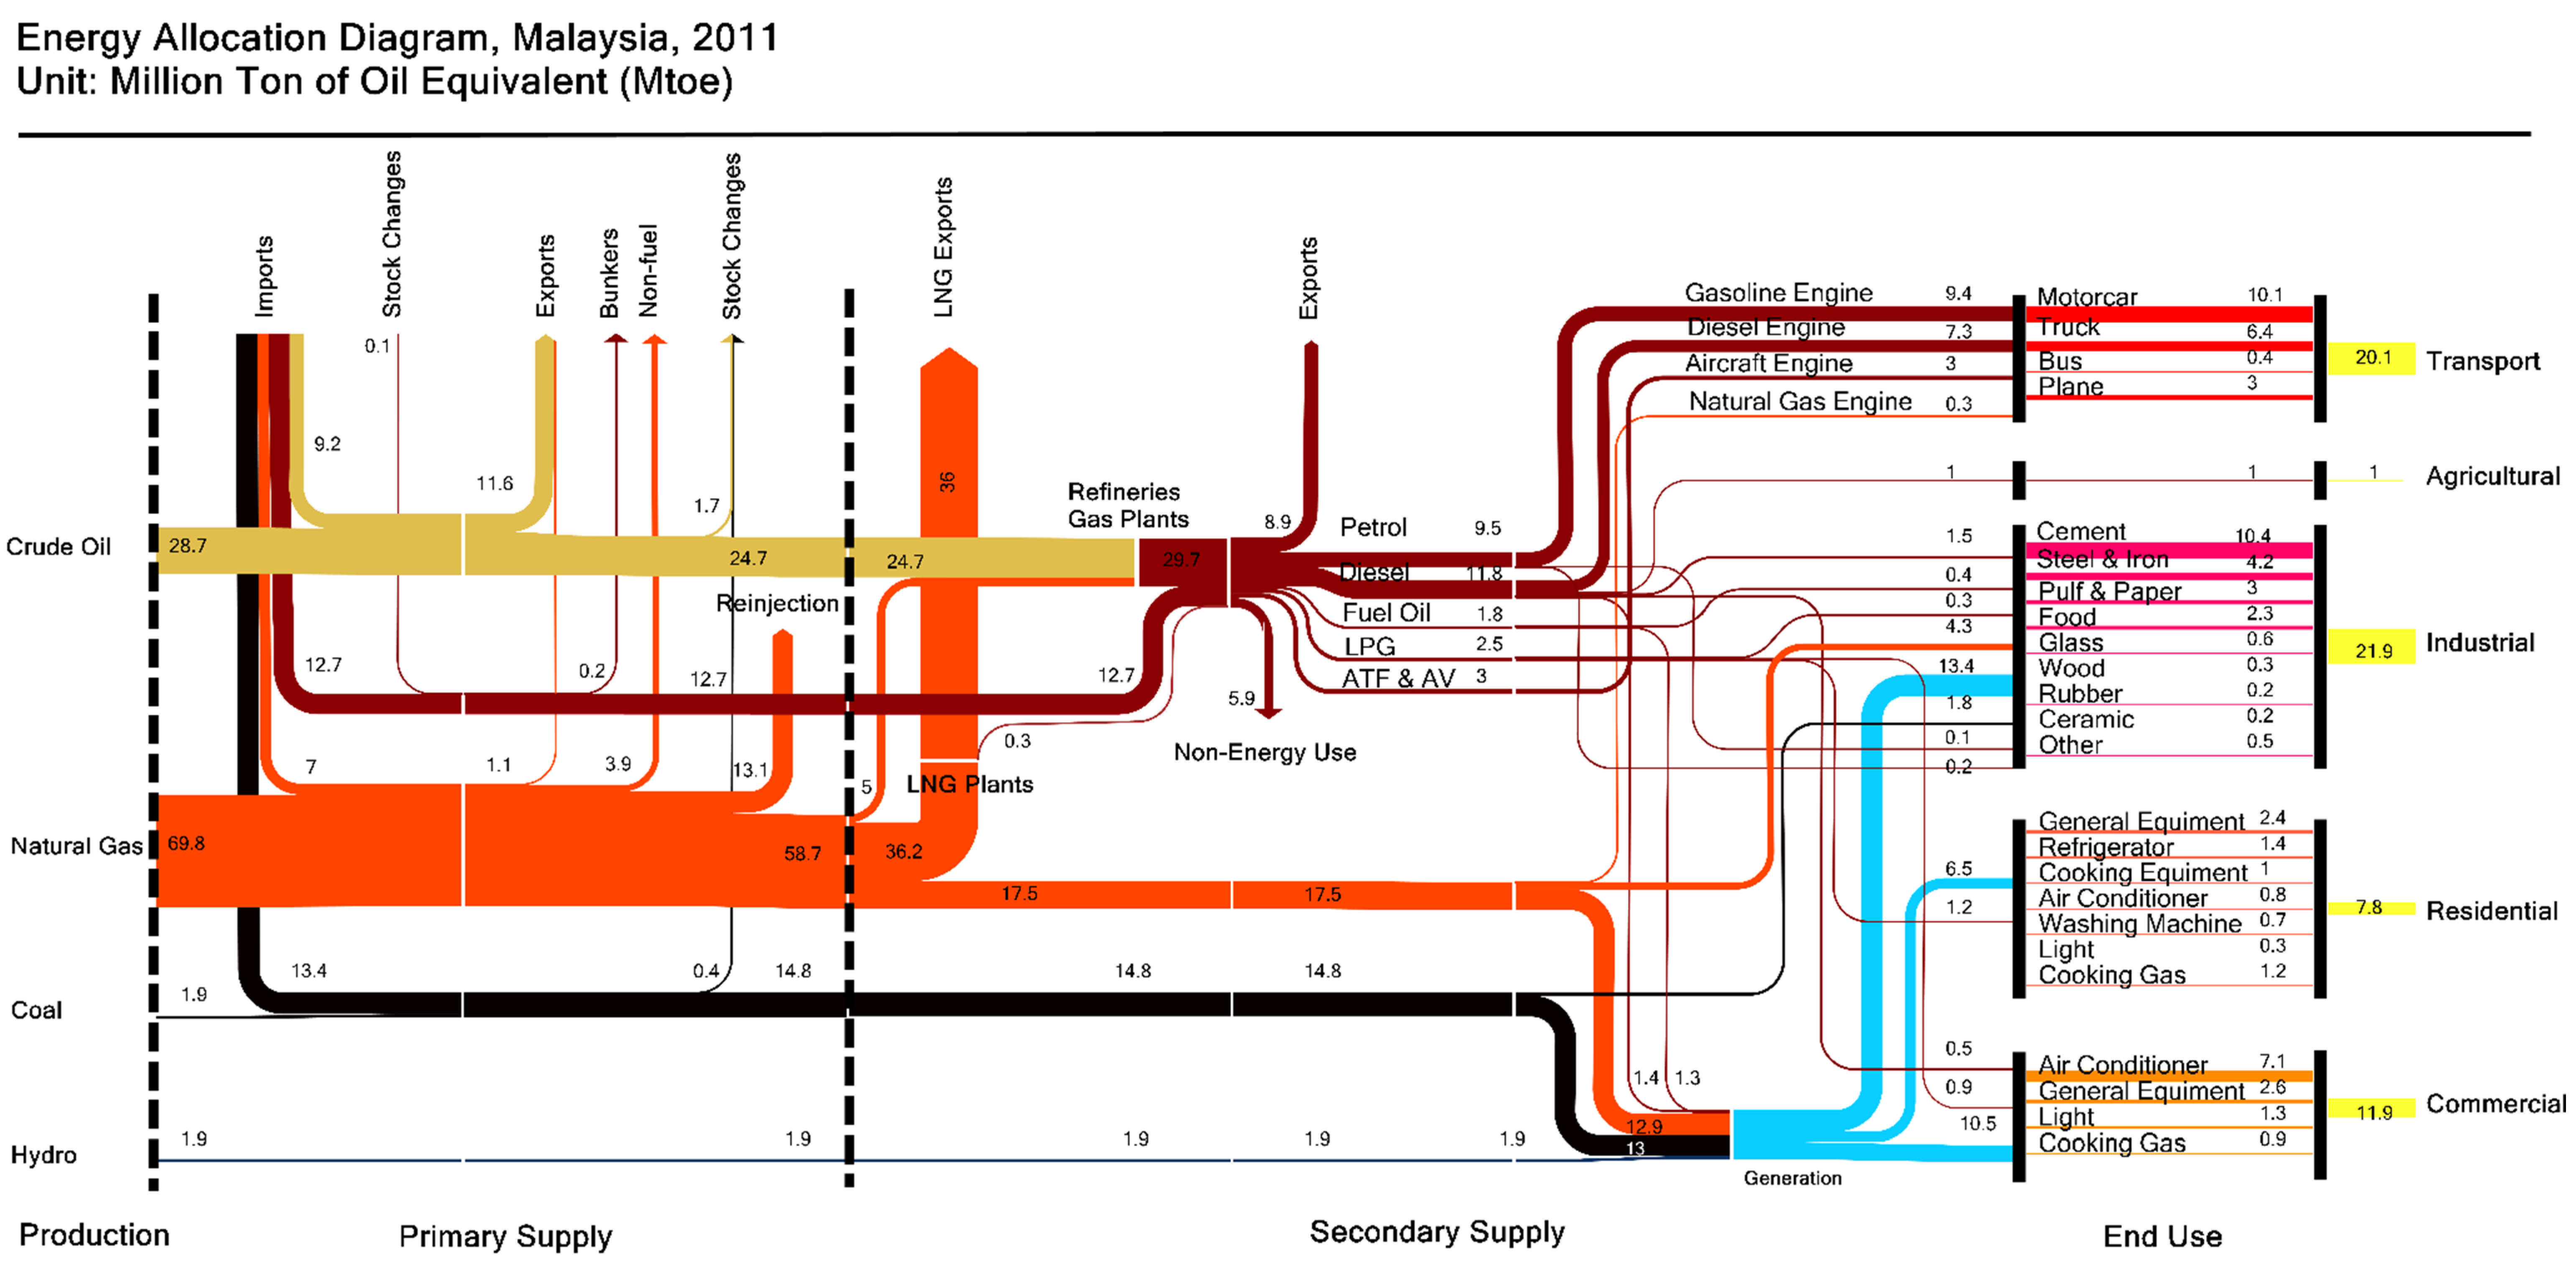
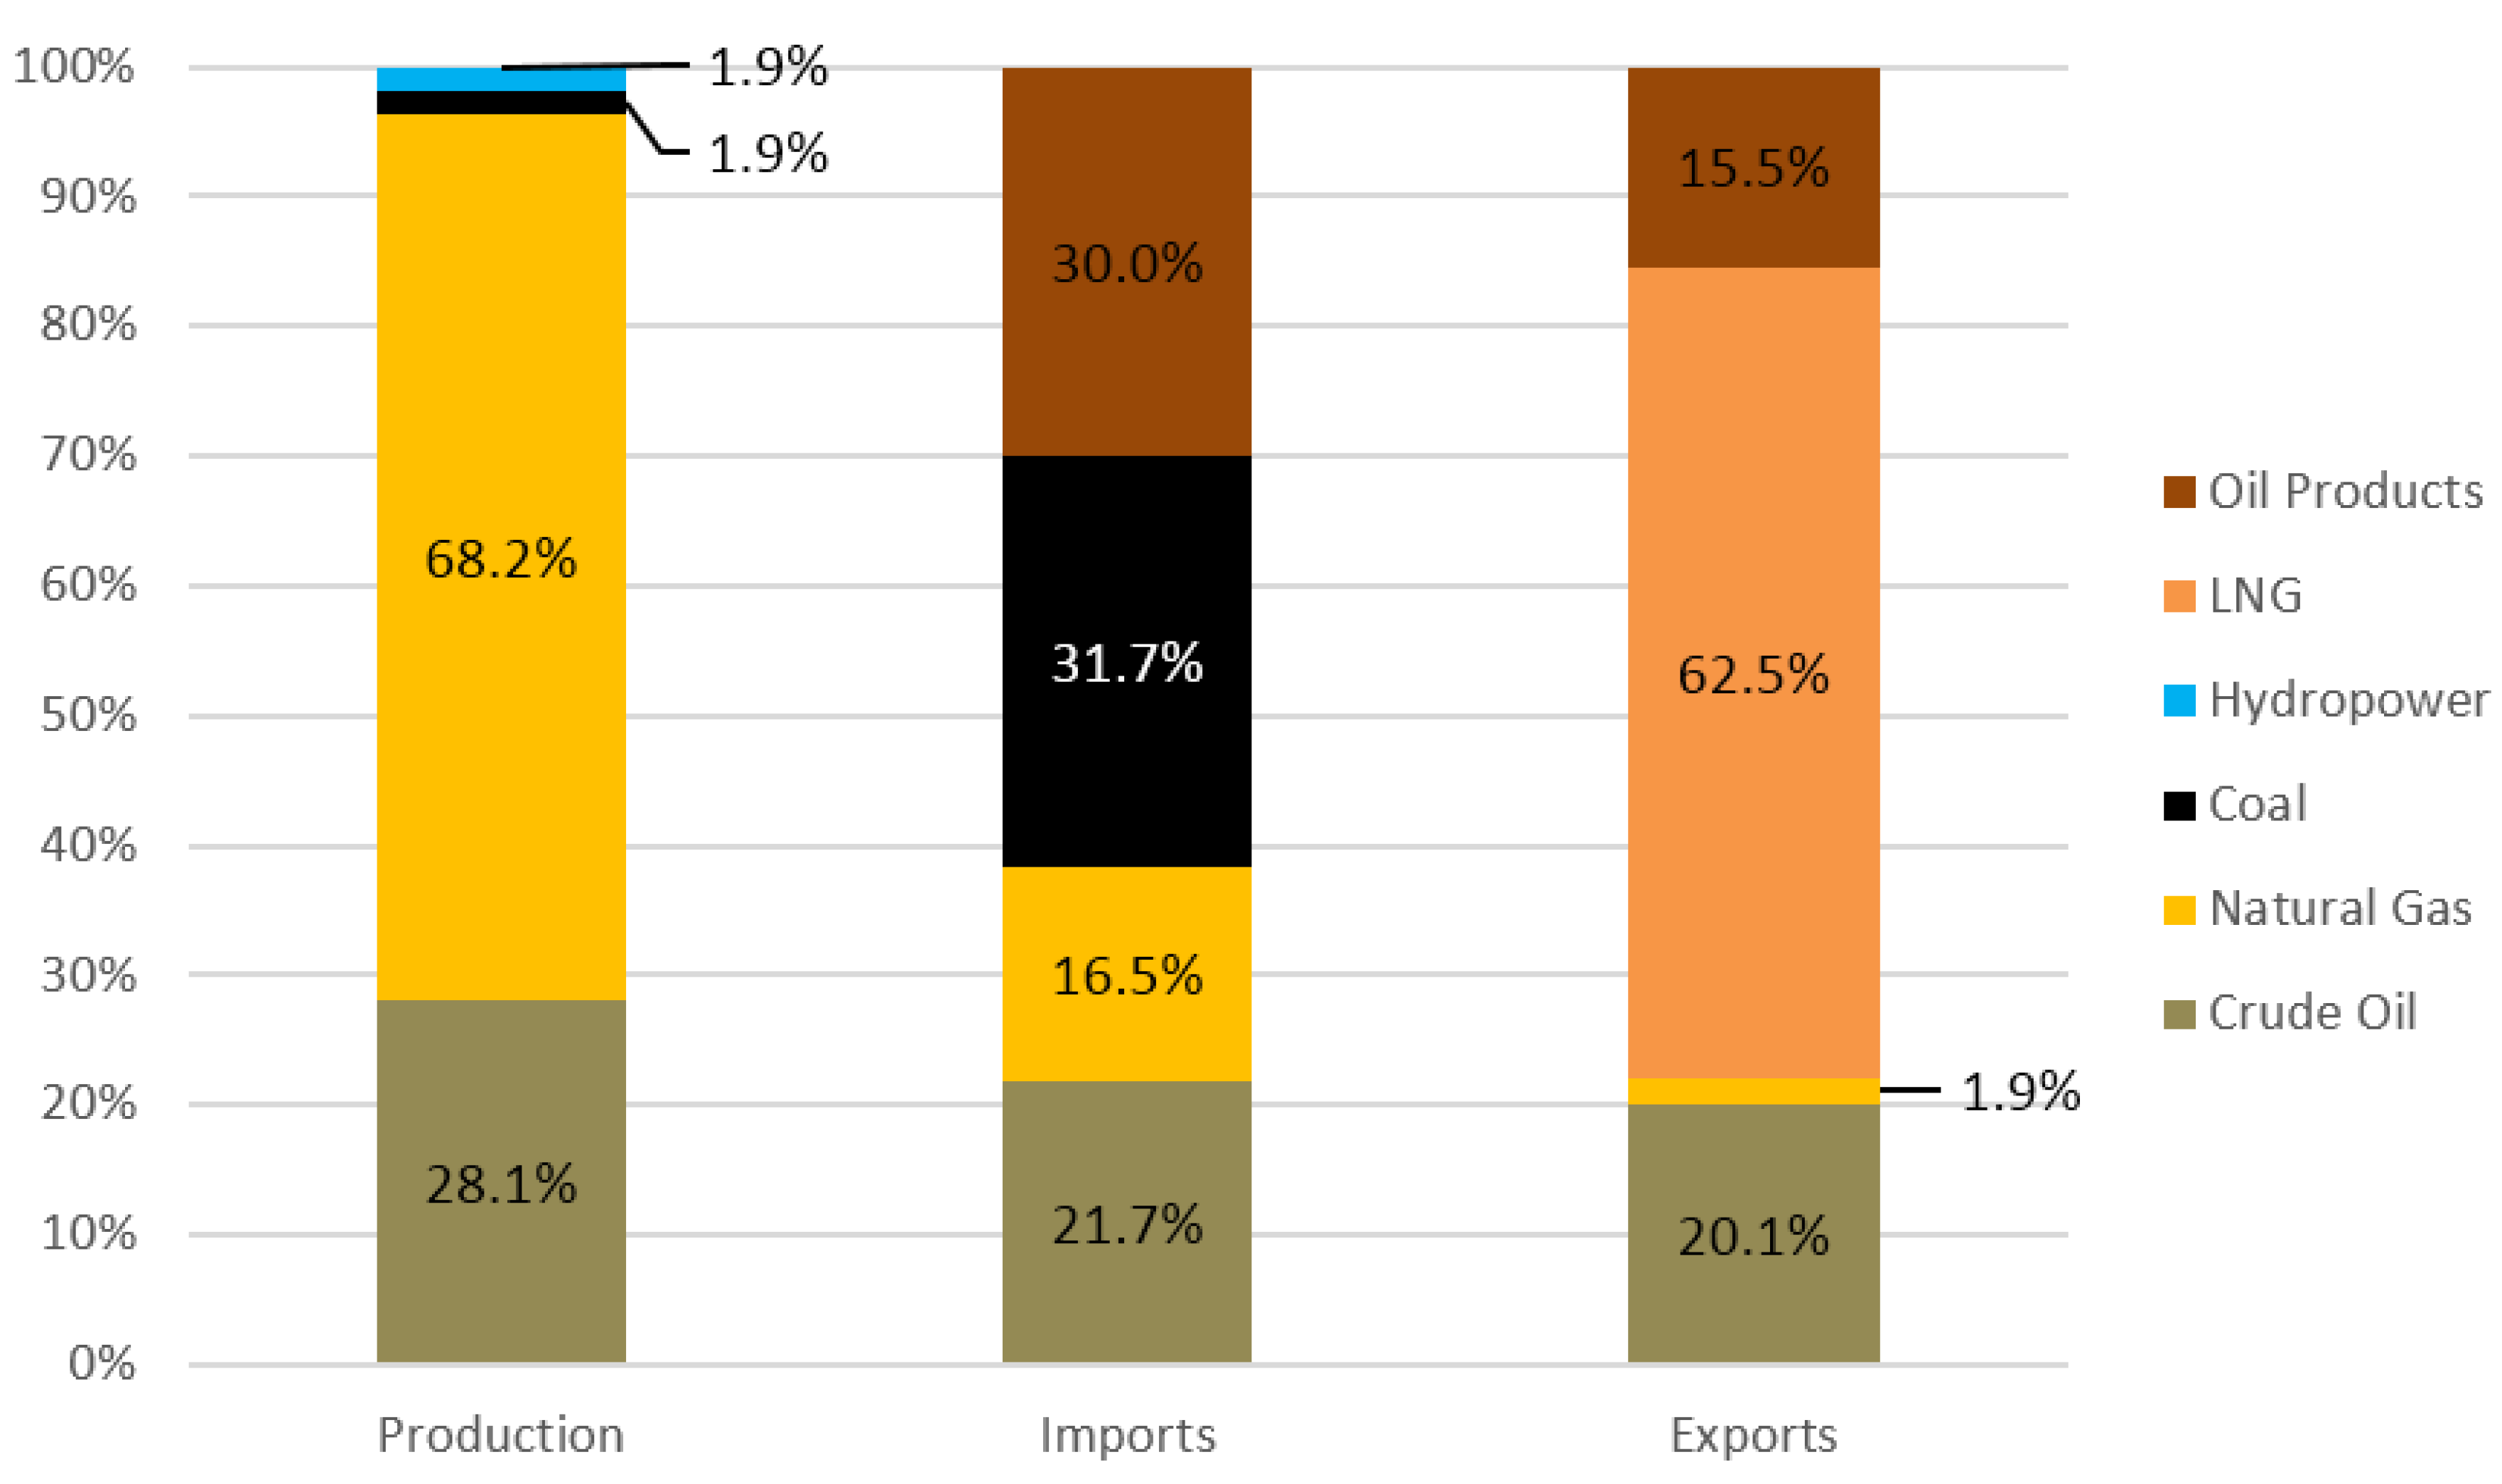
- Malaysia’s energy supply mainly came from crude oil, natural gas, coal and hydropower. Most of the crude oil and natural gas supply in Malaysia came from domestic production, whereas the vast majority of coal was imported.
- (2)
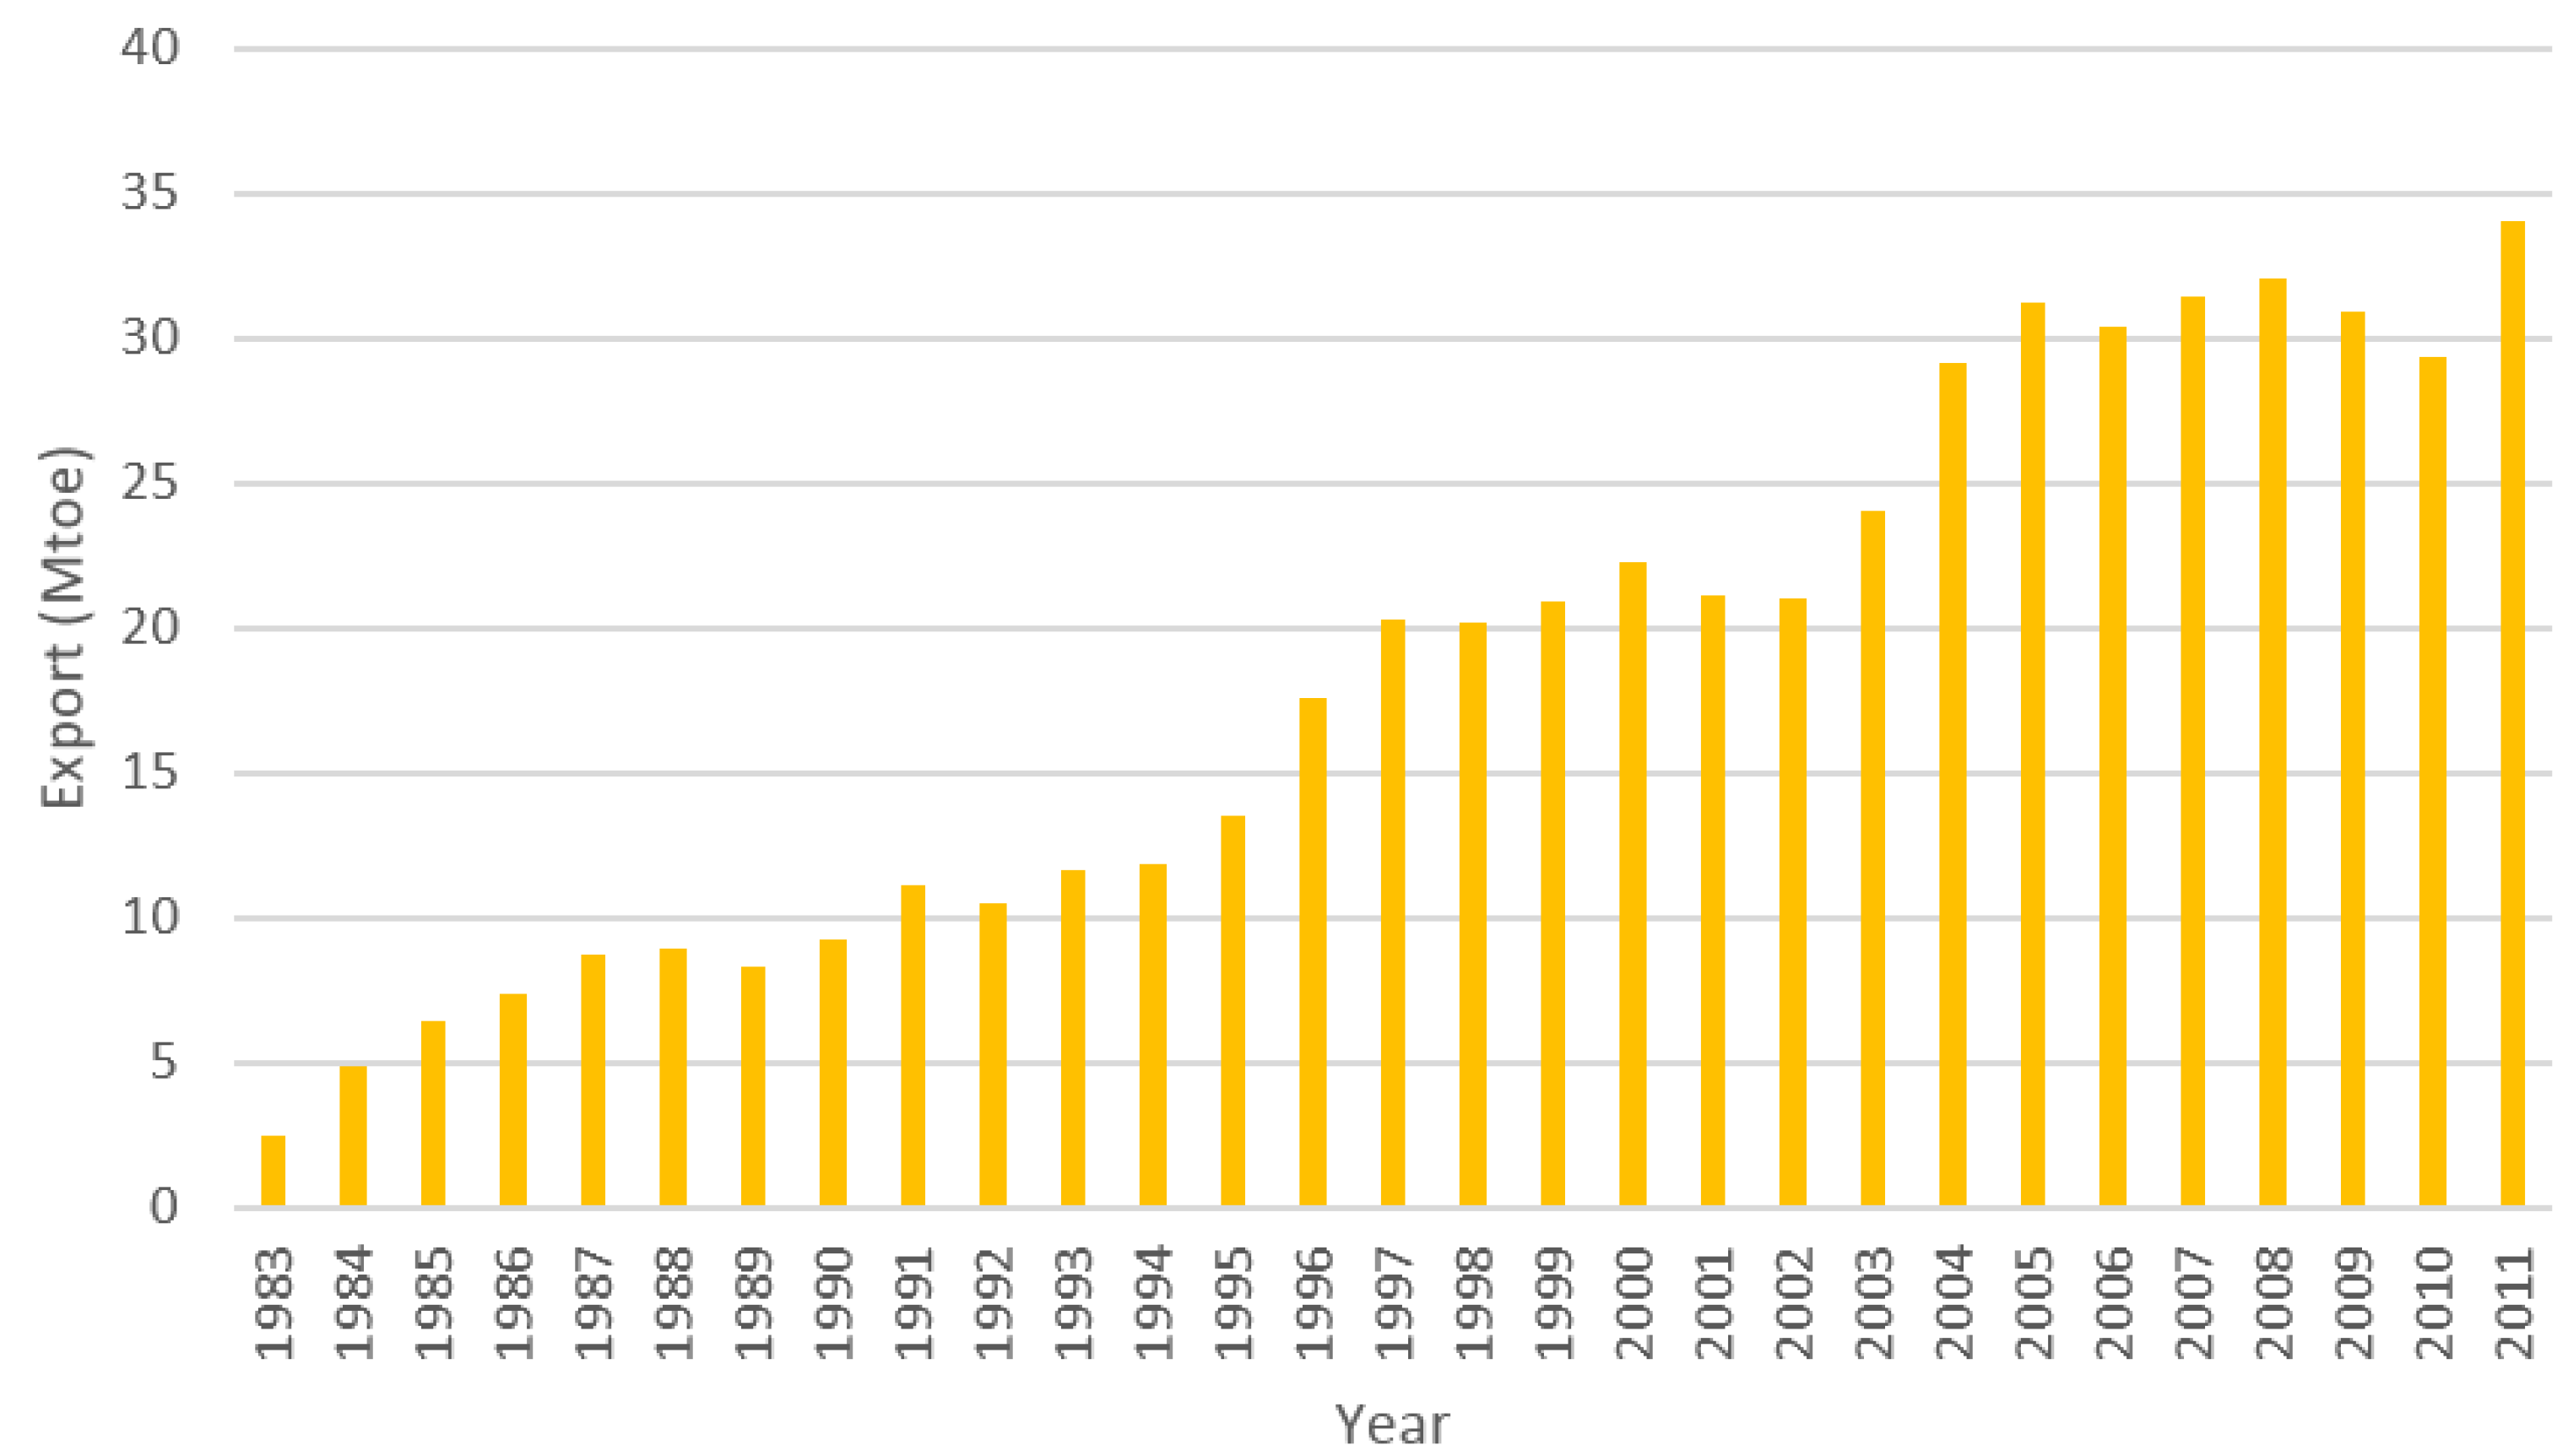
- Malaysia is a net energy exporting country, whereas crude oil and natural gas were the main energy types exported, and 97% of natural gas was exported in LNG form.
- (3)
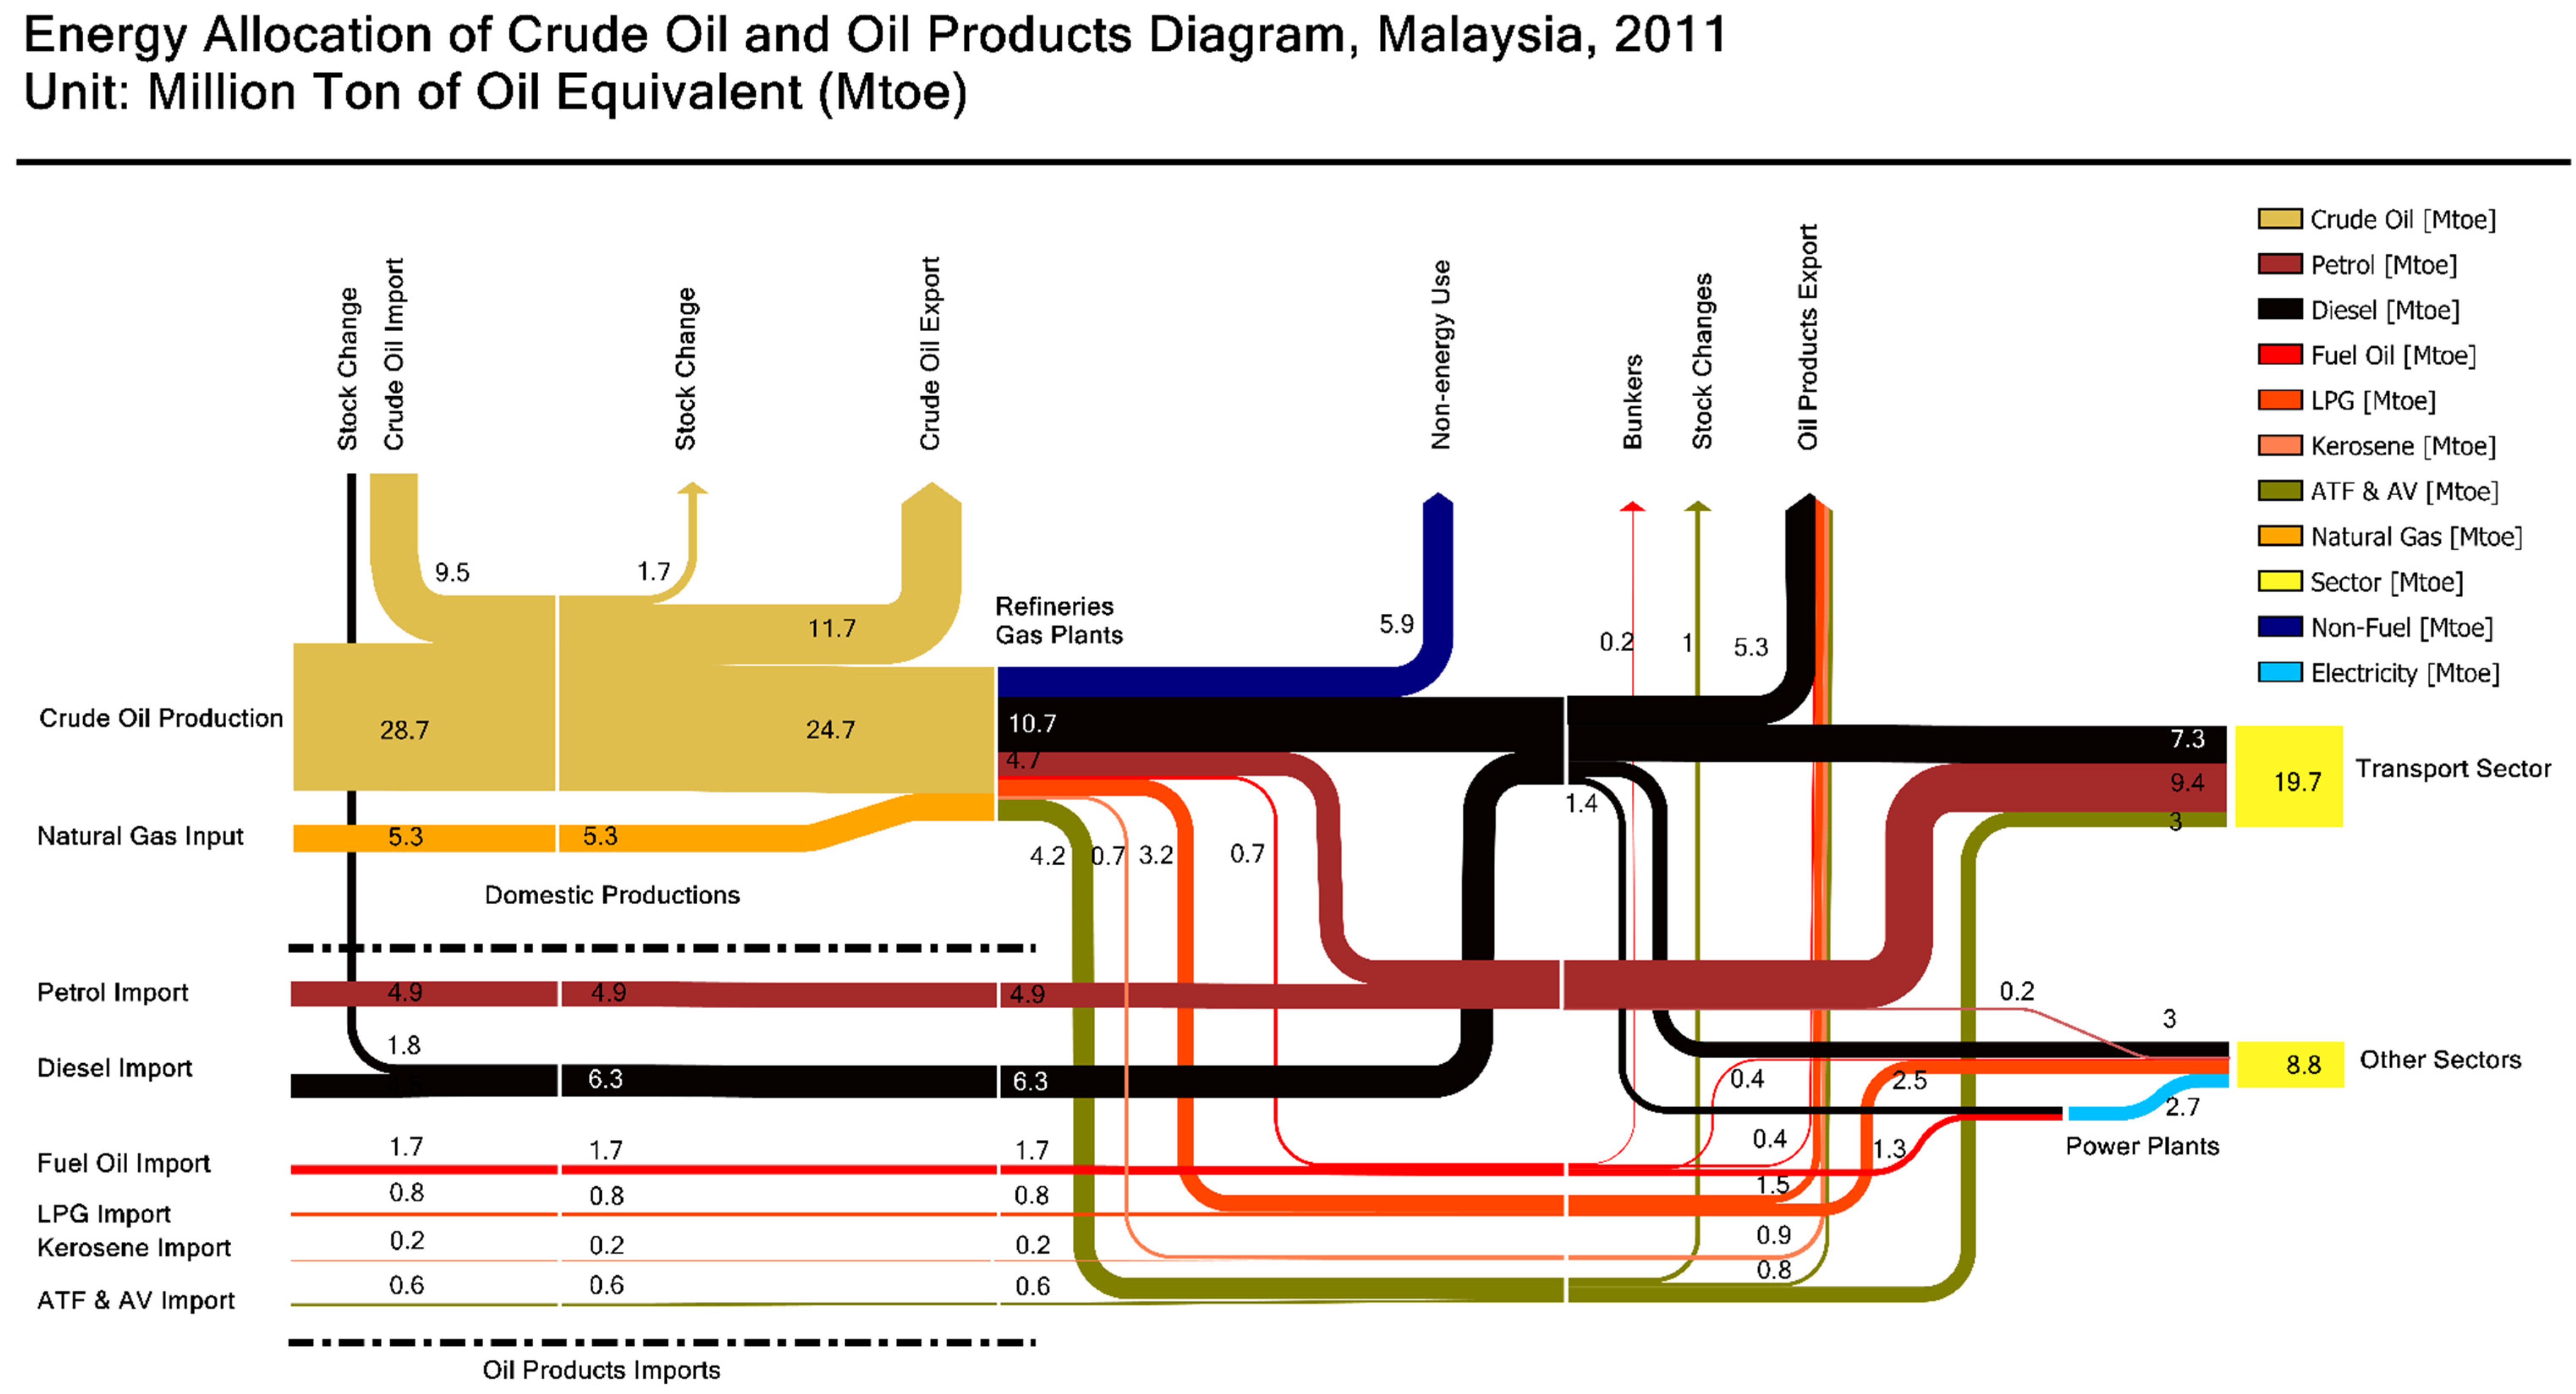
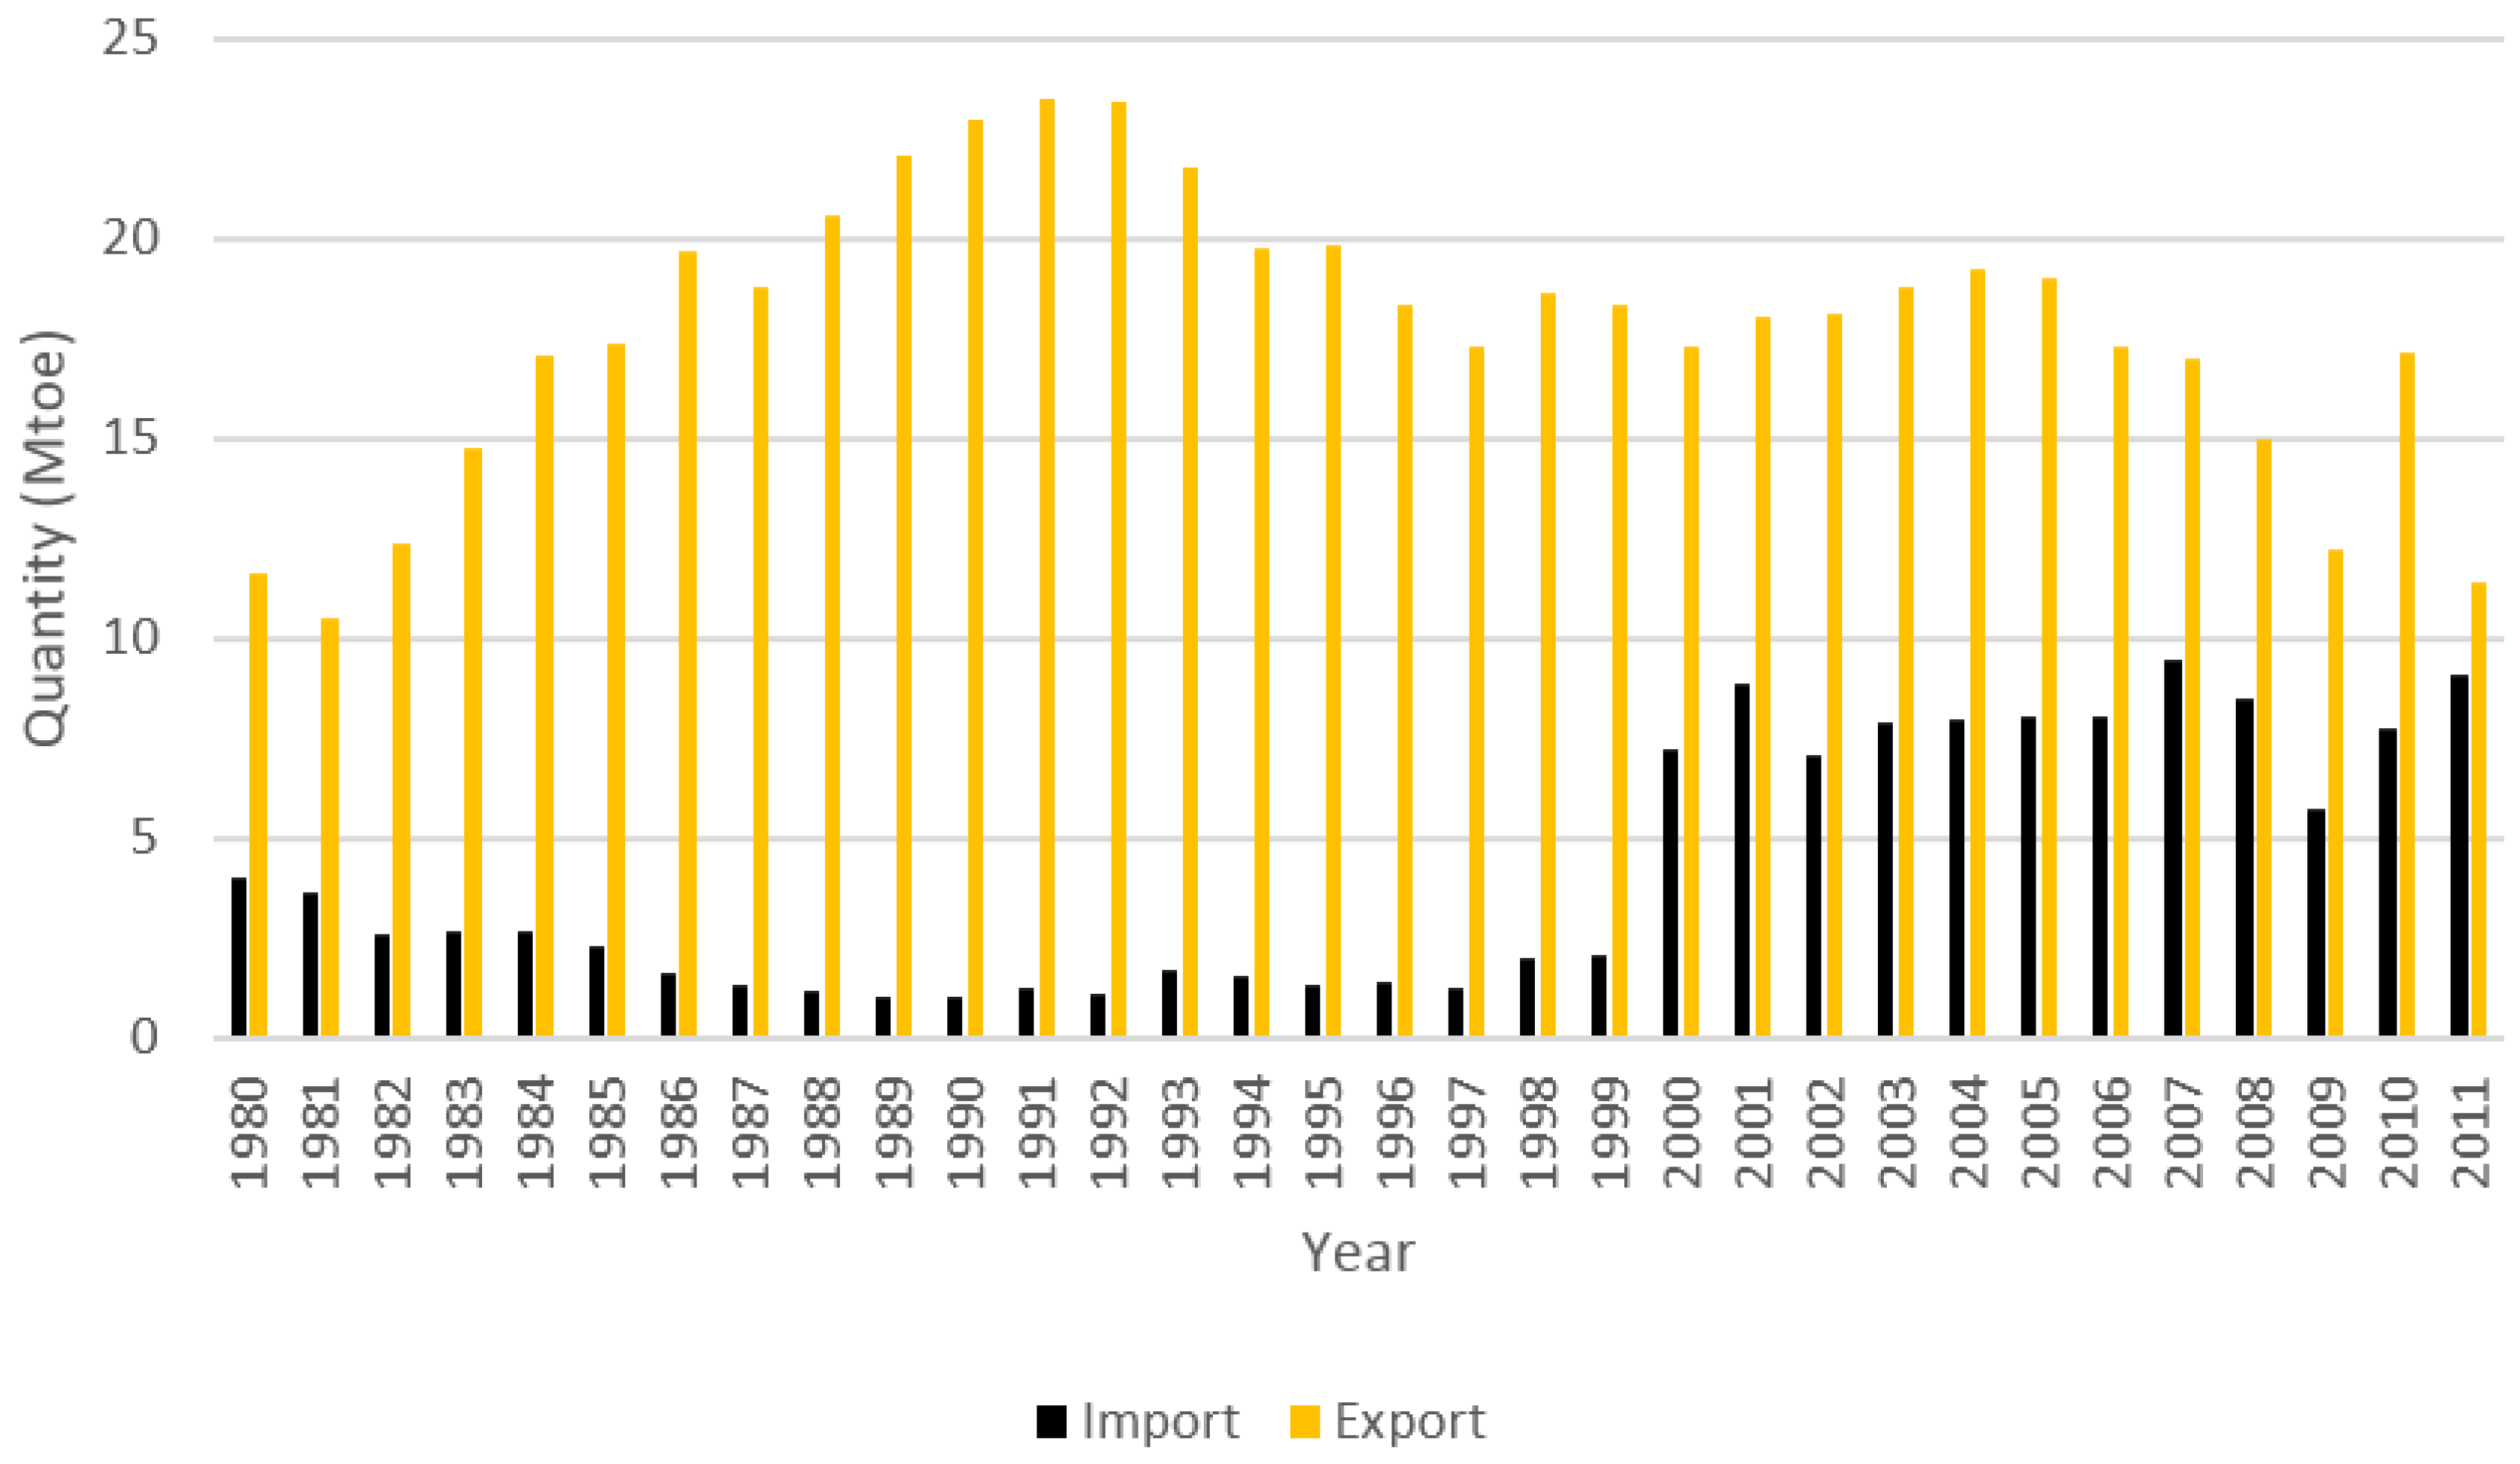
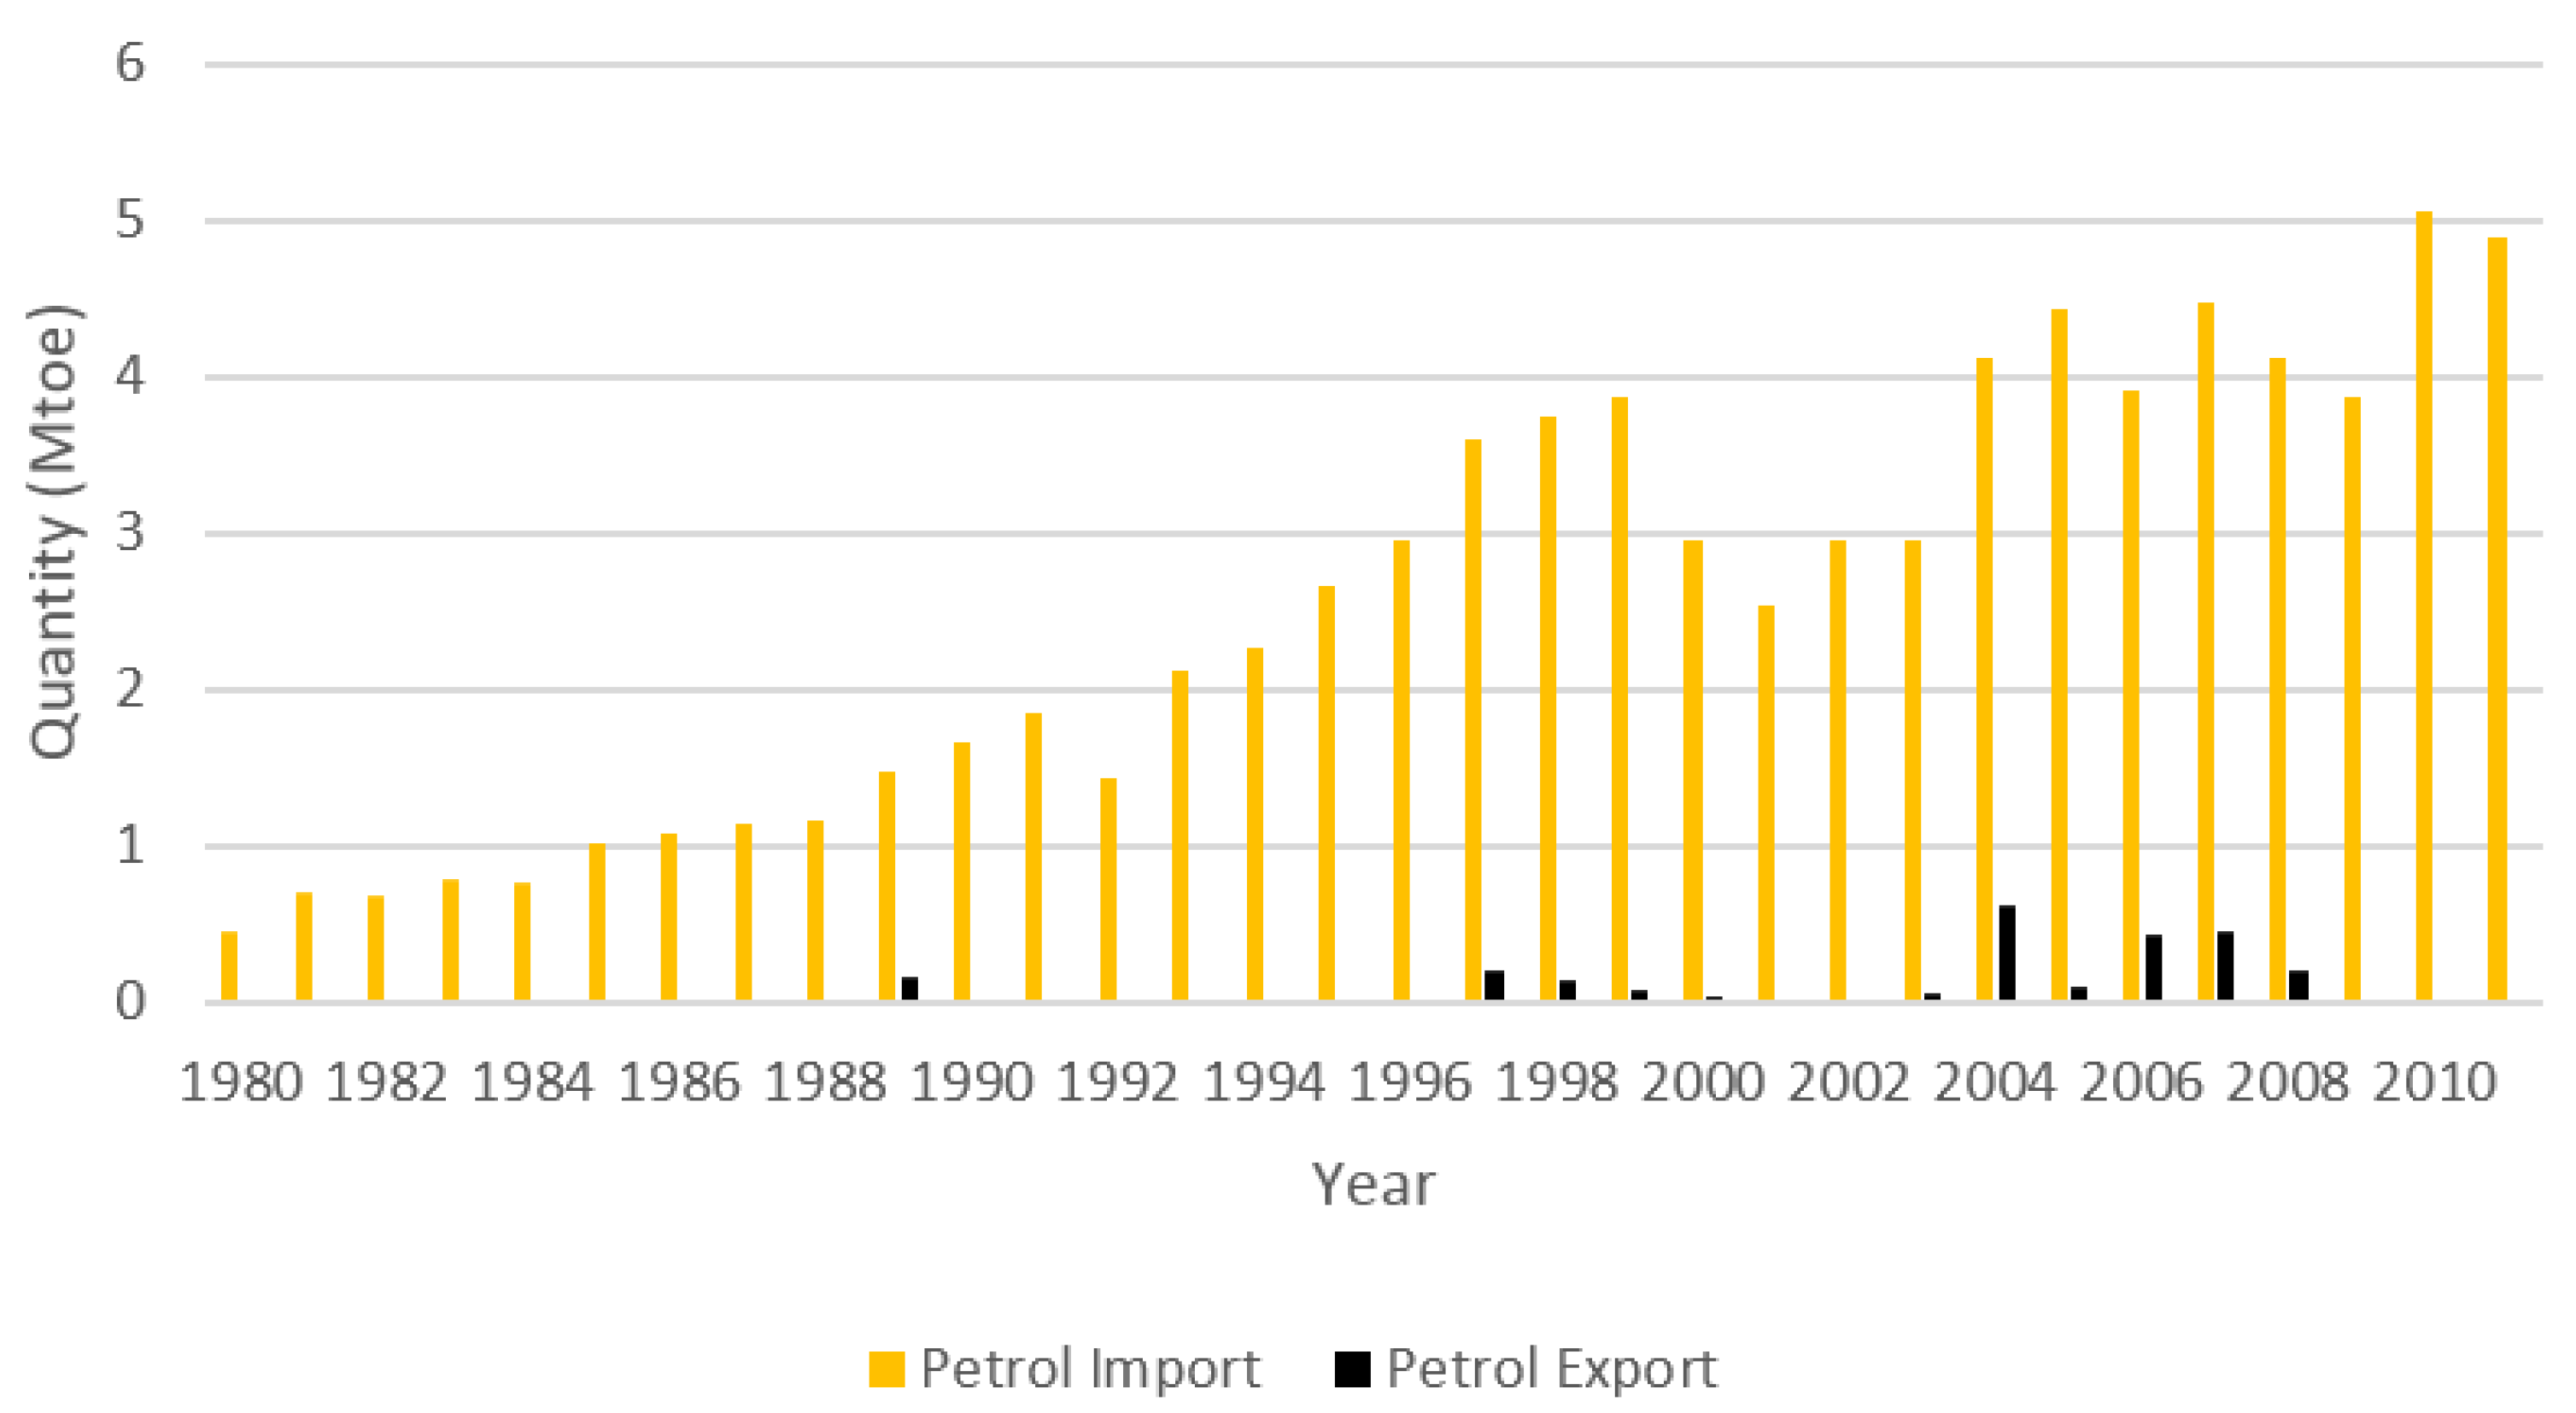
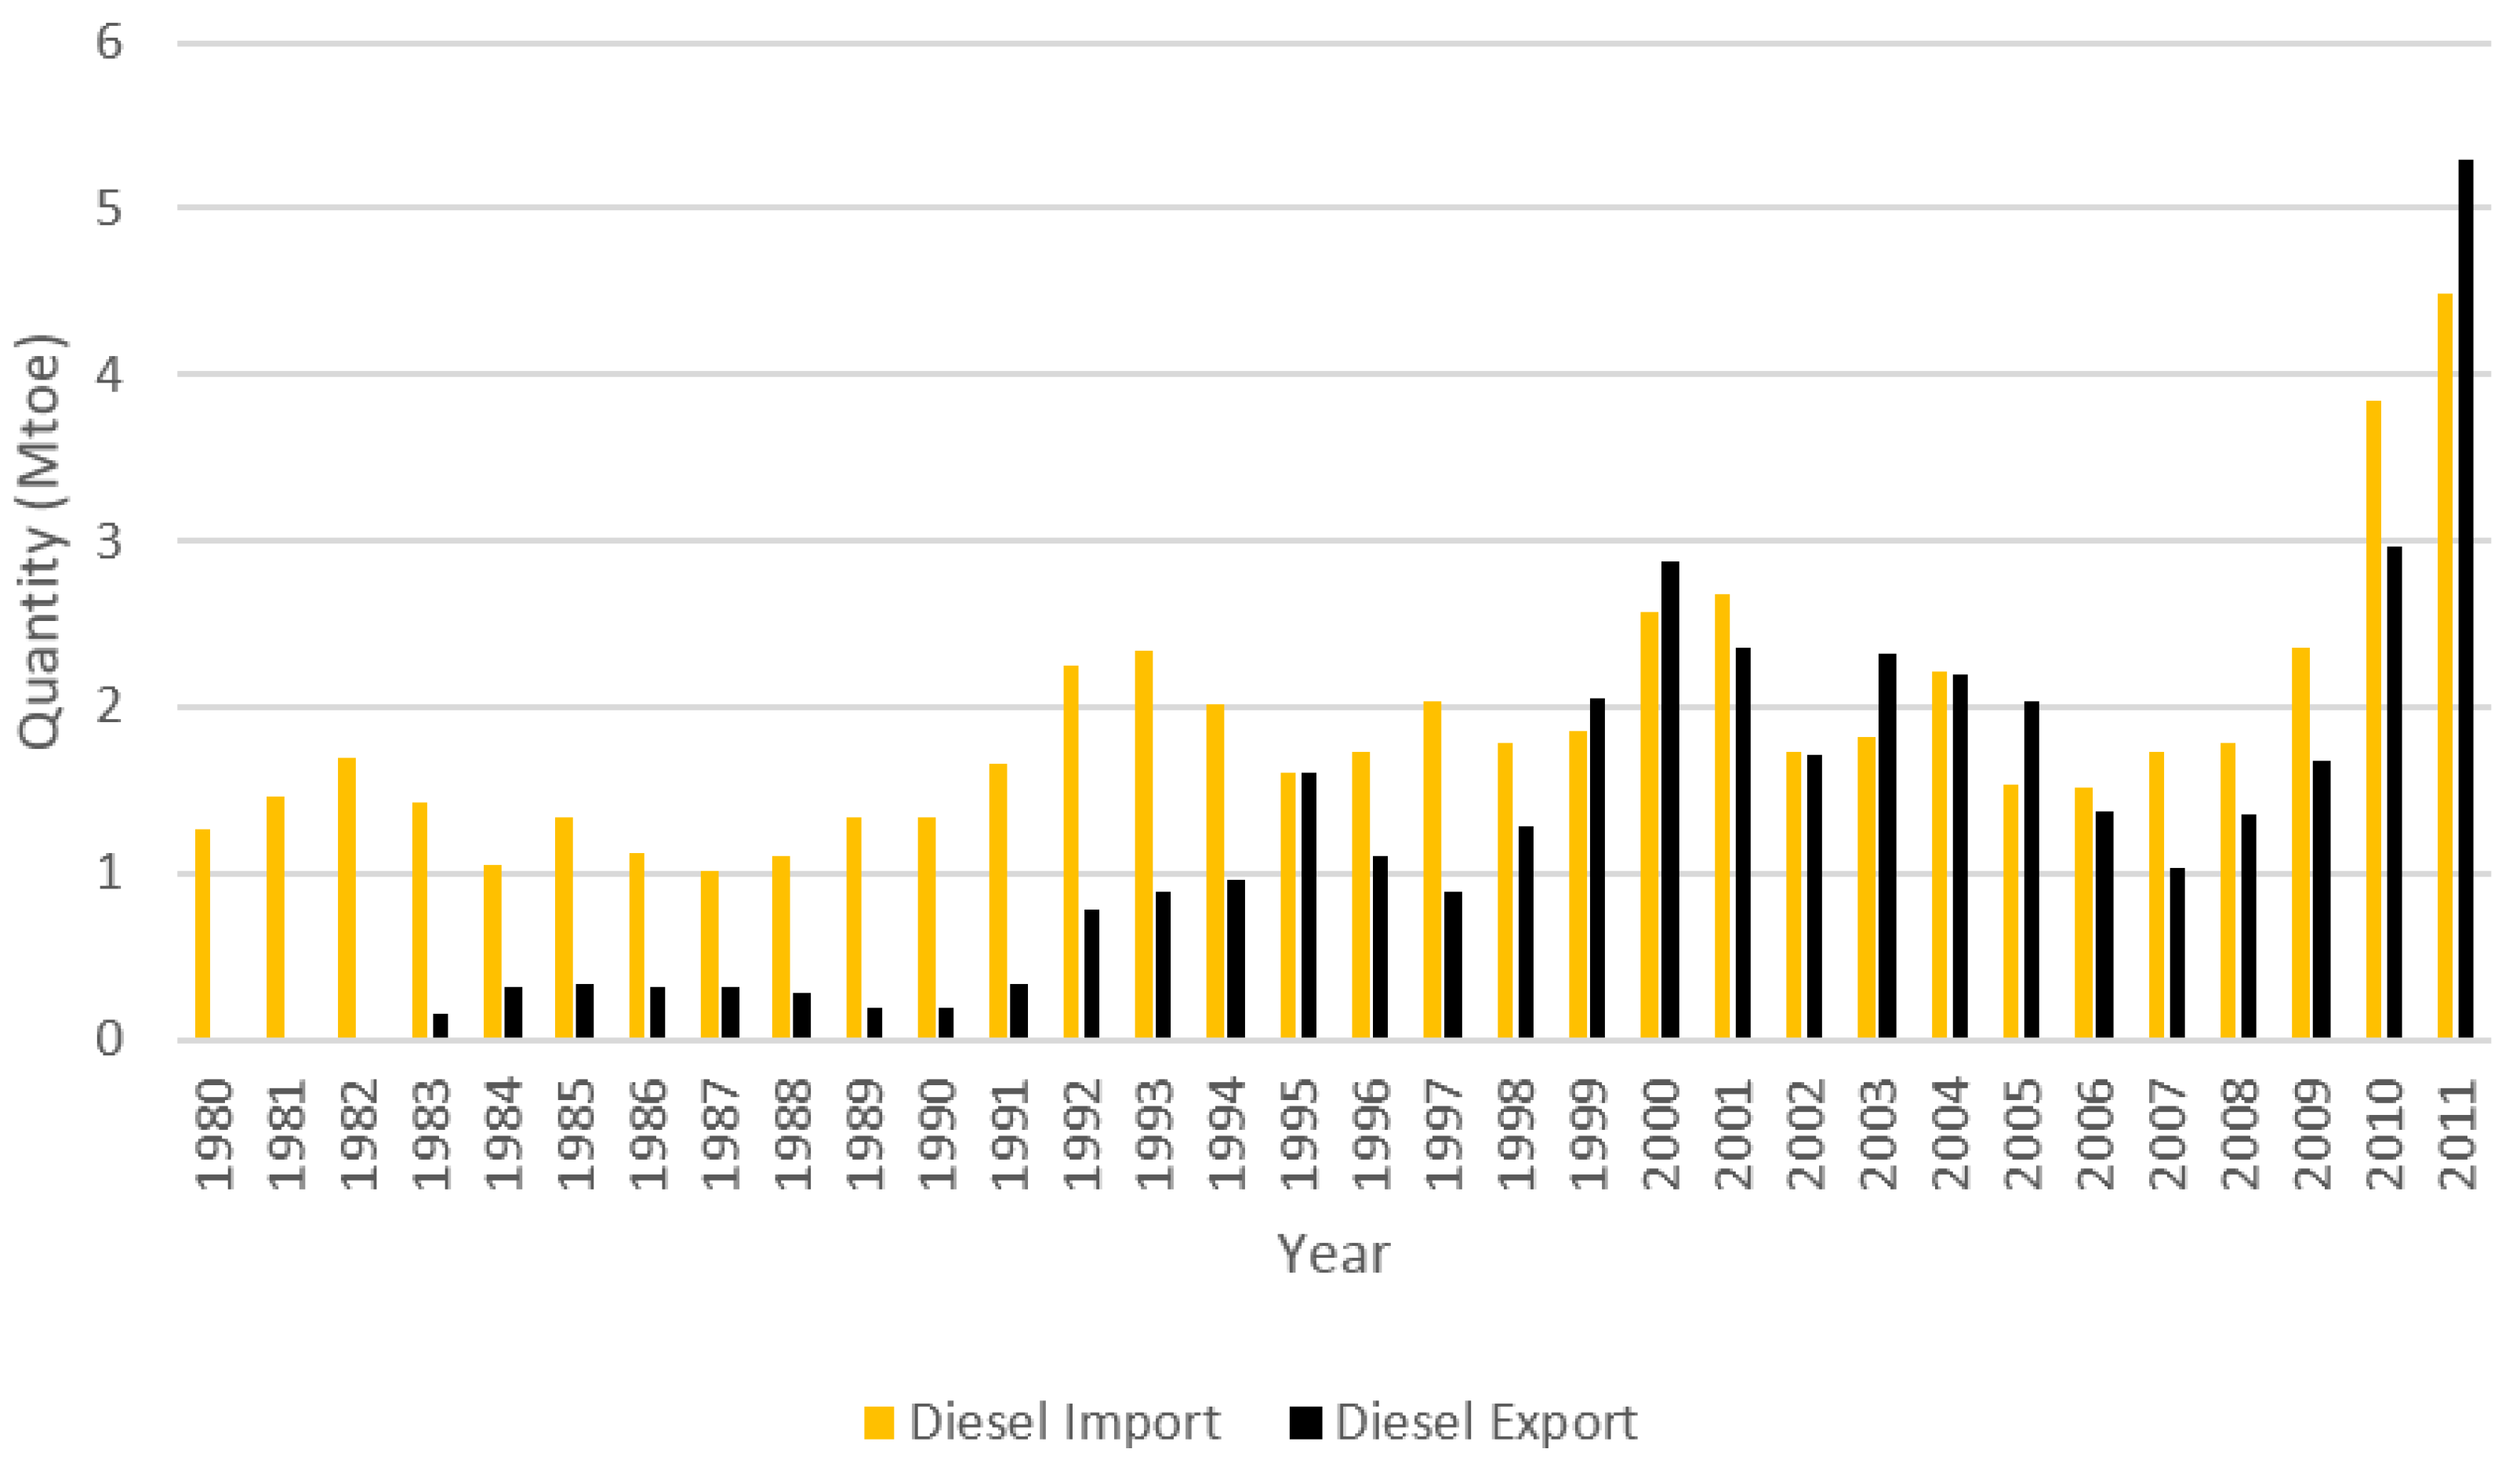
- Though Malaysia was a net exporter of crude oil, it was a net importer of oil products, especially petrol (gasoline). Half of the petrol consumed in the end-use sectors was imported, and no petrol was exported.
- (4)
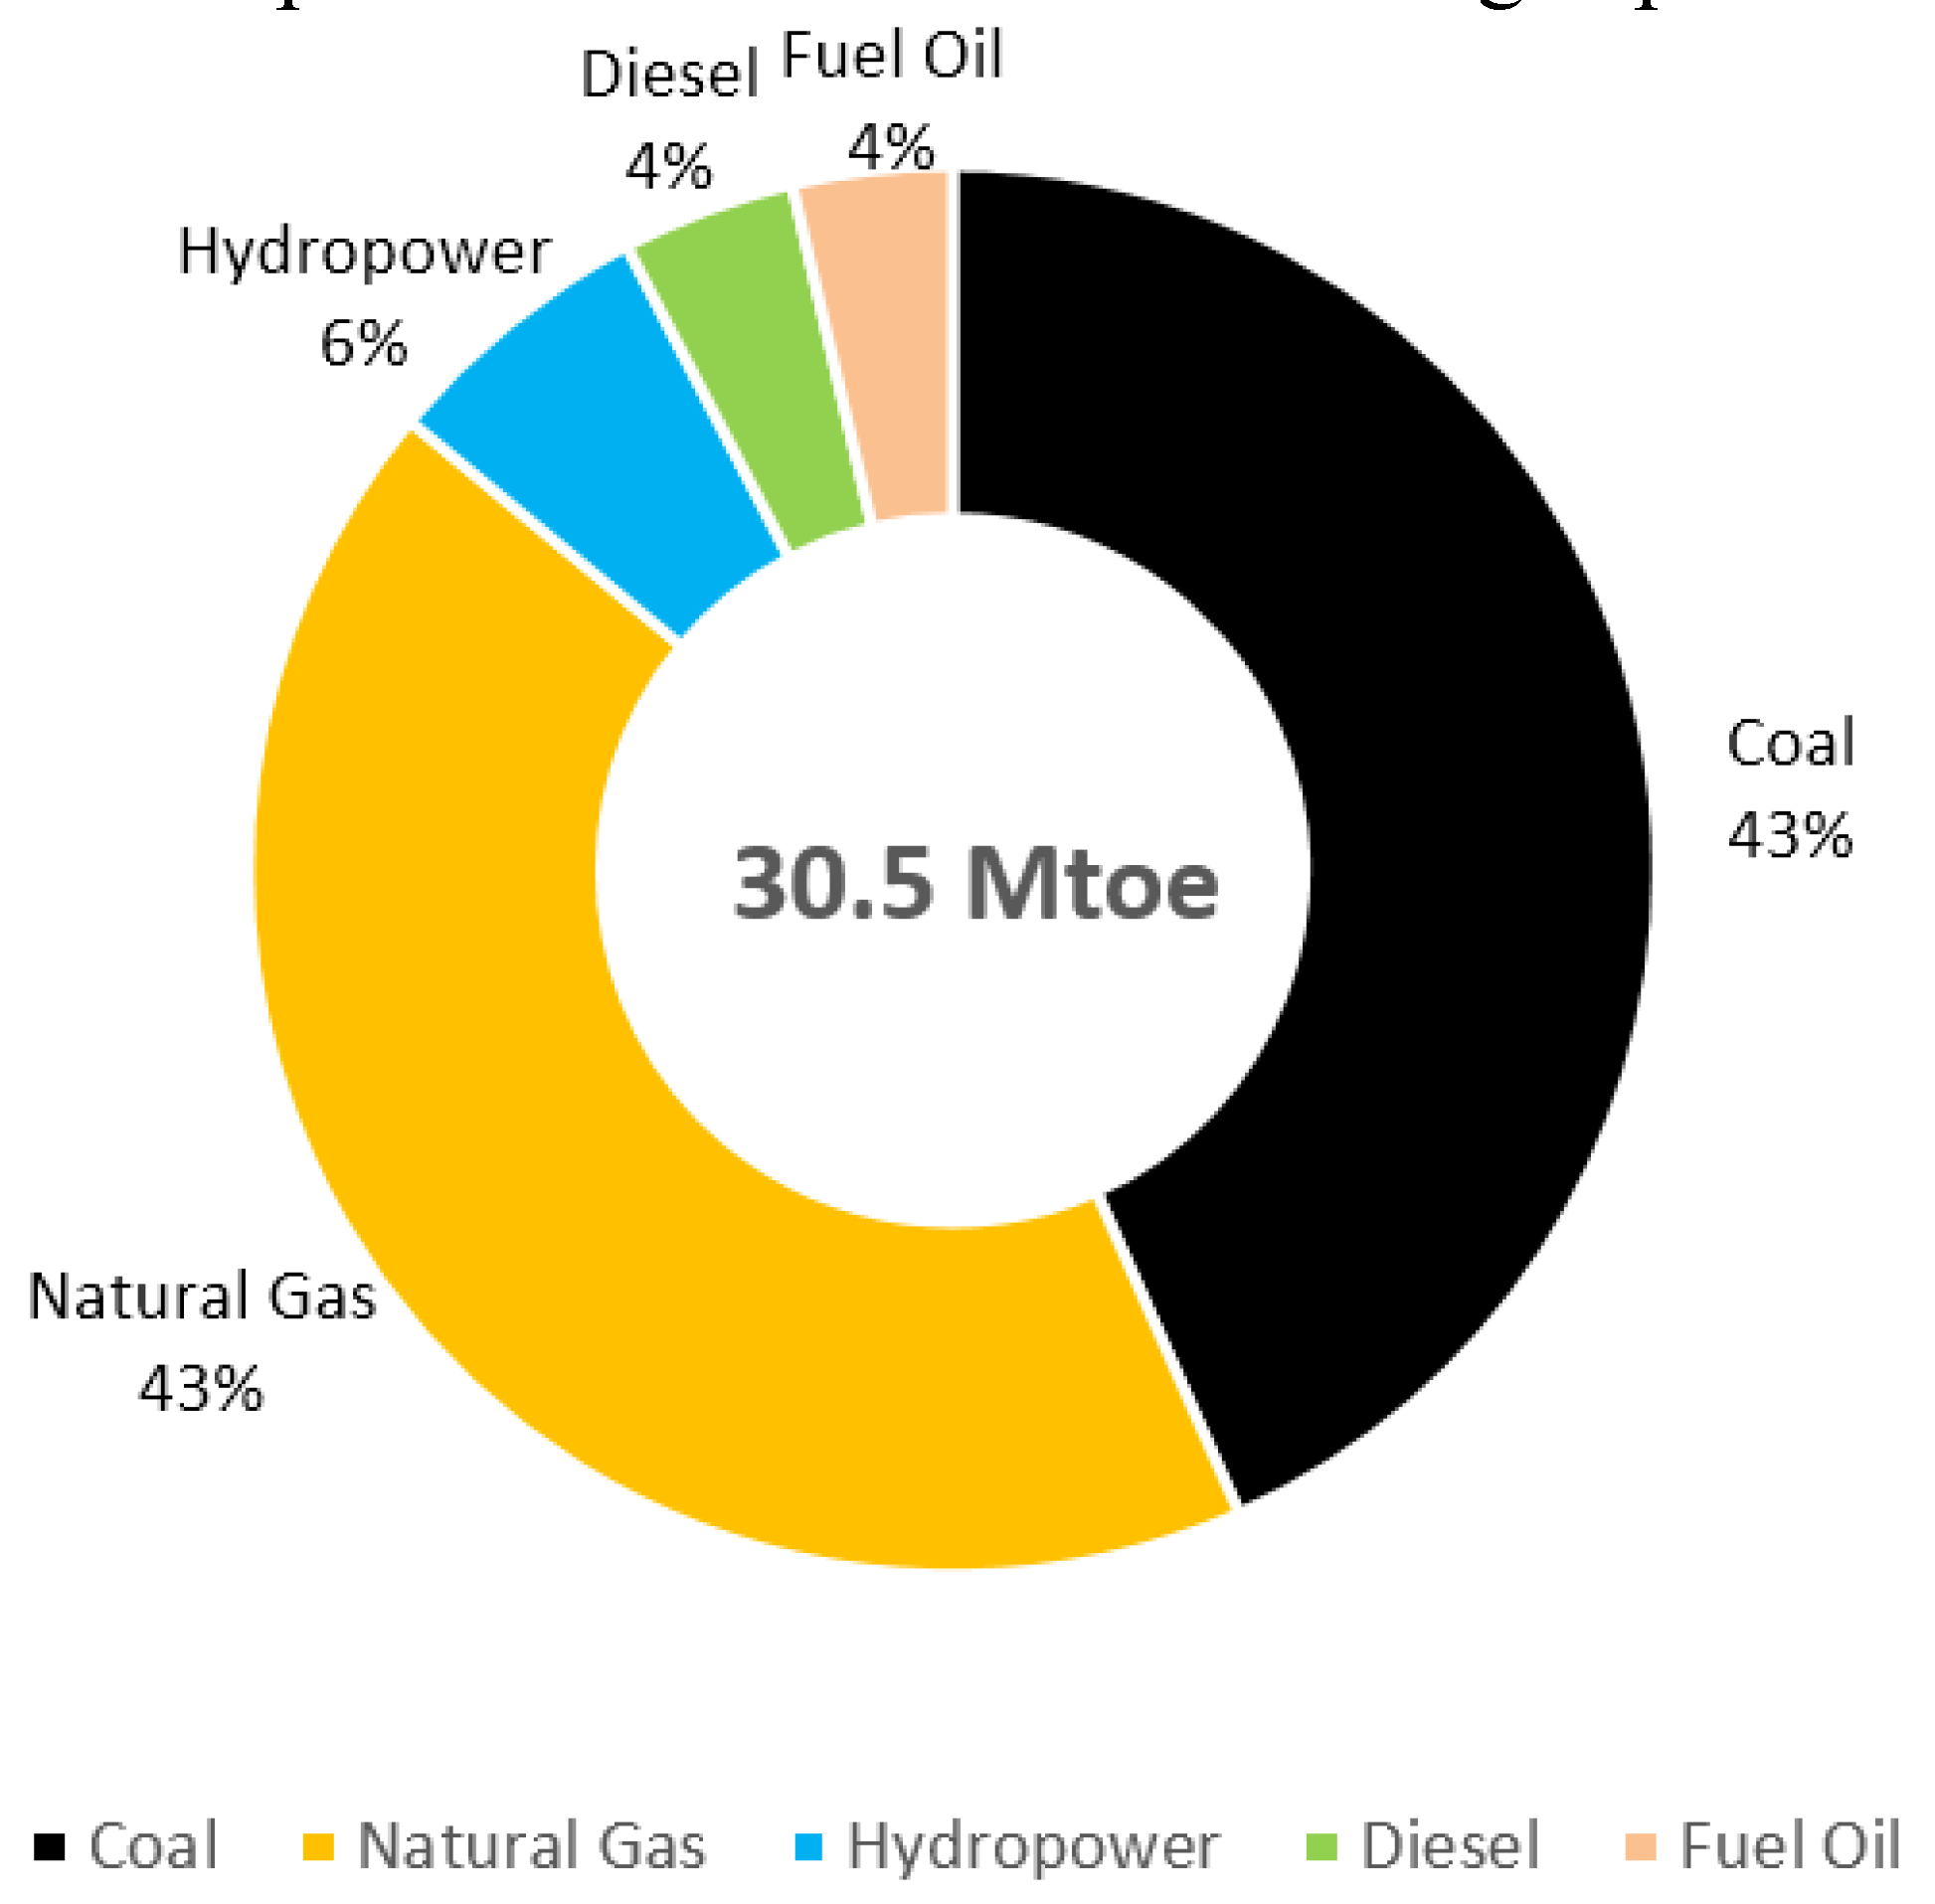
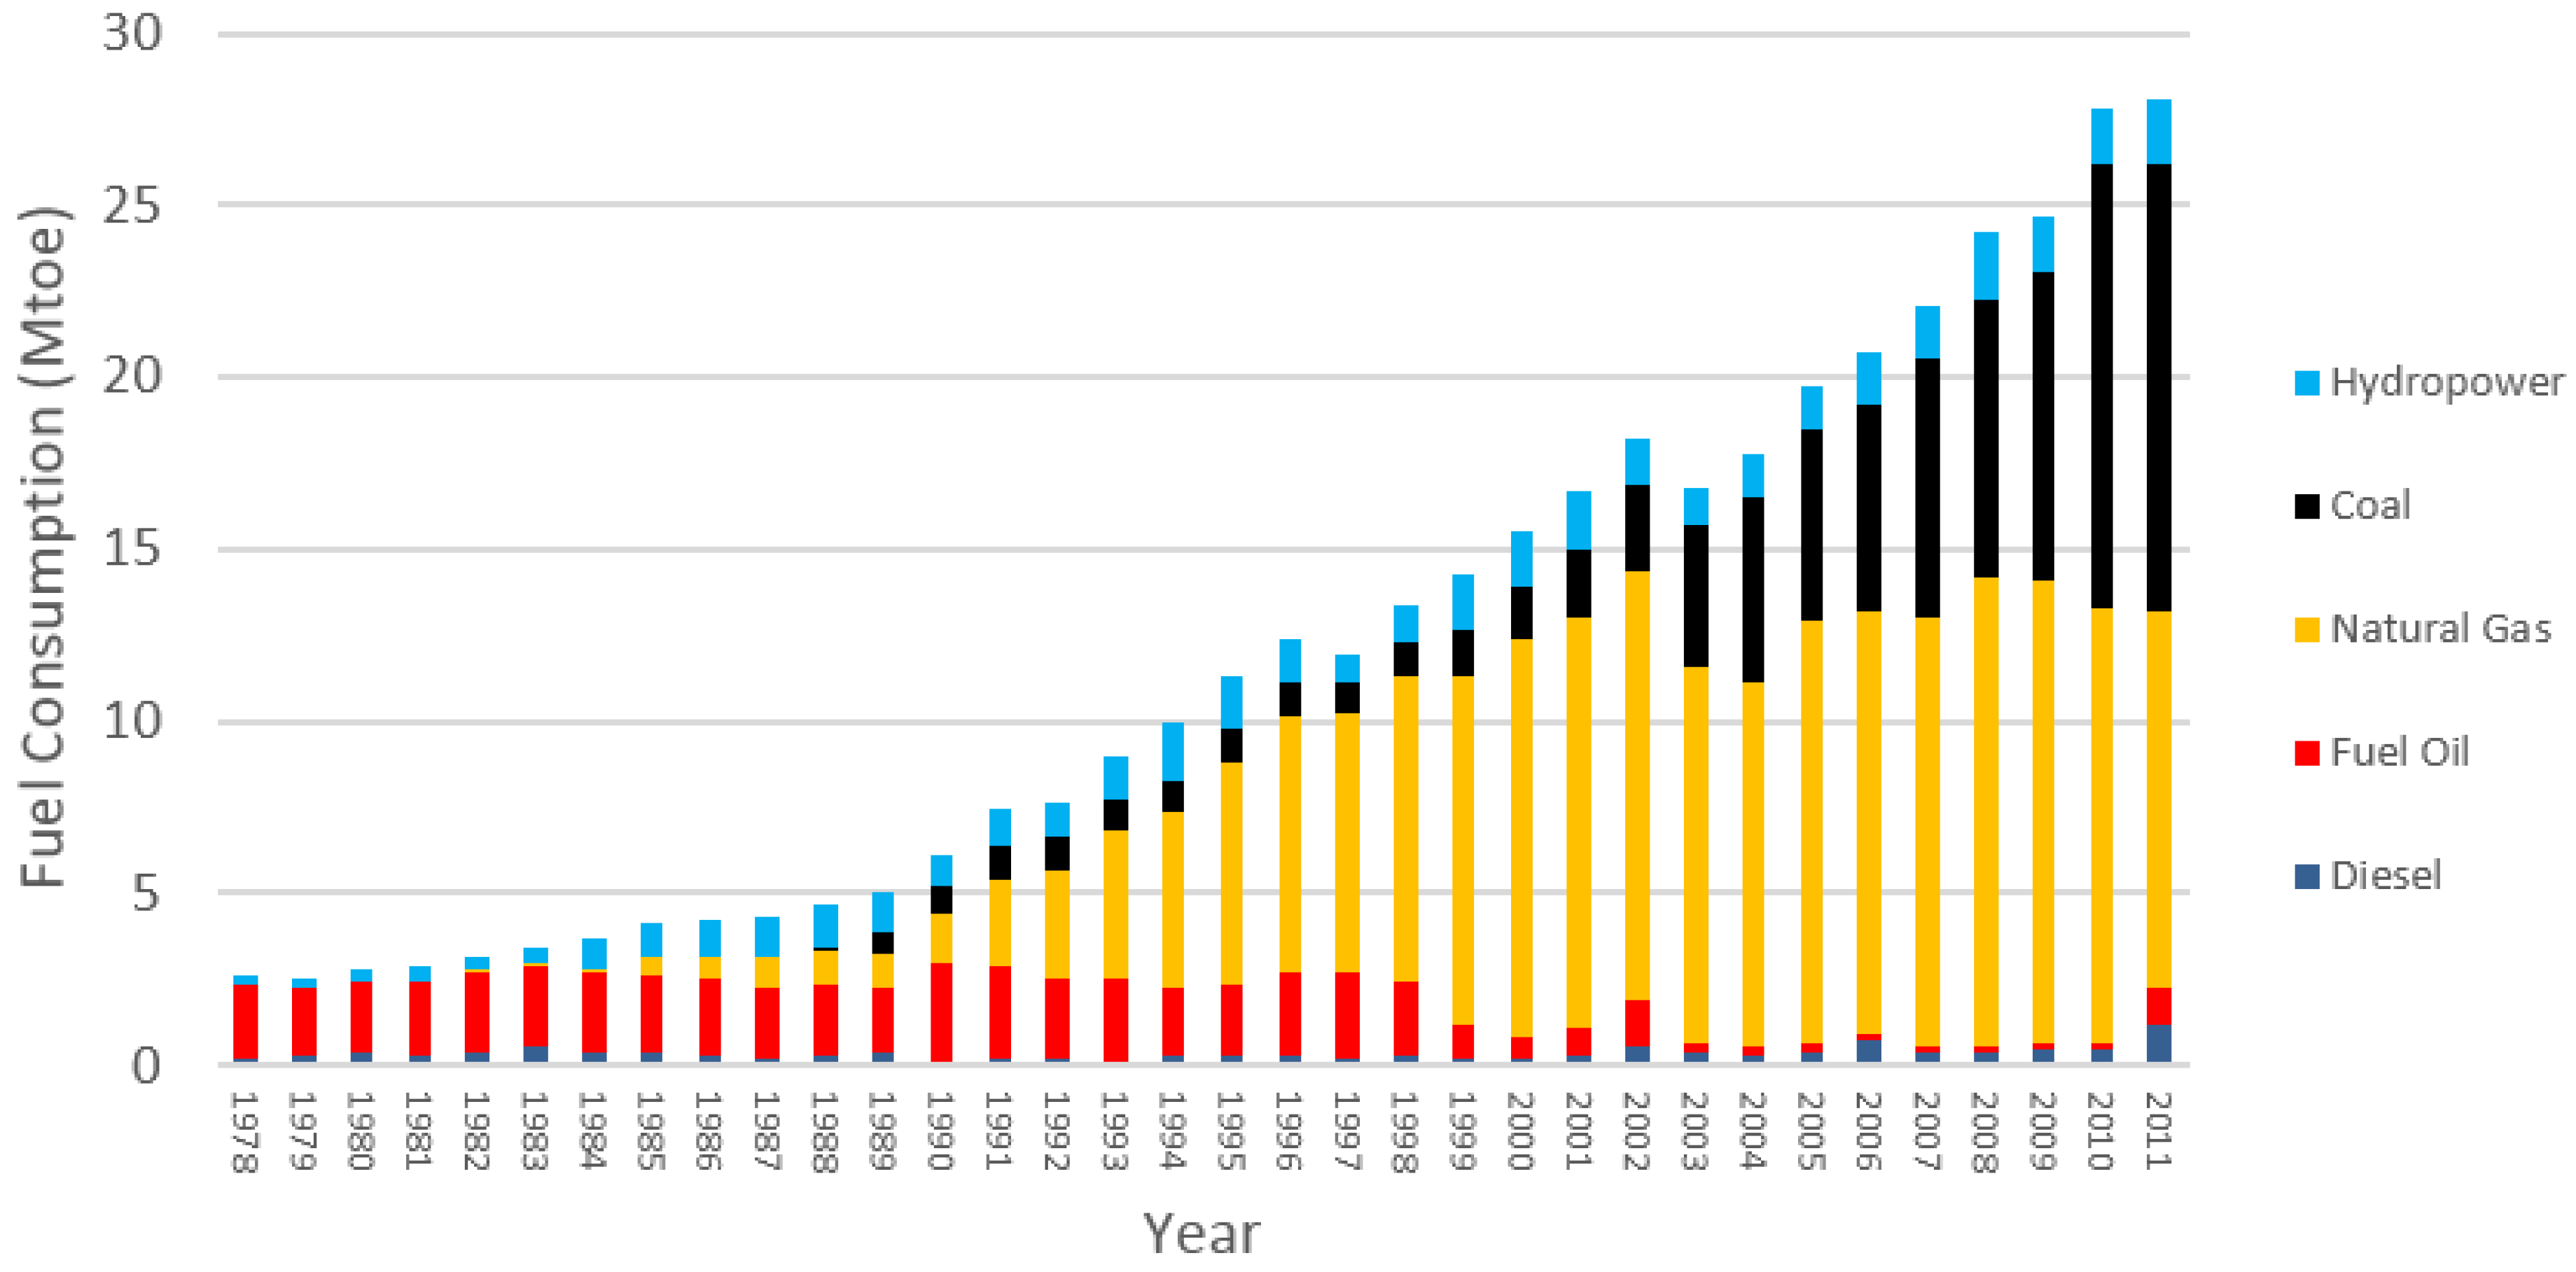
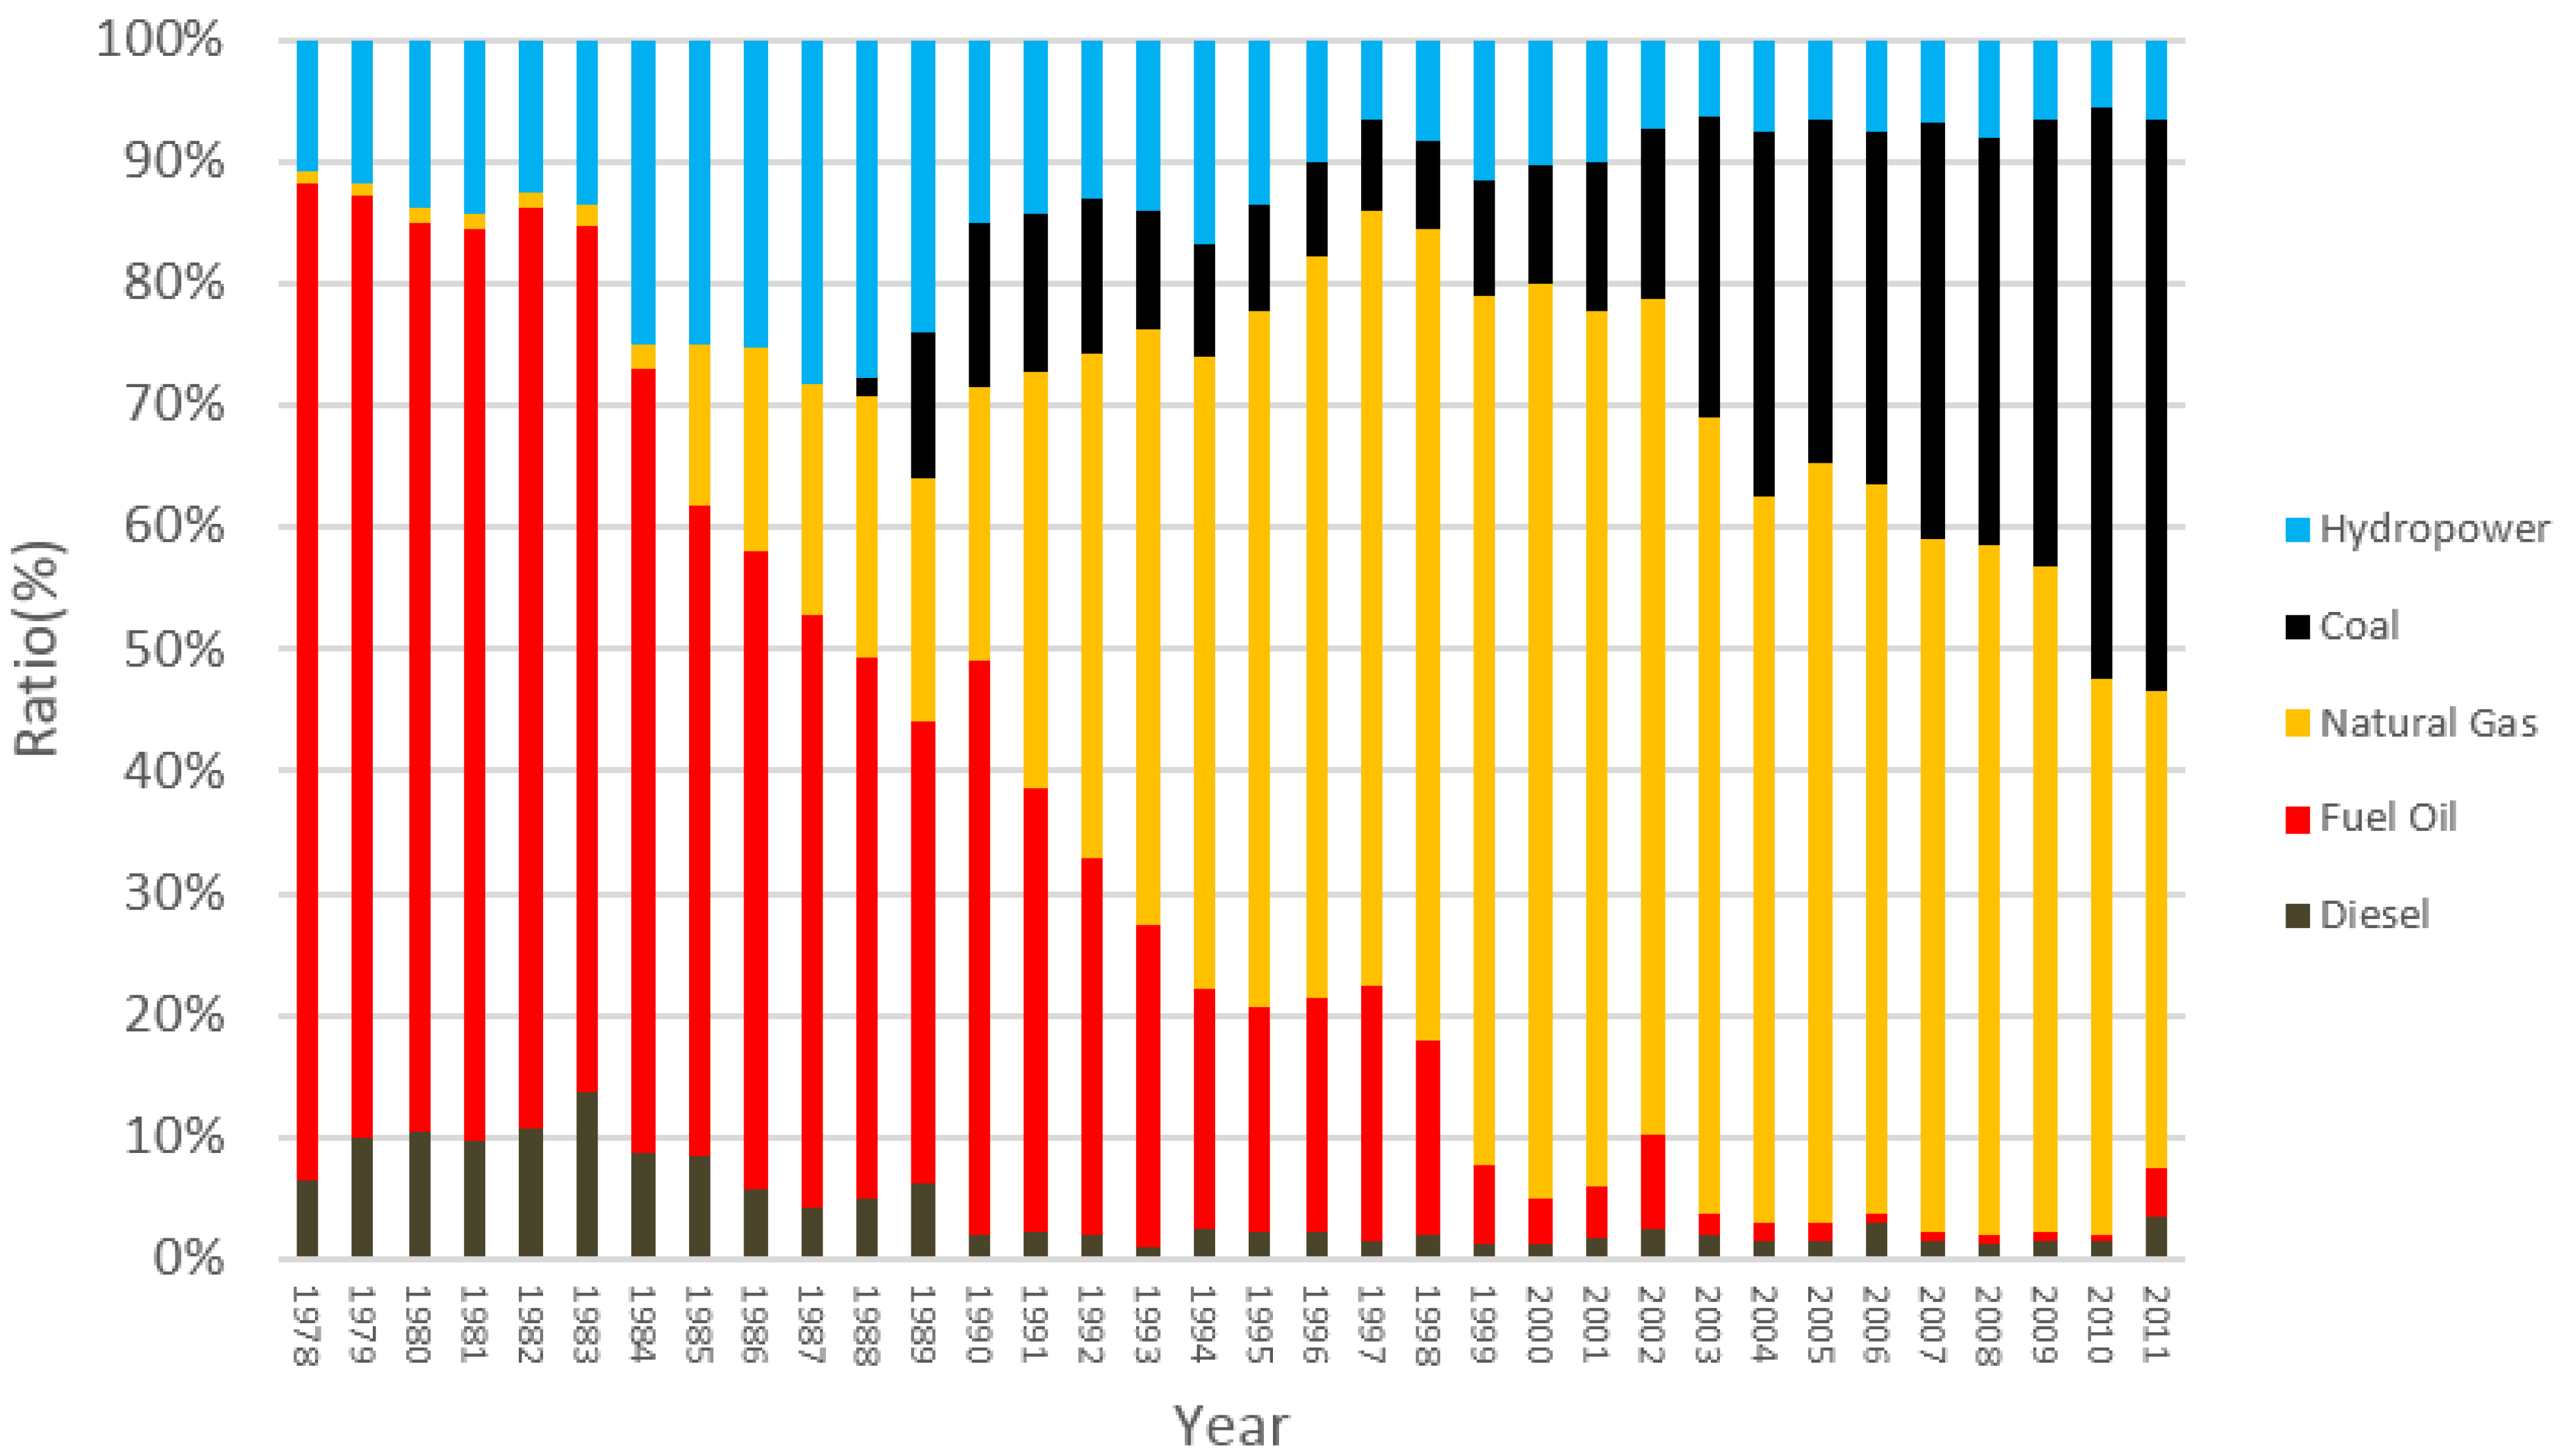
- The electricity supply of Malaysia mainly relied on domestic power generation, and most of the natural gas (74% of the supply), most of the coal (88% of the supply) and all the hydropower were used for electricity generation.
- (5)
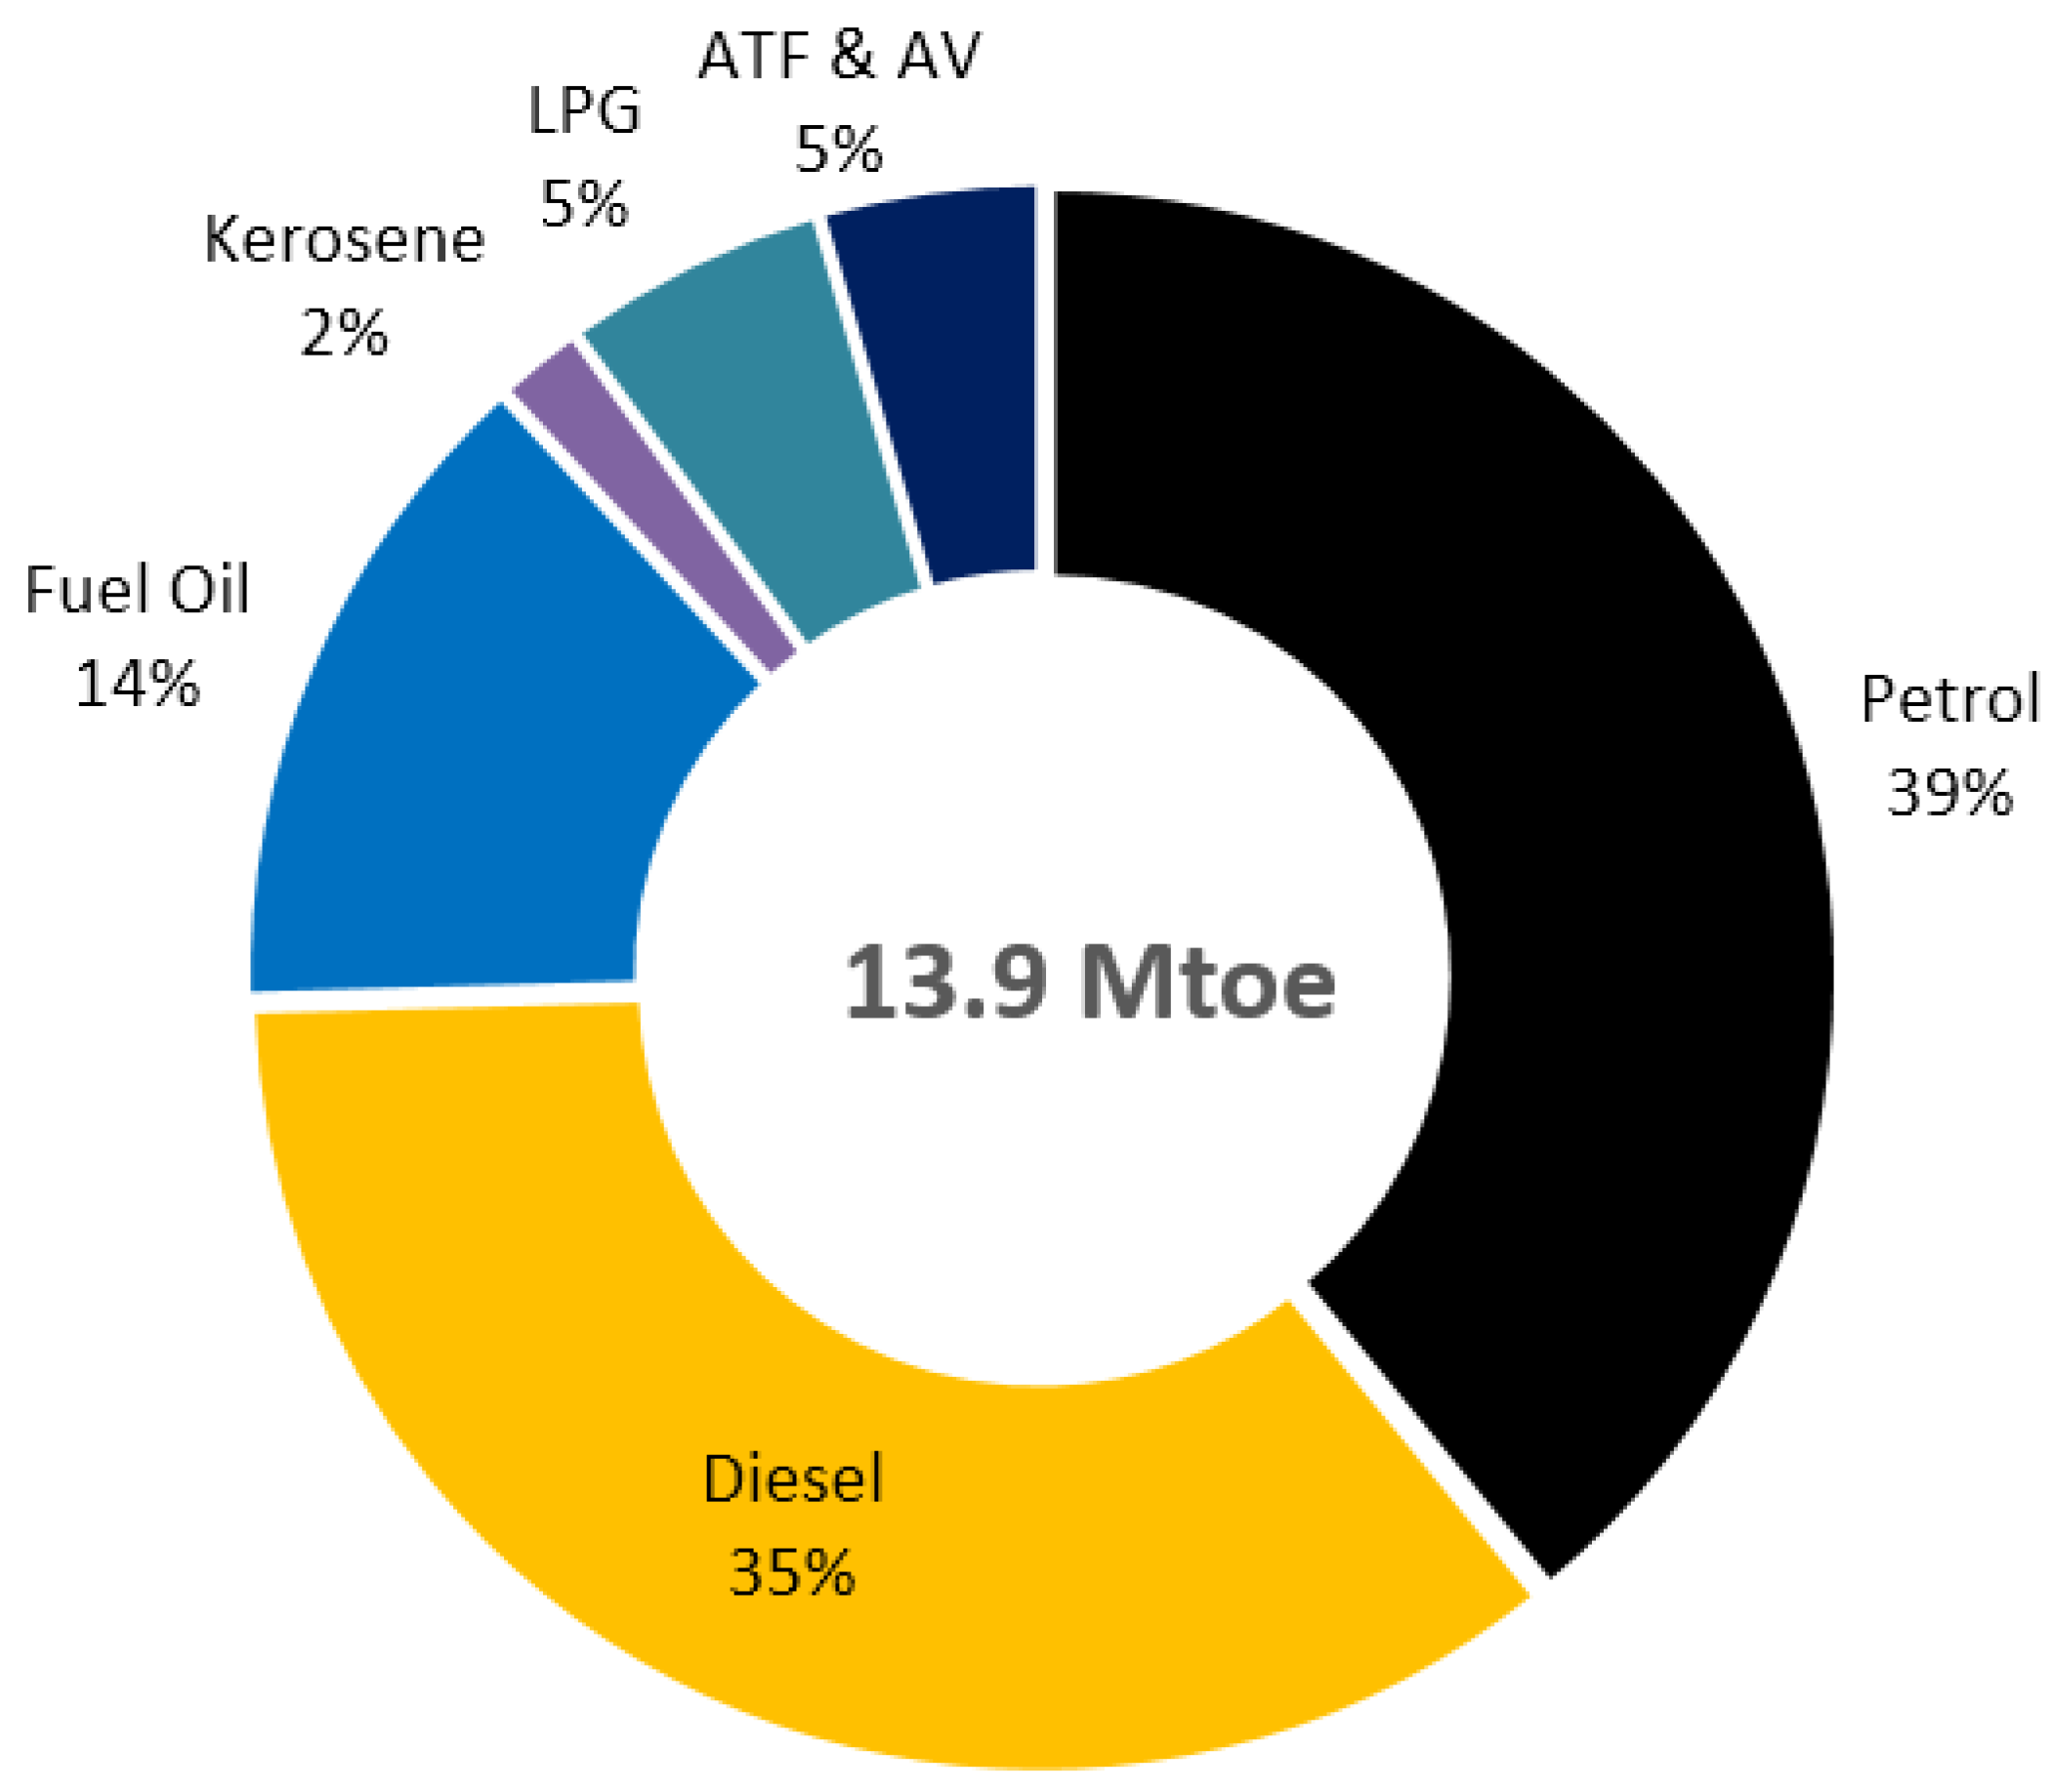
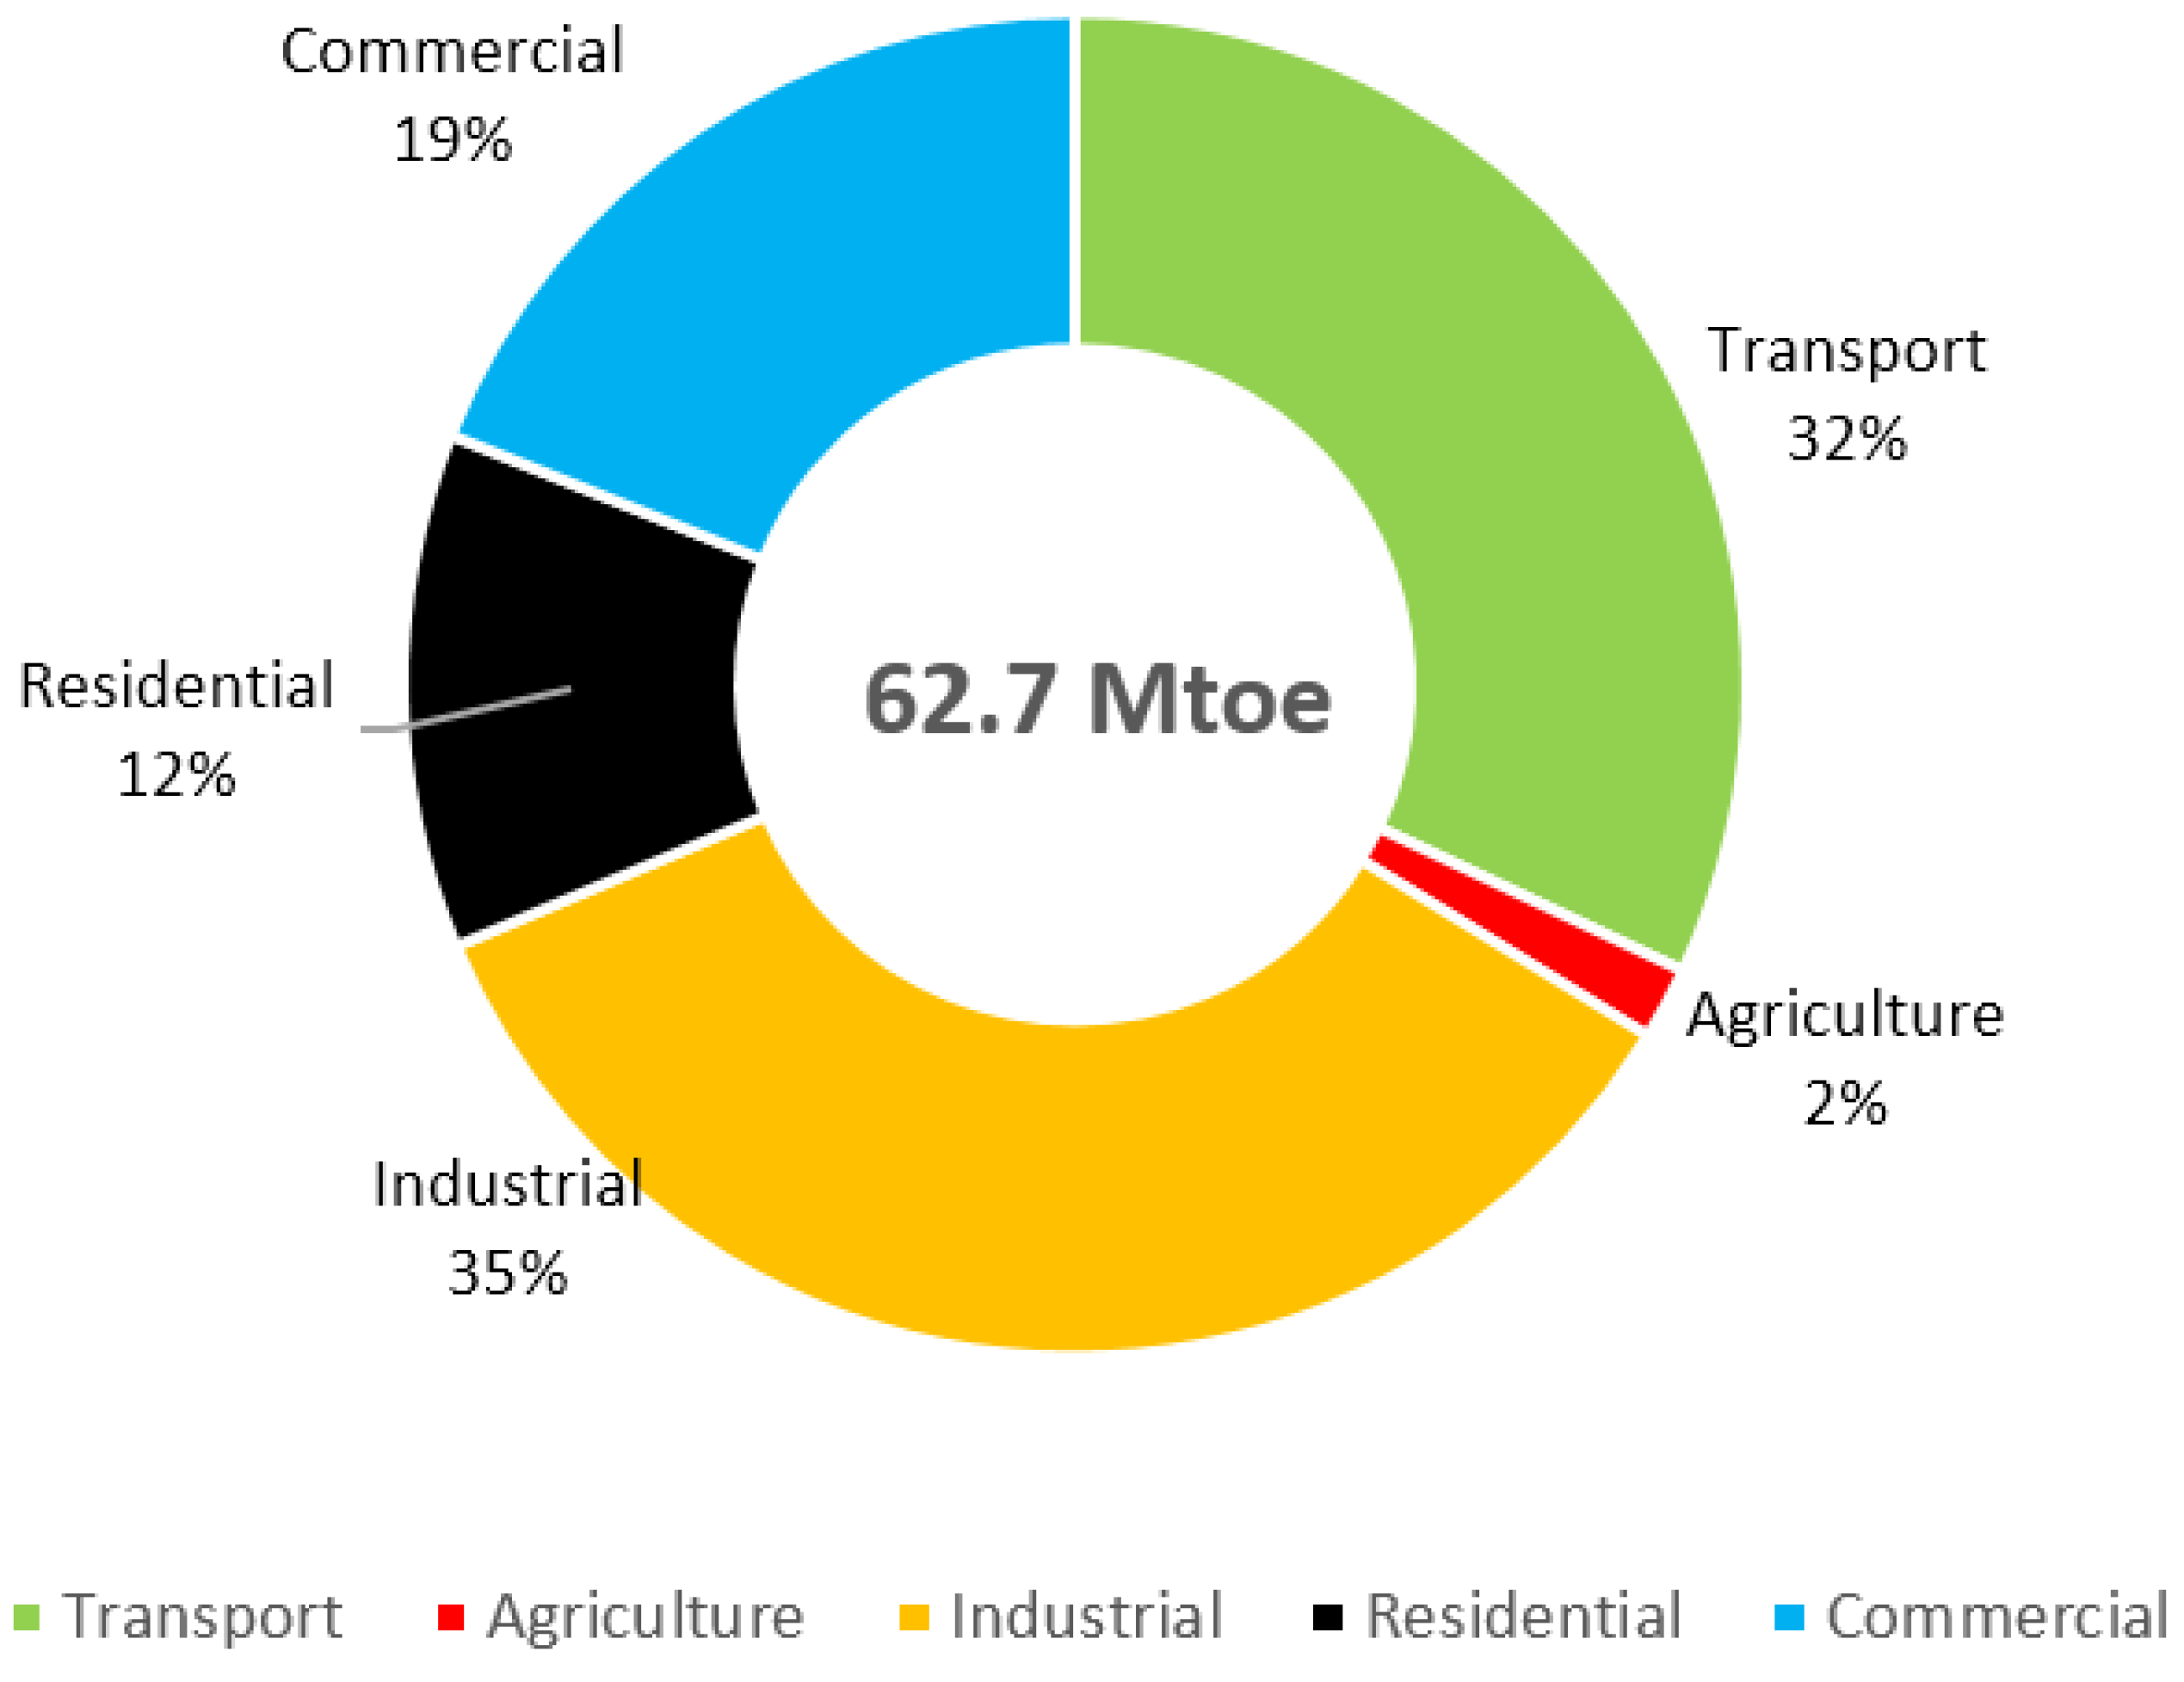
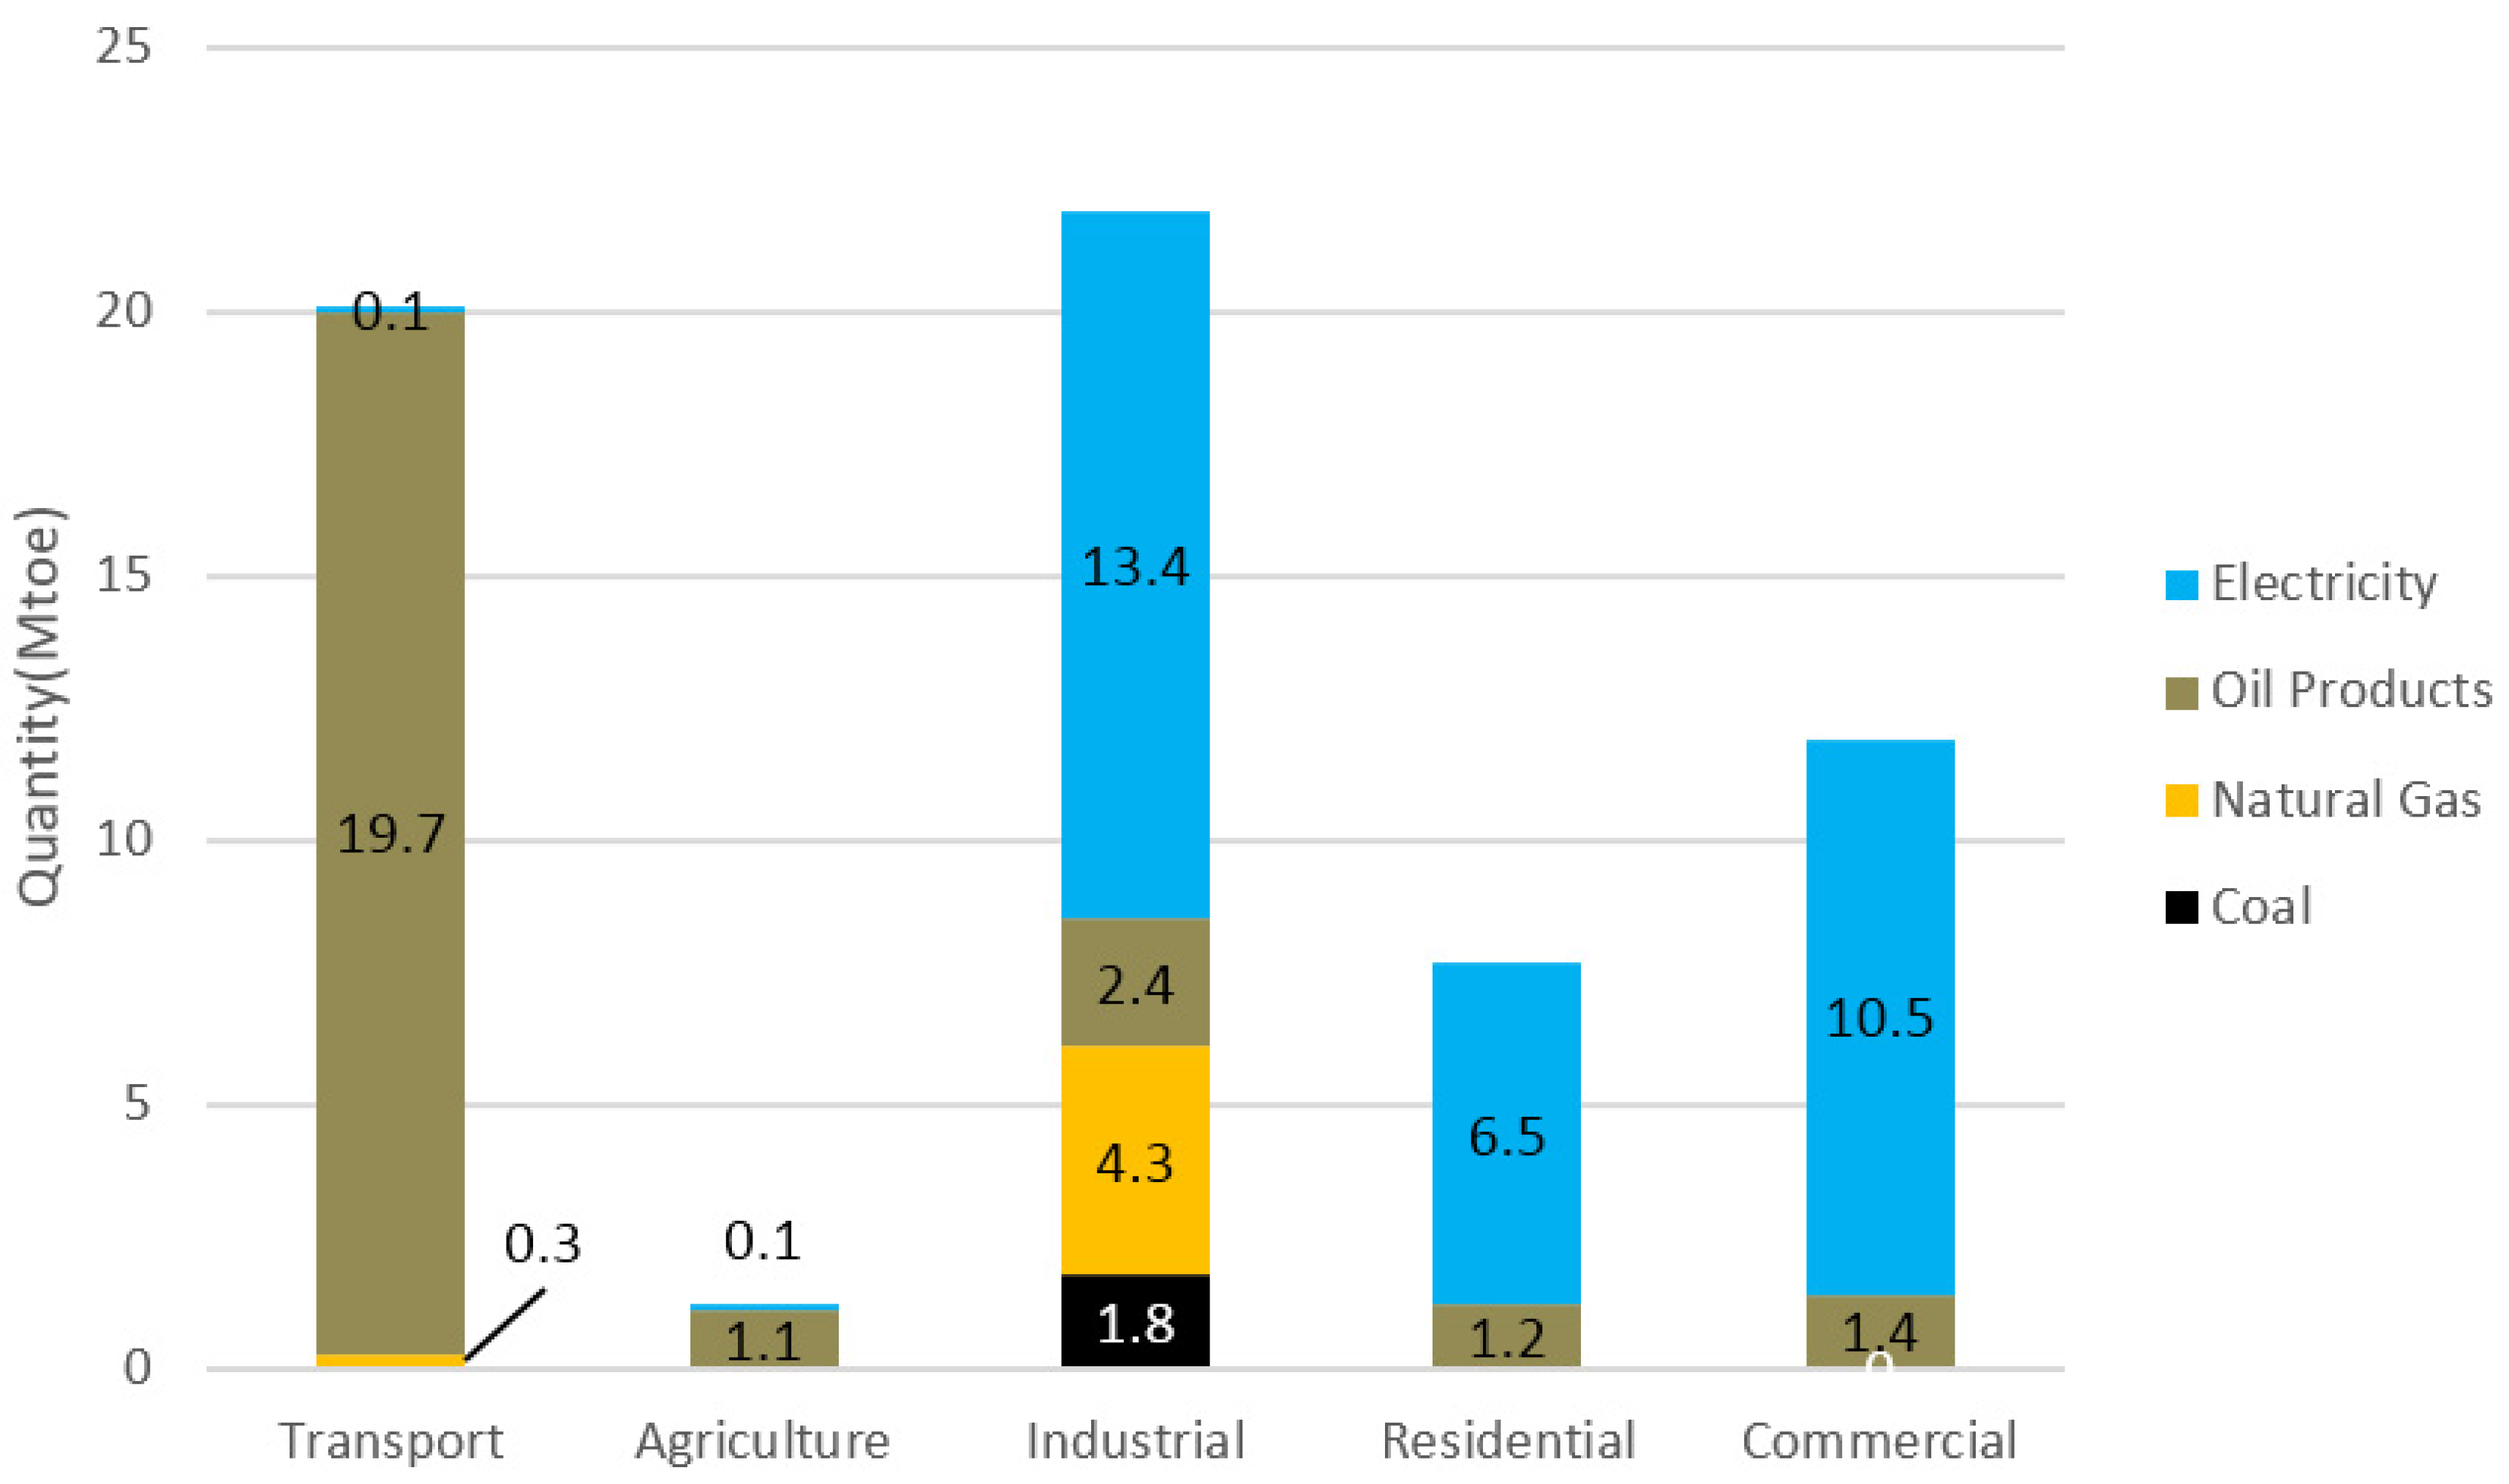
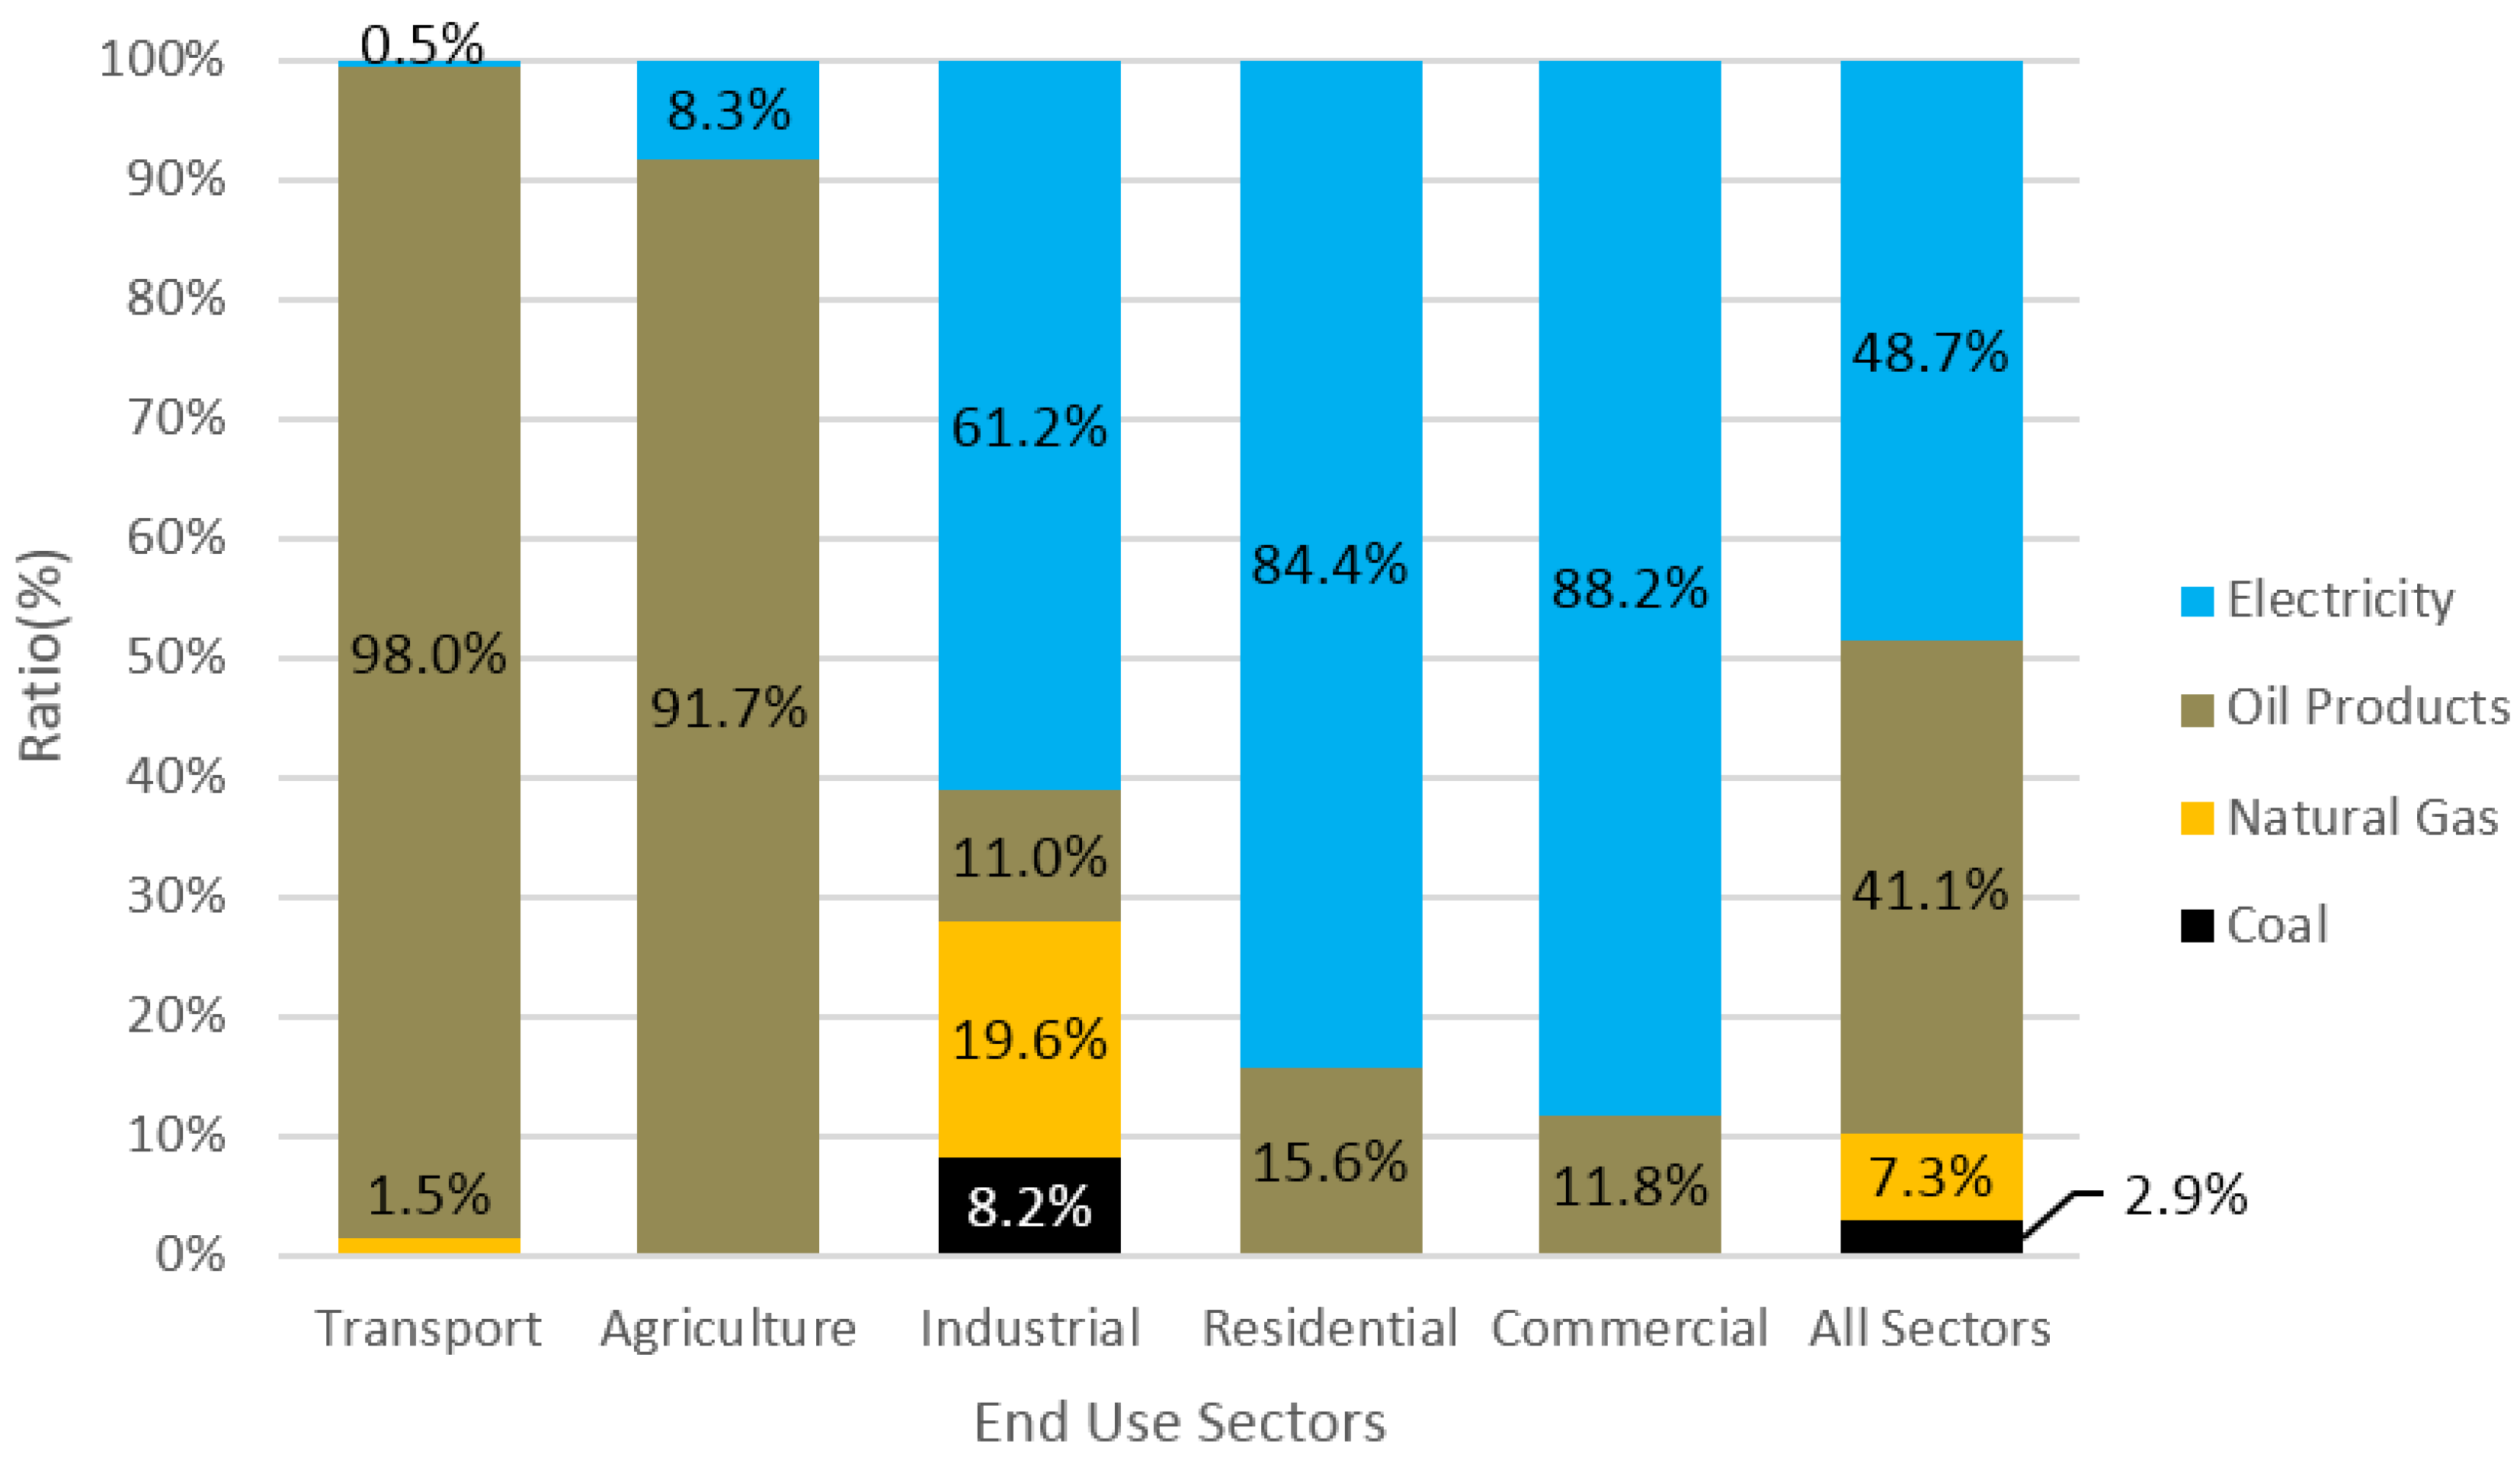
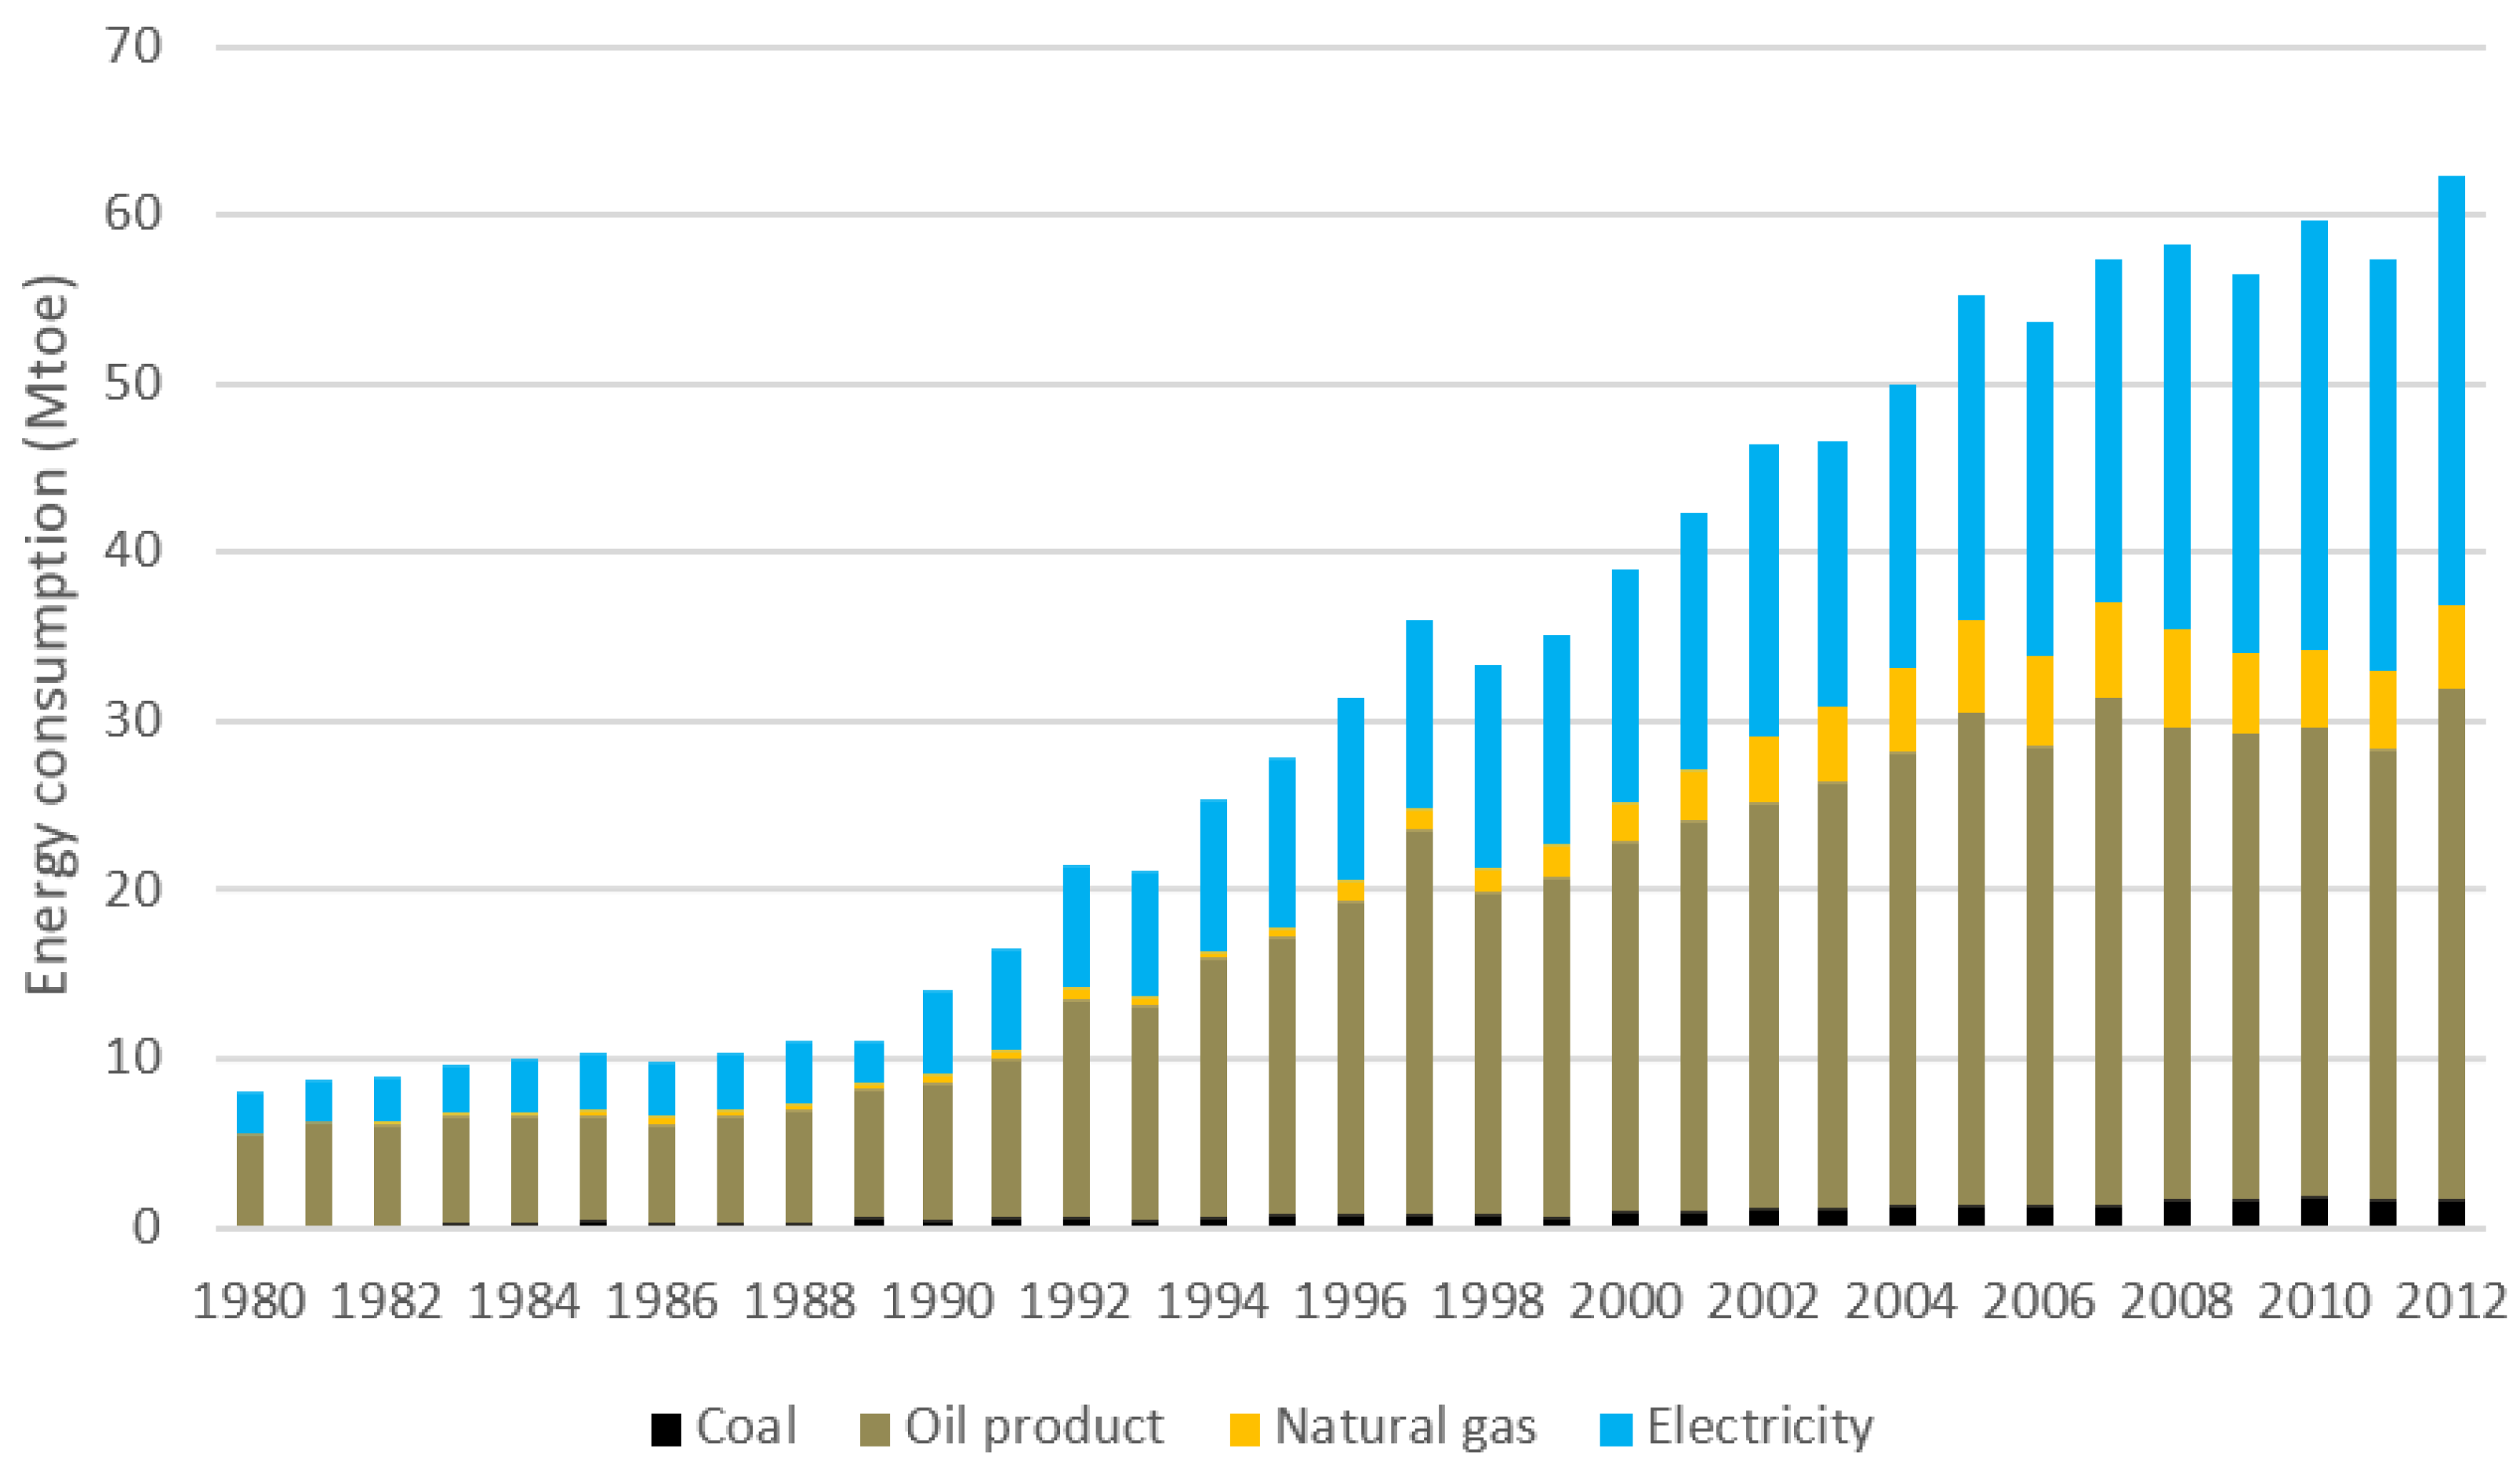
- Electricity (49%), oil products (41%), natural gas (7%) and coal (3%) were the main energy forms for end-use. Each main end-use sector, including the transportation sector, industrial sector and domestic sector (residential, commercial and agriculture), accounted for approximately one-third of the energy consumption. The vast majority of oil products (69%) were consumed in the transportation sector.
3.1. Primary Supply
3.2. Secondary Supply
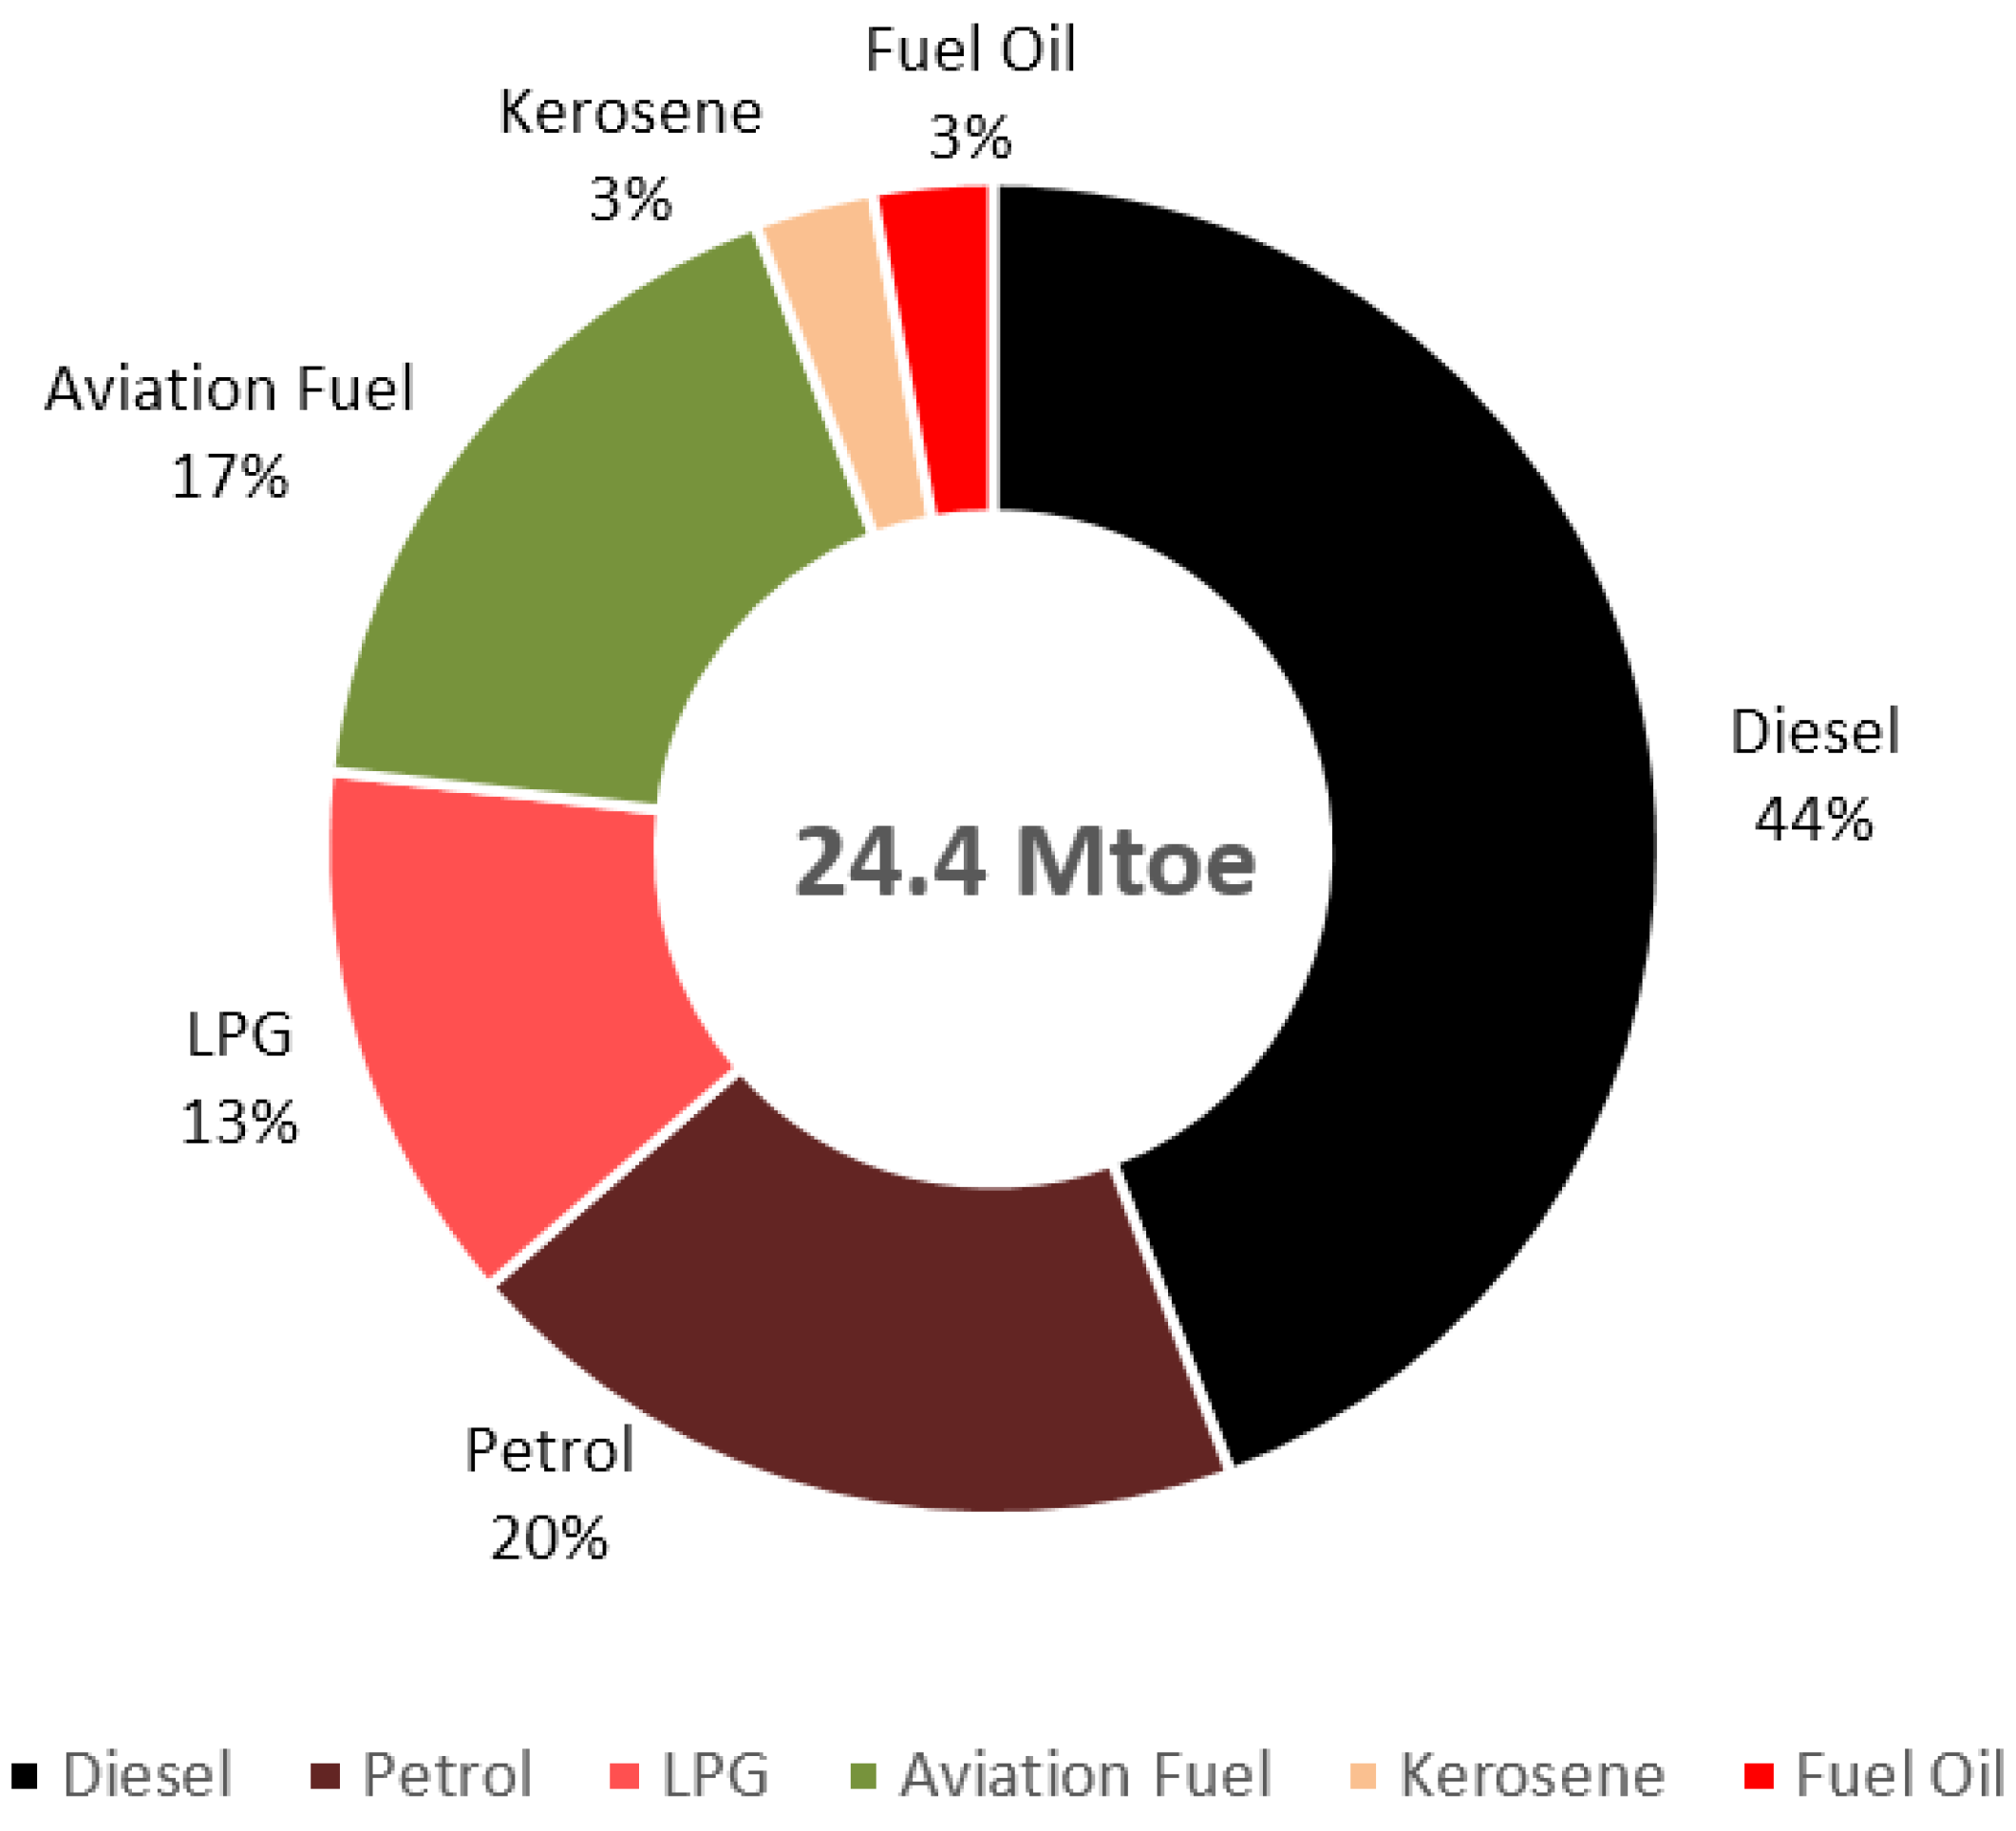
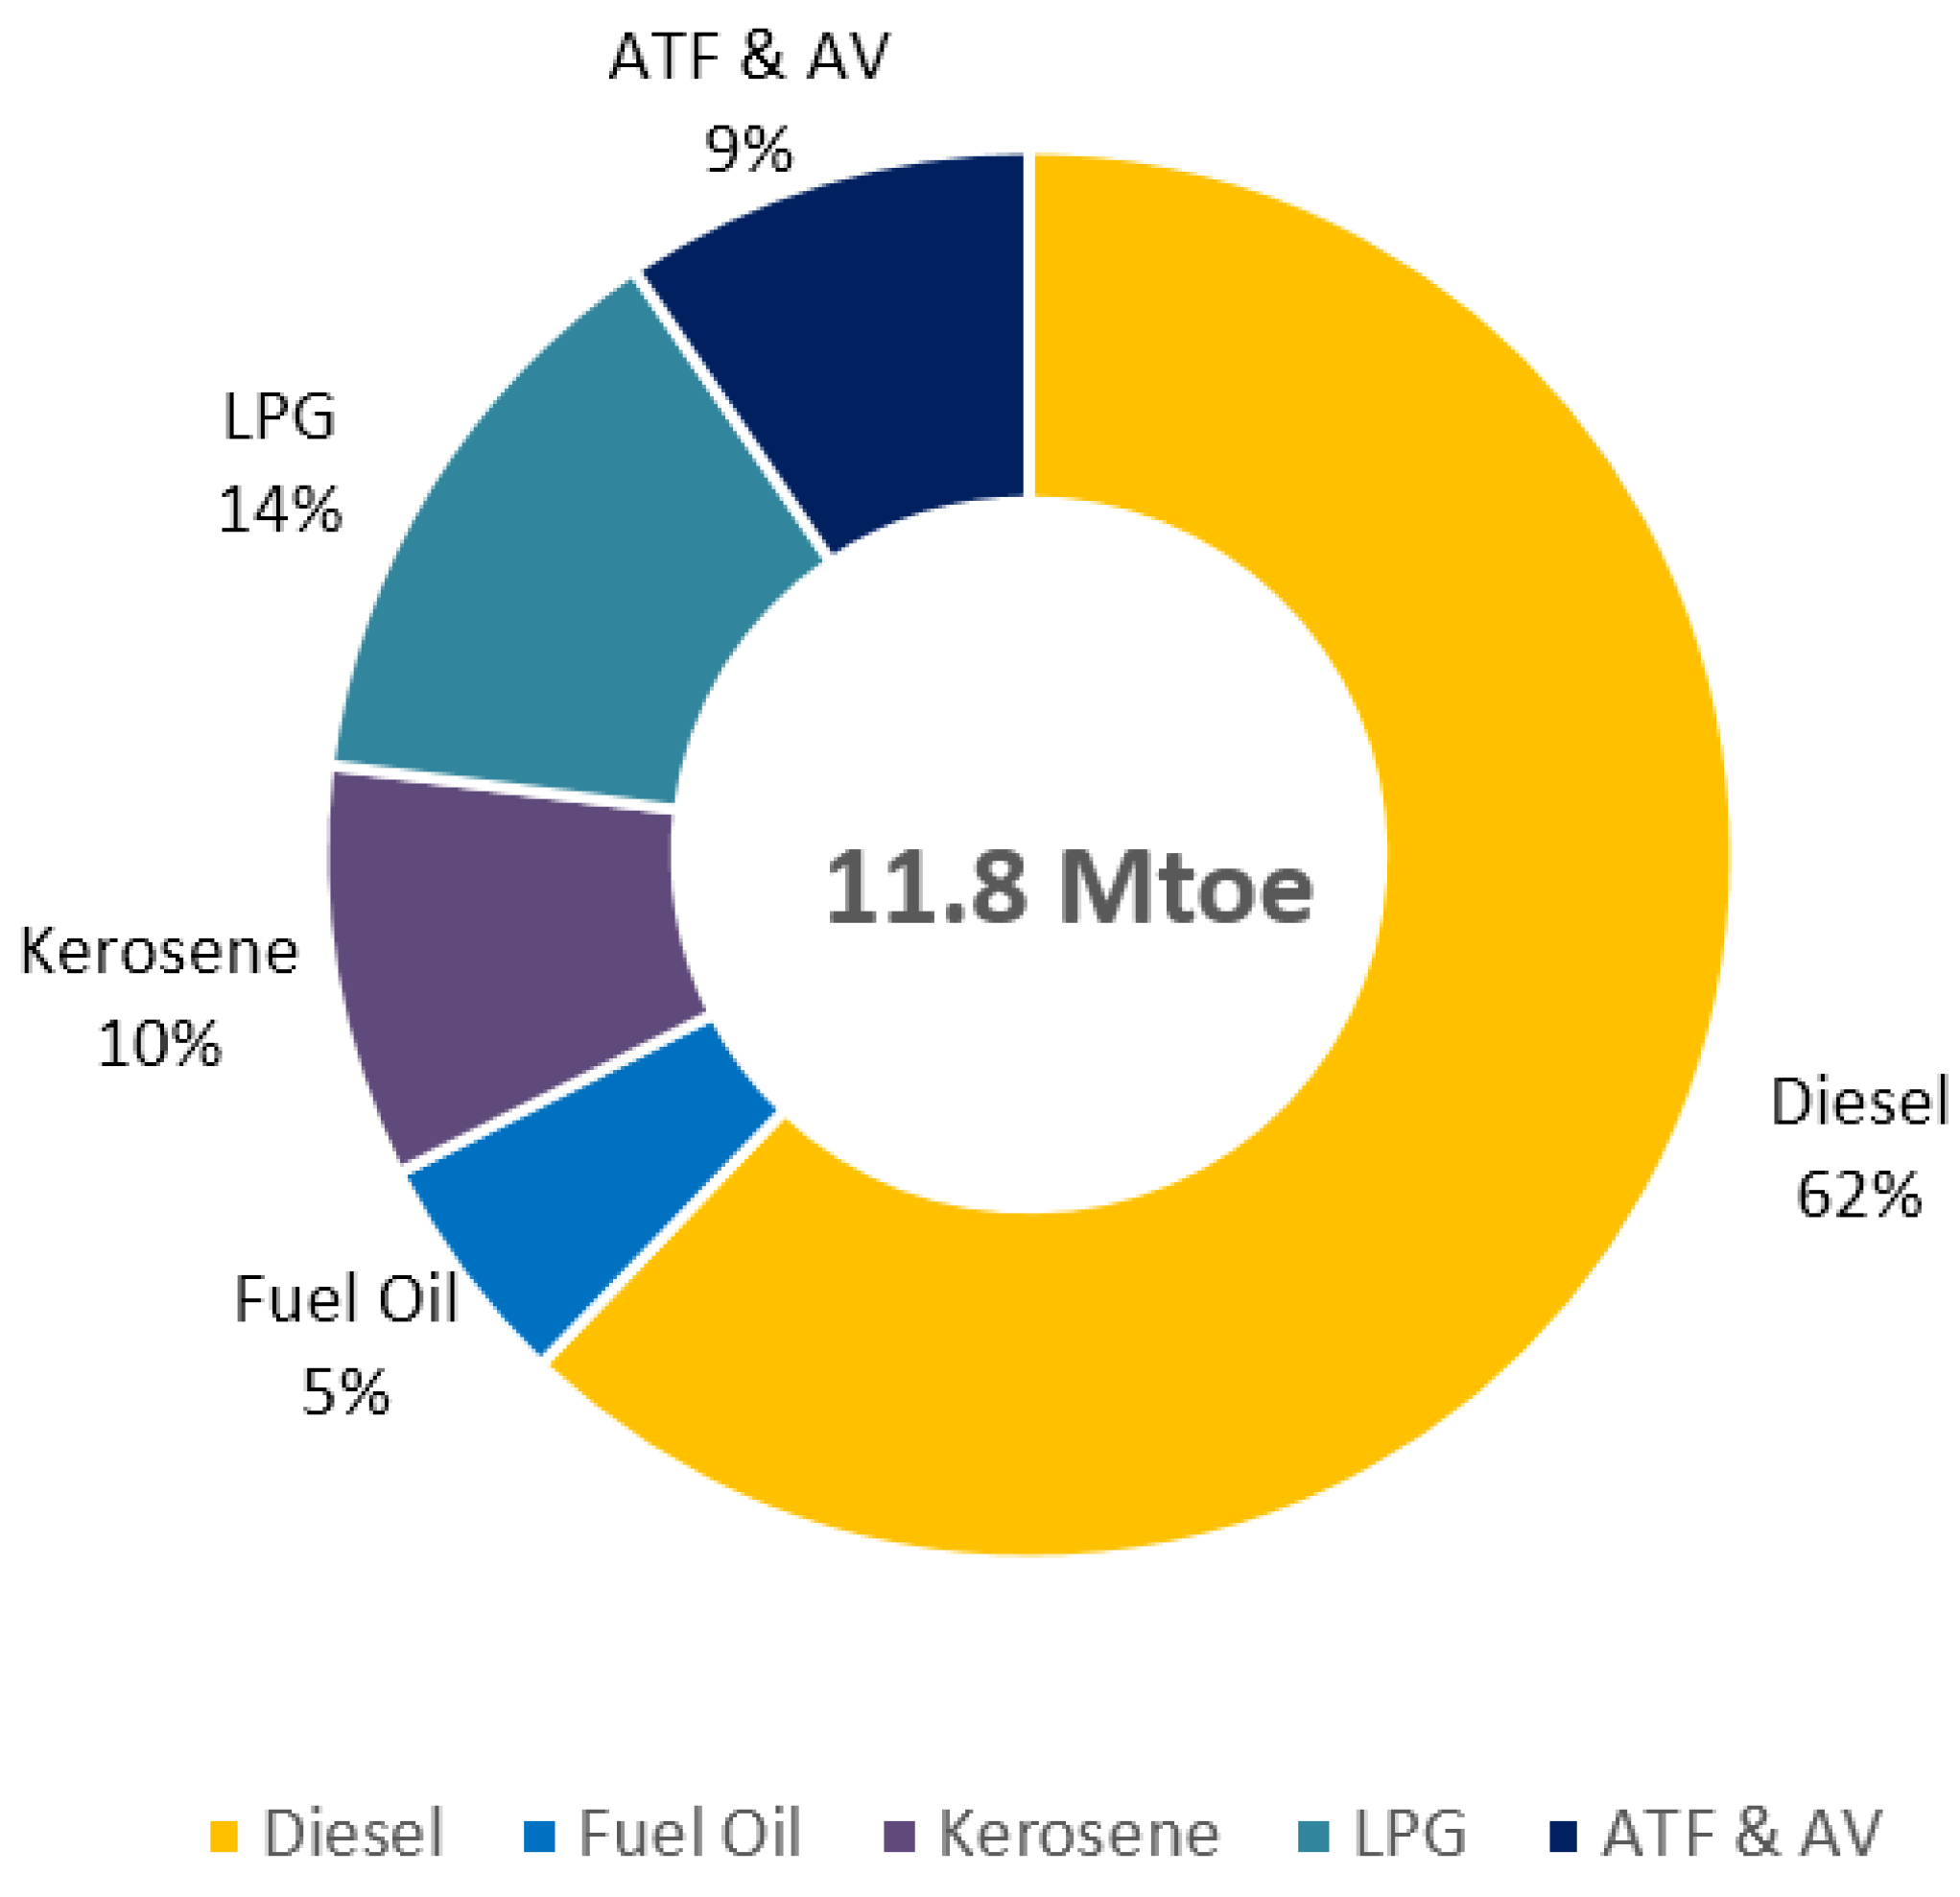
3.3. End-Use


4. Ongoing Trends
4.1. Energy Demand
- (1)
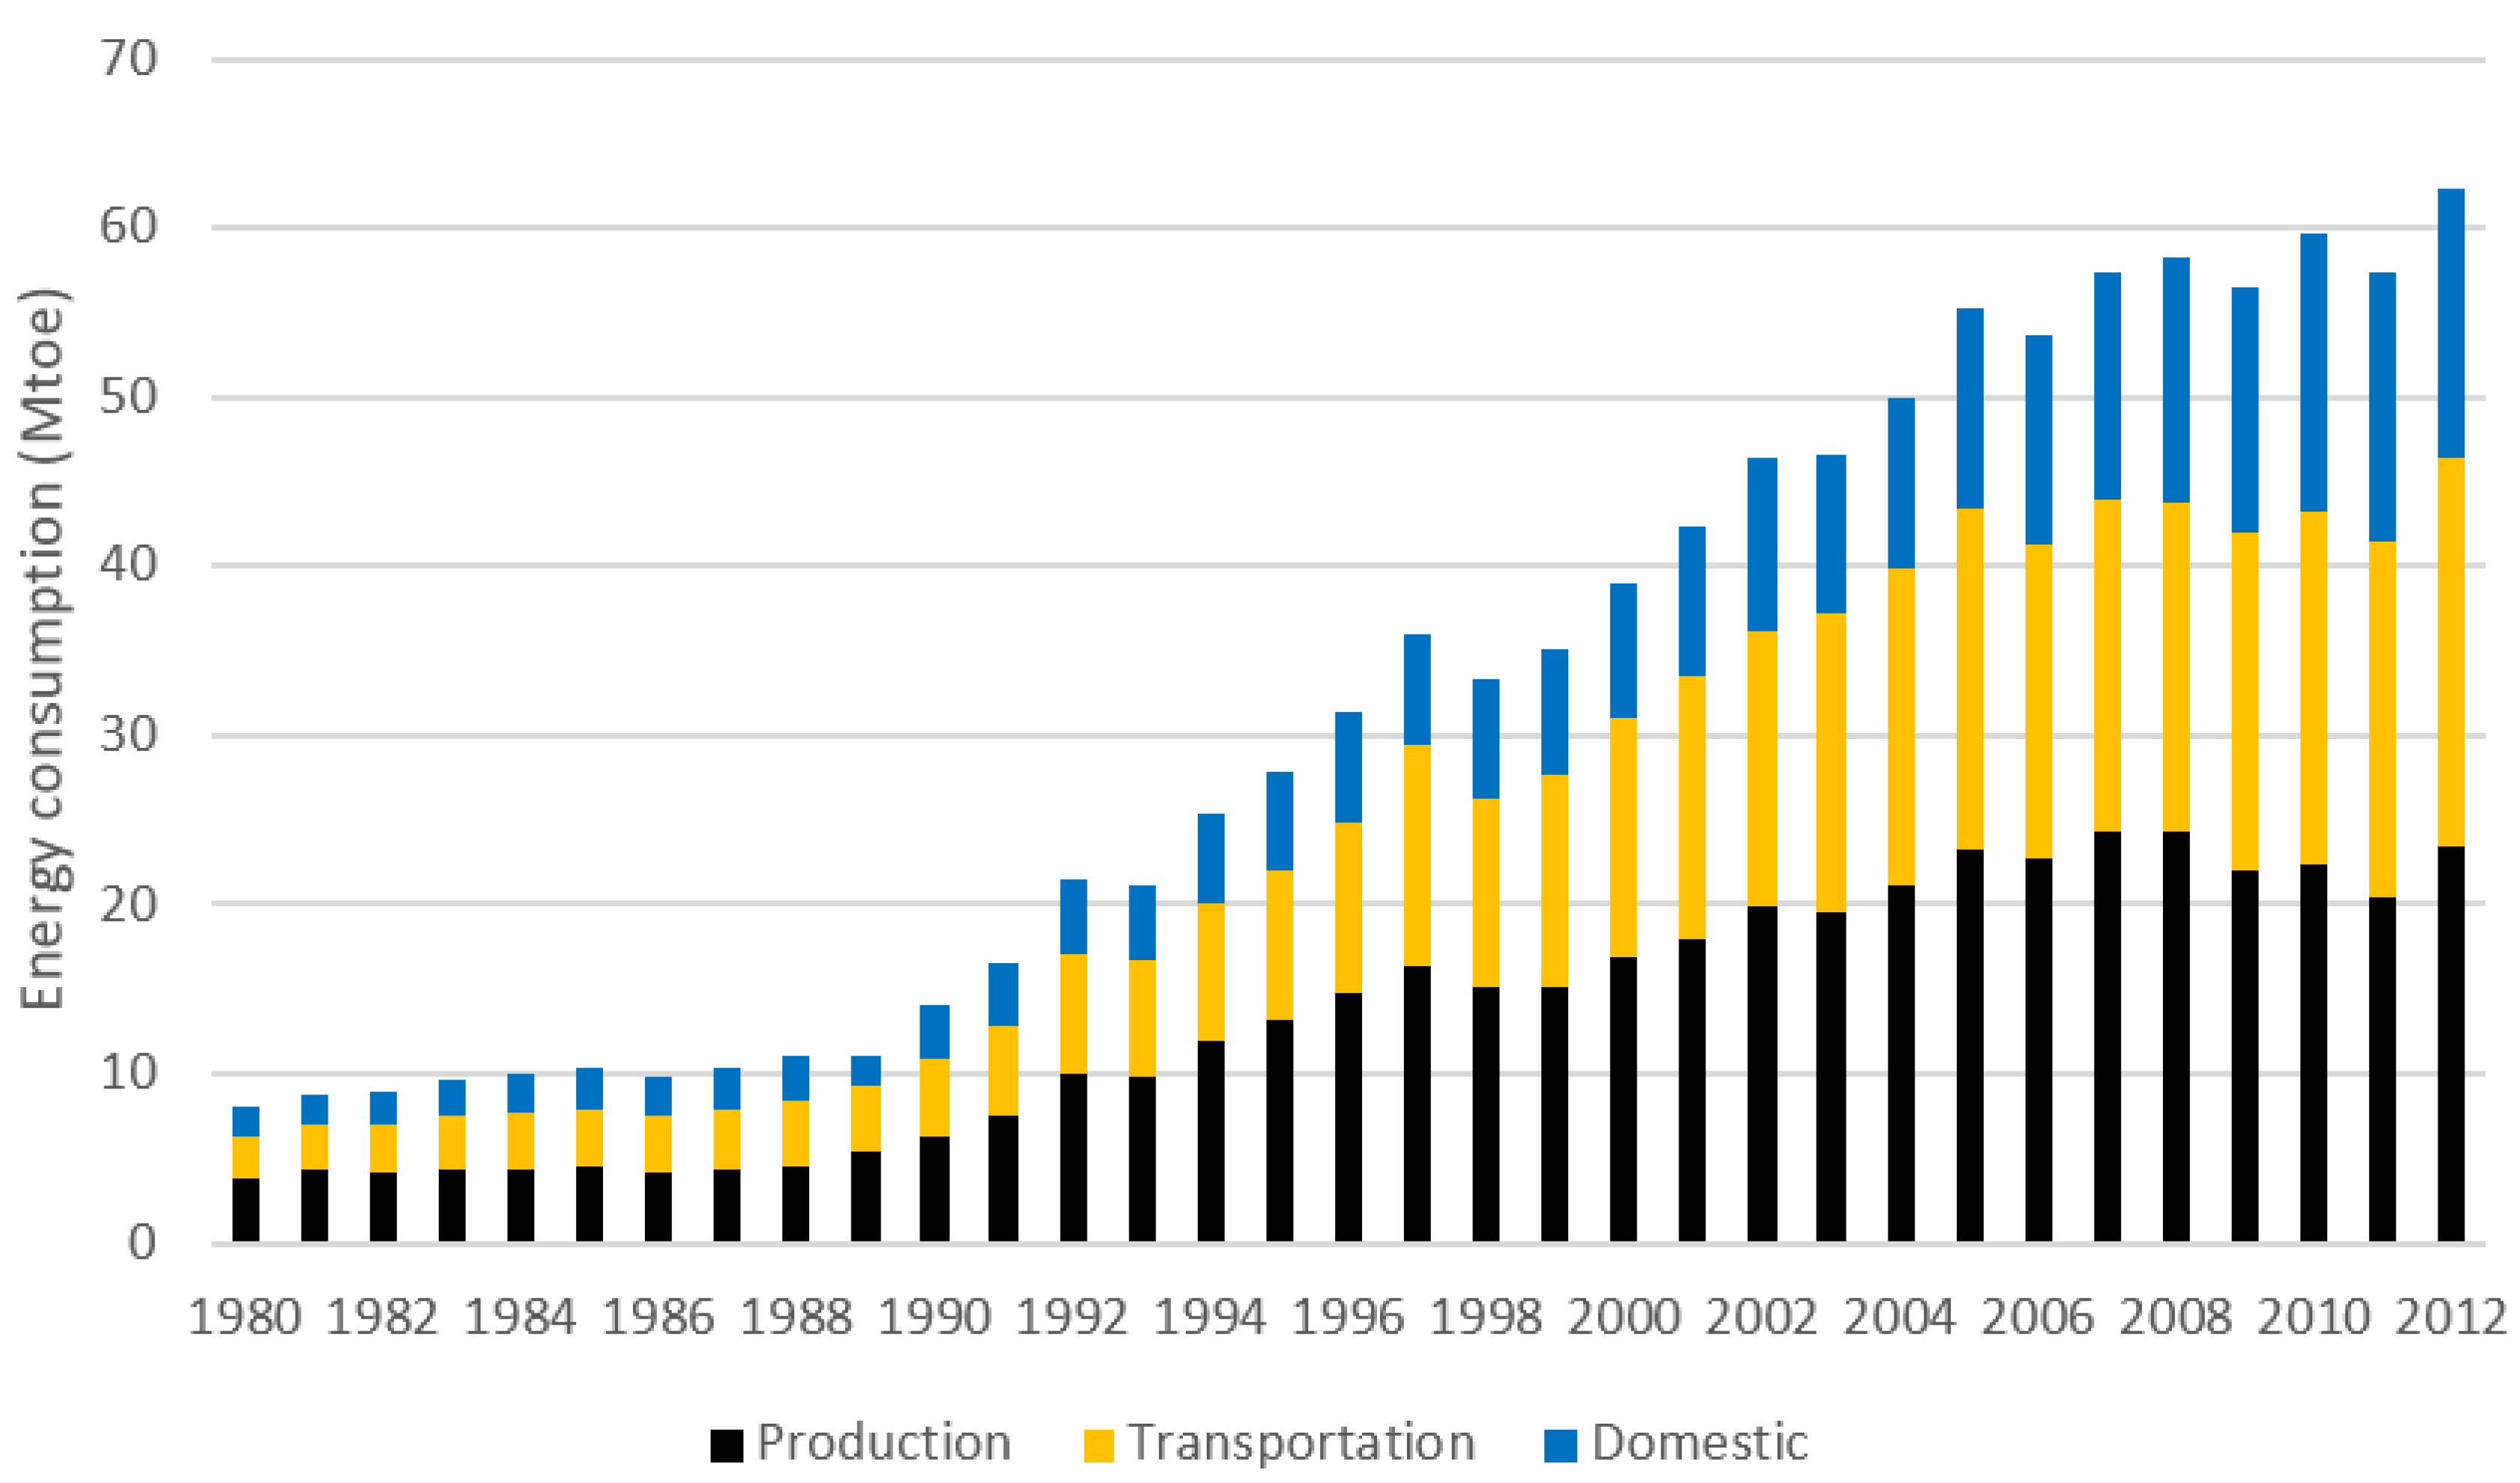
- 1980–1990: Initial stage of industrialization. Primary industry especially agriculture was replaced by secondary industry gradually, and energy consumption growth maintained at a low rate in this stage.
- (2)
- 1990–2005: Middle stage of industrialization. Malaysia was simultaneously experiencing rapid industrialization, urbanization and motorization in this stage. Huge amount of energy were consumed to support the rapid development of industrial sector and the new added demand of services primarily pertaining to energy-intensive products, such as houses, cars, machines and infrastructures. Both energy consumption in the manufacturing, transportation and domestic sectors experienced a high speed growth in this stage.
- (3)
- 2005–2012: Later in the middle stage of industrialization, the proportion of secondary industry decreased whereas the proportion of tertiary industry increased gradually. Comparing with the previous stages, energy consumption in all sectors showed an obvious deceleration, in which the energy consumption growth of the manufacturing sector was nearly zero.
| Period | Average annual end-use energy consumption growth (%) | |||
|---|---|---|---|---|
| Manufacture | Transportation | Domestic | Total | |
| 1980–1990 | 5.06% | 6.21% | 6.52% | 5.74% |
| 1990–2005 | 9.11% | 10.40% | 9.28% | 9.59% |
| 2005–2012 | 0.06% | 1.95% | 4.28% | 1.74% |
| 1980–2012 | 5.81% | 7.19% | 7.31% | 6.62% |
4.2. Resource Availability
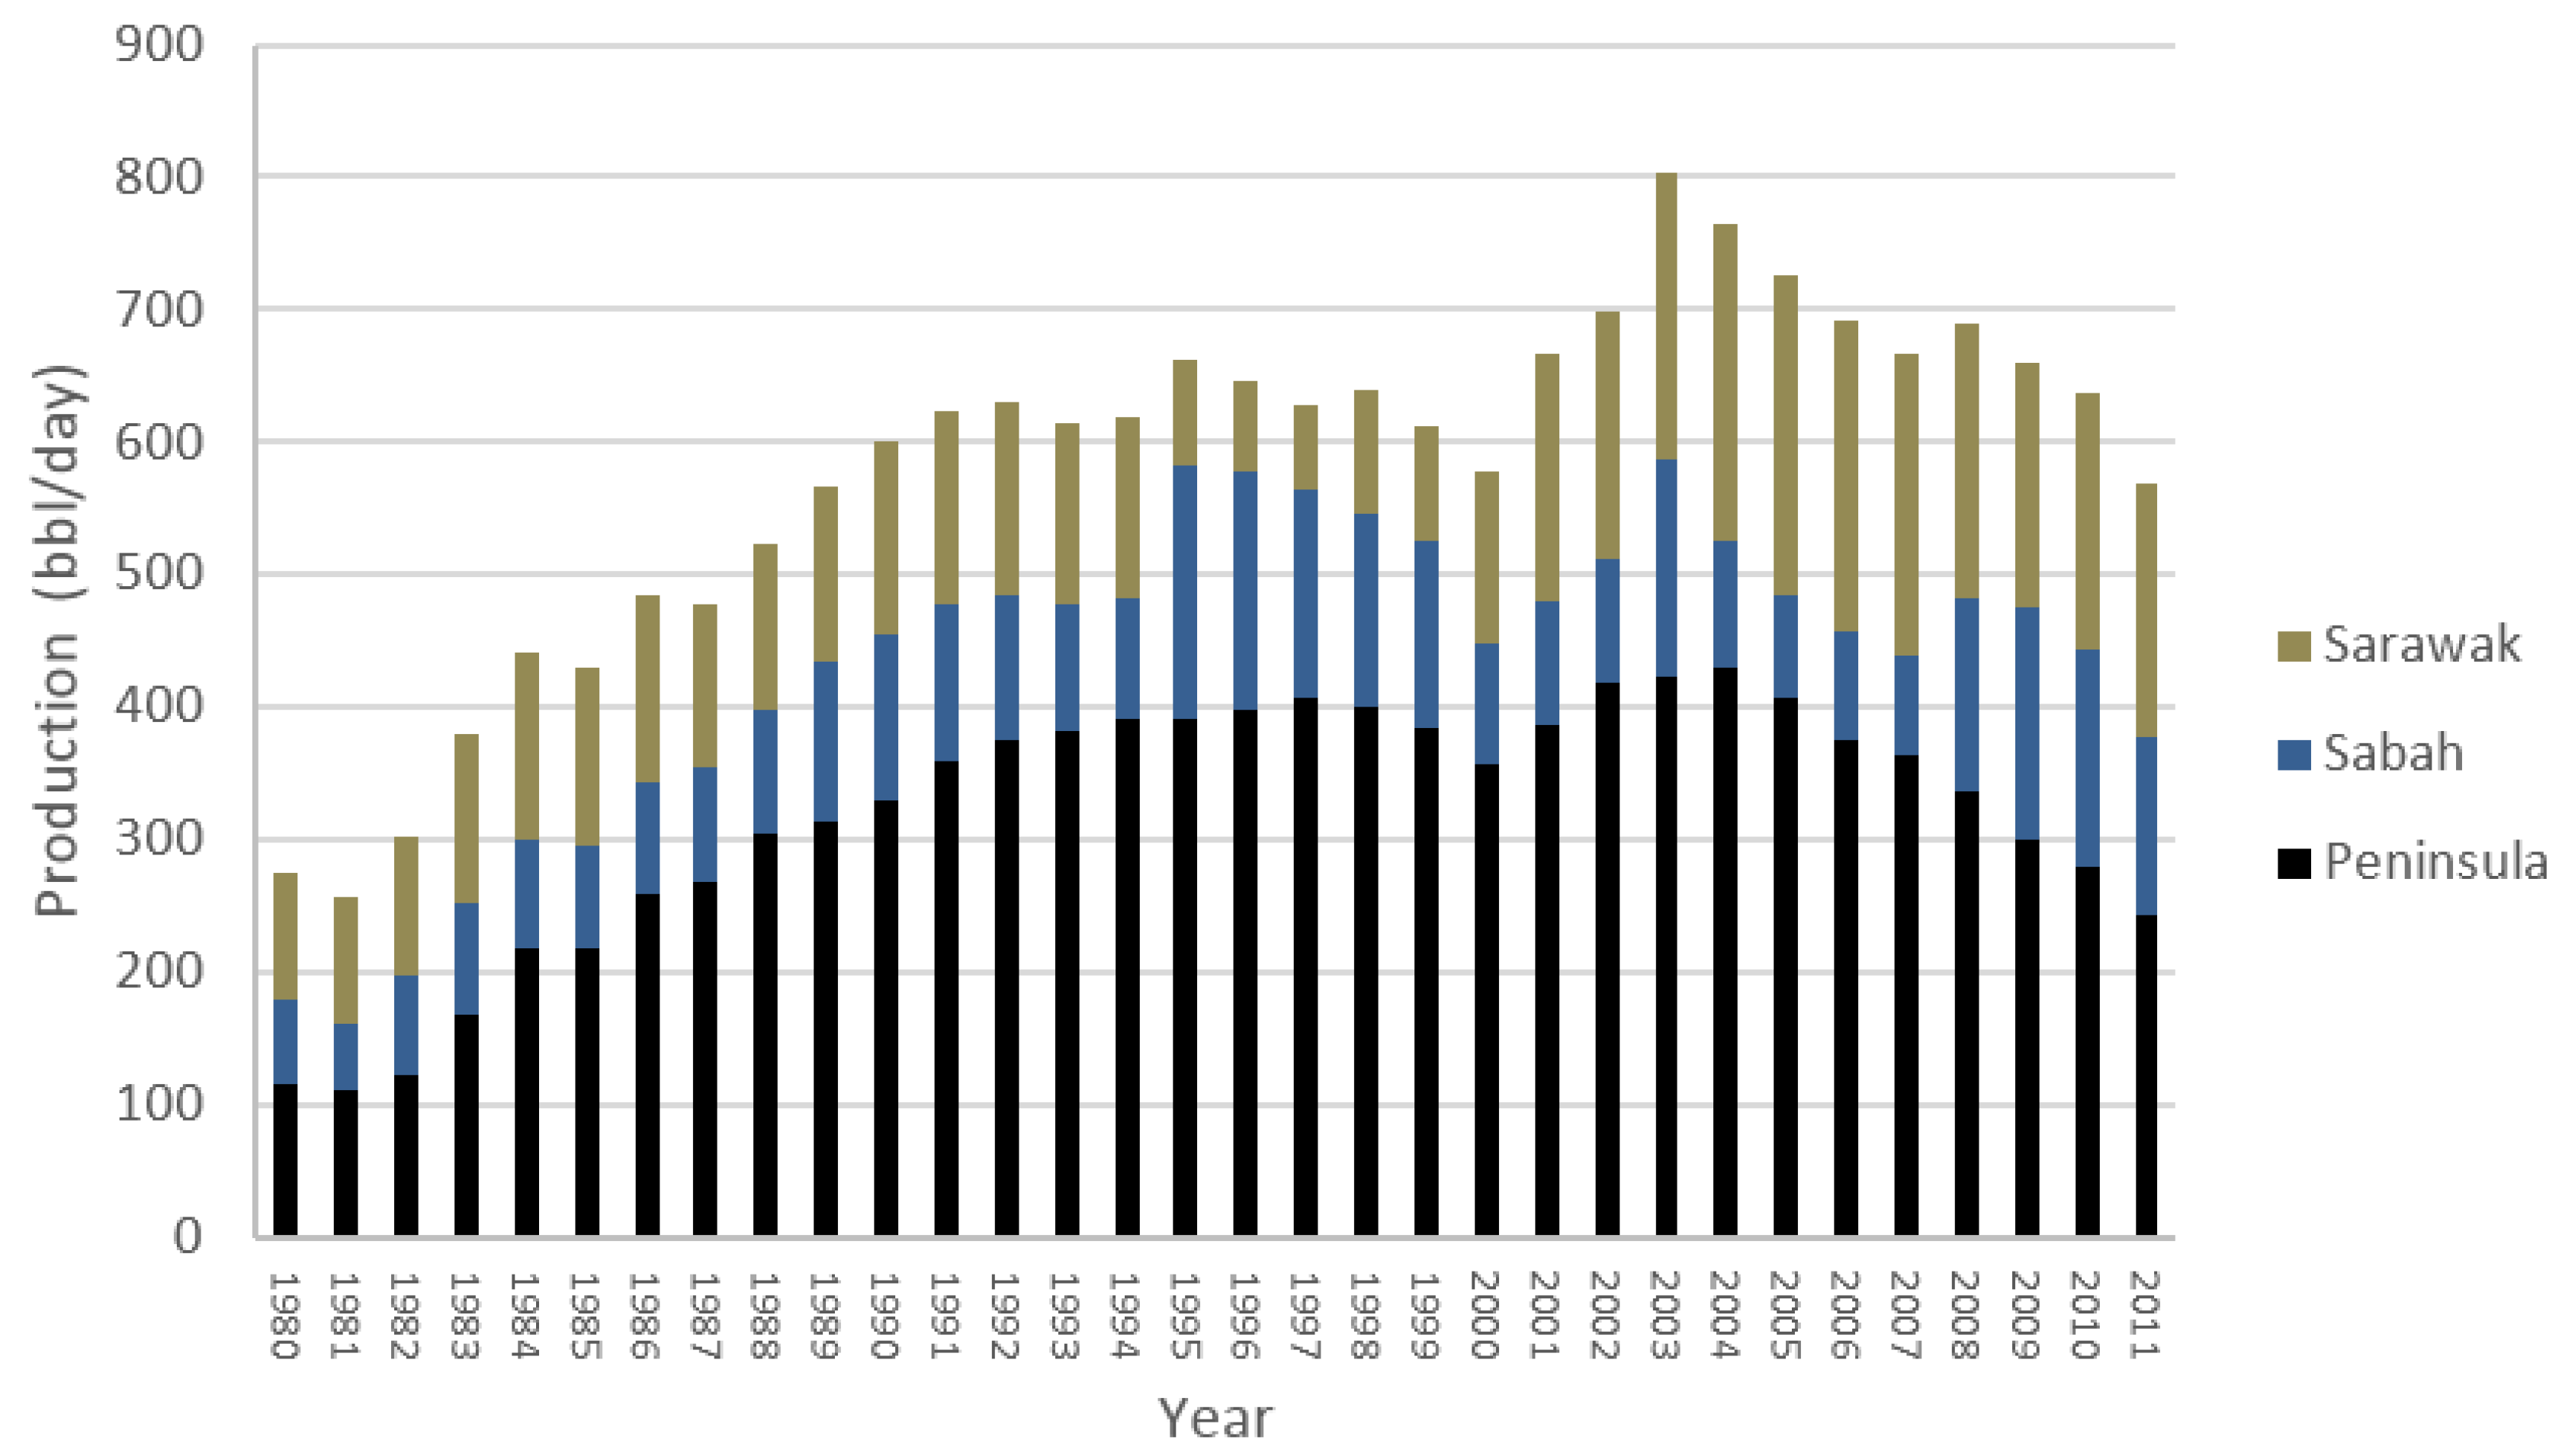
4.2.1. Crude Oil
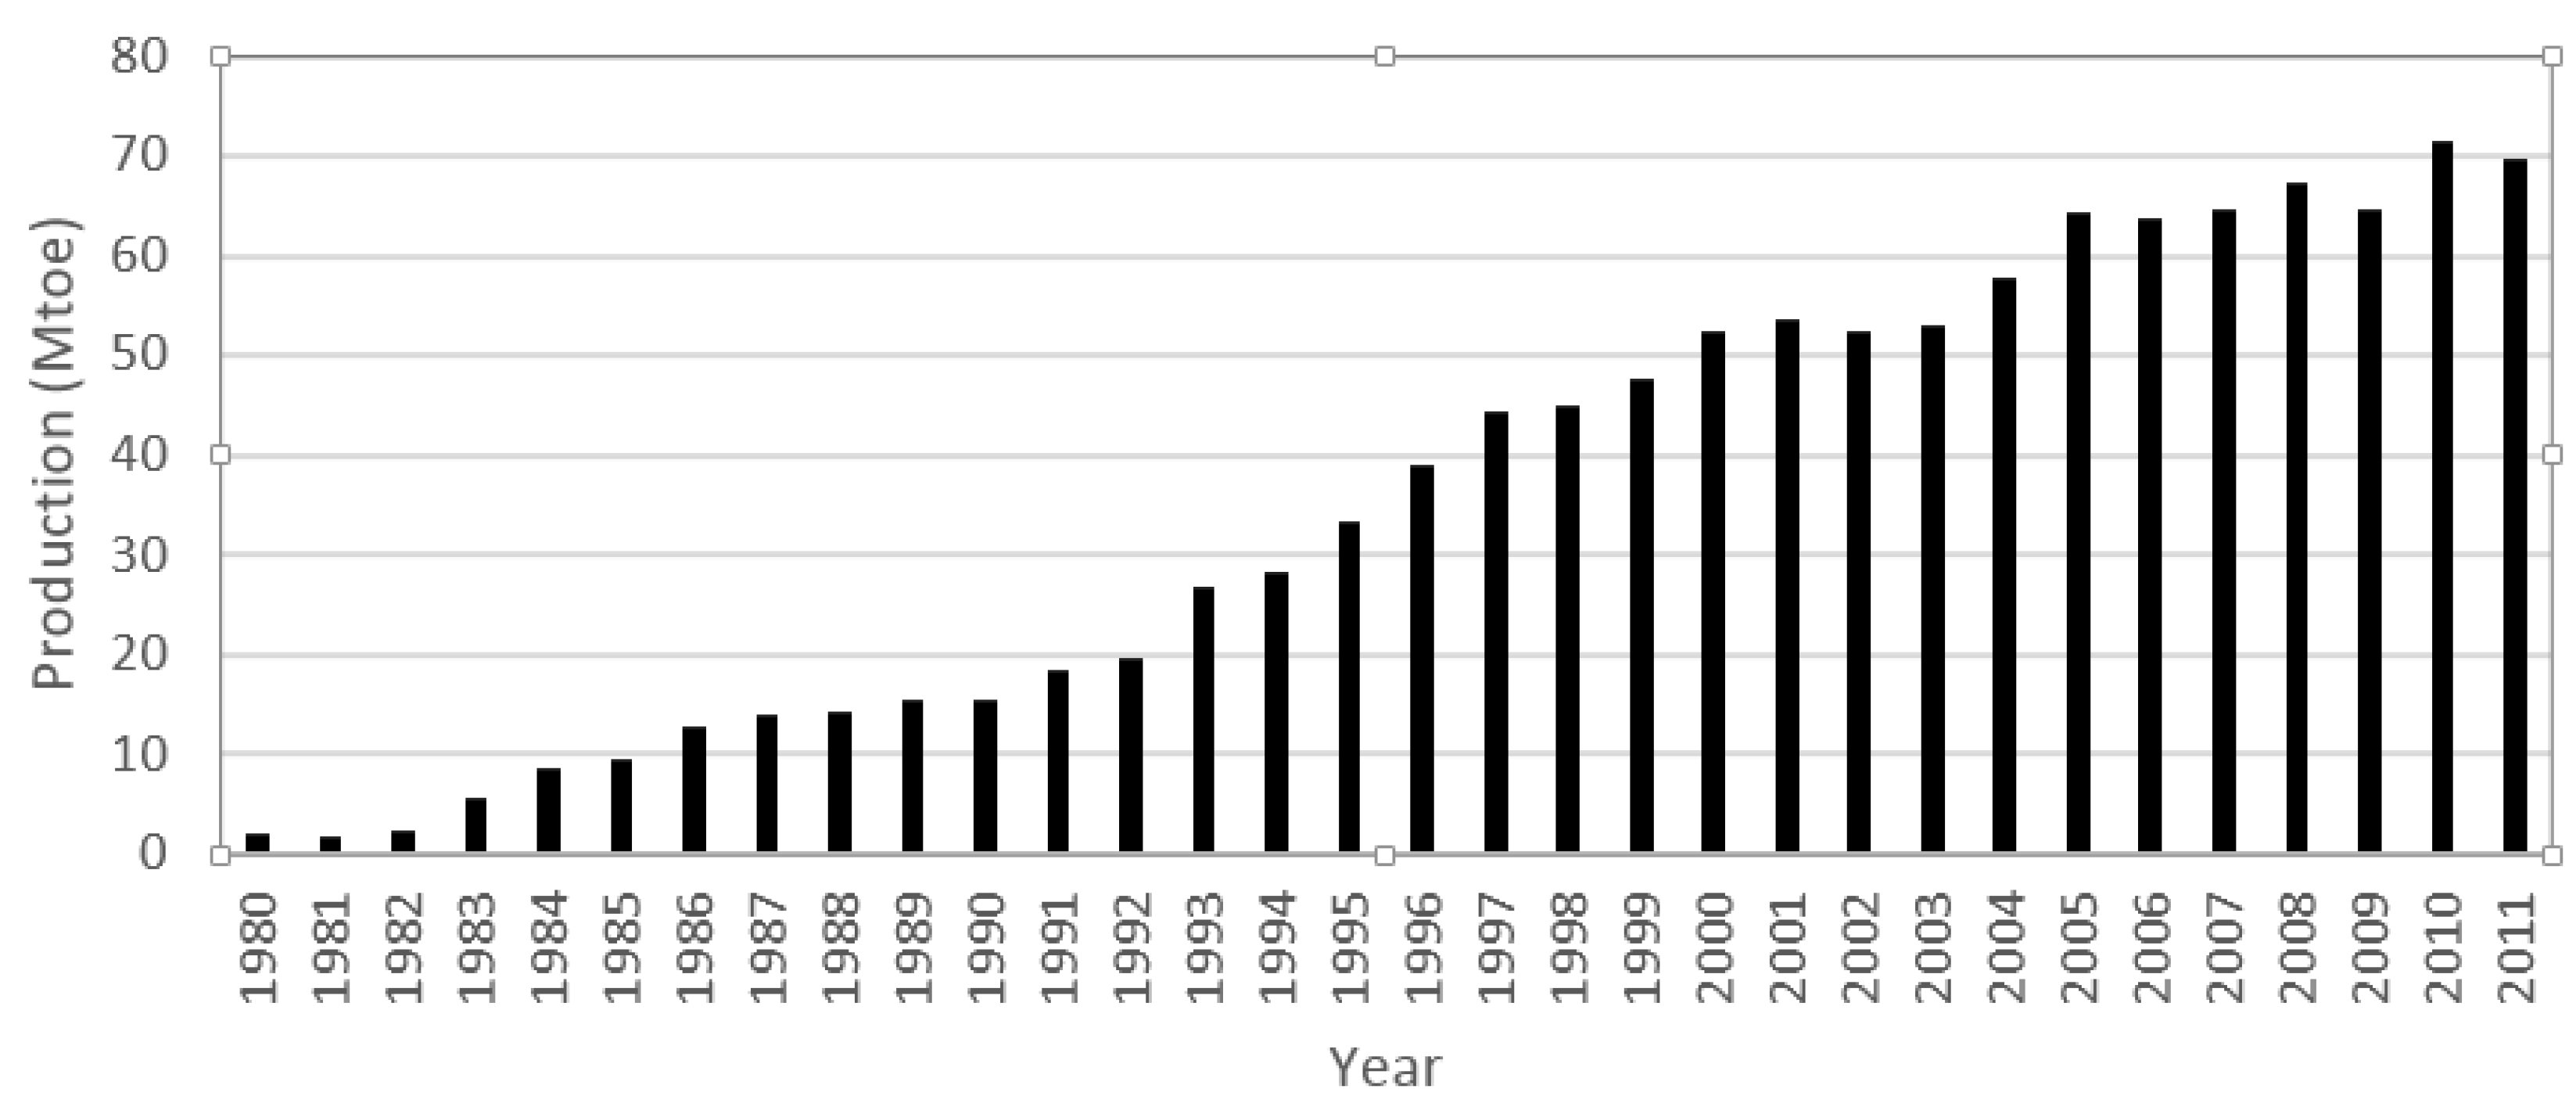
4.2.2. Natural Gas
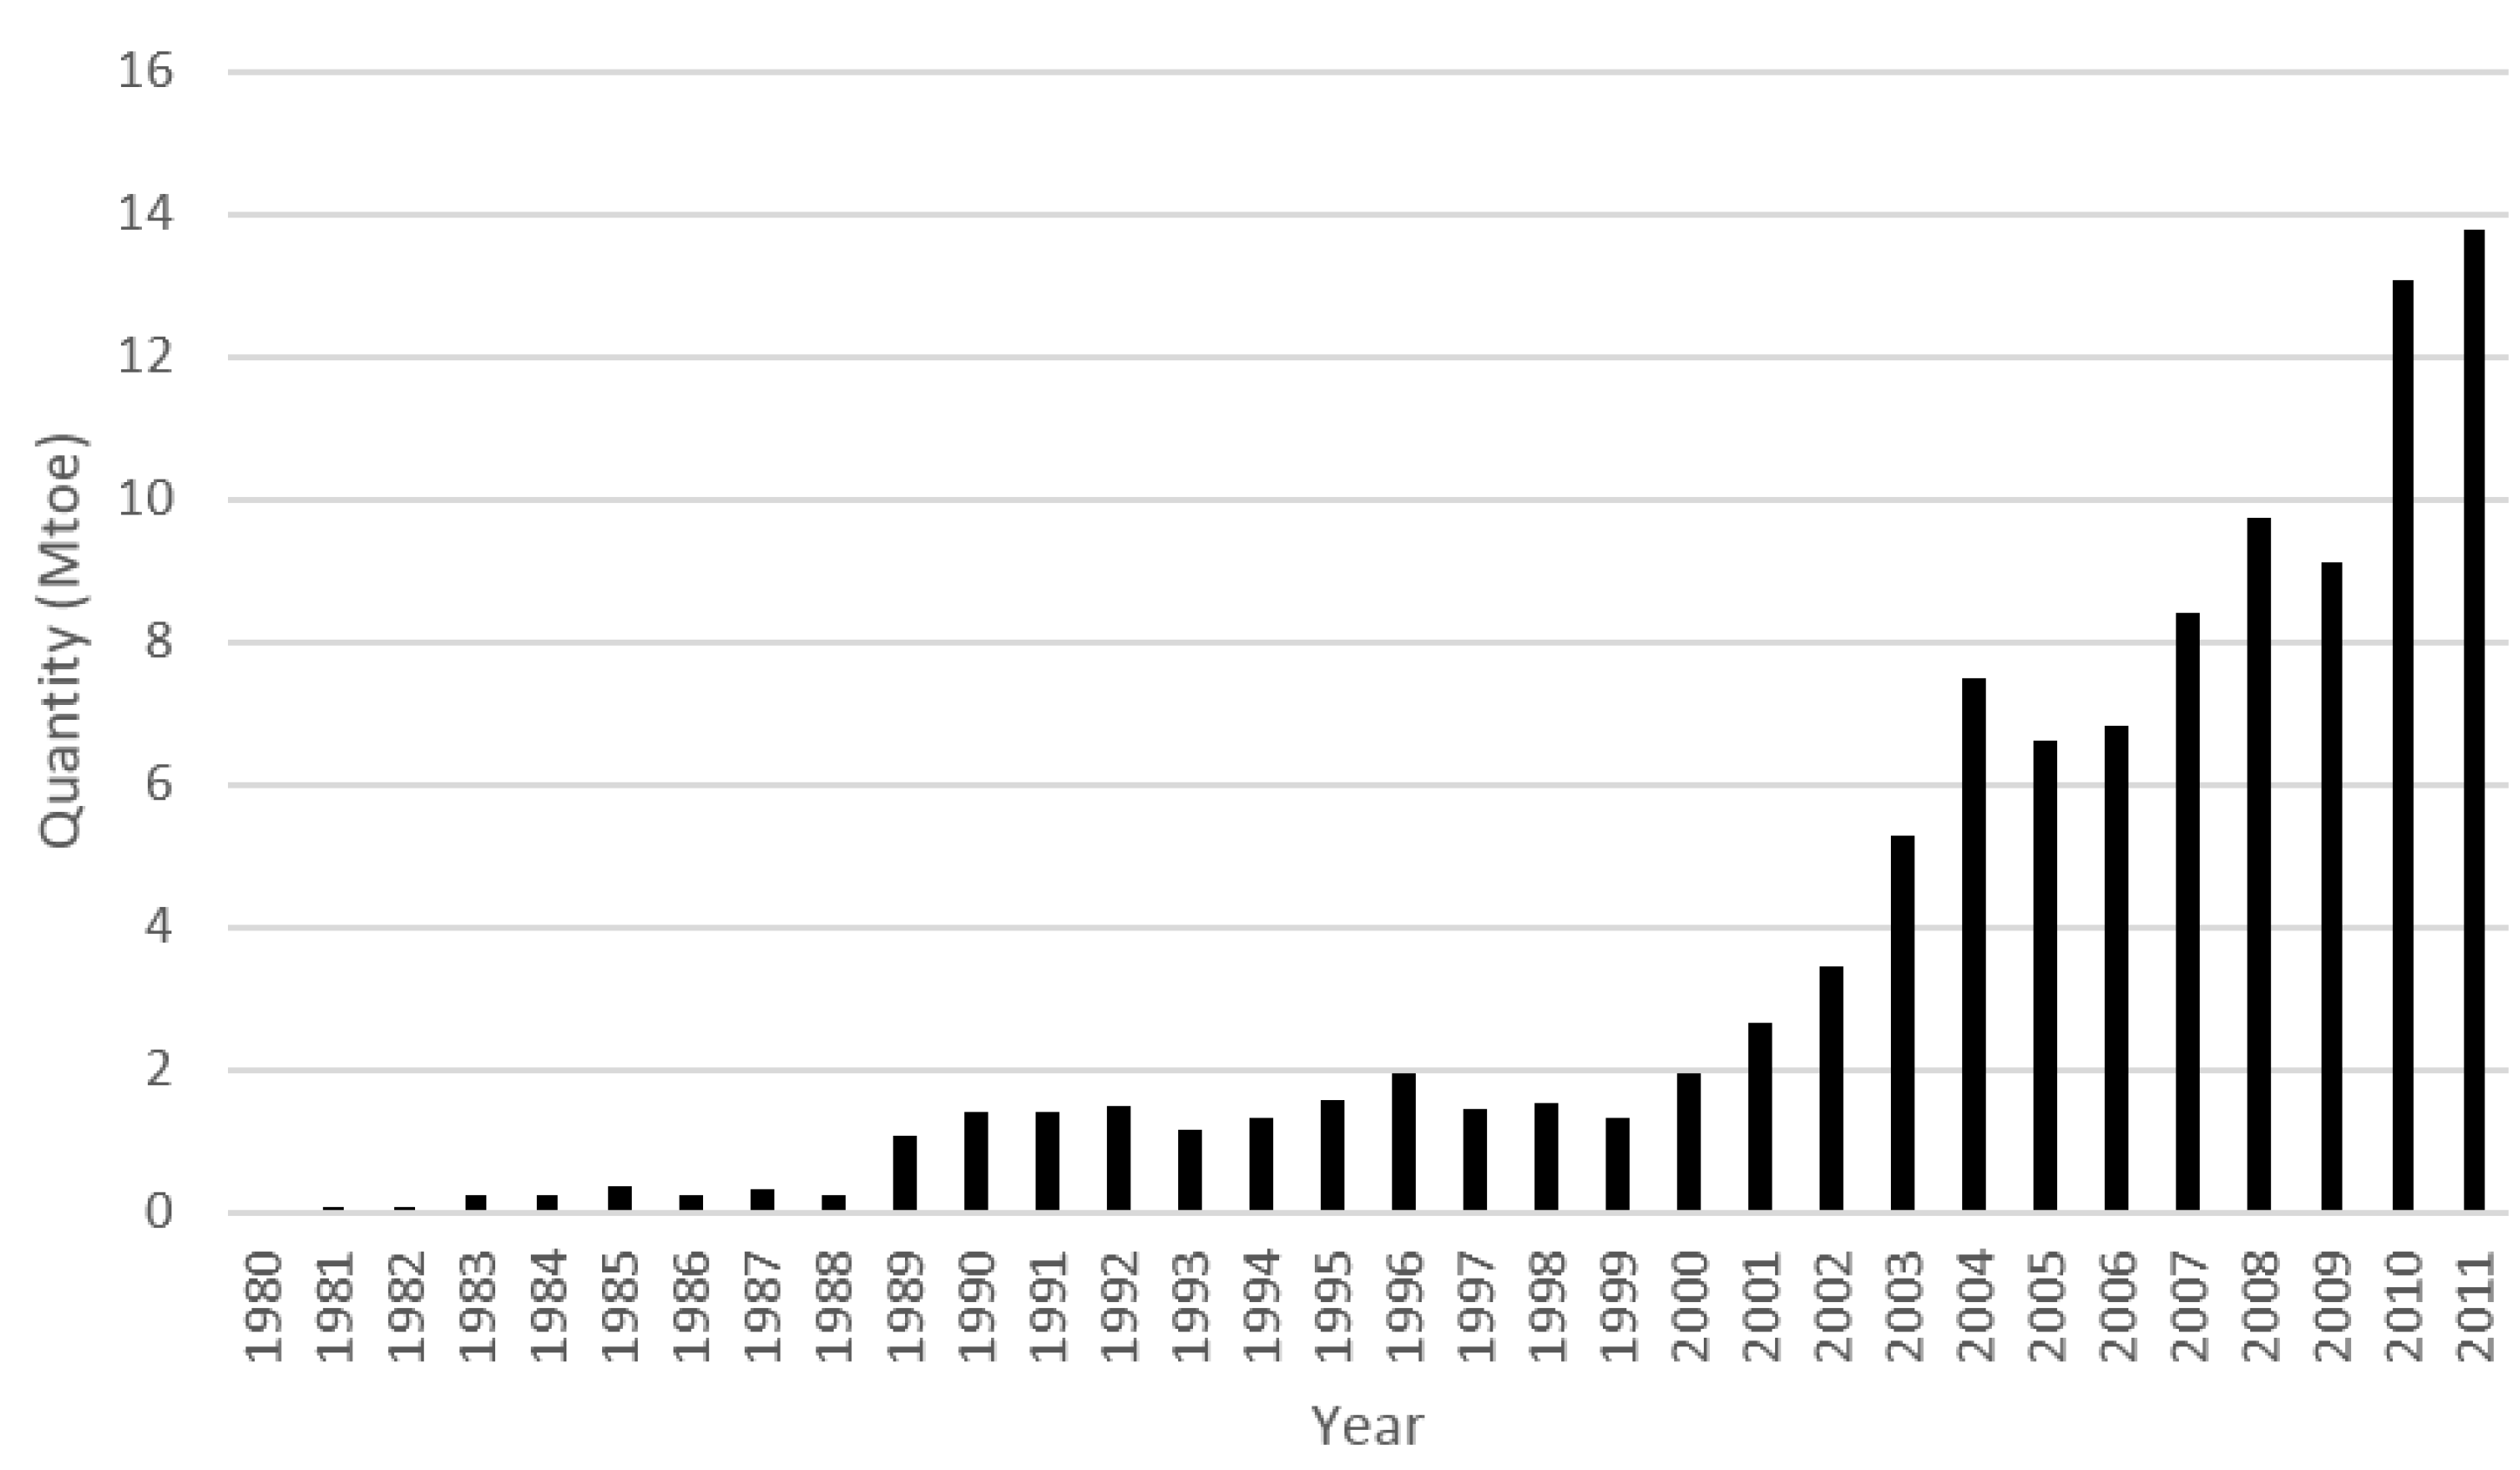
4.2.3. Coal
4.2.4. Renewable Energy
4.3. Technology Choice
4.3.1. Electricity Generation
Oil-Fired Power Plants
Gas-fired Power Plants
Coal-fired Power Plants
Hydropower Power Plants
Nuclear Power Plants
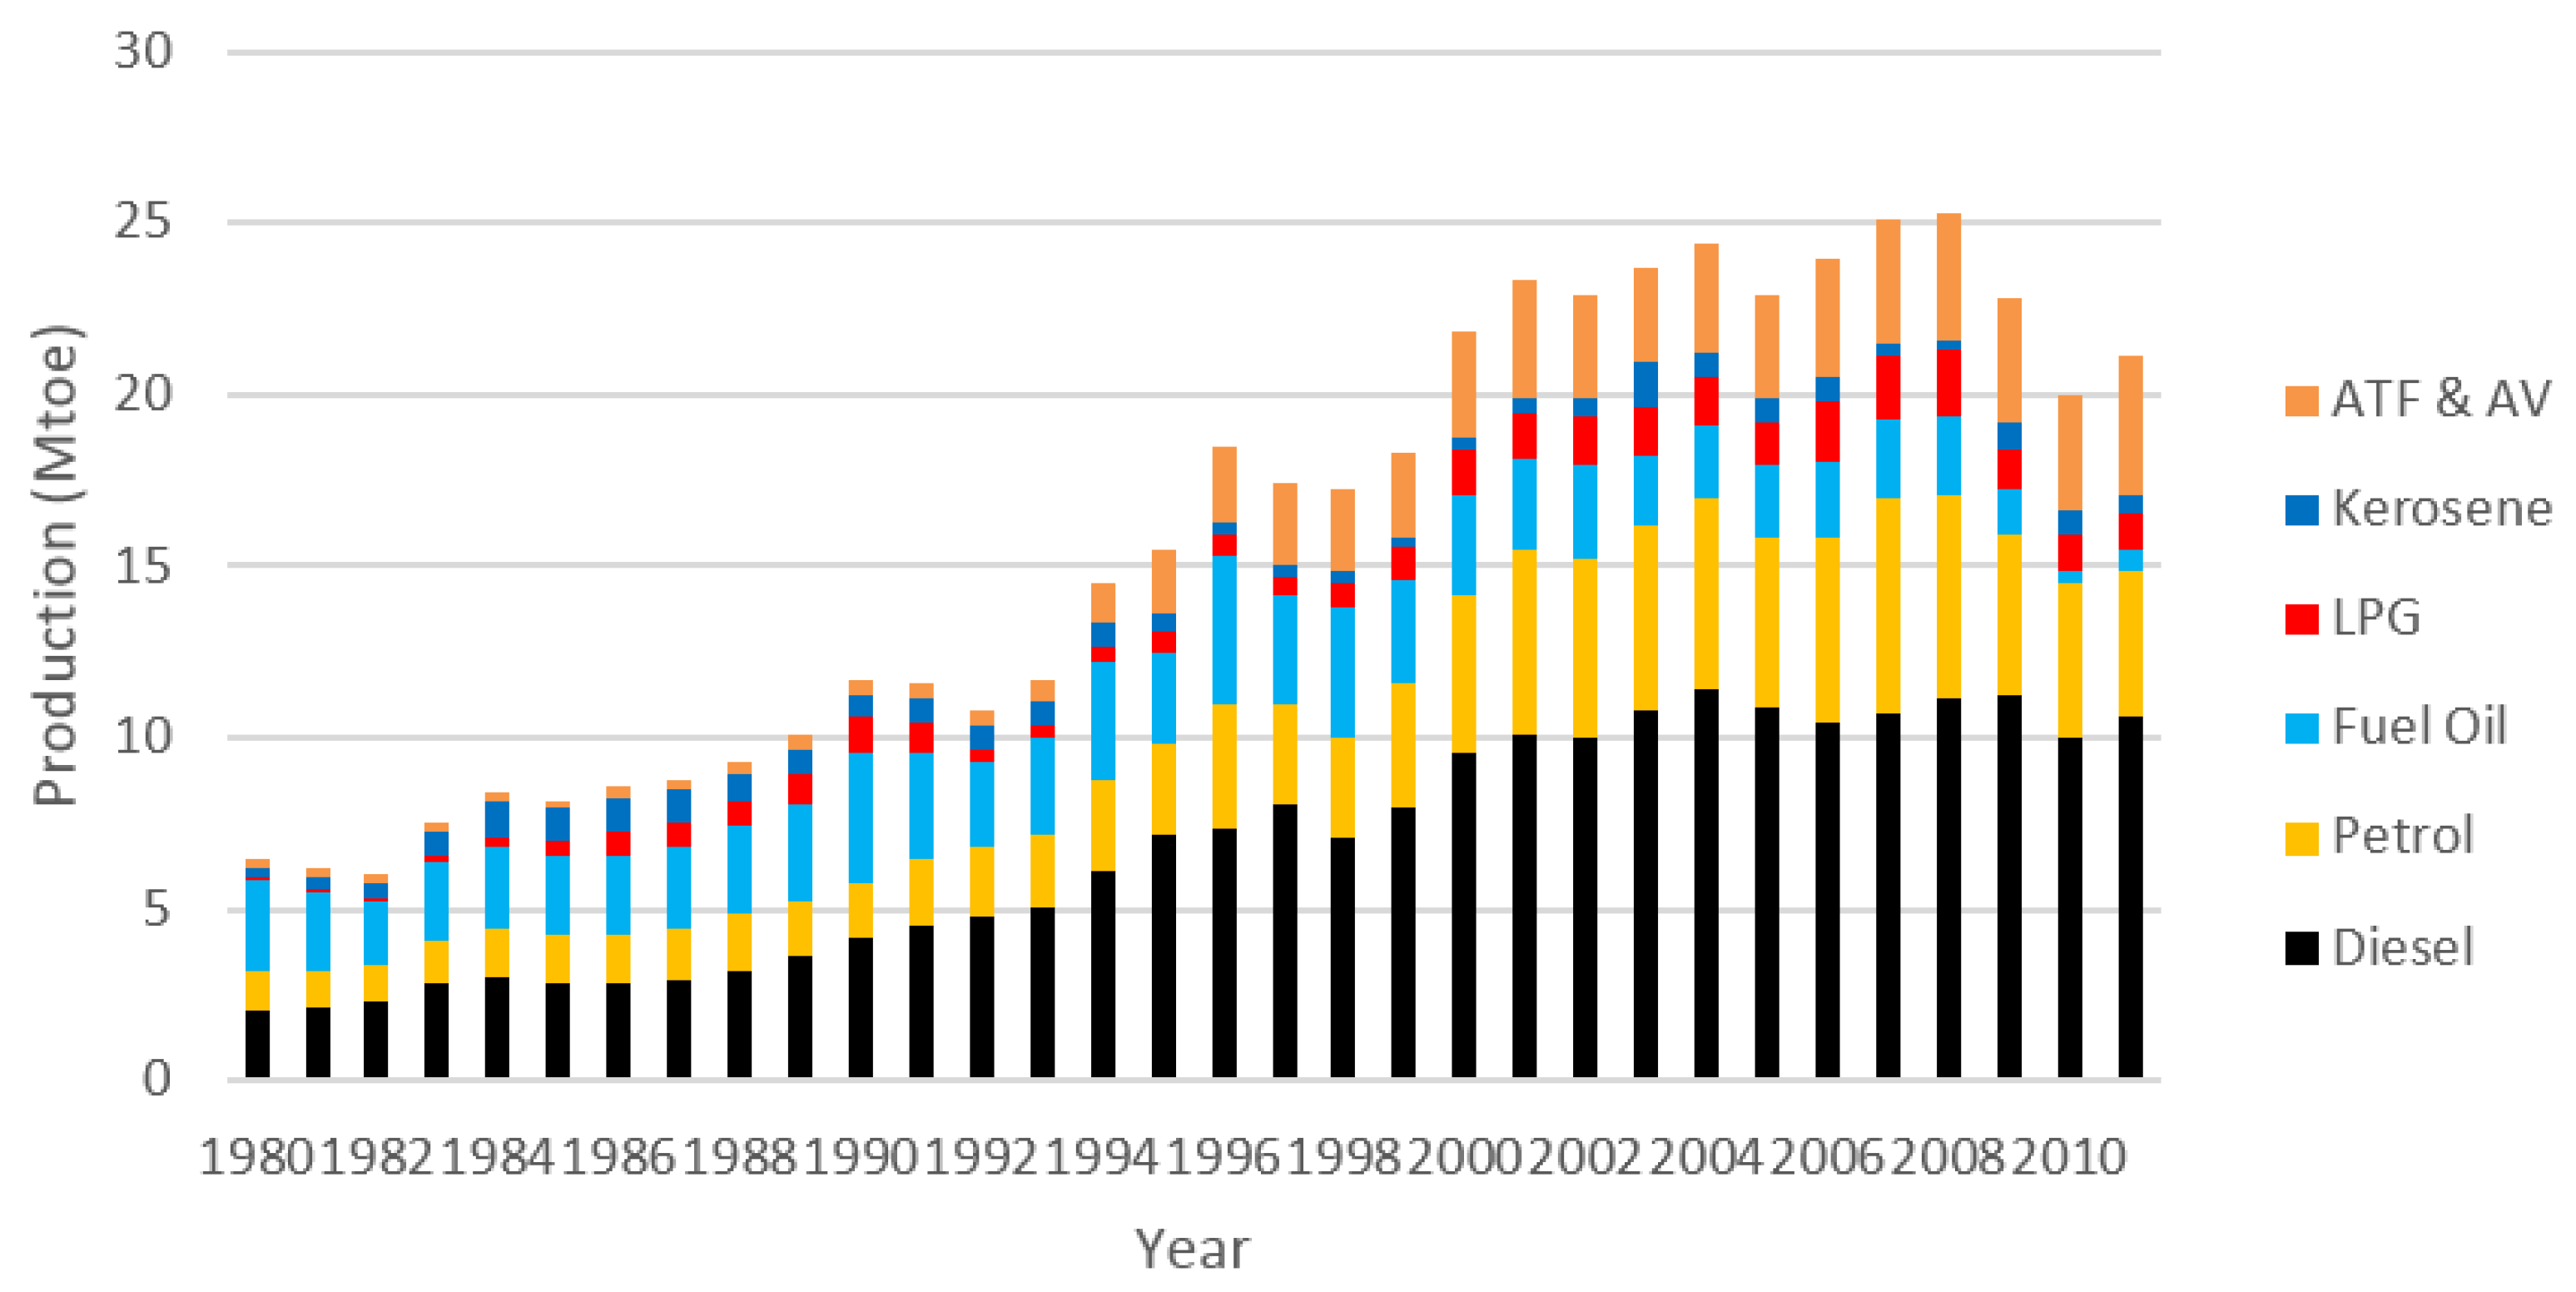
4.3.2. Oil Refining
| Refinery | Ownership | Capacity |
|---|---|---|
| Melaka I refinery | PETRONAS | 93,000 bbl/d |
| Melaka II refinery | PETRONAS, ConocoPhillips | 126,000 bbl/d |
| Kertih refinery | PETRONAS | 40,000 bbl/d |
| Port Dickson refinery | Royal Dutch Shell | 125,000 bbl/d |
| Petron Port Dickson refinery | Petron | 86,000 bbl/d |
| Kemaman Bitumen refinery | TIPCO | 24,000 bbl/d |
4.3.3. Biodiesel
| National biofuels policy | |
|---|---|
| Short-term plan | Establish Malaysian standard specifications for the B5 biodiesel; Participate in B5 biodiesel trials by selected government departments with their fleets of diesel vehicles; Establish B5 biodiesel pumps for the public at selected stations; Voluntary trials on B5 biodiesel by the Malaysian Palm Oil Board for selected users in the industrial sector; Promote awareness to educate the public on the use of B5 biodiesel. |
| Medium-term plan | Establish Malaysian standard specifications for palm oil-based methyl ester for domestic use and export; Engage engine manufacturers to extend warranties to include the use of B5 diesel; Conduct extensive B5 testing to facilitate granting of such engine warranties; Pass and enforce legislation to mandate use of B5 diesel; Encourage establishment of commercial methyl ester plants. The MPOB will act as catalyst by pioneering the establishment of palm biodiesel plants in Malaysia in collaboration with the private sector. |
| Long-term plan | Gradually increase the proportion of palm oil in the diesel blend; Promote greater uptake of biofuels technology by Malaysian companies and foreign companies abroad. |
4.4. Policy Adjustment
4.4.1. Policy Adjustment in the History
Diversification of fossil fuel
- (1)
- The Supply Objective, to ensure adequate, secure and cost-effective energy supply through developing and utilizing alternative sources of energy (both non-renewable and renewable) from within and outside the country;
- (2)
- The Utilization Objective, to promote efficient utilization of energy and discourage wasteful and non-productive patterns of energy consumption;
- (3)
- The Environmental Objective, to minimize the negative environmental impacts on the energy supply chain i.e., energy production, conservation, transportation and utilization.
Introduction of renewable energy
| Year | Renewable energy installation capacity (MW) | Share in electricity generation capacity | |||||
|---|---|---|---|---|---|---|---|
| Biomass | Biogas | Small-hydropower | Solar PV | Solid waste | Total | ||
| 2015 | 330 | 100 | 290 | 55 | 200 | 975 | 6% |
| 2020 | 800 | 240 | 490 | 175 | 360 | 2065 | 10% |
| 2030 | 1340 | 410 | 490 | 854 | 390 | 3484 | 13% |
| 2050 | 1340 | 410 | 490 | 8874 | 430 | 11,544 | 34% |
| Year | Annual electricity generation (Mtoe) | |||||
|---|---|---|---|---|---|---|
| Biomass | Biogas | Small-hydropower | Solar PV | Solid waste | Total | |
| 2015 | 2024 | 613 | 1450 | 61 | 1223 | 5374 |
| 2020 | 4906 | 1472 | 2450 | 194 | 2208 | 11,229 |
| 2030 | 8217 | 2514 | 2450 | 1019 | 2392 | 16,592 |
| 2050 | 8271 | 2514 | 2450 | 13,540 | 2637 | 29,358 |
Promotion of green technology
4.4.2. Facing the Challenge of Global Climate Change
5. Conclusions and Suggestions
Acknowledgments
Author Contributions
Abbreviations
| AV | Aviation fuel |
| ATF | Aviation Turbine Fuel |
| bbl/d | barrel per day |
| GPP | Gas Processing Plant |
| LNG | Liquefied Natural Gas |
| LPG | Liquefied Petroleum Gas |
| MDS | Middle Distillate Synthesis |
| MMscfd | Metric million standard cubic feet per day |
| Mtoe | Million ton of oil equivalent |
| PEQ | Primary Energy Quantity |
| SQ | Standard Quantity |
| Tcf | Trillion cubic feet |
Conflicts of Interest
References
- Malaysia Government. Statistical Handbook Malaysia 2013; Department of Statistics: Kuala Lumpur, Malaysia, 2014.
- Malaysia Overview. Available online: http://www.worldbank.org/en/country/malaysia/overview (accessed on 21 November 2014).
- Wawasan 2020. Available online: http://www.epu.gov.my/wawasan-2020-1991-2020 (accessed on 21 November 2014).
- Malaysia’s Transformation. Available online: http://etp.pemandu.gov.my/Invest_In_Malaysia-@-Malaysia’s_Transformation.aspx (accessed on 21 November 2014).
- Ong, H.C.; Mahlia, T.M.I.; Masjuki, H.H. A review on energy scenario and sustainable energy in Malaysia. Renew. Sustain. Energy Rev. 2011, 15, 639–647. [Google Scholar] [CrossRef]
- Rahim, K.A.; Liwan, A. Oil and gas trends and implications in Malaysia. Energy Policy 2012, 50, 262–271. [Google Scholar] [CrossRef]
- Gan, P.Y.; Komiyama, R.; Li, Z. A low carbon society outlook for Malaysia to 2035. Renew. Sustain. Energy Rev. 2013, 21, 432–443. [Google Scholar] [CrossRef]
- Ali, R.; Daut, I.; Taib, S. A review on existing and future energy sources for electrical power generation in Malaysia. Renew. Sustain. Energy Rev. 2012, 16, 4047–4055. [Google Scholar] [CrossRef]
- Shekarchian, M.; Moghavvemi, M.; Mahlia, T.M.I.; Mazandarani, A. A review on the pattern of electricity generation and emission in Malaysia from 1976 to 2008. Renew. Sustain. Energy Rev. 2011, 15, 2629–2642. [Google Scholar] [CrossRef]
- Ahamed, J.U.; Saidur, R.; Masjuki, H.H.; Mekhilef, S.; Ali, M.B.; Furqon, M.H. An application of energy and exergy analysis in agricultural sector of Malaysia. Energy Policy 2011, 39, 7922–7929. [Google Scholar] [CrossRef]
- Saidur, R.; Masjuki, H.H.; Jamaluddin, M.Y. An application of energy and exergy analysis in residential sector of Malaysia. Energy Policy 2007, 35, 1050–1063. [Google Scholar] [CrossRef]
- Saidur, R.; Sattar, M.A.; Masjuki, H.H.; Abdessalam, H.; Shahruan, B.S. Energy and exergy analysis at the utility and commercial sectors of Malaysia. Energy Policy 2007, 35, 1956–1966. [Google Scholar] [CrossRef]
- Saidur, R.; Sattar, M.A.; Masjuki, H.H.; Ahmed, S.; Hashim, U. An estimation of the energy and exergy efficiencies for the energy resources consumption in the transportation sector in Malaysia. Energy Policy 2007, 35, 4018–4026. [Google Scholar] [CrossRef]
- BoroumandJazi, G.; Rismanchi, B.; Saidur, R. A review on exergy analysis of industrial sector. Renew. Sustain. Energy Rev. 2013, 27, 198–203. [Google Scholar] [CrossRef]
- Chua, S.C.; Oh, T.H. Review on Malaysia’s national energy developments: Key policies, agencies, programmes and international involvements. Renew. Sustain. Energy Rev. 2010, 14, 2916–2925. [Google Scholar] [CrossRef]
- Oh, T.H.; Pang, S.Y.; Chua, S.C. Energy policy and alternative energy in Malaysia: Issues and challenges for sustainable growth. Renew. Sustain. Energy Rev. 2010, 14, 1241–1252. [Google Scholar] [CrossRef]
- Ma, L.W.; Fu, F.; Li, Z.; Liu, P. Oil development in China: Current status and future trends. Energy Policy 2012, 45, 43–53. [Google Scholar] [CrossRef]
- Schmidt, M. The Sankey diagram in energy and material flow management. J. Ind. Ecol. 2008, 12, 82–94. [Google Scholar] [CrossRef]
- Cullen, J.M.; Allwood, J.M. The efficient use of energy: Tracing the global flow of energy from fuel to service. Energy Policy 2010, 38, 75–81. [Google Scholar] [CrossRef]
- Ma, L.W.; Allwood, J.M.; Cullen, J.M.; Li, Z. The use of energy in China: Tracing the flow of energy from primary source to demand drivers. Energy 2012, 40, 174–188. [Google Scholar] [CrossRef]
- Chong, C.H.; Ma, L.W.; Li, Z.; Geng, J.; Zhang, T.K. A programmed data-processing method for mapping energy allocation sankey diagram of China. In Proceedings of the 2014 International Conference on Power and Energy, Shanghai, China, 29 November 2014.
- Malaysia Energy Commission. Malaysia National Energy Balance 2011; Suruhanjaya Tenaga Malaysia: Putrajaya, Malaysia, 2013. [Google Scholar]
- Van den Akker, J. Malaysian Energy Effiency Improvement Programme. Available online: http://www.my.undp.org/content/malaysia/en/home/operations/projects/environment_and_energy/13472_EnergyEfficiency.html (accessed on 22 November 2014).
- Kennedy, S.; Ahamad, F. Estimating the impact of vehicle modification costs on the demand for biofuels in Malaysia. Energy Sustain. Dev. 2007, 11, 67–76. [Google Scholar] [CrossRef]
- British Petroleum. Bp Statistical Review of World Energy. June 2014. Available online: http://www.bp.com/content/dam/bp/pdf/Energy-economics/statistical-review-2014/BP-statistical-review-of-world-energy-2014-full-report.pdf (accessed on 22 November 2014).
- An Overview Report of Malaysia Energy System. Available online: http://www.eia.gov/countries/cab.cfm?fips=MY (accessed on 22 November 2014).
- LNG Shipping of Misc Berhad. Available online: http://www.misc.com.my/LNG_Shipping-@-LNG_Shipping.aspx (accessed on 22 November 2014).
- Sovacool, B.K.; Bulan, L.C. Energy security and hydropower development in Malaysia: The drivers and challenges facing the Sarawak corridor of renewable energy (score). Renew. Energy 2012, 40, 113–129. [Google Scholar] [CrossRef]
- Worldbank. East Asia and the Pacific Country Forecasts. Available online: http://www.worldbank.org/en/publication/global-economic-prospects/regional-outlooks/eap#5 (accessed on 24 February 2015).
- Malaysia Energy Commission. Malaysia Energy Information Hub Statistics Online Database; Malaysia Energy Commission: Putrajaya, Malaysia, 2013. [Google Scholar]
- Energy Information Administration. An Overview Report of Malaysia Energy System. Available online: http://www.eia.gov/countries/cab.cfm?fips=my (accessed on 24 November 2014).
- Energy Supply Objective of Malaysia. Available online: http://www.kettha.gov.my/en/content/supply-objective (accessed on 24 February 2015).
- List of Power Stations in Malaysia. Available online: http://en.wikipedia.org/wiki/List_of_power_stations_in_Malaysia (accessed on 24 February 2015).
- Today, F.M. Official: Nuclear Power Plan Delayed. Available online: http://www.freemalaysiatoday.com/category/nation/2013/01/15/official-nuclear-power-plan-delayed/ (accessed on 24 December 2014).
- Oil Refineries in Malaysia. Available online: http://en.wikipedia.org/wiki/List_of_oil_refineries#Malaysia (accessed on 24 November 2014).
- EPCengineer. Refinery and Petrochemicals Integrated Development (Rapid) Project. Available online: http://www.epcengineer.com/projects/details/2342/refinery-and-petrochemicals-integrated-development-rapid-project (accessed on 24 November 2014).
- Petronas. Sabah-Sarawak Integrated Oil & Gas Project. Available online: http://www.petronas.com.my/our-business/gas-power/gas-processing-transmission/Pages/gas-processing-transmission/sabah-sarawak-integrated-oil-gas-project.aspx (accessed on 24 November 2014).
- New Sabah Times. SOGT to be Fully Operational in April. Available online: http://www.newsabahtimes.com.my/nstweb/fullstory/73798 (accessed on 24 November 2014).
- Johari, A.; Nyakuma, B.B.; Mohd Nor, S.H.; Mat, R.; Hashim, H.; Ahmad, A.; Yamani Zakaria, Z.; Tuan Abdullah, T.A. The challenges and prospects of palm oil based biodiesel in Malaysia. Energy 2015, 81, 255–261. [Google Scholar] [CrossRef]
- Yusoff, M.H.M.; Abdullah, A.Z.; Sultana, S.; Ahmad, M. Prospects and current status of B5 biodiesel implementation in Malaysia. Energy Policy 2013, 62, 456–462. [Google Scholar] [CrossRef]
- Mekhilef, S.; Siga, S.; Saidur, R. A review on palm oil biodiesel as a source of renewable fuel. Renew. Sustain. Energy Rev. 2011, 15, 1937–1949. [Google Scholar] [CrossRef]
- Abdul-Manan, A.F.N.; Baharuddin, A.; Chang, L.W. A detailed survey of the palm and biodiesel industry landscape in Malaysia. Energy 2014, 76, 931–941. [Google Scholar] [CrossRef]
- Attorney General's Chambers of Malaysia. Petroleum Development Act 1974. http://www.agc.gov.my/Akta/Vol.%203/Act%20144.pdf (accessed on 24 November 2014).
- Malaysia Government. National Petroleum Policy 1975. Available online: http://kettha.gov.my/portal/index.php?r=kandungan/index&menu1_id=2&menu2_id=26&menu3_id=111#.VNyczfmUf84 (accessed on 24 November 2014).
- National Energy Policy. Available online: http://kettha.gov.my/portal/index.php?r=kandungan/index&menu1_id=2&menu2_id=26&menu3_id=110#.VNydjPmUf84 (accessed on 24 November 2014).
- Academy of Sciences Malaysia. Sustainable Energy Options for Electric Power Generation in Peninsular Malaysia to 2030; Perpustakaan Negara Malaysia: Kuala Lumpur, Malaysia, 2013. [Google Scholar]
- Hashim, H.; Ho, W.S. Renewable energy policies and initiatives for a sustainable energy future in Malaysia. Renew. Sustain. Energy Rev. 2011, 15, 4780–4787. [Google Scholar] [CrossRef]
- Mekhilef, S.; Barimani, M.; Safari, A.; Salam, Z. Malaysia’s renewable energy policies and programs with green aspects. Renew. Sustain. Energy Rev. 2014, 40, 497–504. [Google Scholar] [CrossRef]
- Ministry of Energy, Green Technology and Water of Malaysia. National Renewable Energy Policy & Action Plan; Ministry of Energy, Green Technology and Water of Malaysia: Putrajaya, Malaysia, 2009.
- National Biofuel Policy. Available online: http://www.greentechmalaysia.my/Pages/pages.aspx?View=GreenBiofuel (accessed on 24 November 2014).
- Malaysia Government. National Green Technology Policy; Ministry of Energy, Green Technology and Water: Putrajaya, Malaysia, 2009.
- International Energy Agency. Climate Change. Available online: http://www.iea.org/topics/climatechange/ (accessed on 24 November 2014).
- Available online: http://cetdem.org.my/wordpress/?page_id=9 (accessed on 24 November 2014).
- BERNAMA. Malaysia announces conditional 40 percent cut in emissions. Available online: http://ww2.utusan.com.my/utusan/special.asp?pr=theMessenger&y=2009&dt=1218&pub=theMessenger&sec=Home_News&pg=hn_09.htm (accessed on 24 November 2014).
© 2015 by the authors; licensee MDPI, Basel, Switzerland. This article is an open access article distributed under the terms and conditions of the Creative Commons Attribution license (http://creativecommons.org/licenses/by/4.0/).
Share and Cite
Chong, C.; Ni, W.; Ma, L.; Liu, P.; Li, Z. The Use of Energy in Malaysia: Tracing Energy Flows from Primary Source to End Use. Energies 2015, 8, 2828-2866. https://doi.org/10.3390/en8042828
Chong C, Ni W, Ma L, Liu P, Li Z. The Use of Energy in Malaysia: Tracing Energy Flows from Primary Source to End Use. Energies. 2015; 8(4):2828-2866. https://doi.org/10.3390/en8042828
Chicago/Turabian StyleChong, Chinhao, Weidou Ni, Linwei Ma, Pei Liu, and Zheng Li. 2015. "The Use of Energy in Malaysia: Tracing Energy Flows from Primary Source to End Use" Energies 8, no. 4: 2828-2866. https://doi.org/10.3390/en8042828
APA StyleChong, C., Ni, W., Ma, L., Liu, P., & Li, Z. (2015). The Use of Energy in Malaysia: Tracing Energy Flows from Primary Source to End Use. Energies, 8(4), 2828-2866. https://doi.org/10.3390/en8042828