Article

A Combined Optical, Thermal and Electrical Performance Study of a V-Trough PV System—Experimental and Analytical Investigations

by
Haitham M. Bahaidarah
1,
Bilal Tanweer
2,
Palanichamy Gandhidasan
2 and
Shafiqur Rehman
3,*
1
Center of Research Excellence in Renewable Energy, RI, King Fahd University of Petroleum & Minerals, Dhahran-31261, Saudi Arabia
2
Mechanical Engineering Department, King Fahd University of Petroleum & Minerals, Dhahran-31261, Saudi Arabia
3
Center for Engineering Research, King Fahd University of Petroleum & Minerals, Dhahran-31261, Saudi Arabia
*
Author to whom correspondence should be addressed.
Energies 2015, 8(4), 2803-2827; https://doi.org/10.3390/en8042803
Submission received: 12 February 2015 / Revised: 19 March 2015 / Accepted: 20 March 2015 / Published: 14 April 2015

Abstract

:
The objective of this study was to achieve higher efficiency of a PV system while reducing of the cost of energy generation. Concentration photovoltaics was employed in the present case as it uses low cost reflectors to enhance the efficiency of the PV system and simultaneously reduces the cost of electricity generation. For this purpose a V-trough integrated with the PV system was employed for low concentration photovoltaic (LCPV). Since the electrical output of the concentrating PV system is significantly affected by the temperature of the PV cells, the motivation of the research also included studying the ability to actively cool PV cells to achieve the maximum benefit. The optical, thermal and electrical performance of the V-trough PV system was theoretically modeled and validated with experimental results. Optical modeling of V-trough was carried out to estimate the amount of enhanced absorbed radiation. Due to increase in the absorbed radiation the module temperature was also increased which was predicted by thermal model. Active cooling techniques were studied and the effect of cooling was analyzed on the performance of V-trough PV system. With absorbed radiation and module temperature as input parameters, electrical modeling was carried out and the maximum power was estimated. For the V-trough PV system, experiments were performed for validating the numerical models and very good agreement was found between the two.

Graphical Abstract

1. Introduction

Among the various renewable sources of energy solar technology has become more attractive for electricity generation, due to the gradual depletion of the fossil fuels. The usage of PV systems is currently not commercially acceptable due to its high cost. In recent years a lot of research has been carried out to reduce the cost of power generation using PV technology. Among these an efficient technique is the use of concentrated photovoltaic systems. However, even the present reduced cost is still reasonably high as compared to the cost of conventional power generation technologies. This issue of cost reduction can be resolved either by increasing the efficiency of the solar cells or using concentration photovoltaics. The material of the PV cell makes a major contribution to the total cost of a PV system. Therefore to reduce the cost of electricity generated by PV system the use of solar cells should be reduced, which can be feasible with the use of low cost reflectors/concentrators.
Among low concentration PV systems the most commonly used are compound parabolic (CPC) and the V-trough concentrators. These configurations often utilize single junction silicon cells and have simple designs. The concentrating reflectors used in such systems are easier and cheaper to manufacture than high concentrating systems as these do not normally require tracking. In addition to direct solar radiation components, LCPV systems have the capability to capture a large amount of diffuse solar radiation, making them suitable for stand-alone and building integration applications. By comparing V-trough and CPC collectors it was found that the reflector-to-aperture ratio of the V-trough is less than that of the CPC for the same concentration ratio [1]. The geometrical optimization of V-trough was carried out by using performance curves [2], which were generated from single reflector-receiver systems. Comparing symmetric and asymmetric troughs it was found that the symmetrical trough is best suited for uniform year round flux-augmentation.
PVT and CPV systems have been investigated and discussed by many researchers for the last decade as can be seen from the literature [3,4,5,6,7,8]. There are also many studies which employ linear Fresnel lenses for CPV systems [9,10,11]. Kribus et al. [12] analyzed a miniature concentrating PV (MCPV) system and tested with a reflector of 0.95 m2 aperture area, under normal beam insolation of 900 W/m2. Most of thermal energy was removed by the coolant flow, but some was lost to the environment through the front and back surfaces. A miniature concentrator PV/thermal system producing about 140–180 W of electricity and an additional 400–500 W of heat was developed. Kandilli [13] modeled, tested experimentally and evaluated thermodynamically and economically a concentrating photovoltaic combined system (CPVCS) based on the spectral decomposing approach. The results showed the energy efficiencies of concentrator, vacuum tube and overall CPVCS to be 15.35%; 49.86%; and 7.3% respectively. Similarly, the second law (exergy) efficiencies of concentrator, vacuum tube and overall CPVCS were found to be 12.06%; 2.0%; and 1.16%. The cost of energy production was estimated as 6.37 $/W and it was stated that this value could be decreased by improving the system performance. Kribus et al. [14] proposed simultaneous production of electrical and high grade thermal energy with a concentrating photovoltaic/thermal (CPVT) system operating at elevated temperature. CPVT collectors may operate at temperatures above 100 °C, and the thermal energy can drive processes such as refrigeration, desalination, and steam production. The results showed that under a wide range of economic conditions, the combined solar cooling and power generation plant can be comparable to and sometimes even significantly better than, the conventional alternative.
Angular losses were estimated theoretically at about 2.5% with an ideal 100% reflectance mirror, and they increased significantly with presence of dust to about 12% if the surface is moderately dirty and to around 24% if the dust quantity is very high [15]. Numerical simulations were conducted to find the parameters that can maximize the received global radiation of the PV cell and at the same time keeping an overall geometric size of the system as small as possible [16]. Results indicated that concentration ratio increases with the increase in incidence angle and the tracking step duration does not affect the reflected radiation. Regarding the V-trough reflectors, many studies are referred to one or two tracking axis using flat mirrors [17,18,19,20]. System performance can be enhanced by increasing the concentration ratio, but if it reaches beyond a critical value, cooling of the panel needs to be carried out. A V-trough concentrator with a two-axis tracking system was designed and fabricated by Shaltout et al. [19]. Experiments were carried out to evaluate the performance of amorphous Si and polycrystalline Si solar cells. Results showed that amorphous Si cell gave 40% more output than the cell without reflector and the reason was that for amorphous Si solar cells the effective wavelength is mainly in the visible band. On the other hand the polycrystalline Si cell did not enhance the power output as expected, because commercially available mirrors coated with aluminum have their lowest reflectivity around 900 nm, which is the center of the effective wavelength required for polycrystalline Si cells. A design procedure and experimental facility was built to assess the technical viability of a V-trough tracking PV system [20]. Simulations were performed and the results indicated 26% increase in electric energy due to tracking, and the electric energy output for V-trough system was increased up to 72%, compared with horizontal fixed collector.
The amount of absorbed radiation depends upon the type of reflectors being used in the V-trough PV system. The effect of the reflectance of aluminum sheet and aluminum foil on the V-trough PV system was studied by Kostic et al. [21]. Total daily thermal energy generated by an aluminum foil reflector produced 55% and an aluminum sheet reflector 39% higher energy as compared to a PV/thermal system without reflectors. Output characteristics of a V-trough PV system with a super cell array and polysilicon cell array were tested by Yan [22]. It was found that the polysilicon cell array and super cell produced 1.2 times and 81.5% more power compared to the one without concentration, respectively. Possible accelerated module degradation rates were analyzed to study the performance of standard PV modules under high concentration [23]. Results showed that standard silicon modules undergo 1.7% of power degradation when coupled with V-trough system with a concentration ratio of 1.9.
V-trough systems enhance the solar radiation and at the same time the temperature of the module also increases, which reduces the electrical efficiency and life of the panel. To counter this issue a study was presented which took advantage of enhanced insolation in V-trough reflectors and at the same time the temperature of the module was maintained at the limit where a standard PV module operates without concentration [24]. Paraffin wax was employed as the phase change material (PCM) having 56–58 °C melting range and was integrated at the rear side of the module to absorb the excess heat. In 2008, a V-trough PV system was designed to effectively dissipate the enhanced heat of the PV module for better performance [25]. In this design a single aluminum metal sheet frame that incorporated six rows of mono-crystalline Si cells mounted on six V-trough channels was used to achieve a better heat dissipation from the cells under concentration conditions. A building-integrated PVT (BIPVT) concentrator system was developed by incorporating a V-trough concentrator [26]. In that study, the optical, thermal and electrical performance of the collector was theoretically modeled but it needed improved heat transfer correlations to ensure a better validation to the experimental performance of the collector. Another area where V-troughs can be integrated with photovoltaic cells is V-trough PV pumping systems. A drip irrigation system was simulated and the maximum surface that can be irrigated by a V-trough PV pumping system was estimated by performing a water balance on monthly basis [27]. Results showed that maximum irrigated area increased up to 76% by the use of V-trough concentration cavity for a PV pumping system compared to a fixed system with the same PV array.
In the present study a V-trough PV system is selected amongst the different categories of LCPV. The reason for selecting these systems is that by integrating simple low cost reflectors with the PV cell, the efficiency could be increased and the cost per Watt be reduced. Many researchers have reported the optical and thermal modeling of the V-trough PV separately, but the comparison of overall performance of the V-trough PV system with a simple flat PV system by coupling optical, thermal and electrical models is rare. Therefore, in order to find the percentage increase in the output power and absorbed radiation for these systems, coupled modeling is presented in this paper. Energy balance equations are applied to calculate the module temperature with the increased illumination. Finally the absorbed radiation and cell temperature are given as input parameters from optical and thermal model into electrical model to find the power output of the V-trough PV system.

2. Modeling of V-Trough PV System

To analyze the performance of V-trough PV system, a sequential modeling is required, which involves the integration of radiation, thermal and electrical models. The radiation model used to estimate the amount of available radiation is Isotropic Model. The schematic of the V-trough PV system is shown in Figure 1.
Figure 1. Schematic diagram of the V-trough PV system.
Energies 08 02803 g001

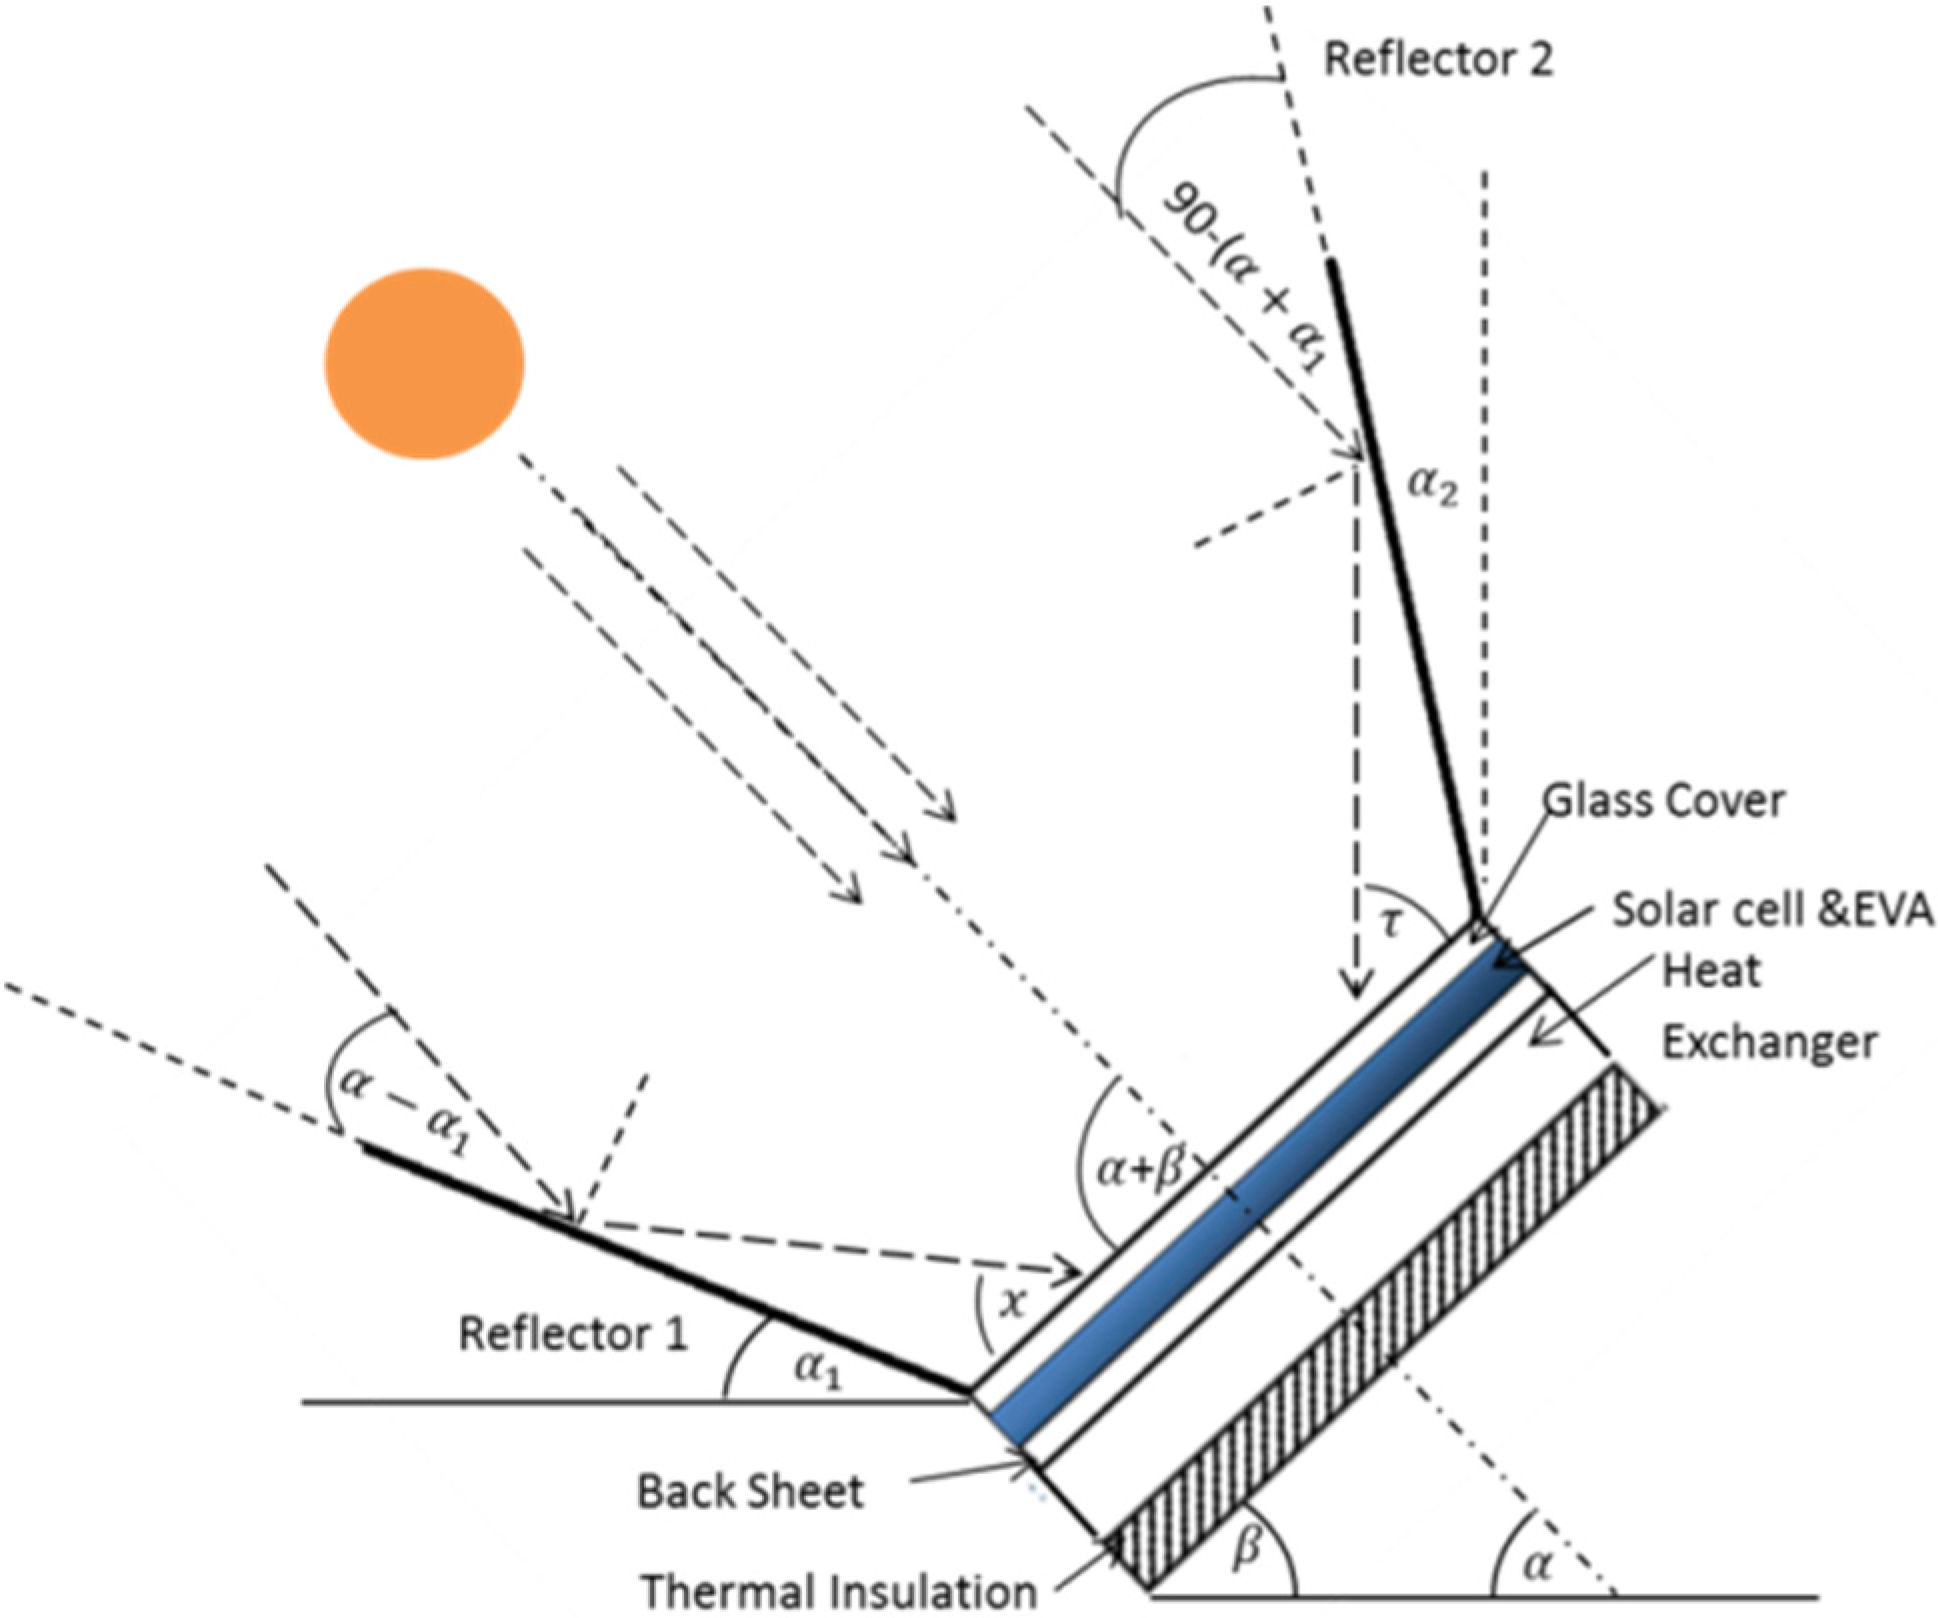
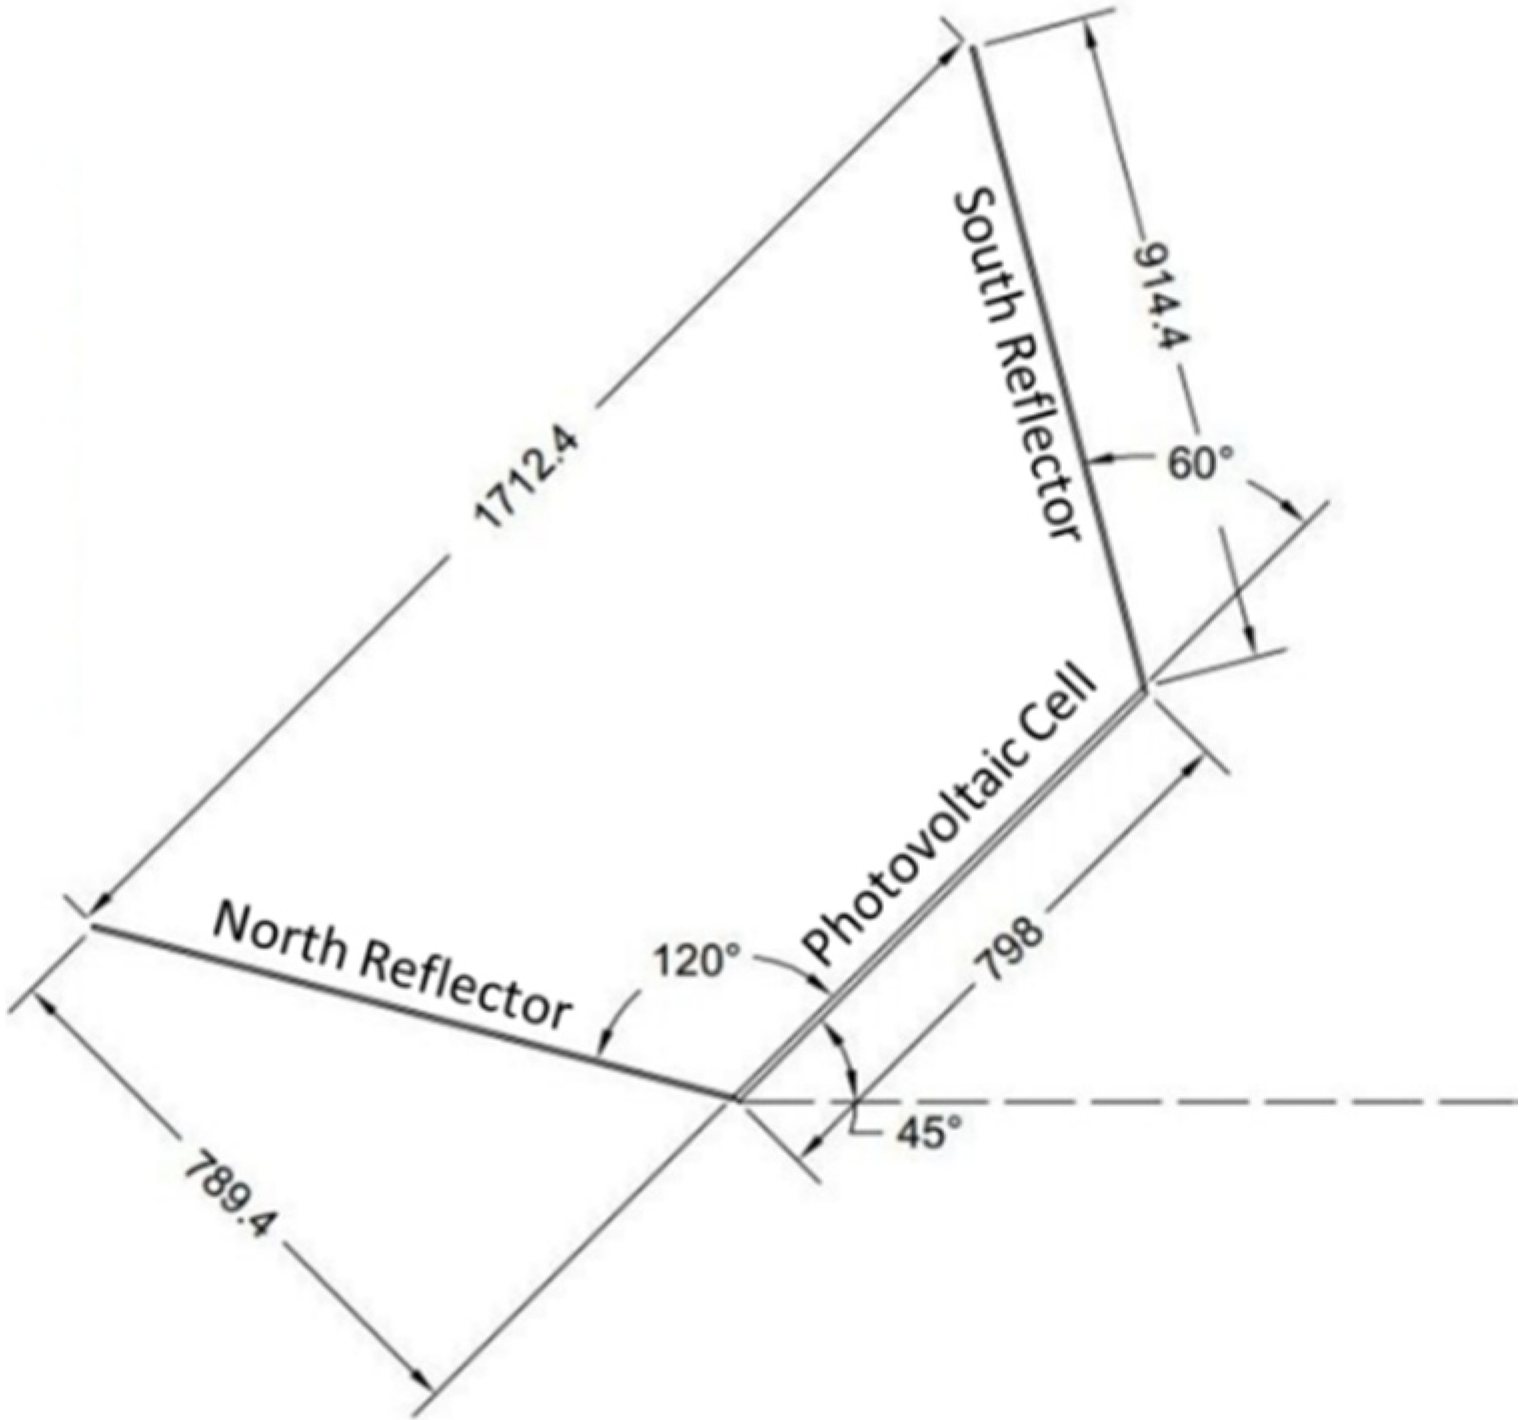
2.1. Optical Modeling of V-Trough PV System

The total solar radiation absorbed by the V-trough PV system is equal to the sum of direct radiation Sb on the PV surface, the sky-diffuse radiation Sd, the ground reflected radiation Sg, the radiation reflected from the bottom reflector to the PV panel with tilted plane angle α1 and the reflected radiation from upper reflector to the surface of PV panel with tilted plane angle α2 [28]:
S t o t = S b + S d + S g + S r e f   r 1 + S r e f   r 2
where the components are given by [28,29]:
S b = ( I T   S i n ( α + β ) ) ( τ α ) b
S d = I d ( 1 + C o s β 2 ) . ( τ α ) d
S d = ρ g I 0 ( 1 C o s β 2 ) . ( τ α ) g
S r e f   r 1 =   ρ A 1 . I T . S i n ( x ) . S i n ( α α 1 ) . ( τ α ) b ; x = β + 2 α 1 α
S r e f   r 2 =   ρ A 1 . I T . S i n ( τ ) . S i n ( α + α 2 ) . ( τ α ) b ; τ = α + 2 α 2 β
In the above Equations, α is the solar altitude angle which is given by:
S i n α = C o s . C o s ω + S i n φ . S i n δ
The optical model presented by the Equations (1) to (7) has been used to calculate the amount of absorbed energy in the V-trough PV system. The transmittance-absorptance product for different components is calculated by the procedure as discussed in [29].

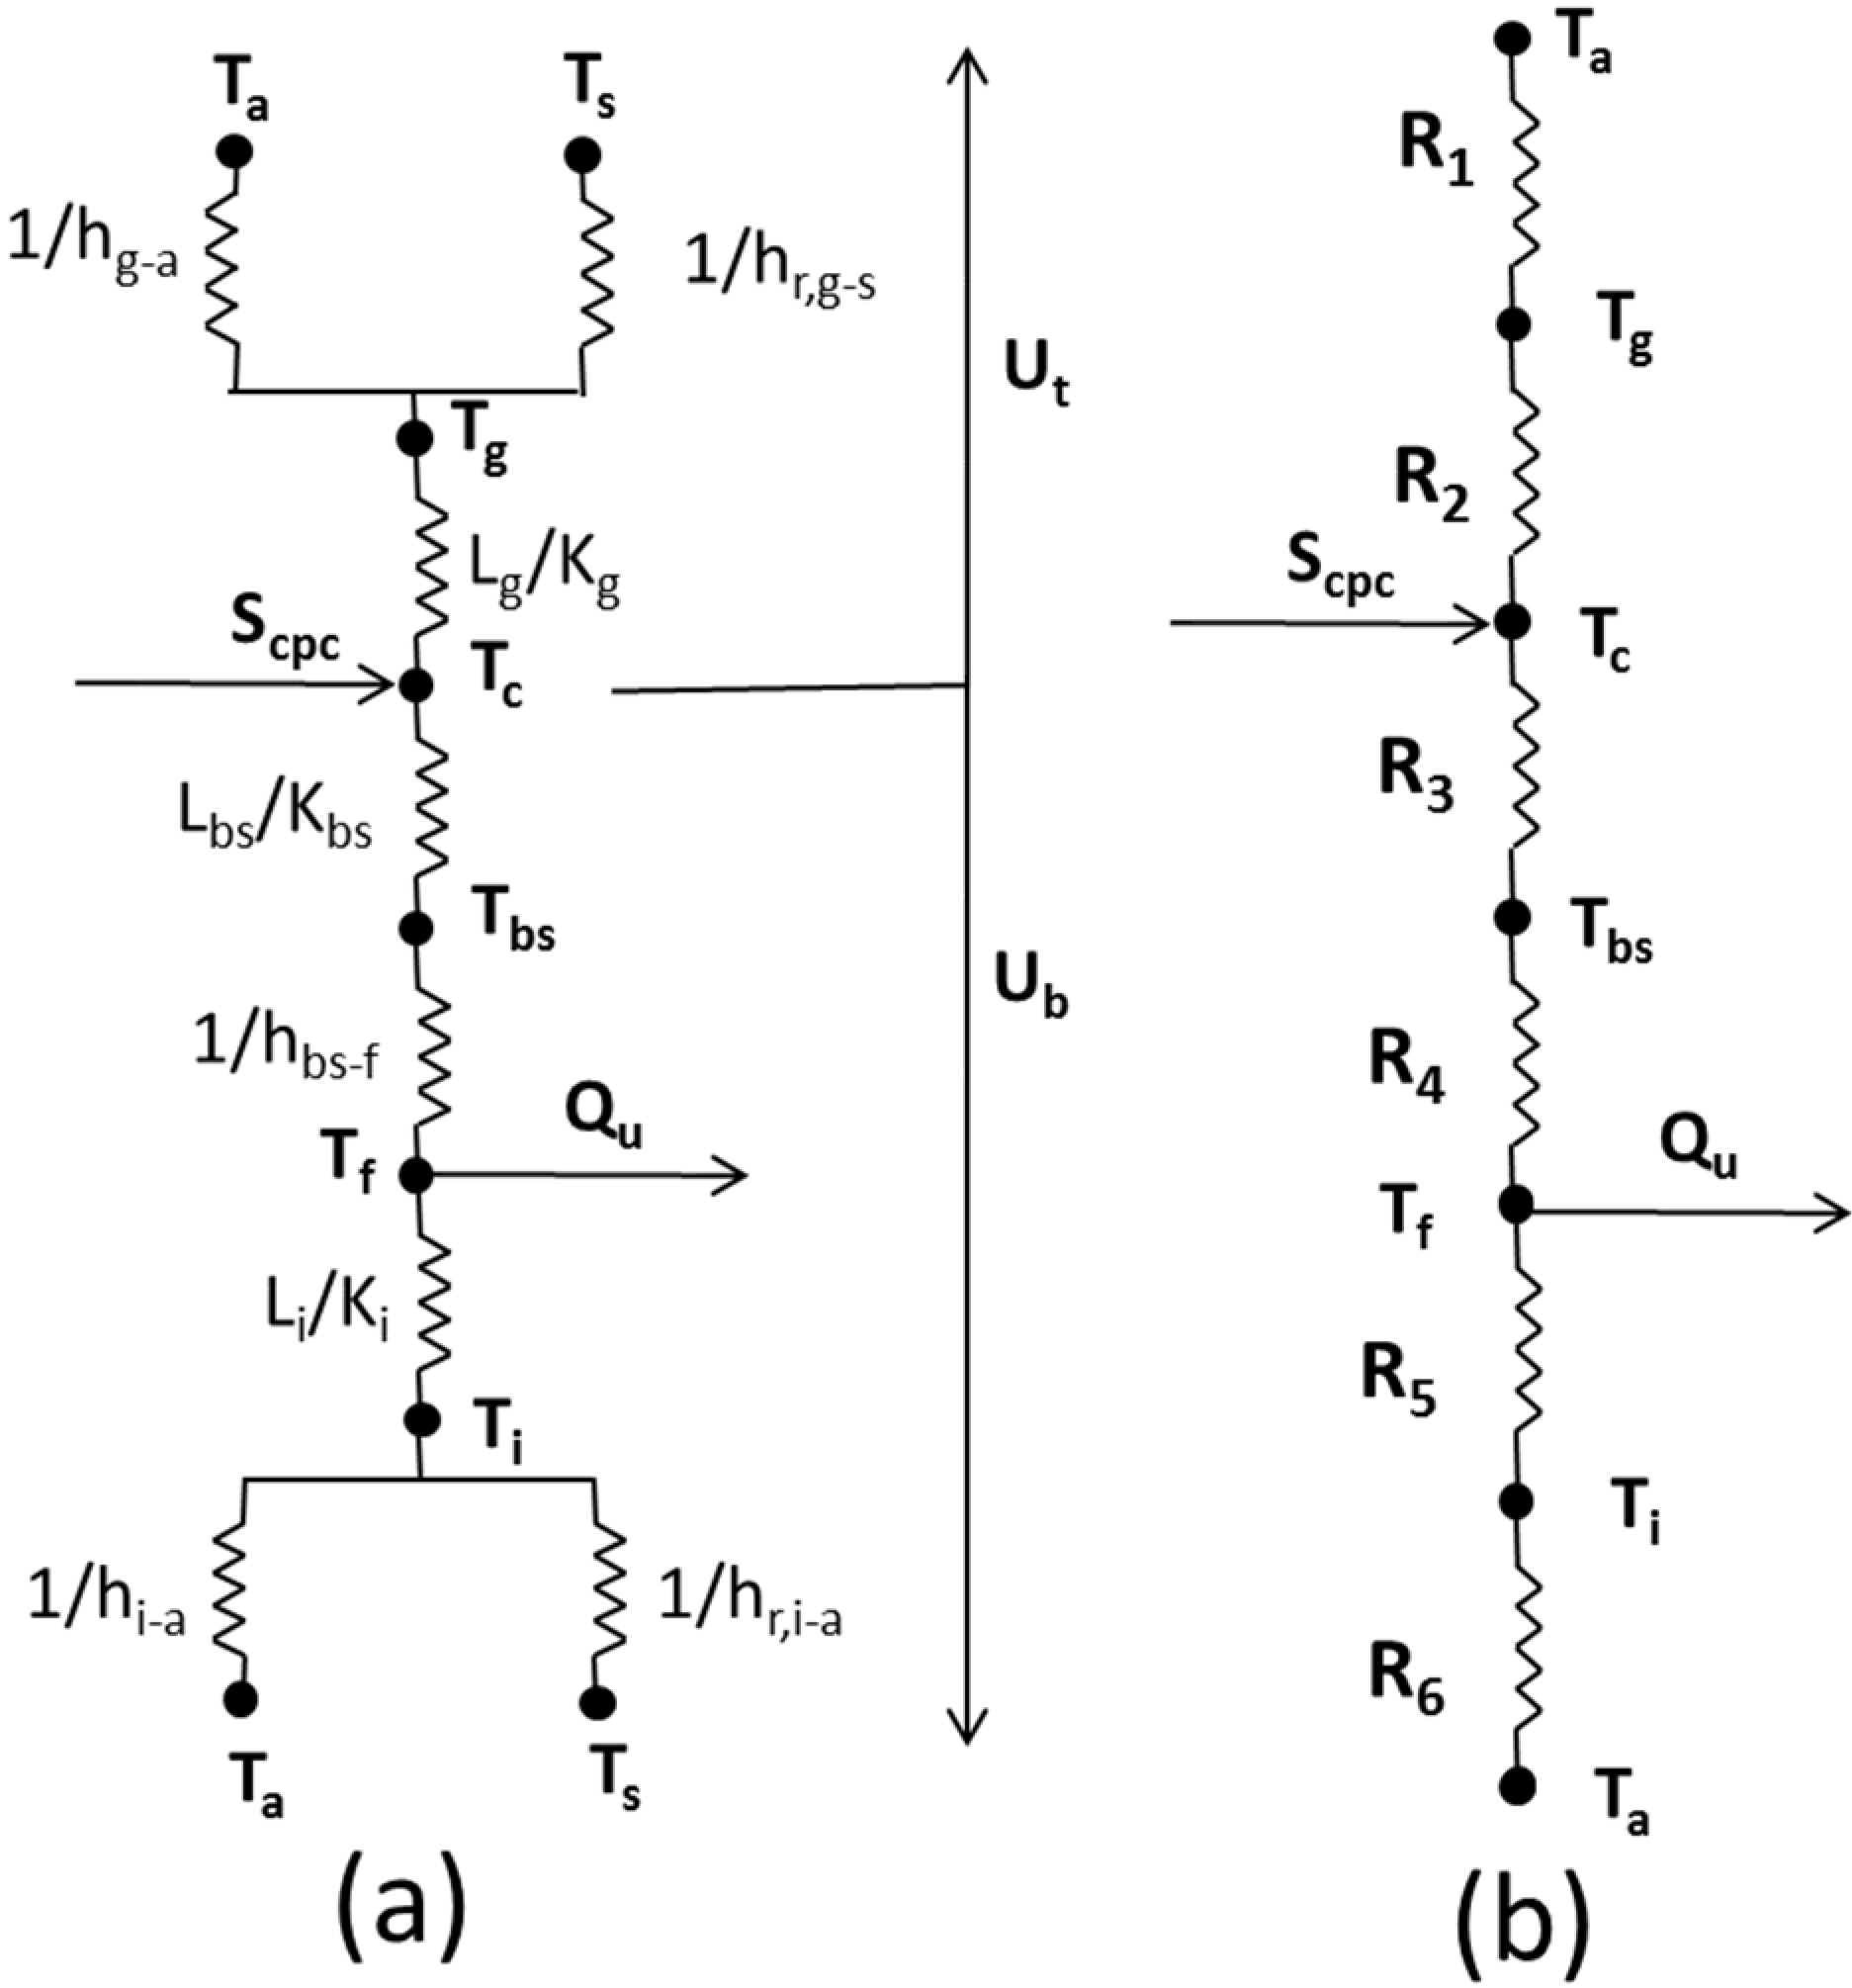
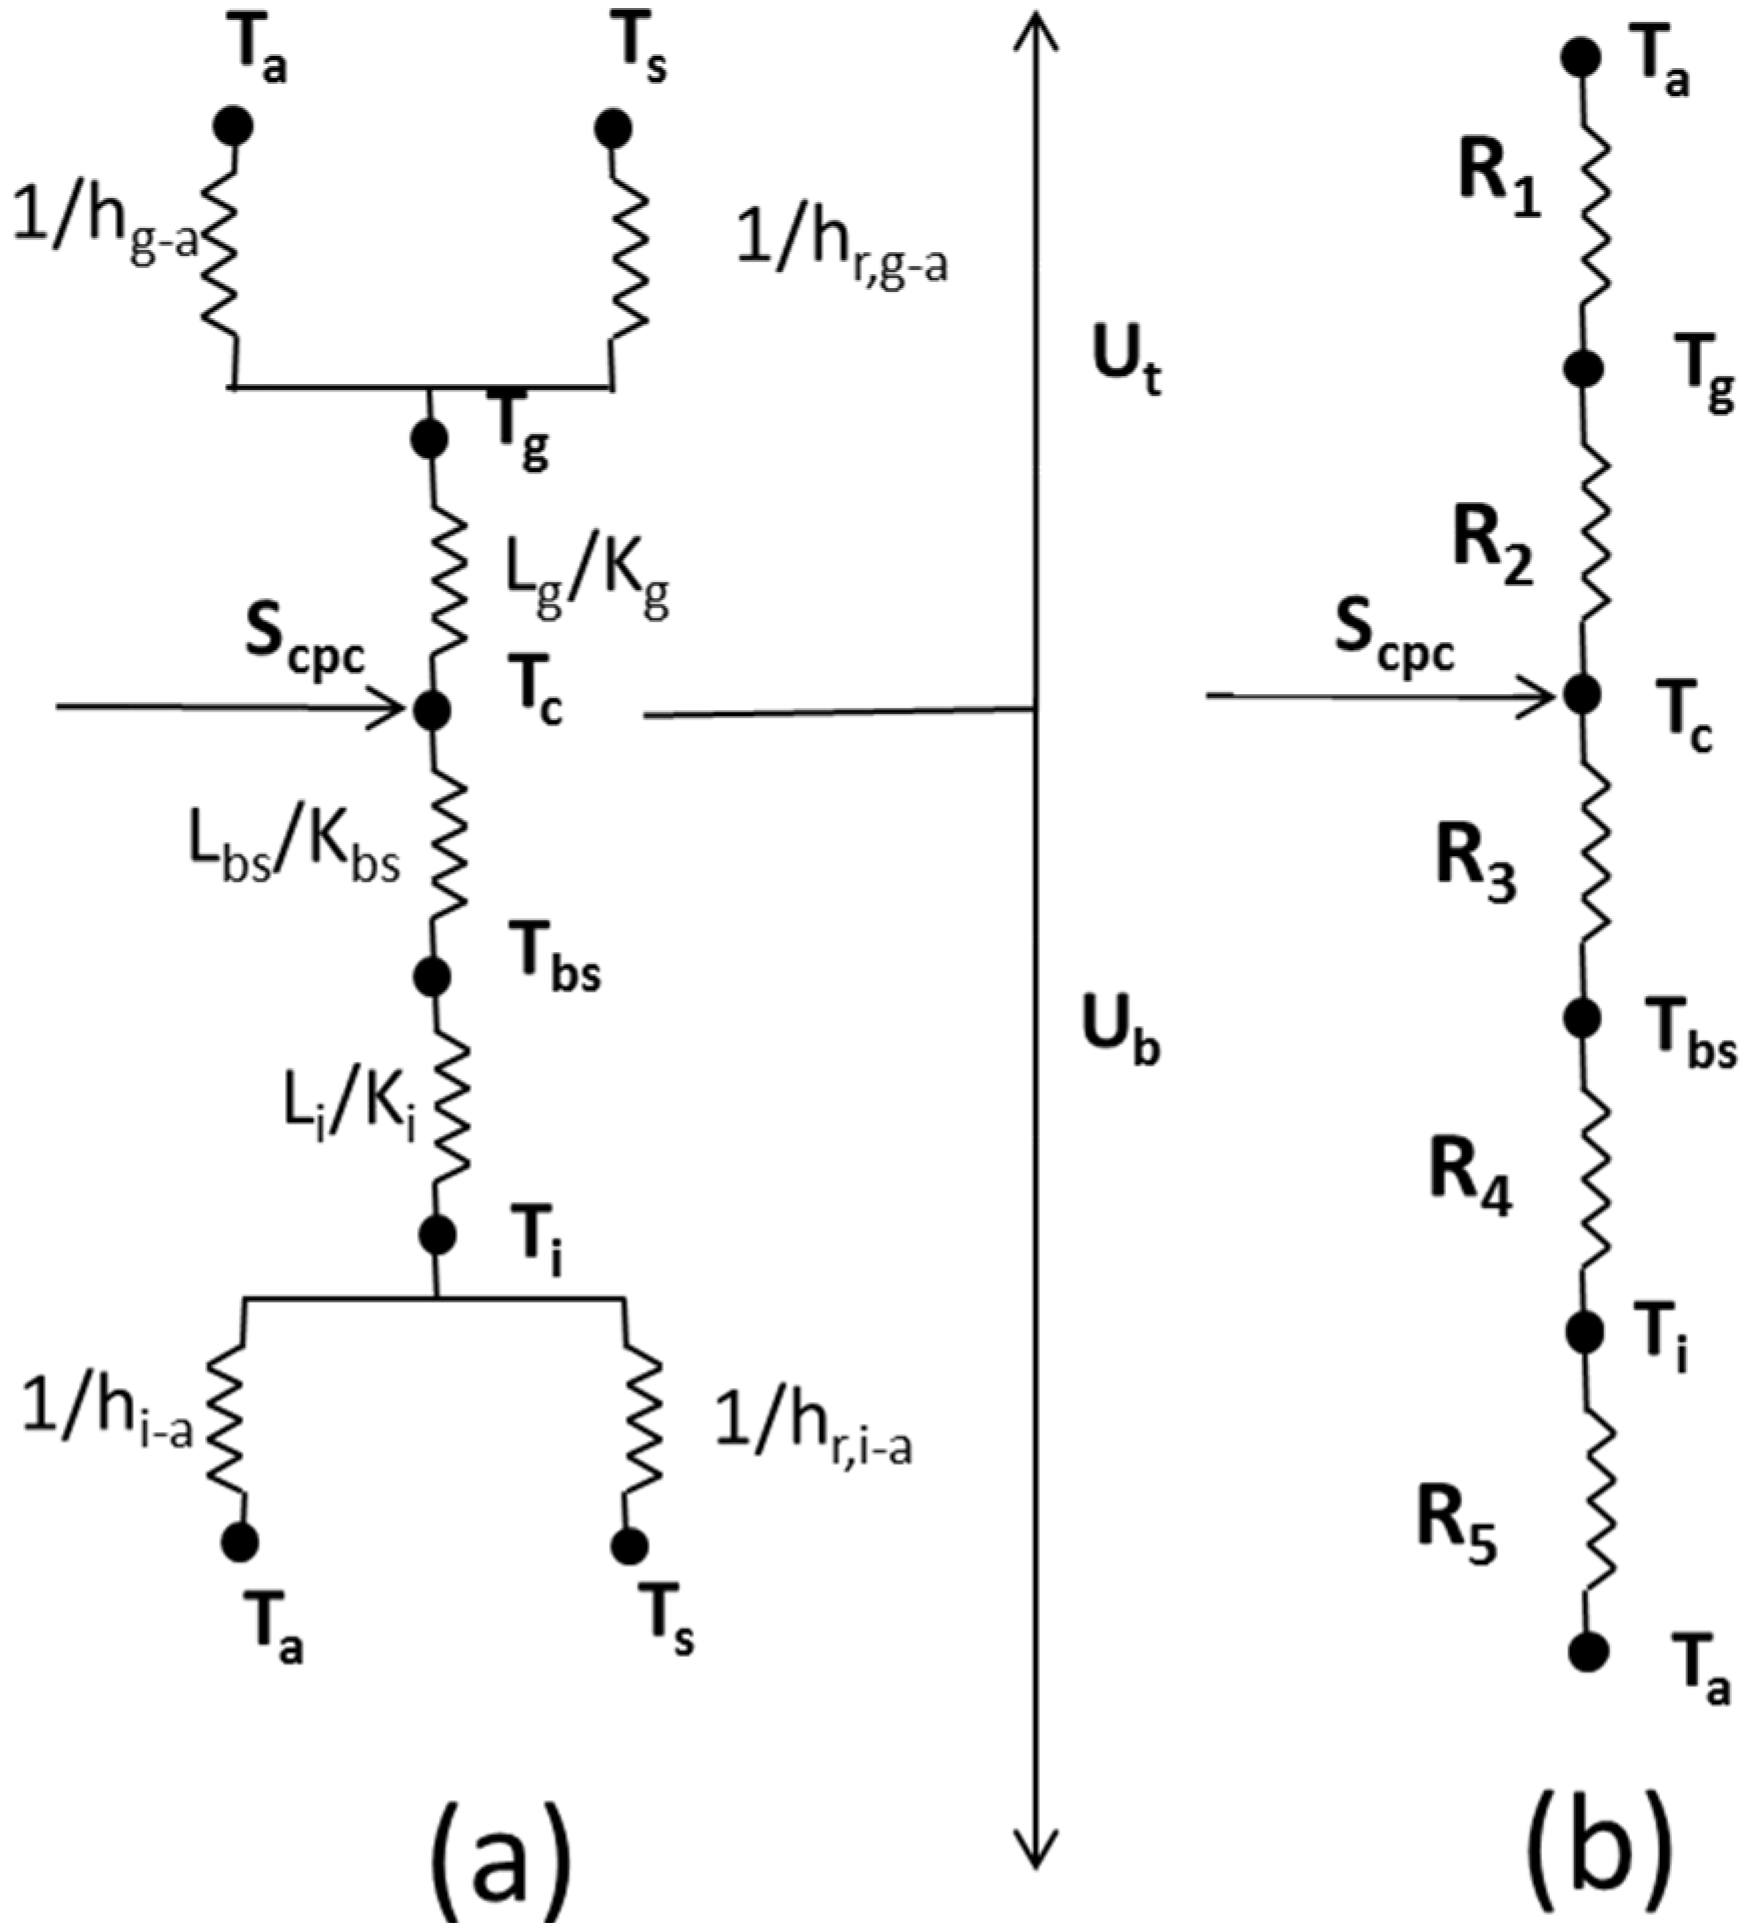
2.2. Thermal Modeling

Absorbed radiation estimated from the optical model of the V-trough PV system was used to evaluate the thermal model for the temperature distribution in different components. Following assumptions were made for thermal modeling:
  • One-dimensional energy transfer and steady state of energy transfer is achieved.
  • Convection and radiation losses from the front cover and insulation to the ambient were the same.
  • The temperature gradient of the glass cover and solar cell was neglected.
  • Temperature variation along the thickness and width of the solar cell was considered negligible.
  • There was no dust and dirt effect on the collector.
  • The water flow in the rectangular channel was uniform and fully developed.
  • Contact resistance between the reflectors and the solar cell was neglected.
Based on the above assumptions the energy balance equations on the different components of the V-trough PV system can be written as follows [29]:
(1)
PV cell:
S = U t ( T c T a ) + h T ( T c T b s )
(2)
Cell glass cover:
U c g ( T c T g ) = U g a ( T g T a )
(3)
Back Sheet:
U c b s ( T c T b s ) = U b s f ( T b s T ¯ f )
(4)
Fluid flowing in the heat exchanger:
U b s f ( T b s T ¯ f ) = m ˙   C p d T f d x d x   ( T f T a )
The thermal networks for the V-trough PV system with and without cooling are shown in Figure 2 and Figure 3, respectively. Conductive, convective and radiative resistances between different components were calculated to estimate the temperature variation in different components of the V-trough PV system.
Figure 2. Thermal network for V-trough PV system with cooling (a) in terms of conduction, convection and radiation resistances; (b) in terms of resistances between plates.
Energies 08 02803 g002

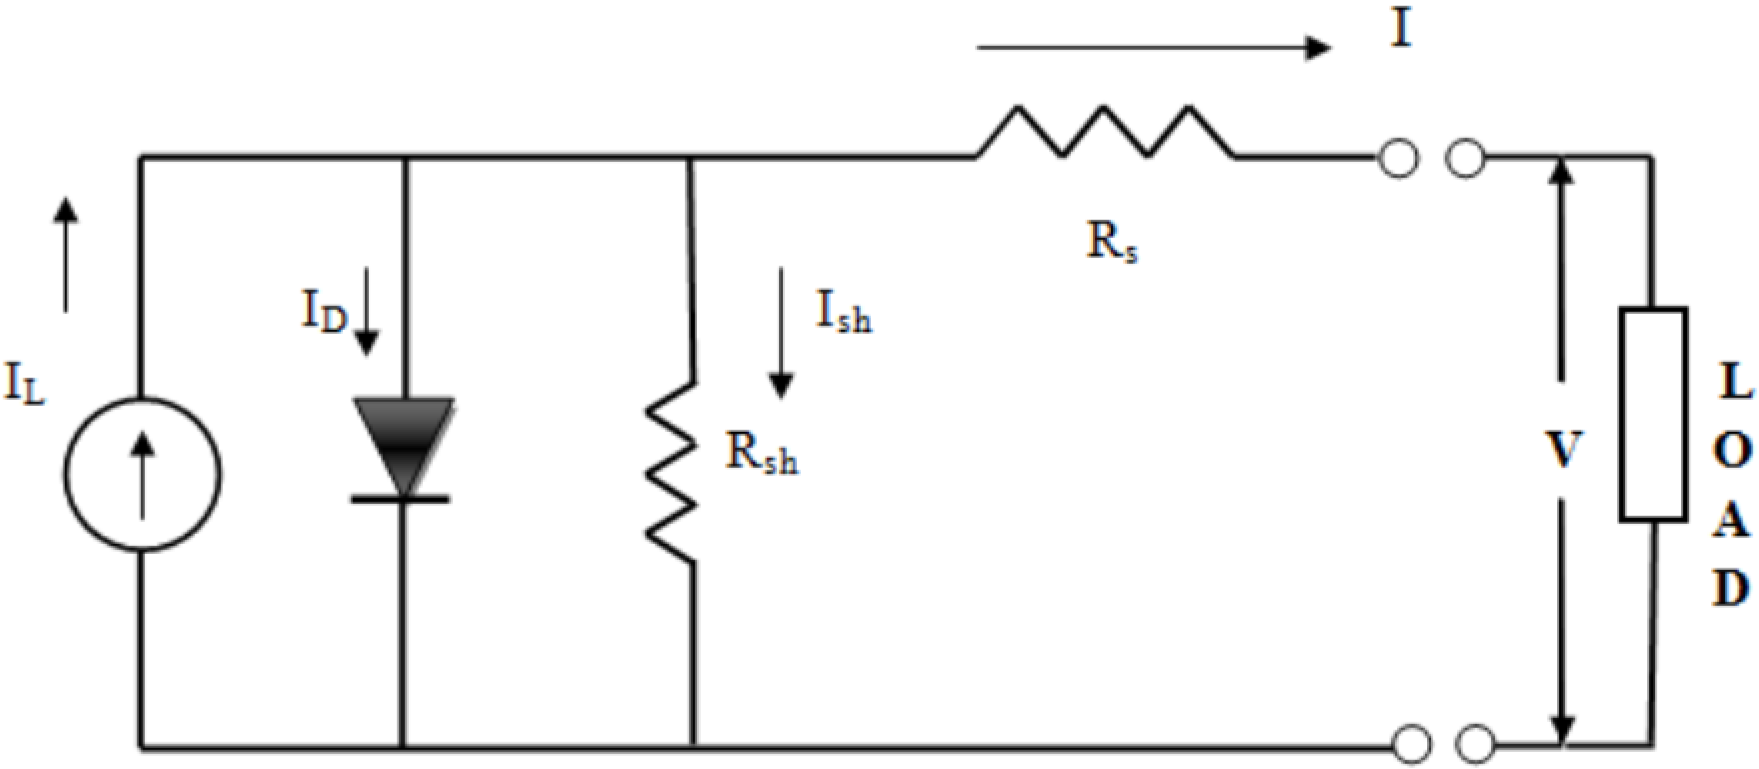
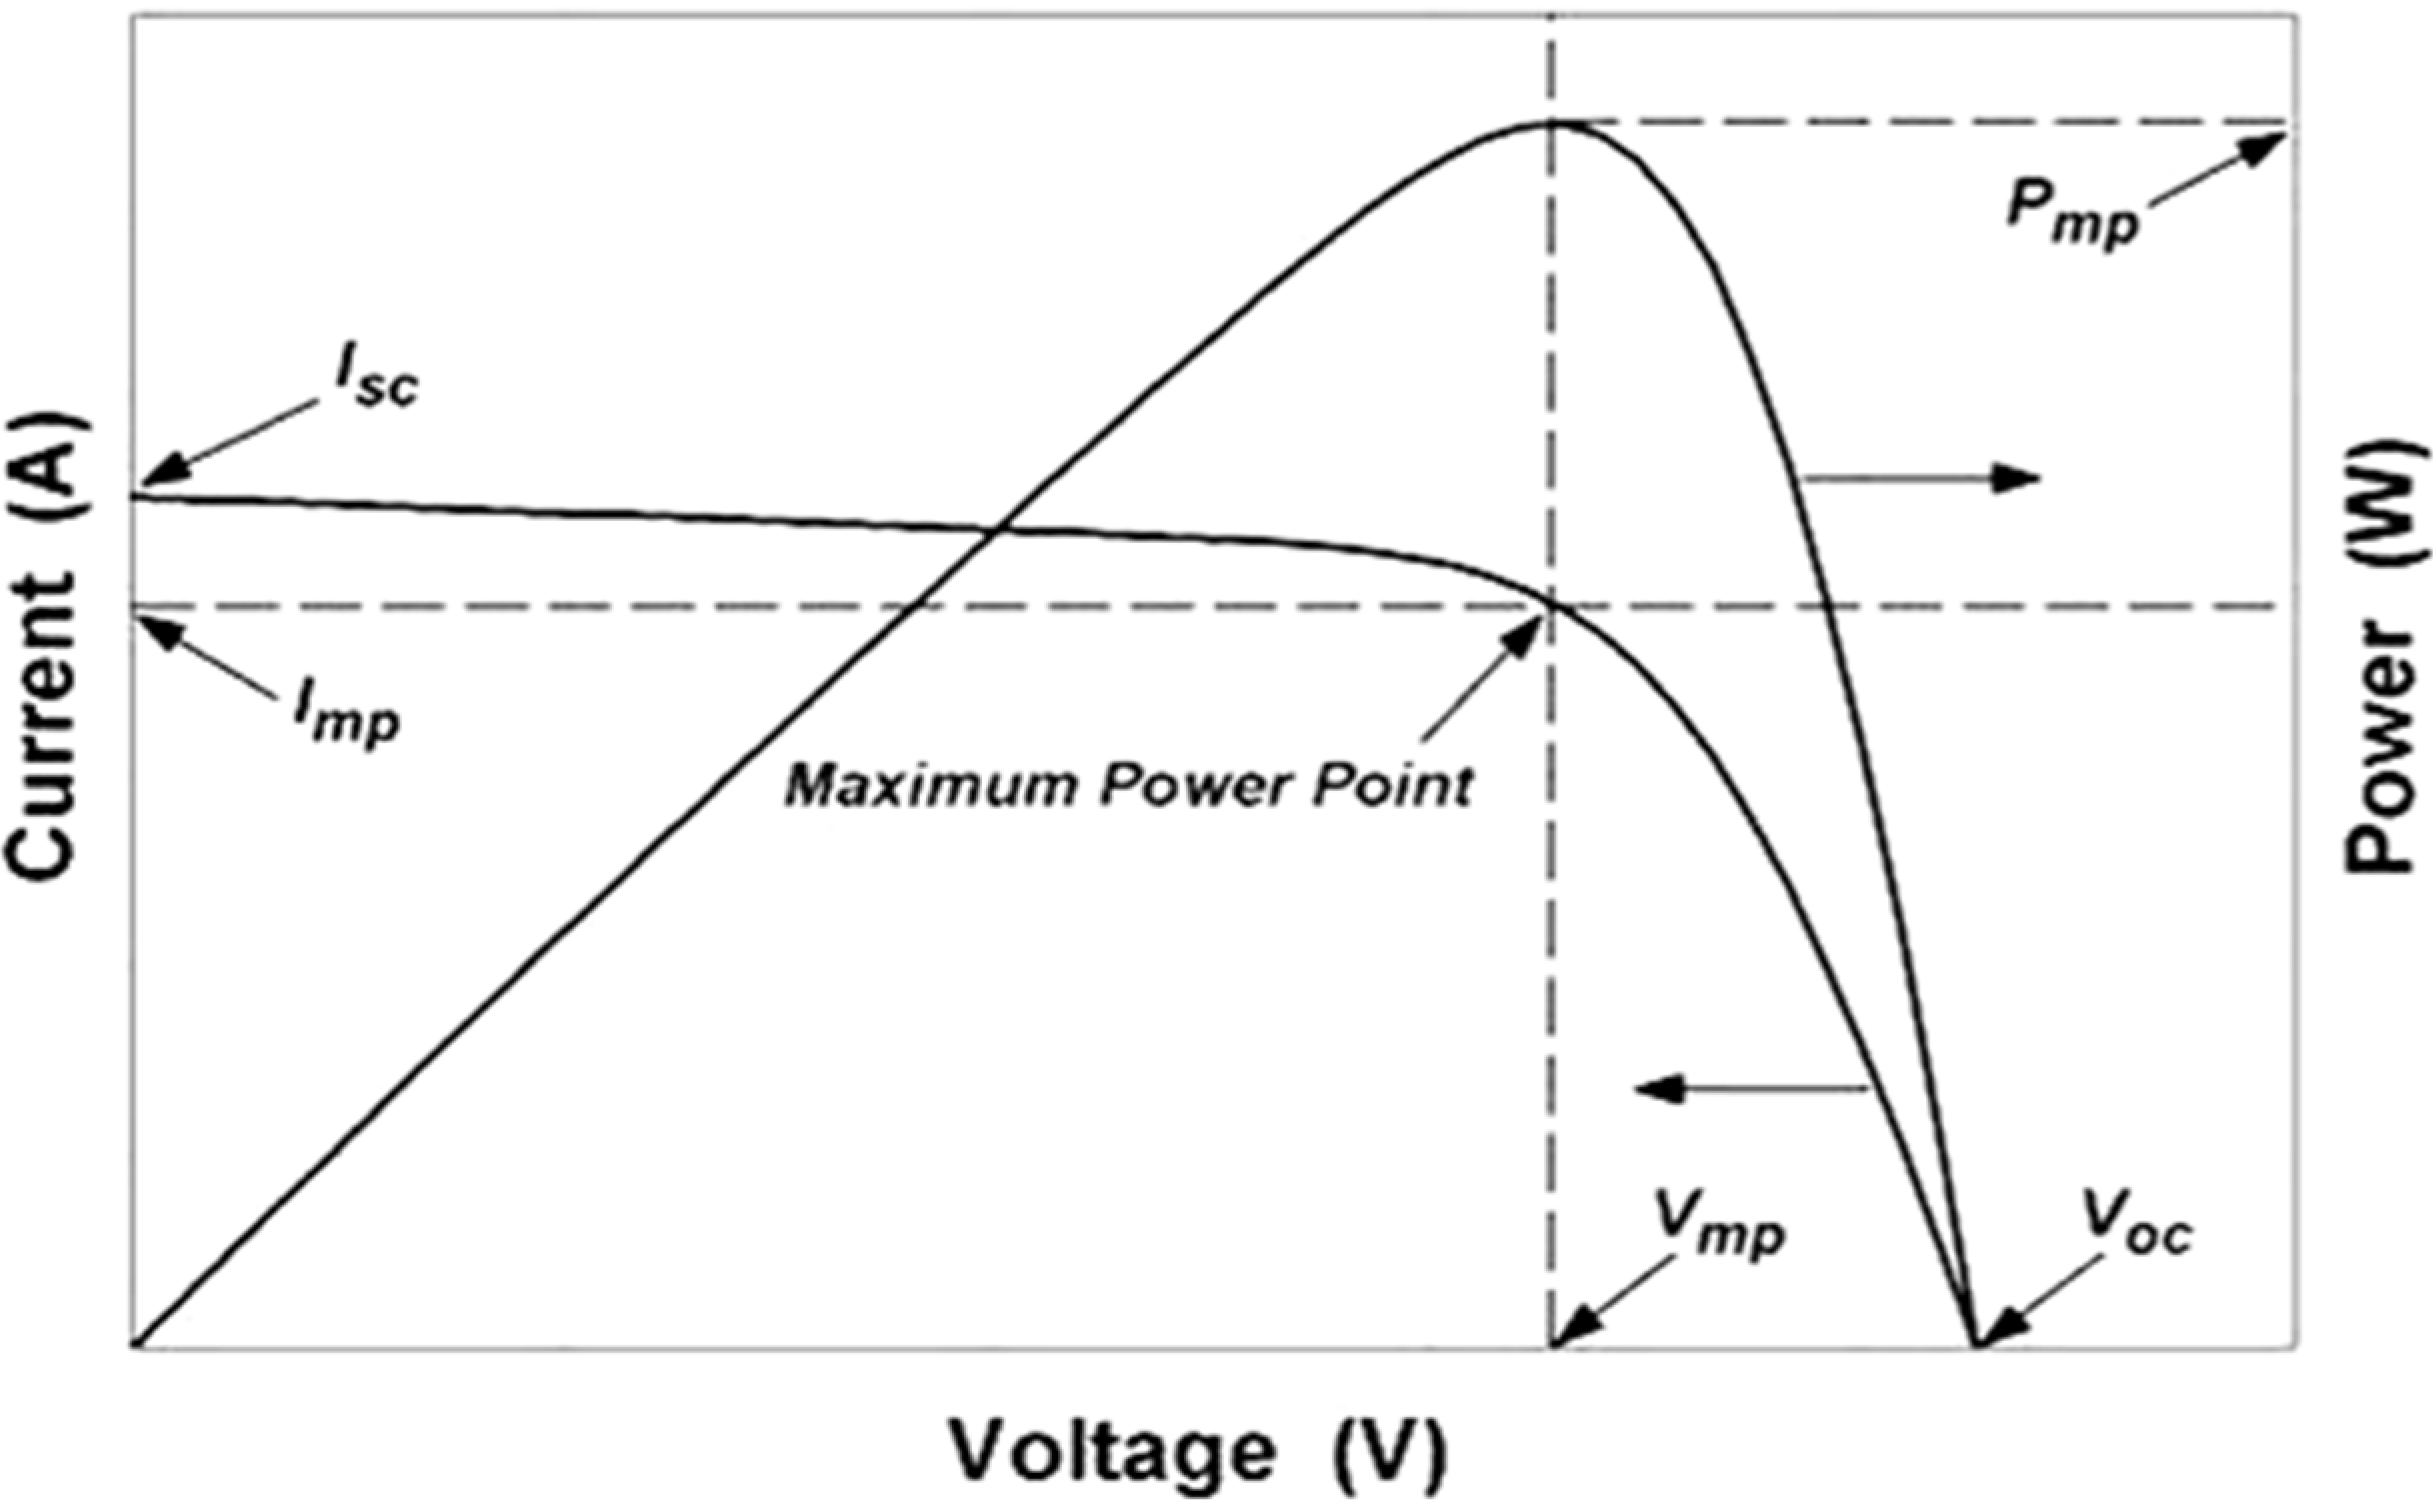
2.3. Electrical Modeling

The main objective of modeling the PV device is that the model should be able to regenerate the output characteristics of the PV panel under different ambient conditions with high precision. Several PV electrical models have been proposed and developed by researchers including the models that are based on the simple idealized model and the models that replicate the actual physics of the PV cell [30]. Some of these models are described vaguely and some of them are much too complex for the simple power system studies like load flow, maximum power point tracking, load frequency match, etc. These models also have the software implementation issue. Electrical characteristics of the PV panel can be modeled by representing it with an equivalent electrical circuit. This model has the advantage over other models due to its electric circuit nature and behavior of the PV array can be easily understood in the circuit. Design engineers require an efficient PV panel model for the simulation study of the power electronics before any experimental verification. This model is best suited for the dynamic and transient study of the power electronics converters.
Figure 3. Thermal network for V-trough PV system without cooling (a) in terms of conduction, convection and radiation resistances; (b) in terms of resistances between plates.
Energies 08 02803 g003
The well-known five parameters electric circuit model of PV device was used and is shown in Figure 4. It consists of light dependent current source, a p-n junction diode and two resistances, one in series and another in parallel. The current source (IL) represents charge carrier generation in the semiconductor caused by incident radiation. The shunt diode represents recombination of these charge carriers at a high forward-bias voltage (V + IRs). The shunt resistor (Rsh) signifies high-current paths through the semiconductor along mechanical defects and material dislocations.
Figure 4. Equivalent circuit for an individual PV cell.
Energies 08 02803 g004
At a fixed temperature and solar radiation, the I-V characteristics of this model are given by the following equation [30]:
I = I L I 0 [ e x p ( V + I R s a ) 1 ] V + I R s R s h
where, I and V represent the current and voltage, respectively, at the load condition. The circuit requires that five parameters be known, namely the light generated current (IL), diode reverse saturation current (Io), series resistance (Rs), shunt resistance (Rsh) and ideality factor (a). The five parameters in the model were obtained using the I-V characteristics of a module under reference conditions supplied by the manufacturer and other known PV characteristics. Measurements of PV electrical characteristics were made for standard reference conditions: incident radiation intensity of 1,000 W/m2, a cell temperature of 25 °C, and a spectral distribution corresponding to an air mass of 1.5. There are five parameters to be estimated and hence five conditions are required to calculate these simultaneously. These conditions are given in Table 1. The methodology adopted here is to know three I-V points on the I-V curve (i.e., short circuit current, open circuit voltage and maximum power point) as shown in Figure 5.
Table 1. Conditions used to estimate five parameters.
At short circuit [ d I / d V ] s c = 1 / R s h , r e f
At open circuit voltageI = 0, V = Voc,ref
At short circuit currentI = Isc,ref , V = 0
At the maximum power pointI = Imp,ref , V = Vmp,ref
At the maximum power point [ d V I / d V ] m p = 0
Figure 5. I-V and P-V curves for a PV module.
Energies 08 02803 g005
By applying all the above described five conditions into Equation (12), the following equations are obtained [30]:
I s c , r e f = I L , r e f I 0 , r e f [ e x p ( I s c , r e f R s , r e f a r e f ) 1 ] I s c , r e f R s , r e f R s h , r e f
I L , r e f = I 0 , r e f [ e x p ( V o c , r e f a r e f ) 1 ] + V o c , r e f R s h , r e f
I m p , r e f = I L , r e f I 0 , r e f [ e x p ( V m p , r e f + I m p , r e f R s , r e f a r e f ) 1 ] [ V m p , r e f + I m p , r e f R s , r e f R s h , r e f ]
[ d I d V ] s c 1 R s h , r e f
I m p , r e f V m p , r e f = ( I o , r e f a r e f ) e x p ( V m p , r e f + I m p , r e f R s , r e f a r e f ) + 1 R s h , r e f 1 + ( I o , r e f R s , r e f a r e f ) e x p ( V m p , r e f + I m p , r e f R s , r e f a r e f ) + ( R s , r e f R s h , r e f )
Solving these simultaneous Equations (13) to (17) gives the value of five parameters (aref, IL,ref, Io,ref, Rs,ref and Rsh,ref), at the reference conditions. The ideality factor which is assumed to be independent of the cell temperature is related to reference condition by:
a a r e f = T c T c , r e f
The effect of each of the five parameters on the behavior of the I-V curve for monocrystalline solar panel around the STC condition is similar for all panels under all operating conditions.
The bold I-V curve in each of the above plots is the result of using parameters calculated using STC data while the other two are the result of adjusting one specified parameter above and below the original value. The above figures show that both a and Io adjust the predicted voltage at all points on the I-V curve and IL adjusts the predicted current. Rs and Rsh have a more localized influence around the maximum power point; Rs adjusts the maximum power voltage and Rsh adjusts the maximum power current.
The light current for any operating conditions is related to its reference conditions by:
I L = S S r e f [ I L , r e f + μ I s c ( T c T c , r e f ) ]
where S S r e f is the ratio of absorbed radiation to the absorbed radiation at reference condition. It is given by:
S S r e f = M ( G b G r e f R b K τ α , b + G d G r e f K τ α , d ( 1 + C o s β 2 ) + G G r e f ρ g K τ α , g ( 1 C o s β 2 ) )
The diode reverse saturation current is related to reference conditions by:
I o = I o , r e f ( T c T c , r e f ) 3 e x p ( ε k T c , r e f ε k T c )
The following relationship is used to relate the shunt resistance (Rsh), (which is assumed to be finite and independent of temperature but varies with the absorbed radiation) at reference conditions to that at operating conditions:
R s h R s h , r e f = S r e f S
These equations are a set of nonlinear equations that cannot be solved unless good initial guesses and variable limits are used. The following guess values [29] were used for determining the parameters:
a r e f , g u e s s = 1.5 K T c , r e f N / q
I o , r e f , g u e s s = I s c , r e f e x p ( V o c , r e f / a r e f , g u e s s )
I L , r e f , g u e s s = I s c , r e f
The series resistance was assumed to be independent of both temperature and solar radiation so that:
R s = R s , r e f
Once the values of reference parameters are obtained, the characteristics curve can be found at any operating conditions. In order to estimate the maximum power point (MPP) from the model, the following equations are used:
I m p V m p = [ I o a e x p ( V m p + I m p R s a ) + 1 R s h 1 + R s R s h + I o R s a e x p ( V m p + I m p R s a ) ]
The general I-V equation at the MPP must also be satisfied:
I m p = I L I o [ e x p ( V m p + I m p R s a ) 1 ] [ V m p + I m p R s R s h ]
The simultaneous solution of the Equations (27) and (28) yields the MPP current and voltage. The maximum power output can be obtained as:
P m p = I m p V m p
In estimating the PV module performance, the temperature dependance of the maximum power point efficiency ( η m p ) is an important parameter and is given by:
η m p = I m p V m p G T A m

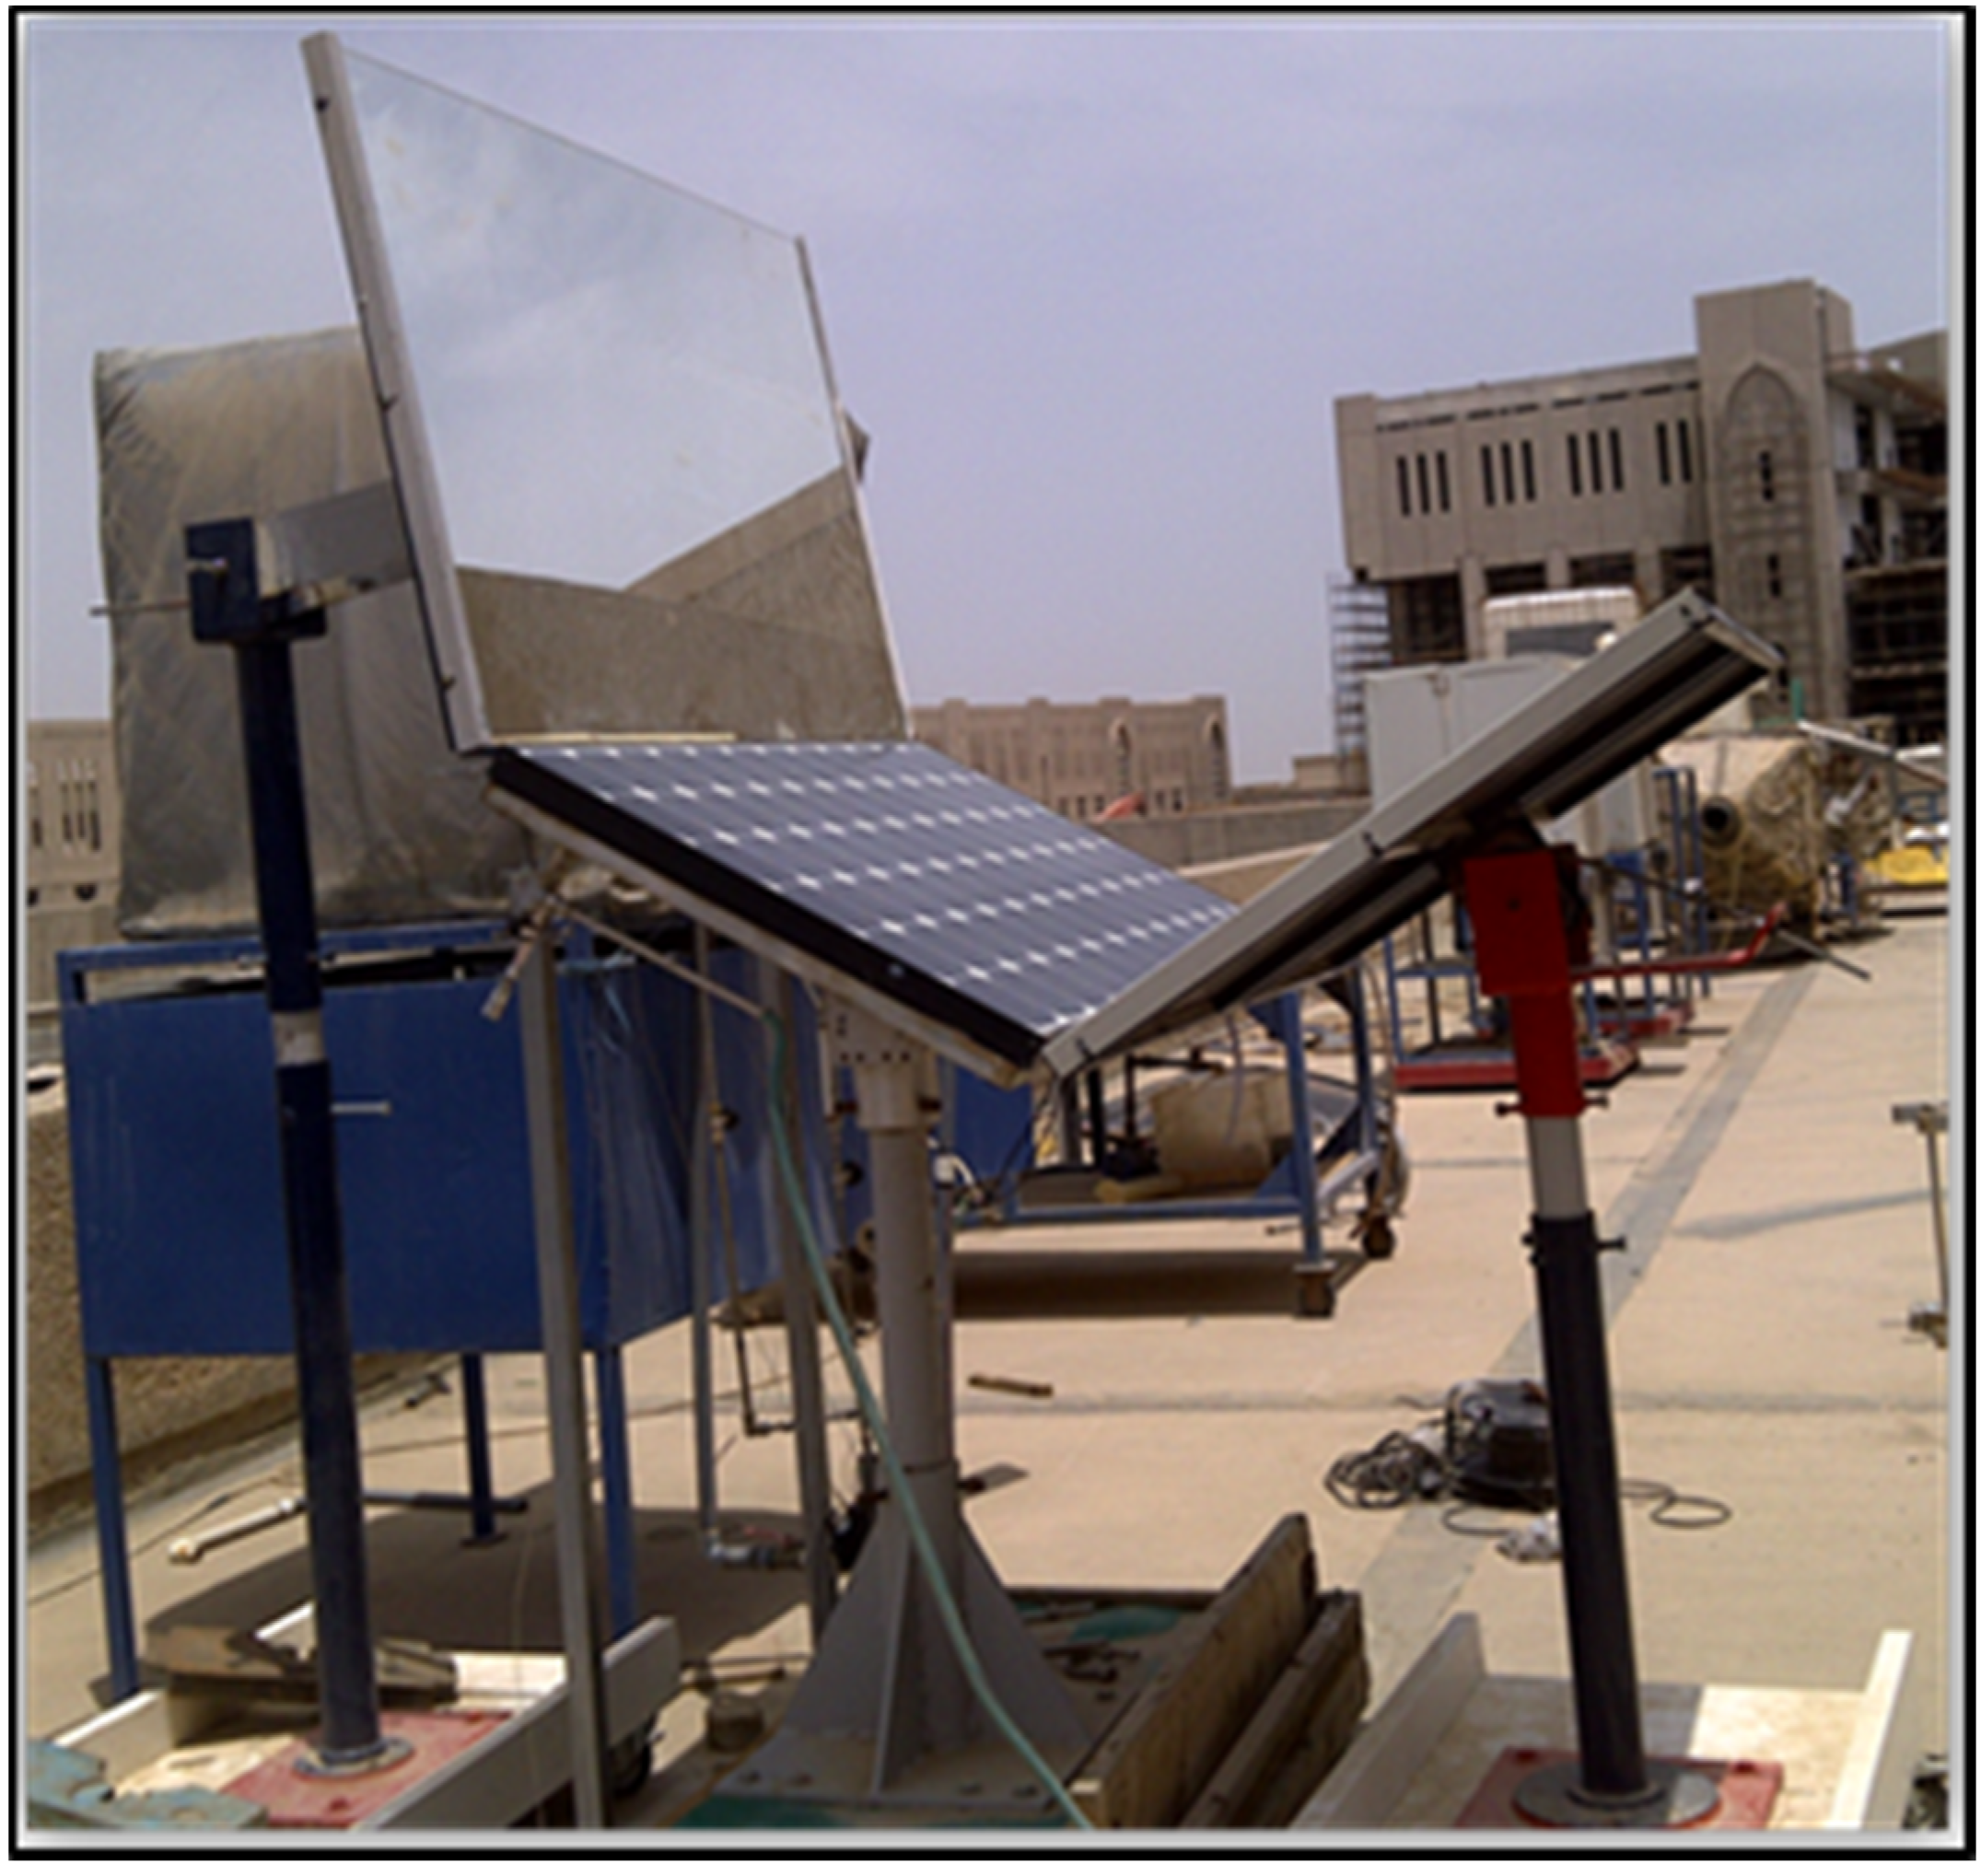
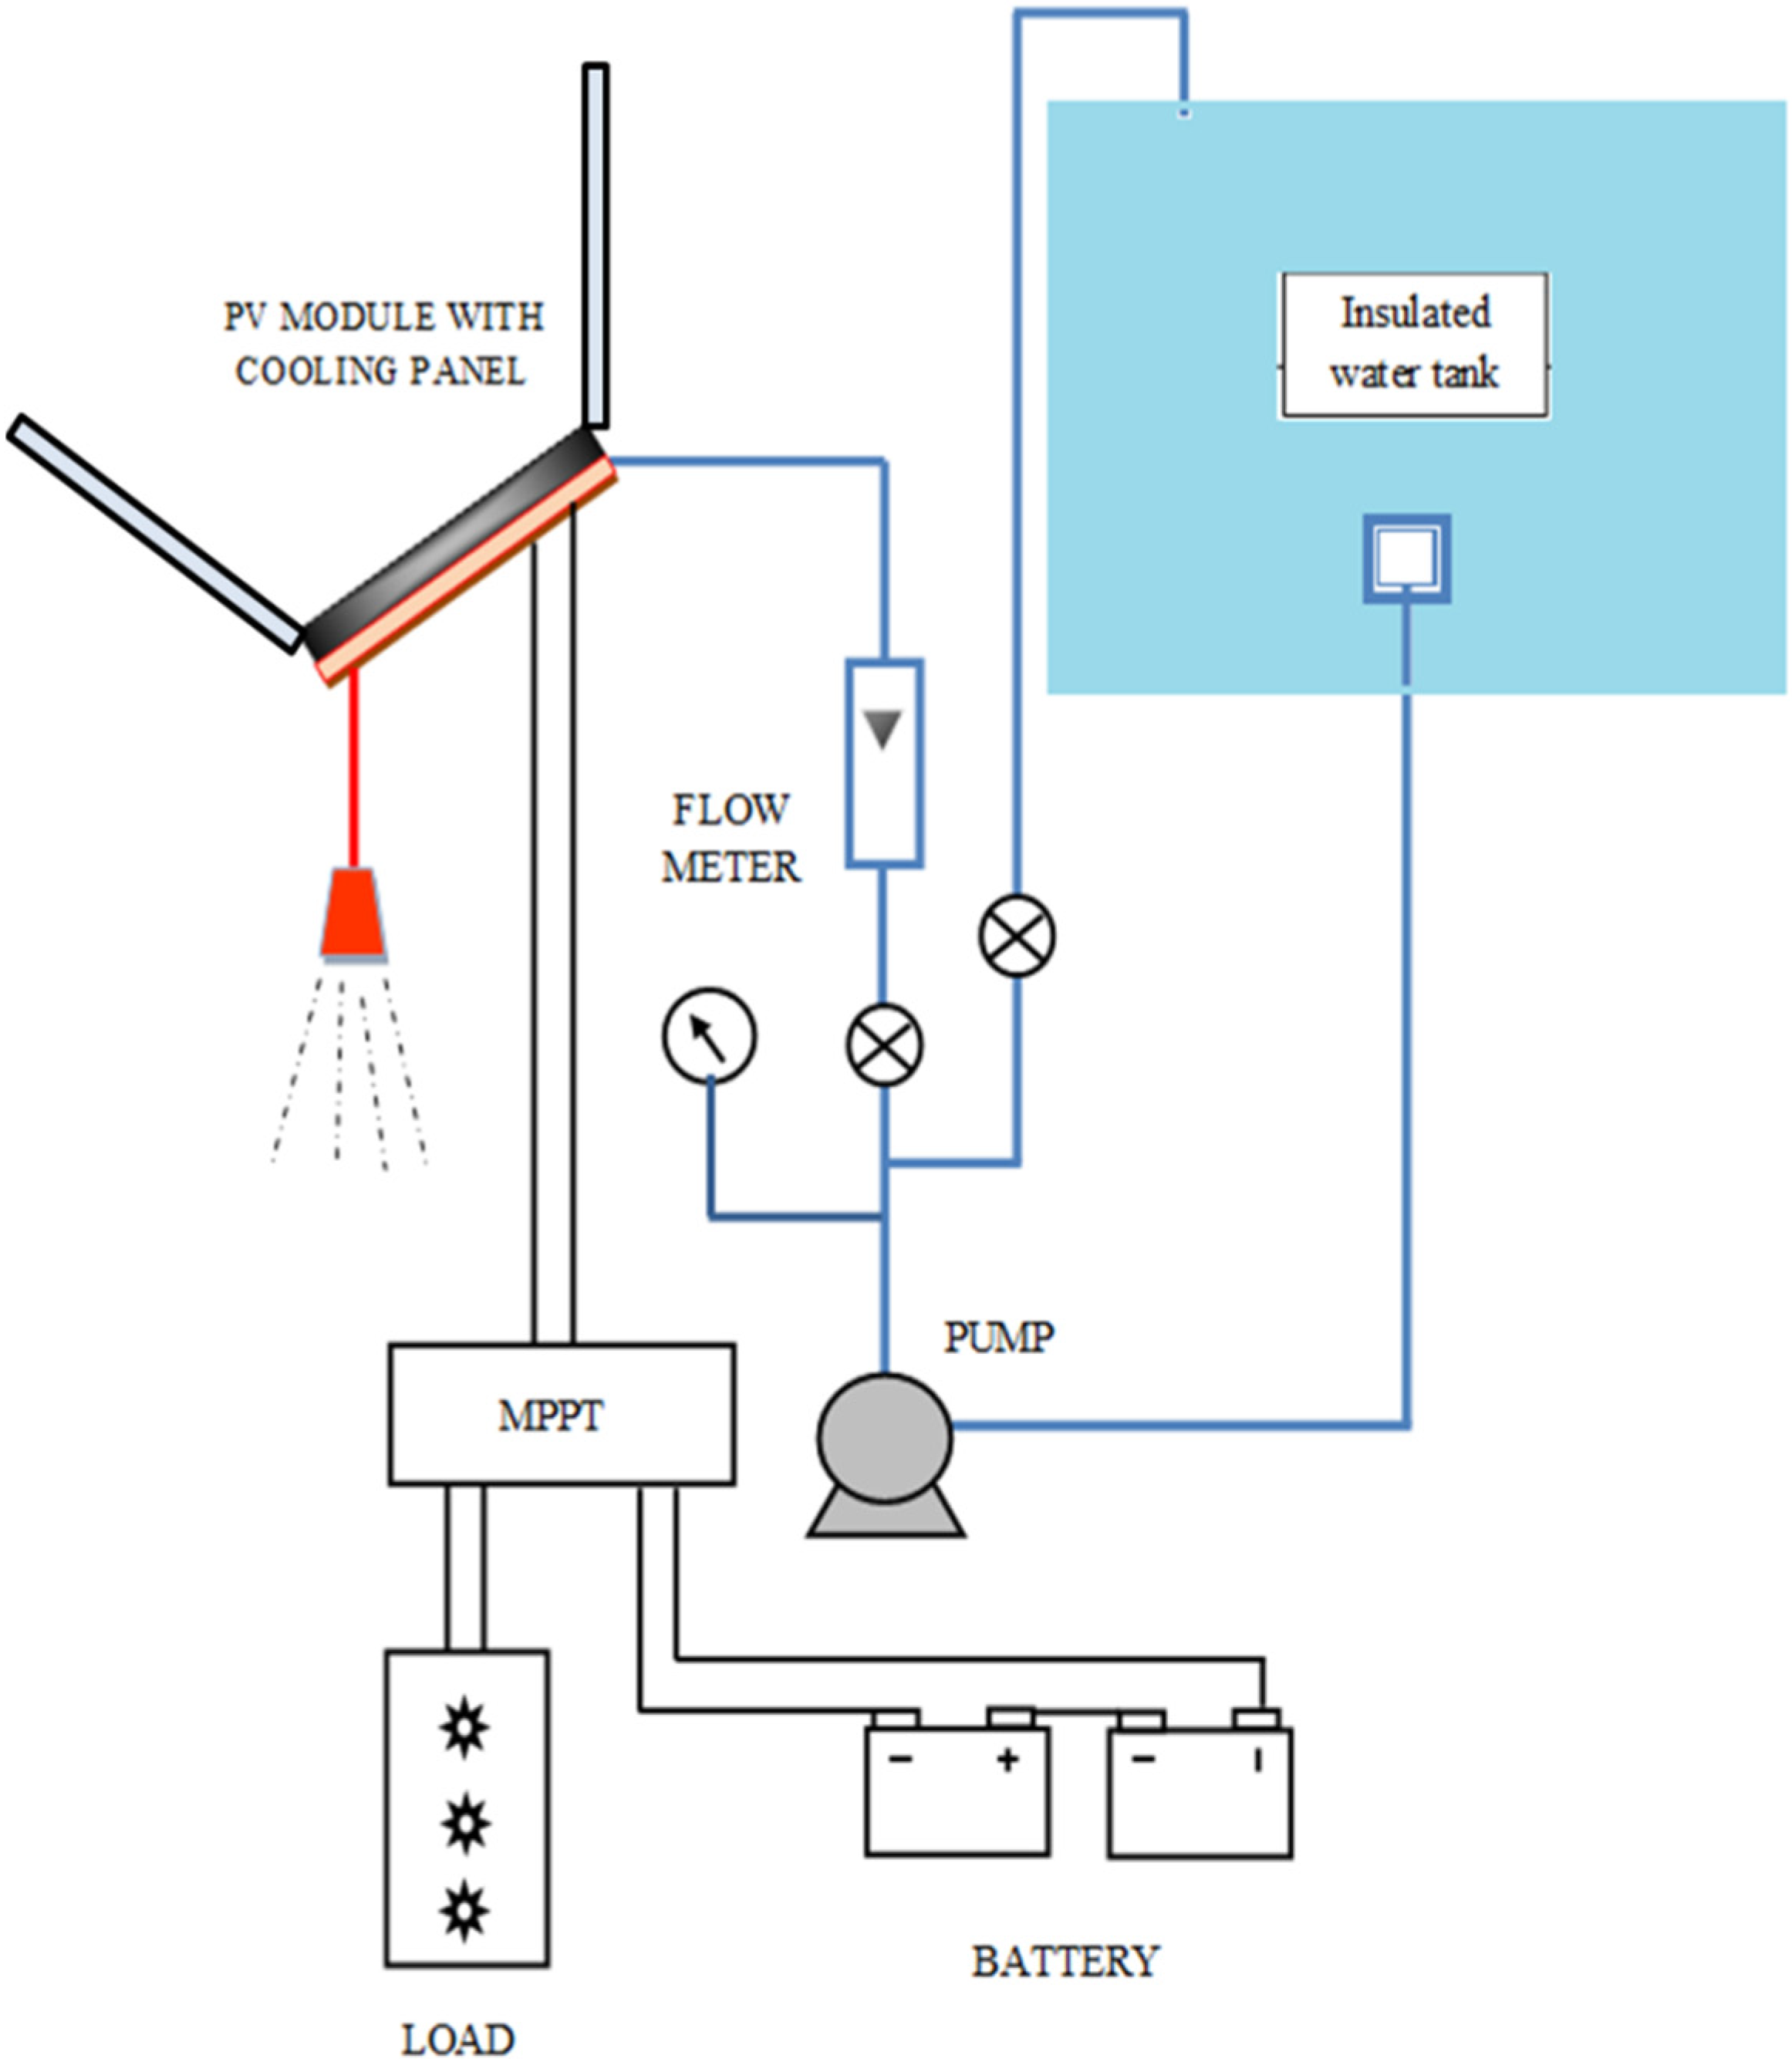
3. Experimental Study

Experimental setup was designed to investigate the performance of electrical efficiency and power output from the PV panel during operation under concentrated sunlight (concentration ratio > 1). There are various design models for V-trough PV systems which are categorized according to tracking modes. The different tracking modes are seasonal tracking, one axis north-south tracking and diurnal tracking. V-trough parameters are evaluated for a geometric concentration ratio of 2 as shown in Figure 6 below.
A commercially available SunPower 230 W module was used for the V-trough PV system. A glass mirror with a reflectivity around 79% was used as the reflector material. The thickness of the mirror used for the experiments was 5 mm. When the solar intensity is enhanced by reflectors, the temperature of the panel rises and it adversely affects the electrical efficiency of the system.
For this purpose a cooling system was integrated with the V-trough PV system to lower the module temperature and increase the electrical efficiency. A storage tank with proper insulation was used to supply cooling water to the system. For lowering the operating temperature of the module, a SDM100 collector (heat exchanger) was placed at the bottom of the panel with about 20 mm of insulation. A pump and bypass system were used in order to maintain the pressure of water supplied to the collector. The electricity which is generated by the solar panels was stored in two batteries of 12 V each connected in series. The experimental setup is shown in Figure 7.
Figure 6. Dimensions (mm) of V-trough PV System.
Energies 08 02803 g006
Figure 7. Experimental setup of V-trough PV system.
Energies 08 02803 g007
During the operation, a maximum power point tracker (MPPT) was used to extract the maximum power from the panel under different operating conditions. Solar radiation was measured by using a pyranometer which was installed horizontally. In this setup the wind speed was recorded by an anemometer. A K-type thermocouple was used to measure the ambient, PV module, water inlet and outlet temperatures. The voltage and current of the panel were recorded with an ammeter and multimeter from the MPPT. The schematic diagram of the entire setup is shown in Figure 8. The experiment was performed normally from 9 am to 4 pm. During the operation of the experiment, PV current & voltage, inlet and outlet temperature, temperature of the module, wind speed and solar radiation were recorded on an hourly basis. Monocystalline silicon solar cells are used in the current experimental setup. The used SunPower 230 solar panel utilizes 72 all back-contact solar cells. The specifications of the panel are given in Table 2. According to the manufacturer data the total panel conversion efficiency is about 18.5%.
Figure 8. Schematic Diagram of V-trough PV system.
Energies 08 02803 g008
Table 2. Specifications of the SunPower 230 PV module.
Solar PV module parametersValue
Module typeSunPower SPR-230WHT-U
Maximum Power (Pmp)230 Watt
Maximum Power Voltage (Vmp)41 V
Maximum Power Current (Imp)5.61 A
Maximum Power point efficiency ( η m p ) 18.5%
Open Circuit Voltage (Voc)48.7 V
Short Circuit Current (Isc)5.99 A
Area of the module (A)1.24 m2
Temperature co-efficient of Short-circuit current ( μ I s c ) 3.5 mA/K
Number of solar cells72 (monocrystalline type)
A maximum power point tracker (MPPT) was utilized to maximize the power output of the PV module and it is also a high efficiency DC to DC converter. The specifications of the SunSaver MPPT are given in Table 3. The MPPT controller is able to calculate the voltage at which modules can produce the maximum power output and the working voltage of PV module at maximum power output voltage rather than battery voltage. There was a significant increase in the current supplied to the battery by using the MPPT controller rather than a conventional converter.
Table 3. Specifications of Sunsaver MPPT.
SUNSAVER MPPTSSMPPT-15L
Maximum Battery Current15 A
Maximum Open Circuit Voltage75 V
Maximum PV Input200 Wp (12 V Battery)
400 Wp (24 V Battery)
System Voltage12/24 V
To store the excess electrical energy produced by the PV panel, two batteries (12 V, 80 Ah) connected in series were used. The electricity generated by the panel was used to drive the load which consists of DC bulbs rating 24 V and 70 W. An ammeter and voltmeter was used for measuring the maximum current and voltage from the output terminals of the MPPT. A multimeter was used to measure the voltage from the panel through the terminals of the MPPT.
The PV module was integrated with a cooling panel followed by insulation with thickness of about 20 mm attached on the rear side of the module. The water to be supplied to the cooling panel was stored in a well insulted storage tank with an insulation thickness of 10 mm. The outlet of the tank was connected to a pump for circulating water at the required pressure. The pump delivers the water to the cooling panel only after adjusting the required flow rate and pressure using a bypass system. The maximum pressure allowed for the cooling panel was 41.4 kPa. The bypass system which regulates the pressure by pumping the water back to the storage tank (with pressure gauge and valve arrangement) ensures the pressure does not exceed 41.4 kPa. To regulate the water flow inside the cooling panel, a flowmeter with maximum flow rate of 3.6 LPM was used. The cooling water circulated through the collector, captured the waste heat from the PV module and produced hot water collected at the collector outlet. Temperatures at the various points of the system were measured using thermocouples, a hygro thermo-anemometer was used to record the ambient temperature and wind speed. The accuracy and sensitivity of the instruments used in the setup is given in Table 4.
Table 4. Accuracy/sensitivity of the instruments.
Instrument UsedAccuracy/sensitvity
Sunsaver MPPTCurrent: 1%; Voltage: 2%
Pyranometer30.1 µV/(W/m2)
Hygro Thermo-Anemometer2% ± 0.2 m/s
Thermocouple Thermometer±1 °C

4. Results and Discussion

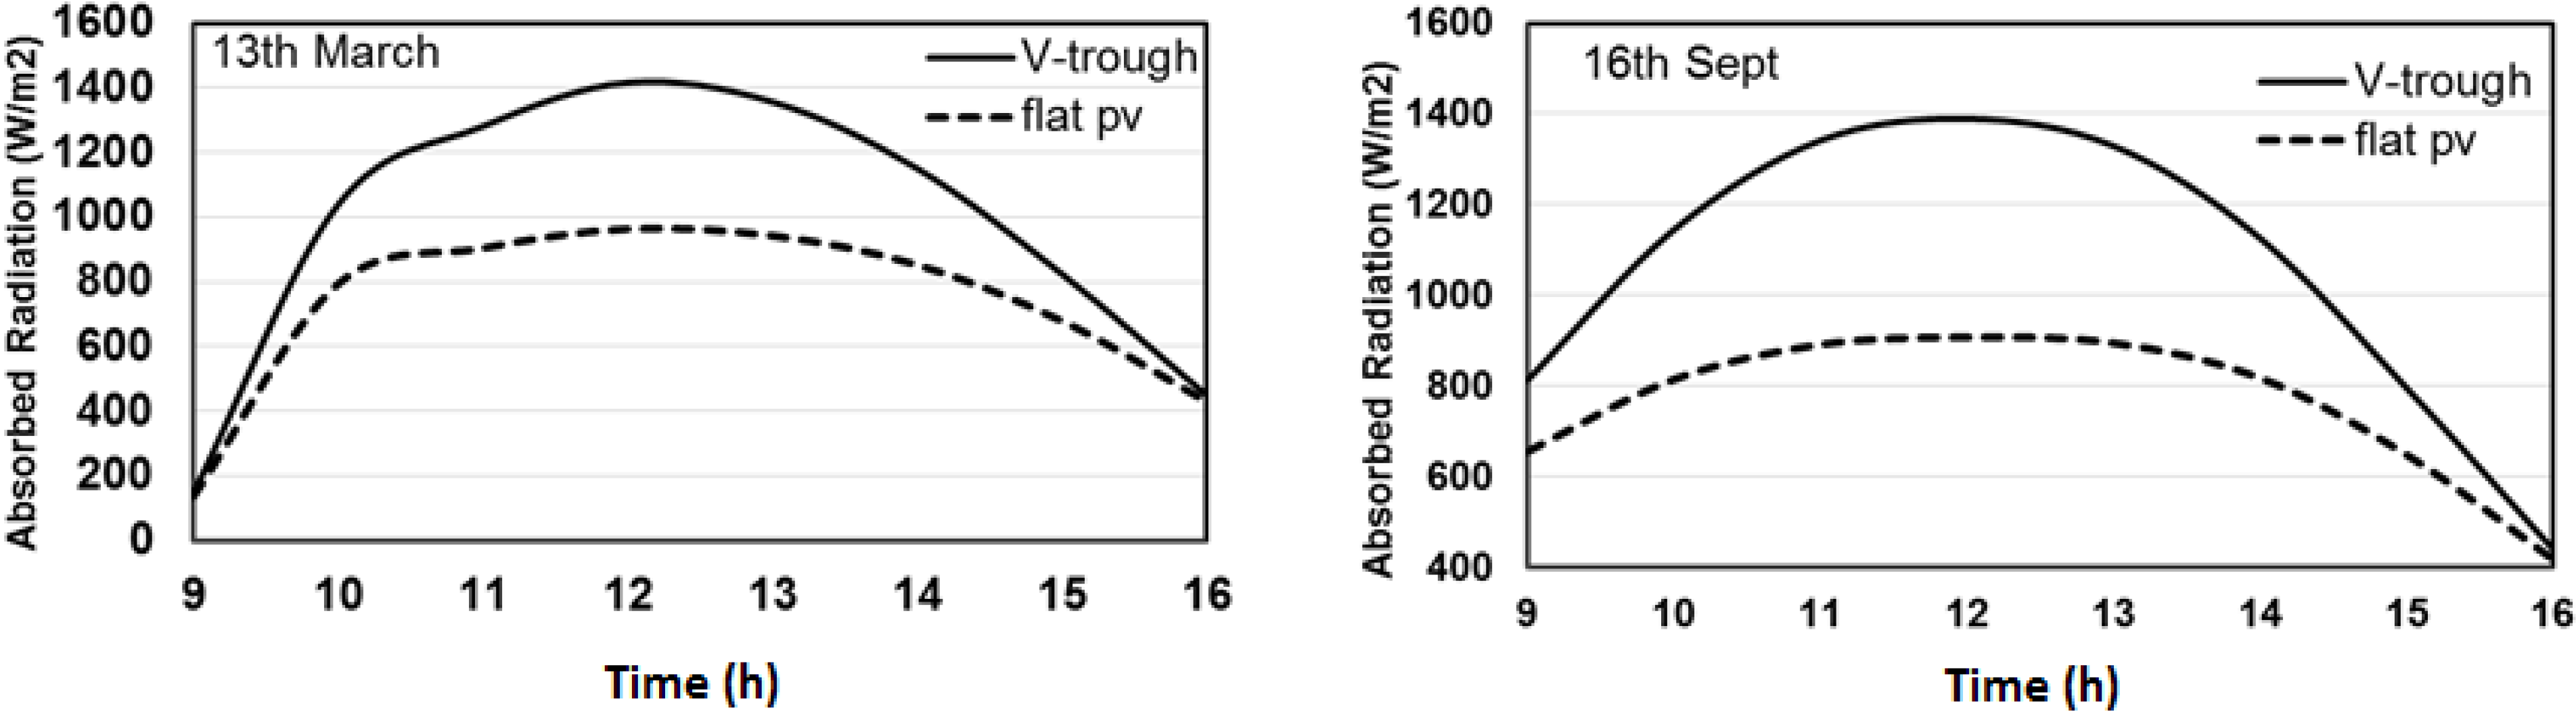
4.1. Optical Modeling

As discussed earlier, the solar flux need to be enhanced on the given cell area for improving the performance of PV system and reducing the cost of electric power produced per unit area. In this regard, a different low concentration photovoltaic configuration known as V-trough is used. It consists of two planar reflectors attached with the PV panel that make a V-trough shape.
V-trough performance analysis was carried under the climatic conditions of Dhahran (latitude = 26.5°). The slope of the collector was kept at 45°. Figure 9 shows the solar irradiance absorbed in the V-trough PV system and a simple PV panel. Simulations were carried out for the ambient conditions of representative days of March and September. In March the maximum amount of radiation intensity absorbed by flat PV panel was about 963 W/m2. When the V-trough was integrated with it, the amount of absorbed radiation intensity increased to 1,416 W/m2, i.e., by approximately 47.04%. Similarly on 16th September the amount of enhancement in the absorbed radiation with planar reflectors was 53%. This amount of absorbed energy was then used as an input parameter for the thermal and electrical models.
Figure 9. Comparison of absorbed radiation intensity for V-trough PV system and simple PV panel.
Energies 08 02803 g009

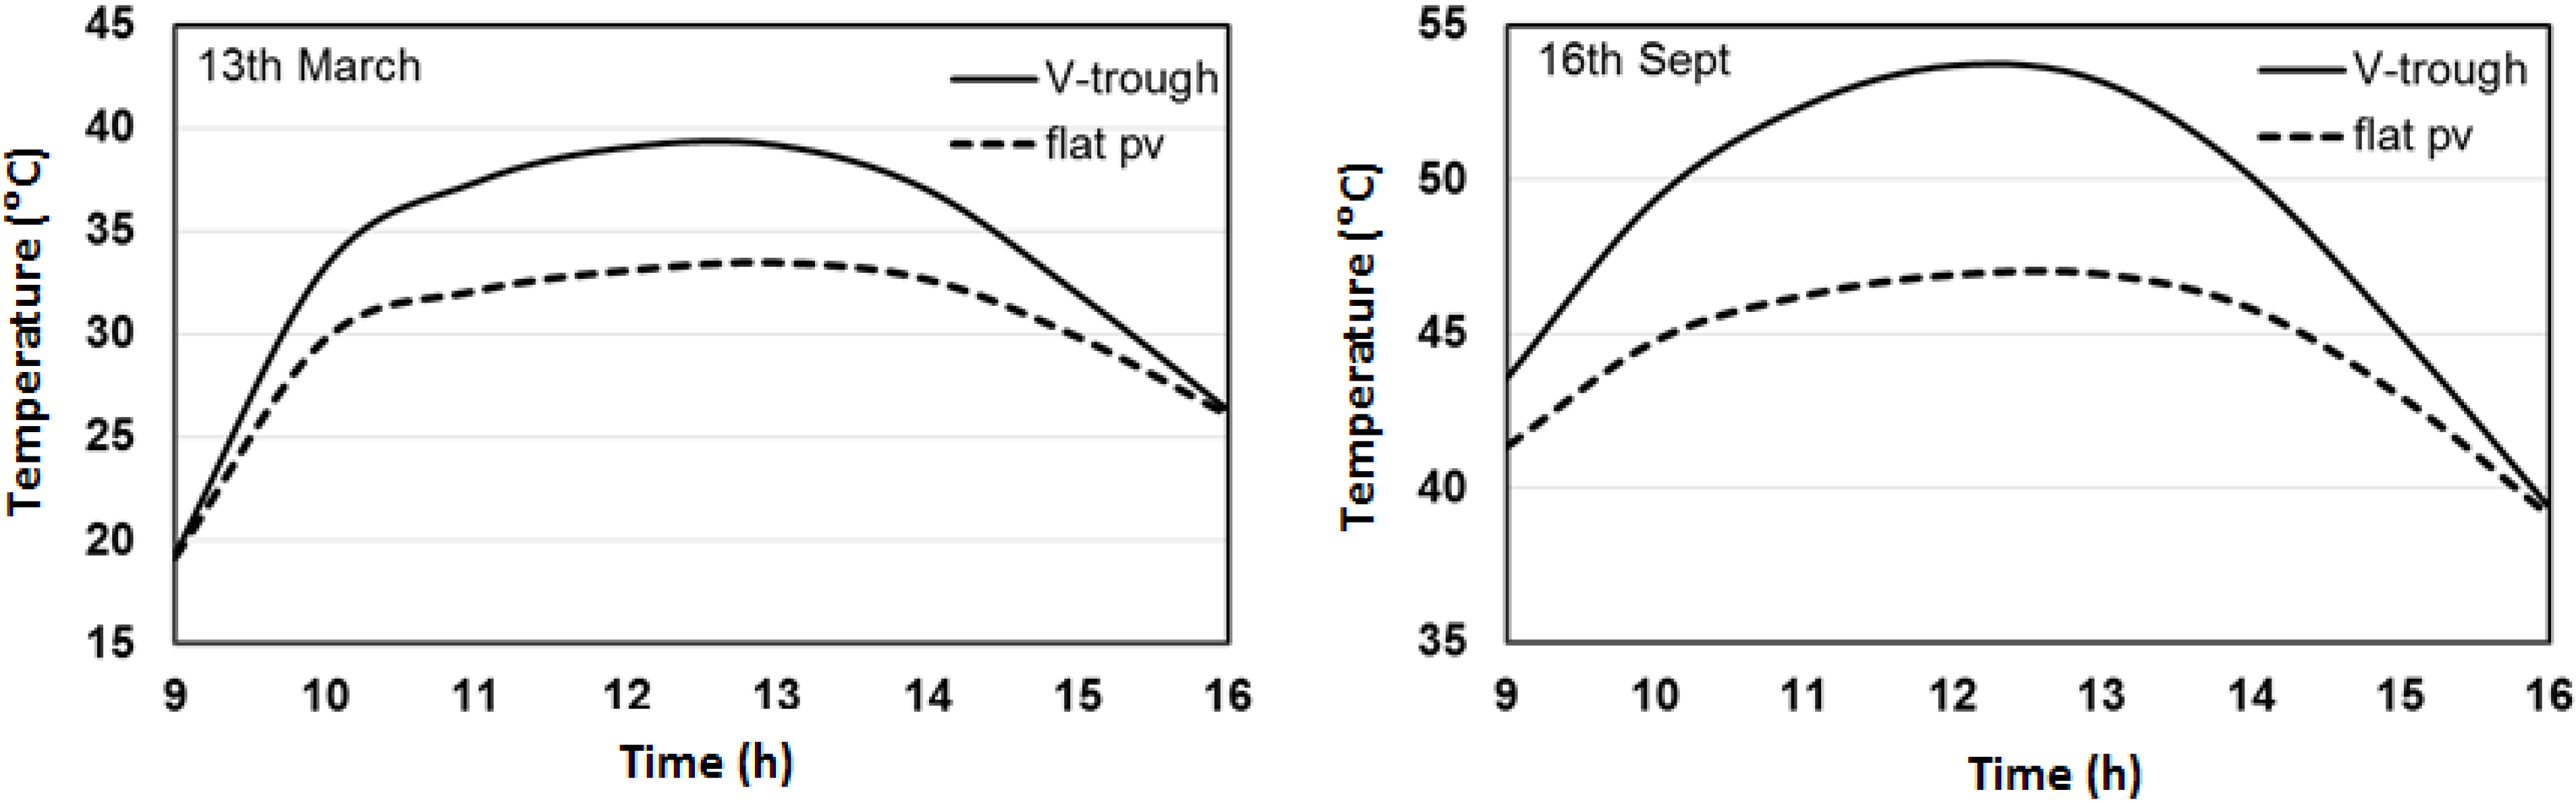
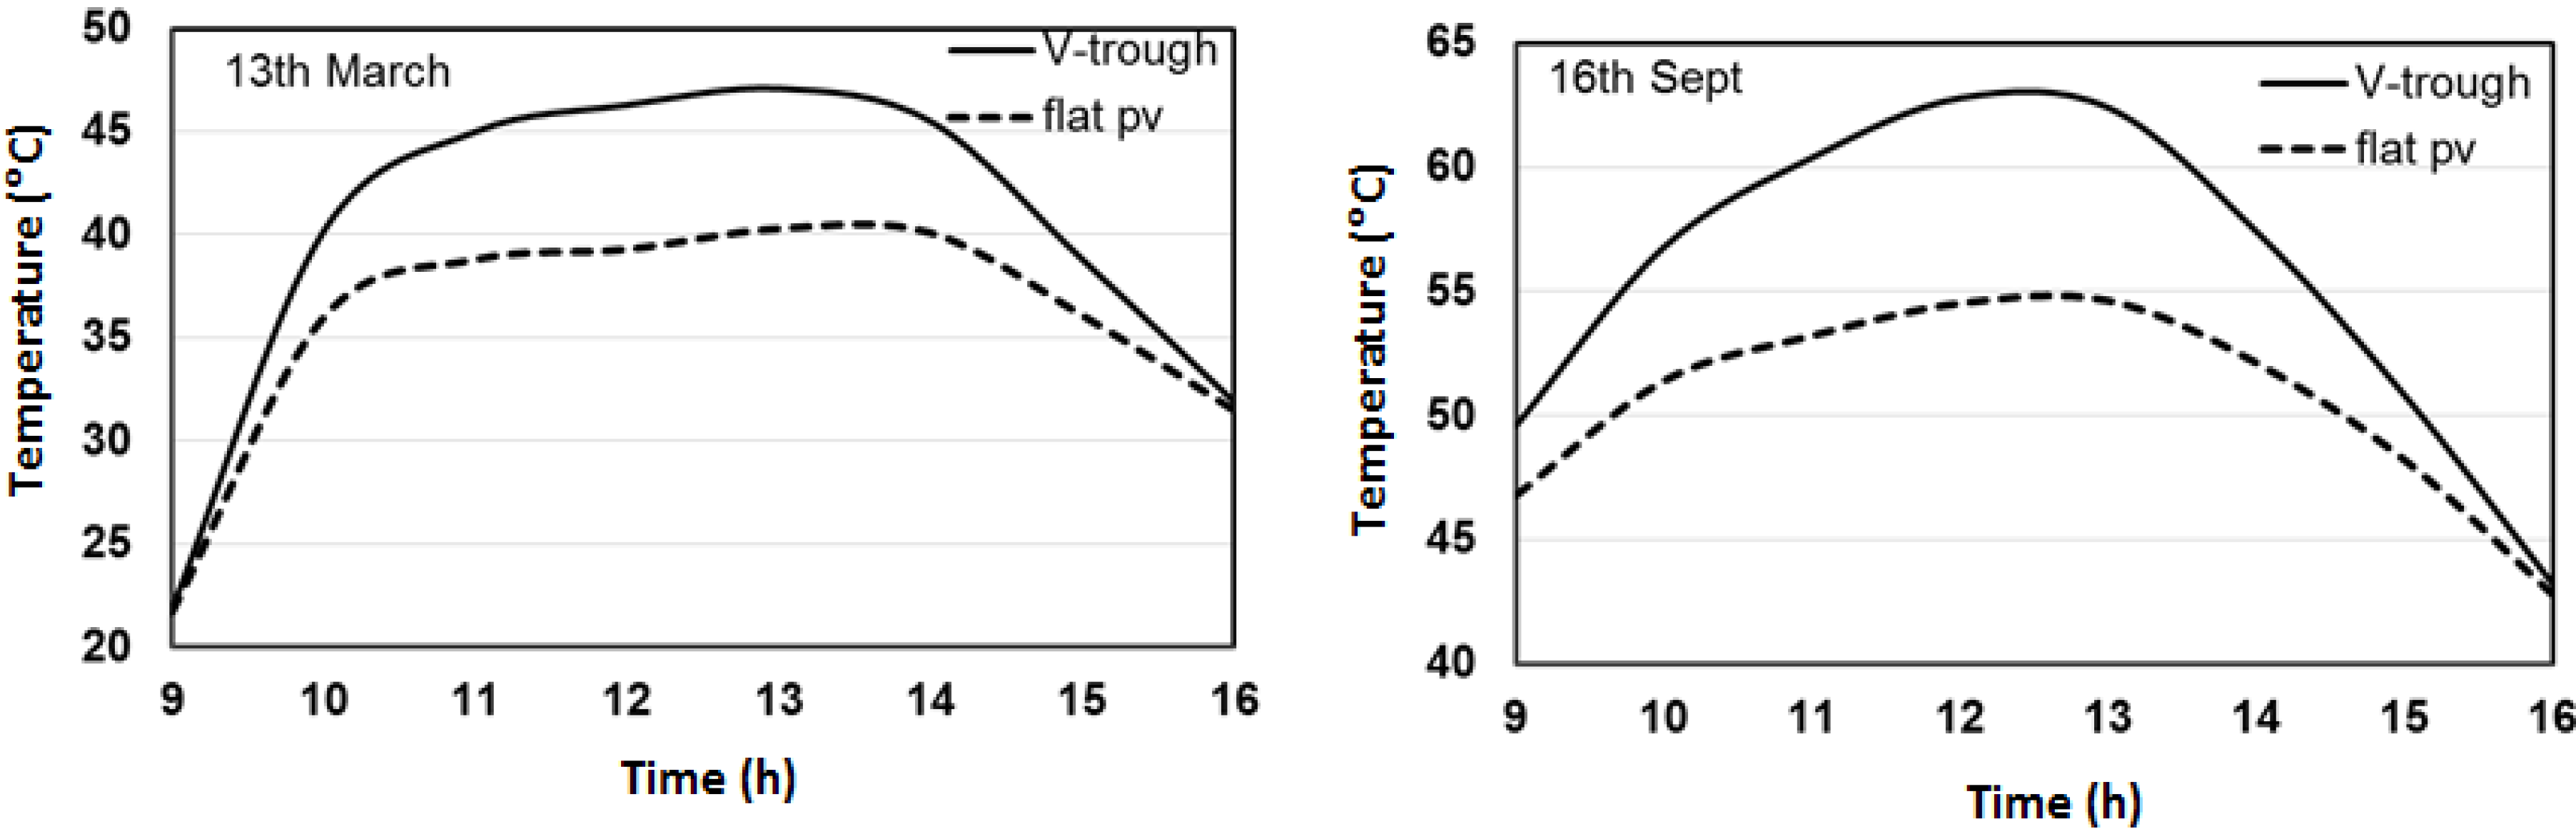
4.2. Thermal Modeling

Photovoltaic cells are able to utilize the part of the absorbed solar radiation and generate electric power, while the rest of the absorbed radiation increases the temperature of the cells. The operating temperature of the module depends on the equilibrium maintained between the heat generated by the module and the heat lost to the surroundings. By applying the energy balance equations, the thermal network of the PV system was solved and the module temperature was estimated. Figure 10 shows the maximum cell temperatures for the V-trough PV system and a simple PV panel under the operating conditions. The maximum cell temperature for the V-trough PV system was 47.1 °C on March 13th, whereas for a simple PV panel the temperature remained under 40.3 °C. The increase in the cell temperature for the V-trough PV system was due to the increased amount of absorbed radiation compared to simple PV panels.
Figure 10. Cell temperature without cooling.
Energies 08 02803 g010
In order to lower the operating cell temperature and increase the electrical efficiency of the PV system, active cooling was incorporated in the system. Results show that by circulating water, the module temperature is effectively reduced. Figure 11 shows the operating cell temperatures values after the integration of a cooling system with the simple PV panel and V-trough PV system. The maximum cell temperature value in the case of the V-trough PV system was reduced to 39.20 °C which is 16.8% less compared to the same V-trough PV system without cooling. Similarly, for flat PV panels the operating temperature attained a maximum value of 33.4 °C which was 16.9% less compared to without cooling. In September, the maximum value of the module temperature reached 62.8 °C, while with cooling the temperature was reduced to 53.7 °C, i.e., a reduction of 14.5%. Therefore in order to get maximum benefit from the available concentrated panels, cooling is necessary.
Figure 11. Cell temperature with cooling.
Energies 08 02803 g011

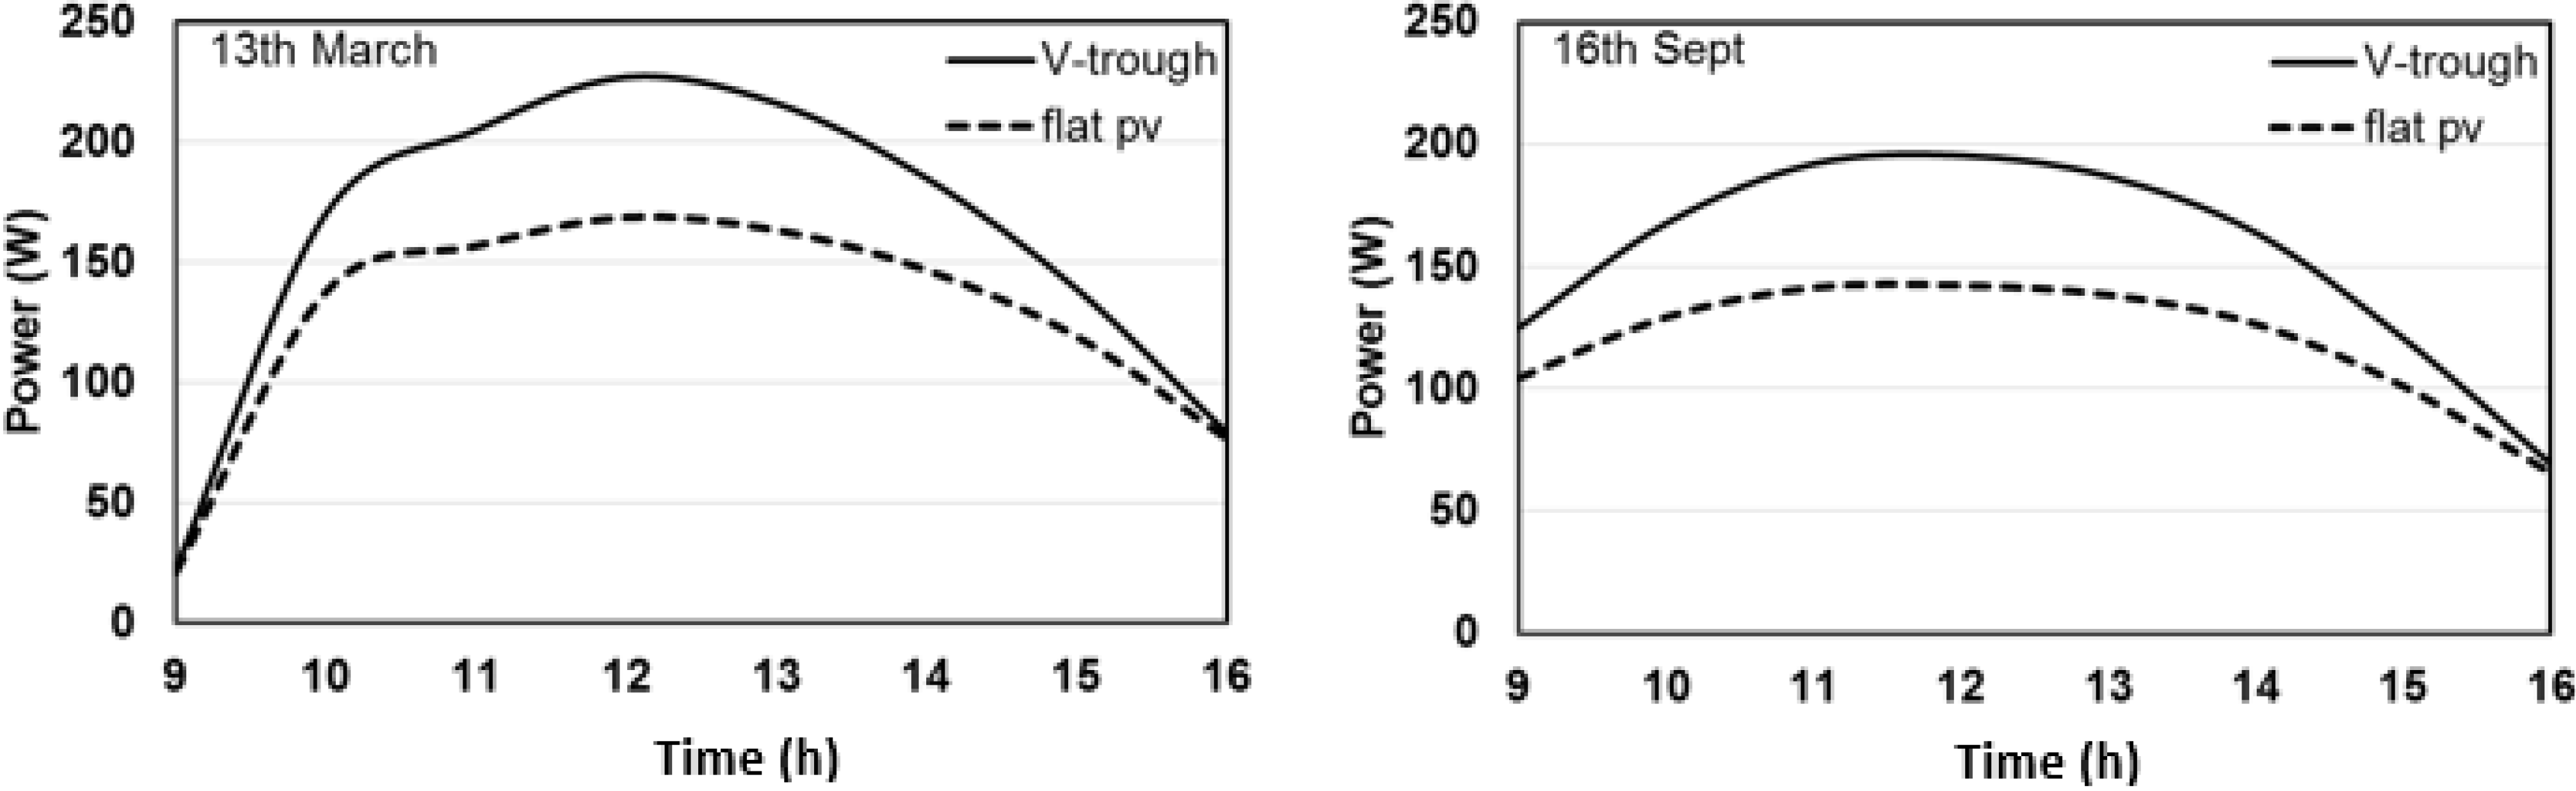
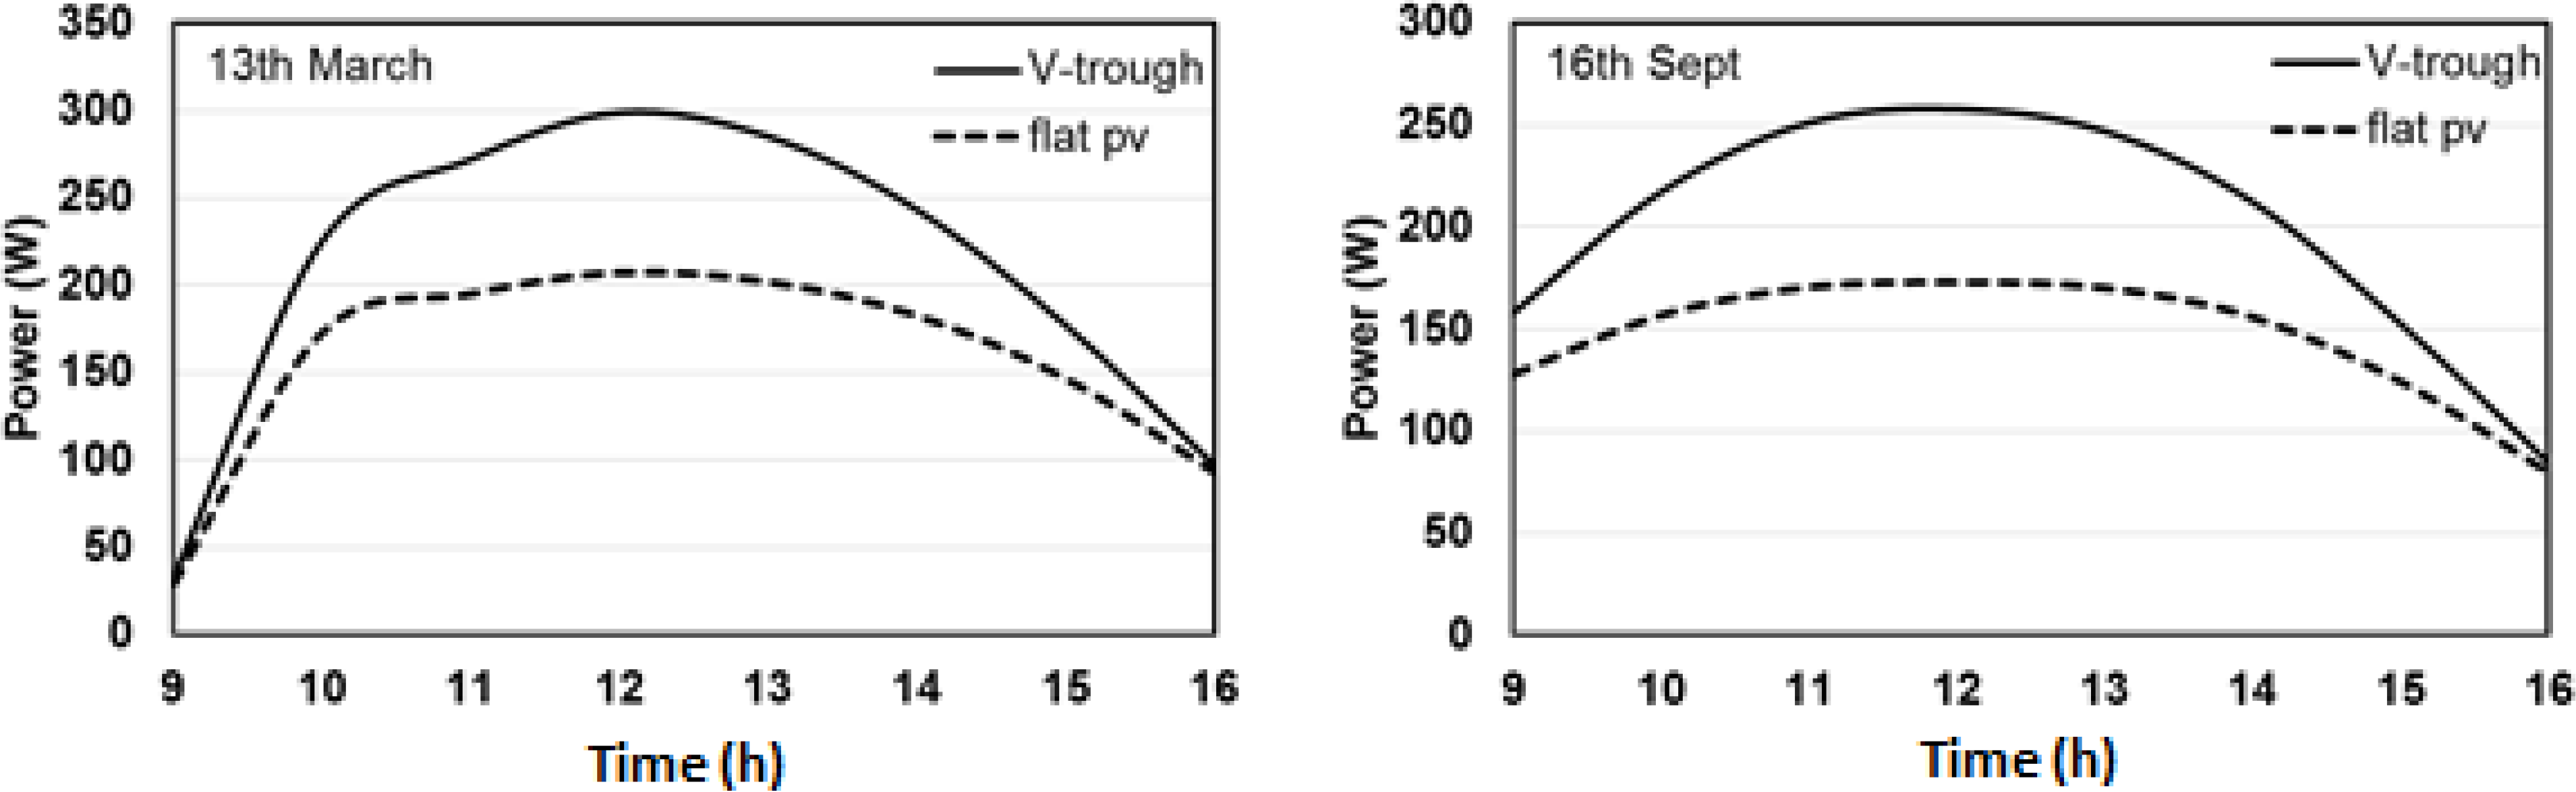
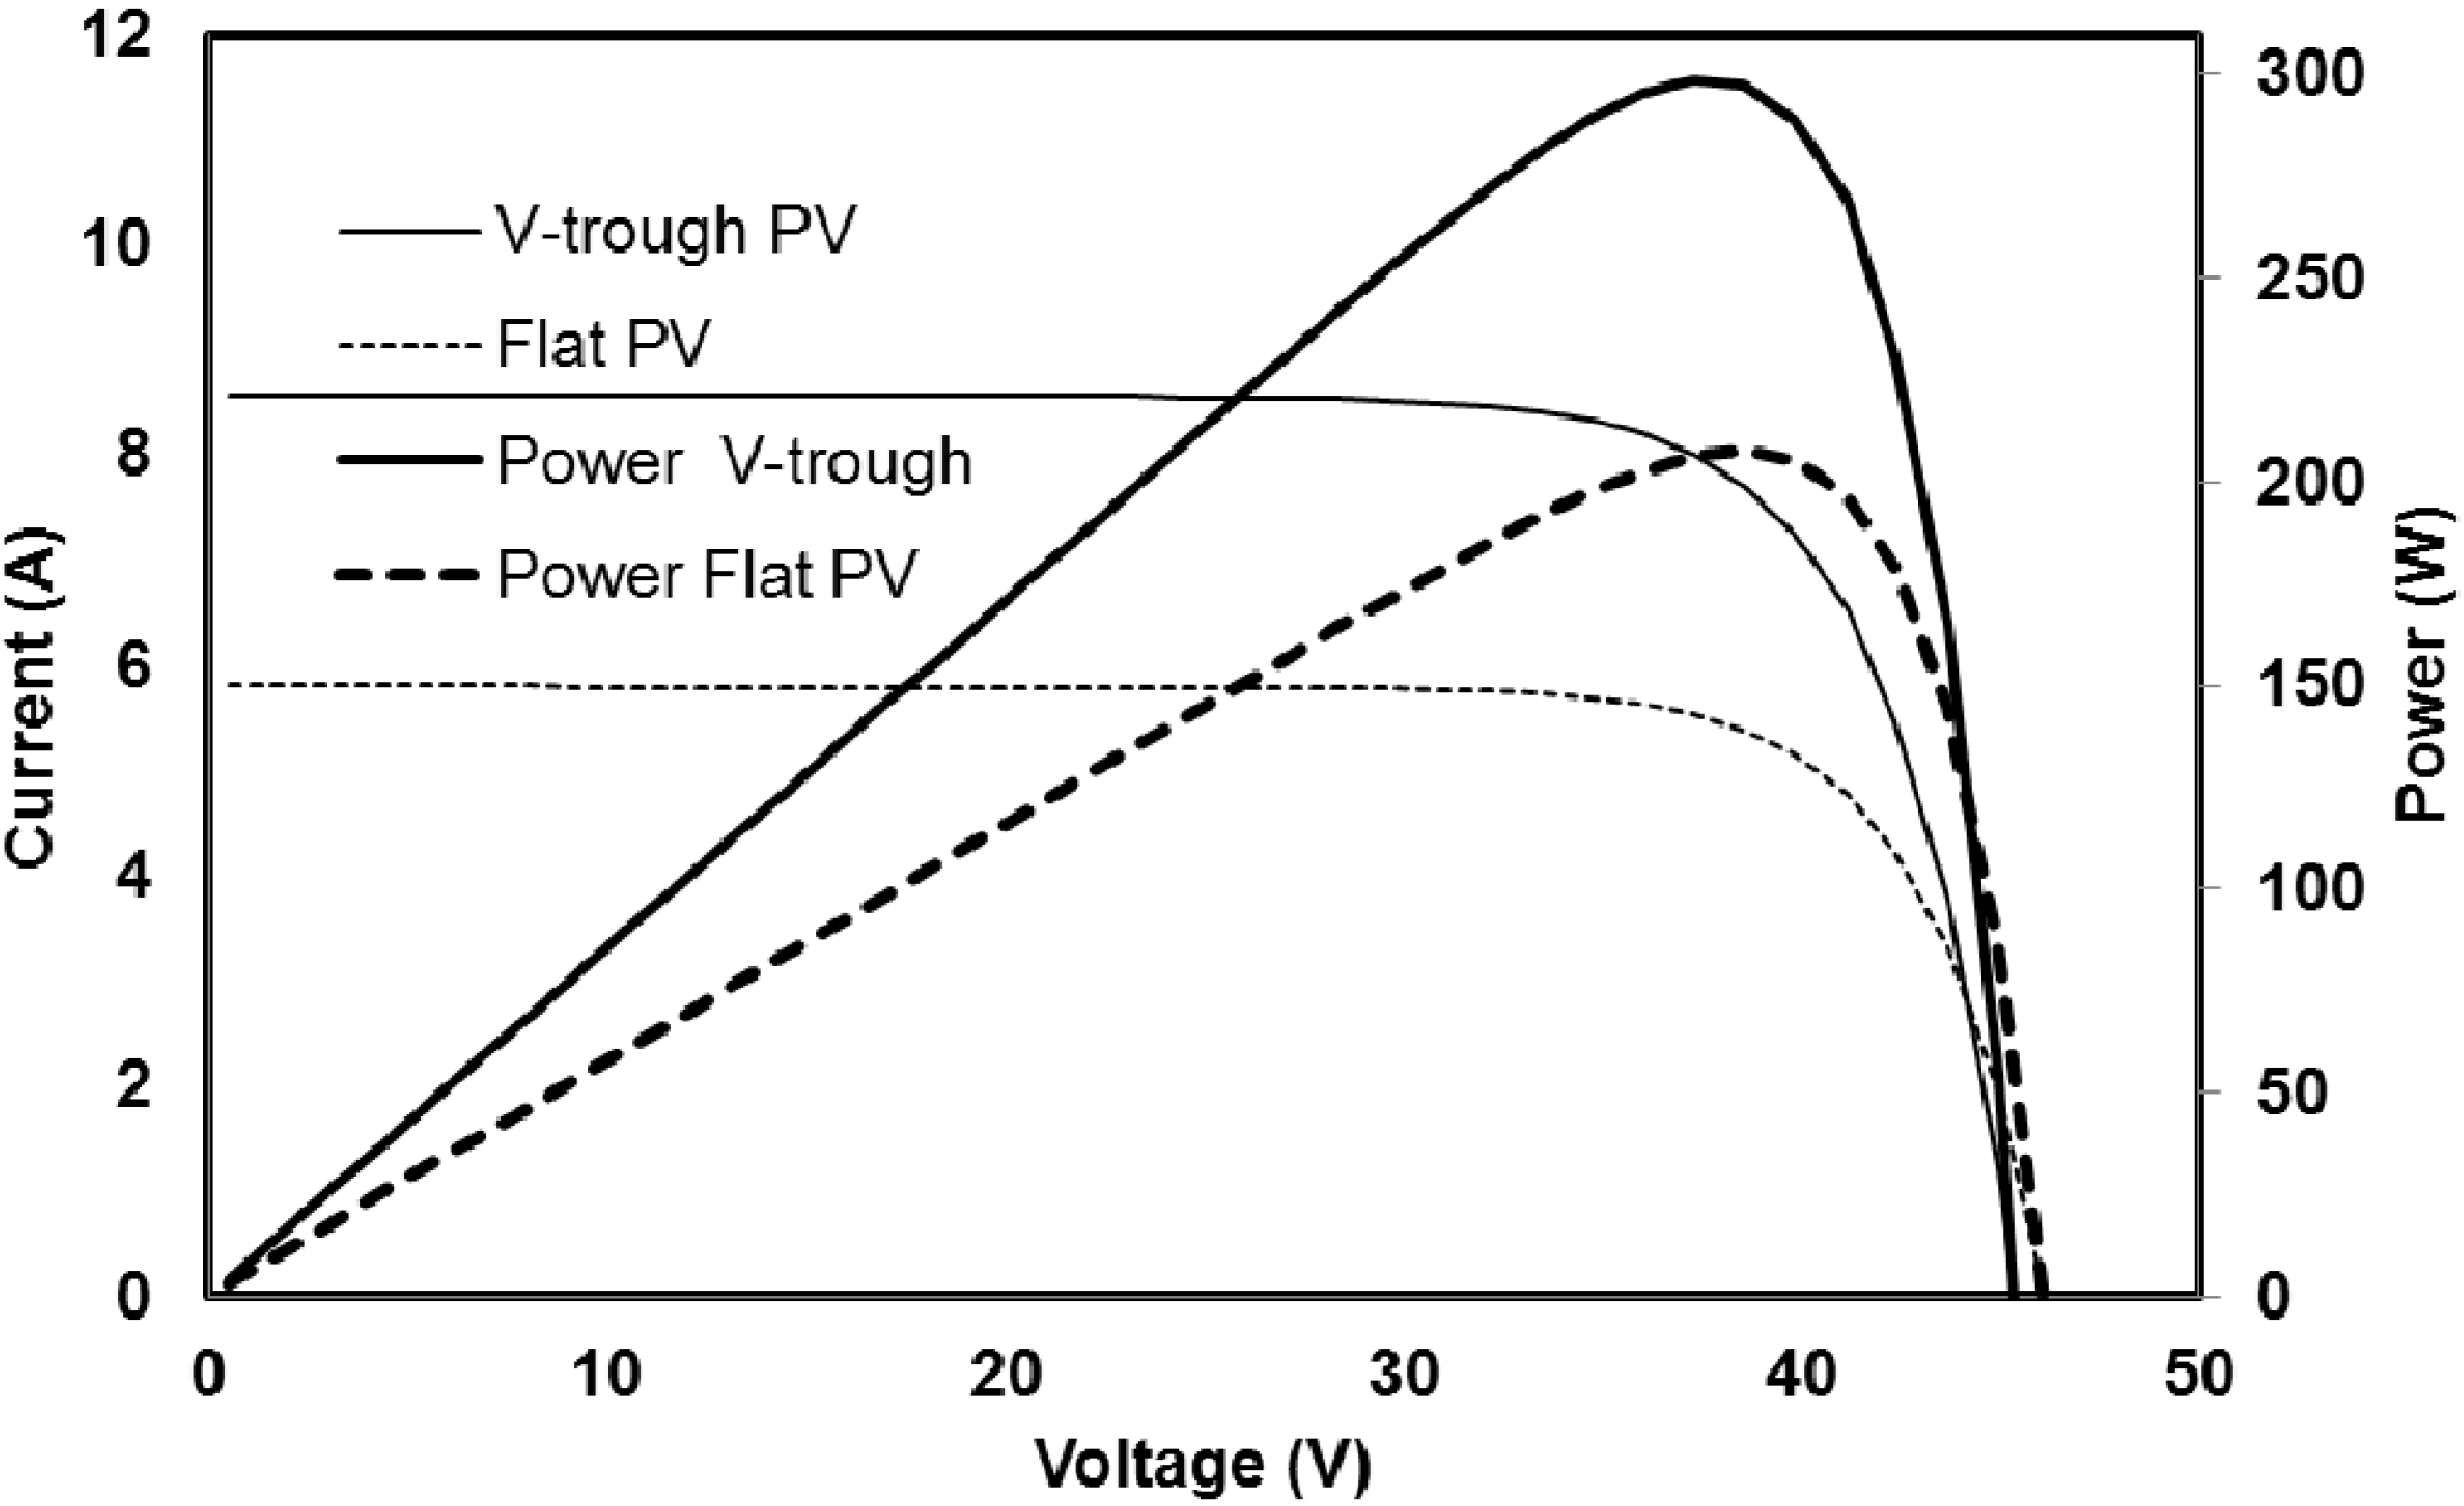
4.3. Electrical Modeling

To analyze the electrical performance of the photovoltaic cells, the five parameter model was used in the current study. The estimation of five reference parameters was carried out by solving the corresponding non-linear equations using EES software. After the estimation of the five parameters, the electrical performance of the PV system was analyzed by giving absorbed radiation and cell temperature as the input parameters. The reference parameters were estimated from the data given in the SunPower 230 W monocrystalline solar panel data sheet provided by the manufacturer. The electrical performances of the V-trough PV system and simple PV panel are shown in Figure 12. Variation of electric power output for both the cases was predicted for different ambient conditions. The maximum power output from the flat PV panel on 13th March was 168.9 W and when the V-trough reflectors were integrated along with the same panel the maximum power output increased to 227.3 W. By utilizing the two planar reflectors the power output was enhanced by 34.6%. Similarly on 16th September, the power output from the flat PV was 142.7 W and with the V-trough PV system the maximum power output reached 195.6 W. In this case, the power increased by 37% with the integration of a V-trough on a simple PV panel.
When the solar intensity is enhanced by the reflectors, the module temperature rises as discussed earlier. In order to estimate the effect of cell temperature on the electrical performance, active cooling was applied. There was a significant increase in the maximum value of the power output once active cooling was incorporated along with the existing system as shown in Figure 13.
Figure 12. Maximum power output (uncooled).
Energies 08 02803 g012
Figure 13. Maximum power output (cooled).
Energies 08 02803 g013
After applying active cooling, the maximum power output for the simple PV panel reached 207.4 W for the ambient conditions on March 13th. This shows that there was an increase of 22.8% in the value of the maximum power output delivered from the flat PV system. In the case of the V-trough PV system, there is an increase of 71.6 W which represents a 31.5% increase. The power was thus increased in each case by applying cooling, as shown in Figure 14 and Figure 15.
Figure 14. Comparison of power output for V-trough PV system with and without cooling.
Energies 08 02803 g014
Figure 15. Comparison of power output for flat PV system with and without cooling.
Energies 08 02803 g015
The I-V and P-I curves of the V-trough PV system and flat PV system are described in Figure 16. The monocrystalline panel has a good I-V characteristic curve for both configurations with and without concentrators. This indicates that the panel has good output characteristics even at low concentrations.
Figure 16. I-V and P-V curves for Flat PV and V-trough PV system (cooled).
Energies 08 02803 g016
As shown in Figure 16, it can be seen that maximum output power of the actively cooled module changes sharply under concentration and non-concentration conditions. The maximum power increases from 207.4 (non-concentration) to 298.8 W (concentration).

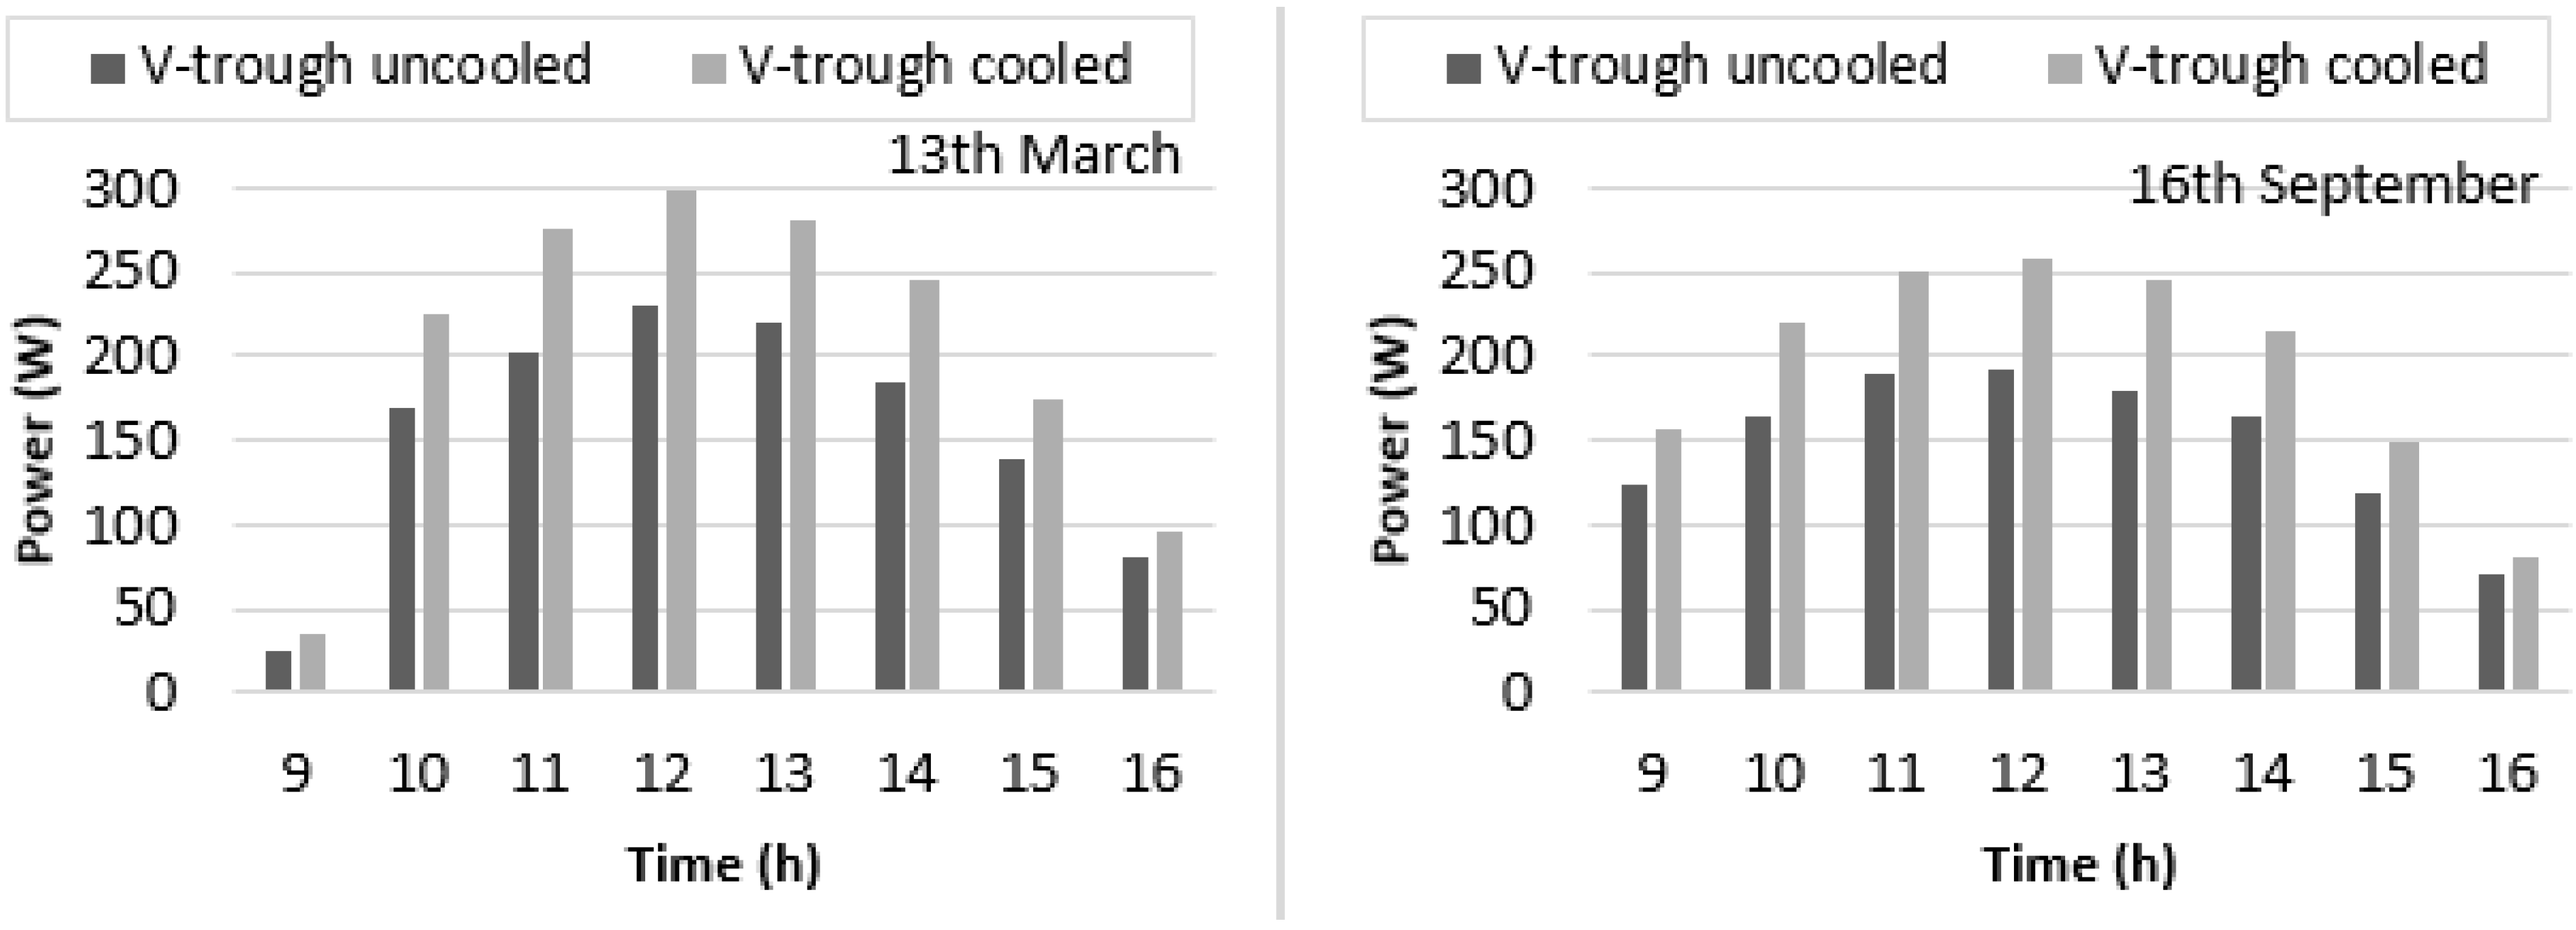
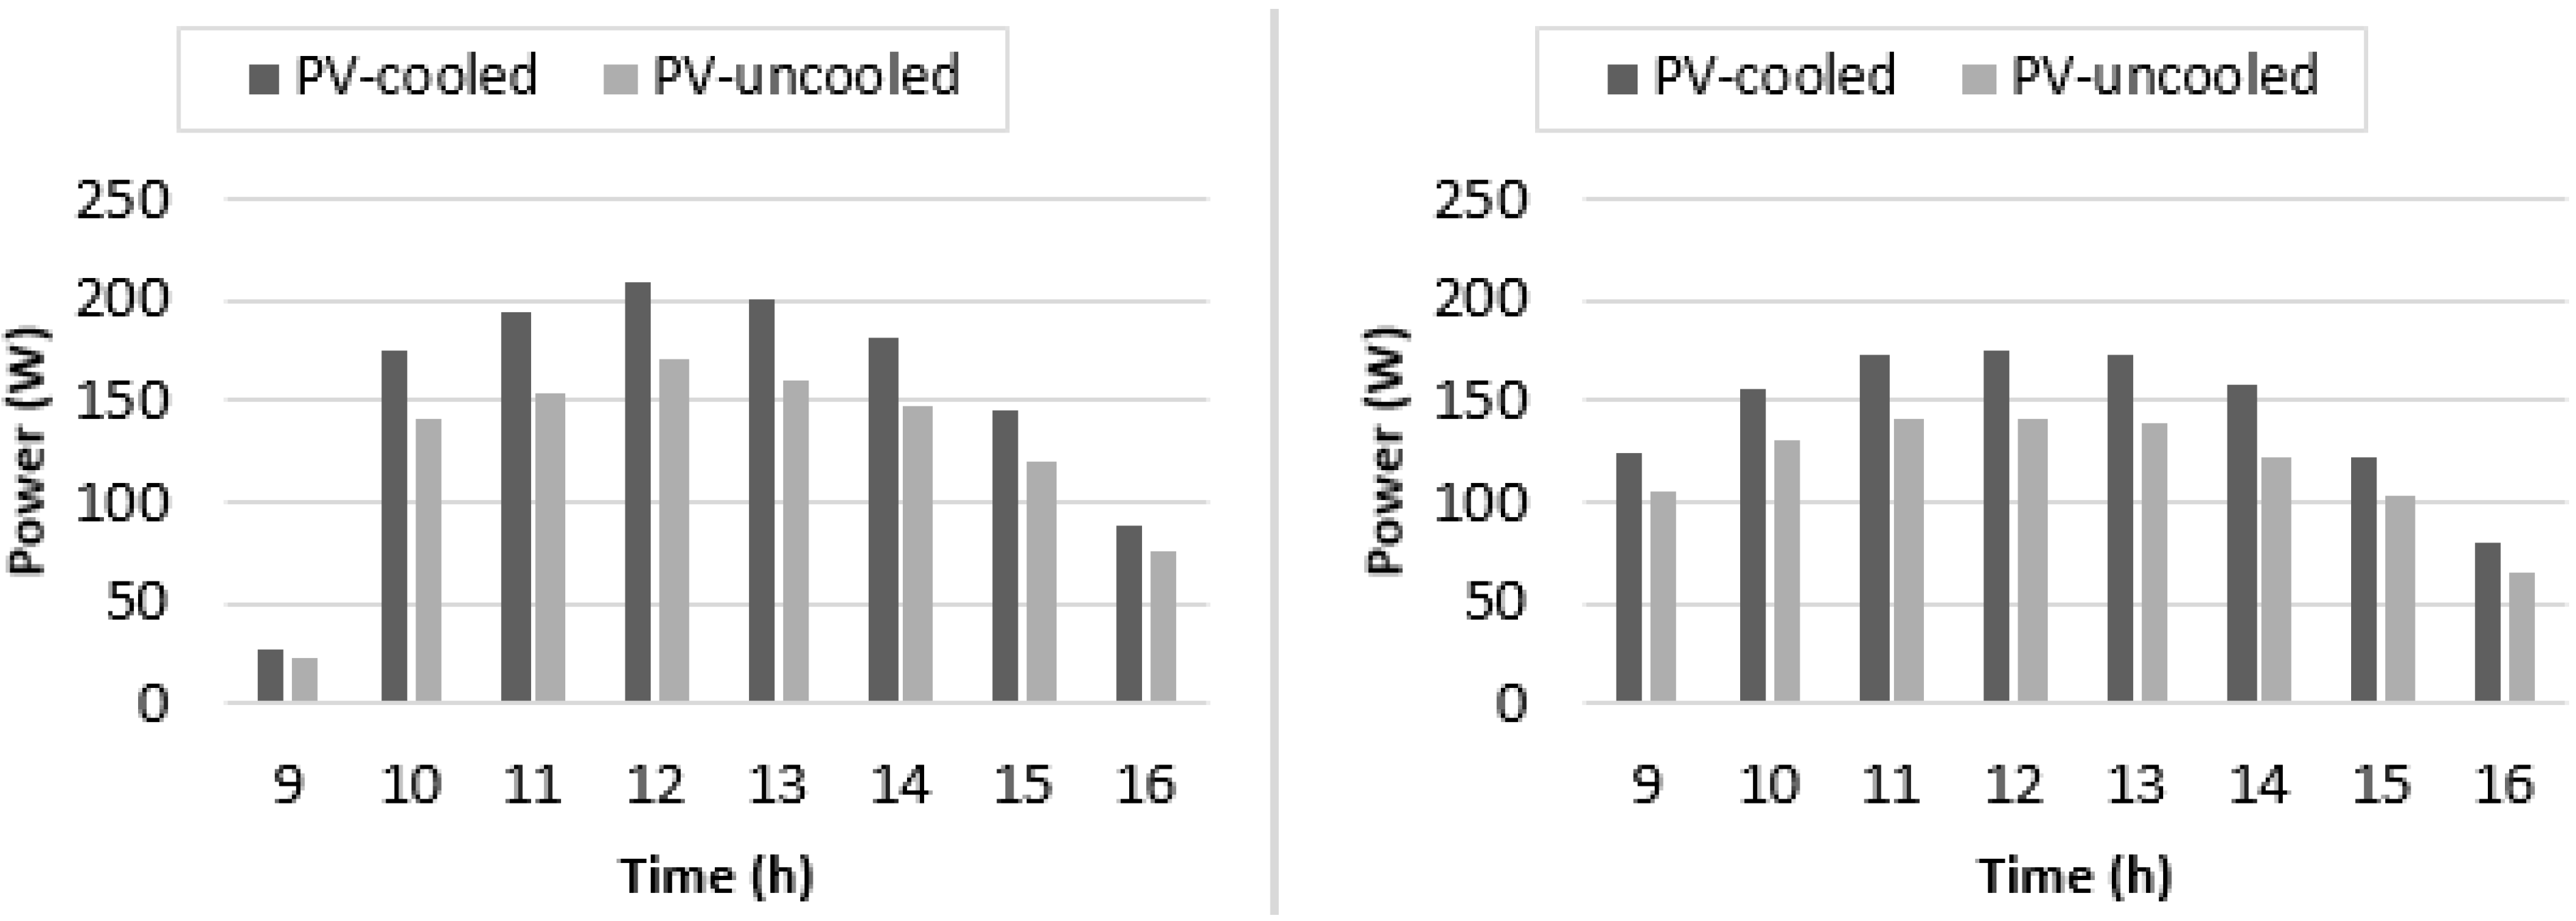
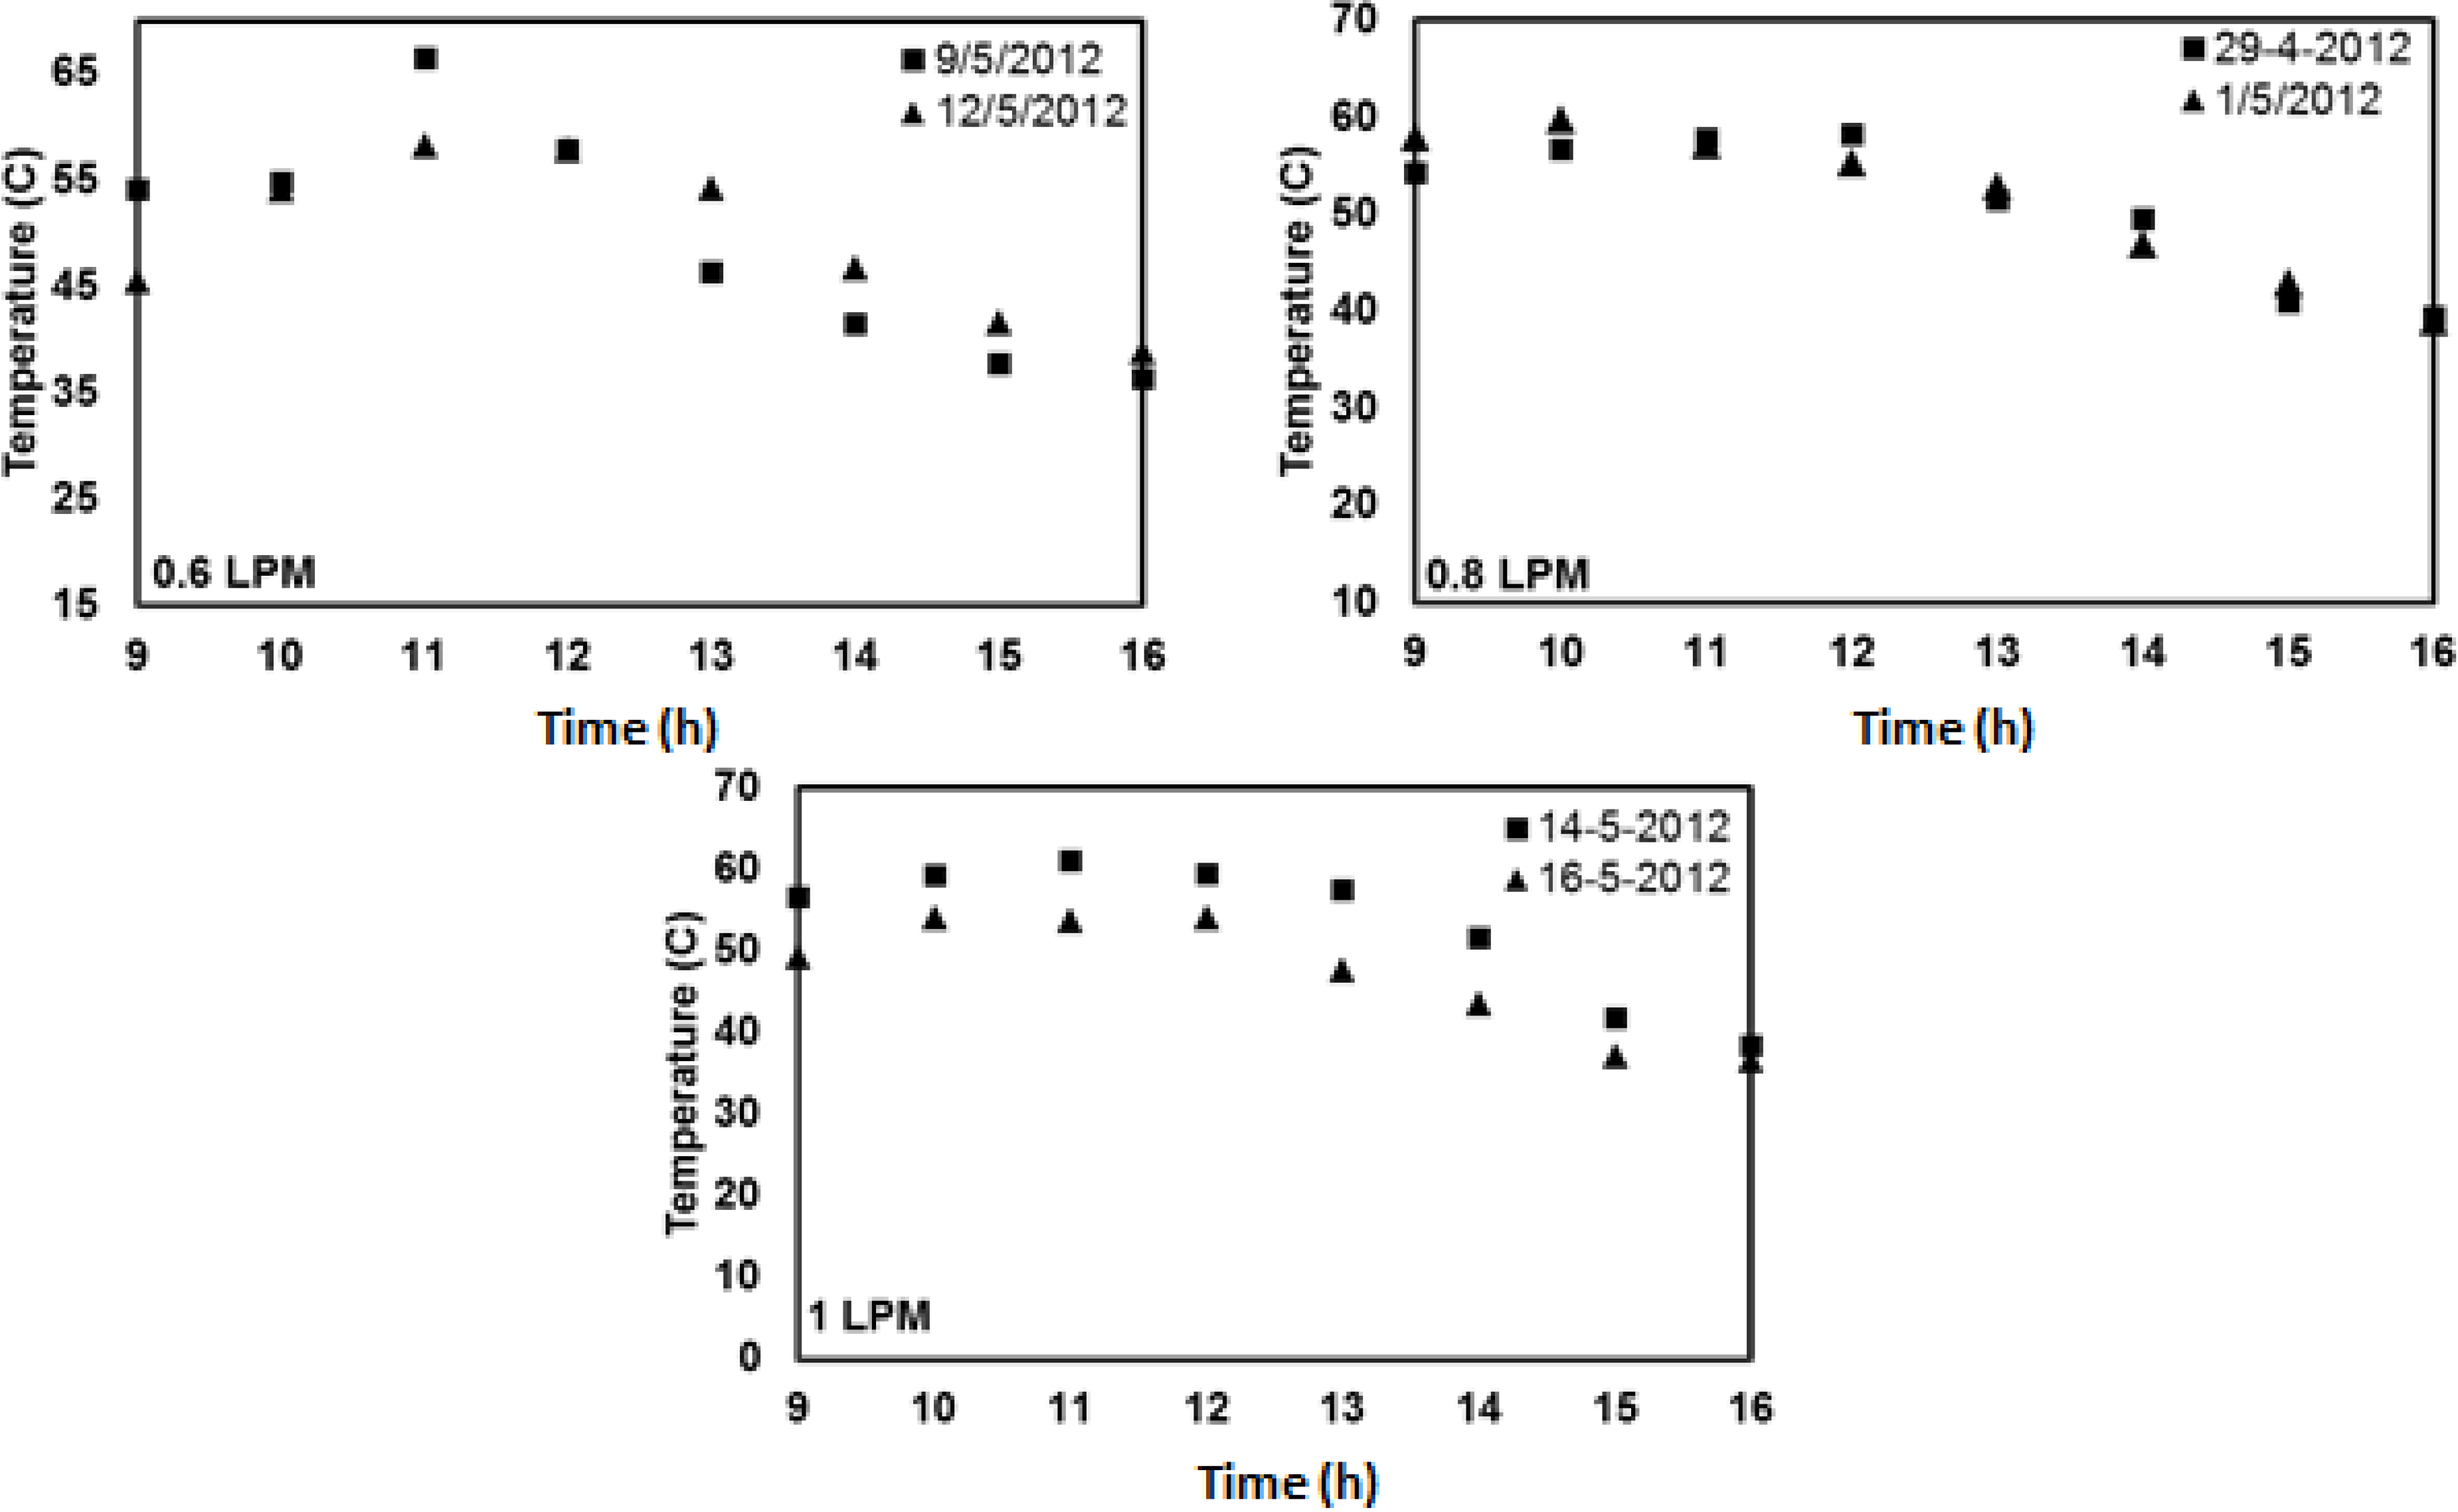
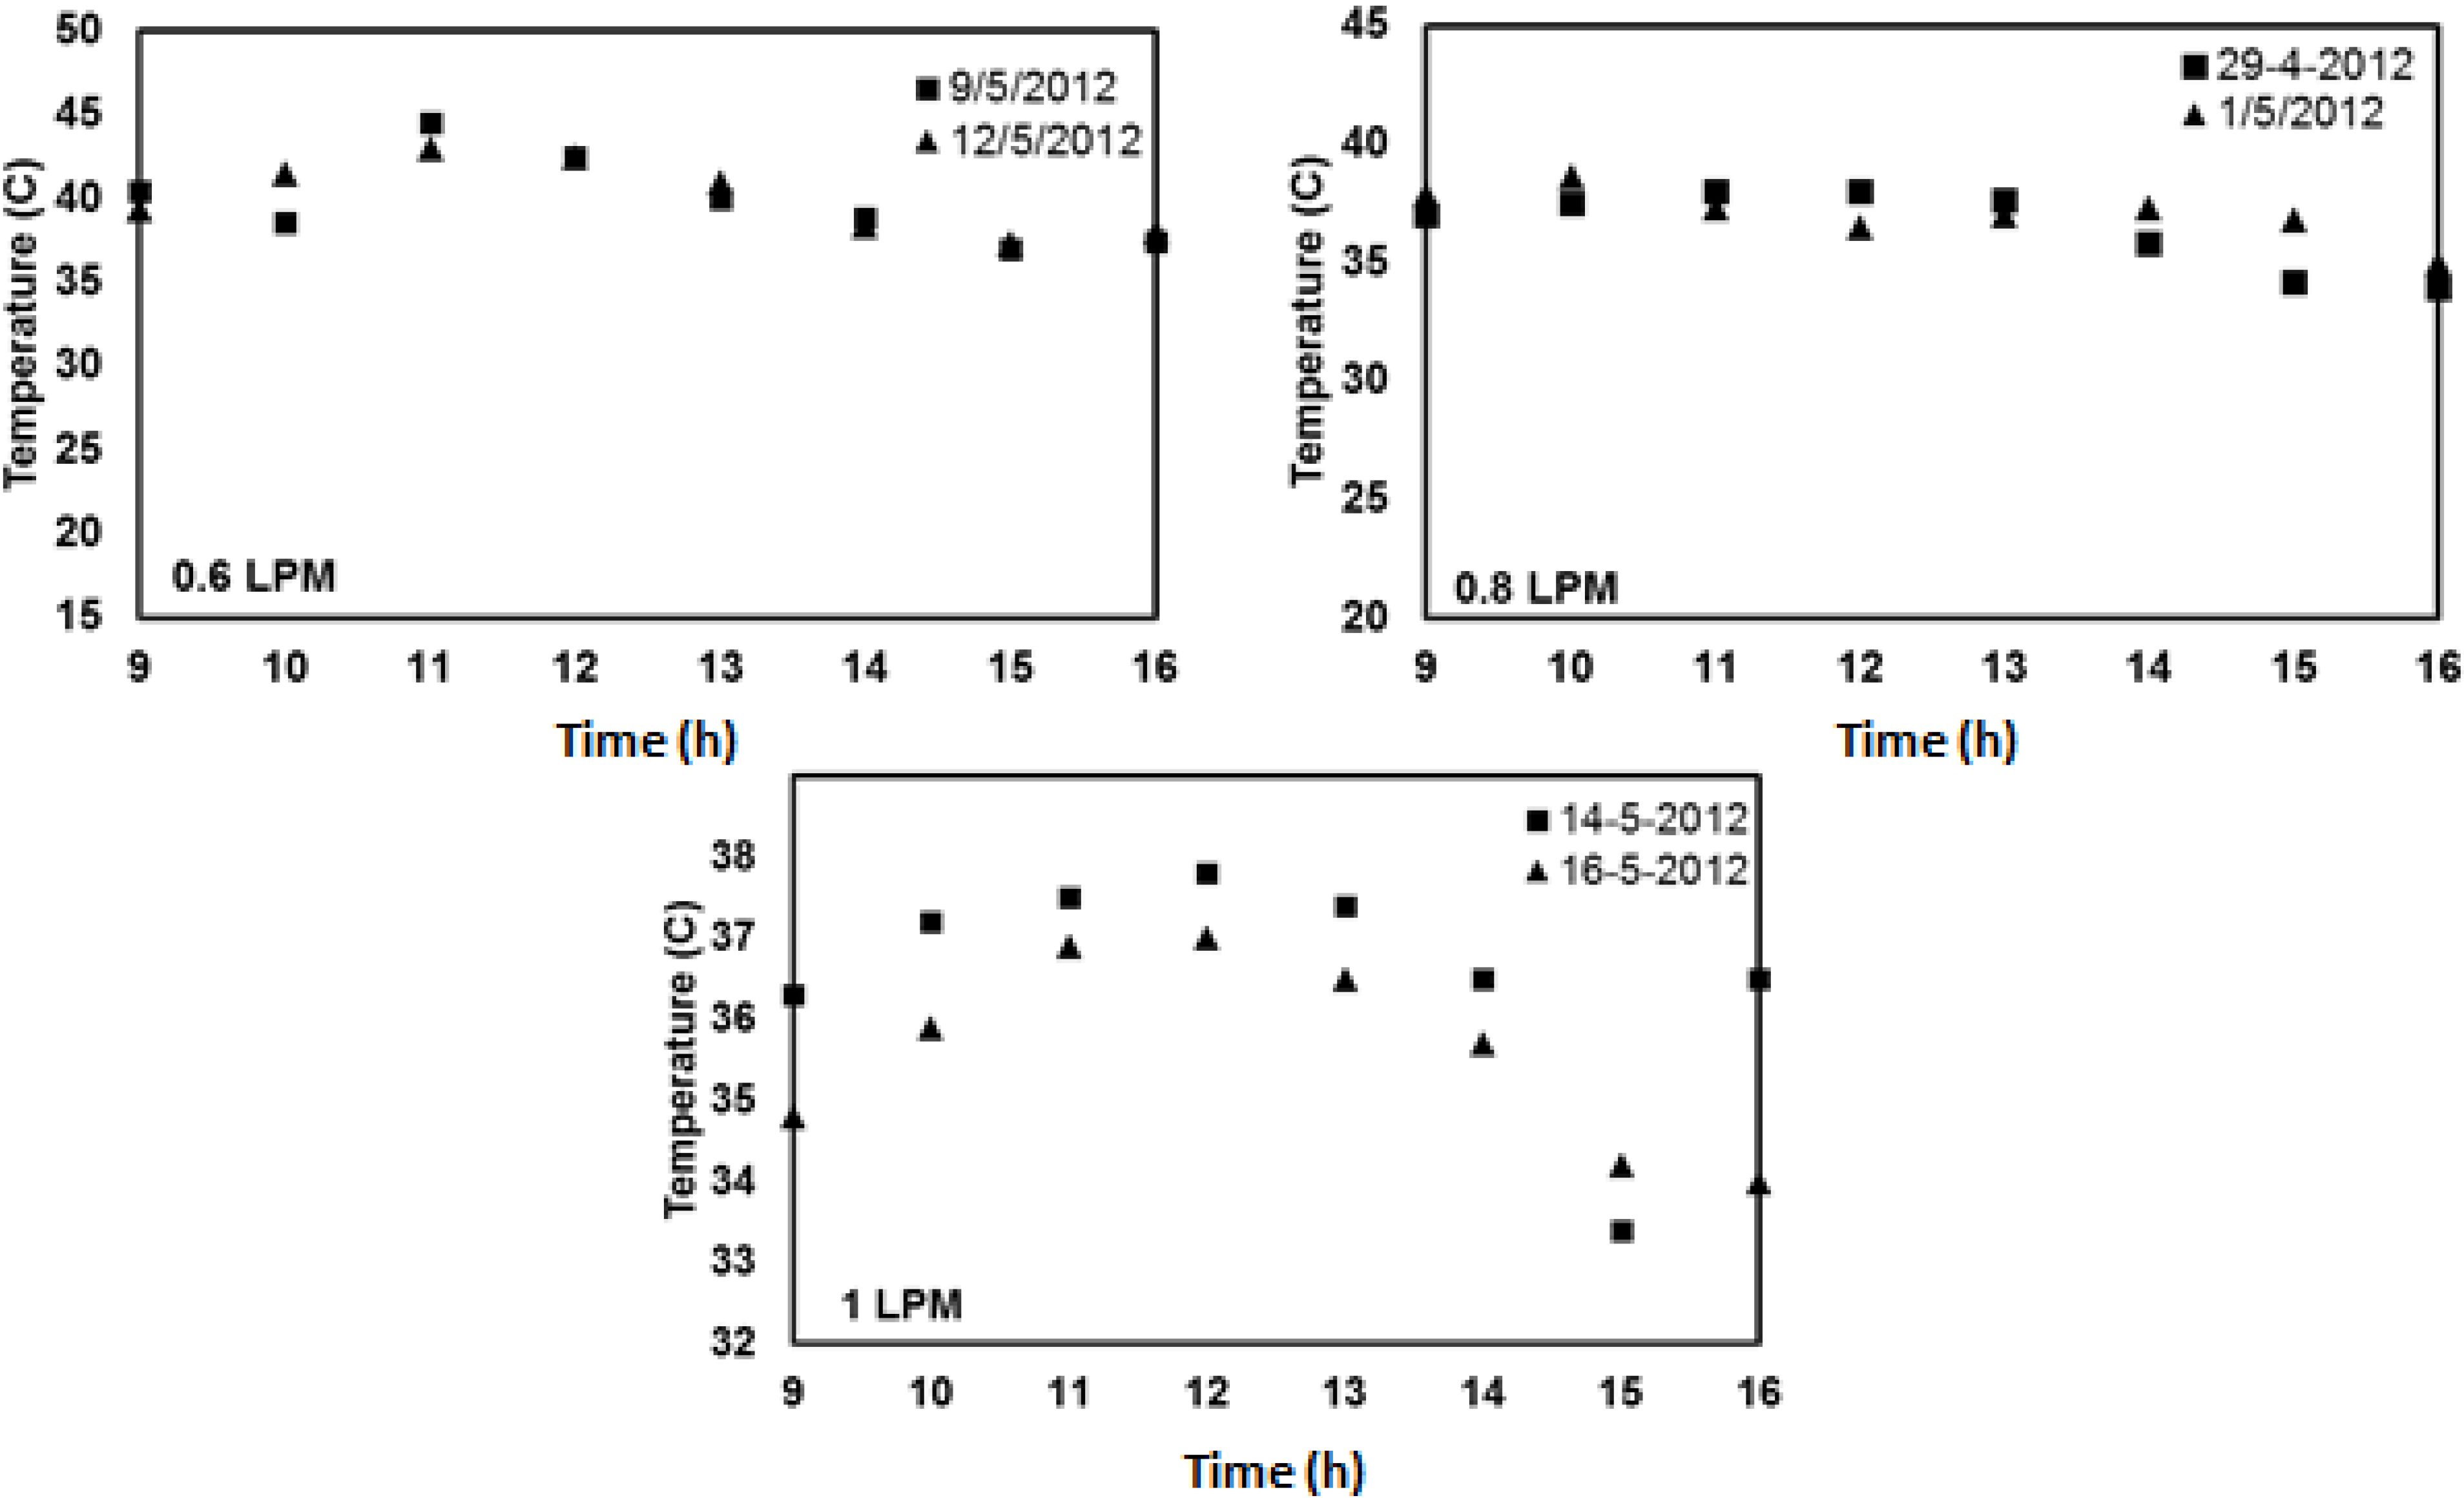
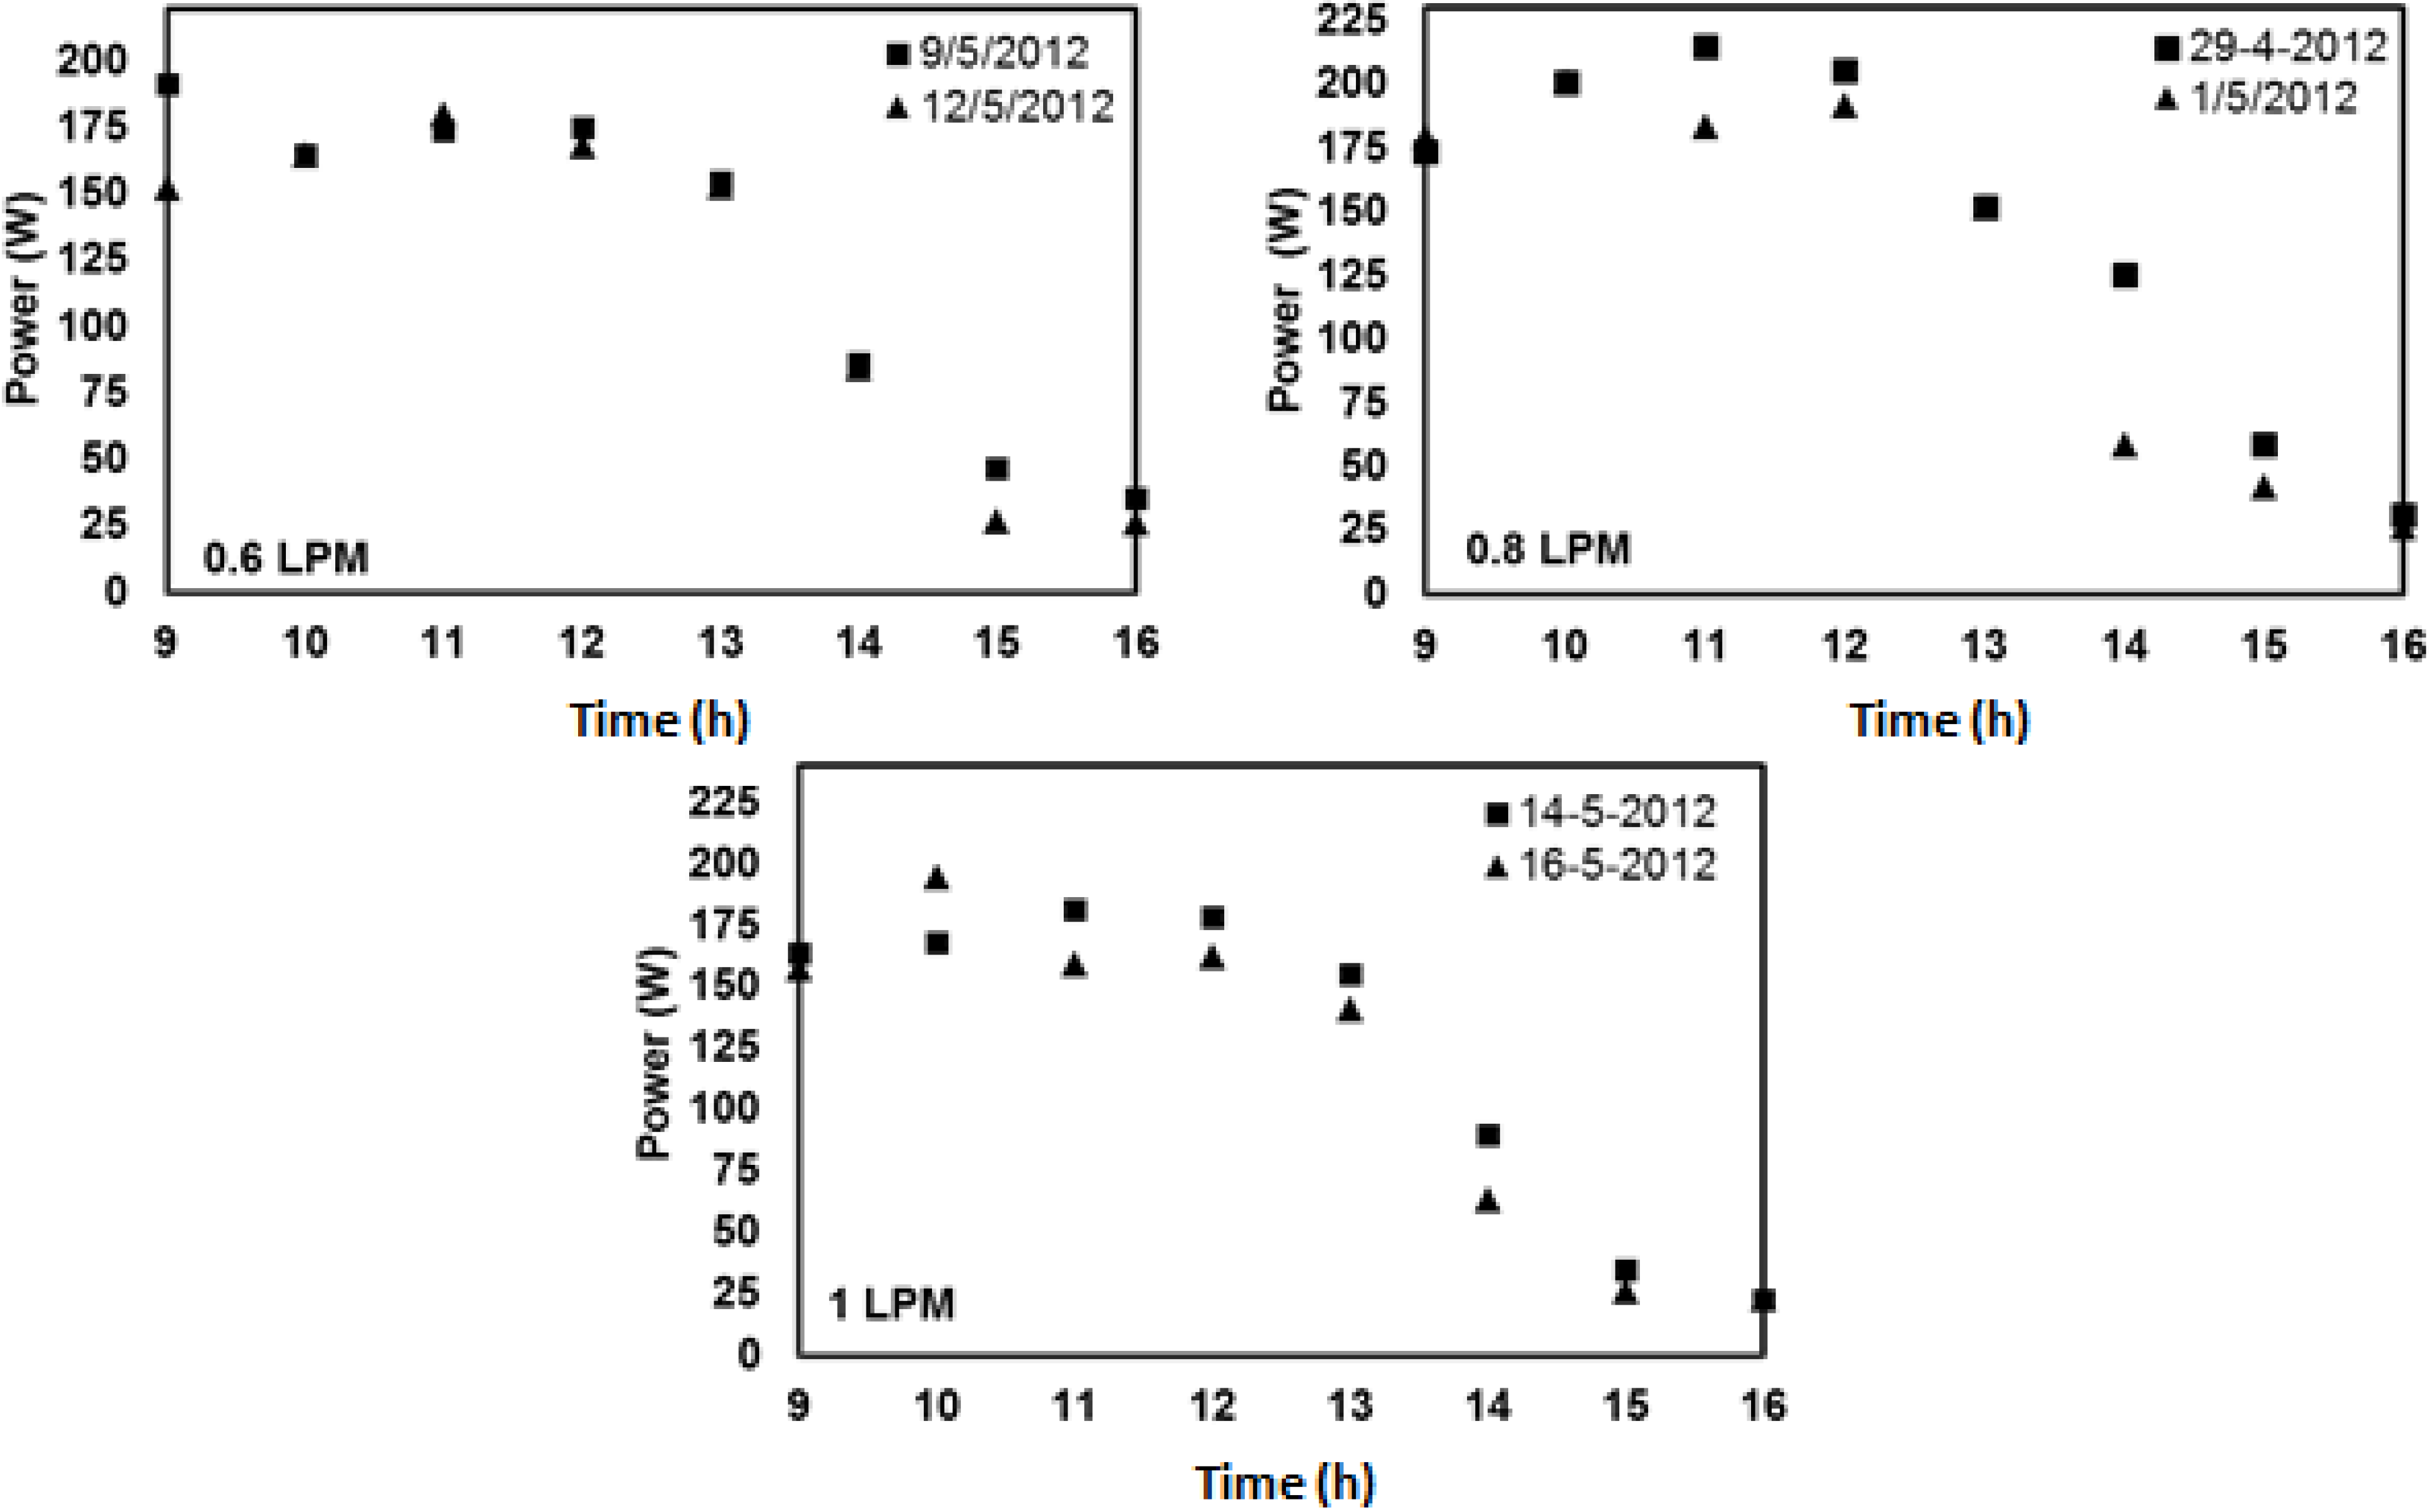
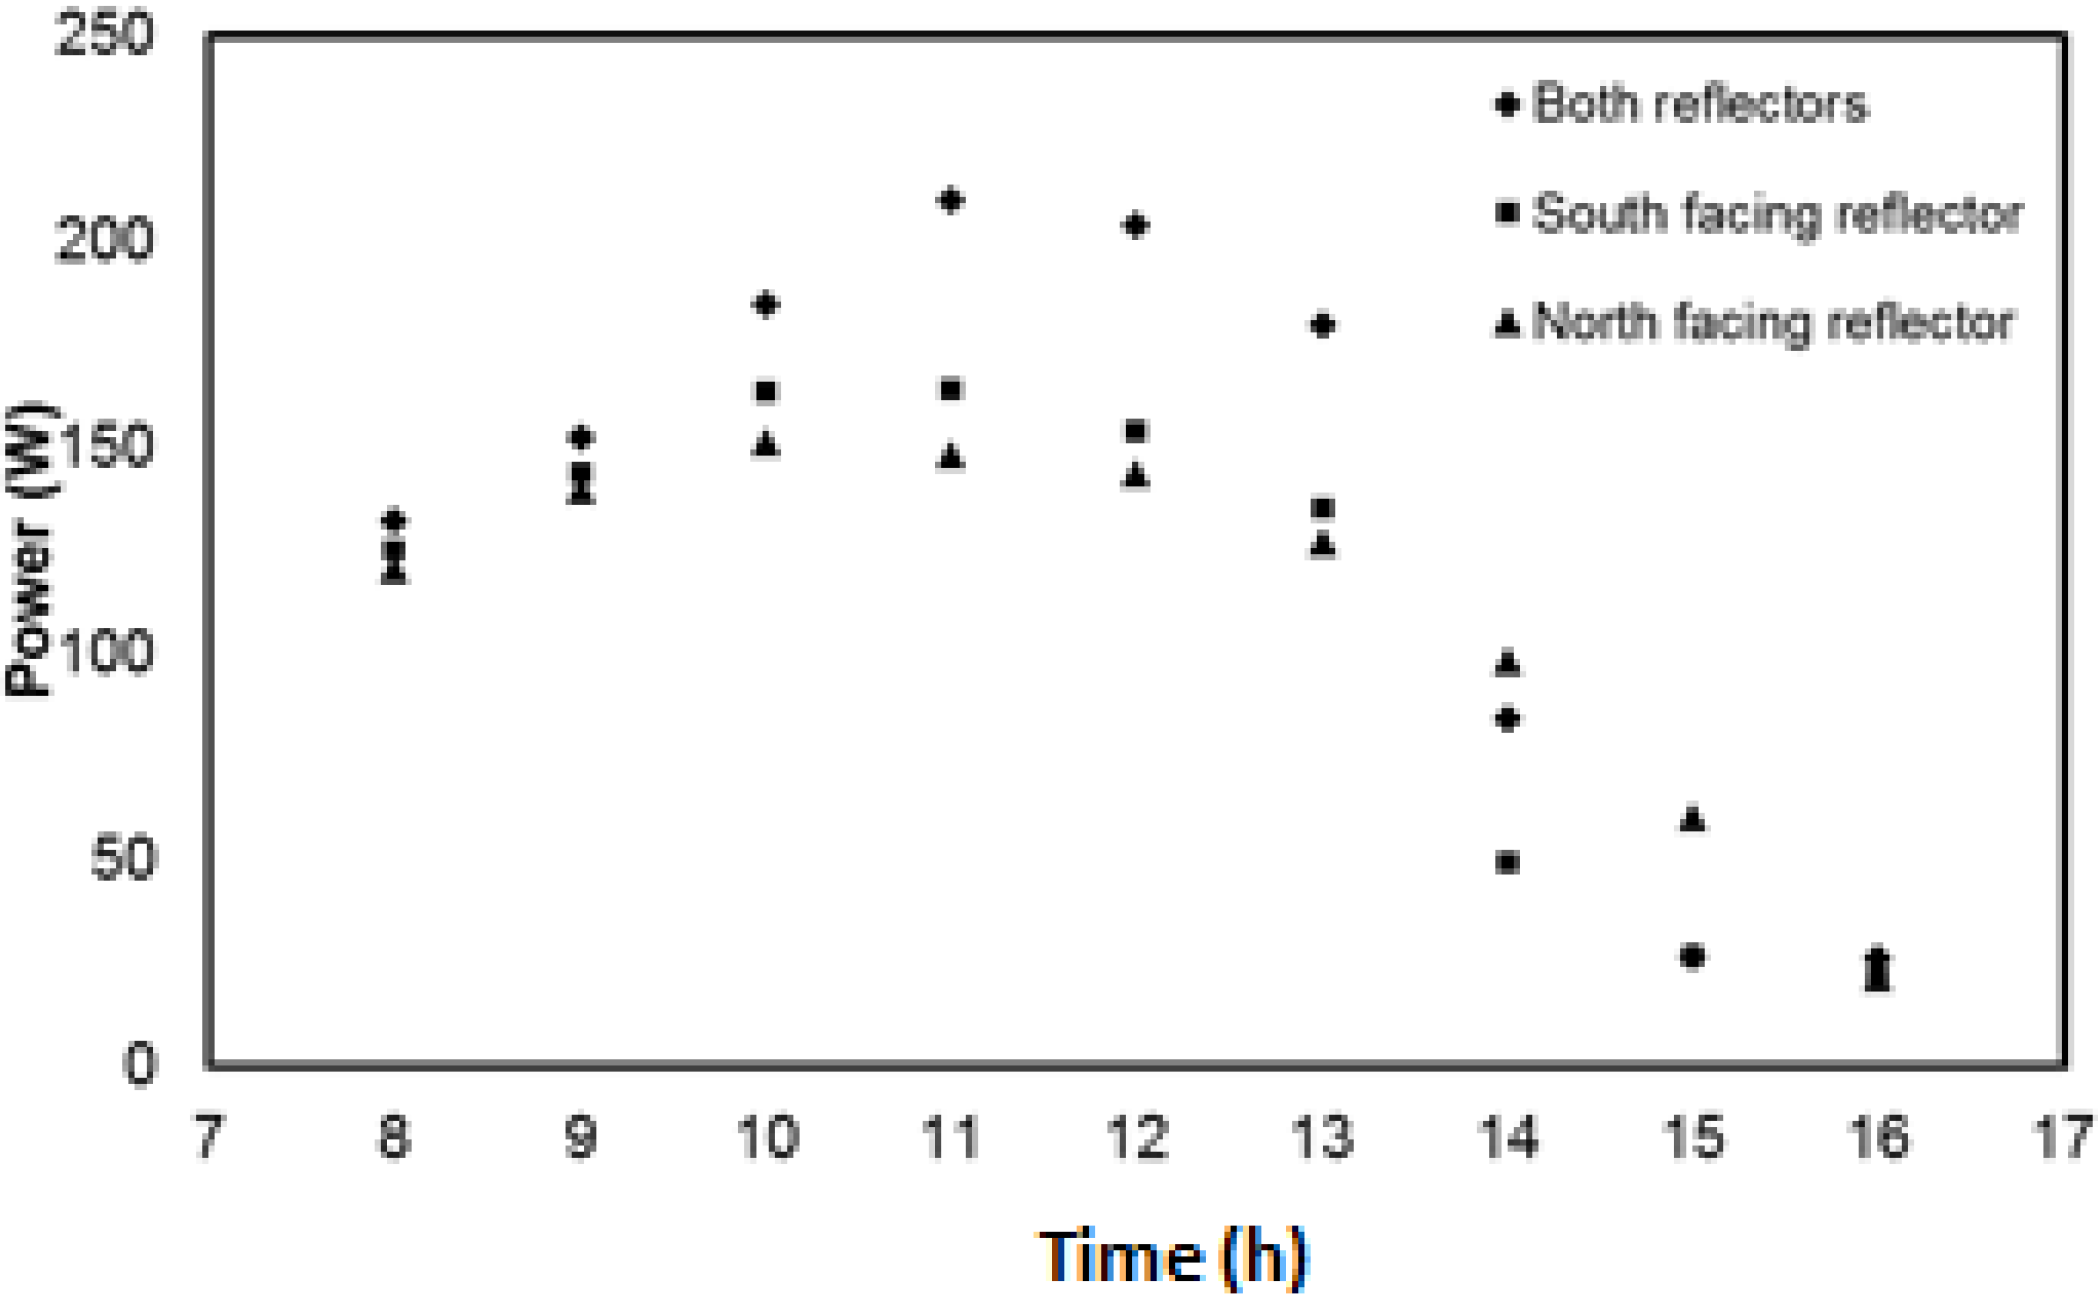
4.4. Experimental Results of V-Trough PV System

The effect of mass flow rate on the fluid outlet temperature, top surface temperature and maximum power was studied. The mass flow rate was varied from 0.6–1 LPM. Results obtained at 0.6 LPM showed that the maximum value of the outlet fluid temperature was obtained with this flow rate. It can be seen from Figure 17 that the front surface temperature was maximum in the case of 0.6 LPM.
Figure 17. Front panel temperature.
Energies 08 02803 g017
As the flow rate was increased the outlet fluid temperature decreased as the time for the fluid to extract more heat was reduced. As shown in Figure 18, the maximum outlet fluid temperature was observed at a mass flow rate of 0.6 LPM, whereas the minimum outlet temperature was observed at maximum flow rate, which in the present case was 1.0 LPM.
Figure 18. Outlet fluid temperature.
Energies 08 02803 g018
In order to find the optimum mass flow rate, the maximum power output from the panel was recorded on test days. Figure 19 shows the variation of power output with time at different flow rates. It was observed that the maximum power output is achieved at the mass flow rate of 0.8 LPM. At 0.6 LPM and 1 LPM almost similar trends were observed. Therefore it is concluded that the optimum flow rate for achieving the maximum power is 0.8 LPM.
Figure 19. Power output from V-trough PV system.
Energies 08 02803 g019
The effect of each reflector in the V-trough PV system was also studied with the help of this experimental setup. Figure 20 shows the contribution of each reflector on the performance of V-trough PV system. It is observed that the south facing reflector has more contribution as compared to the north facing reflector. The angle of the reflector is an important parameter in deciding the amount of concentration. The angle for the south facing reflector was 50° which couldn’t be increased to 60° due to limitations of the experimental setup. The results show that limiting angle for the north facing reflector was 60°. If the angle of the north facing reflector is decreased from 60°, all the reflected beams of the solar radiation strike the south facing reflector and were reflected out of the system. Therefore from this analysis it is concluded that the angles of both the reflectors are very important in determining the amount of increase in the concentration. It was found that when the south facing reflector was applied alone, there was shading in the later part of the day. In the case of the north facing reflector, there was no shading throughout the day. Therefore a north facing reflector alone can be used as compared to a south facing reflector.
Figure 20. Comparison of both reflectors power output.
Energies 08 02803 g020

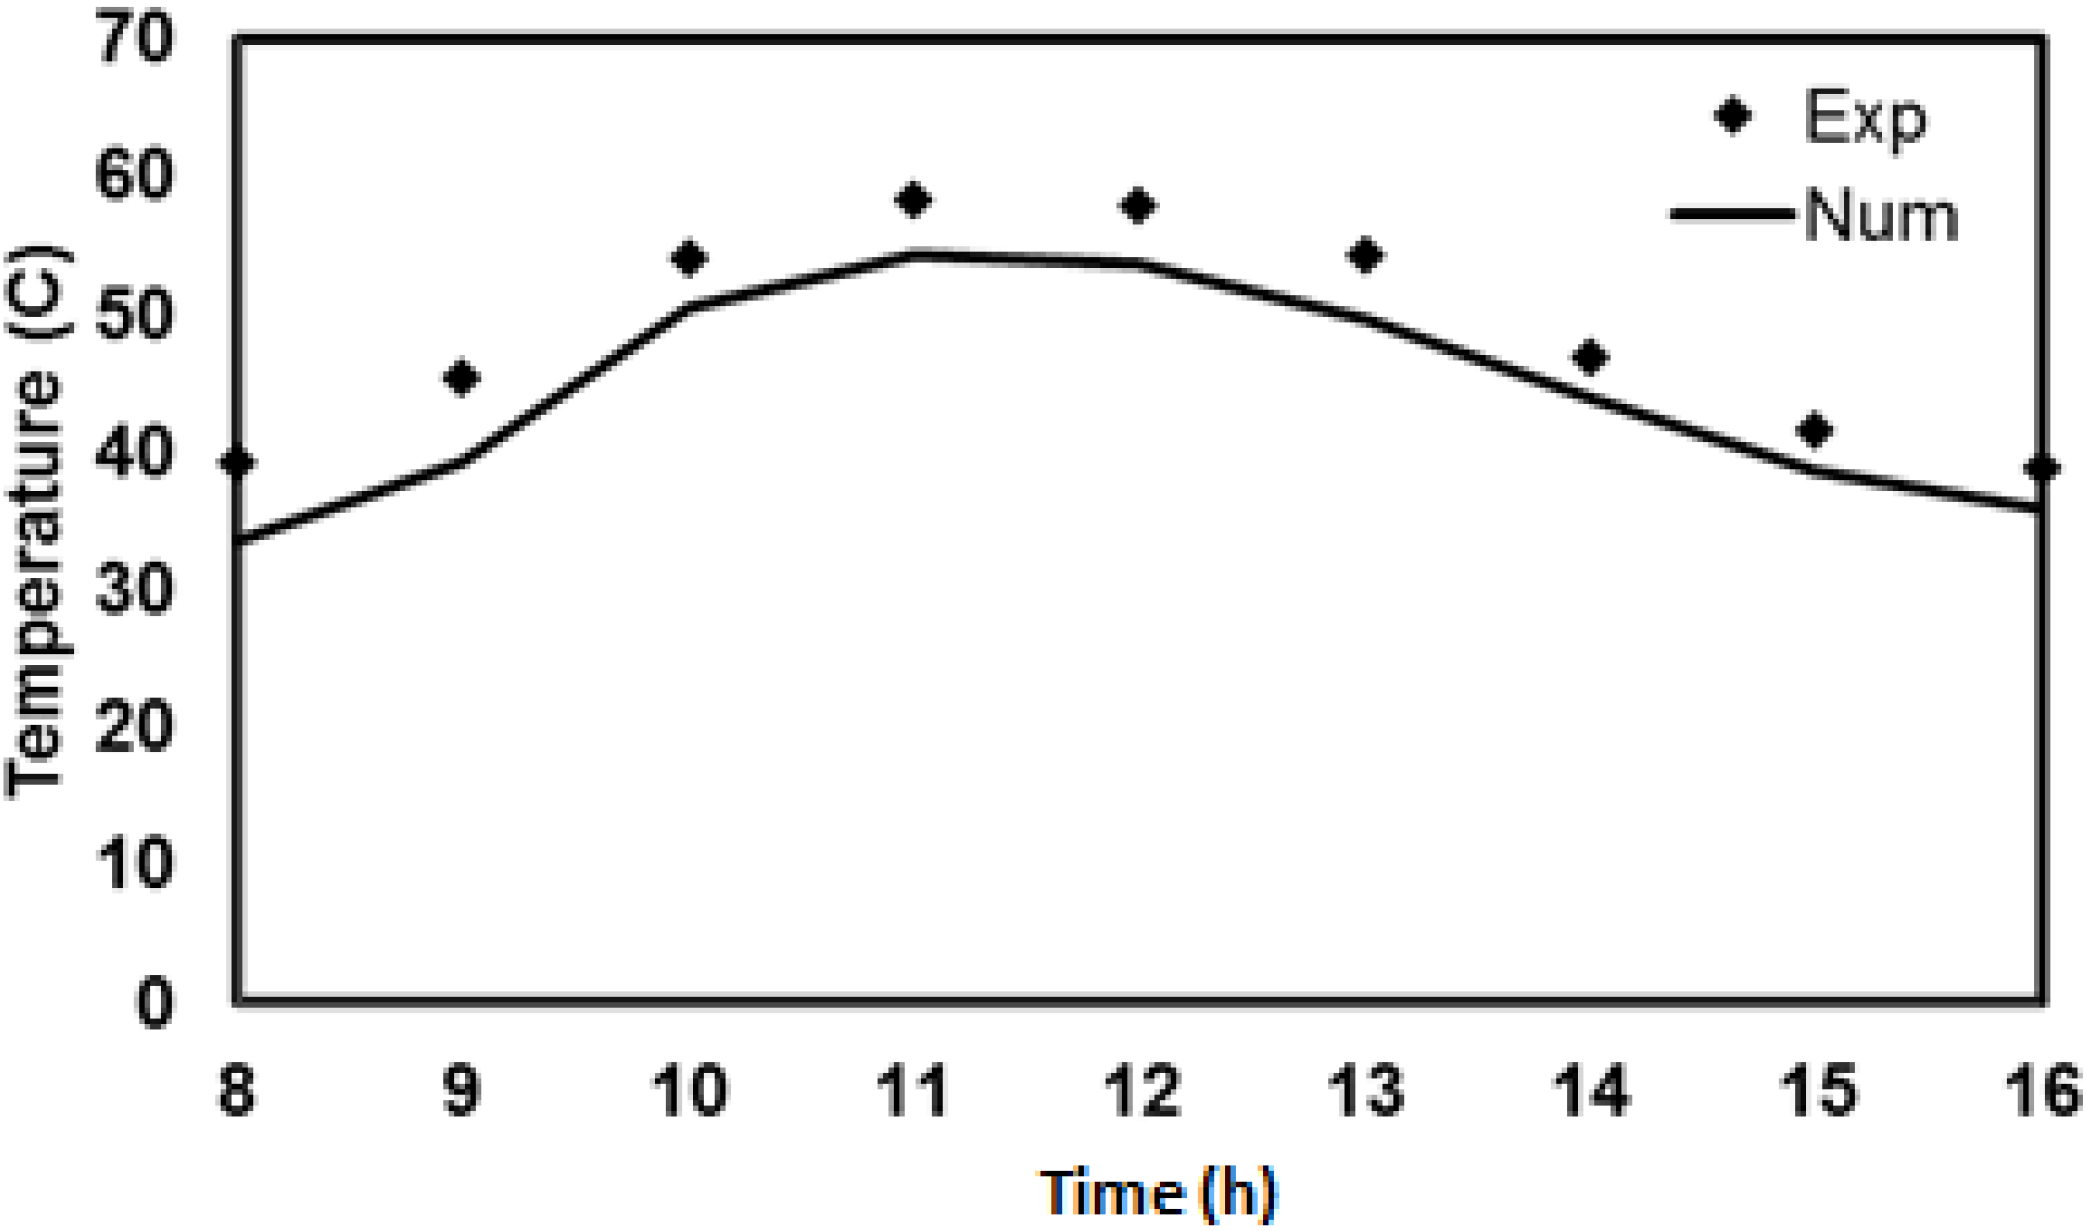
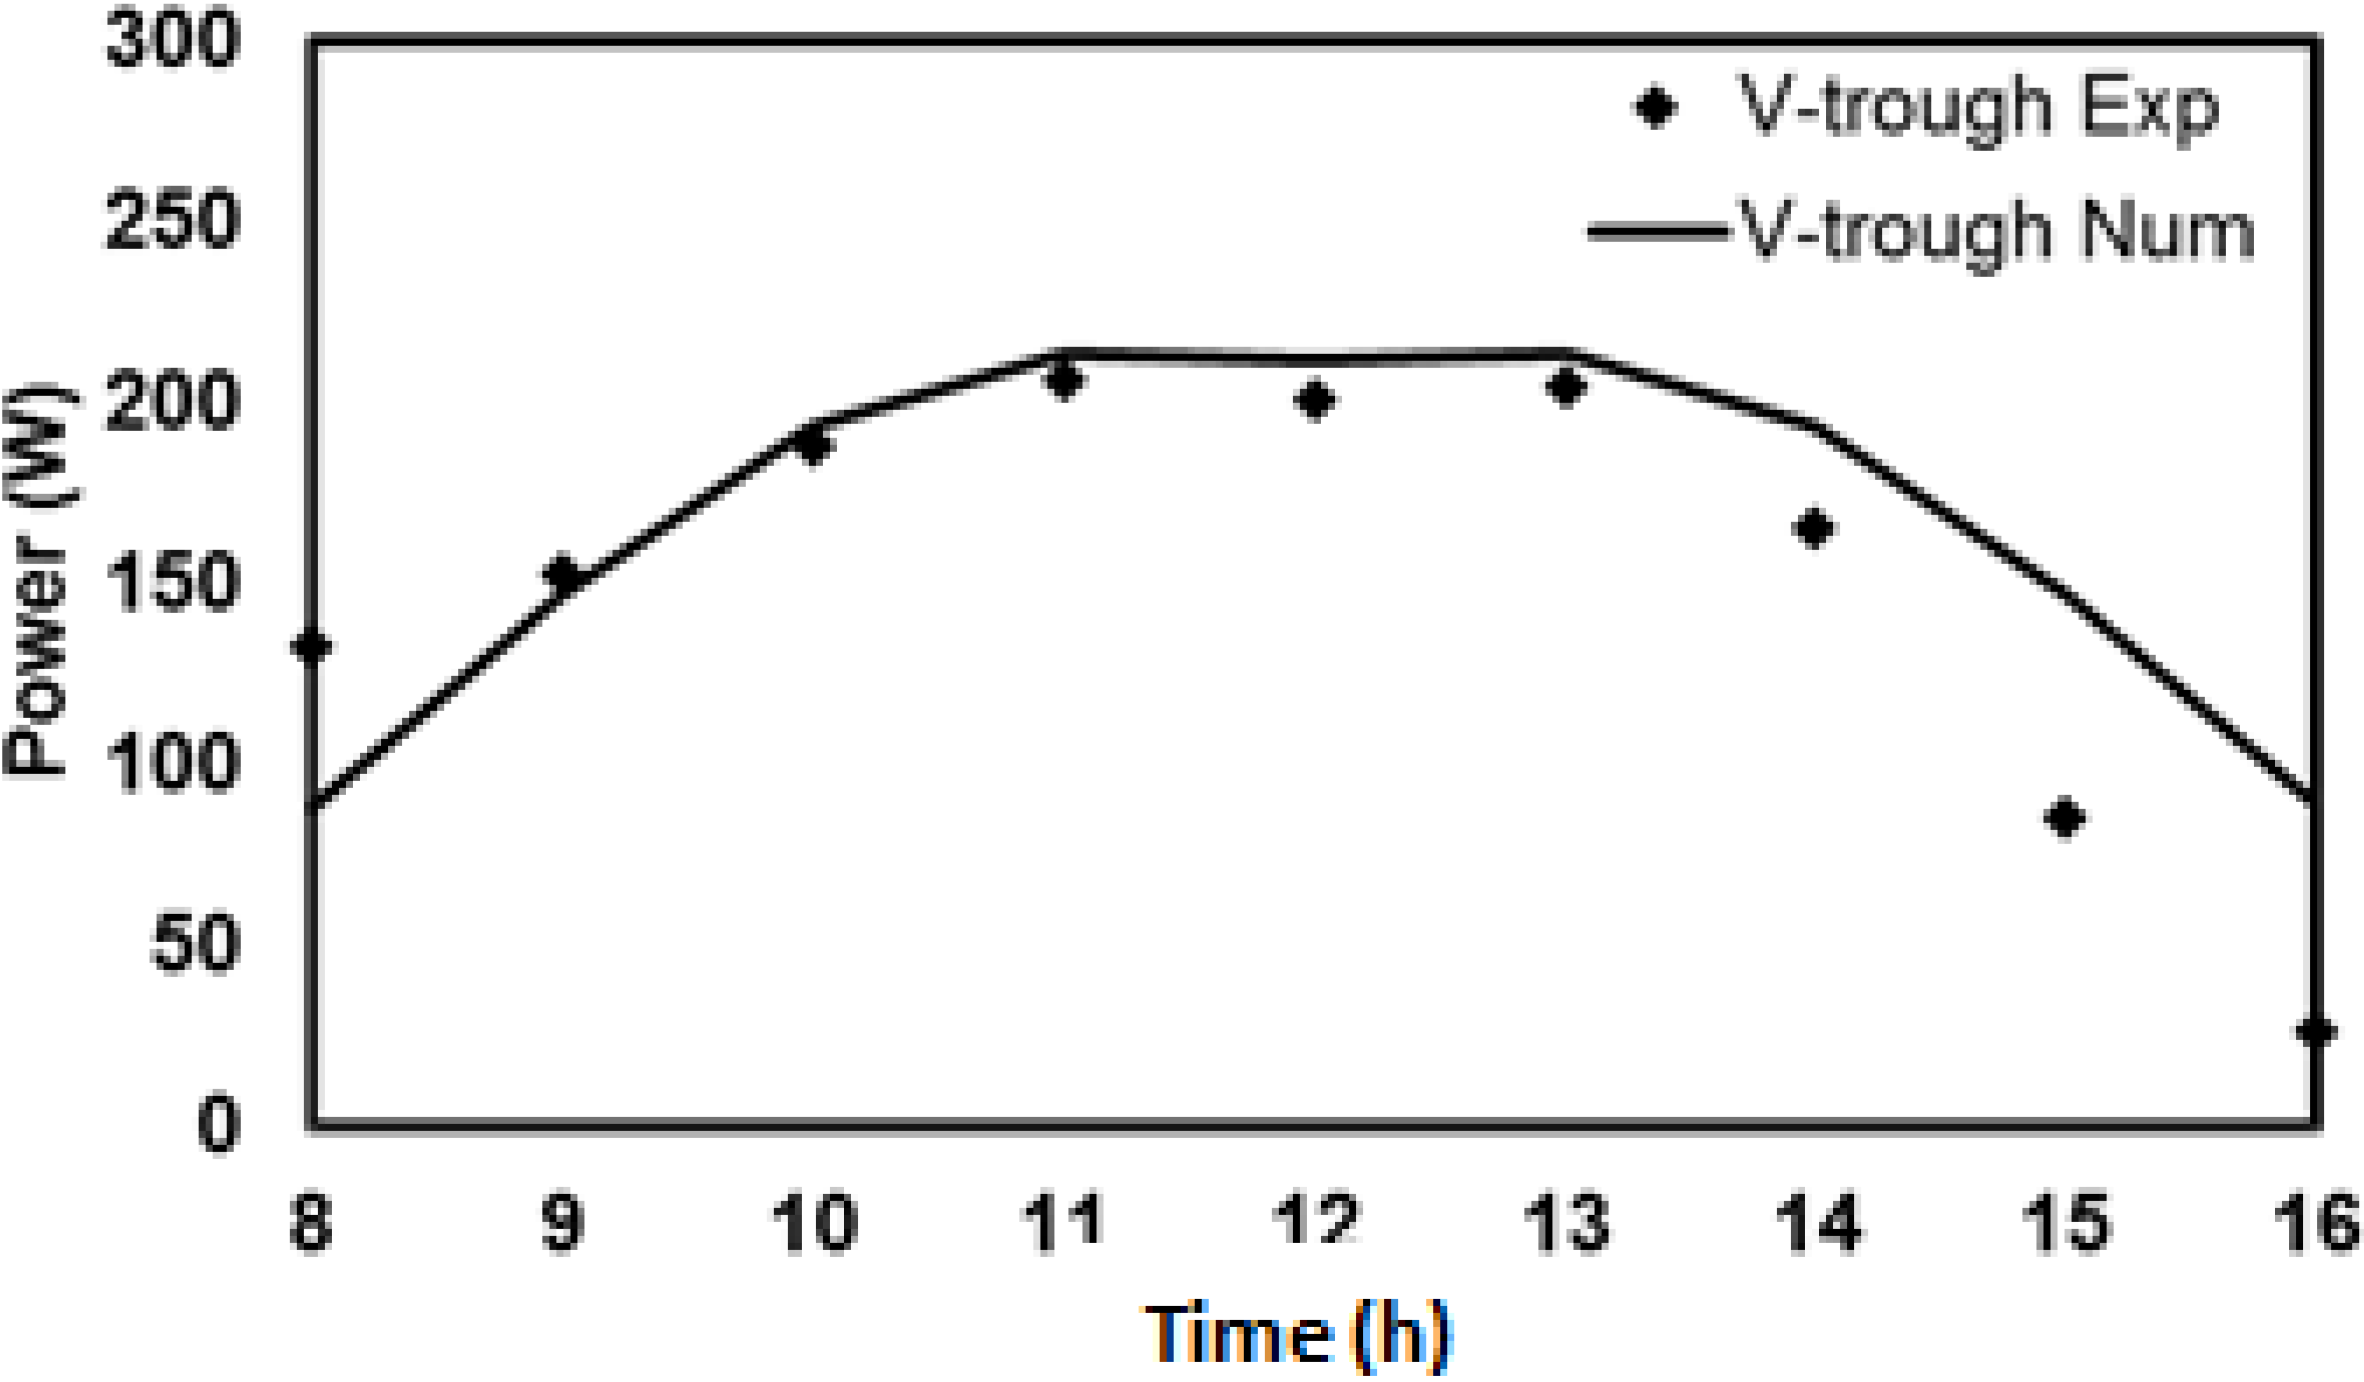
4.5. Comparison of Experimental and Numerical Results for V-Trough PV System

The numerical results obtained were validated with the experimental data from the tests conducted at KFUPM in the month of June, 2012. Figure 21 shows the comparison of numerical and experimental results of maximum power for the V-trough PV system. The measured power output matches fairly well with the numerical result in the first half of the day, i.e., from 8 am to 1 pm as shown in Figure 21. After 2 pm the south facing reflector caused shading due to which the power suddenly dropped. In the experimental setup the slope of the V-trough PV system and the reflectors was not very flexible. There were some constraints due to which the slope of the reflectors and the panel couldn’t be varied much. It was found that this sudden drop in power can be avoided by changing the orientation and the slope of the panel and the reflectors.
Figure 21. Comparison of power by numerical and experimental values.
Energies 08 02803 g021
Numerical modeling of V-trough PV system involves the estimation of the amount of energy absorbed by using simple planar reflectors. The model used in the current case assumes a constant flux distribution from the planar reflectors onto the panels. Figure 22 shows the comparison of cell temperature between the numerically predicted values and the experimentally measured values. Results from the numerical model follow the same trend as measured experimentally. This shows that there is a fairly good agreement between the numerical and experimental results.
Figure 22. Comparison of cell temperature by numerical and experimental values.
Energies 08 02803 g022

5. Conclusions

In this study technical and photovoltaic-cell quality comparisons were made between a common PV panel and a V-trough PV system. The purpose of this study was to determine the superiority of the V-trough PV concentrating technology over simple PV panels. A combined optical, thermal and electrical model was developed which predicted the characteristic curves of the V-trough PV system. A PV integrated with a V-trough can serve as a good means of enhancing the electrical efficiency of the PV system by using low cost reflectors. Applying cooling enhanced the power output considerably and also the thermal gain of the V-trough PV system. The established steady state model predicted the thermal performance of V-trough PV system with and without cooling. Both the thermal and electrical performance of the collector were presented and discussed. The results showed that by applying cooling the power of the simple PV panel was increased by 22.8% and for the V-trough by 31.5%. The comparisons showed good agreement between the experimental and numerical values. It was concluded from the results that a V-trough PV system has more benefits than the normal flat PV system and hence, V-trough PVs are recommended for greater electric power output.

Acknowledgments

The author(s) would like to acknowledge the support provided by King Abdulaziz City for Science and Technology (KACST) through the Science & Technology Unit at King Fahd University of Petroleum & Minerals (KFUPM) for funding this work through Project No. 10-ENE1376-04 as part of the National Science, Technology and Innovation Plan.

Nomenclature

Cp
Specific heat capacity (kJ/kg K)
G
Solar radiation intensity (W/m2)
hT
Conductive heat transfer coefficient (W/m2K)
I
Current (A)
IL
Light generated current (A)
Io
Extraterrestrial radiation intensity (W/m2)
A
Diode reverse current (A)
IT
Total incident solar radiation intensity (W/m2)
k
Boltzmann’s constant (J/K)
Kτα
Incidence angle modifier
M
Air mass modifier
mass flow rate (kg/s)
N
number of cell
q
electronic charge (C)
R
Resistance (Ω)
Rb
Geometric factor
S
Absorbed radiation intensity (W/m2)
T
Temperature (°C or K)
T ¯ f
Mean fluid temperature (°C)
Ut
Heat transfer coefficient (W/m2K)
V
Voltage (V)

Greek Symbols

α
solar altitude angle
β
slope of V-trough PV
τα
transmissivity absorptance product
ρAl
reflectivity of aluminum
α1
angle of reflector 1
α2
angle of reflector 2
φ
latitude
δ
solar declination angle
ω
hour angle
μIsc
temperature coefficient of short circuit current (A/K)
ρg
ground reflectivity
ϵ
Emissivity

Subscripts

a
Ambient
b
Beam
bs
Backsheet
bsf
back sheet to fluid
c
Cell
cbs
cell to backsheet
cg
cell to glass
d
Diffuse
f
Fluid
fa
fluid to ambient
g
ground reflected
ga
glass to ambient
oc
open circuit
ref
Reference
ref,r1
reflector 1
ref,r2
reflector 2
s
Series
sc
short circuit
sh
Shunt
tot
Total

Author Contributions

Dr. Haitham M. Bahaidarah and Dr. P. Gandhidasan conceptualize the idea of this research project. These two and the Mr. Bilal Tanweer developed the proposal to the funding body. The reviewers’ comments were incorporated by all the four authors. Finally the project was awarded the funding. Drs. Haitham M. Bahaidarah, P. Gandhidasan and Shafiqur Rehman designed the experimental setup and procured the equipment and the material required for the experimental work. The fabrication and integration of the experimental setup was mostly carried out by the M. S. student Mr. Bilal Tanweer and supervised by Dr. Haitham and Dr. Gandhidasan. The experimental runs were made by the student and the data was obtained. The data was analyzed by the team. The paper was written by all the authors with different degree of contribution.

Conflicts of Interest

The authors declare no conflict of interest.

References

  1. Irshid, M.I.; Othman, M.O. V-Troughs with high concentration ratios for photovoltaic concentrator cells. Sol. Cells 1988, 23, 159–172. [Google Scholar] [CrossRef]
  2. Chiam, H.F. Bi-yearly adjusted V-trough concentrators. Sol. Energy 1982, 28, 407–412. [Google Scholar] [CrossRef]
  3. Kandilli, C. Performance analysis of a novel concentrating photovoltaic combined system. Energy Convers. Manag. 2013, 67, 186–196. [Google Scholar] [CrossRef]
  4. Mittelman, G.; Kribus, A.; Dayan, A. Solar cooling with concentrating photovoltaic/thermal (CPVT) systems. Energy Convers. Manag. 2007, 48, 2481–2490. [Google Scholar] [CrossRef]
  5. Li, M.; Li, G.L.; Ji, X.; Yin, F.; Xu, L. The performance analysis of the trough concentrating solar photovoltaic/thermal system. Energy Convers. Manag. 2011, 52, 2378–2383. [Google Scholar] [CrossRef]
  6. Kumar, S.; Tiwari, A. Design, fabrication and performance of a hybrid photovoltaic/thermal (PV/T) active solar still. Energy Convers. Manag. 2010, 51, 1219–1229. [Google Scholar] [CrossRef]
  7. Calise, F.; Dentice d’Accadia, M.; Vanoli, L. Design and dynamic simulation of a novel solar trigeneration system based on hybrid photovoltaic/thermal collectors (PVT). Energy Convers. Manag. 2012, 60, 214–225. [Google Scholar] [CrossRef]
  8. Gang, P.; Huide, F.; Jie, J.; Tin-tai, C.; Tao, Z. Annual analysis of heat pipe PV/T systems for domestic hot water and electricity production. Energy Convers. Manag. 2012, 56, 8–21. [Google Scholar] [CrossRef]
  9. Ammar, M.B.; Chaabene, M.; Chtourou, Z. Artificial neural network based control for PV/T panel to track optimum thermal and electrical power. Energy Convers. Manag. 2013, 65, 372–380. [Google Scholar] [CrossRef]
  10. Zhao, X.; Zhang, X.; Riffat, S.B.; Su, Y. Theoretical study of the performance of a novel PV/e roof module for heat pump operation. Energy Convers. Manag. 2011, 52, 603–614. [Google Scholar] [CrossRef]
  11. Rosell, J.I.; Vallverdu, X.; Lechon, M.A.; Ibanez, M. Design and simulation of a low concentrating photovoltaic/thermal system. Energy Convers. Manag. 2005, 46, 3034–3046. [Google Scholar] [CrossRef]
  12. Chemisana, D.; Ibáñez, M.; Rosell, J.I. Characterization of a photovoltaic–thermal module for Fresnel linear concentrator. Energy Convers. Manag. 2011, 52, 3234–3240. [Google Scholar] [CrossRef]
  13. Chemisana, D.; Ibáñez, M. Linear Fresnel concentrators for building integrated applications. Energy Convers. Manag. 2010, 51, 1476–1480. [Google Scholar] [CrossRef]
  14. Kribus, A.; Kaftori, D.; Mittelman, G.; Hirshfeld, A.; Flitsanov, Y.; Dayan, A. A miniature concentrating photovoltaic and thermal system. Energy Convers. Manag. 2006, 47, 3582–3590. [Google Scholar] [CrossRef]
  15. Martín, N.; Ruiz, J.M. Optical performance analysis of V-trough PV concentrators. Prog. Photovolt. Res. Appl. 2008, 16, 339–348. [Google Scholar] [CrossRef]
  16. Hermenean, I.S.; Diaconescu, D.V. On the geometric modelling of a concentrating PV-mirror system. Bull. Transilv. Univ. Brasov. 2009, 2, 73. [Google Scholar]
  17. Tina, G.M.; Scandura, P.F. Case study of a grid connected with a battery photovoltaic system: V-trough concentration vs. single-axis tracking. Energy Convers. Manag. 2012, 64, 569–578. [Google Scholar] [CrossRef]
  18. Reis, F.; Brito, M.C.; Corregidor, V.; Wemans, J.; Sorasio, G. Modeling the performance of low concentration photovoltaic systems. Sol. Energy Mater. Sol. Cells 2010, 94, 1222–1226. [Google Scholar] [CrossRef]
  19. Shaltout, M.A.M.; Ghettas, A.; Sabry, M. V-trough concentrator on a photovoltaic full tracking system in a hot desert climate. Renew. Energy 1995, 6, 527–532. [Google Scholar] [CrossRef]
  20. Sangani, C.; Solanki, C. Experimental evaluation of V-trough (2 suns) PV concentrator system using commercial PV modules. Sol. Energy Mater. Sol. Cells 2007, 91, 453–459. [Google Scholar] [CrossRef]
  21. Kostic, L.T.; Pavlovic, T.M.; Pavlovic, Z.T. Influence of reflectance from flat aluminum concentrators on energy efficiency of PV/Thermal collector. Appl. Energy 2010, 87, 410–416. [Google Scholar] [CrossRef]
  22. Yan, C.Q. Output characteristics study of V-trough PV concentration system. Appl. Mech. Mater. 2011, 71–78, 2077–2080. [Google Scholar] [CrossRef]
  23. Reis, F.; Brito, M.C.; Corregidor, V.; Wemans, J.; Sorasio, G. Ageing of standard PV module when integrated in a V-trough concentration system. MRS Proc. 2011, 1210, 1–6. [Google Scholar]
  24. Maiti, S.; Banerjee, S.; Vyas, K.; Patel, P.; Ghosh, P.K. Self regulation of photovoltaic module temperature in V-trough using a metal–wax composite phase change matrix. Sol. Energy 2011, 85, 1805–1816. [Google Scholar] [CrossRef]
  25. Solanki, C.; Sangani, C.; Gunashekar, D.; Antony, G. Enhanced heat dissipation of V-trough PV modules for better performance. Sol. Energy Mater. Sol. Cells 2008, 92, 1634–1638. [Google Scholar] [CrossRef]
  26. Anderson, T.N.; Künnemeyer, R.; Duke, M.; Carson, J.K. A combined optical, thermal and electrical performance model of a building integrated photovoltaic/thermal concentrator (BIPVTC). In Proceedings of the 18th Electronics New Zealand Conference, ENZCON 2011, Massey University, Palmerton North, New Zealand, 21–22 November 2011; pp. 107–112.
  27. Vilela, O.C.; Bione, J.; Fraidenraich, N. Simulation of grape culture irrigation with photovoltaic V-trough pumping systems. Renew. Energy 2004, 29, 1697–1705. [Google Scholar] [CrossRef]
  28. Kostić, L.T.; Pavlović, T.M.; Pavlović, Z.T. Optimal design of orientation of PV/T collector with reflectors. Appl. Energy 2010, 87, 3023–3029. [Google Scholar] [CrossRef]
  29. Duffie, J.A.; Beckman, W.A. Solar Engineering of Thermal Processes; John Wiley & Sons, Inc.: Hoboken, NJ, USA, 2013. [Google Scholar]
  30. Stutenbaeumer, U.; Mesfin, B. Equivalent model of monocrystalline, polycrystalline and amorphous silicon solar cells. Renew. Energy 1999, 18, 501–512. [Google Scholar] [CrossRef]

