Article

Wind Integration into Energy Systems with a High Share of Nuclear Power—What Are the Compromises?

Laboratory of Energy Efficiency and Systems, Department of Energy Technology, Aalto University, P.O. Box 14100, FI-00076 Aalto, Finland
*
Author to whom correspondence should be addressed.
Energies 2015, 8(4), 2493-2527; https://doi.org/10.3390/en8042493
Submission received: 21 November 2014 / Revised: 4 March 2015 / Accepted: 19 March 2015 / Published: 31 March 2015

Abstract

:
Towards low-carbon energy systems, there are countries with ongoing plans for expanding their nuclear power capacity, and simultaneously advancing the role of variable renewable energy sources (RES), namely wind and solar energy. This crossroads of capital-intensive, baseload power production and uncontrollable, intermittent RES may entail new challenges in the optimal and economic operation of power systems. This study examines this case by hourly analysis of a national-level energy system with the EnergyPLAN modeling tool, coupled with wind integration simulations (including uncertainty) implemented using MATLAB. We evaluate the maximum feasible wind integration under different scenarios for nuclear power plants, energy demand, and the flexibility of energy infrastructure for a real case study (Finland). We propose wind-nuclear compromise charts to envision the impact of any mix of these two technologies on four parameters: total costs, power exchange, carbon emissions, and renewable energy integration. The results suggest that nuclear power constrains the room for maximum uptake of wind energy by a descending parabolic relationship. If nuclear power production exceeds 50% of the total power demand, wind will be unlikely to penetrate in shares over 15% of the respective demand. Moreover, we investigate the role of four flexibility options: demand side management, electrical energy storage, smart electric heating, and large-scale heat pumps (backed with thermal energy storage). Heat pumps (which are in connection with combined heat and power (CHP) and district heating systems) offer the highest efficiency in balancing excess power from variable RES. However, power-to-heat options offer a limited capability for absorbing high-level excess power, as oversupply arises mainly in the periods with relatively low demand for heat. This calls for longer-term energy storage and/or other flexibility options to achieve the planned targets in wind-nuclear scenarios.

Graphical Abstract

1. Introduction

National energy systems are on the threshold of a new transition era. The growth in integration of intermittent renewable energy sources (RES) has challenged the optimal operation of conventional power systems, demanding a more flexible energy infrastructure. The expansion of competitive electricity markets with a marginal cost pricing mechanism introduces volatile prices and an uncertain horizon for the investment on new generation capacity. On the other hand, more stringent environmental policies call for an adequate support for the promotion of renewable or carbon-free energy. Meanwhile, energy security and energy self-sufficiency should not be neglected. The world energy outlook (2014), published by International Energy Agency (IEA), estimates that the share of variable RES, namely wind and solar PV, will reach 23% of the total electricity generation in the EU by 2040 [1]. The EU Energy Roadmap aims to mitigate the greenhouse gas emissions by over 80% by 2050 (compared to 1990) [2]. The EU States are hence obliged to consider a wider array of decarbonization options to accomplish the outlined targets (e.g., bioenergy, hydropower, or nuclear power).
According to the International Atomic Energy Agency (IAEA) [3], China, Finland, India, the Republic of Korea, the Russian Federation, Pakistan, and the USA are the countries with “nuclear units under construction and more proposed plans for the future”. In some countries, the new constructions (or the planned units) will constitute a high share of nuclear capacity (e.g., France, Finland, the UK), which intersects the ambitious national (variable) renewable energy plans. For instance, in addition to the current installed capacity of 5.4 GW solar PV, France is to boost the capacity of wind up to 25 GW by 2020 (in a power system with 63 GW nuclear capacity and 100 GW peak demand) [4]. Finland is one of the OECD (Organization for Economic Co-operation and Development) countries with ongoing plans to expand the nuclear power capacity. Nuclear energy is the main pillar of the baseload power supply in Finland, constituting one-third of the annual domestic power production [5]. Two new nuclear power plants (NPPs) are expected to enter the grid in the next decade making nuclear responsible for 60% of the annual electricity supply for a short period, before the present nuclear power plants will be decommissioned [6]. On the other hand, Finland’s Environmental Policy seeks to enhance the share of wind up to 10% of the annual demand by 2025 [7]. This study aims to examine this intersection with an overview of the main deciding parameters on a national-level basis.
Considering wind integration in the power systems with a high share of nuclear, Alonso and Valle [8] has contrasted the role of wind with nuclear power as two competing alternatives in Spain. They discover that nuclear could cut a greater deal of carbon emissions with lower electricity generation costs compared with wind. In [9], the integration of renewable-based electricity (RES-E) for the replacement of NPPs in Germany is examined, concluding that the expansion of power grid and the provision of balancing power might be the main barriers in this regard. Gota et al. [10] has employed hourly energy system analysis to study the reduction of nuclear power capacity in Romania, replaced by fluctuating RES. They highlighted lower power exports and the need for energy storage (or other flexibility measures) as two drawbacks of such substitution plans. The study of simultaneous integration of wind and large nuclear capacity is not widely discussed in the literature. Shropshire et al. [11] hypothesizes the combination of flexible small and medium-sized reactors (SMR) in integrating wind by employing a virtual power plant. However, in this contribution, we examine the case of a typical nuclear fleet employed as large-scale baseload power plants. We examine the case of Finland as a country with a high share of nuclear, ambitious plans for wind, and a continuous dependency on power imports. The aim is to demonstrate the techno-economic circumstances of high-level wind integration in a real energy system, and to explore remedies for those undesirable consequences. The results are however applicable to other cases with similar conditions.
The impact of large-scale wind penetration on a power system has been subject for a wide spectrum of researches in the literature; on the need for operating reserves [12], unit commitment [13], balancing power [14], and transmission system planning [15]. This study aims to investigate this impact on the entire energy system in an integrated method by considering the potential of both heat and power sectors in absorbing fluctuating RES intersected with the nuclear power. First, by the aid of the EnergyPLAN modeling tool, we build a comprehensive model of the national energy system with hourly time resolutions to capture the details in heat and power production/consumption. Next, we model the future wind integrations with MATLAB to create time series of wind variations for different installed capacities in an adequate detail. Different scenarios are then analyzed based on growth in power demand, power exchange possibilities, and the share of nuclear. Finally, under high levels of wind and nuclear, we quantify the magnitude and time of possible excess power as well as the respective flexibility requirements. Different solutions are compared in dealing with the variability of wind, including cross-border power transmission, energy storage, demand side management, and the electrification of heat sector by large-scale heat pumps (LHP) or on-call electric boilers. We also explore compromises in the optimal mix of wind-nuclear based on five different criteria: maximum wind penetration, total costs, carbon emissions, share of RES, and self-sufficiency in the power supply.
The remainder of this contribution is structured in five Sections. Section 2 demonstrates the methodology applied for the modeling of an energy system, modeling of high-level wind integrations, and a short note on wind uncertainties. The case study is introduced in Section 3 with the input data and modeling paradigm. The results are presented and discussed in Section 4 and Section 5, followed by the concluding remarks and recommendations in Section 6. This study remains silent about the societal aspects, geopolitical views, welfare effects, hazards and risks and disposal problems, and a robust environmental impact (land use, visual impacts, etc.) of the examined technologies. The other limitations of this contribution are highlighted in more details in Section 2.2.

2. Methodology

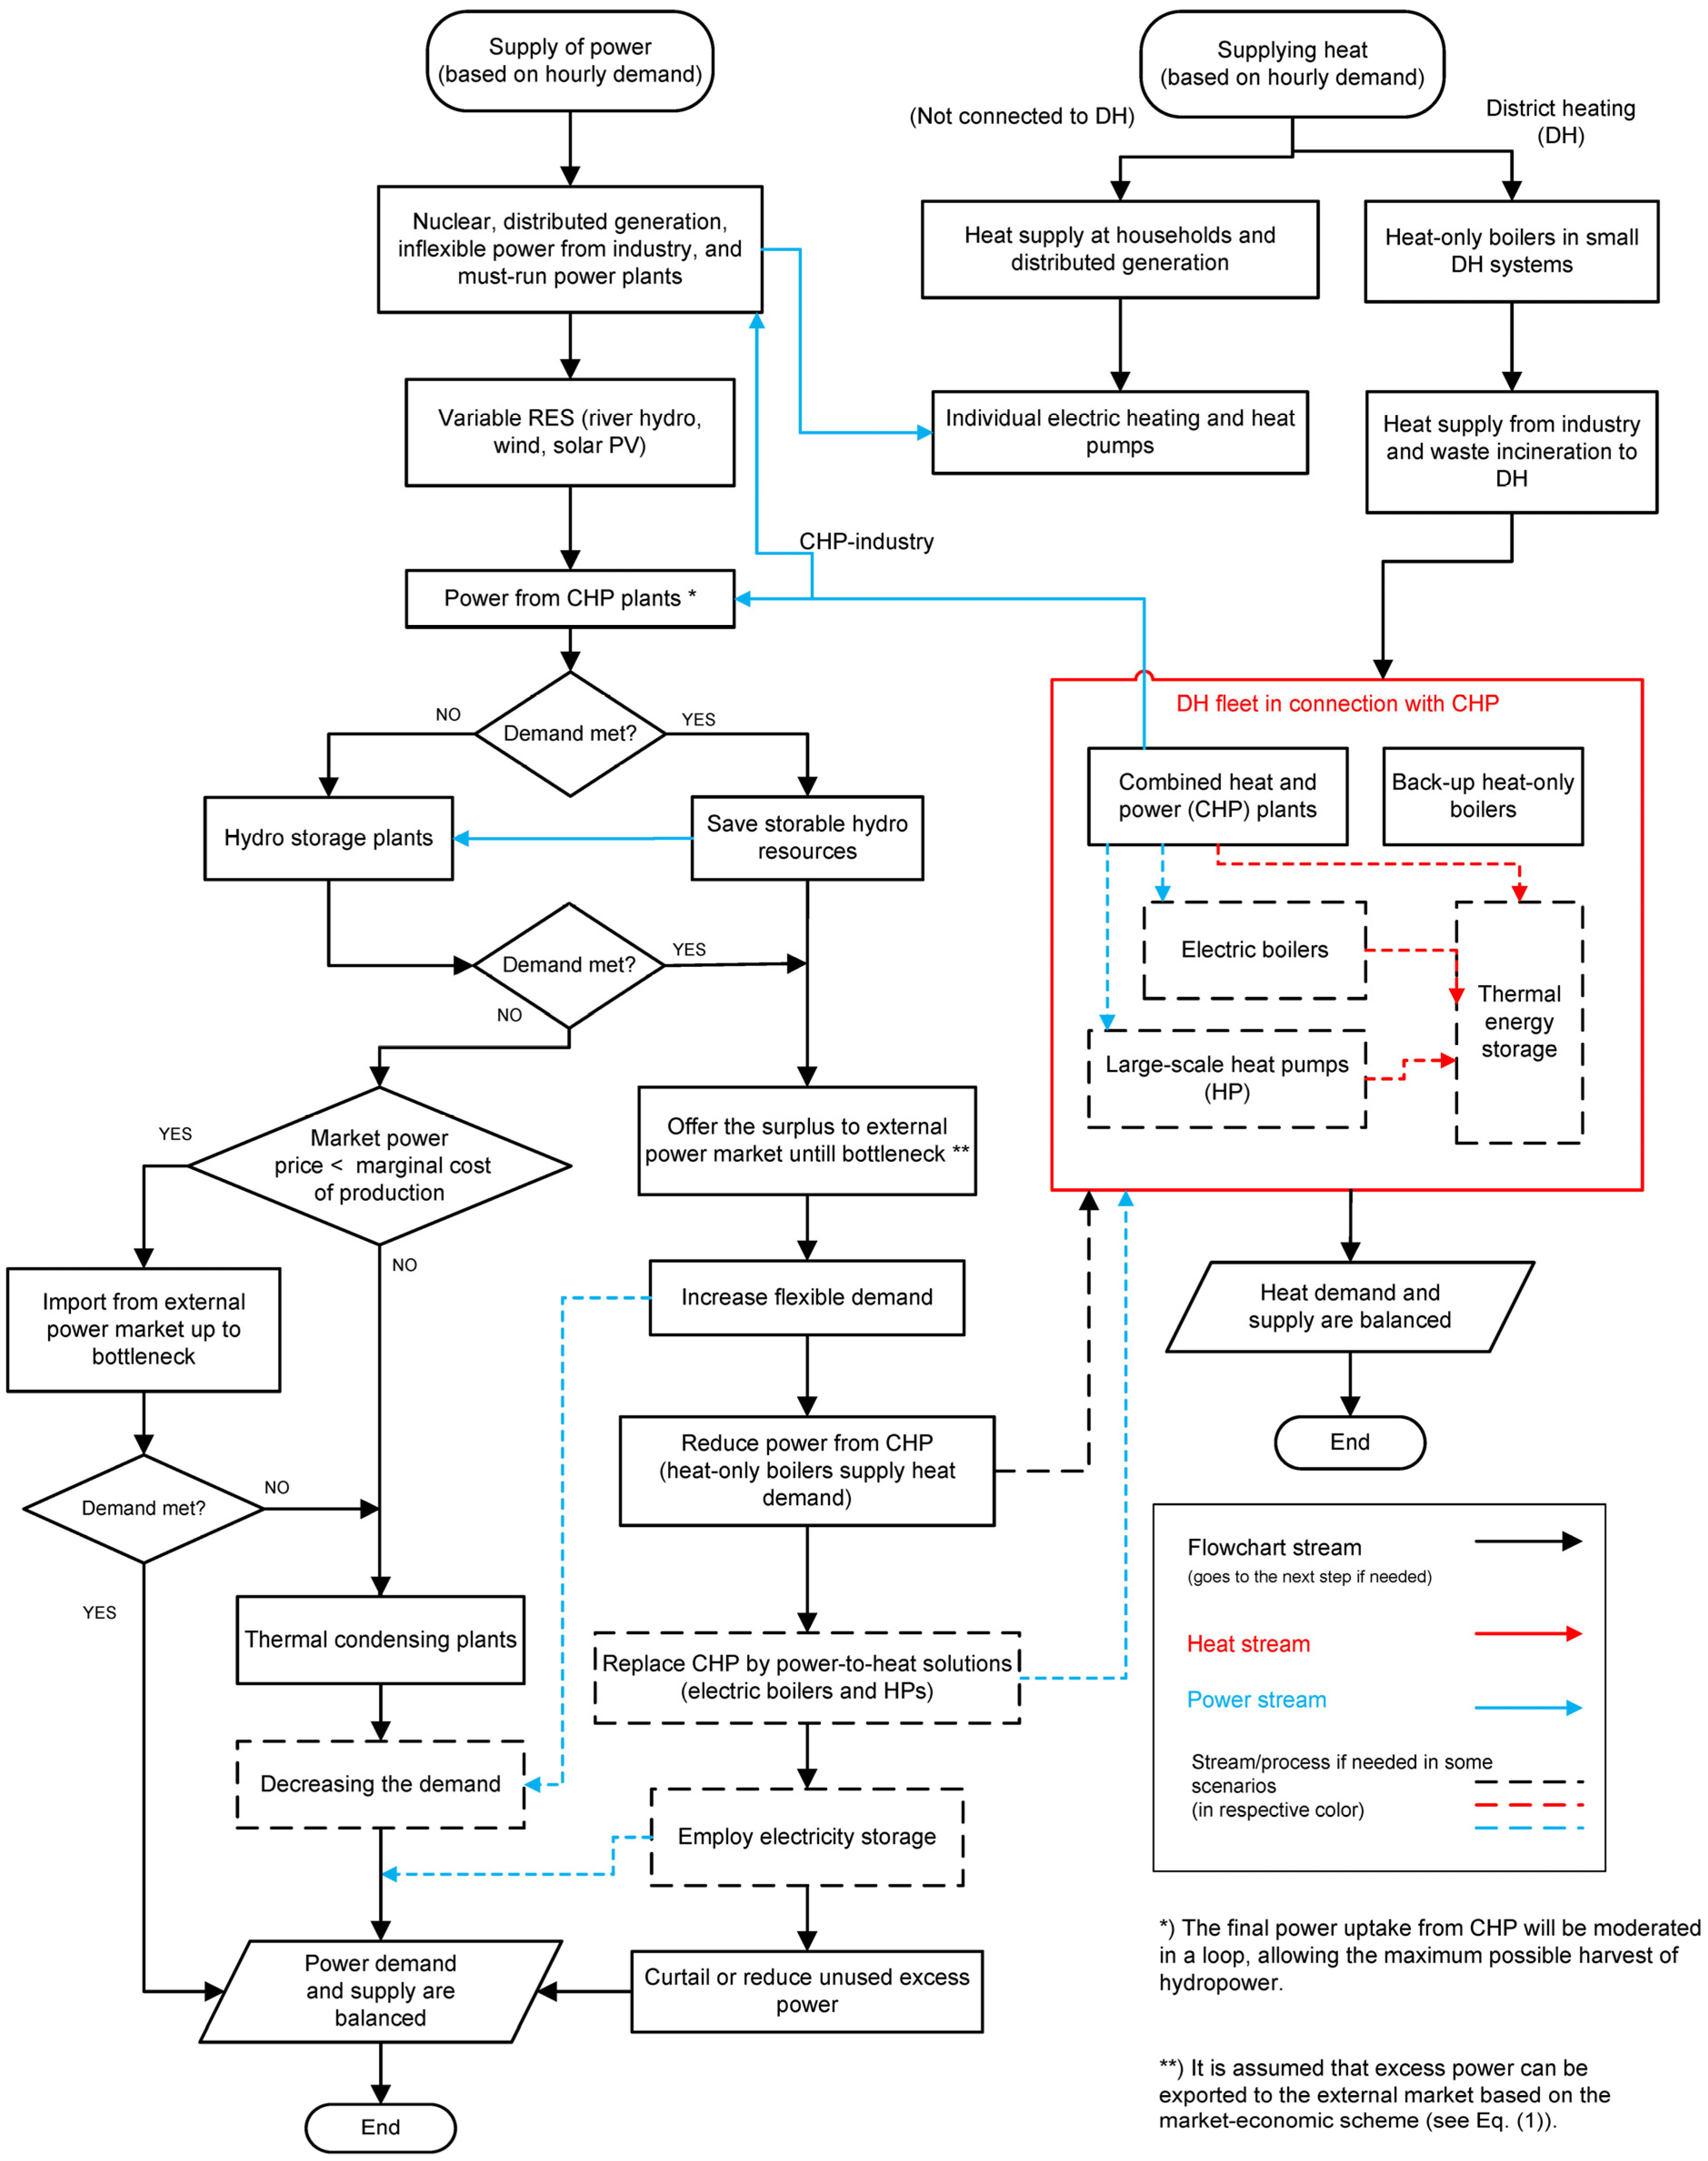
2.1. Modeling of National-Level Energy Systems

In this study, we model the energy system based on hourly analysis to capture the detailed variations in energy supply and demand. Consequently, it is possible to monitor the impact of heat demand on power production from combined heat and power (CHP) plants or the use of power to heat options. Hourly analysis portrays the hourly fluctuations in wind production and the related consequences in the power system. Besides the complexity of collecting sub-hour data, Deane et al. [16] indicate that modeling with a time resolution of 5 min improves the results of hourly analysis merely by 1% in the calculation of yearly costs and benefits. Based on a review of different energy system modeling tools [17,18], the authors selected EnergyPLAN for the scope of this analysis. EnergyPLAN offers capability in the analysis of energy systems with a high share of CHP [19], a high share of variable RES [20], energy storage [21], and the possibility to convert the excess power into different energy carriers [22].
EnergyPLAN [23] is a tool designed for the modeling and analysis of regional and national-level energy systems. It is a deterministic tool, which can be employed for technical and economic optimization of energy systems based on the inputs/outputs defined by the user. The time series inputs encompass the hourly heat and power demand, hourly distribution of variable RES, hourly inflow of hydro resources, and hourly distribution of nuclear downtime. The fuel mix and costs, production technologies including their efficiency and costs, power exchange possibilities and hourly price data are other input parameters. The user is able to adopt a set of regulations to model the operation of an energy system. For instance, the operation of CHP plants can be regulated based on the corresponding heat demand, power prices, or a triple-tariff (applied in Denmark). EnergyPLAN has been previously employed for the modeling of RES integration into different national energy systems, e.g., Denmark [24], Ireland [20], China [25], the UK [26], Finland [27], and some other countries [28,29,30].

2.2. A Market-Economic Scheme for Energy System Modeling

To model the energy system, we employ the algorithm presented in Figure 1, by the aid of EnergyPLAN modeling tool. The optimization is performed based on a market-economic scheme, in which the power producers seek to optimize their profits in a competitive market so that electricity is produced with the minimum possible costs. This resembles the liberalized electricity markets with marginal cost-based pricing mechanism. For each particular hour during the year, the power and heat demand is first quantified. Then, inflexible power production modes maintain a major part of the demand. This encompasses nuclear baseload, river hydro, non-adjustable distributed generation, inflexible power production in the industry, and other must-run power plants (grid stabilizing plants, for example). Variable RES-E is another contributor in this step, which cannot be controlled, adjusted, or converted to the other energy carriers in the first place. The abovementioned power plants supply the main fraction of the electricity demand in that hour in question.
On the other hand, heat demand is partially met by heat generation at the household level (individual heat pumps (HPs), electric-resistant heating, and small-scale fuel-combusting boilers), as well as distributed heat generators at a regional level. Then, the annual heat demand in the district heating (DH) networks is determined for each individual hour (see Section 3.3 for more details). CHP plants together with heat-only boilers supply the heat demand in the DH networks. Consequently, the respective power produced by the CHP plants is fed to the power grid. Next, the storable hydro resources maintain the remaining power demand.
Figure 1. Schematic scheme of the model in supplying power and heat in an integrated method based on hourly distributions of demand and market prices of electricity—This procedure is translated into a set of regulation strategies to be run by EnergyPLAN.
Energies 08 02493 g001
After this step, the energy system exchanges power with the external power market, based on the market-economic optimization scheme. In case of power deficiency in the system, the marginal cost of the next (thermal condensing) generating unit is compared with the governing price of electricity in the external market for that hour.
The new capacity will be settled if the marginal cost of production is lower than the market price. Power is otherwise imported until reaching the bottleneck in the interconnector. To reflect the impact of alterations in power exchange on the electricity prices, a price elasticity factor ( e p ) is employed. For instance, a price elasticity factor of 0.005 €/MWh/MW indicate that a new demand for 1000 MWh/h power import to the examined system will increase the power price in the external market by 5 €/MWh (relative to a basic power price defined by the user ( P o )). The price of electricity in the external market ( P m a r k e t ), system price ( P s y s ), basic price ( P o ), and price elasticity factor ( e p ), are related to the amount of net power import ( Q n e t ) as stated in Equation (1):
P m a r k e t = P s y s + ( P s y s P o ) × e p × Q n e t
The net power export from the system (to be inserted in Equation (1) with a negative sign) will reduce the power prices in the external market. Therefore, by adopting an iterative loop, EnergyPLAN optimizes the governing prices after the addition of each power production mode to guarantee the operation of the least-cost generation mode (versus the possibility of power exchange). In case of bottleneck in the interconnector, the revenues are divided equally (half of the costs/benefits are allocated to the system in question). This is analogous to the actual function of a typical electricity market. The external power market is assumed to function based on the Nash–Cournot concept, in which the other producers (even in the external market) do not alter their production in different scenarios projected for the modeled system. After reaching the bottleneck in importing power, the deficiency in power supply is compensated with domestic condensing thermal power plants, demand side management, and peak/reserve plants consecutively. In case of excess power (e.g., from variable RES), a set of flexibility measures must be applied, so that the maximum possible amount of RES-E could be absorbed to the system. Finally, the power demand is balanced and the remaining RES-E has to be curtailed (impossible to use, export, store, or convert to other energy carriers). For more details, concerning the problem formulation in a market-economic scheme the reader can refer to the documentation of EnergyPLAN tool, Chapter 6 in version 11.1, publicly available in [23].
The drawbacks and limitations of this study in the modeling of an energy system can be categorized in two groups: (i) related to the tool; and (ii) related to the author’s analysis. EnergyPLAN is not capable to model the ramping constraints of thermal power plants, while the minimum stable load can be set for these plants. Since the power plants are modeled in an aggregated manner with the average values, controlling the merit order of different thermal power plants is not possible. The tool considers NPPs only in baseload operation with full priority to operate. However, the availability of NPPs can be inserted in time series to reflect the maintenance downtime or fuel replacement periods. The unit commitment costs (e.g., stand-by/shut-down/start-up costs) of the thermal (backup) power plants cannot be calculated. We propose an offline method to calculate the flexibility requirements in high-level wind integrations (Section 4.5). The tool provisions one interconnector to the external market (to one price area). In reality, a country may be connected to more than one price area with different import/export capacities (as is the case for Finland). The authors admit that this approach can affect the amount of temporal power export/import. However, the results of our simulations suggest an annual net exchange with less than 2% relative difference compared to the historical data. The model is deterministic; it does not capture the uncertainties in the modeling of future scenarios. The authors apply a limited uncertainty analysis regarding the future variations of wind production (explained in Section 2.4). The model does not capture the spatial constraints or limitations in the transmission grid, implying that any wind integration level can be managed by the grid.
In terms of future power prices, energy demand, and emission costs, we apply general assumptions based on the available references: a robust forecasting method might improve the results of this analysis. We do not examine the case of smart electric vehicles, power to gas options, and the use of district cooling in this study. Considering the mentioned flexibility solutions may recover the maximum wind penetration levels quantified in this study.

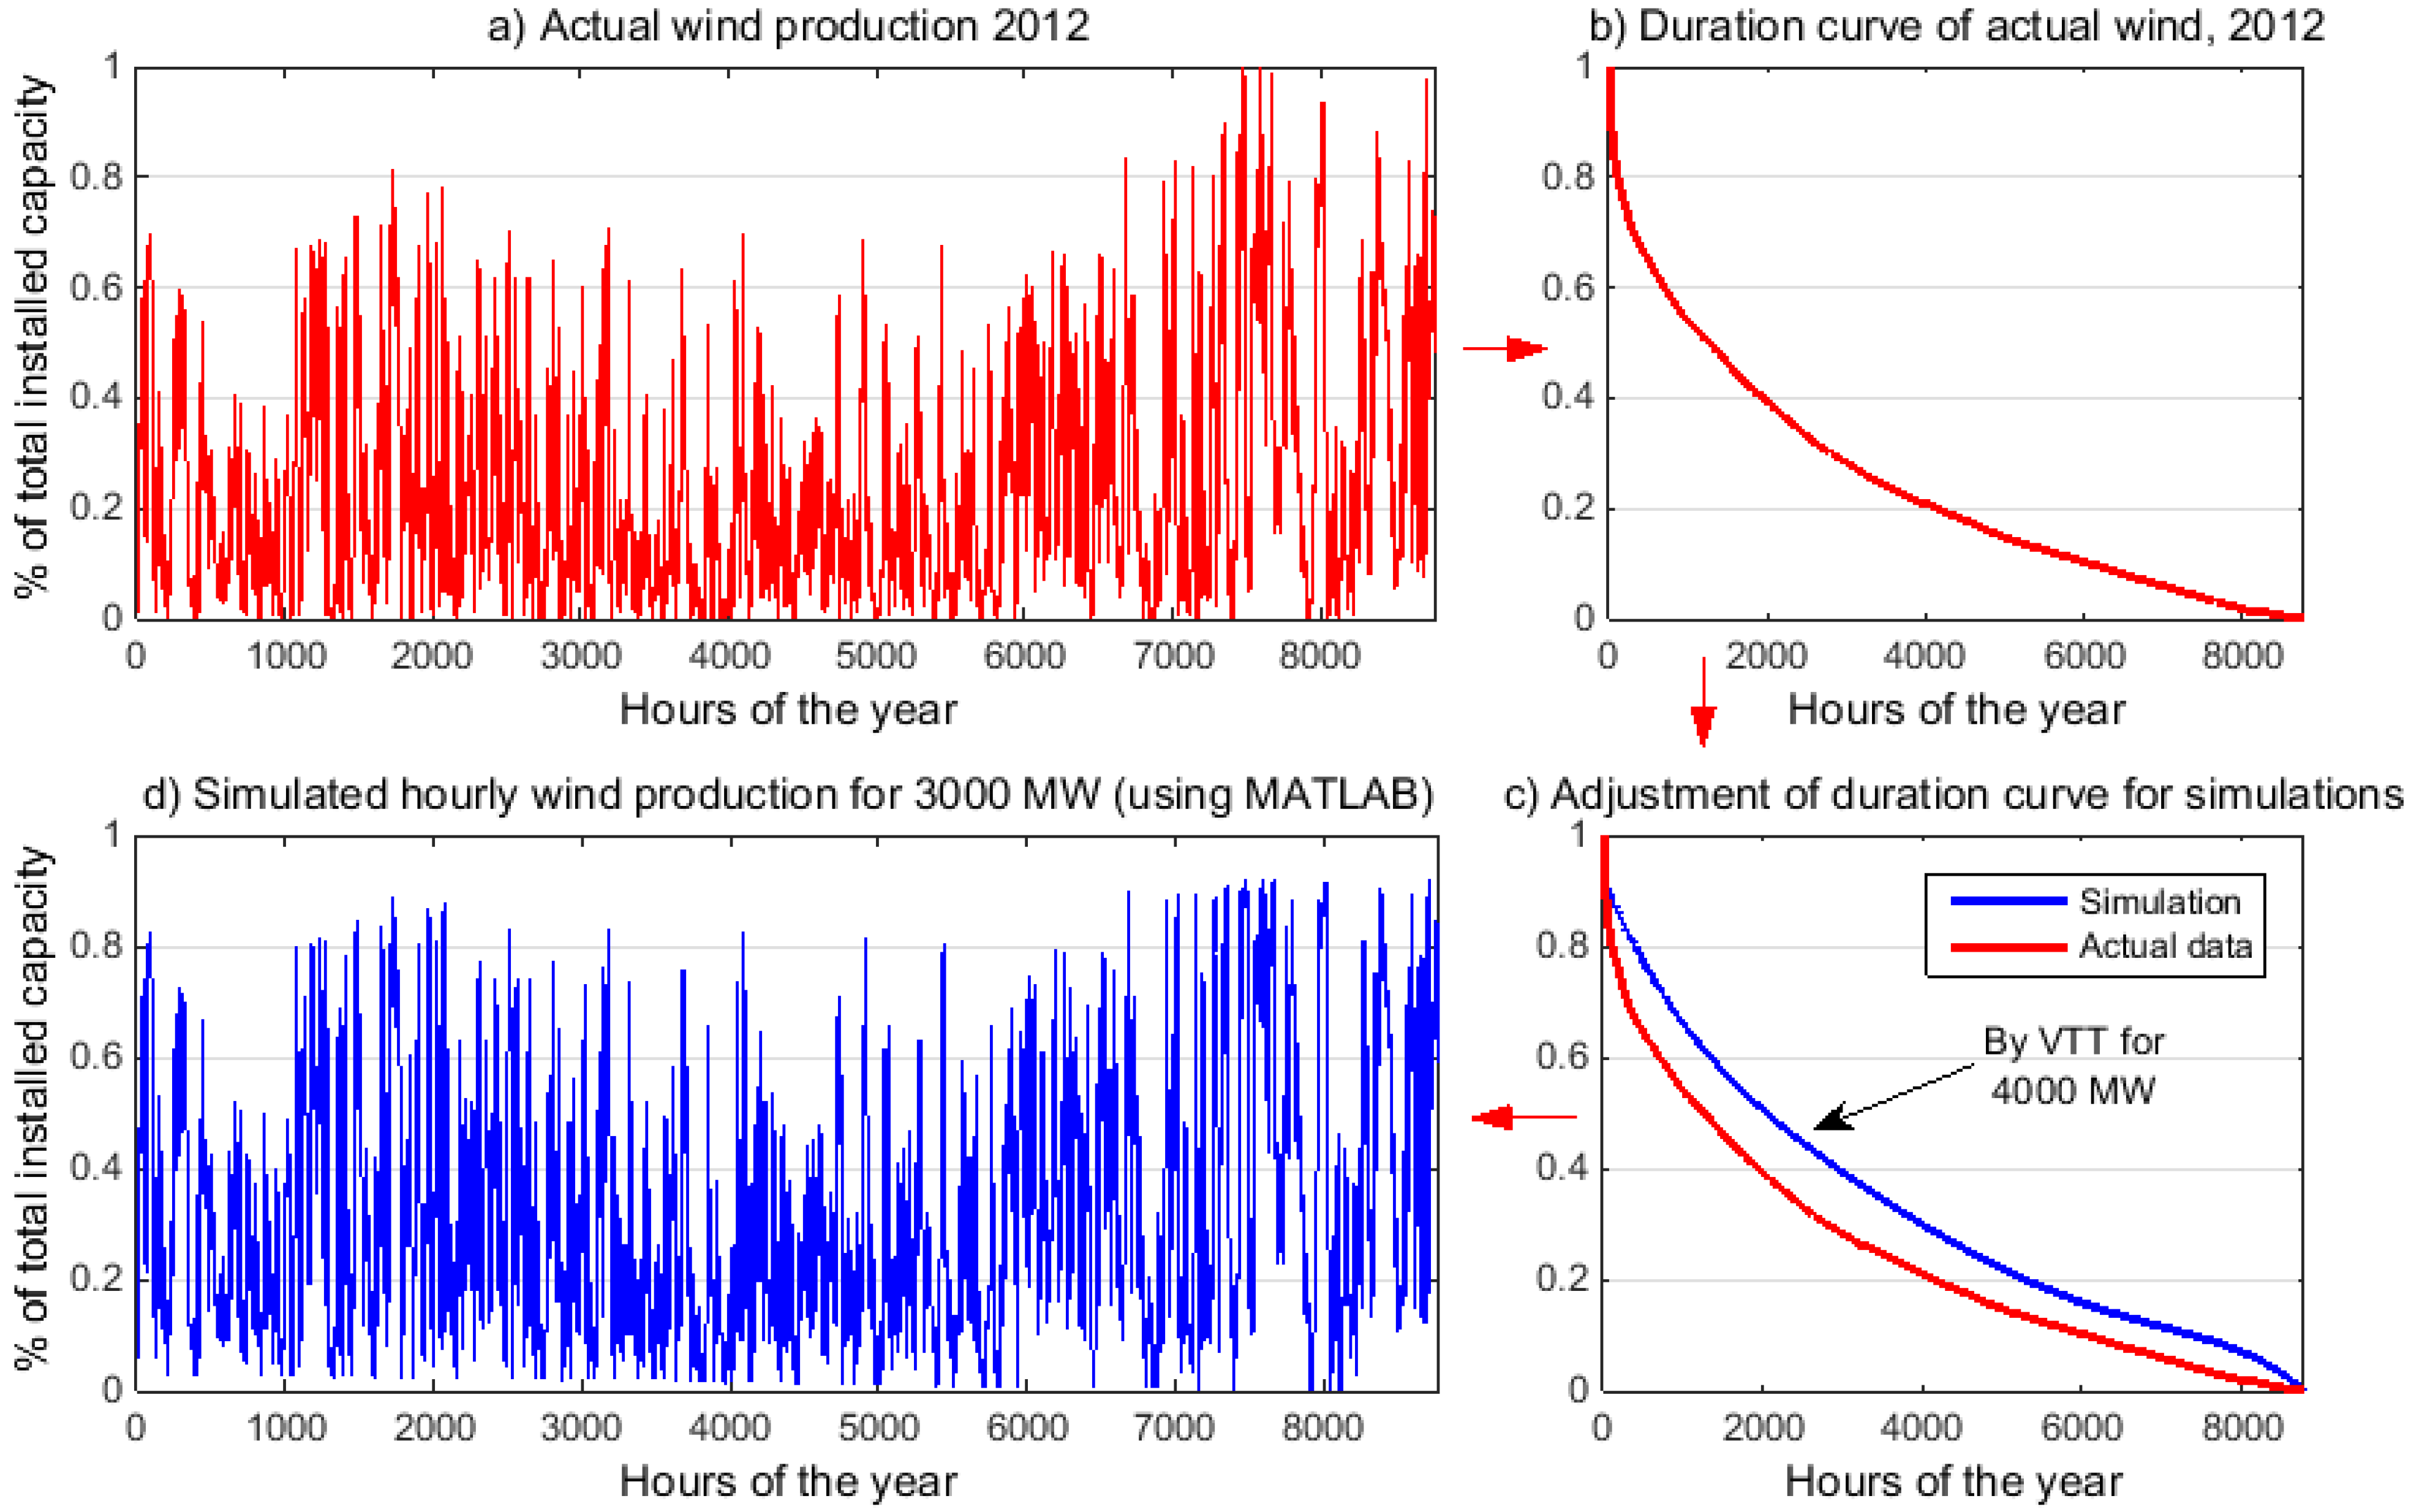
2.3. Methodology in Modeling of High-Level Wind Integrations

The methodology explained in this Section is applicable for the modeling of high-level wind integrations based on the actual wind production data. It is argued that large-scale, aggregated, and dispersed wind production will experience less periods of peak, calm, as well as lower fluctuations in very short time periods [31]. Yet the energy system will encounter high variations in time lags as order of a few hours or longer [32]. Therefore, we employ a simple but robust methodology to account for the smoothing effect of high-level wind integrations.
In a study by Technical Research Center of Finland (VTT) [33], a wind integration model is built for Finland up to 4000 MW installed capacity. We adopt the annual duration curve of that scale wind integration and compare it with the duration curve of today’s actual production data. Then, based on the relative difference of the two curves, the duration curve of any integration level in the future will be generated. Finally, the hourly variations of the simulated wind integrations are reproduced based on the temporal order of the actual hourly distribution (available data). This simulation procedure is depicted in four steps in Figure 2. Hence, the periods of peak and calm are significantly moderated in high-level wind uptake over the country. The results of this analysis show an acceptable consistency compared to other national-level wind integration studies, e.g., the recent VTT’s publication [34]. Offshore wind production is simulated separately by assigning a larger capacity factor. This is based on the difference in wind speed on the coastal areas of Finland, compared to the offshore locations. An average difference of 8%–12% is determined for the offshore wind speed at the height of 50 m compared to 10 coastal locations, based on the Finnish Wind Atlas [35]. Therefore, an annual capacity factor of 24% for onshore [7], whereas 26% for offshore wind is applied in this study (cf. 28% Denmark, 27% UK onshore, 36% UK offshore, and 19% Germany based on European Wind Energy Association [4]).
Figure 2. Methodology in modeling and simulation of large-scale wind integrations in four steps: (a) Actual wind distribution in 2012; (b) Actual duration curve; (c) Comparing actual duration curve with simulations by a comprehensive wind integration study [33]; (d) Reproducing hourly variations from duration curve for any desirable installed capacity.
Energies 08 02493 g002

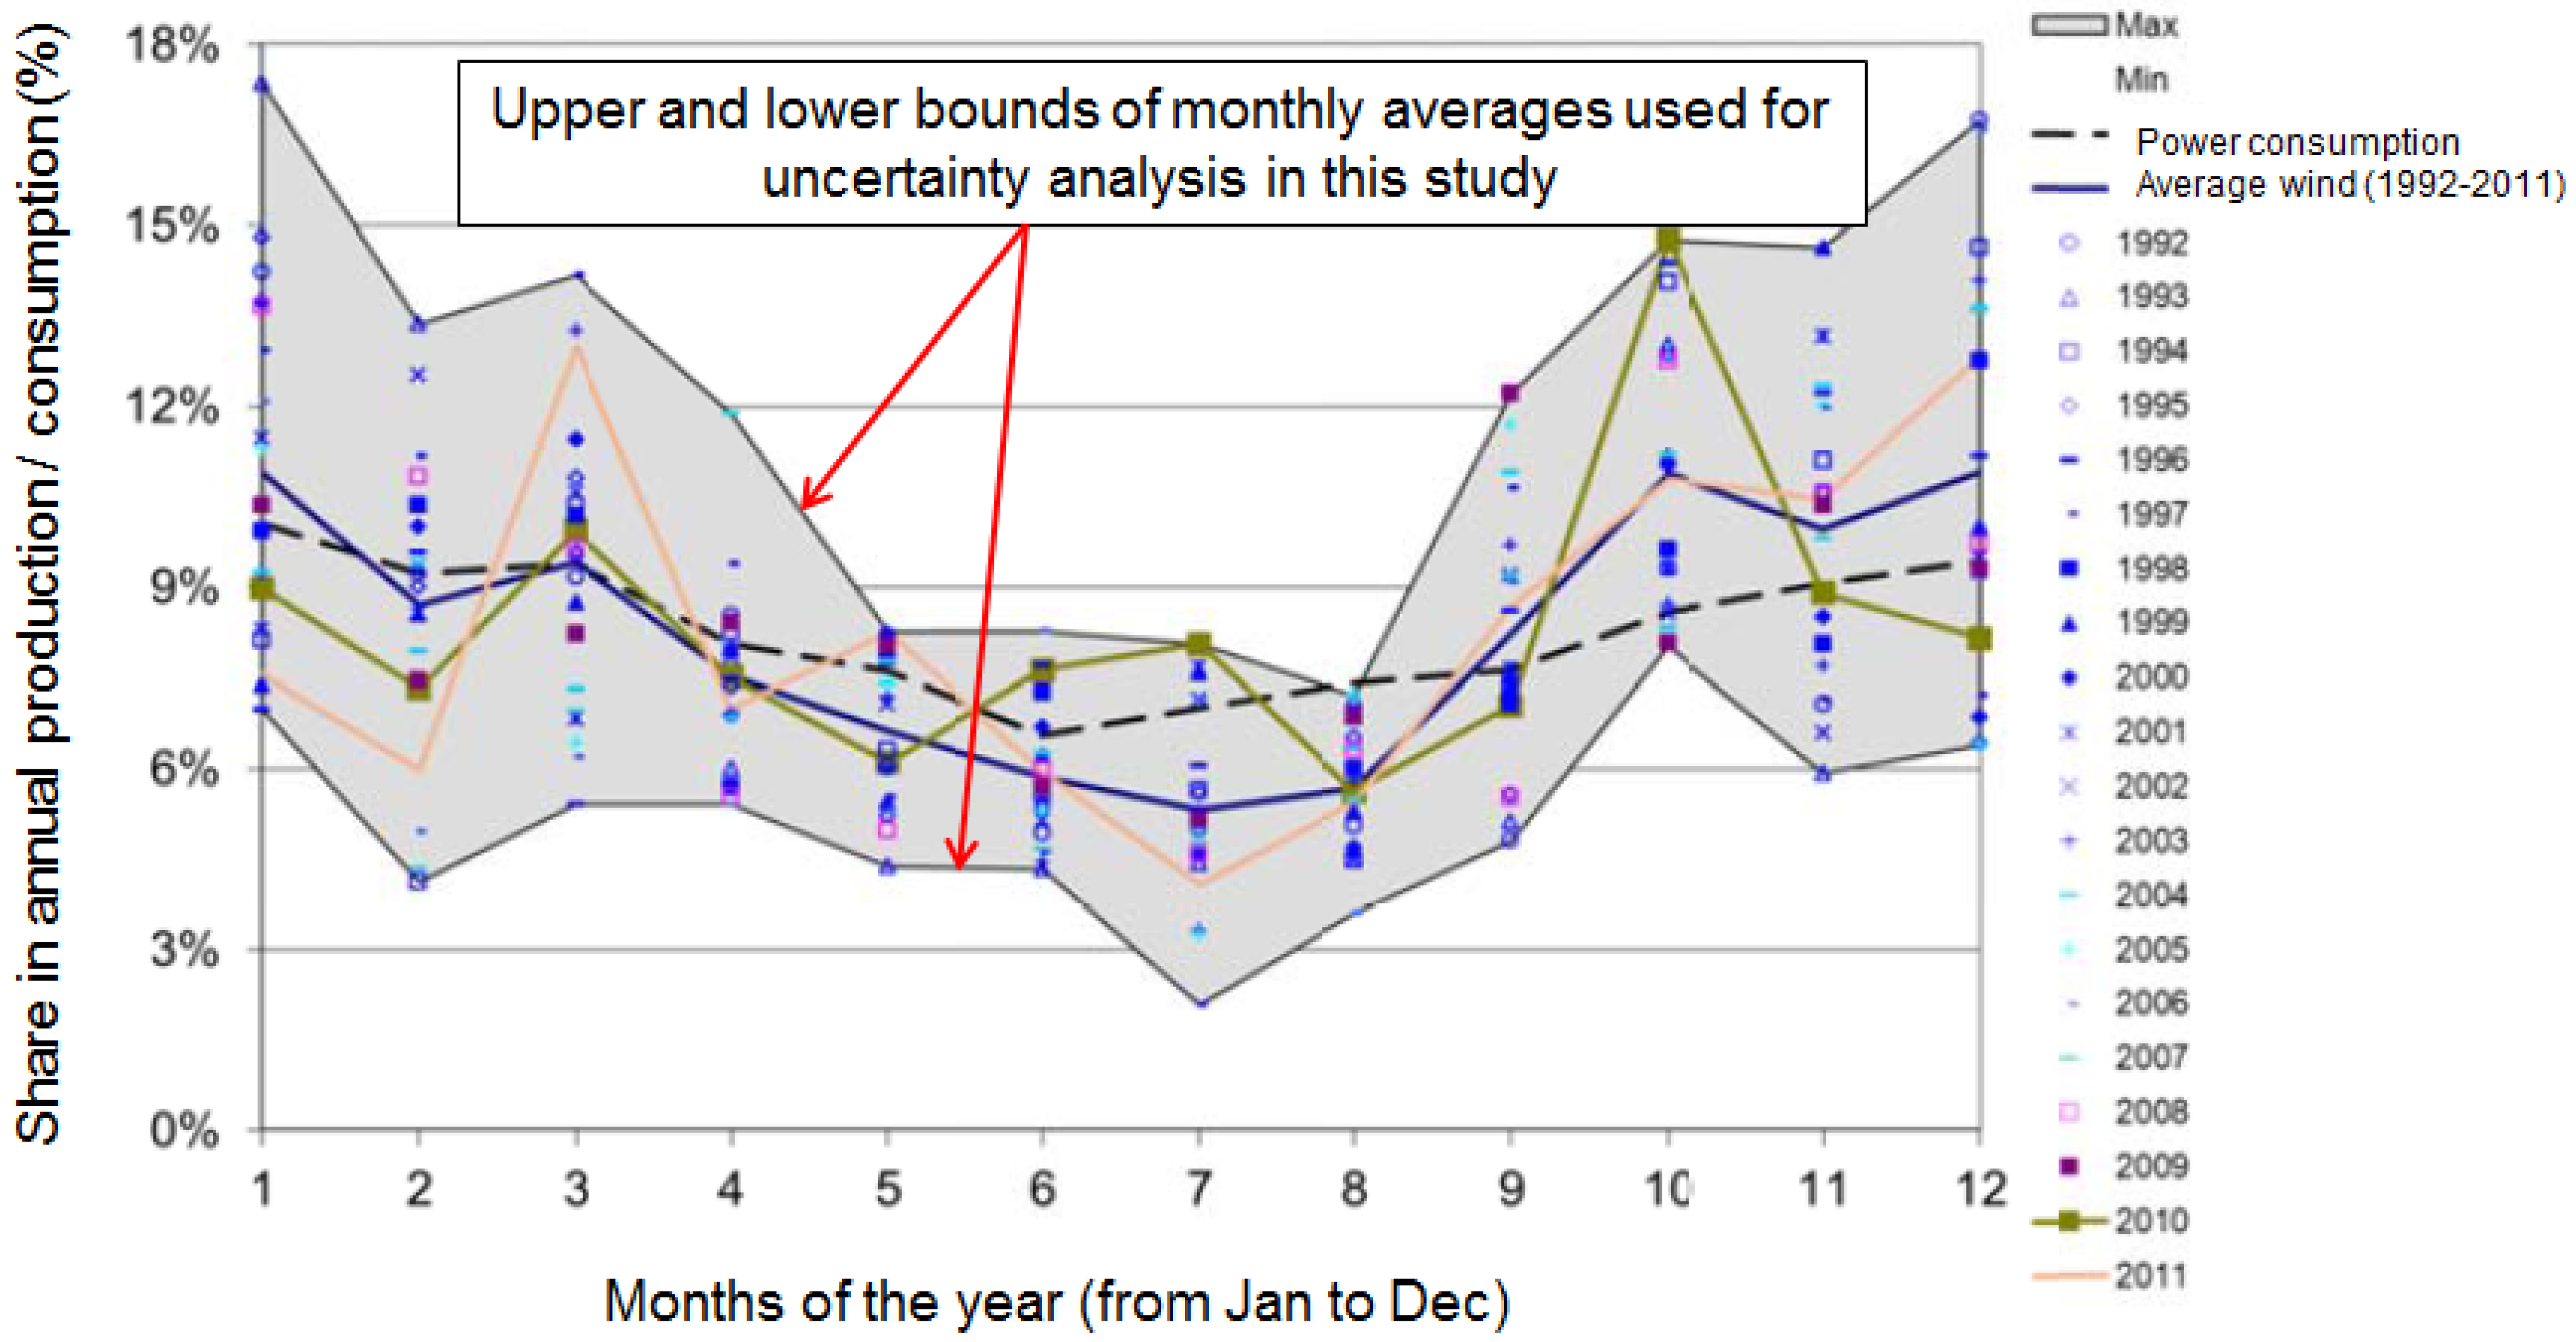
2.4. A Note on Uncertainties

Since EnergyPLAN is a deterministic tool, a systematic uncertainty analysis is irrelevant and non-applicable to this study. However, as we simulate large-scale wind integrations on an hourly basis, the future fluctuations might influence the results. Koivisto et al. [36], proposes an uncertainty analysis for wind integration simulations by employing the Monte Carlo method. We obtained a set of time series of hourly wind productions from the authors of the latter. To incorporate more realistic assumptions for accepting wind time series for our analysis: (1) We check the capacity factor of the time series; (2) we consider the monthly-averaged wind production in the past 10 years as upper and lower binding limits for the monthly averages of our simulations (these limits are adopted from [37] and illustrated in Figure A1, Appendix A). For instance, the monthly average of stochastic wind production in our model for January does not exceed the highest historical recorded average nor goes below the minimum average level for this month. After 50 simulation runs, the generated sequences (50 different hourly time series of wind production) were inserted as the input data to the EnergyPLAN model, resulting in 50 different run times. The results for 4000 MW wind installations suggest a deviation of less than 4% in yearly outputs for the total costs and fuel consumption. This implies that the results of this study might have up to approximately 4% error due to the future alterations in the wind regime.

3. Case Study: Finland

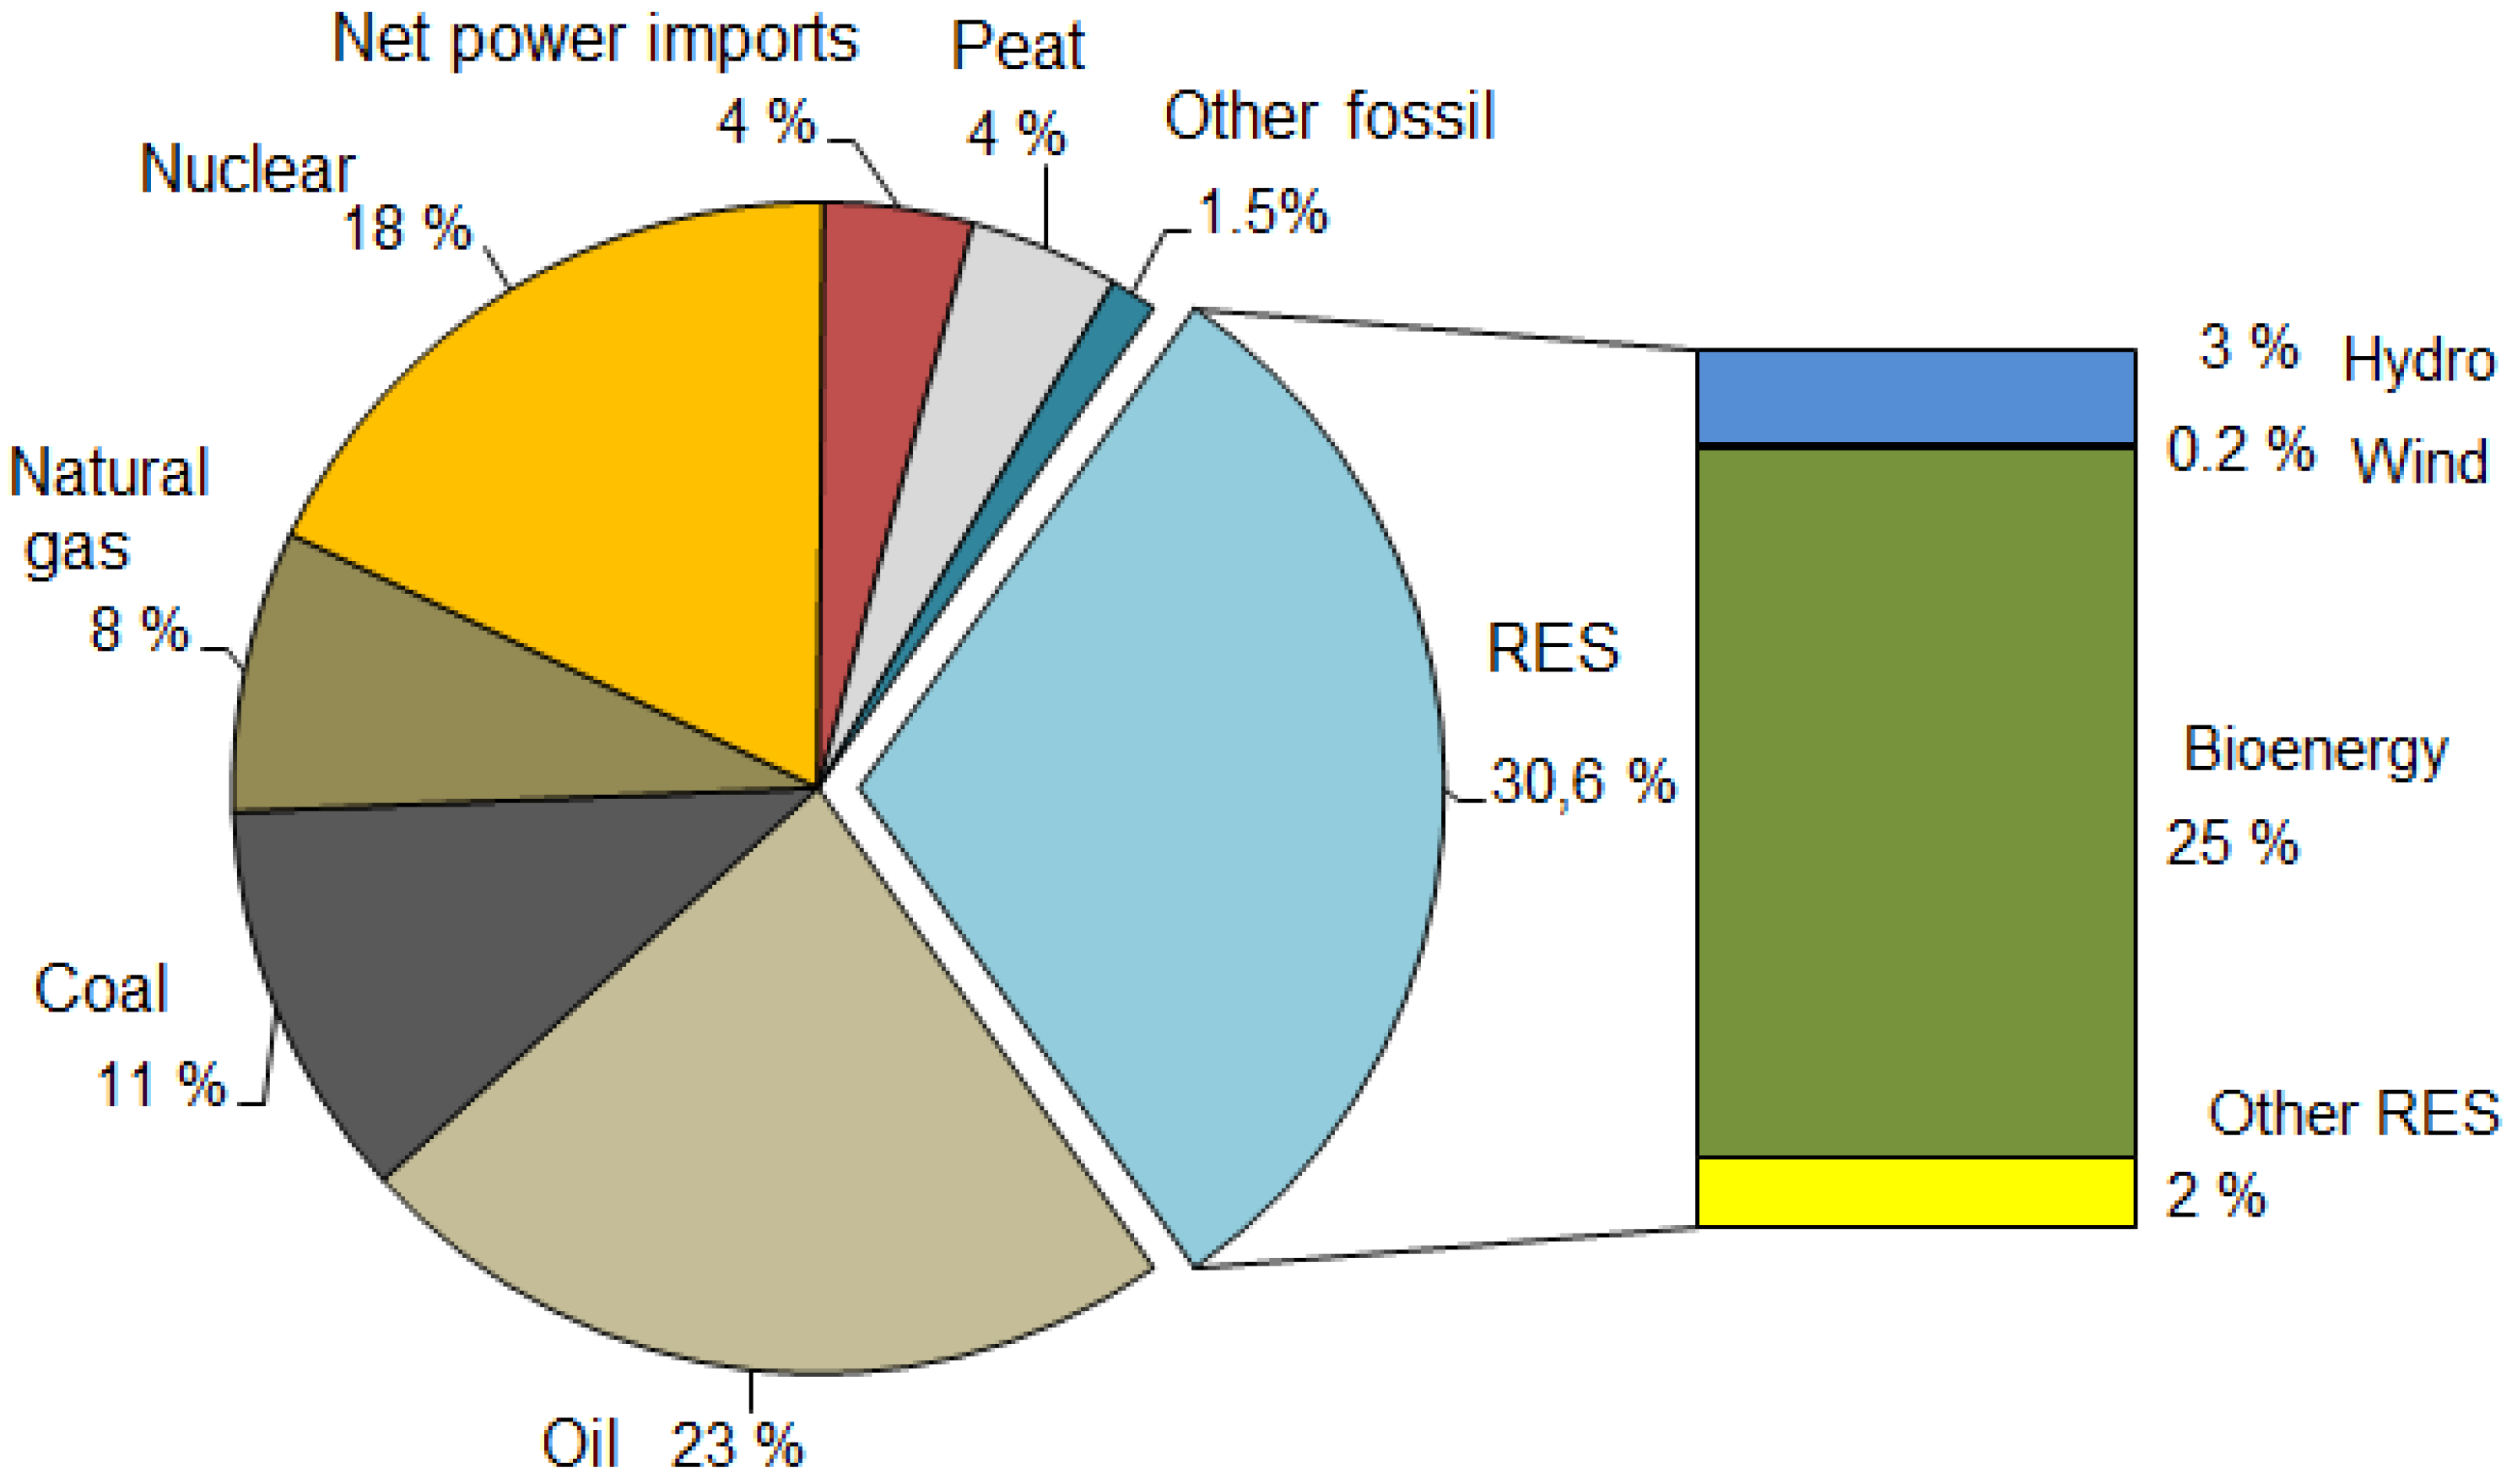
3.1. Energy Mix in Finland

According to Statistics Finland [5], total primary energy consumption (PEC) was 1373 PJ in 2013, which is approximately equal to the previous year. The utilization of RES reached 31% in PEC, with a growth of 5% in the use of forest chips. Power consumption totaled 84 TWh in 2013; comprising 33% nuclear, 16% hydropower, and 19% power imports (mainly from the Nordic electricity market and from Russia in peak times). As a country with energy-intensive industries, the power imports have spurred the economic risks associated with the fluctuations of power prices in the external market, which also depresses the nation’s energy security. The DH demand was 32 TWh, 70% of which was supplied by CHP plants. Figure 3 illustrates the share of different energy sources in PEC in 2013.
Figure 3. Total PEC (primary energy consumption) in Finland 2013 (data from [5]).
Energies 08 02493 g003

3.2. Finland’s Energy Policy and Future Trends

The updated version of Finnish Energy and Environmental Policy (2013) [38] underlines coal consumption as well as power imports as two cases that should be substituted with new decarbonized energy production. Accordingly, the construction of new nuclear capacity as well as a feed-in tariff of 105 €/MWh for wind production that eventuates between 2020 and 2025 is being promoted [7]. As a result, 11 GW wind power projects are officially registered by the end of 2013, from which 3 GW is offshore [39]. This promises a significant growth compared to the installed capacity of 630 MW at the end of 2014 [40]. Finland aims to augment the share of RES in final energy consumption up to 38% by 2020, to fulfill the EU targets [41]. While wind production was only 1 TWh in 2013, Finland has plans to soar the wind contribution up to 6 TWh/a by 2020 and 9 TWh/a by 2025 [7].
The Finnish energy system is, therefore, entering a new era: a high share of nuclear power and a relatively large wind capacity. Considering the intermediate power supply, CHP production constitutes one-third of the power production in Finland [42]. A major part of CHP plants are connected with DH networks, which bundles the power production with the heat demand. CHP plants offer an energy-efficient solution for supplying heat in the cold climate. It is expected that more energy efficient buildings and the deployment of individual heat pumps (HPs) will lower the heat demand, depressing the potential of CHP plants or leading them to the power-only generation mode. This interconnection of heat and power sector will be thoroughly examined in this study.
Finland has four operating nuclear reactors with total nominal capacity of 2780 MW. A new third-generation, European Pressurized Reactor (EPR) reactor with 1600 MW capacity called Olkiluoto 3 (OL3) is expected to start to operate in 2018. Moreover, the third nuclear power producer in Finland, Fennovoima Ltd., is to initialize the construction of Hanhikivi 1 with 1200 MW capacity in Pyhäjoki, Northern Finland [43]. Olkiluoto 4 (OL4) is another NPP with a ratified decision-in-principle [44] that is expected to enter the grid in the 2020s. As of Dec 2014, the construction of OL4 is uncertain since the permit will expire in 2015. Fortum Energy Company may apply for a new license for Loviisa 3 during the next parliament, depending on the EU energy policy and CO2 prices. With respect to the aging of existing NPPs, the operating permits of two plants (Olkiluoto 1 and 2) will expire in 2018 [45]. It is expected that the owner company (Teollisuuden Voima Oyj, TVO) will apply for permit extensions. However, the other existing plants (Loviisa 1 and 2) are to be decommissioned around 2030. The nuclear landscape in the 2020s is not clear yet, suggesting a constant growth followed by a turnaround after 2030. Hydropower potential is deemed to be saturated in Finland with 2500 MW installed capacity. In this study, this capacity is considered to remain unchanged up to 2030, as the majority of the potential sites are situated in the environmentally protected areas.
Electricity demand in Finland is highly correlated to the energy use in the industry, mainly by the forest and metal sectors. The previous estimations by Finnish Energy Industries (Energiateollisuus, ET) [46] and the Confederation of Finnish Industries (Elinkeinoelämän Keskusliitto, EK) [47] suggest a total electricity demand of 100–110 TWh by 2030. The Climate and Energy Strategy of Finland estimated a total power demand of 103 TWh for 2030, which was later moderated to 94 TWh for 2020. The overall demand of industry is estimated to grow less than earlier predictions as the forest industry does not experience the previously projected developments. In this study, sensitivity analyses are performed to cover different projections of the power demand in the future with regard to other reports and EU-level predictions as well [48,49].

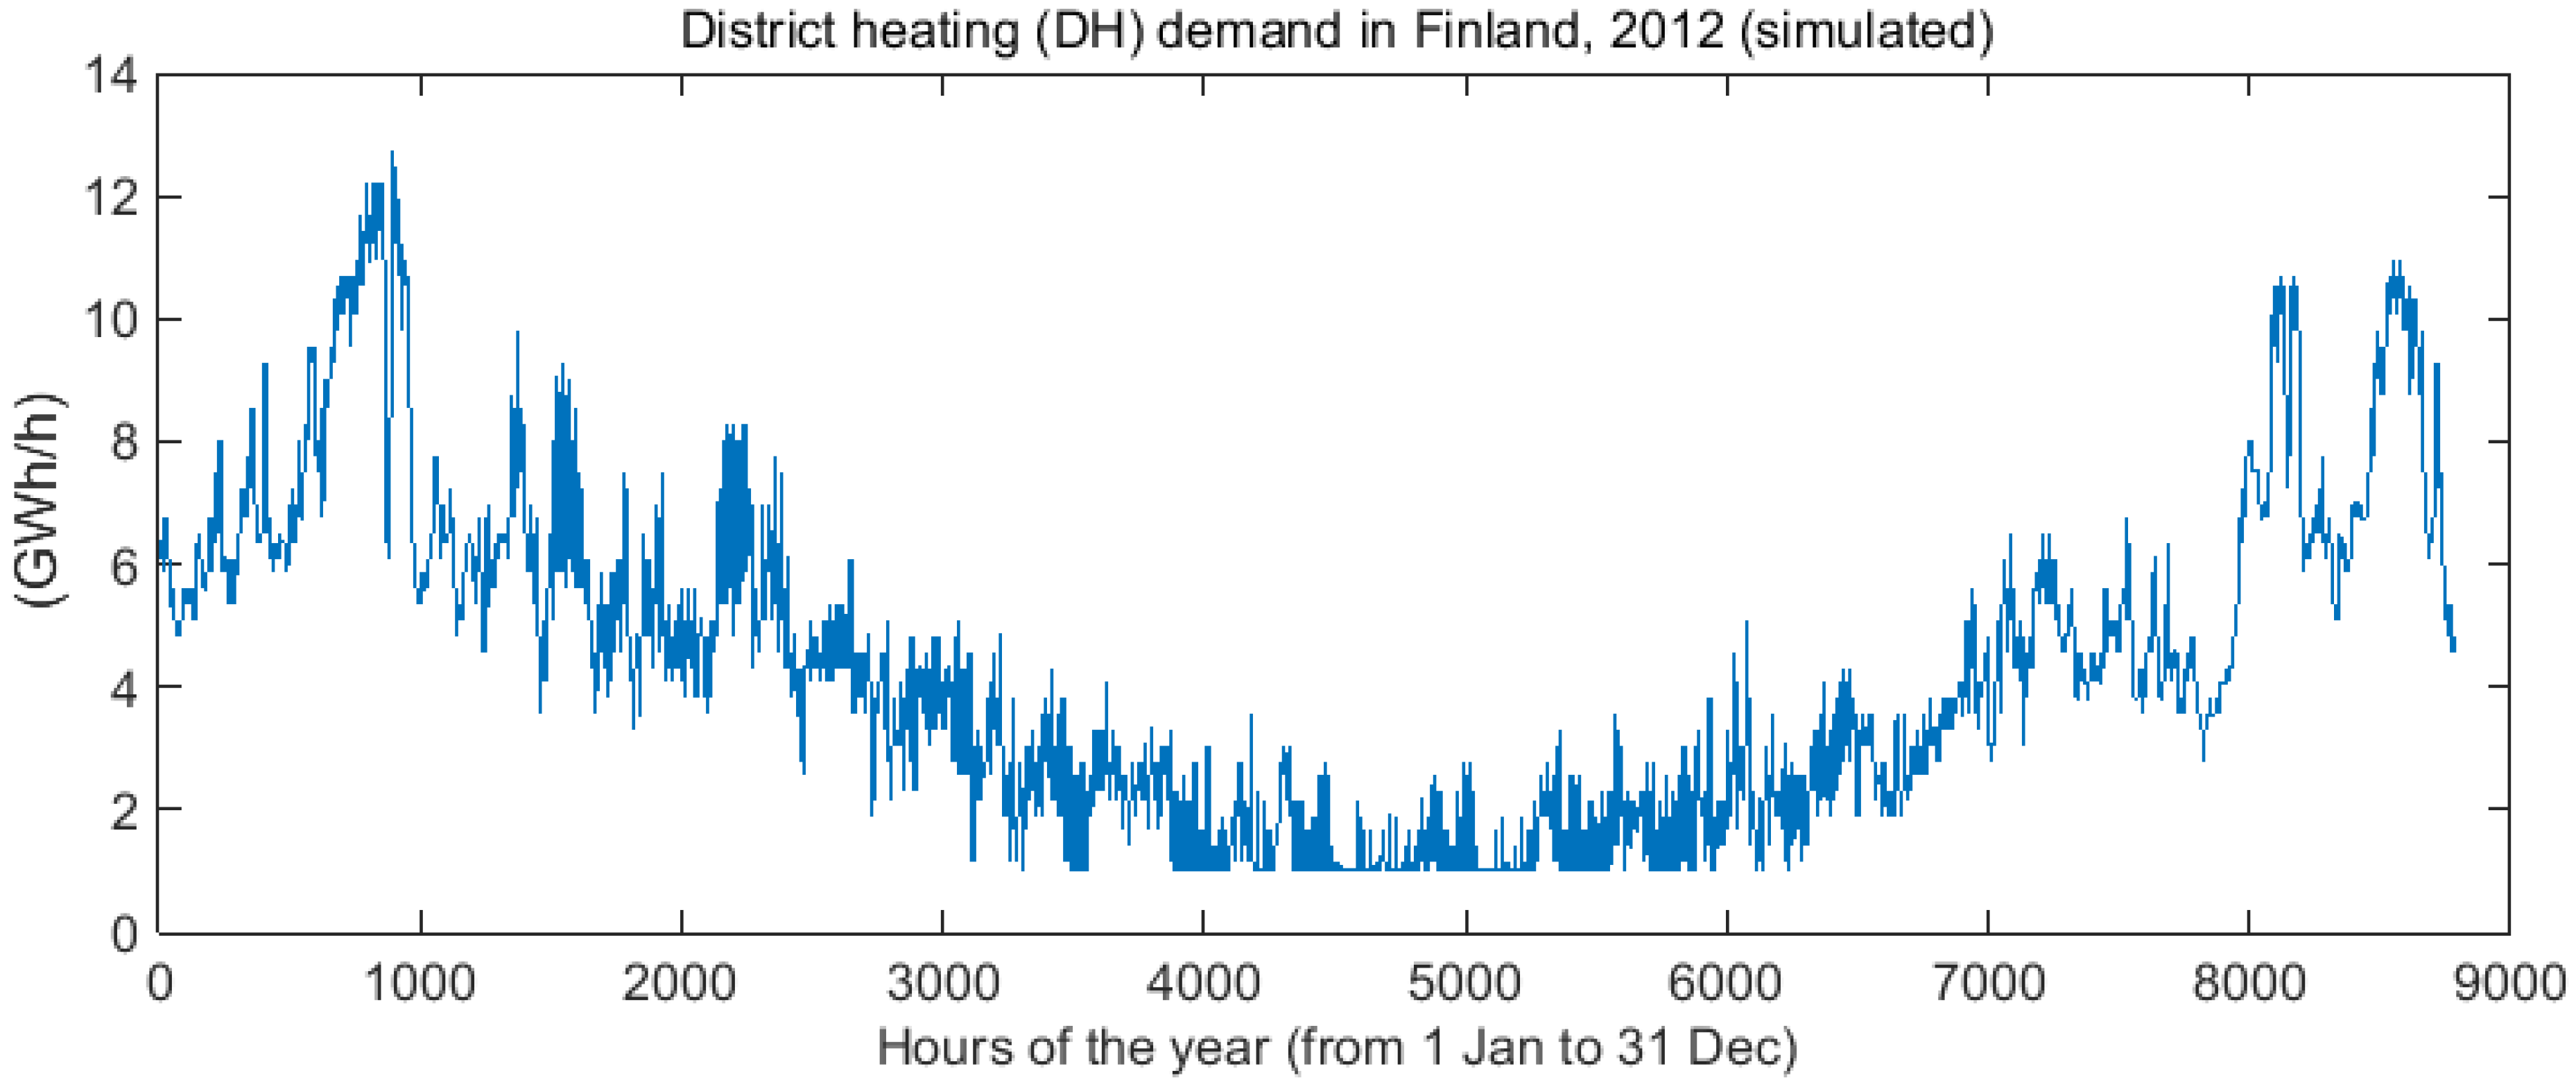
3.3. Reference Model and Input Data

Different approaches have been employed to model the Finnish energy system. In a series of studies by VTT [50], a roadmap for the Finnish energy system is outlined through to 2030. In a more recent publication [51], VTT has modeled the energy system for 2050 by scenario analysis, highlighting structural changes from technical to behavioral changes. Other studies have also addressed the future of Finnish energy system, from societal and qualitative perspective [52], as well as system dynamics approach [53,54]. In a more detailed study, Kiviluoma [55] highlights the role of heating systems in further penetration of wind. The latter conclude that the heat sector can advance the share of wind by 12%-point, resulting in a wind-nuclear share of 77%. In our analysis, we offer a more comprehensive modeling and analysis of the Finnish energy system in the 2020s by considering the most recent projections for the nuclear construction plans, renewable energy policy, energy demand, fuel costs, power prices in the Nordic power market, and wind production data. The aim is to explore the most optimal compromise between nuclear and wind as two major pillars of the Finnish decarbonization plans.
We model the Finnish energy system for the reference year 2012 as a benchmark, for which the details of input and output energy flows are available. To this end, the hourly distribution of power demand and market prices of electricity for the reference year are obtained from Nord Pool [56]. Then, the generation capacity for power and heat production is set for the model, based on Statistics Finland [5] (see Table 1). CHP plants in DH and industry sectors are modeled with their fuel distribution and efficiencies. A share of 25% (equal to 500–550 MW capacity) from total hydropower production is deemed for the river hydropower. The hydro inflow is calibrated based on the weekly data in 2012.
Table 1. Power generation capacity at peak load in Finland 2012 (data from [5]).
Production ModePower Capacity (MWe)Share (%)Electrical Efficiency (%)
Nuclear power2,75019.633
Hydro power2,59520.890
Condensing power plants2,04515.438
Combined heat and power, total5,86044.230
CHP industry2,37017.9-
CHP district heating3,49026.3-
Total13,250100-
To model the heat demand, we employ the heating degree days (HDD) approach. Based on Finnish Meteorological Institute [57] data, the heat demand can be calculated for the indoor temperature need of 17 °C (assuming the remaining heat demand is fulfilled from in-house latent heat, lights, etc.). By applying this approach, the relative variations of space heating demand is determined based on the hourly ambient temperatures (obtained from a weather station in the Central Finland). To accommodate the energy needs for the supply of hot water, a typical share of 30% of the total heat demand is allocated. This method is an approximation, as the heat demand trend is not identical in different regions or different buildings in an extended country like Finland. Finally, by knowing the total annual DH demand (TWh/a), the produced time series of relative heat demand (HDD) can be converted to the hourly DH demand, as illustrated in Figure B1, Appendix B.
The investment costs, fixed O&M costs, and variable costs of different technologies are mainly based on [58,59,60,61,62], while fuel costs and taxes from [63] (see Table B1 and Table B2, Appendix B). Average carbon price of 8 €/t is considered for the reference model, otherwise mentioned. The main input data of energy production and consumption in the industry sector, households, and transportation are obtained from Statistics Finland [5] and Finnish Energy Industries [42].

3.4. Calibration and Verification of Reference Model

The results of EnergyPLAN model for Finland are compared with the available data to check the accuracy of the model. First, the annual fuel consumption in heat and power production is calibrated. The output of nuclear, hydro, and wind power plants is manipulated by the respective correction factors in to produce the desirable output. The output of thermal plants and power exchange, however, demands a more sophisticated, iterative approach by changing the share of thermal plants in each DH group (backpressure or extraction plants). This is in particular relevant to the case of Finland, which the cogeneration plants are mainly run based on the heat demand, which couples the two sectors. The initial results show a consistent outcome with the available statistics. The annual output of CHP plants, condensing plants, and net import of electricity show only 0.08, −0.67 and 0.12% error, compared to the data obtained from Statistics Finland. Table 2 summarizes the output of the model built by the aid of EnergyPLAN and the respective data from the Finnish authorities. The share of power import is higher in the statistics, 19 TWh compared to the result of 17.5 TWh in our model. The net import shows, however, a relative error of 0.11% (Table 2).
Table 2. Comparison of the results from EnergyPLAN model and the recorded data for Finland 2012.
Production ModeAnnual Production (TWh), 2012DifferenceError
EnergyPLAN Reference ModelStatistics Finland [5]
Nuclear power22.0622.060.000.00%
Hydro power16.6716.670.000.00%
Wind power0.490.490.000.00%
Condensing power plants5.145.18−0.04−0.77%
Combined heat and power, total23.3023.290.010.04%
CHP industry8.788.780.000.00%
CHP district heating14.5214.510.010.07%
Total domestic production67.6767.690.02−0.03%
Import of electricity17.5019.091.59−8.32% a
Net import17.4617.440.020.11%
Total supply85.185.10.000.00%
Note: a Notice the explanation in Section 3.4.
The other examined criterion is the consumption of different fuels and corresponding carbon emissions. By calculations conducted in this study, the total fuel consumption and carbon emissions indicate relative errors of 0.33% and 2.15%, respectively. In the calculation of emission factors of different fuels, the guidelines issued by Statistics Finland are applied. The reference model in EnergyPLAN shows monthly results with a higher error, approximately 6% on average.

4. Wind Integration in Different Nuclear Scenarios

This section presents the analysis of wind integration in different nuclear capacities. We consider a set of general assumptions for all the scenarios, including an interest rate of 5% for investment in power plants. The trend of hourly prices is as for the Nordic electricity market in 2012. According to the national transmission system operator (TSO), Fingrid, the power system is capable to activate flexible demand of 200–400 MW capacity [64]. Accordingly, we primarily consider the following flexibility measures in this study in periods of excess wind production: (i) 400 MW flexible demand with a time scale of maximum 24 h; (ii) the possibility of export to the external power market (2012 interconnector capacity to the Nordics); (iii) 33 MWe LHP (i.e., Katri Vala plant) with the associated thermal storage; and (iv) decreasing the power production in CHP plants.

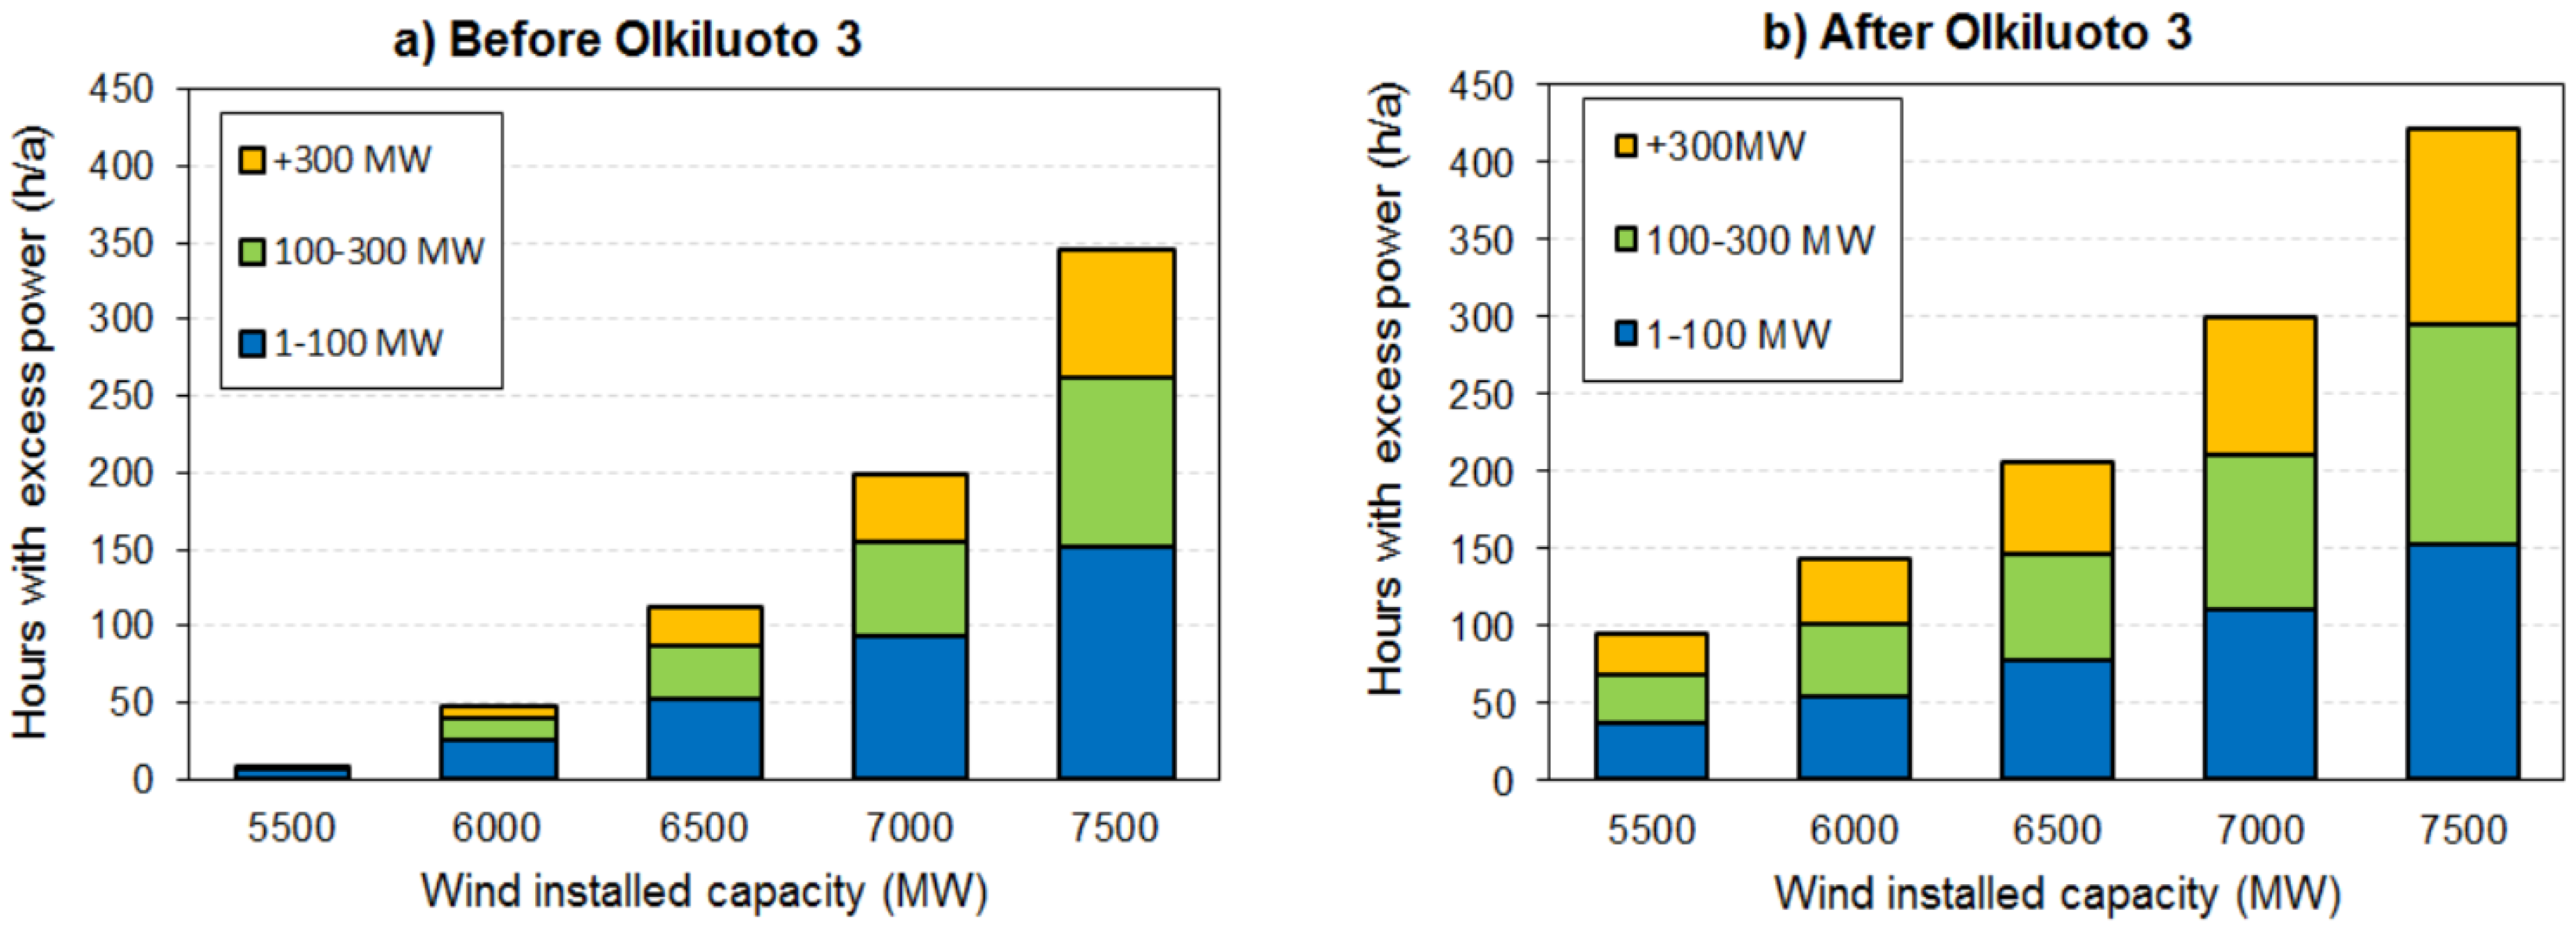
4.1. Higher Wind Integrations under Today’s Conditions

After applying the methodology explained in Section 2, we increase the share of wind capacity to monitor the impact on the existing energy system. Regarding the costs, we reviewed different studies on the present costs of wind installation [7], offshore sites [65], and the future costs [59,66]. It is expected that the investment cost of wind generation in Finland would decrease by 5% by 2030 with expanding the installed capacity [67]. The cost of power imbalance entailed by wind into the power system is also considered in the cost calculations, amounting 3–4 €/MWh of wind production [68,69].
By considering the mentioned flexibility options, the results suggest that Finnish energy system can integrate wind maximum by 18%–19% (from total power demand), which corresponds to 15.5–16.5 TWh/a annual wind production. Based on [70], power excess from wind can be measured in different time scales and magnitude. The results indicate that in wind installations of 7000 MW, Finnish power system must curtail wind productions in the magnitude of 100 MWh/h and higher in 105 h/a (hour per year). In 7500 MW wind capacity, the number of hours with more than 100 MWh/h oversupply will reach 195 h/a, with 82 h/a excess power over 300 MWh/h. We consider this event as an indicative maximum limit for wind integration, corresponding to 2%–3% wind curtailment in terms of annual wind energy production. Therefore, the maximum wind capacity can be indicatively considered as 7500–8000 MW with today’s flexibility of the energy system. This implies that the wind integration targets set by the Finnish energy policy are yet in a feasible limit. In maximum wind integrations, the share of RES in PEC will improve to 35% and the share of RES-E will reach 51% of the domestic power consumption. Total carbon emissions declines to 45 Mt/a, a 5% reduction from 2012.
Even at maximum wind integration, Finland remains a net power importer (approximately 5 TWh/a), however, with a 70% reduction compared to 2012. The most economic case occurs at 10% wind integration (~4000 MW), when the total costs of the Finnish energy system (including wind installation costs) will decline by almost 100 M€/a from 2012. The required investment for wind will be compensated by the avoided costs of the respective fossil fuels and power imports, so that the total costs of the energy system inclines: 1 MWh wind energy contributes to the national economy by 11 € (at 10% integration level and 5% interest rate).
Integrating wind is still economically profitable up to 19% (Figure 4). The profitability deteriorates beyond this level, due to the extensive substitution of power from CHP with wind power, which results in a more frequent use of heat-only boilers. The economics of different wind integration levels is investigated for two different carbon emission prices in Figure 4, promising more cost savings in higher carbon prices. Other techno-economic impacts of wind on unit commitment and reserve capacity are not considered in this analysis due to the limitations explained in Section 2.2, while the balancing costs are included.

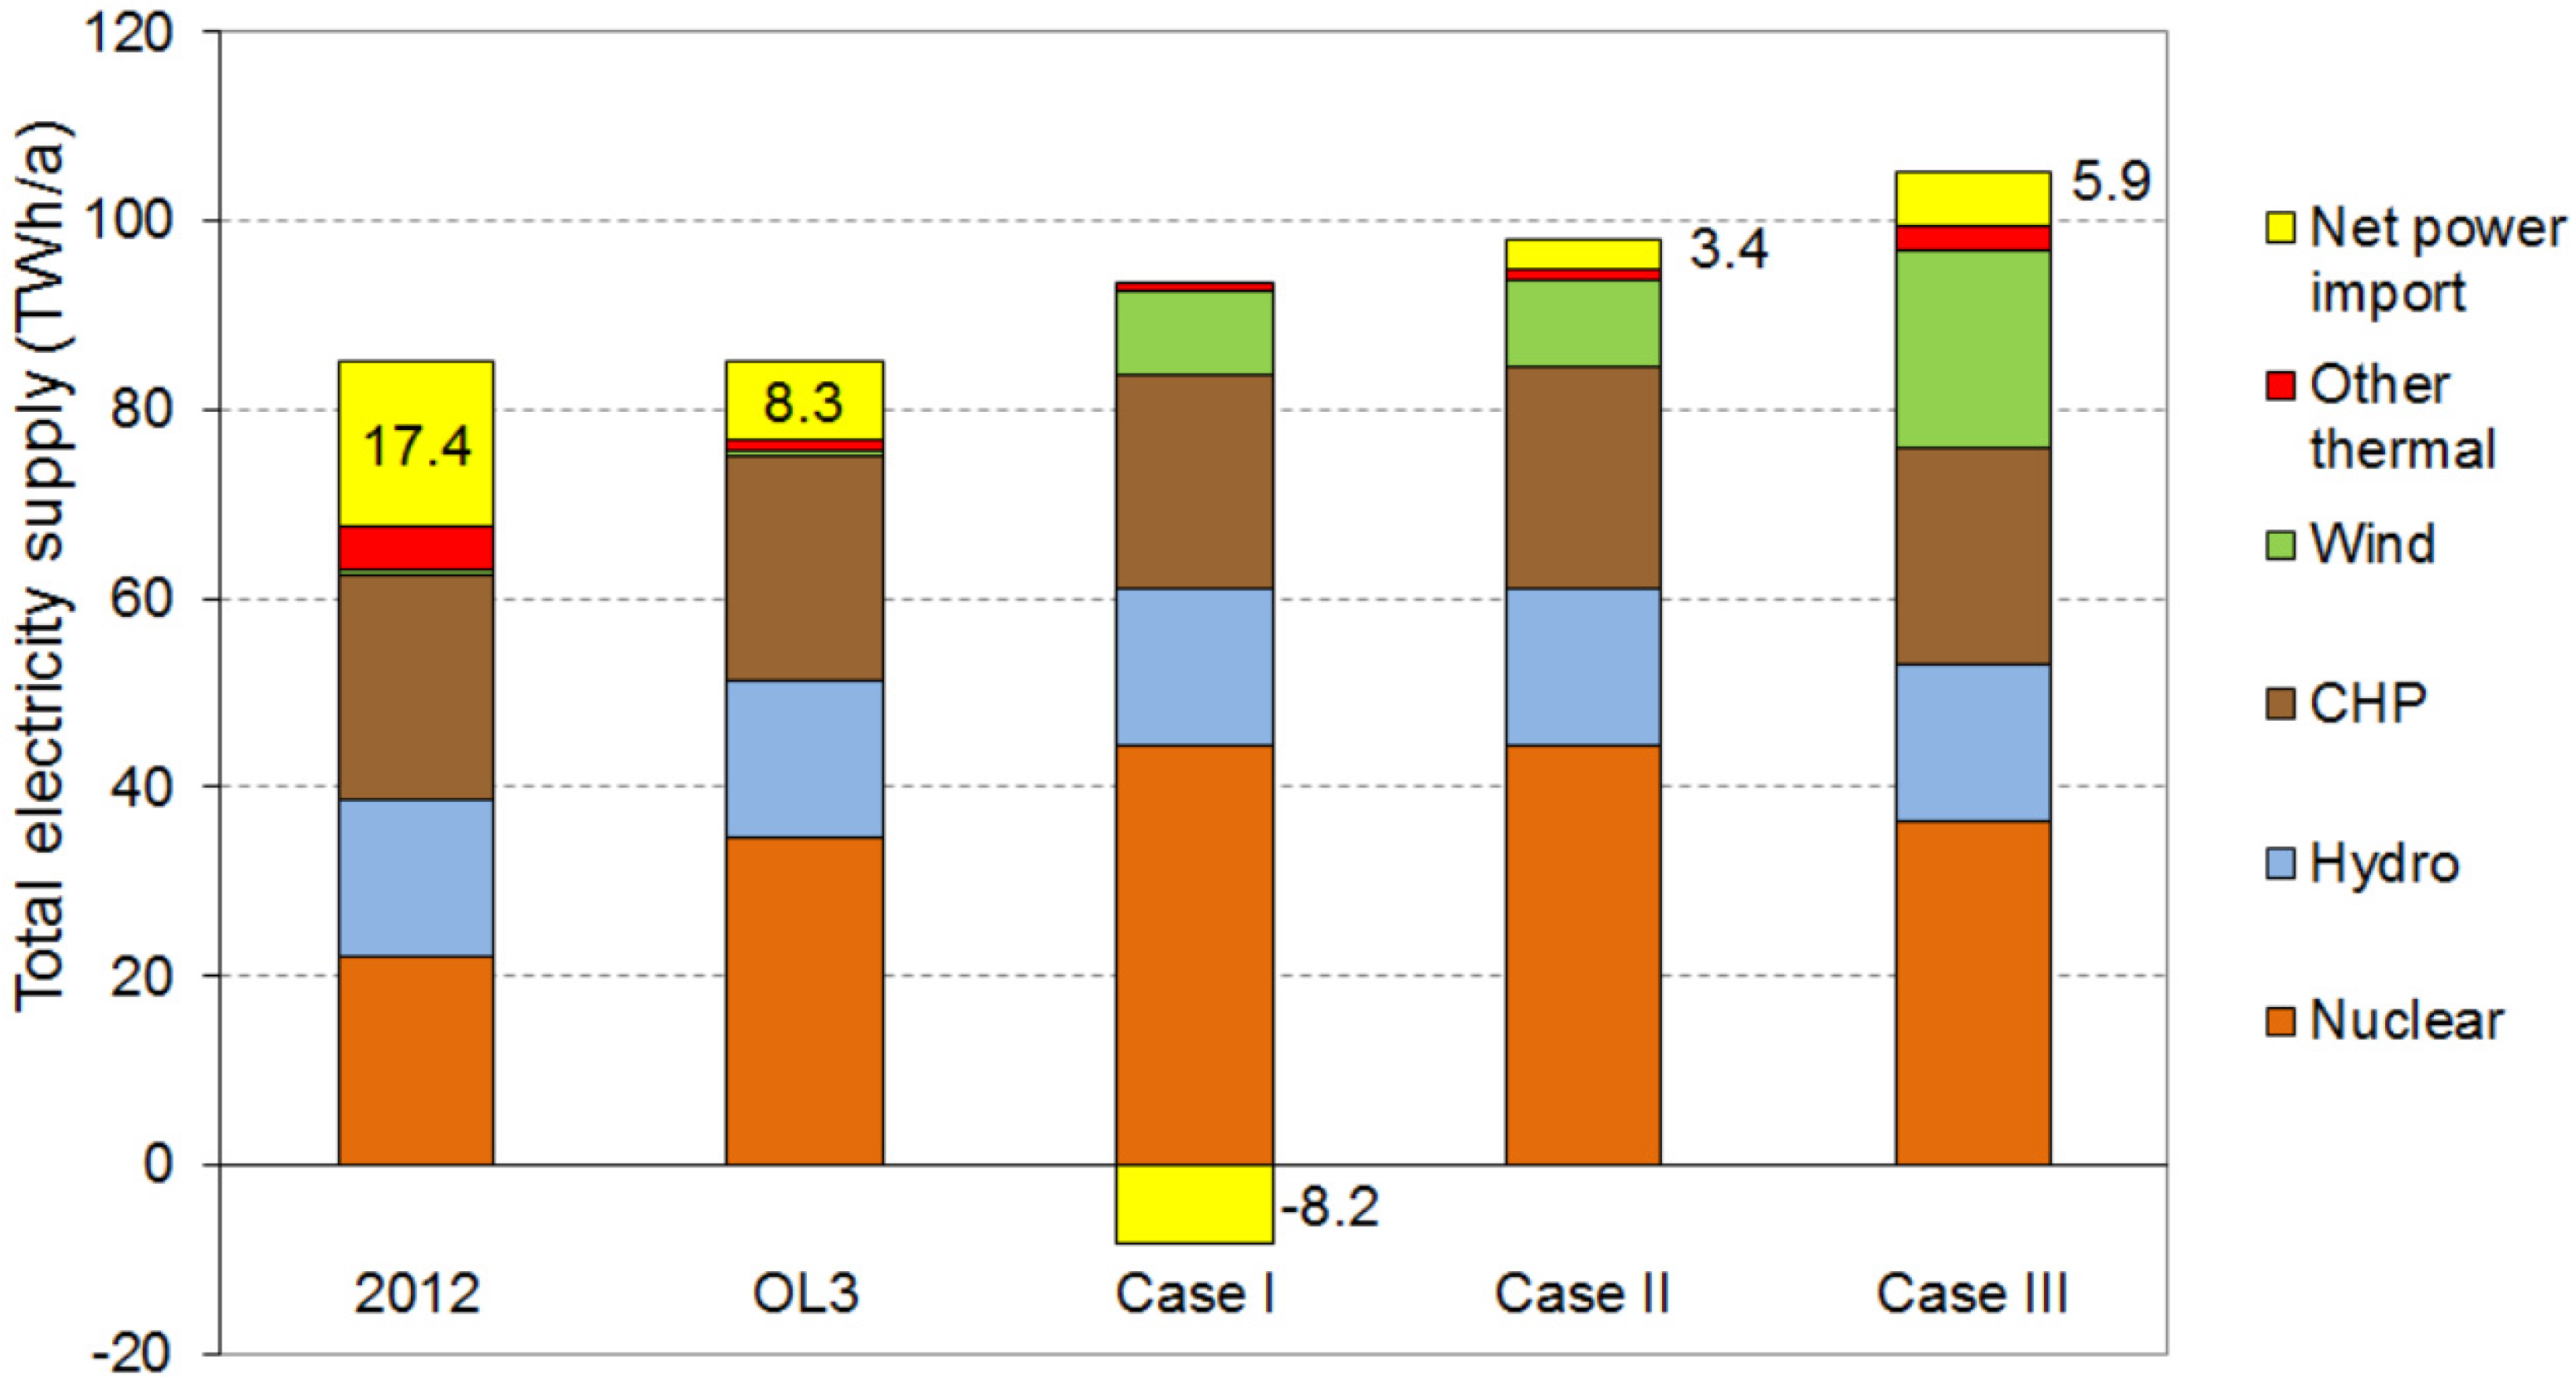
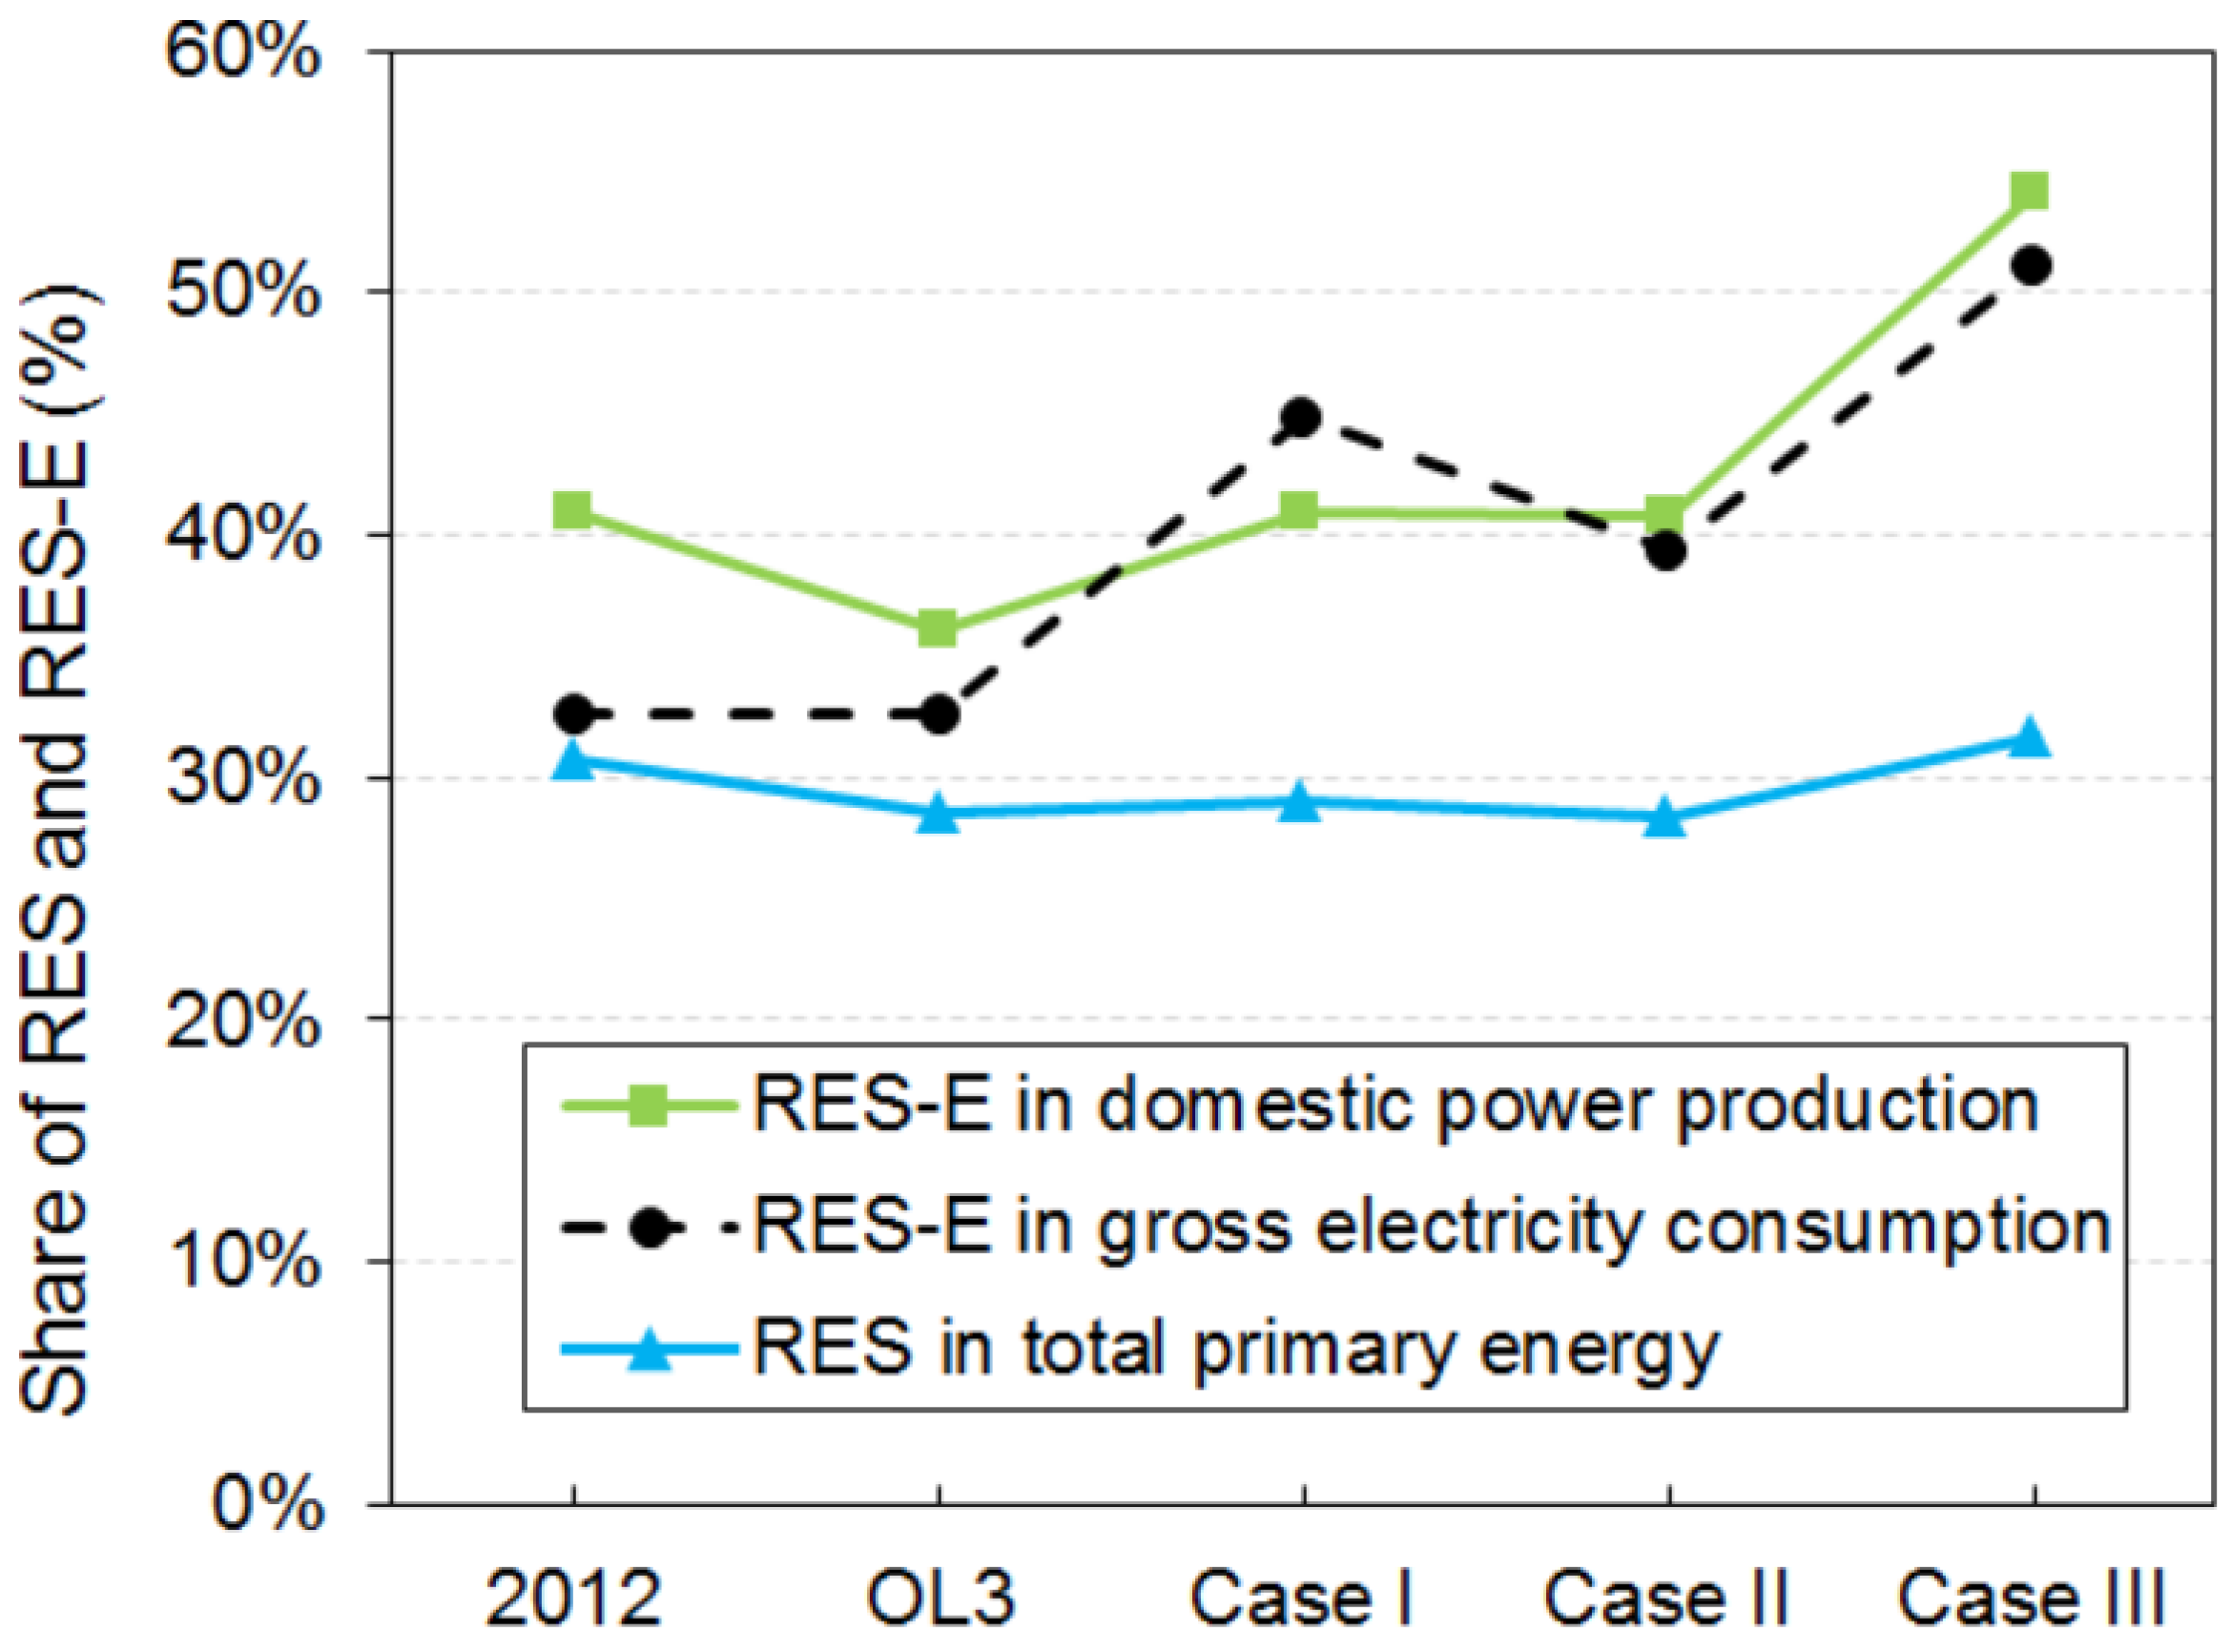
4.2. The Situation with One New Nuclear Power Plant (Olkiluoto 3)

This Section investigates the techno-economic implications of the commissioning of a new NPP (OL3) with 1600 MW power capacity. With OL3, the power from nuclear fleet will grow to 34 TWh/a, which supports 46% of the national power demand (85 TWh/a). This reduces the net power imports to 8 TWh, showing 50% cuts compared to 2014. The share of decarbonized power improves to 74% of the domestic production, resulting in 6% reduction in CO2 emissions. OL3 reduces the total costs of the energy system by 250 M€/a by averting power imports and fossil fuel consumption. After OL3, there will be 78% reduction in the power production from condensing plants. However, the share of RES in PEC will diminish from 31% to 29%.
Figure 4. Changes in total costs of the energy system under different wind integration levels and emission costs compared to 2012 (interest rate 5%).
Energies 08 02493 g004
From wind integration perspective, OL3 constrains the room for wind if the power demand remains unaltered. After OL3, in wind installations of 6500 MW, there will be approximately 205 h/a with excess power up to 500 MWh/h, indicating a 100% growth compared with the situation before OL3. Figure 5 illustrates the case of wind integration before and after OL3, this NPP diminishes the maximum possible capacity for wind by 500 MW.
Figure 5. Hours with excess power in different wind integration levels (a) before and (b) after a nuclear plant with 1600 MW capacity (OL3).
Energies 08 02493 g005
The increase in wind penetration in Finland directly affects the amount of power imports. In Figure 6, the changes in the share of different power production modes is illustrated, from today to the nuclear capacity of 4400 MW (after OL3), for different wind integration levels. Wind integration gradually improves the share of RES in PEC, yet lower than 2012 even with 4000 MW wind installations after OL3 (see Table C1, Appendix C for more details). Analysis of the total costs of the energy system reveals that any wind integration level will be unprofitable after OL3 (with fixed demand and emission costs as 2012). The economy of wind integrations up to 5000 MW installed capacity is compared for the cases with and without OL3 in Figure 7.
Figure 6. Evolution of power supply mix in Finland from 2012 to the commissioning of Olkiluoto 3 (OL3), and further in wind integrations up to 4000 MW (power demand 85 TWh/a)—The amount of net power imports are labeled on each bar.
Energies 08 02493 g006
Figure 7. Changes in total annual costs of the Finnish energy system in wind integrations up to 5000 MW with and without the new nuclear plant (OL3), (interest rate 5%).
Energies 08 02493 g007

4.3. Finnish Energy System after 2020

This Section represents the period when the second NPP with a capacity of 1200 MW will be in operation (Hanhikivi 1 operated by Fennovoima (FV1)), boosting the national nuclear capacity to 5580 MW. We analyze this scenario with different projections for the power demand, Case I with a demand as 2014 and Case II with the projected demand of 98–100 TWh/a. In these Cases, the government’s wind target of 9 TWh is taken into account. In Case III, 1000 MW nuclear capacity will be decommissioned after 2030 (the phase-out of Loviisa plants) while 20% of the power demand is supplied by wind. The heat demand is considered to remain unaltered.
A summary of the assumptions applied in this Section for the three scenarios is presented in Table 3. The future fuel prices are based on IEA World Energy Outlook [1]. The estimation of future electricity prices and carbon emission costs are obtained from [71].
Table 3. Assumptions and projections for Finnish energy system in the decade of 2020s.
Transition Phases in the Nuclear FleetUnitScenarios
Case ICase IICase III
Nuclear capacityMW558055804580
Share of nuclear from total power production-52%47%36%
Onshore wind (capacity factor 24%)MW360036008400
Offshore wind (capacity factor 25.5%)MW6006001400
Total wind productionTWh/a9921
Wind integration (from total demand)-10.5%9.5%20%
Total power demand aTWh/a8598105
Electric vehicles (from total demand)TWh/a0.512
Max transmission capacity (for export)MW250025002500
Carbon emission costs€/tonne182432
Note: a Including the growth in the use of individual HPs.
Figure 8 portrays the evolution of Finnish energy system under the examined Cases. The results suggest that Finland will be a net power exporter with the addition of two new NPPs and 4200 MW wind installed capacity. Case II demonstrates that Finland will be again a net power importer if the power demand grows by 10% compared to 2014. After the decommissioning of two old NPPs (probably Loviisa 1 and 2), Finland requires 6 TWh power imports to fulfill the demand.
In Figure 9, the share of RES and RES-E in high integrations of nuclear and wind are compared to 2012. Based on the hourly analysis, Finnish power system does not encounter any major challenge during the transition period (three cases in Table 3), if the interconnection capacity could be fully employed at the periods of excess domestic power supply. The electricity demand in the other countries connected to Finland is assumed to remain constant based on the price pattern in 2012. In the absence of a cross-border model, it is not possible to model/estimate the transitions in the other countries in the same period. In another set of simulations, the maximum possible wind integration in different scenarios for nuclear is portrayed in Table C1, Appendix C.
Figure 8. Finland’s power production mix and the share of power exchange in different Cases, compared to 2012 (see Table 3). Power exchange values are labeled.
Energies 08 02493 g008
Figure 9. Share of RES and RES-E in different Cases compared to 2012, based on the assumptions in Table 3 (OL3: Olkiluoto 3).
Energies 08 02493 g009

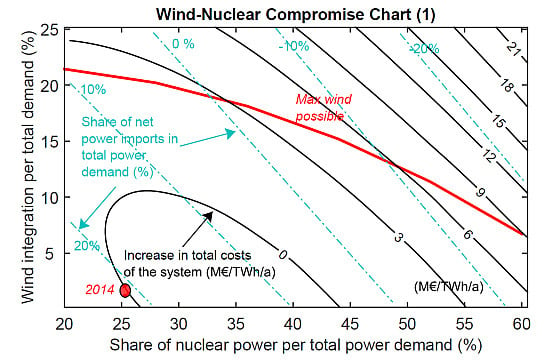
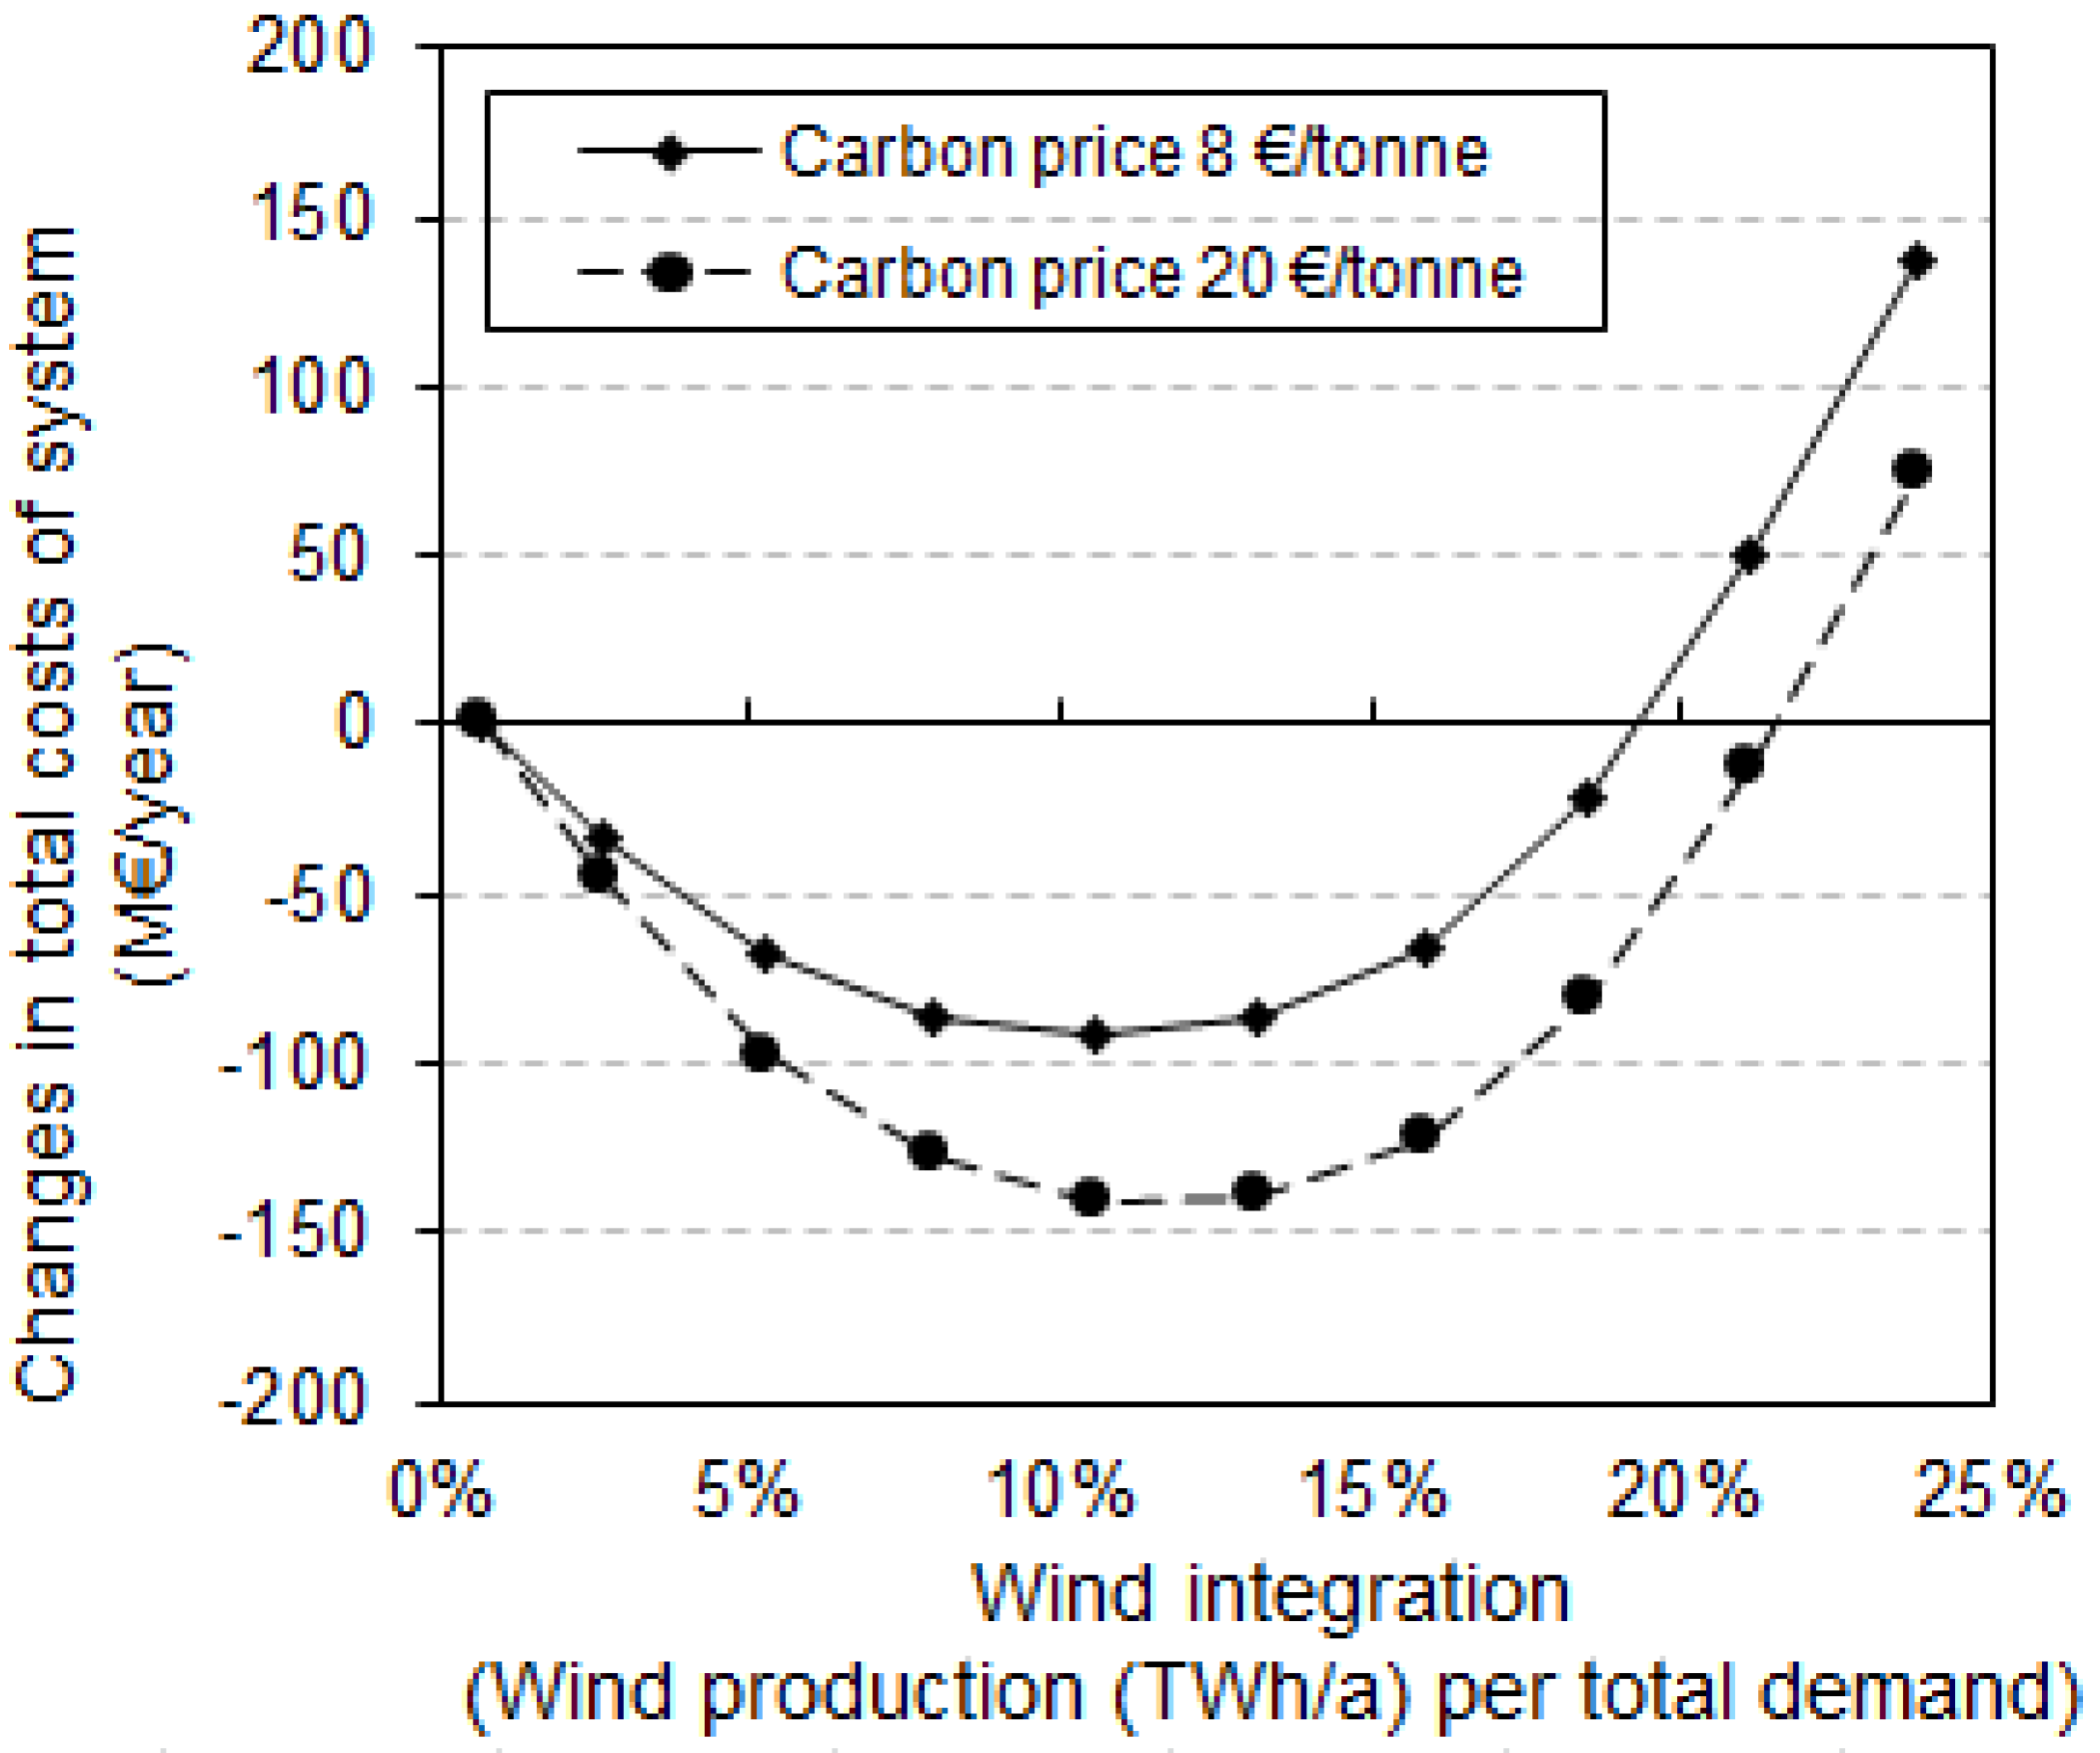
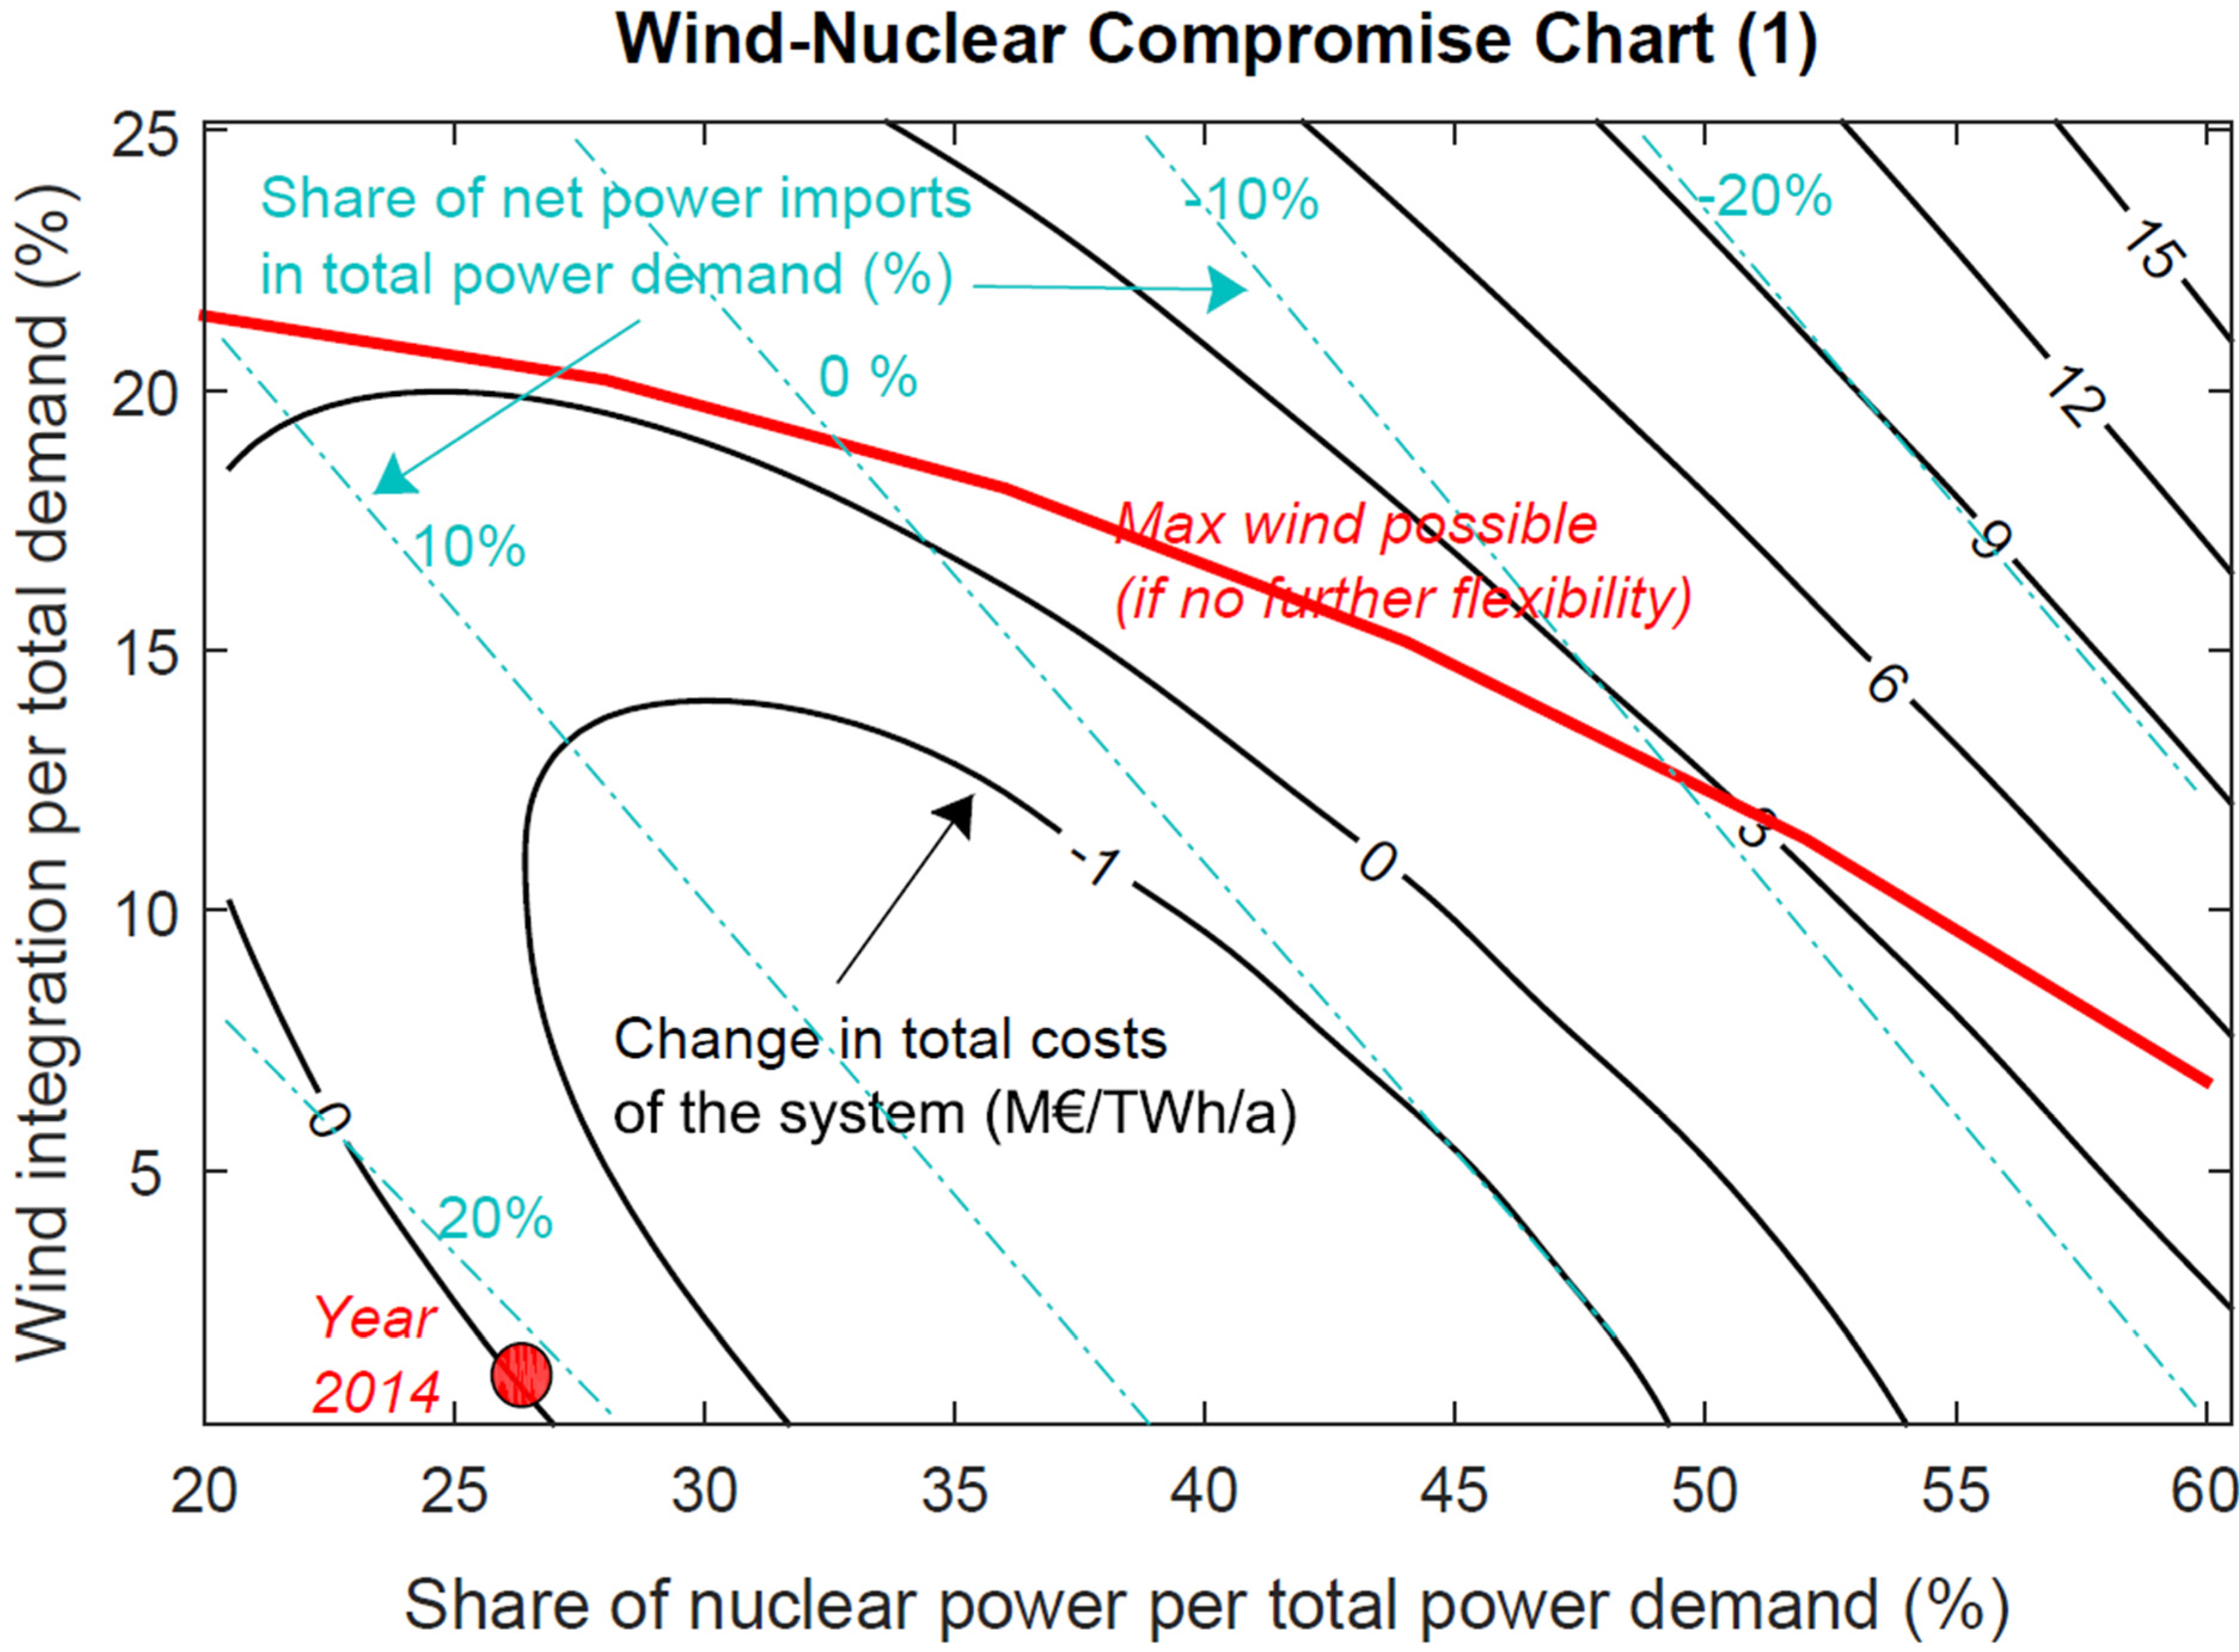
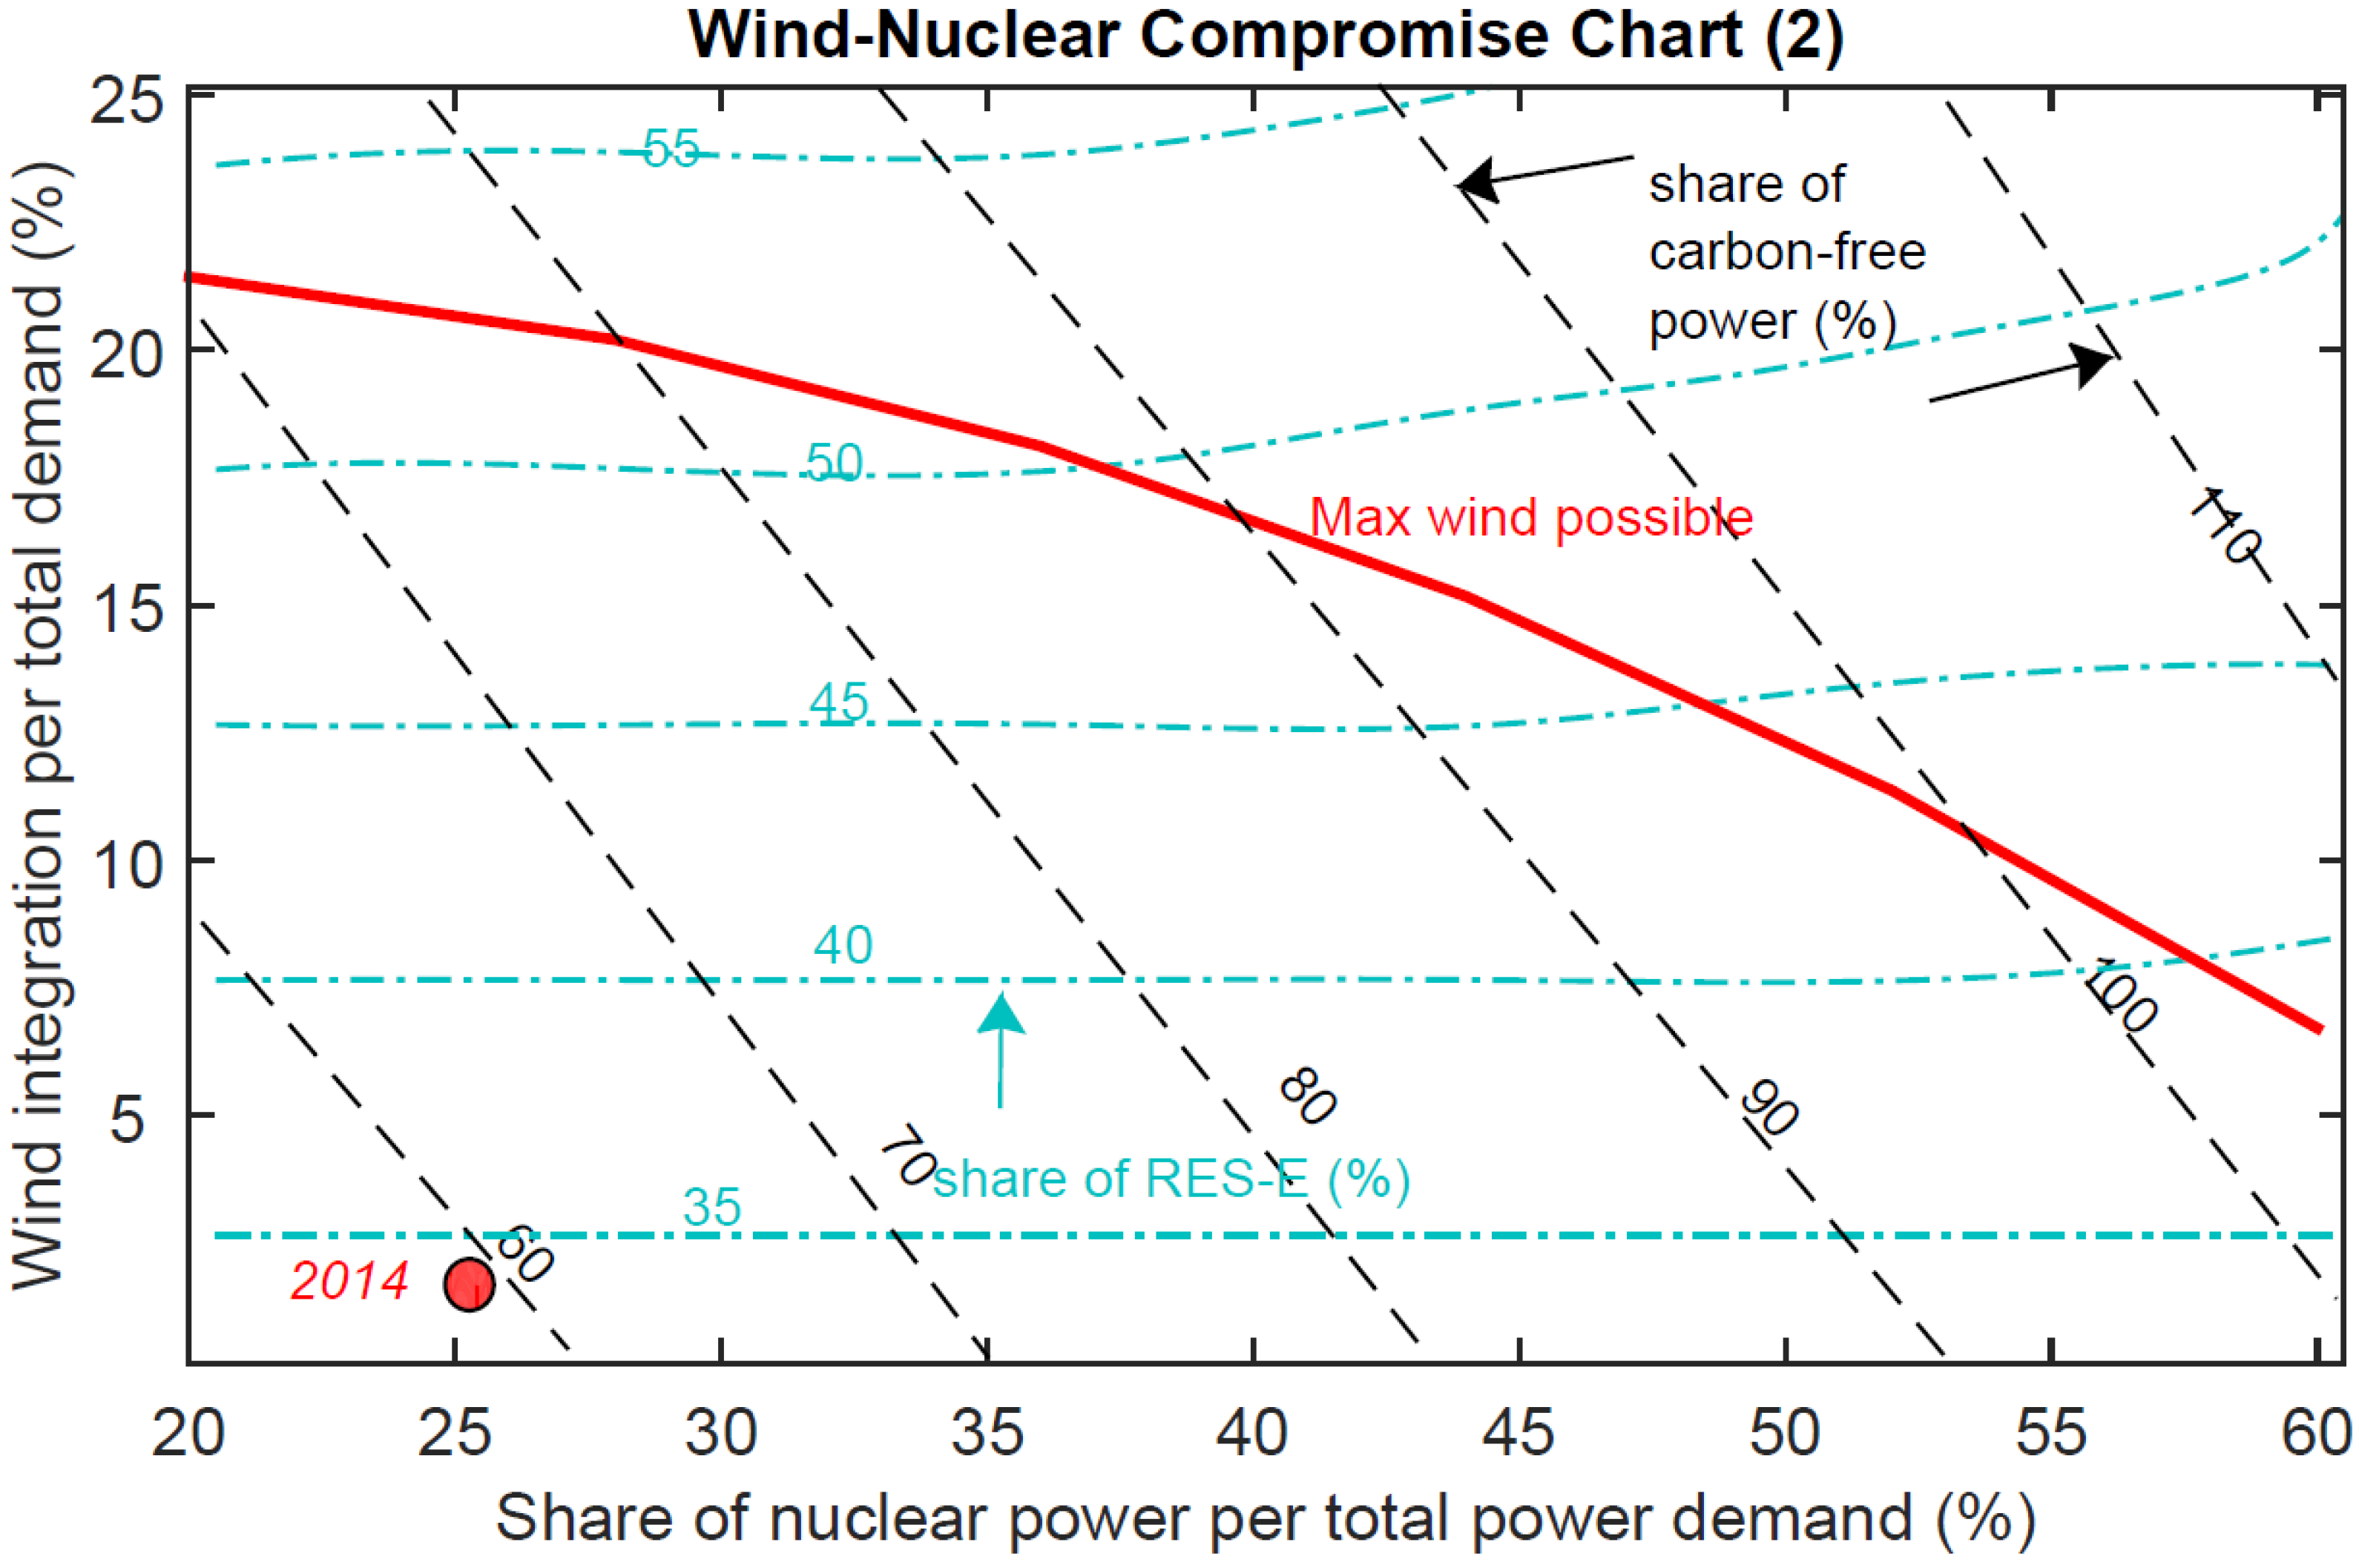
4.4. Wind-Nuclear Compromise Charts

We explore the maximum wind penetration level for three distinctive periods of the nuclear development in Finland for the power demand between 85 and 100 TWh. The results indicate that the Finnish nuclear policy will deteriorate the potential for wind, while improving the country’s energy security and decarbonization targets (see Table C1, Appendix C). The other significant outcome is the concave, descending, polynomial relationship between the share of nuclear (N) and maximum wind ( W m a x ) in the energy system explained by Equation (2) (it should be noted that the share of each technology should be inserted in decimals, values between 0 and 1). It implies that the more growth in the share of nuclear in the domestic power production will result in a parabolic reduction in the maximum potential for wind. This relationship is illustrated in Figure 10 with the red line. The criterion for the maximum wind is an annual wind curtailment of 2%–3% relative to the total wind production (based on hourly analysis):
W m a x = 0.472   N 2 + 0.0873   N + 0.216   ( % )
An energy system can be optimized based on 11 different parameters [72]. In this study, we examine the case of wind-nuclear intersection with regard to five optimization criteria: maximum wind integration, self-sufficiency, total costs, carbon emissions of the energy sector, and renewable energy in the electricity supply. In Figure 10, the wind-nuclear compromise chart is illustrated for three criteria: maximum possible wind, self-sufficiency in power supply, and total costs of the energy system (for the remaining parameters see Figure C1, Appendix C). The results reveal that the maximum potential for wind will decline below 10% in nuclear shares of higher than 55%. Alternatively, the Finnish energy system may not be able to balance out the power import/export in the shares of nuclear less than 31% of total power demand. For the preparation of wind-nuclear compromise charts, it is assumed that the share of other power production units as well as the flexibility of the energy infrastructure remains unaltered.
Figure 10. Wind-nuclear compromise chart with respect to self-sufficiency in power supply and total costs of the energy system (max wind possible (red curve), share of net power imports per total electricity demand (blue dash lines), change in total costs of the energy system compared to 2014 (per unit of annual power demand, M€/TWh/a) (black line)). The state of the energy system in 2014 is highlighted with a red circle. For wind-nuclear compromise chart (2), the reader may refer to Figure C1, Appendix C.
Energies 08 02493 g010

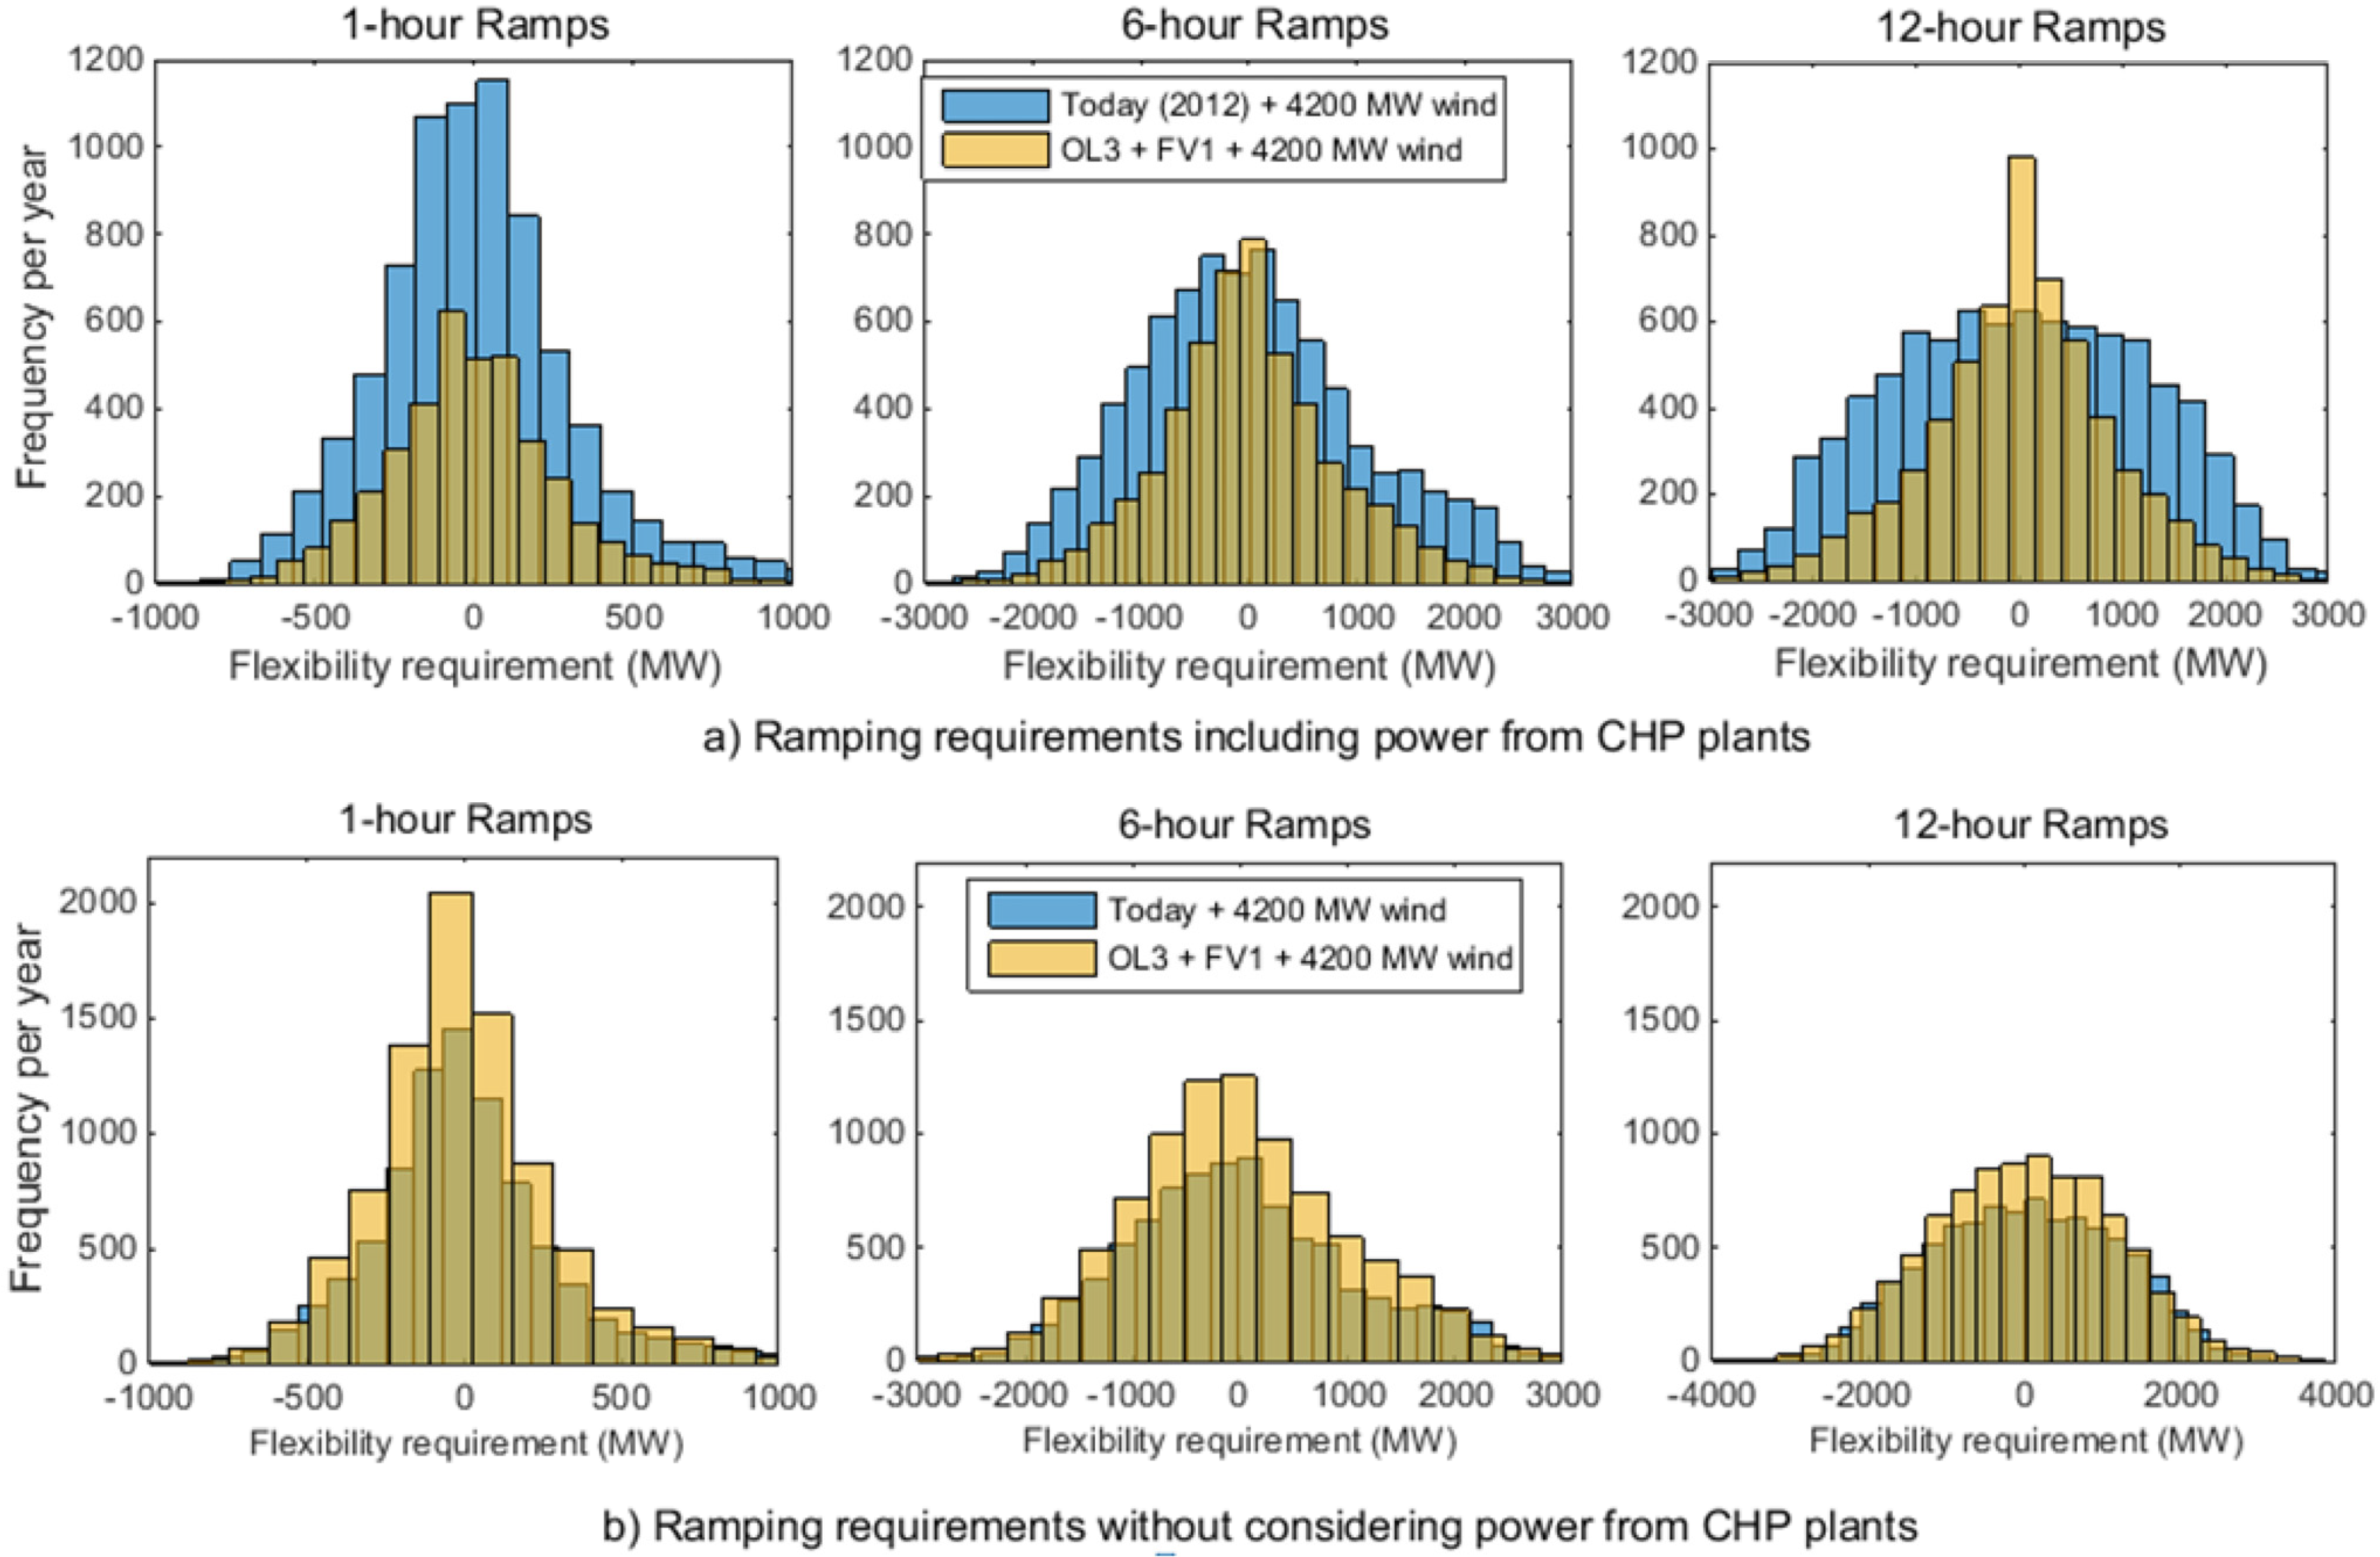
4.5. Nuclear-Wind Integration and Power Ramping Requirements

In this Section, the flexibility requirements are modeled for the net load ramps with a time horizon of 1 to 12 h. The ramping rate of power production modes (P) and power demand (L) in an interval (h) is explained by Equation (3) at any specific time (t), where t { h + 1 , h + 2 , , 8760 } [73]. The non-dispatchable and inflexible power production modes do not follow the load, e.g., variable RES ( P V R E S ), which encompasses wind and must-run hydropower (both river hydro and the surplus of other hydropower plants when their reservoir capacity is full). Power from CHP plants ( P C H P ) that are following their respective heat demand is another varying production mode. By subtracting variability of supply and demand, the net ramp loads ( h L n e t )   can be calculated by Equation (4):
h P ( t ) = P ( t ) P ( t h )   ( MWh / h )
h L n e t ( t ) = h L ( t ) h P V R E S ( t ) h P C H P ( t )   ( MWh / h )
In high-level wind integrations, the dynamics of the energy system is partially capable to balance the hourly variations in power demand and supply, without additional back-up (e.g., by adjusting hydropower production or regulating power from CHP). The remaining ramping requirements should be met by thermal power plants, power exchange through cross-border intraday and regulation markets, or other flexibility solutions (including NPPs if possible). By calculating the frequency of ramping needs in different time scales, we compare two cases of today plus 4.2 GW wind with Case I (two new NPPs and 4.2 GW wind) in Figure 11. The flexibility requirements are quantified in cases with and without power from CHP plants. The results indicate a much lower ramping needs if the role of CHP plants is taken into account (comparing Figure 11a with Figure 11b). The correlation between power and heat demand creates a good opportunity for CHP plants to contribute in decreasing the ramping requirements. On the other hand, the results suggest lower 1-h ramps when two new NPPs enter the grid, compared with today (in the case with CHP plants, Figure 11a). This can be interpreted by considering the fact that a significant part of ramping needs must be maintained by power imports and condensing plants in today’s conditions (even after 4.2 GW wind). However, with two new NPPs, the power system encounters tighter bounds between the maximum capacity of NPPs and load at each hour (a 2800 MW tighter margin compared with today). Therefore, the addition of 4.2 GW wind in this compressed margin will result in many excess power occasions per year. Without considering power exports, this oversupply has to be mainly alleviated by declining power from CHP plants. Consequently, power supply and demand meet each other precisely in a large number of hours a year, leaving the ramps merely caused by load in Equation (4). If we ignore the flexibility that CHP plants can provide (Figure 11b), the ramping needs after new NPPs will be higher than today in each time scale.
The authors admit that the results of this Section can be affected by growth in the power demand, considering the actual operation of power plants, and power transmission possibilities. We do not hence draw a precise conclusion and the results are an indication to highlight the role of intermediate power (and heat) production portfolio in smoothing the ramping needs of high-level wind-nuclear scenarios. It is argued that the third generation of NPPs has load-following capabilities according to the EU Utility Requirements [74]. The practicality of employing capital-intensive NPPs in part-load operation to provide flexibility for the power system calls for a separate study.
Figure 11. The frequency and magnitude of 1-, 6-, and 12-h ramps in net power load after adding 4200 MW wind installations, (a) with power from CHP and (b) without power from CHP. The case is compared for today (blue) and after two new NPPs in Case I (yellow), with fixed power demand (85 TWh/a).
Energies 08 02493 g011

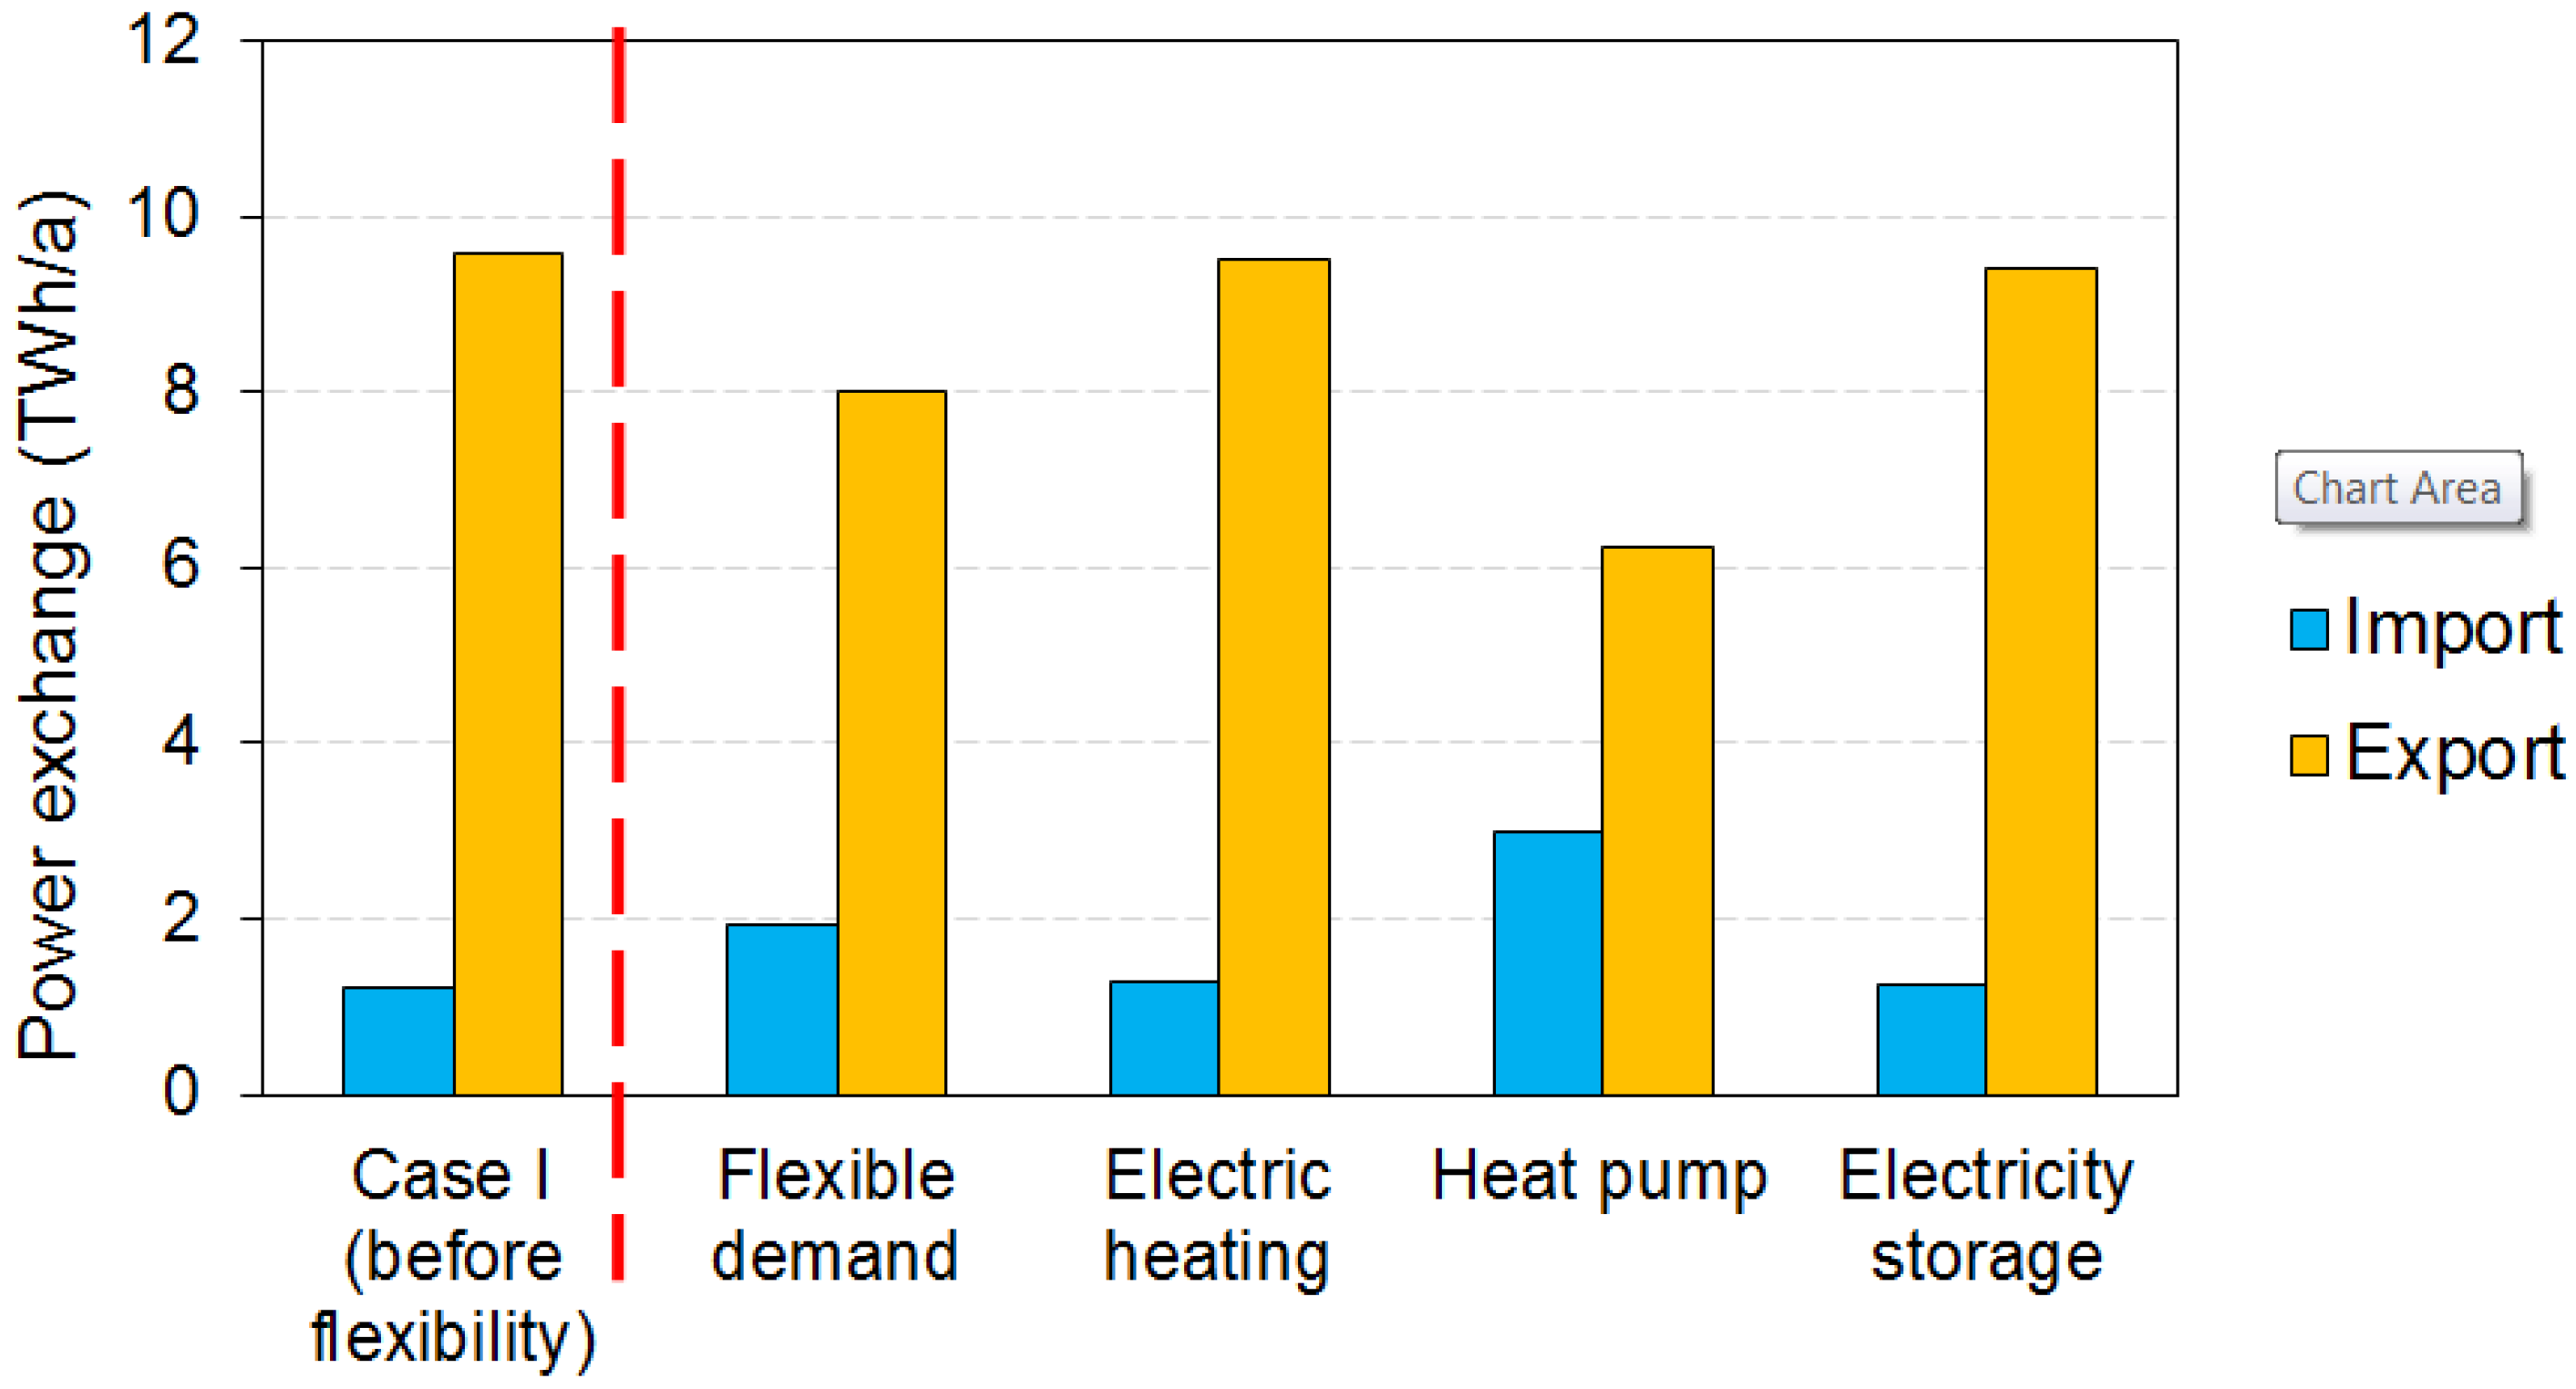
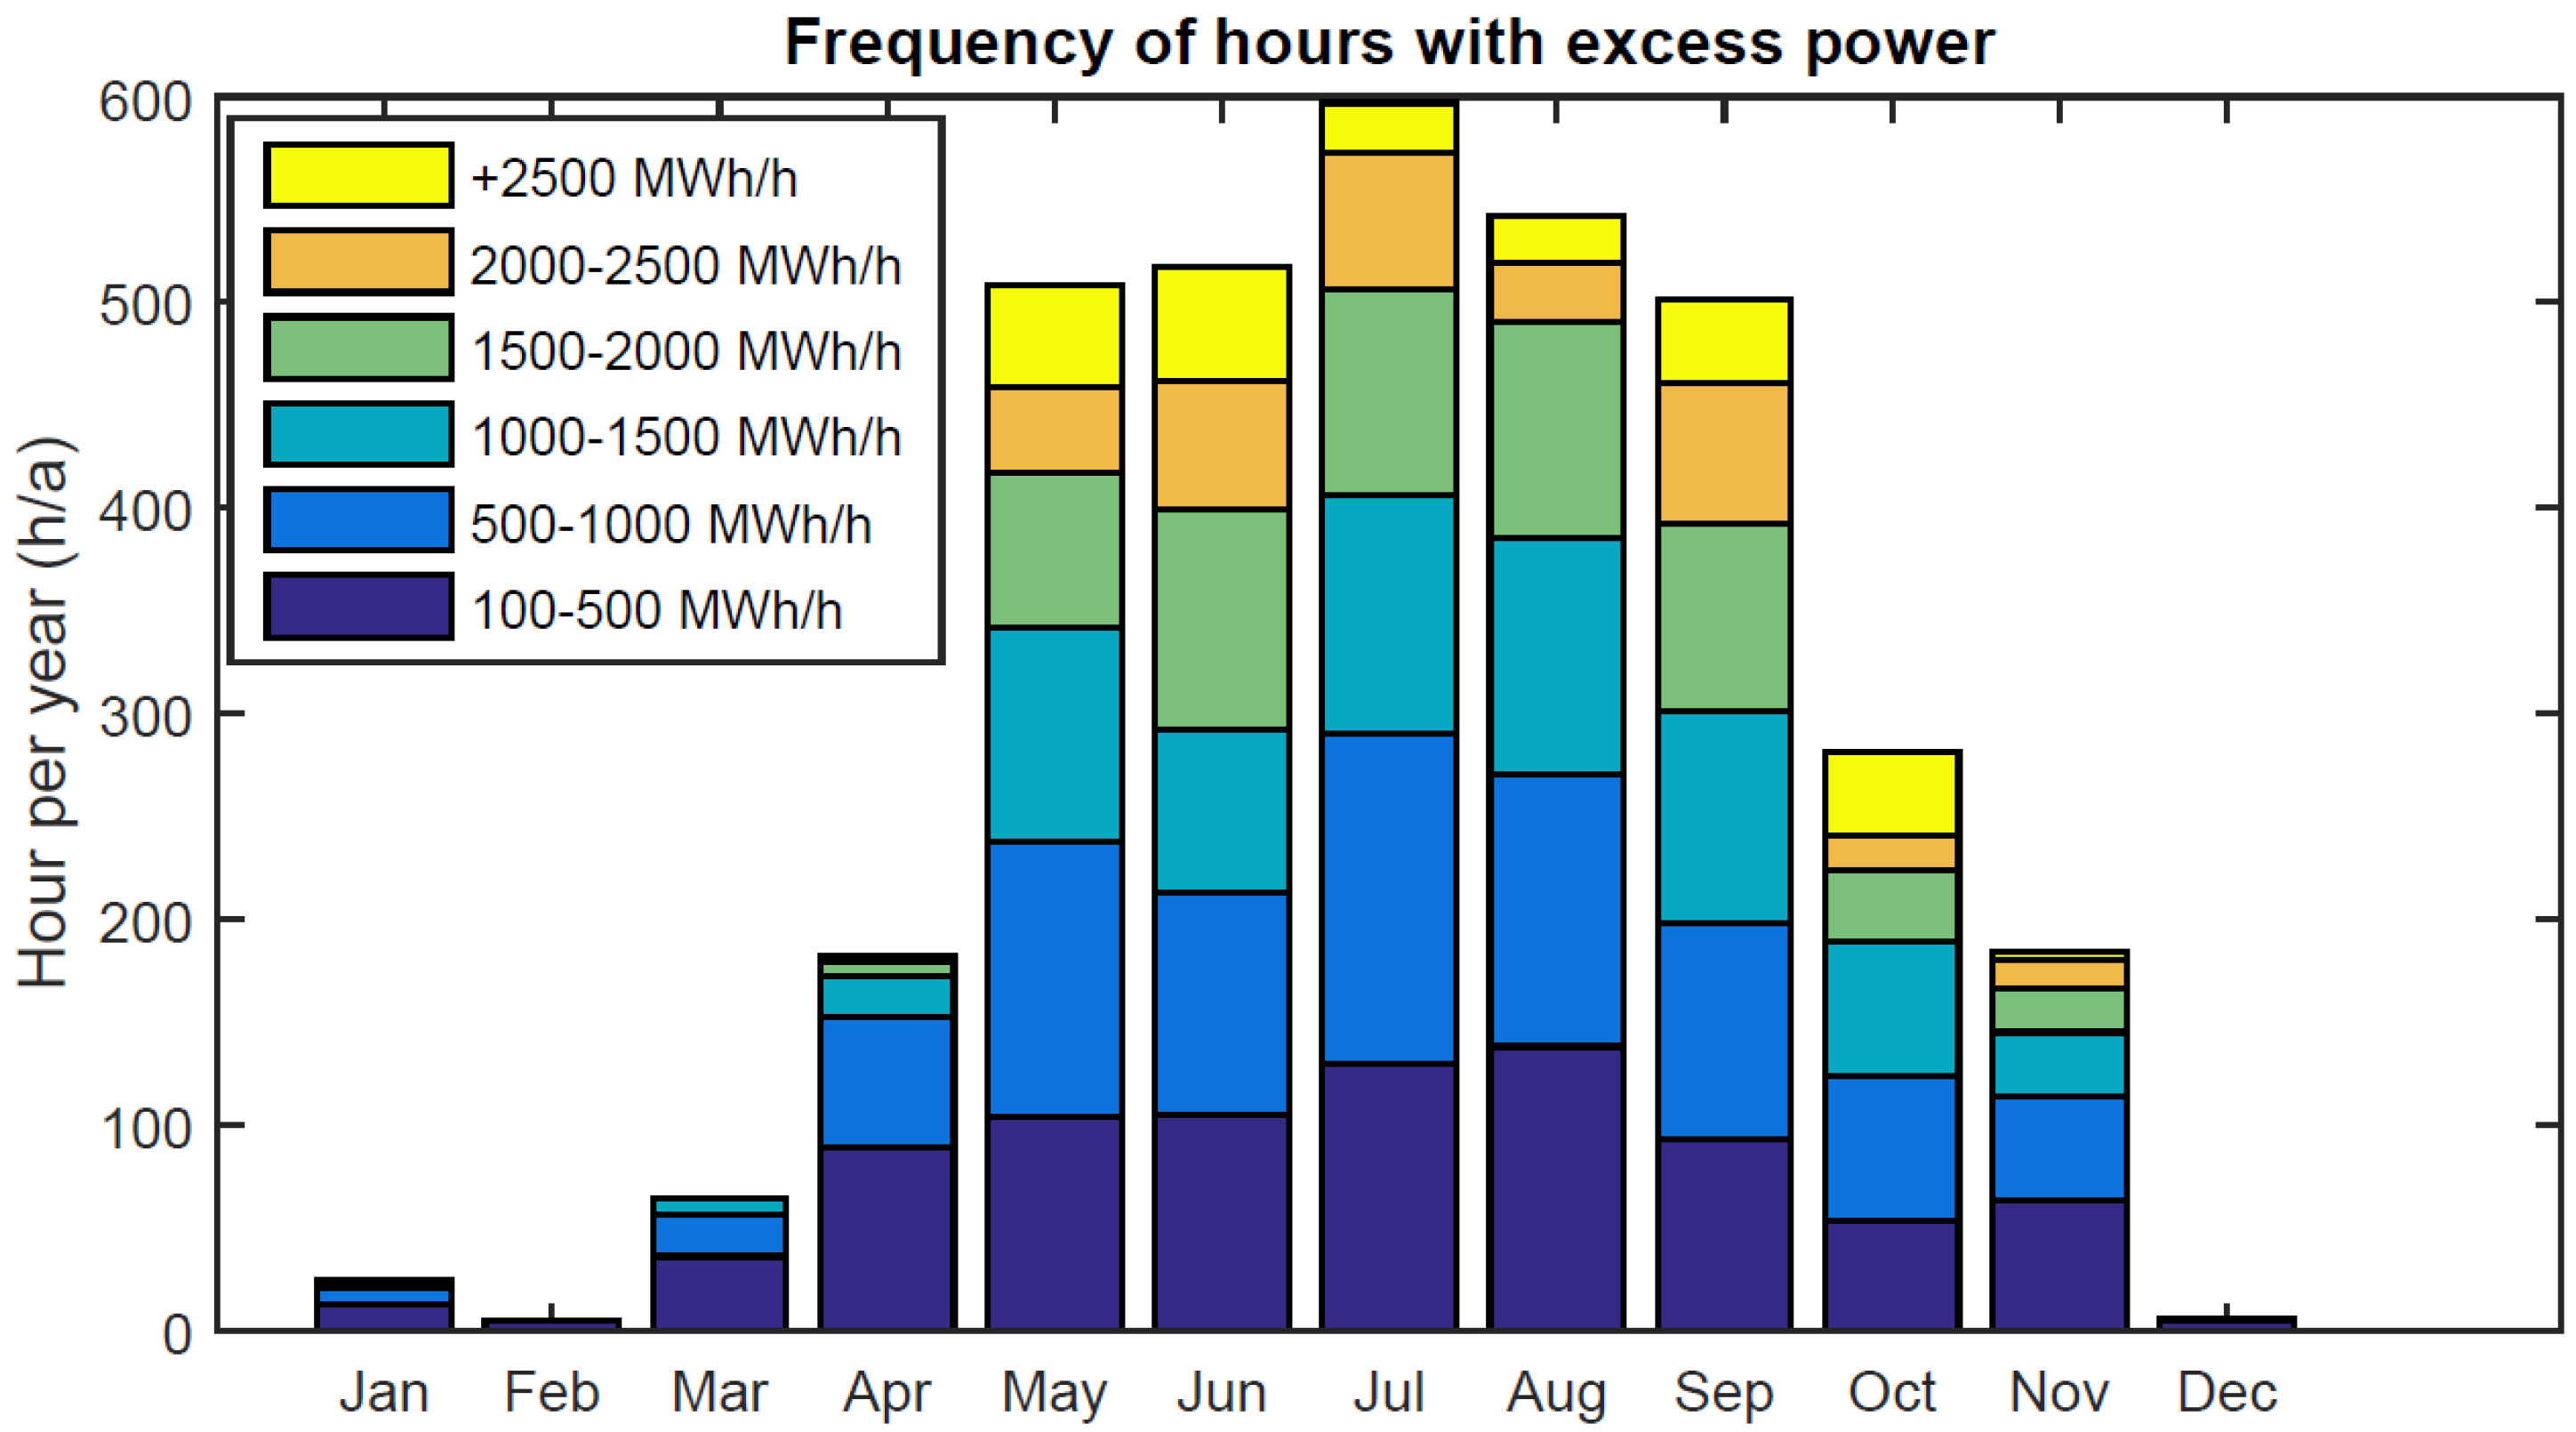
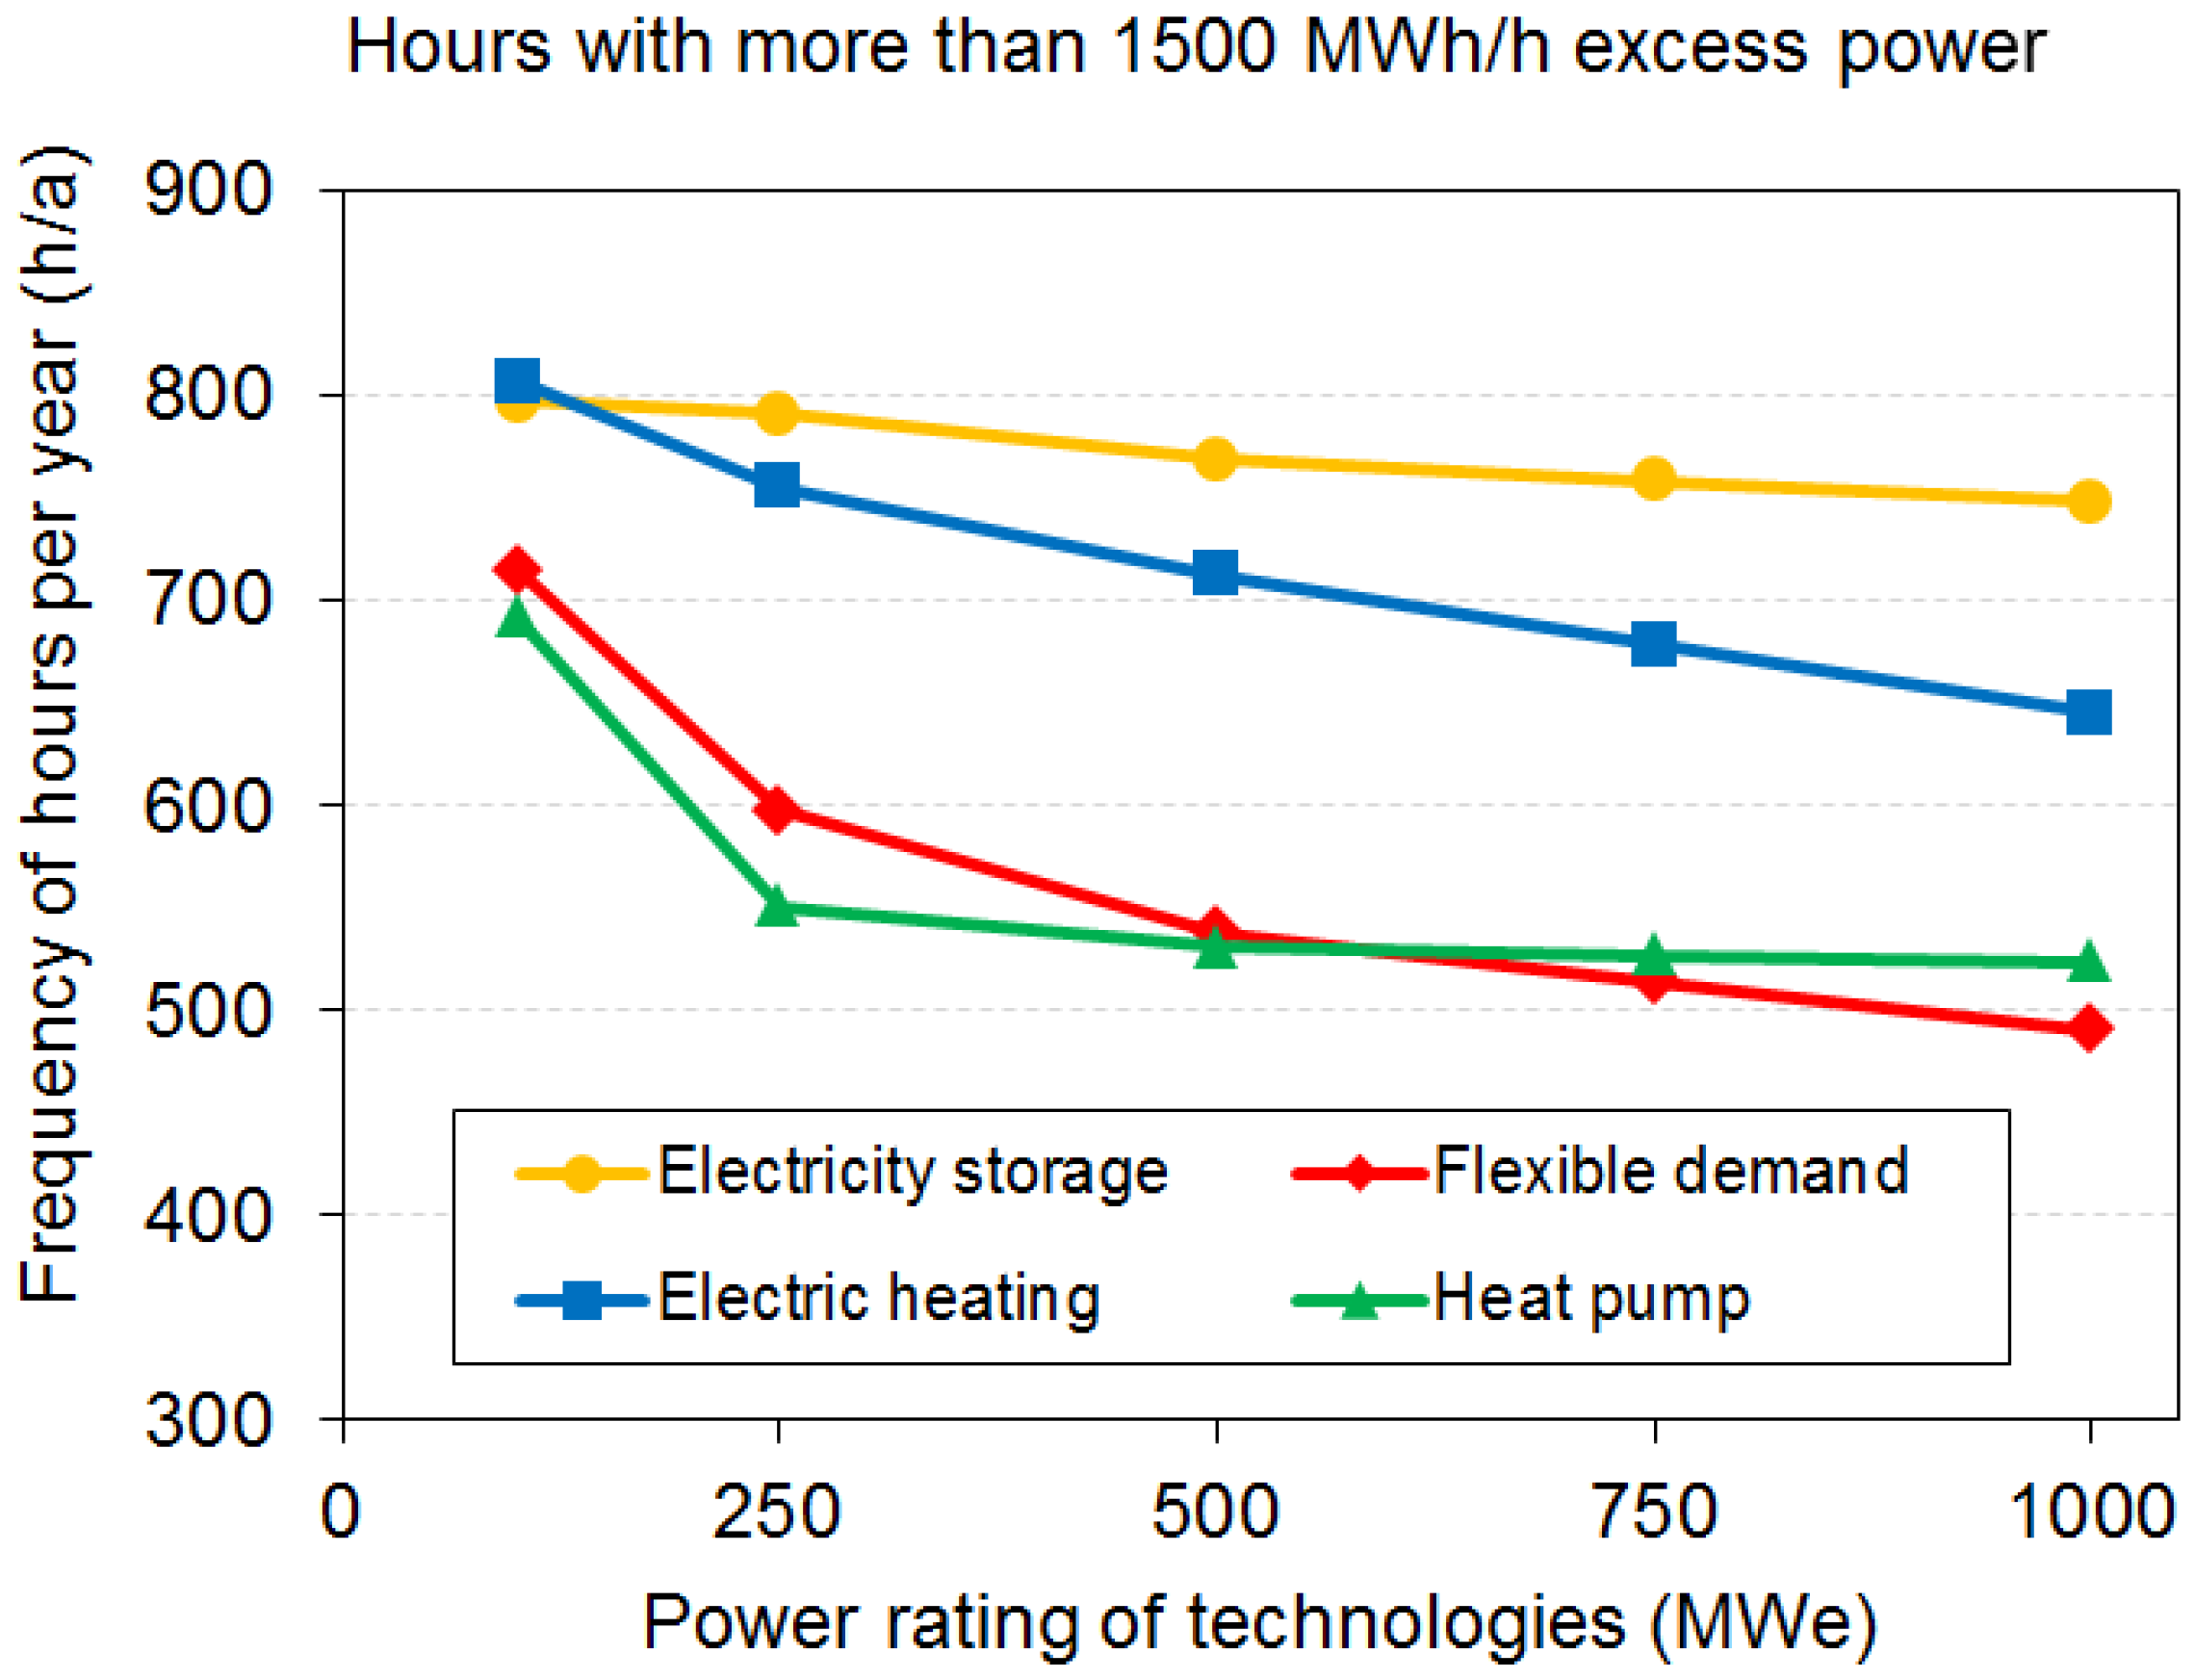
5. Excess Power and Alternative Solutions for Increasing the Flexibility

By employing the technical optimization module in EnergyPLAN, the possibility of power exchange with other electricity markets can be deactivated. Therefore, the capability of the energy system in absorbing the excess power is evaluated as a closed system. The Case I with 57% nuclear production and 10% wind integration is further analyzed in this Section. Two different time spans are contrasted to examine this combination of nuclear and wind in winter and summertime. In Figure 12, the state of Finland’s domestic power supply (excluding condensing plants) and total hourly demand is illustrated in Figure 12a January and Figure 12b June for the Case I.
In the wintertime, the hourly changes of demand and wind production are mostly balanced by the domestic power mix and the power surplus remains in the export capacity limits. While hydro storages are restricted in Finland, they contribute in the balancing of power demand and supply. In hours with excessive wind production, the share of power from CHP diminishes, leaving heat-only boilers to supply the corresponding heat demand. The analysis shows that for those hours without noticeable wind generation, the system is capable to supply power from condensing plants and/or power imports.
In Figure 12b, the situation in June is simulated, illustrating that the nuclear power and must-run hydropower can fulfill the demand in low- and medium-demand hours. The excess power in periods of low demand can be explicitly distinguished by hourly analysis. The share of hydropower remains high as the water reservoirs after the spring and storage possibilities are very limited (4 TWh for Finland). A marginal fraction of CHP plants are still operating in the industry or for the supply of hot water or other heat demand.
Figure 12. Variations in electricity demand and domestic power supply (excluding condensing plants) in (a) January and (b) June (Case I, without power imports, Table 3).
Energies 08 02493 g012

5.1. Dealing with Excess Power

Each energy system may benefit from some inherent flexibility in dealing with the events of undesirable power production. With employing EnergyPLAN and applying the regulation strategies illustrated in Figure 1, the capability of the Finnish energy system in absorbing excess power is examined in this Section. Figure 13 demonstrates the frequency of hours with extra power exceeding the domestic demand, as well as the amount of this excess power for Case I. According to the results, there will be approximately 3400 h/a (hour per year) with excess power production of higher than 100 MWh/h, of which the excess power may exceed 1500 MWh/h in 1080 h/a. The excess power occasions mainly occur in periods with lower power and heat demand. The results indicate an increase in the utilization of heat-only boilers in the DH systems, if the power from CHP plants is reduced in periods of excess power.
Figure 13. The frequency and magnitude of excess power in different months of the year (conditions for Case I, see Table 3).
Energies 08 02493 g013
Different studies have addressed the cases for harvesting excess power from variable RES, for example by energy storage or the electrification of heat sector [75]. In [76], seven alternatives are compared for integrating variable RES. For low to medium-level RES penetrations, the deployment of power to gas technologies is not taken into account. Therefore, in this study, four alternative solutions are employed to balance the excess power, including flexible demand, electric heating, LHPs, and electricity storage. A capacity of 300 MWe is first considered for each option to monitor their impact on the energy system (heat and power sectors) in dealing with the excess power.

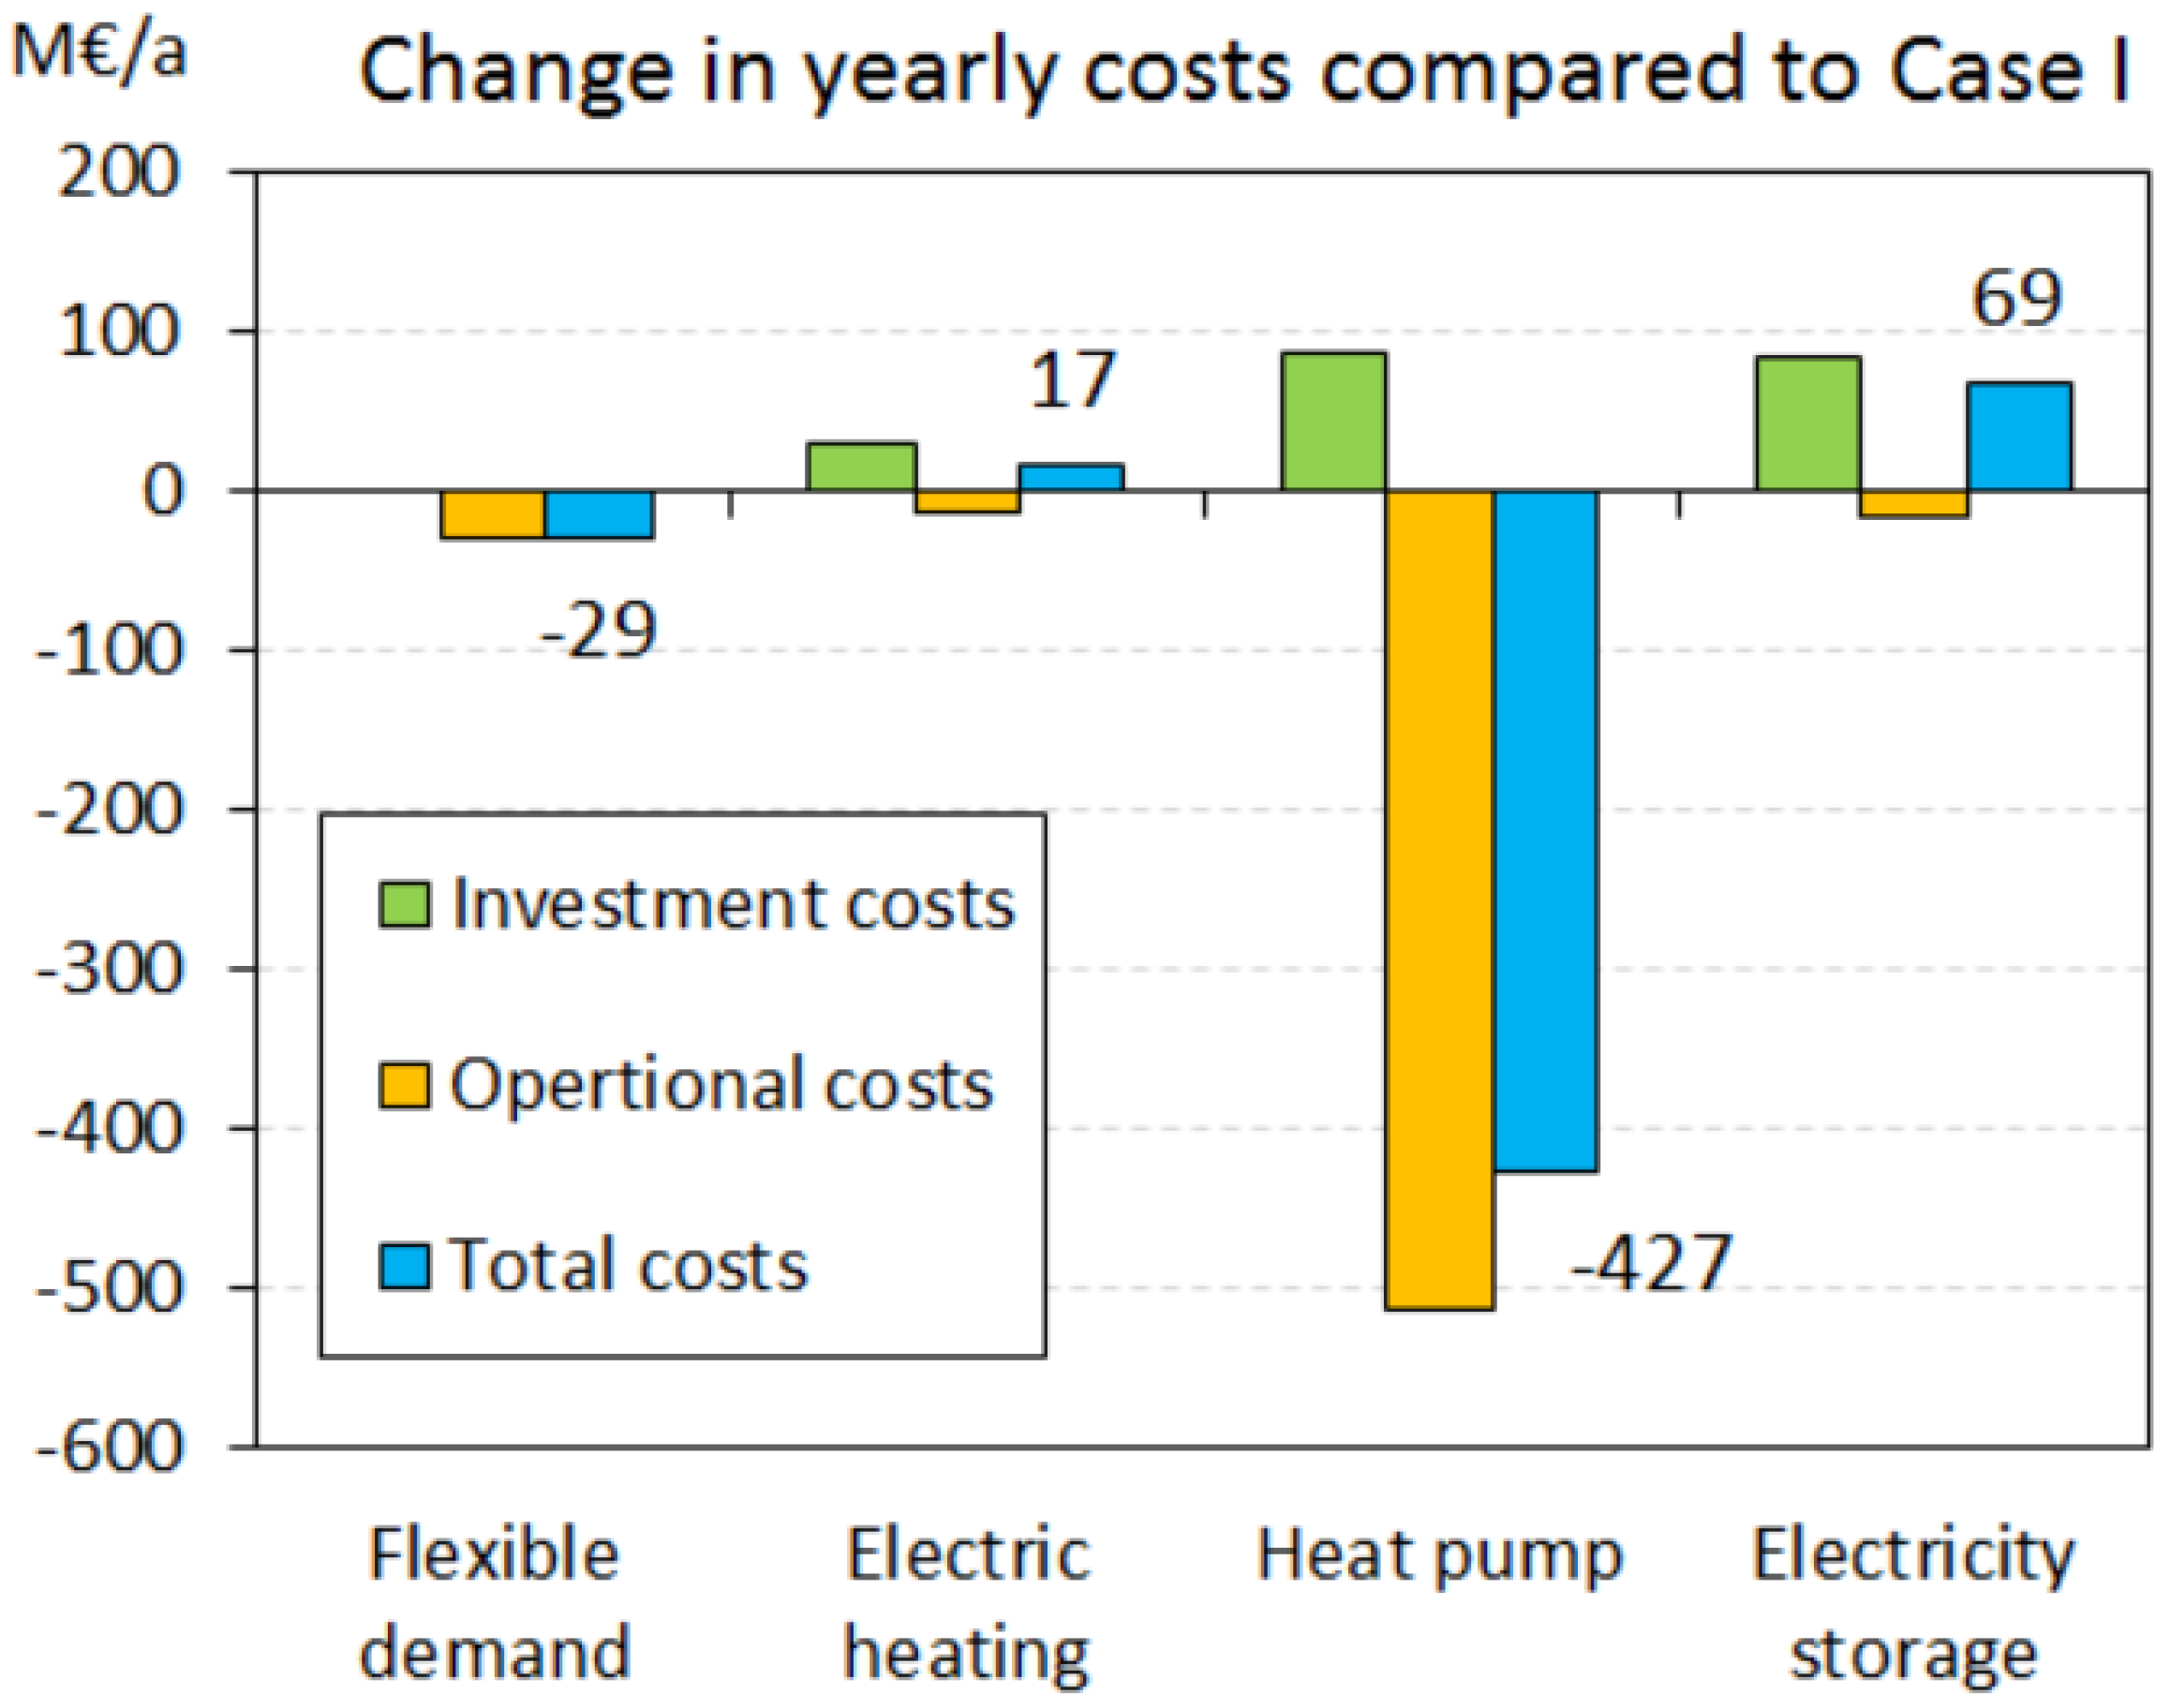
5.1.1. Flexible Demand

Flexible demand (demand side management) is one of the primary and economical alternatives to smoothen the power imbalance [77]. In this analysis, we investigate the impact of an additional flexibility of 300 MWe with 24 h time span in offsetting the power excess. The results suggest that the frequency of hours with more than 1500 MW excess power declines by 45% with employing flexible demand (see Figure 14 for more details).

5.1.2. Smart Electric Heating

Power can be converted to thermal energy primarily by electric resisting coils (e.g., in electric boilers), or more efficiently through air-sourced or ground-sourced HPs. Accordingly, in periods of excess power, we consider the use of on-call electric boilers to reduce the excess power, which ultimately results in the lower use of heat-only boilers in the DH networks. If electric boilers with maximum total capacity of 300 MWe connect to the DH networks (without additional heat storage), the frequency of hours with extra power production higher than 1500 MW will decline by about 30%.

5.1.3. Large-Scale Heat Pumps (LHPs) with Thermal Energy Storage

As discussed, excess power may lead to the further utilization of heat-only boilers (replacing CHP for meeting the heat demand) in high-RES-E scenarios. This calls for more energy- and environmentally-efficient measures for meeting the heat demand and/or decoupling the simultaneous production of power and heat in CHP plants. While direct electrification is one of the measures mentioned in the EU roadmap for the decarbonization of the heat sector, a study by Connolly et al. [78] favors DH over other alternatives due to 15% less expenses. Accordingly, in this Section, we examine LHPs and heat storage systems connected with CHP plants for absorbing the excess power and converting that to heat. The employment of 300 MWe LHPs (COP (coefficient of performance) = 3) is examined with 24 h duration of the respective thermal storage, connected to the DH networks. The results reveal that LHPs can diminish the hours with the extra power higher than 1500 MW from 1080 to 550 h/a, a reduction of 50%. We do not examine the case of individual HPs in this study as they cannot be fully regulated in periods of excess wind.
Figure 14. Comparing the frequency and magnitude of excess power before and after employing 300 MWe of flexible technologies (conditions for Case I, see Table 3).
Energies 08 02493 g014

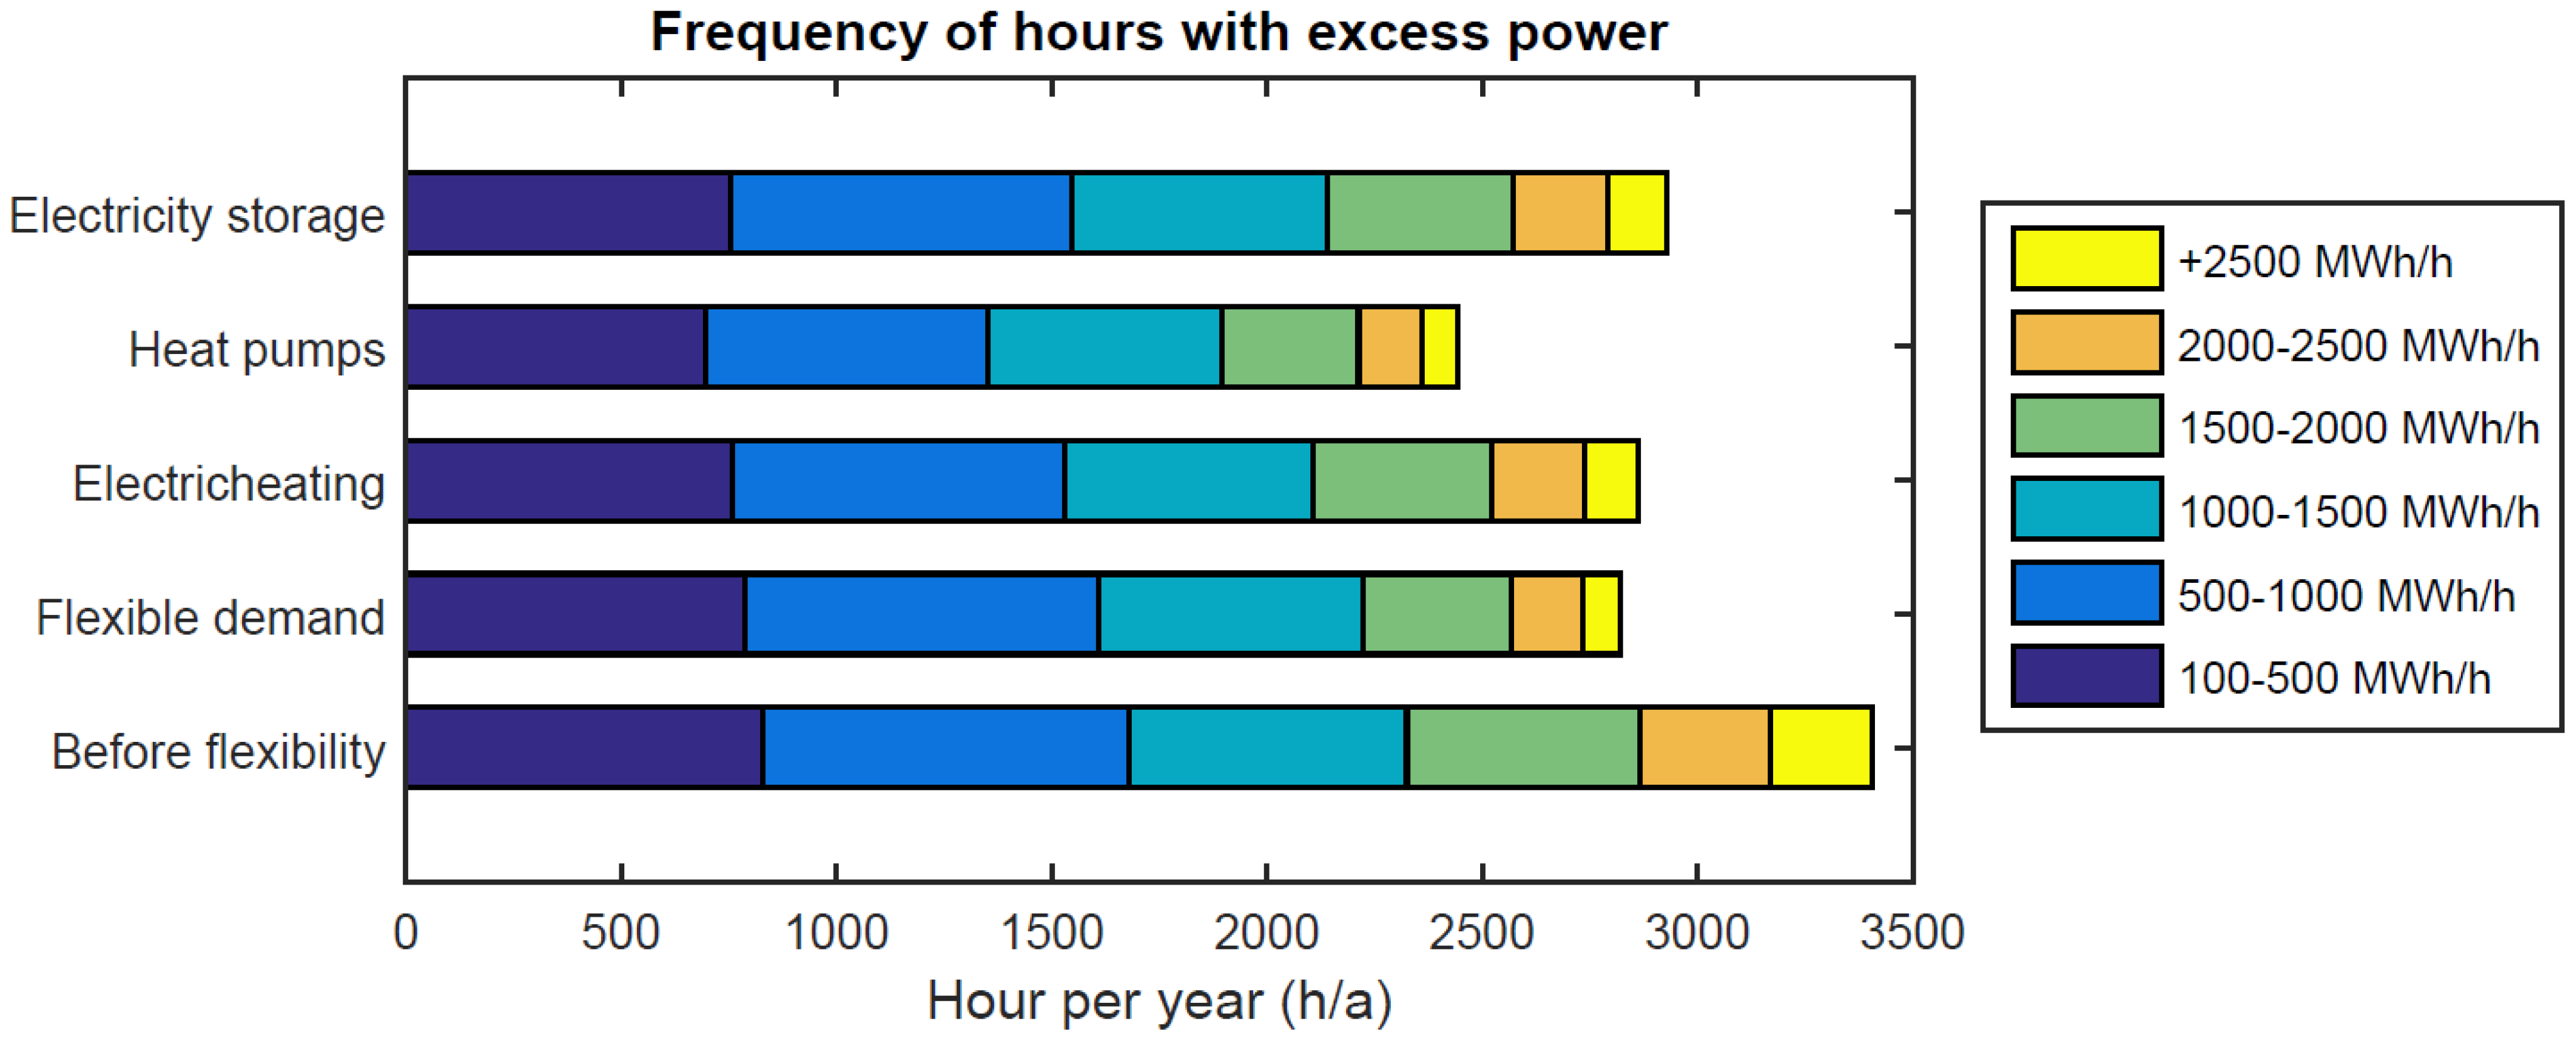
5.1.4. Electrical Energy Storage

Electrical energy storage (EES) is the next alternative examined in this study for shifting the excess power. Since there are not abundant potential sites for pumped hydropower storage in Finland and gas prices are uncertain, a generic battery is examined in this study as the possible EES (for example NaS batteries). Based on the trends in the cost of batteries capable in grid-scale applications, an investment costs of 2500 €/kW, fixed operation and maintenance (O&M) costs of 50 €/kWa, and variable O&M costs of 0.005 €/kWh are obtained from [79]. The main technical assumptions include a maximum charge/discharge time of 8 h, 75% overall efficiency at the rated depth of discharge, and a lifetime of 15 yr.
The electricity storage unit is simulated with a nominal capacity of 300 MW in charge/discharge. The hourly analysis depicts that EES can contribute by averting excess power in the critical times, e.g., in summertime. The excess power beyond 1500 MW will be recovered by 27%, from 1080 to 800 h/a by employing EES. In a market-economic scheme, the operation of EES is controlled by the market prices of electricity, which offers no pure profitability in the Finnish power market [80]. EES has contradicting effect on the power exchange. In higher level EES capacities, the net export of electricity declines due to the domestic use of excess power, in addition to more power imports with lower prices.

5.2. Discussion

The effect of the four mentioned flexibility solutions on the magnitude and periods of excess power is summarized in Figure 14. LHPs and flexible demand show the highest flexibility to balance the power oversupply. LHPs benefit from a typical COP of three, which is higher than the average heat-to-power ratio of the CHP plants. Therefore, by replacing the CHP plants to reduce the excess power, LHPs boost the heat supply, resulting in even lower demand for the operation of the remaining CHP plants (and heat-only boilers). Electricity storage shows almost the poorest performance as the power oversupply occurs at long enough periods that EES cannot be fully discharged and is remained unused.
With respect to the use of combustible fuels in the heating sector, LHP offers the best performance in abandonment of the heat-only boilers, from 2.5 TWh/a in Case I to 0.8 TWh/a, a 60% recovery. Other technologies show a marginal improvement in the conservation of combustible fuels in the heat sector. Among the introduced flexibility measures, LHPs with thermal storage reservoirs have the highest investment costs among the examined solutions (see Table B1, Appendix B). However, as LHPs significantly reduce the operational costs, they offer the highest net profitability. Except of flexible demand, the other two solutions will, however, increase the annual costs of the system (see details in Figure 15). In this study, the investment cost of flexible demand is not taken into account. If the energy system would be connected to the external market, the influence of each flexibility measure on the power exchange could be illustrated as in Figure 16. The results indicate that LHPs demonstrate the highest balance in the power exchange. This improvement in the power exchange is the direct effect of the domestic use of excess power, assuming no changes in power supply/demand from the neighboring countries.
Figure 15. Changes in the annual costs of the Finnish energy system after employing 300 MWe flexibility (and additional storage if needed) compared to the case without flexibility (Case I). The costs are calculated with 5% interest rate and in 2014-euro.
Energies 08 02493 g015
Figure 16. Effect of 300 MWe flexibility on power exchange between Finland and the external electricity market, compared with Case I.
Energies 08 02493 g016

5.3. Sensitivity Analysis

In this Section, we investigate the impact of the power rating of flexibility solutions in balancing the excess power. The results highlight that EES (with max 8 h charge/discharge) offers the minimum capability in smoothing the power imbalance in higher capacities (Figure 17). The demand side management (with 24 h time lag) surpasses LHPs in absorbing excess power with capacities above 600 MWe, while both technologies offer relatively lower flexibility in higher capacities. The results reveal a saturation point for the LHPs (with one-day long heat storage) as they offer the least efficiency in higher capacities for smoothing the excess power. These results indicate that each flexibility measure is limitedly able to utilize the excess power, until the magnitude and period of oversupply is beyond the capacity of that technology. The short-term flexibility of the examined solutions in absorbing variable RES-E is further discussed in [81].
Figure 17. Performance of flexibility solutions in different power ratings in decreasing the frequency of the hours with power oversupply.
Energies 08 02493 g017

6. Conclusions

This study examines the case of energy systems with high share of nuclear capacity and medium- to high-level wind integration plans, by applying hourly analysis and considering the interconnection of heat and power sectors. The conclusions can be sorted in two divisions:

6.1. General Conclusions

The results suggest a descending parabolic relationship between the maximum possible wind and the share of nuclear in a power system: nuclear constrains the room for wind by a factor of two. The results indicate that in nuclear shares over 50% of the annual power demand, the share of wind hardly crosses 15% (with cross-border transmission capacity equal to 20% of the peak load). Wind-nuclear compromise charts proposed in this study can illustratively explore the optimal mix of the two technologies based on different criteria. The results of this analysis demonstrate the importance of energy system analysis (rather than power system models) in the evaluation of high-RES scenarios. The heat sector can play role in absorbing the variability of RES-E in the power systems in which the rest of the fleet is inflexible or expensive to be adjusted (e.g., nuclear plants). Four flexibility solutions are examined in this study with the installed capacity equal to 10% of the installed wind capacity. The results suggest that LHPs equipped with heat storage (in CHP-DH systems) are the most efficient and economical solution in reducing excess power, where the DH infrastructure exists. Demand side management showed to be the second best solution. The results indicate that if an adequate thermal energy storage would not support the power-to-heat solutions, reducing excess power can be limited if it occurs mainly in the summertime (the case for cold climate countries). Therefore, the choice of flexibility measure highly depends on the available energy infrastructure and the degree of interdependence between heat and power sectors.

6.2. Conclusions Applicable to the Case Study (Finland)

In achieving energy security and minimizing fossil (and later biomass) fuel consumption, the Finnish energy system will encounter some contradicting challenges: (1) increasing the share of variable RES against reducing carbon emissions by nuclear energy; (2) cutting power imports versus maintaining the economic competitiveness in the domestic power supply. With the ongoing development plans for nuclear power, the share of RES-E (renewable electricity) in gross final energy consumption declines continuously as the maximum potential for wind diminishes, assuming constant bioenergy use as 2012 (see Table C1, Appendix C for more details). We explored a second-degree polynomial relationship between nuclear capacity and maximum wind integration levels. The resulting wind-nuclear compromise charts can inform the policy makers about the environmental, technical, and economic implications of different wind-nuclear installation mixes. Finland is able to augment the share of wind by 20% of the total annual demand under today’s conditions for nuclear, power demand, and flexibility. However, increasing the share of nuclear to 55% of the annual demand will diminish the maximum penetration level for wind to less than 10%. We also examined the ramping requirements in high-level wind-nuclear scenarios, discovering the key role of CHP plants as major load followers in this context.
The operation of a new NPP (OL3) constrains the room and economic profitability for wind, from a system perspective. While without OL3 wind energy offers net profits (in integration levels up to 20% of the total power demand), any wind penetration level after the operation of OL3 will increase the total costs of the national energy system. This is due to the fact that a major part of fossil fuel consumption and power imports will be alleviated by OL3, resulting in less opportunities for wind. Finland will experience a period of excess power production at the peak of its nuclear transition era, if the wind development plans for the 2020s eventuate (i.e., 4000 MW installed wind capacity). Based on the examined assumptions, the magnitude of this excess power can be over 5 GW in some hours of the year (without considering the choice of power export). The planned revenues from wind-nuclear policy will be realized if the transmission capacity could be fully exploited by Finland for power exports. However, the uncertainty in the possibility of power exports at the event of domestic power oversupply should not be neglected, calling for the assessment of internal flexibility solutions.
We examined four alternative solutions for absorbing the excess power, by assuming the Finnish power system as a closed system. If coupled with heat storage systems, LHPs connected to DH networks demonstrate the most efficient way in reducing the power oversupply (though not capable in alleviating it). LHPs may improve the overall costs of the energy system, as they replace the fuel consumption in CHP and boiler plants by maintaining the respective heat demand. Since the extra power occurs mainly in the summertime, this will be a burden in large-scale deployment of power-to-heat options in the energy system. Flexible demand showed the second best performance, with relatively minor additional costs to the system. All the four examined technologies offer a limited flexibility, indicating the need for flexibility solutions with a longer time span. The flexible demand option favors all other technologies in capacities higher than 25% of the corresponding installed wind capacity.
The separate study of a country connected to the external power markets may underestimate the impact of power exchange in power system planning. On the other hand, energy transitions in the other countries connected to the market may complicate the analysis of future RES scenarios. The situation in the neighboring countries may be similar in periods of power oversupply, resulting in low or negative prices. This may lead to further efforts for increasing the flexibility of the energy system and longer-term energy storage systems for the domestic use of the excess power. The future work may incorporate a robust uncertainty analysis in the study of future scenarios, and more versatile flexibility alternatives in offsetting the excess power. The unit commitment requirements in high-level wind integration are other areas for further improvement.

Acknowledgments

The authors would like to acknowledge the supports and funding provided by the STEEM project (Sustainable Transition of European Energy Markets), Aalto Energy Efficiency Research Program, and the Aalto University doctoral program. The authors also thank the Department of Development and Planning, Aalborg University, Denmark, for providing the energy system modeling tool EnergyPLAN with the associated documentation freely available for the research community.

Author Contributions

Behnam Zakeri performed the data collection and synthesis, wind integration modeling, modeling and analysis of energy system, simulations, and the preparation of manuscript, under supervision and guidance of prof. Sanna Syri. Samuli Rinne provided the initial data and model in EnergyPLAN. All the authors were engaged in reviewing the manuscript, discussion, and scenario development.

Nomenclature

CHP
Combined heat and power
DH
District heating
FV1
Fennovoima nuclear power plant (Hanhikivi 1)
HDD
Heating degree days
HP
Heat pump
LHP
Large-scale heat pump
NPP
Nuclear power plant
OL3
Olkiluoto 3 (nuclear power plant)
PEC
Primary energy consumption
RES
Renewable energy source
RES-E
Renewable-based electricity
VTT
Technical Research Center of Finland

Appendix

A. Uncertainty Analysis for Higher Wind Integrations

Figure A1. The recorded monthly averages of wind production in Finland 1992–2011, adopted with permission from [37].
Energies 08 02493 g018

B. Input Data

Table B1. Costs and lifetime of different technologies used in this study based on [58,59,60,61], otherwise mentioned.
Cost of Different TechnologiesUnitCost per unitLifetimeFixed O&M CostsNote
Million EuroYear% of Installation Costs
Hydropower plantMW1.5500.5
Condensing power plantMW1.3354An approximated average for coal, gas and biomass plants
Nuclear power plantMW5501-
Wind (onshore)MW1.55252.7[7,59,65,66]
Wind (offshore)MW1.95303
Heat-only boilersMWth0.2400.5Mainly oil and gas plants
Small-scale CHP unitMWe1.1205-
Large CHP plantMWe1.3353.5-
Large-scale HPMWe3.5301-
Thermal storageGWh3251-
Electricity storage (EES)MW2.5153NaS battery [79]
Households level and small-scale distributed generation
BoilerMWth0.2201-
Electric boilerMWe0.6250.1-
HPMWe7151-
Table B2. Fuel costs (excluding taxes) for the reference scenario based on [63,82].
Fuel and Emission CostsUnit Cost per unit (€)Note
CoalGJ4Simulated and input together based on their reported shares (6.9 €/GJ for heat production)
PeatGJ4.2
Natural gasGJ10.3(13.05 €/GJ in heat production)
Fuel oilGJ12.8average of heavy and light oil
DieselGJ16.4-
Forest wood chipsGJ5.5based on the mixed used (dry biomass)
Wood pelletsGJ12.5-
Figure B1. Modeling aggregated hourly DH demand for the whole country in 2012.
Energies 08 02493 g019

C. Optimal Wind Integration Levels in Different Nuclear Capacities

Figure C1. Optimization map of wind-nuclear compromise for evaluating the share of carbon-free power production (black dashes) and RES-E (blue dashes), compared with maximum possible wind (red curve) and today’s conditions (red circles). The ratios are per total power demand (see Section 4.4 for explanation).
Energies 08 02493 g020
Table C1. The technical, economic, and emission-related implications in different nuclear capacities and the respective maximum possible wind integration, compared to 2012.
Different ScenariosPower Demand (peak load)Nuclear Capacity (share a)Max Wind Capacity (share b)Max RES c in PECMax RES-E dMax Carbon-free Power e Net Power Imports fChange g in CO2 EmissionsChange in Total Costs h
TWh/a (GW)GW (-)GW (-)---TWh/a-M€/a
No more NPP85 (14)2.78 (28%)7.6 (19%)35%51%77%5.3−13%−5
OL3 plant85 (14)4.38 (39%)6.4 (16%)32%48%88%−3.2−22%−35
OL3 + FV1 (Case I)85 (14)5.58 (47%)4.6 (11.5%)29%43%95%−8.4−26%6
OL3 + FV1 (Case II)98 (15.7)5.58 (44%)7.1 (15%)30%42%86%0.5−18%630
Notes: a Share of nuclear production (TWh/a) in total domestic power production. b Share of maximum possible wind production (TWh/a) in total power demand (with no major flexibility solutions). c Assuming constant biomass use and hydropower availability as today. d Share of renewable-based electricity in gross power consumption. e Share of decarbonized power production in domestic power production (it was 59% in 2012). f After maximum wind integration in each scenario (power export with negative sign). g Relative change in total carbon emissions from energy and transport, compared to 2012 (in optimal mix of nuclear and max wind). The values are corrected to include the equivalent emissions related to the cross-border power exchange. h Relative change in the yearly cost of the Finnish energy system, compared to 2012 (in optimal mix of nuclear and max wind) (interest rate 5%).

Conflicts of Interest

The authors declare no conflict of interest.

References

  1. World Energy Outlook 2014; International Energy Agency (IEA): Paris, France, 2014.
  2. Energy Roadmap 2050. Available online: http://ec.europa.eu/energy/energy2020/roadmap/index_en.htm (accessed on 22 February 2014).
  3. International Status and Prospects for Nuclear Power 2014; GOV/INF/2014/13-GC(58)/INF/6; International Atomic Energy Agency (IAEA): Vienna, Austria, 2014.
  4. Wind Statistics 2014. Available online: http://www.ewea.org/ (accessed on 19 January 2015).
  5. Energy Supply and Consumption. Available online: http://www.stat.fi/til/ehk/index_en.html (accessed on 21 December 2013).
  6. Energy Policies of IEA Countries—Finland 2013 Review; International Energy Agency (IEA): Paris, France, 2013.
  7. Holttinen, H.; Peltola, E. Country Reports: Finland; IEA Wind 2012 Annual Report; IEA Wind: Boulder, CO, USA, 2013. [Google Scholar]
  8. Alonso, G.; Valle, E.D. Economical analysis of an alternative strategy for CO2 mitigation based on nuclear power. Energy 2013, 52, 66–76. [Google Scholar] [CrossRef]
  9. Lechtenböhmer, S.; Samadi, S. Blown by the wind. Replacing nuclear power in German electricity generation. Environ. Sci. Policy 2013, 25, 234–241. [Google Scholar] [CrossRef]
  10. Gota, D.I.; Lund, H.; Miclea, L. A Romanian energy system model and a nuclear reduction strategy. Energy 2011, 36, 6413–6419. [Google Scholar] [CrossRef]
  11. Shropshire, D.; Purvins, A.; Papaioannou, I.; Maschio, I. Benefits and cost implications from integrating small flexible nuclear reactors with off-shore wind farms in a virtual power plant. Energy Policy 2012, 46, 558–573. [Google Scholar] [CrossRef]
  12. Holttinen, H.; Milligan, M.; Ela, E.; Menemenlis, N.; Dobschinski, J.; Rawn, B.; Bessa, R.J.; Flynn, D.; Gomez Lazaro, E.; Detlefsen, N. Methodologies to determine operating reserves due to increased wind power. In Proceedings of the 2013 IEEE Power and Energy Society General Meeting (PES), Vancouver, BC, Canada, 21–25 July 2013; pp. 1–10.
  13. Kiviluoma, J.; O’Malley, M.; Tuohy, A.; Meibom, P.; Milligan, M.; Lange, B.; Holttinen, H.; Gibescu, M. Impact of wind power on the unit commitment, operating reserves, and market design. In Proceedings of the 2011 IEEE Power and Energy Society General Meeting, San Diego, CA, USA, 24–29 July 2011; pp. 1–8.
  14. Söder, L.; Abildgaard, H.; Estanqueiro, A.; Hamon, C.; Holttinen, H.; Lannoye, E.; Gomez-Lazaro, E.; O’Malley, M.; Zimmermann, U. Experience and challenges with short-term balancing in European systems with large share of wind power. IEEE Trans. Sustain. Energy 2012, 3, 853–861. [Google Scholar] [CrossRef]
  15. Smith, J.C.; Osborn, D.; Zavadil, R.; Lasher, W.; Gómez-Lázaro, E.; Estanqueiro, A.; Trotscher, T.; Tande, J.; Korpås, M.; van Hulle, F.; et al. Transmission planning for wind energy in the United States and Europe: Status and prospects. Wiley Interdiscip. Rev. Energ. Environ. 2013, 2, 1–13. [Google Scholar] [CrossRef]
  16. Deane, J.P.; Drayton, G.Ó.; Gallachóir, B.P. The impact of sub-hourly modelling in power systems with significant levels of renewable generation. Appl. Energy 2014, 113, 152–158. [Google Scholar] [CrossRef]
  17. Connolly, D.; Lund, H.; Mathiesen, B.V.; Leahy, M. A review of computer tools for analysing the integration of renewable energy into various energy systems. Appl. Energy 2010, 87, 1059–1082. [Google Scholar] [CrossRef]
  18. Lund, H.; Duic, N.; Krajacic, G.; Graça Carvalho, M.D. Two energy system analysis models: A comparison of methodologies and results. Energy 2007, 32, 948–954. [Google Scholar] [CrossRef]
  19. Lund, H.; Möller, B.; Mathiesen, B.V.; Dyrelund, A. The role of district heating in future renewable energy systems. Energy 2010, 35, 1381–1390. [Google Scholar] [CrossRef]
  20. Connolly, D.; Lund, H.; Mathiesen, B.V.; Leahy, M. Modelling the existing Irish energy-system to identify future energy costs and the maximum wind penetration feasible. Energy 2010, 35, 2164–2173. [Google Scholar] [CrossRef]
  21. Hassan, A.S.; Xydas, E.S.; Marmaras, C.E.; Cipcigan, L.M.; Jenkins, N. Integrating renewable energy with flexible storage systems: A case study of GB and Greece. In Proceedings of the 2013 48th International Universities’ Power Engineering Conference (UPEC), Dublin, Ireland, 2–5 September 2013; pp. 1–6.
  22. Ridjan, I.; Mathiesen, B.V.; Connolly, D.; Duic, N. The feasibility of synthetic fuels in renewable energy systems. Energy 2013, 57, 76–84. [Google Scholar] [CrossRef]
  23. EnergyPLAN. Available online: http://www.energyplan.eu/ (accessed on 14 December 2013).
  24. Lund, H.; Mathiesen, B.V. Energy system analysis of 100% renewable energy systems-The case of Denmark in years 2030 and 2050. Energy 2009, 34, 524–531. [Google Scholar] [CrossRef]
  25. Liu, W.; Lund, H.; Mathiesen, B.V. Large-scale integration of wind power into the existing Chinese energy system. Energy 2011, 36, 4753–4760. [Google Scholar] [CrossRef]
  26. Le, N.A.; Bhattacharyya, S.C. Integration of wind power into the British system in 2020. Energy 2011, 36, 5975–5983. [Google Scholar] [CrossRef]
  27. Zakeri, B.; Syri, S.; Rinne, S. Higher renewable energy integration into the existing energy system of Finland—Is there any maximum limit? Energy 2015, in press. [Google Scholar]
  28. Fernandes, L.; Ferreira, P. Renewable energy scenarios in the Portuguese electricity system. Energy 2014, 69, 51–57. [Google Scholar] [CrossRef] [Green Version]
  29. Cerovac, T.; Cosic, B.; Pukšec, T.; Duic, N. Wind energy integration into future energy systems based on conventional plants—The case study of Croatia. Appl. Energy 2014, 135, 643–655. [Google Scholar] [CrossRef] [Green Version]
  30. Cosic, B.; Markovska, N.; Taseska, V.; Krajacic, G.; Duic, N. Increasing the renewable energy sources absorption capacity of the Macedonian energy system. J. Renew. Sustain. Energy 2013, 5. [Google Scholar] [CrossRef]
  31. Holttinen, H. Hourly wind power variations in the Nordic countries. Wind Energy 2005, 8, 173–195. [Google Scholar] [CrossRef]
  32. Holttinen, H. Wind integration: Experience, issues, and challenges. Wiley Interdiscip. Rev. Energy Environ. 2012, 1, 243–255. [Google Scholar] [CrossRef]
  33. Lemström, B.; Kiviluoma, J.; Holttinen, H.; Peltonen, L. Impact of Wind Power on Regional Power Balance and Transfer; Technical Research Center of Finland (VTT): Espoo, Finland, 2009. [Google Scholar]
  34. Holttinen, H.; Rissanen, S.; Larsen, X.; Løvholm, A.L. Wind and Load Variability in the Nordic Countries; Technical Research Center of Finland (VTT): Espoo, Finland, 2013. [Google Scholar]
  35. Maps of power production. Available online: http://www.windatlas.fi/en/index.html (accessed on 22 December 2013).
  36. Koivisto, M.; Ekström, J.; Seppänen, J.; Mellin, I.; Saarijärvi, E.; Haarla, L. Statistical analysis of large scale wind power generation using Monte Carlo simulations. In Proceedings of the 18th Power Systems Computation Conference (PSCC), Wroclaw, Poland, 18–22 August 2014.
  37. Turkia, V.; Holttinen, H. Tuulivoiman Tuotantotilastot—Vuosiraportti 2011. (Wind Energy Statistics of Finland—Yearly Report 2011); Technical Research Center of Finland (VTT): Espoo, Finland, 2013. (In Finnish) [Google Scholar]
  38. Finland’s Energy and Climate Strategy 2013. Available online: https://www.tem.fi/en/energy/energy_and_climate_strategy/strategy_2013 (accessed on 17 December 2013).
  39. Wind Power Projects in Finland. Available online: http://www.tuulivoimayhdistys.fi/ (accessed on 18 December 2013).
  40. Wind Energy Statistics in Finland. Available online: http://www.vtt.fi/proj/windenergystatistics/?lang=en (accessed on 20 May 2014).
  41. The EU Climate and Energy Package. Available online: http://ec.europa.eu/energy/index_en.htm (accessed on 22 December 2013).
  42. Electricity Statistics. Available online: http://energia.fi/en (accessed on 20 December 2013).
  43. Fennovoima Hanhikivi 1 Project. Available online: http://www.fennovoima.fi/en/hanhikivi-1-project (accessed on 20 January 2015).
  44. Syri, S.; Kurki-Suonio, T.; Satka, V. Increasing nuclear power at liberalised energy markets-case Finland. In Proceedings of the 2nd European Energy Conference, Maastricht, The Netherlands, 17–20 April 2012.
  45. Syri, S.; Kurki-Suonio, T.; Satka, V.; Cross, S. Nuclear power at the crossroads of liberalised electricity markets and CO2 mitigation—Case Finland. Energy Strategy Rev. 2013, 1, 247–254. [Google Scholar] [CrossRef]
  46. Finnish Energy Industries. Turning Challenges into Opportunities—A Carbon Neutral Vision for Electricity and District Heat for 2050; Energiateollisuus ry (ET): Helsinki, Finland, 2009. [Google Scholar]
  47. Electricity Consumption Will Grow Again after the Recession. Available online: http://www.ek.fi/ek/en/news/electricity_consumption_will_grow_again_after_the_recession-2041 (accessed on 20 December 2013).
  48. Power Statistics & Trends 2013; Eurelectric (The Union of the Electricity Industry): Brussels, Belgium, 2013.
  49. Scenario Outlook & Adequacy Forecast 2013–2030; The European Network of Transmission System Operators for Electricity (ENTSO-E): Brussels, Belgium, 2013.
  50. Energy Use: Visions and Technology Opportunities for Finland; Technical Research Center of Finland (VTT)/Edita: Helsinki, Finland, 2007.
  51. Low Carbon Finland 2050; Technical Research Center of Finland (VTT): Espoo, Finland, 2012.
  52. Heinonen, S.; Ruotsalainen, J. Energy Futures 2030—Toward the Neo-Growth Paradigm of the Sixth-Wave Era; Finland Futures Research Centre, University of Turku: Turku, Finland, 2013. [Google Scholar]
  53. Aslani, A.; Naaranoja, M.; Helo, P.; Antila, E.; Hiltunen, E. Energy diversification in Finland: Achievements and potential of renewable energy development. Int. J. Sustain. Energy 2013, 32, 504–514. [Google Scholar] [CrossRef]
  54. Aslani, A.; Helo, P.; Naaranoja, M. Role of renewable energy policies in energy dependency in Finland: System dynamics approach. Appl. Energy 2014, 113, 758–765. [Google Scholar] [CrossRef]
  55. Kiviluoma, J. Managing wind Power Variability and Uncertainty through Increased Power System Flexibility; Technical Research Center of Finland (VTT): Espoo, Finland, 2013. [Google Scholar]
  56. Market Data. Available online: http://www.nordpoolspot.com/Market-data1 (accessed on 15 December 2014).
  57. Local Weather. Available online: http://en.ilmatieteenlaitos.fi/ (accessed on 12 December 2013).
  58. Updated Capital Cost Estimates for Utility Scale Electricity Generating Plants; U.S. Energy Information Administration (EIA), U.S. Deportment of Energy (DOE): Washington, DC, USA, 2013.
  59. Danish Energy Agency. Generation of Electricity and District Heating, Energy Storage and Energy Carrier Generation and Conversion: Technology Data for Energy Plants; Energi Styrelse: Copenhagen, Denmark, 2012.
  60. UK Electricity Generation Costs Update; Mott MacDonald Consulting Co.: Brighton, UK, 2010.
  61. EnergyPLAN Cost Database. Available online: http://www.energyplan.eu/costdatabase/ (accessed on 14 April 2014).
  62. Vuorinen, A. Planning of Optimal Power Systems, 2nd ed.; Ecoenergo Oy: Espoo, Finland, 2009. [Google Scholar]
  63. Energy Prices. Available online: http://www.stat.fi/til/ehi/index_en.html (accessed on 18 April 2014).
  64. Demand-Side Management. Available online: http://www.fingrid.fi/en/electricity-market/load-and-generation/Demand-Side_Management/Pages/default.aspx (accessed on 29 April 2014).
  65. Salo, O.; Syri, S. What economic support is needed for Arctic offshore wind power? Renew. Sustain. Energy Rev. 2014, 31, 343–352. [Google Scholar] [CrossRef]
  66. Lantz, E.; Wiser, R.; Hand, M. IEA Wind Task 26—The Past and Future Cost of Wind Energy; NREL/TP-6A20-53510; National Renewable Energy Laboratory: Denver, CO, USA, 2012.
  67. Syri, S.; Lehtilä, A.; Ekholm, T.; Savolainen, I.; Holttinen, H.; Peltola, E. Global energy and emissions scenarios for effective climate change mitigation-Deterministic and stochastic scenarios with the TIAM model. Int. J. Greenh. Gas Control 2008, 2, 274–285. [Google Scholar]
  68. Holttinen, H. Estimating the impacts of wind power on power systems—Summary of IEA Wind collaboration. Environ. Res. Lett. 2008, 3. [Google Scholar] [CrossRef]
  69. Helander, A.; Holttinen, H.; Paatero, J. Impact of wind power on the power system imbalances in Finland. IET Renew. Power Gener. 2010, 4, 75–84. [Google Scholar] [CrossRef]
  70. Hedegaard, K.; Meibom, P. Wind power impacts and electricity storage—A time scale perspective. Renew. Energy 2012, 37, 318–324. [Google Scholar] [CrossRef]
  71. Challenges for Nordic Power—How to Handle the Renewable Electricity Surplus; Econ Pöyry/Thema Consulting Group: Oslo, Norway, 2010.
  72. Østergaard, P.A. Reviewing optimisation criteria for energy systems analyses of renewable energy integration. Energy 2009, 34, 1236–1245. [Google Scholar] [CrossRef]
  73. Huber, M.; Dimkova, D.; Hamacher, T. Integration of wind and solar power in Europe: Assessment of flexibility requirements. Energy 2014, 69, 236–246. [Google Scholar] [CrossRef]
  74. Adjustable Nuclear Power to Stabilise Generation and Distribution of Electric Power. Available online: http://www.lut.fi/web/en/news/-/asset_publisher/lGh4SAywhcPu/content/adjustable-nuclear-power-to-stabilise-generation-and-distribution-of-electric-power (accessed on 12 February 2015).
  75. Østergaard, P.A. Comparing electricity, heat and biogas storages’ impacts on renewable energy integration. Energy 2012, 37, 255–262. [Google Scholar] [CrossRef]
  76. Mathiesen, B.V.; Lund, H. Comparative analyses of seven technologies to facilitate the integration of fluctuating renewable energy sources. IET Renew. Power Gener. 2009, 3, 190–204. [Google Scholar] [CrossRef]
  77. Finn, P.; Fitzpatrick, C. Demand side management of industrial electricity consumption: Promoting the use of renewable energy through real-time pricing. Appl. Energy 2014, 113, 11–21. [Google Scholar] [CrossRef]
  78. Connolly, D.; Lund, H.; Mathiesen, B.V.; Werner, S.; Möller, B.; Persson, U.; Boermans, T.; Trier, D.; Østergaard, P.A.; Nielsen, S. Heat roadmap Europe: Combining district heating with heat savings to decarbonise the EU energy system. Energy Policy 2014, 65, 475–489. [Google Scholar] [CrossRef]
  79. Zakeri, B.; Syri, S. Electrical energy storage systems: A comparative life cycle cost analysis. Renew. Sustain. Energy Rev. 2015, 42, 569–596. [Google Scholar] [CrossRef]
  80. Zakeri, B.; Syri, S. Economy of electricity storage in the Nordic electricity market: The case for Finland. In Proceedings of the 11th International Conference on the European Energy Market (EEM), Krakow, Poland, 28–30 May 2014.
  81. Lund, H.; Andersen, A.N.; Østergaard, P.A.; Mathiesen, B.V.; Connolly, D. From electricity smart grids to smart energy systems—A market operation based approach and understanding. Energy 2012, 42, 96–102. [Google Scholar] [CrossRef]
  82. Den Herder, M.; Kolström, M.; Lindner, M.; Suominen, T.; Tuomasjukka, D.; Pekkanen, M. Sustainability impact assessment on the production and use of different wood and fossil fuels employed for energy production in North Karelia, Finland. Energies 2012, 5, 4870–4891. [Google Scholar] [CrossRef]

