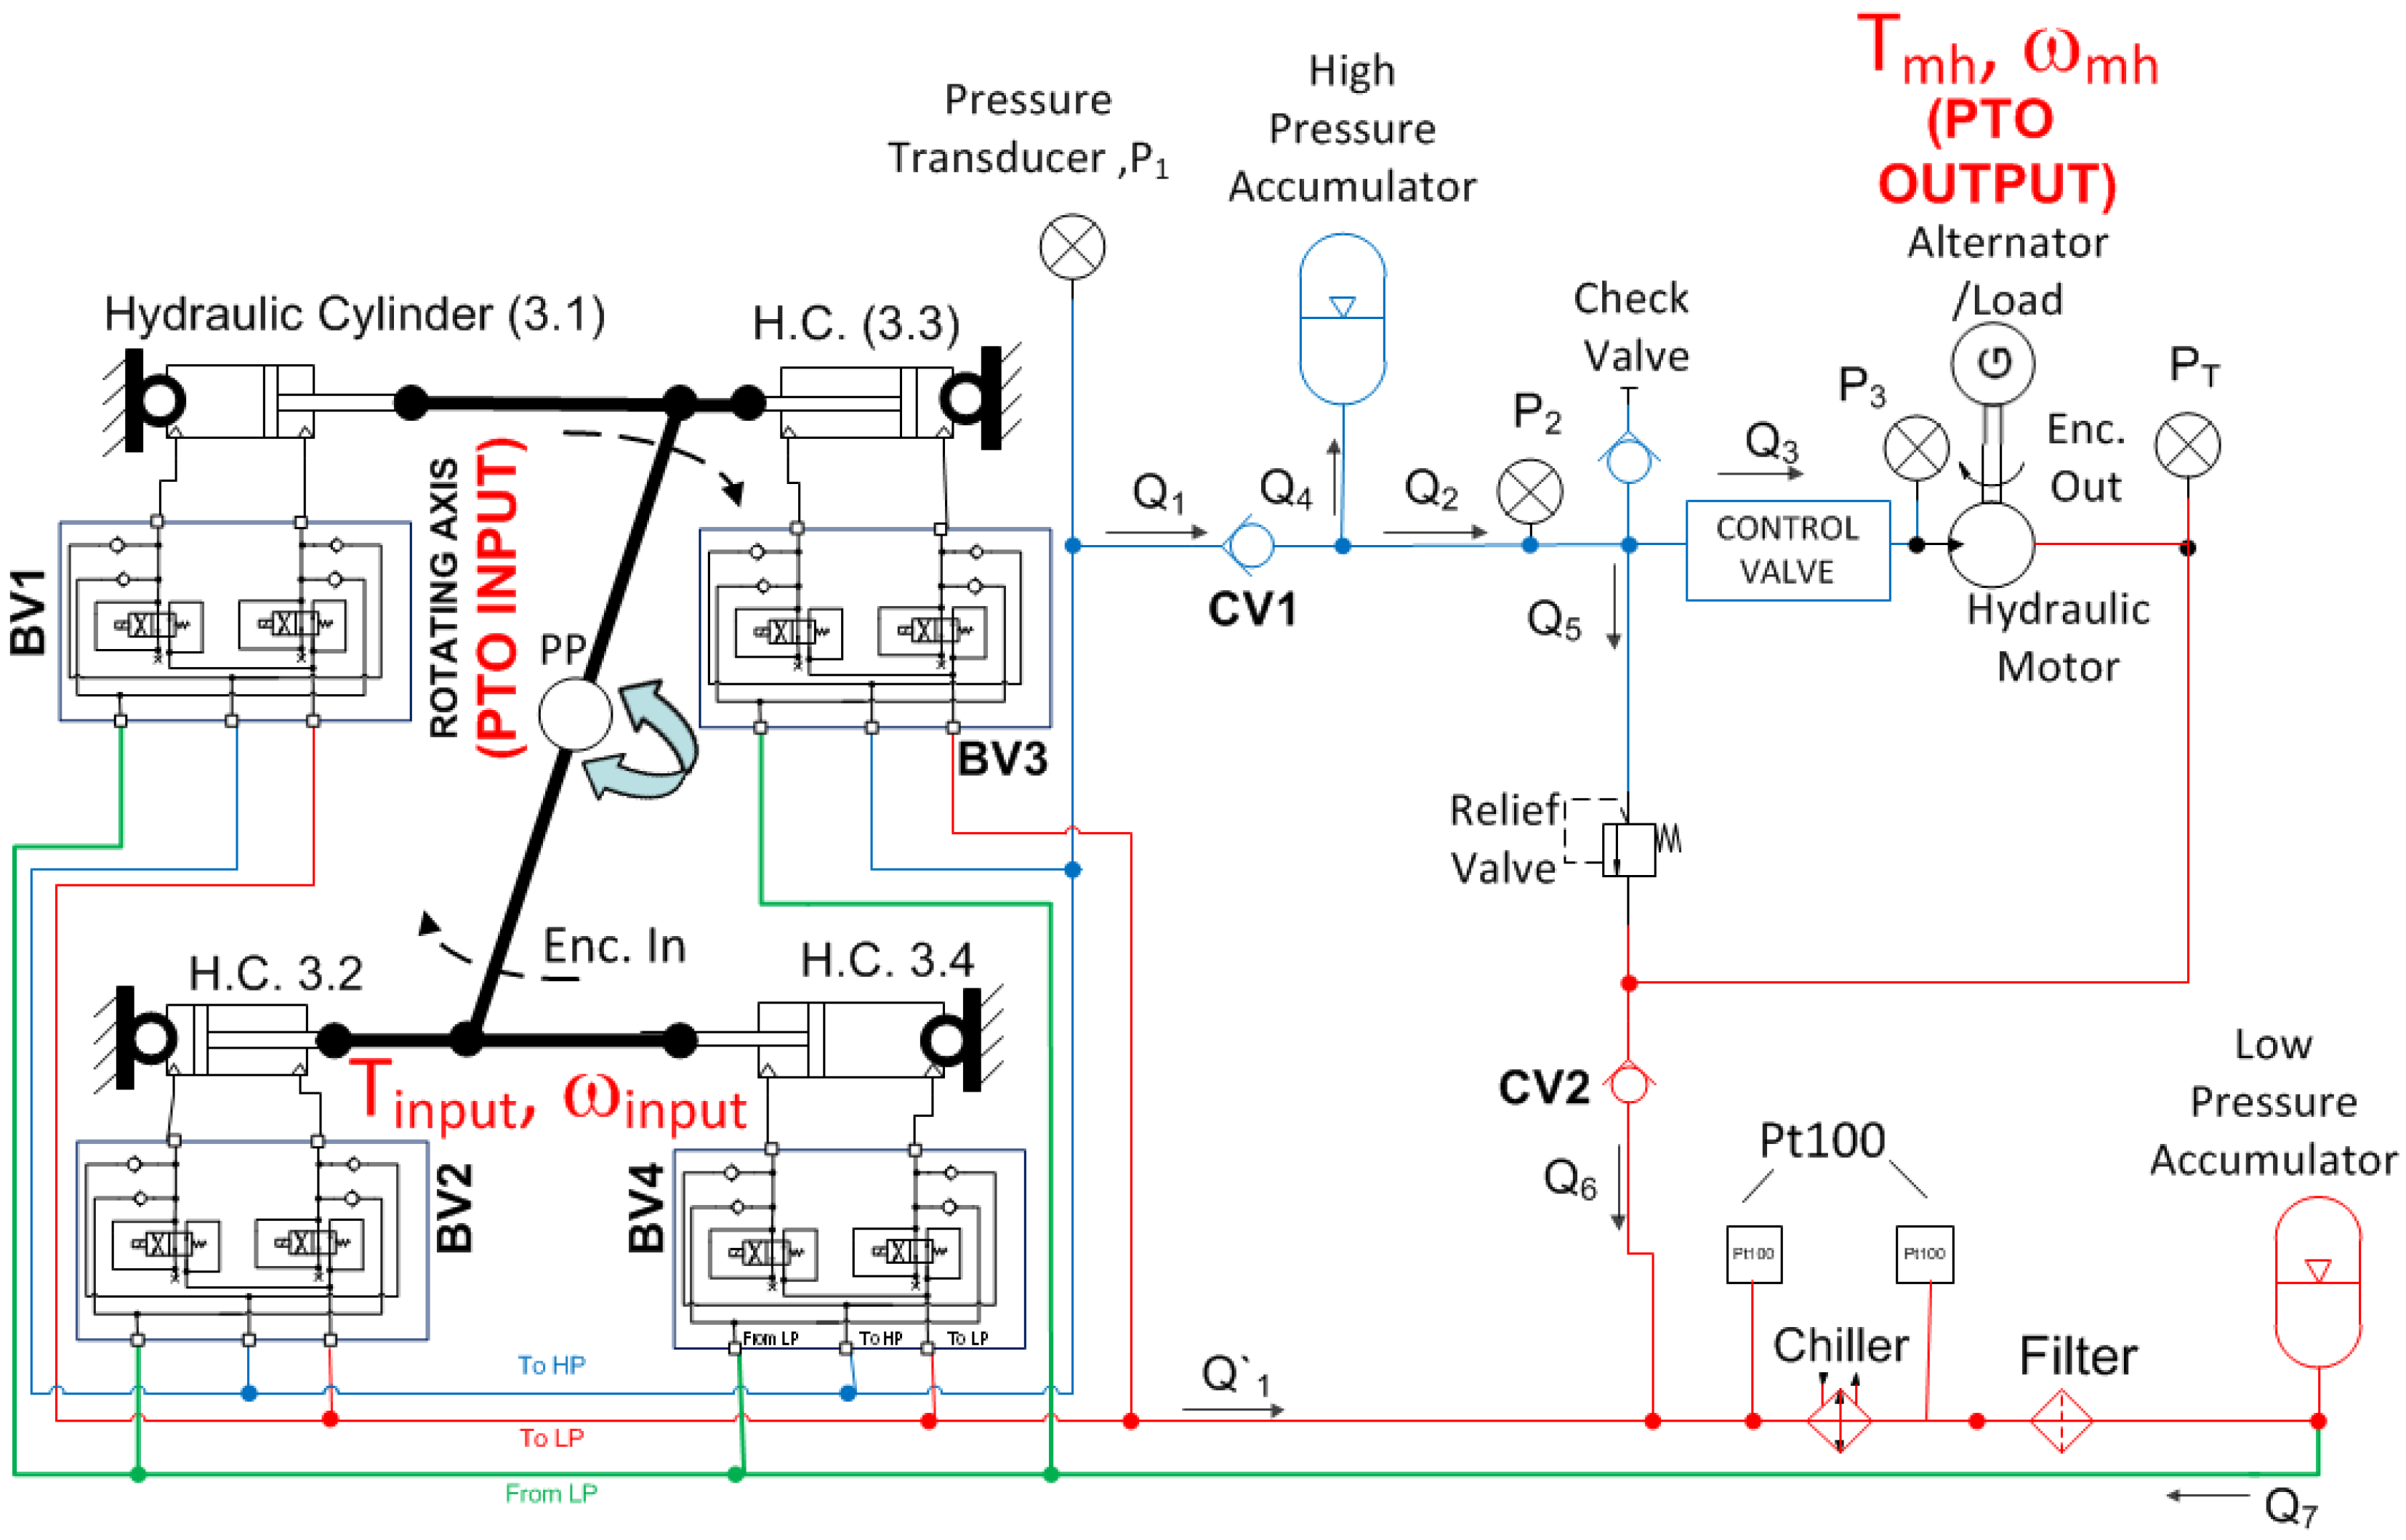
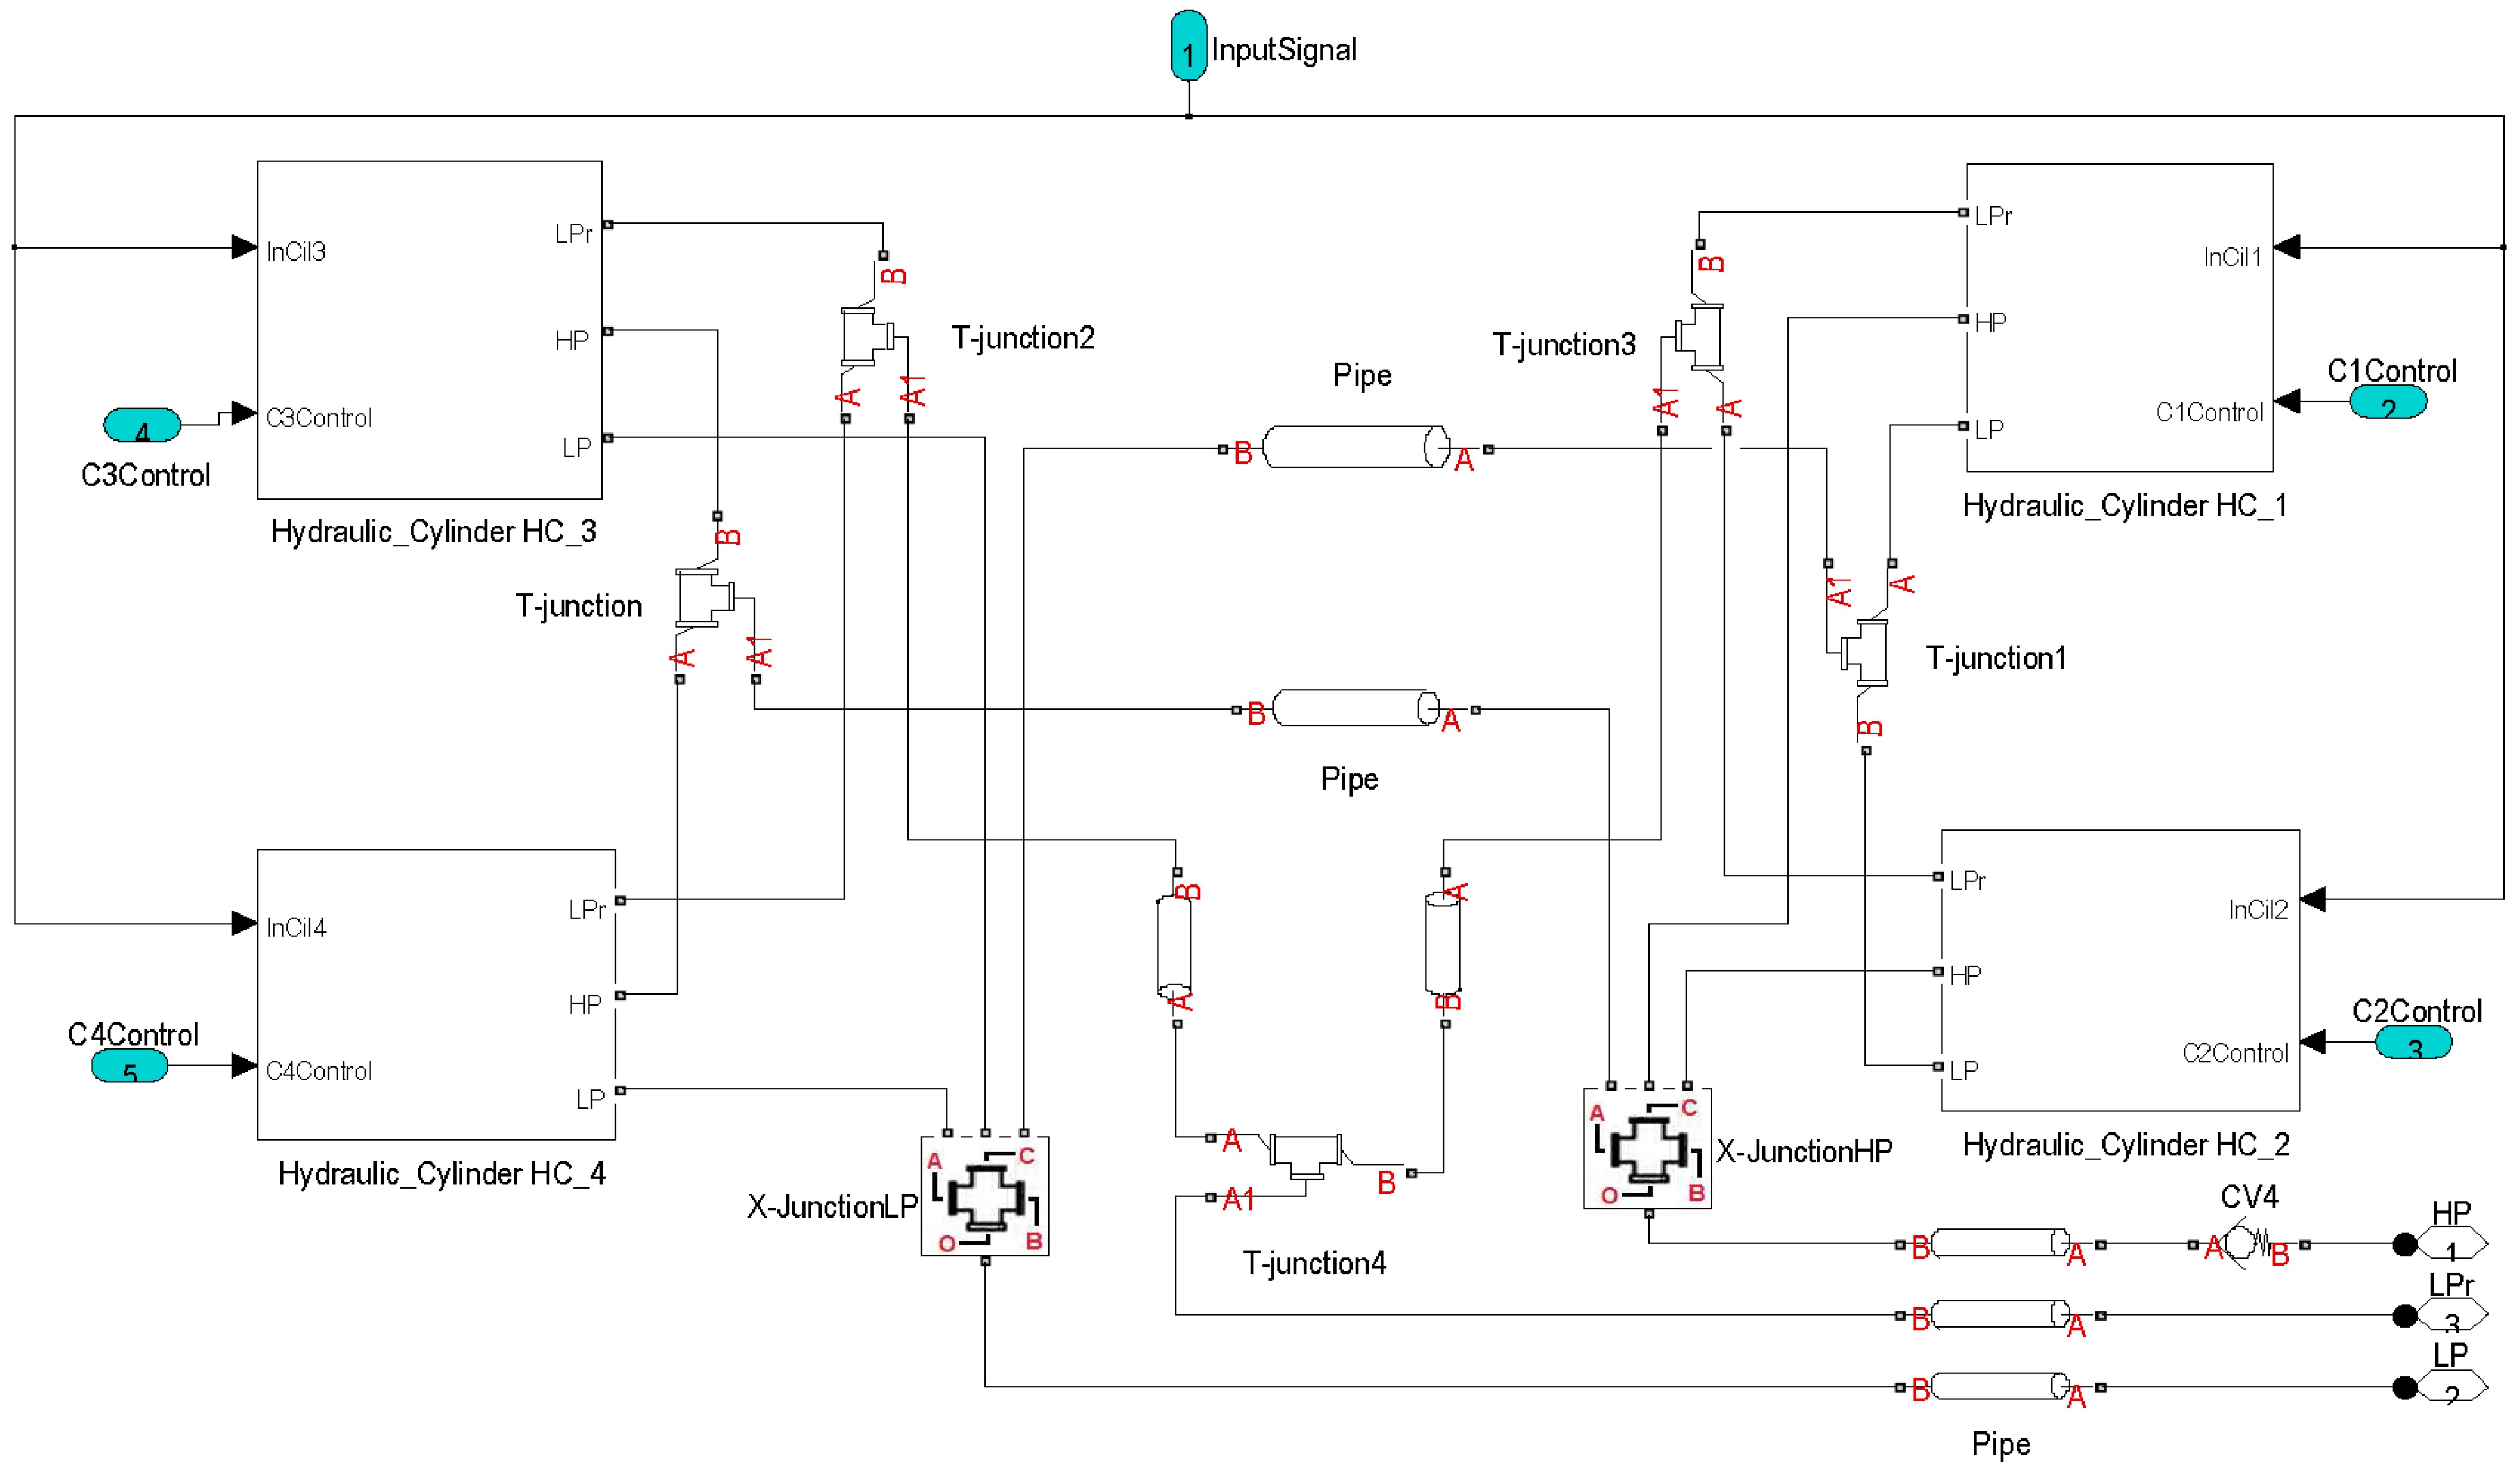
The aim of the model validation is to adjust the model parameters through experimental data in order to obtain a complete adjusted open loop model for use in the control of any WEC that generates an alternative angular movement. Therefore, in this section some simulation results are presented in order to check the behavior of the pressure depending on geometrical parameters as well as the hydraulic cylinders on duty through consideration of a specific input movement. The validation demonstrates some of the possibilities to adjust the restraining torque depending on the hydraulic cylinder geometrical configuration and the number of hydraulic cylinders on duty. In addition some simulation tests on the PTO output are displayed, at different percentages of the aperture of the control valve, in order to check the speed of the hydraulic motor.
Firstly the capabilities of this hydraulic PTO through simulation tests are presented, and, secondly, the comparison between the simulation and experimental results after the adjustment of the main features of the components of the model are explained.
4.1. Simulation Validation
With the aim of checking the behavior of the PTO model, different simulations have been carried out using the geometrical configurations indicated in
Table 10 whilst applying the same input movement signal.
For the sake of the validation, and later on, the adjustment of the model, a sinusoidal input signal with an amplitude of 40 mm at 0.1 Hz has been selected to move the rack-pinion geared system. In
Table 10 the values of the parameters OB (R), AC (L) and OC of each hydraulic cylinder for the selected configurations are defined. The values of each geometrical configuration used in this article correspond to maximum (Config 2), minimum (Config 3) and medium (Config 4) available distances for the OB and AC parameters. Config 1 corresponds to the geometrical configuration used in the experimental tests (see
Section 4.2). For simplicity, these values are selected at the beginning of the simulation.
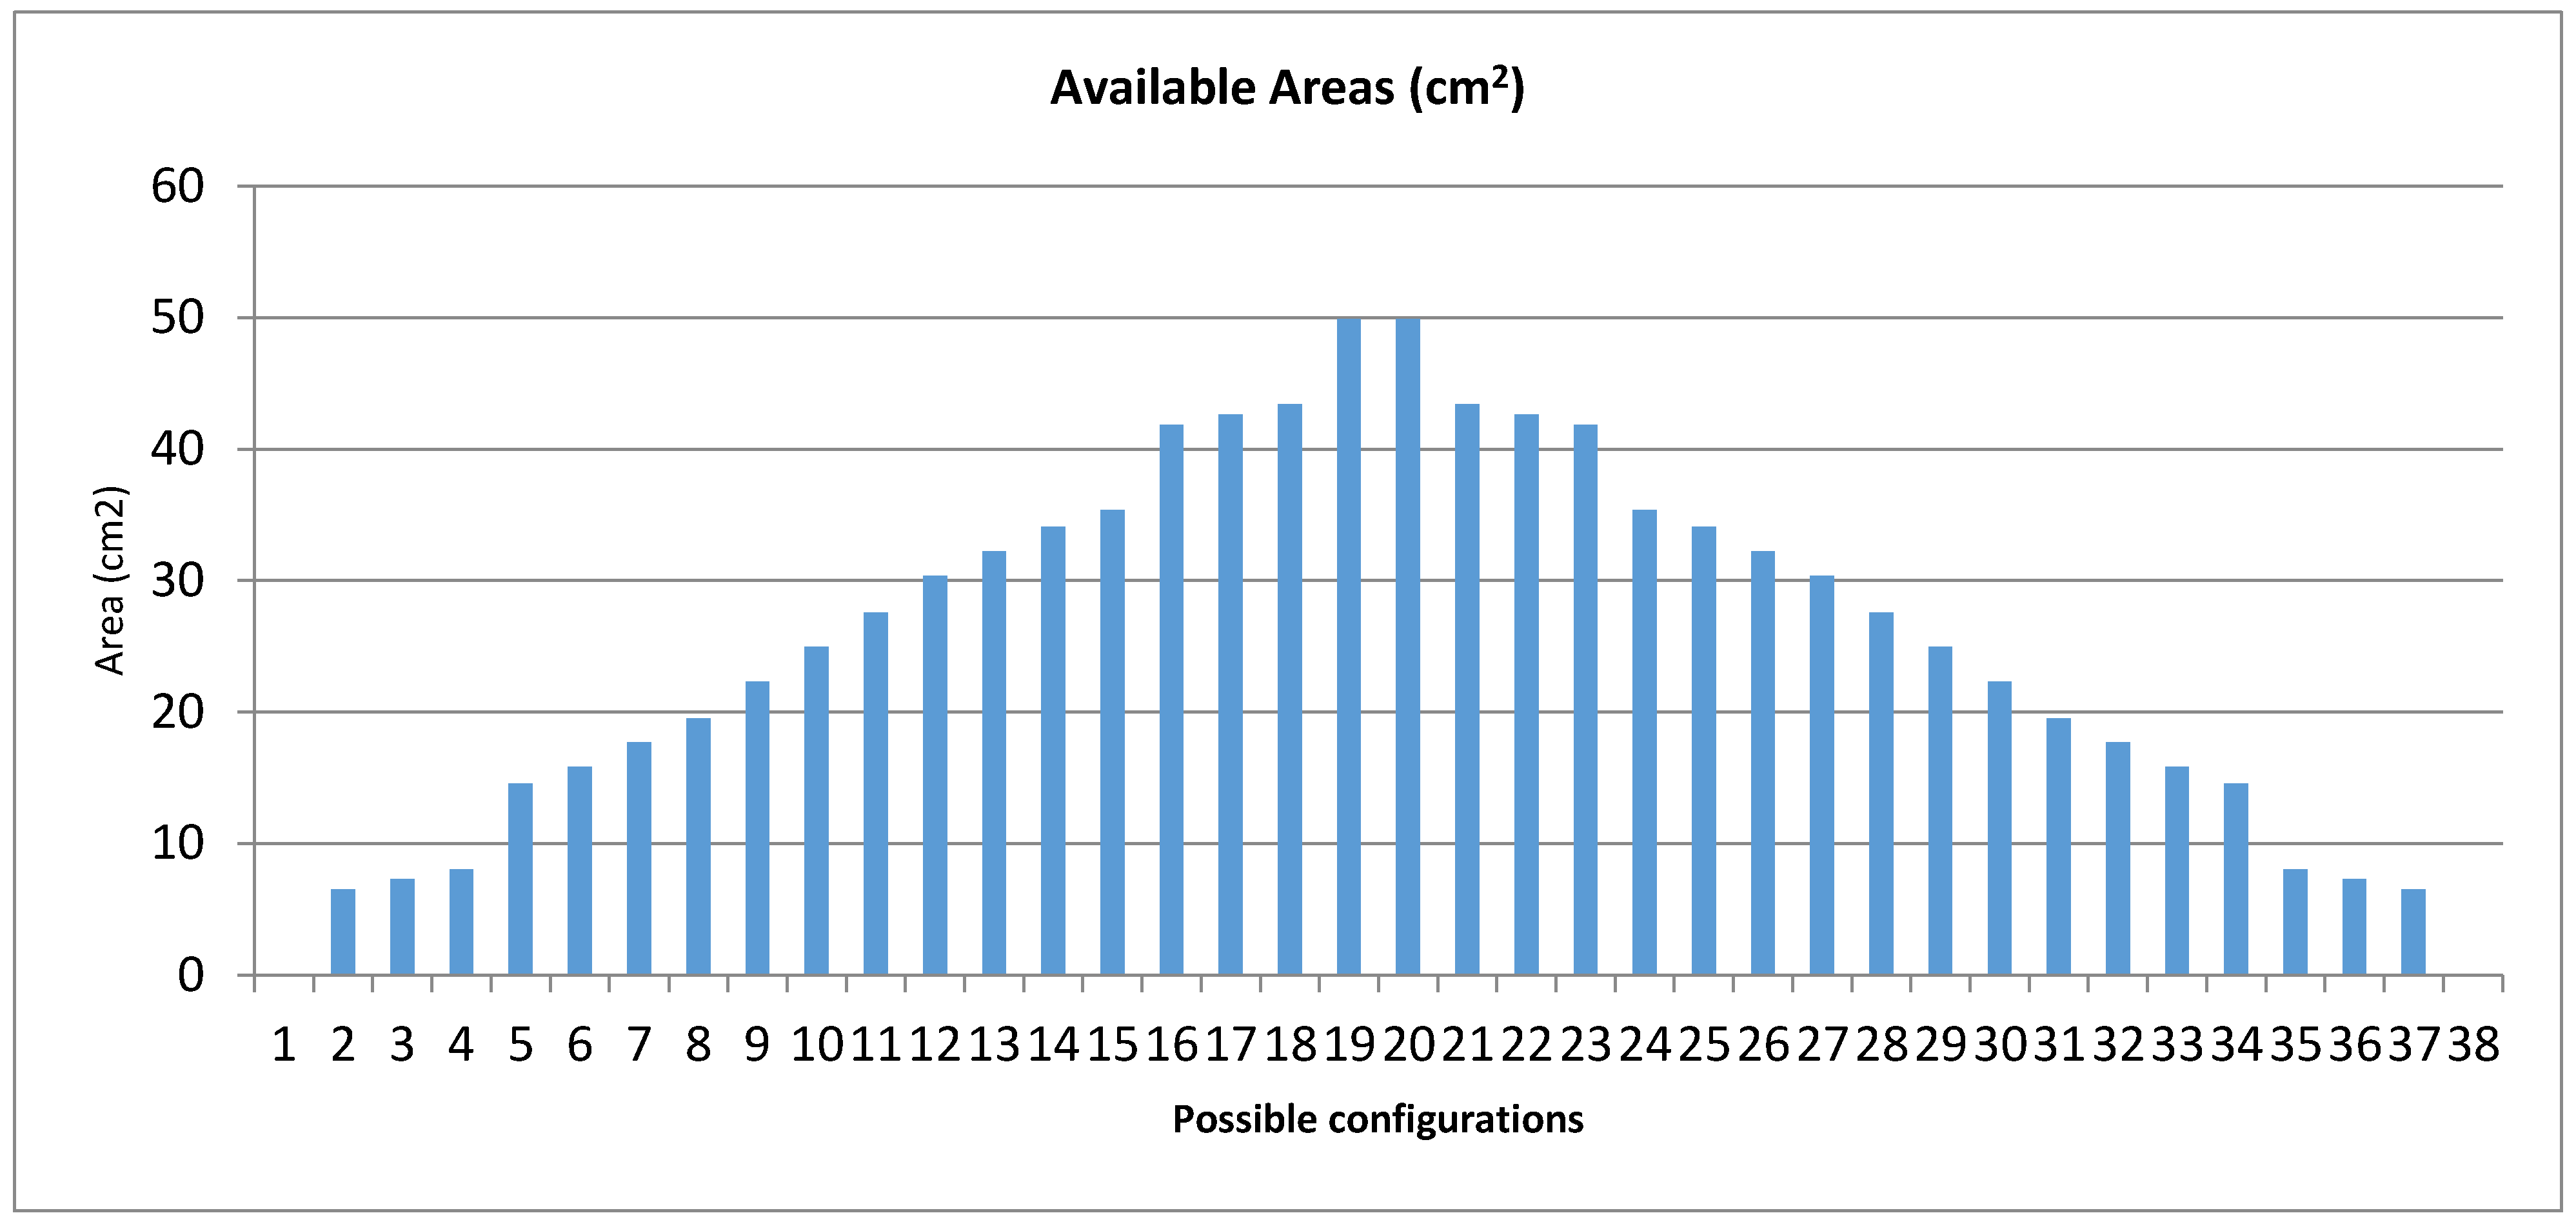
The configurations are related to the maximum displacement, AB, allowed for the hydraulic cylinder rod and previously indicated in
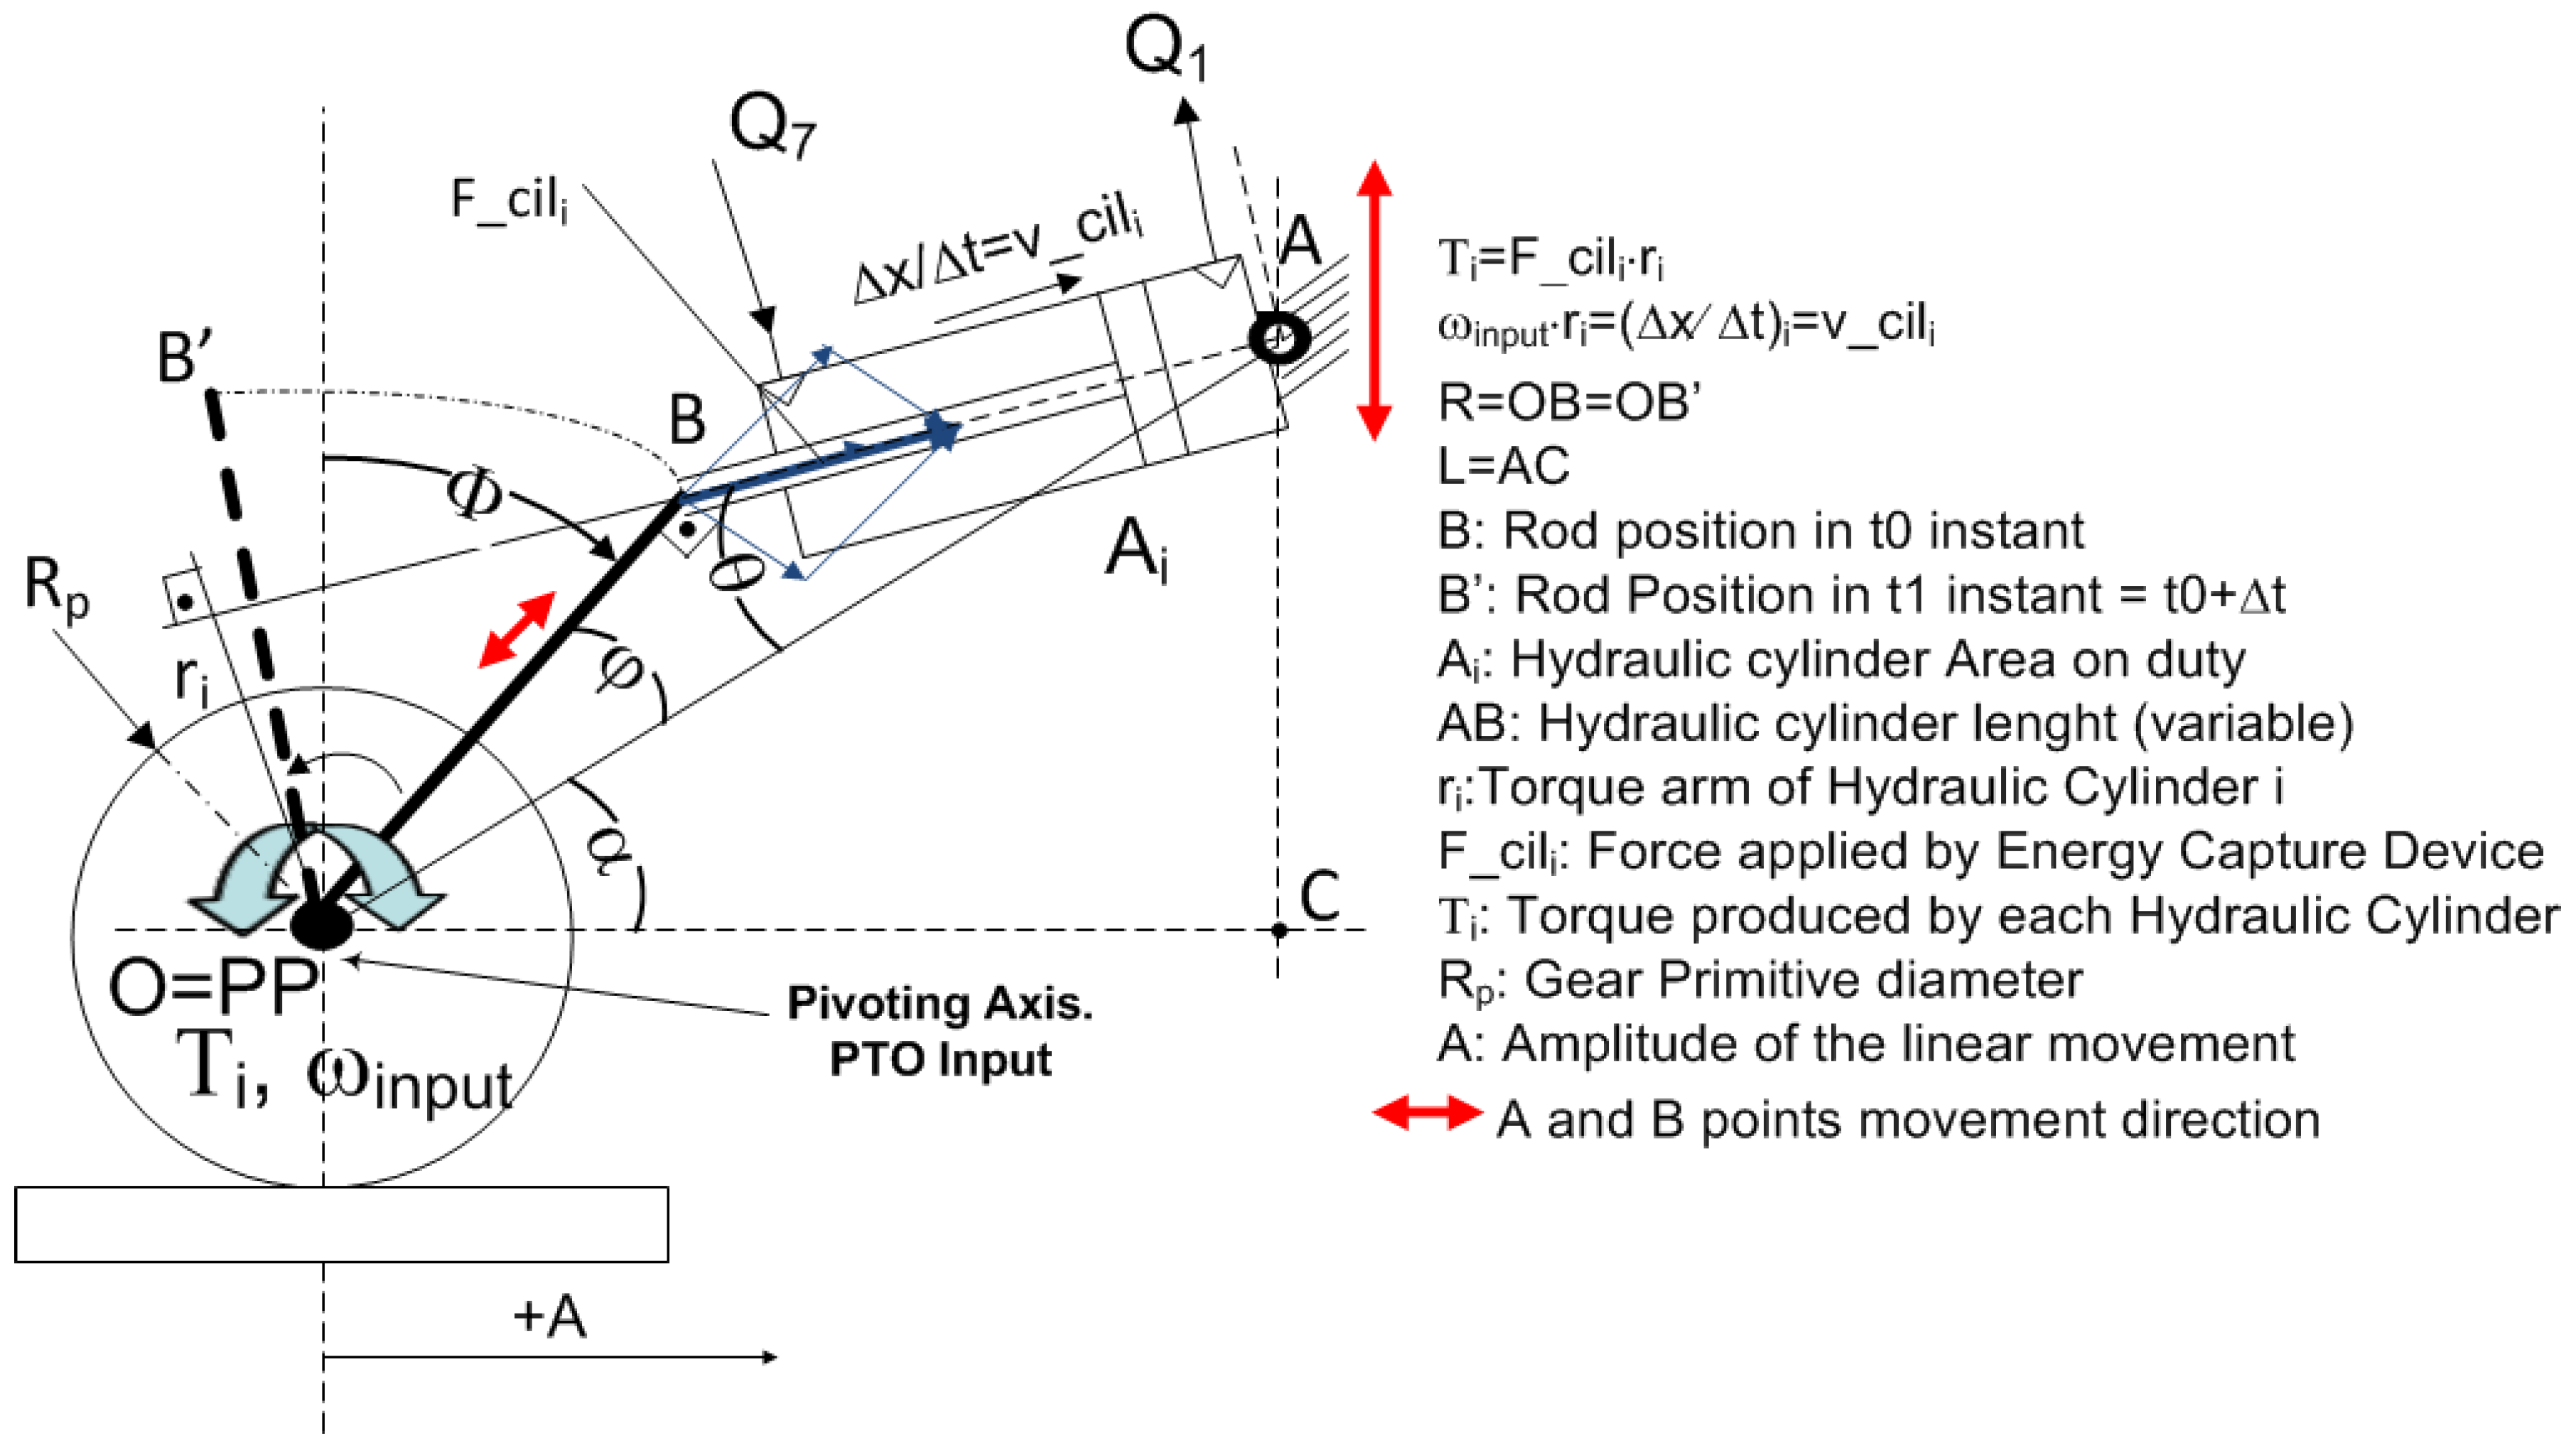
Table 1. In this sense, Config 1 allows greater displacement than Config 2, which in turns is greater than Config 4. The lowest allowed displacement is applied by Config 3. The movement directions of points A and B are displayed in
Figure 2 and can be globally seen in [
27].
In the model, the different geometrical configurations available for each hydraulic cylinder are discrete (see
Table 1). These geometrical configurations could be modified automatically during the operation. Depending on the reaction forces to be supported the choice of each geometrical configuration in the PTO could be driven by electromechanical or hydraulic devices in real application, as indicated in the submitted patent [
41]. In the simulations, for validation and experimental tests, these configurations are modified manually at the beginning of each simulation.
The following subsections describe the simulation test performed to check the behavior of the PTO in three different scenarios related to the control valve state: Control valve completely open, control valve completely closed and, finally, control valve opened at some specific aperture percentage.
4.1.1. Simulation Test I: PTO Behavior Using Fully Open Control Valve
These simulation tests consist of applying a sinusoidal input signal maintaining the control valve completely open. This means that the aperture percentage of the control valve remains at one hundred. In this case, the flow injected by the active hydraulic cylinders will be transmitted completely at the PTO output, except for any leaks within the circuits. The flow through the fixed-displacement hydraulic motor will have a very similar shape when compared to the injected flow rate.
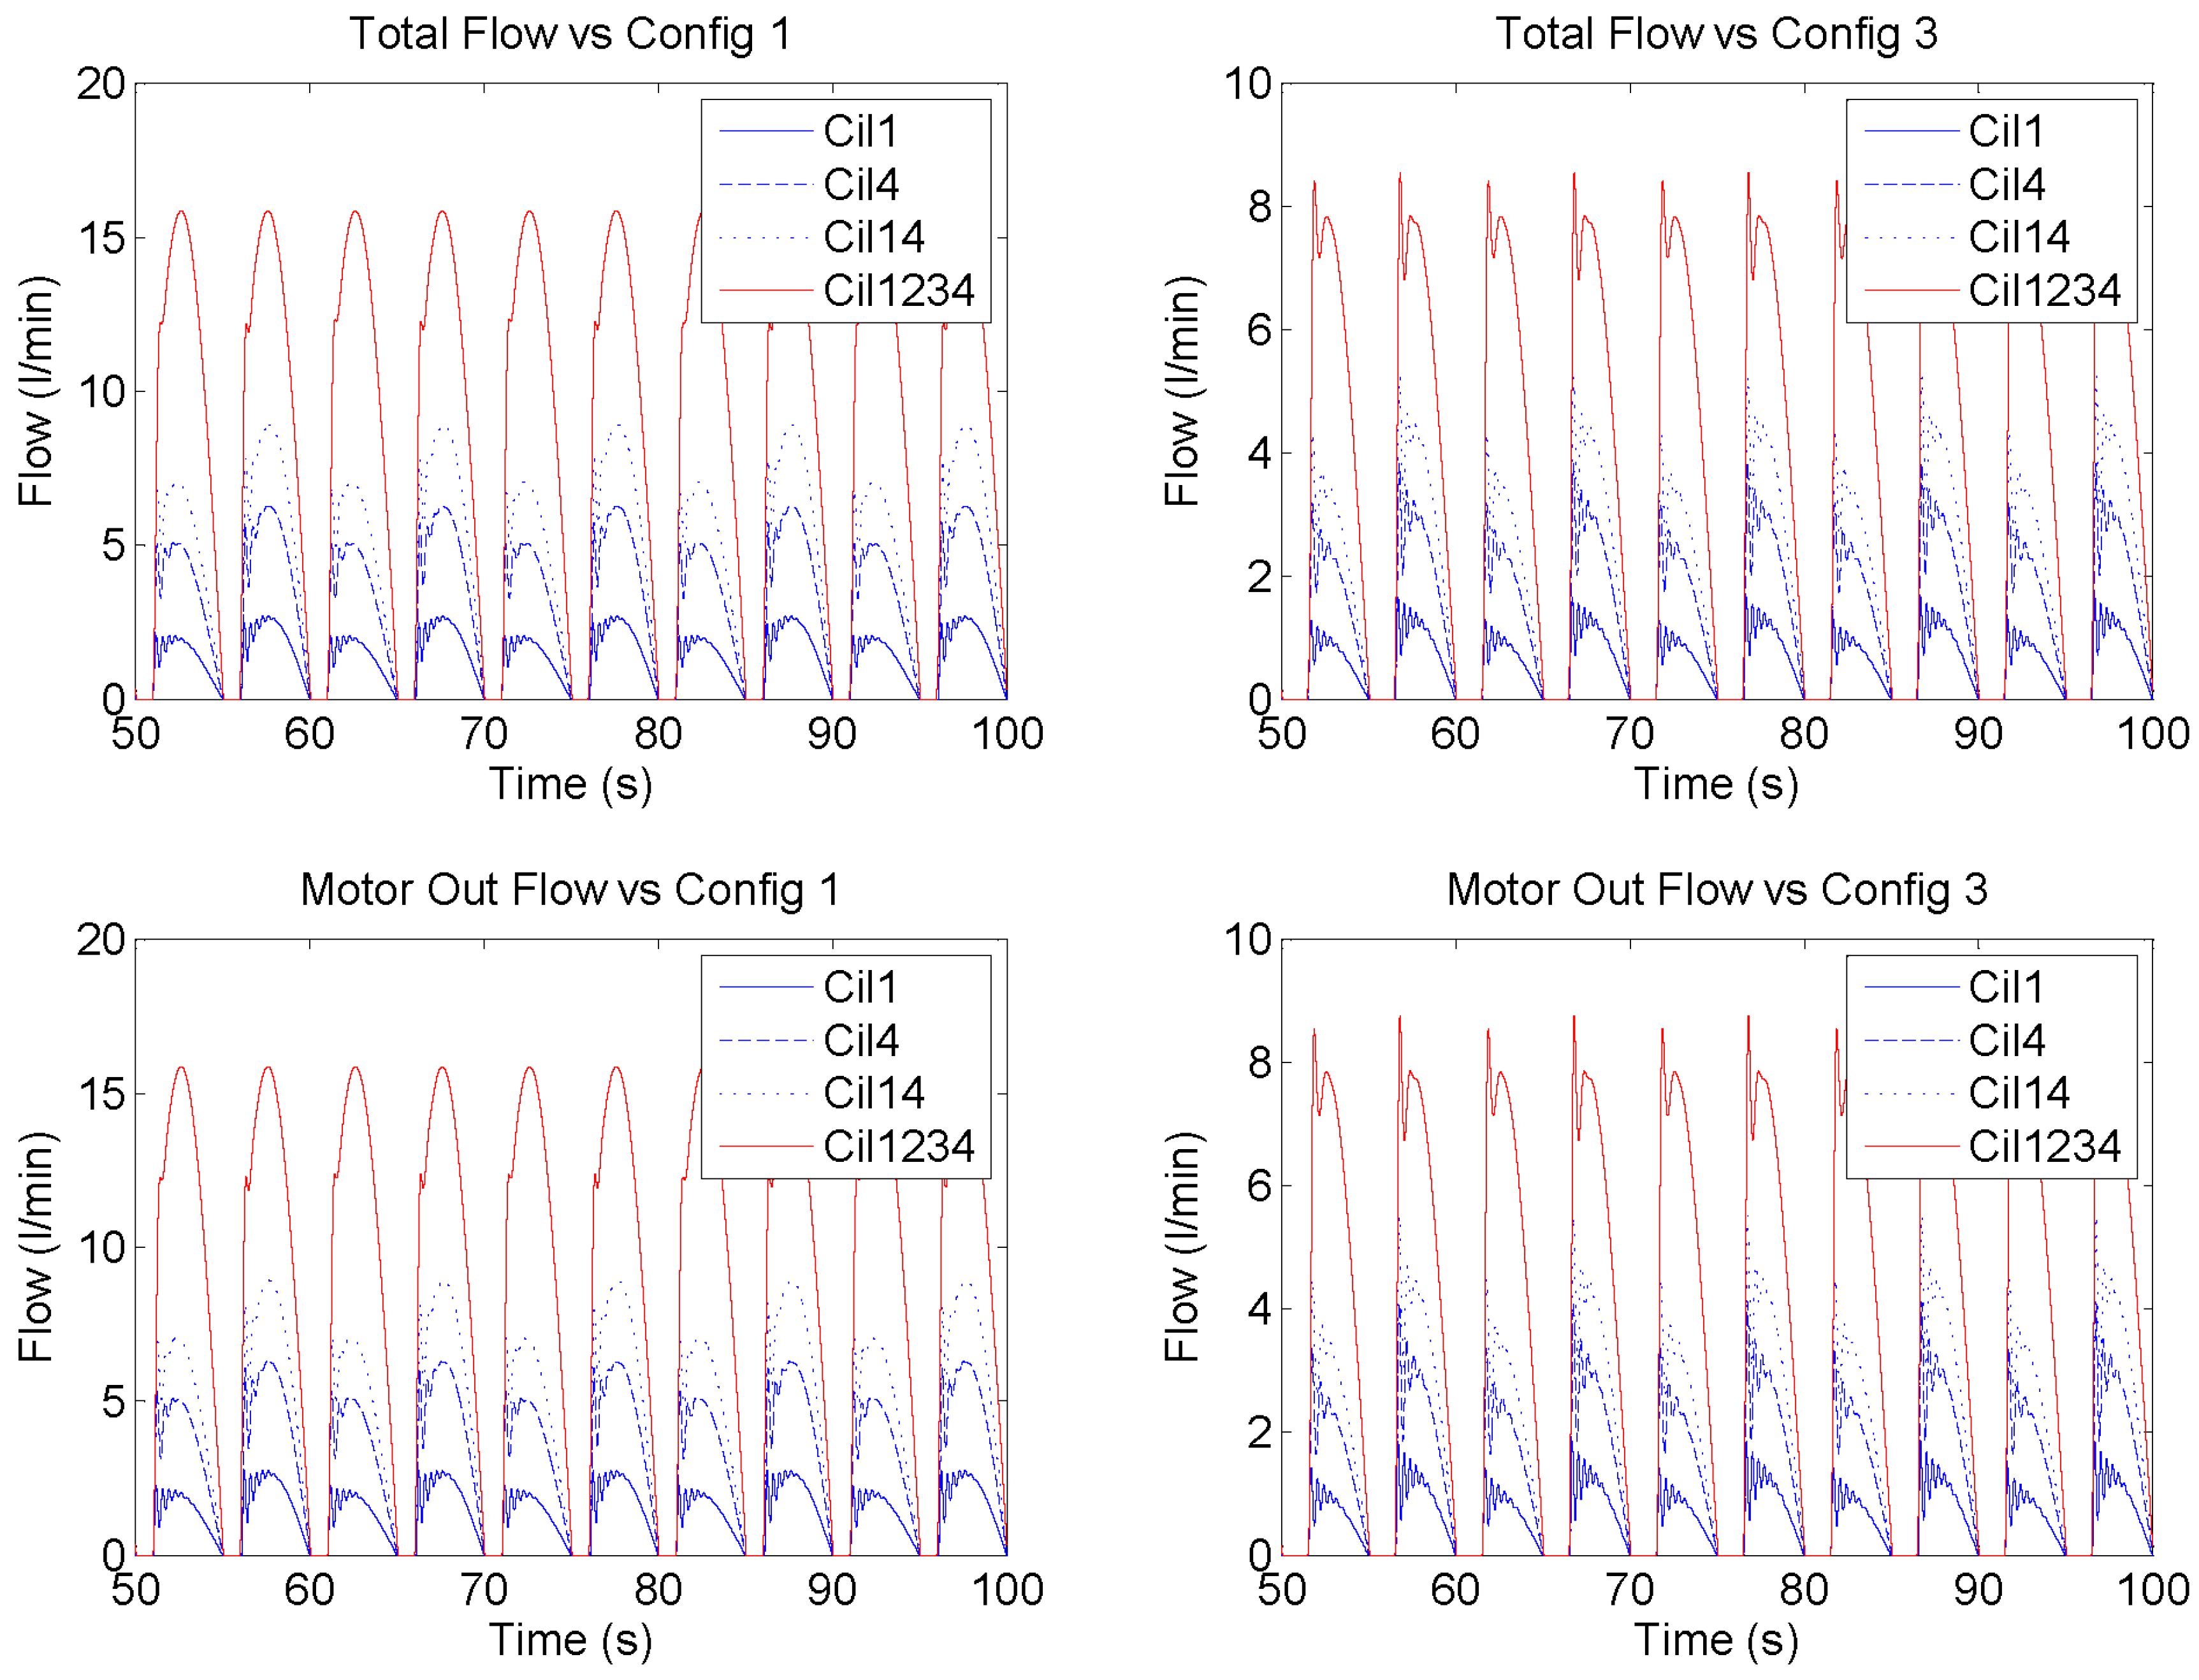
Figure 10 shows the behavior of the input and output flows of the PTO for a specific time and when two geometrical configurations are used (Config 1 and Config 3). The behavior of the flow depends on the activated hydraulic cylinders. The upper left area of
Figure 10, shows the instantaneous oil flow injected in the HP side of the circuit with four different activated hydraulic cylinders and using a geometrical configuration that allows high axial displacement of each cylinder rod (Config 1). In the bottom left area of the figure, the flow through the hydraulic motor is shown. The upper right side of
Figure 10 shows the instantaneous oil injected in the HP side of the circuit by activating the same cylinders but using a geometrical configuration which allows low axial displacement of each cylinder rod (Config 3). In the bottom right side of the figure, the flow through the hydraulic motor is shown. As Config 1 enables higher rod displacements than Config 3, the injected flow to the high pressure side is higher. As can be seen in the
Figure 10, the flow is asymmetrical during one cycle in Cil1, Cil4 or Cil14 cases. This is due to the differences between the piston and annulus areas of each hydraulic cylinder. Hydraulic cylinders with the same characteristics are placed on opposite sides. Therefore only when both of the same characteristics are active will the maximum flow be the same, and independent of the movement direction. This occurs when hydraulics cylinder HC3.1 and HC3.3 or HC3.2 and HC.34 are active. One particular case is shown in
Figure 10, where all hydraulic cylinders are activated. The upper and lower graphs are very similar, because the only difference between them is the leakage in the circuit. The sharp peaks of each configuration are related to the inclusion of the pipes in the hydraulic model. According to [
25], the inclusion of pipes decreases the stiffness of the hydraulic pump system, in our case the hydraulic cylinders on duty, which can cause a phase delay from the pumped fluid. The longer the length of the pipes, the higher the dead volume of the hydraulic circuit and the lower the stiffness. As indicated in
Section 4.2, the amount of trapped air is estimated at around 6%, which further reduces the stiffness of the system. This effect is more pronounced if the hydraulic cylinders on duty are the smallest ones because the hydraulic cylinder chamber volume is lower than the dead volume.
The flow through the fixed-displacement hydraulic motor allows the rotation of the hydraulic motor axis proportionally to the displacement.
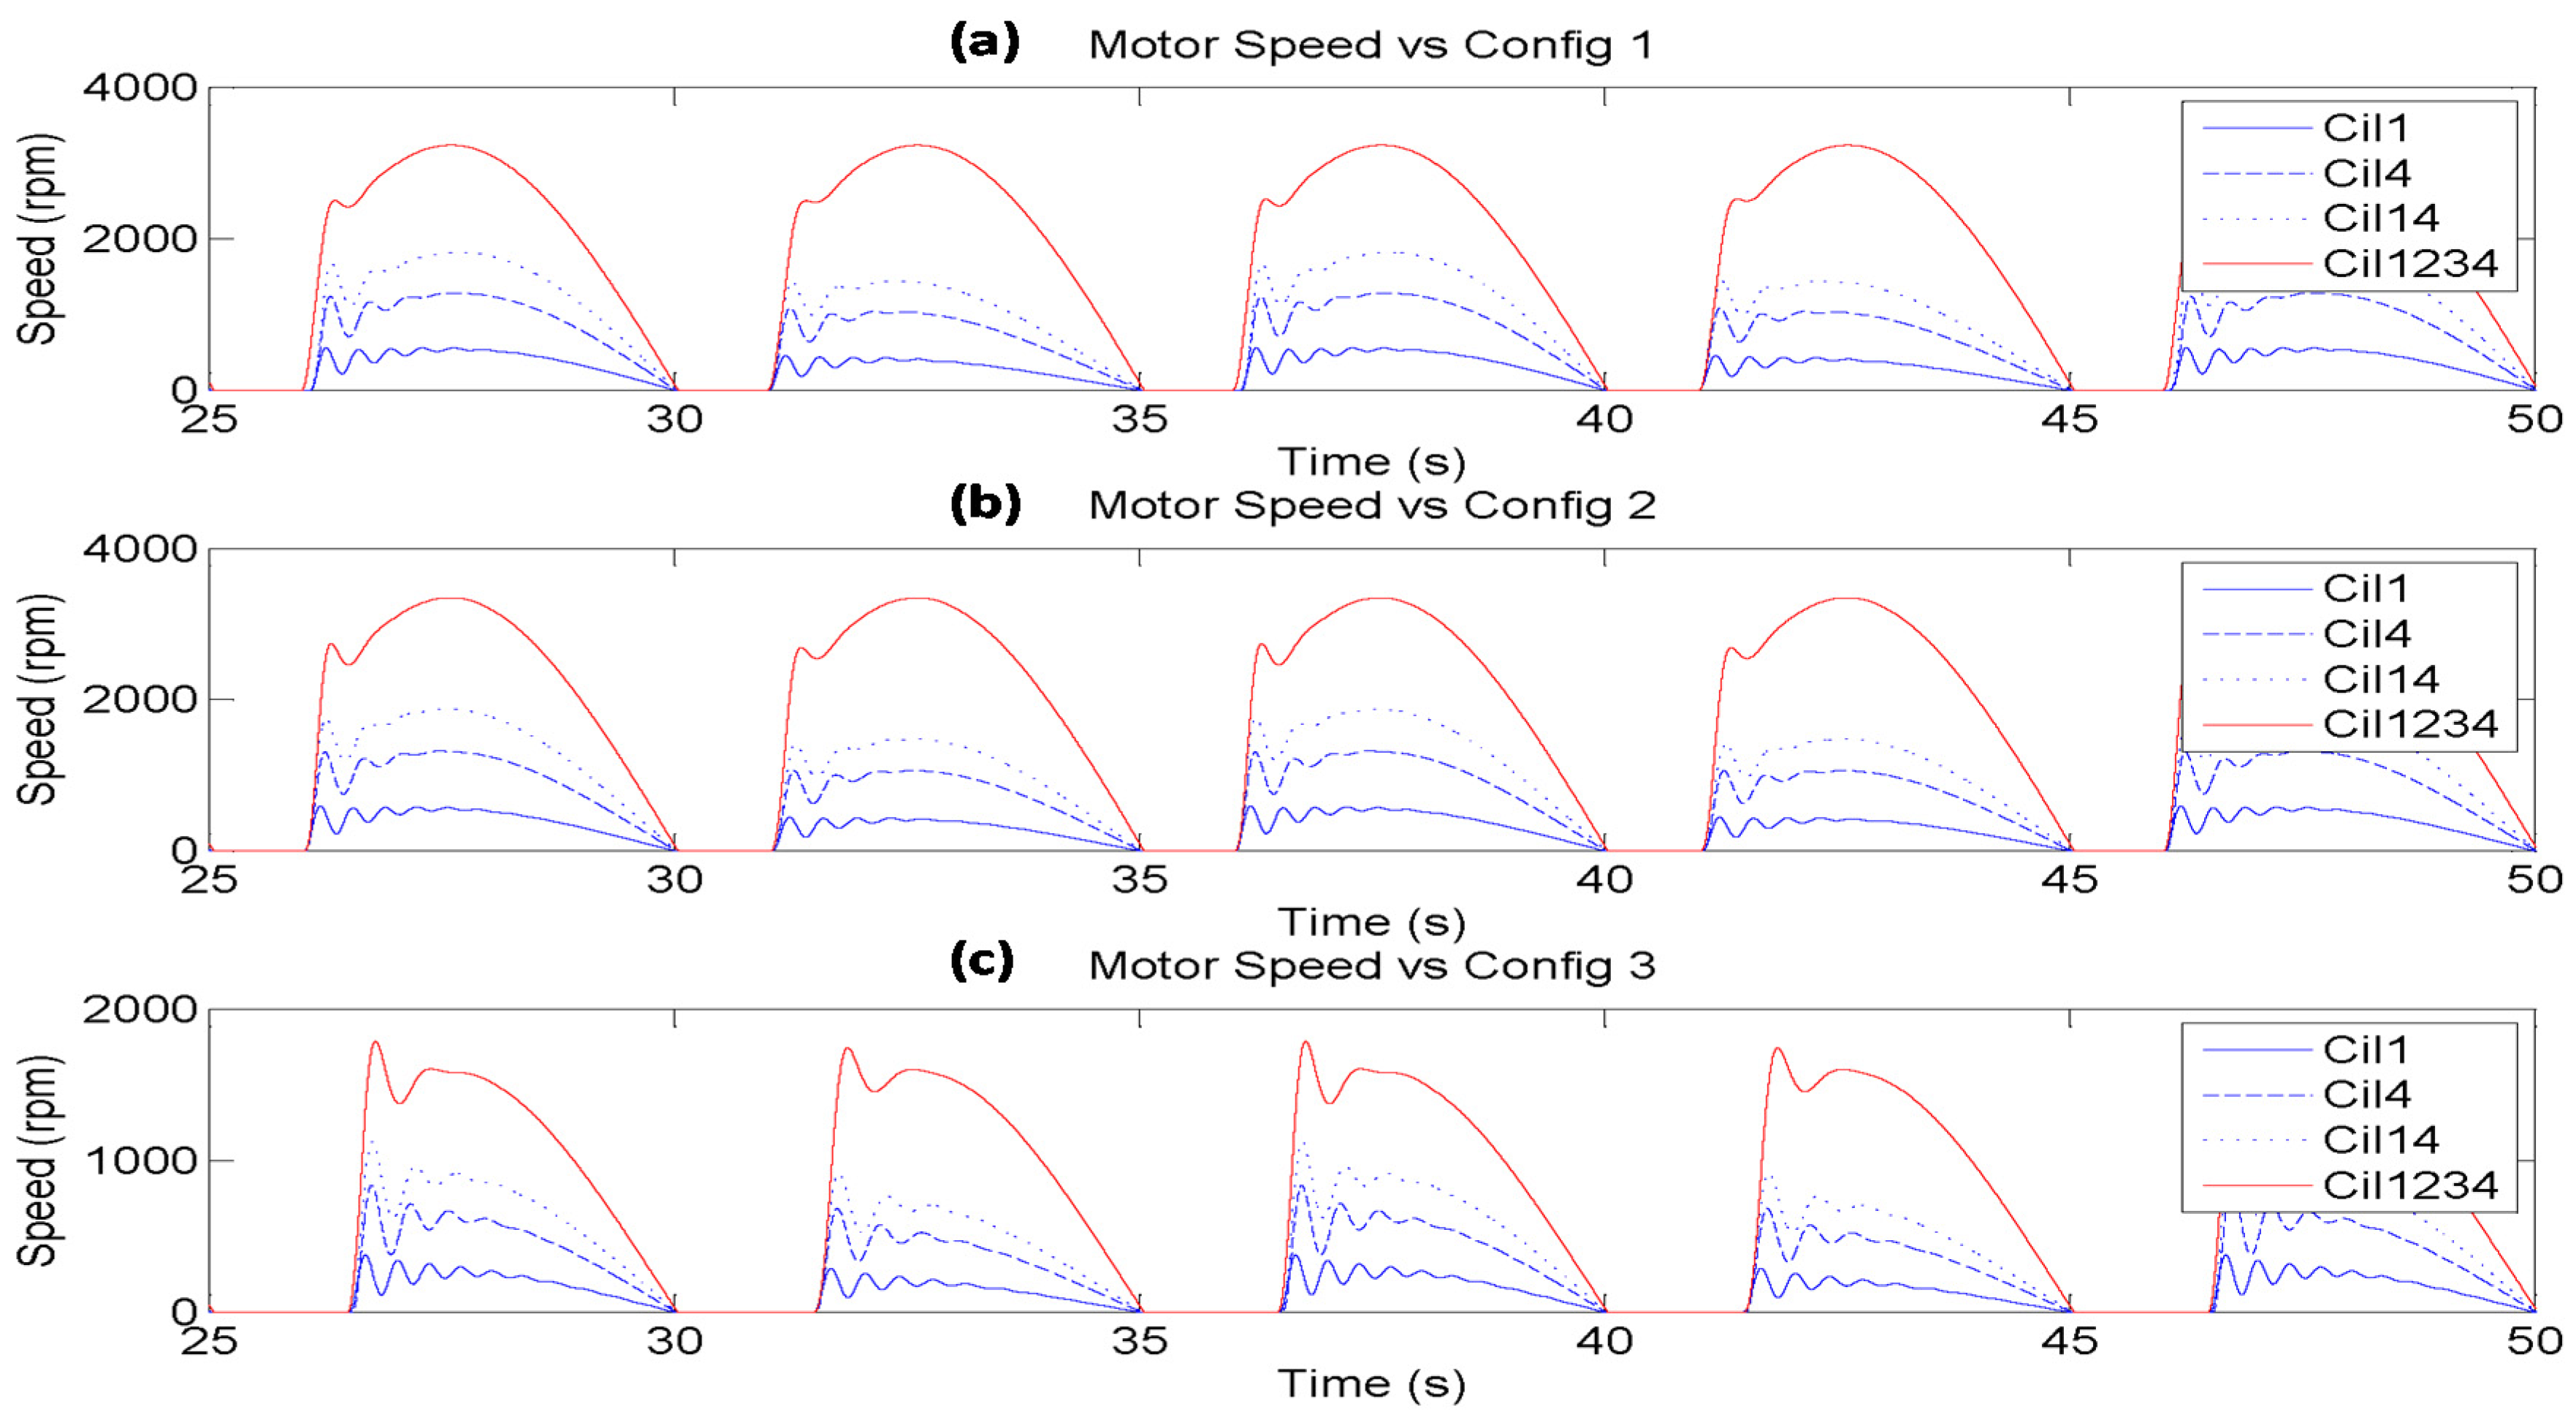
Figure 11 illustrates the behavior of the hydraulic motor speed in the same configurations using identical active hydraulic cylinders. In this case, three different geometrical configurations are shown; the two previous configurations (a and c graphs) and also the configuration with the highest rod displacement of the hydraulic cylinders (Config 2).
Figure 10.
Instantaneous flow at the PTO input and output versus activated cylinders using configuration 1 and 3.
Figure 10.
Instantaneous flow at the PTO input and output versus activated cylinders using configuration 1 and 3.
Figure 11.
Instantaneous hydraulic motor speed versus activated cylinders using different configurations: Config 1 (a), Config 2 (b) and Config 3 (c).
Figure 11.
Instantaneous hydraulic motor speed versus activated cylinders using different configurations: Config 1 (a), Config 2 (b) and Config 3 (c).
In this arrangement the movement of the hydraulic cylinder rods using Config 1 and 2 provoke a very similar angular speed in the hydraulic motor. Hence, the angular speed at the hydraulic motor shaft will be very similar.
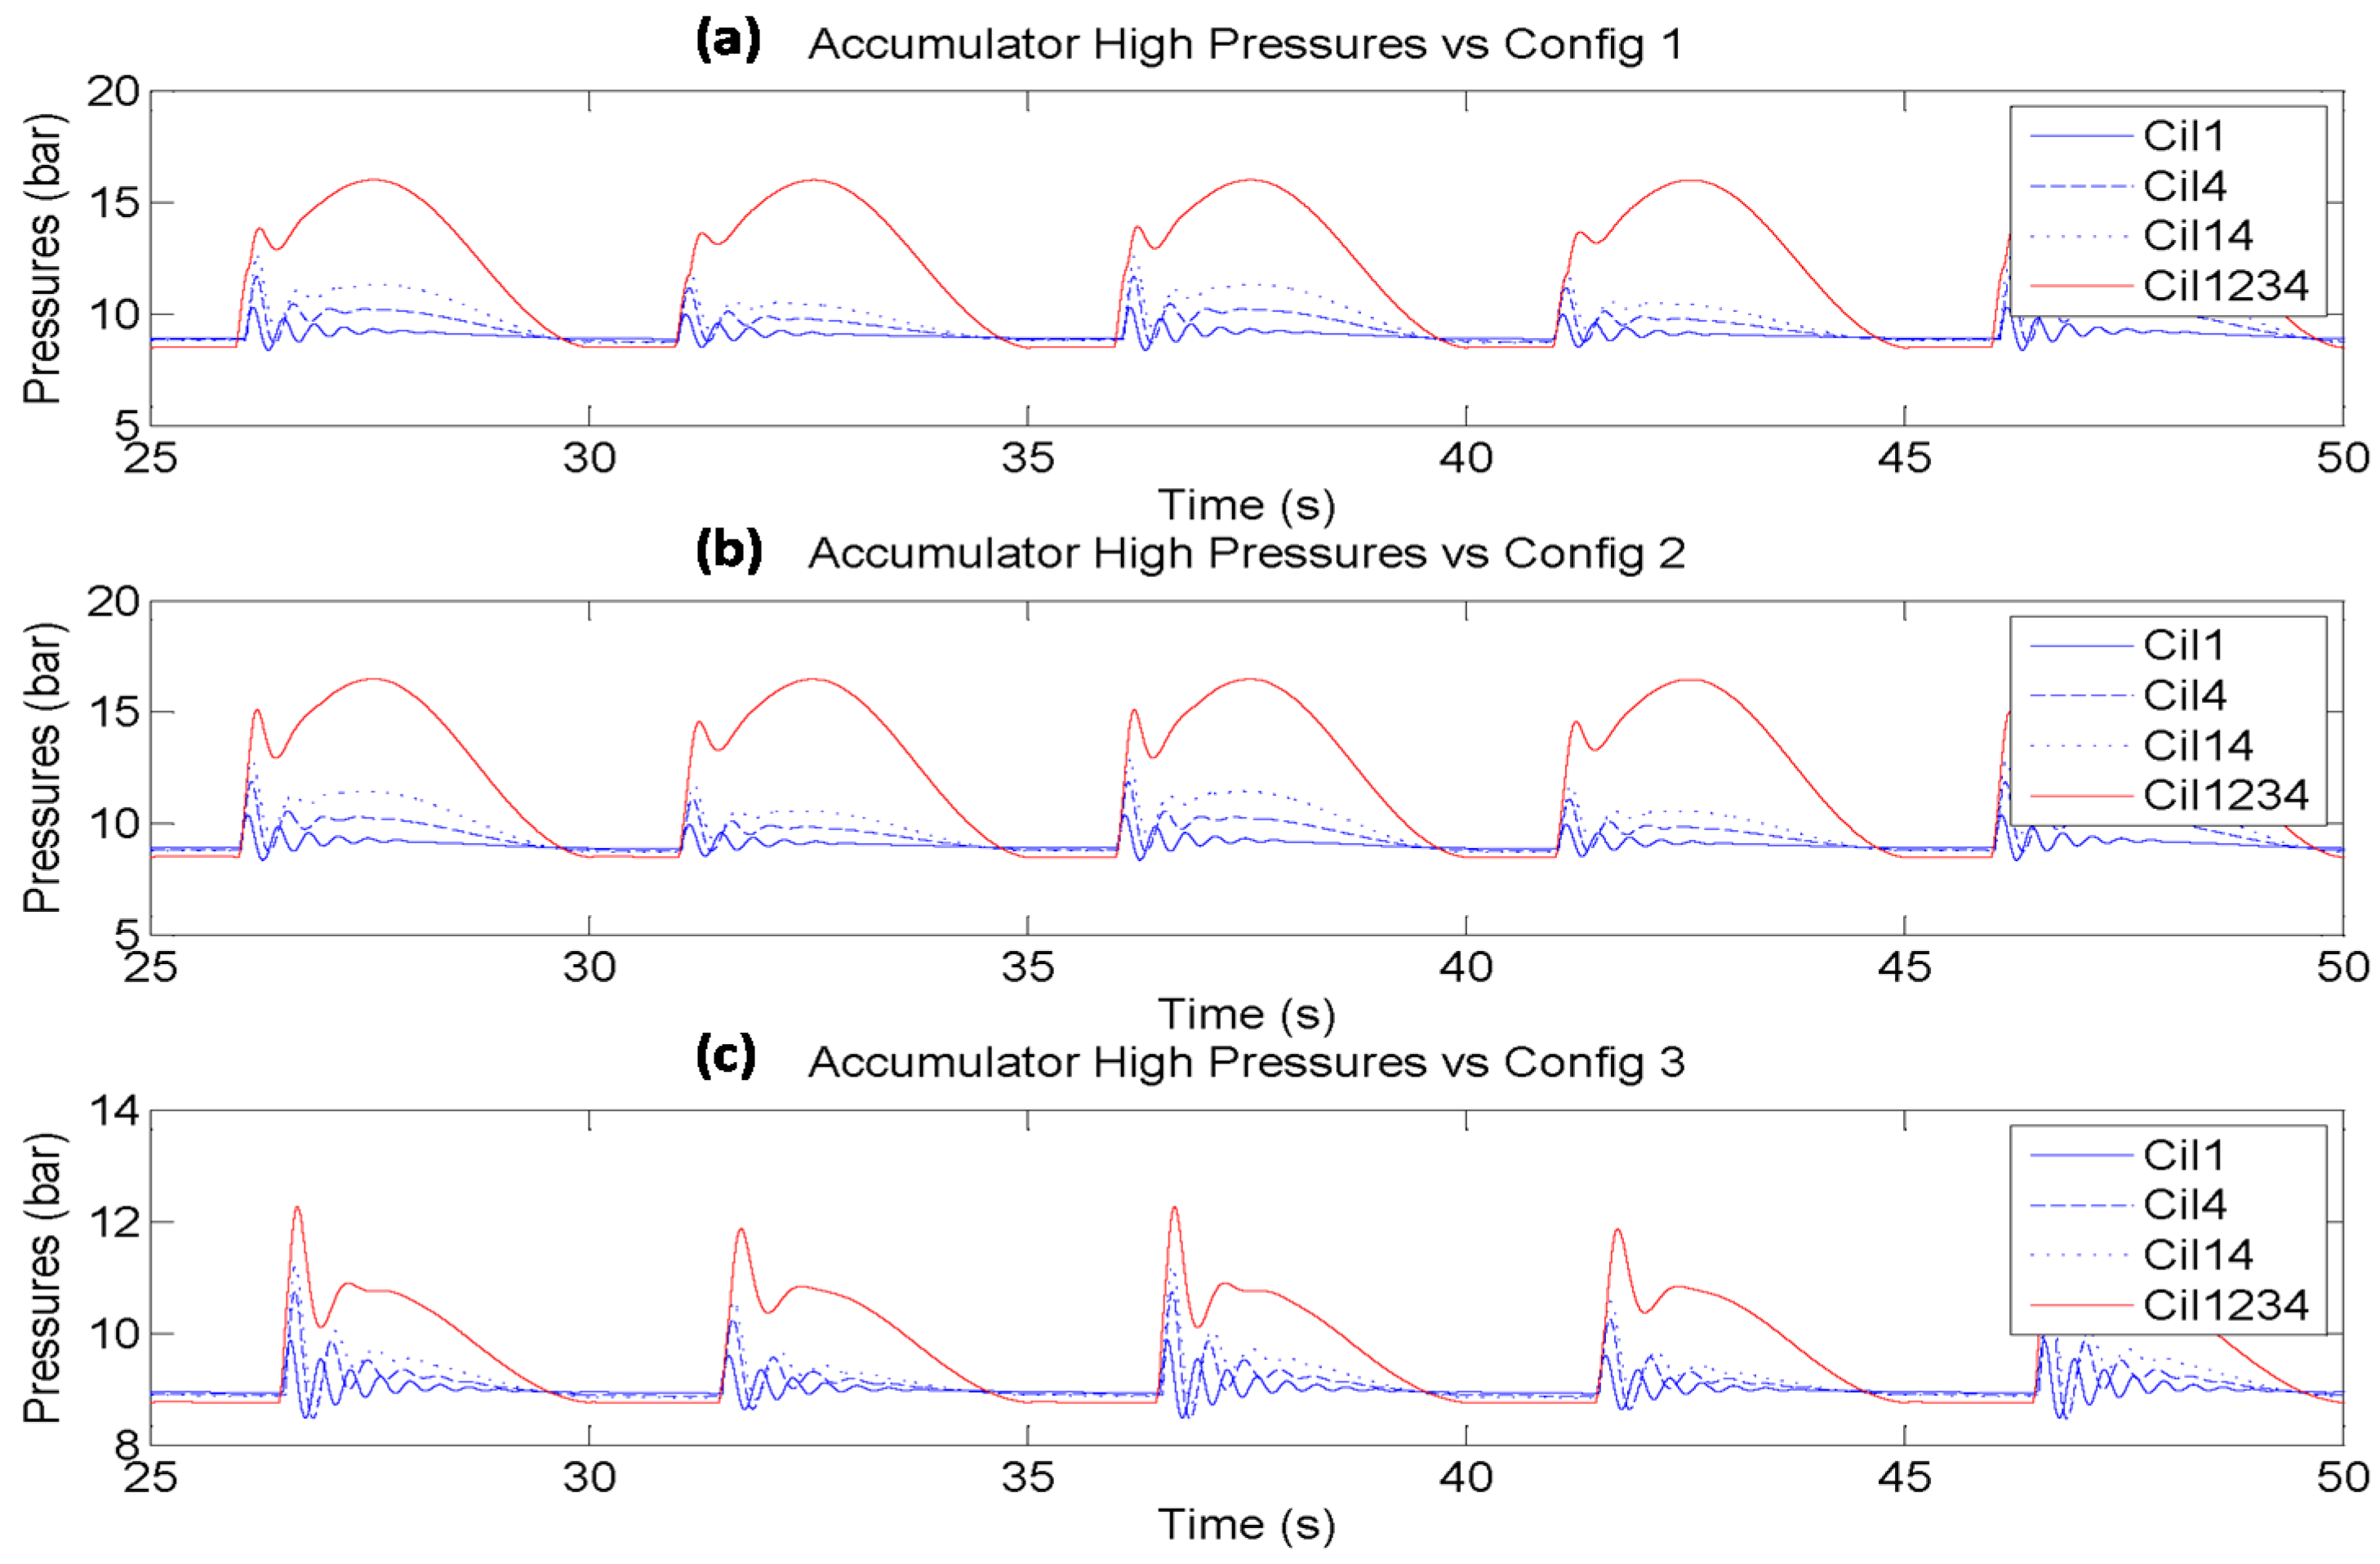
Figure 12 depicts the behavior of the instantaneous HP Accumulator pressure using identical active hydraulic cylinders in the same geometrical configurations from
Figure 11. As mentioned before, the sharp peaks of each configuration are related to the pipes included between the hydraulic cylinders and the accumulators. These components reduce the stiffness of the hydraulic system.
Figure 12.
Instantaneous HP Accumulator pressure versus activated cylinders using different configurations: Config 1 (a), Config 2 (b) and Config 3 (c).
Figure 12.
Instantaneous HP Accumulator pressure versus activated cylinders using different configurations: Config 1 (a), Config 2 (b) and Config 3 (c).
4.1.2. Simulation Test II: PTO Behavior Using Control Valve Completely Closed
These simulation tests consist of applying a sinusoidal input signal whilst maintaining the control valve completely closed. This means that the aperture percentage of the control valve remains at zero. In this case, the flow injected in the HP side of the hydraulic circuit by the active hydraulic cylinders is stored inside the HP accumulator itself. As the oil volume inside the accumulator is higher than previously, the internal pressure in the accumulator, P2, will increase. These simulation tests demonstrate the flexibility to modify the HP accumulator pressure evolution, on the one hand, depending on the geometrical configuration whilst a specific combination of hydraulic cylinders are active and, on the other hand, depending on the active hydraulic cylinder whilst a specific geometrical configuration is fixed.
As in the previous tests, several geometrical configurations have been selected to show the behavior of the HP accumulator. In this simulation, the relief valve has been fixed at 130 bar. Therefore, if the oil volume inside the HP accumulator reaches to a specific value that exceeds 130 bar, any subsequent input movement will overcome the relief valve pressure. In this case, the injected flow will go through the relief valve, maintaining the same high pressure unless input conditions change.
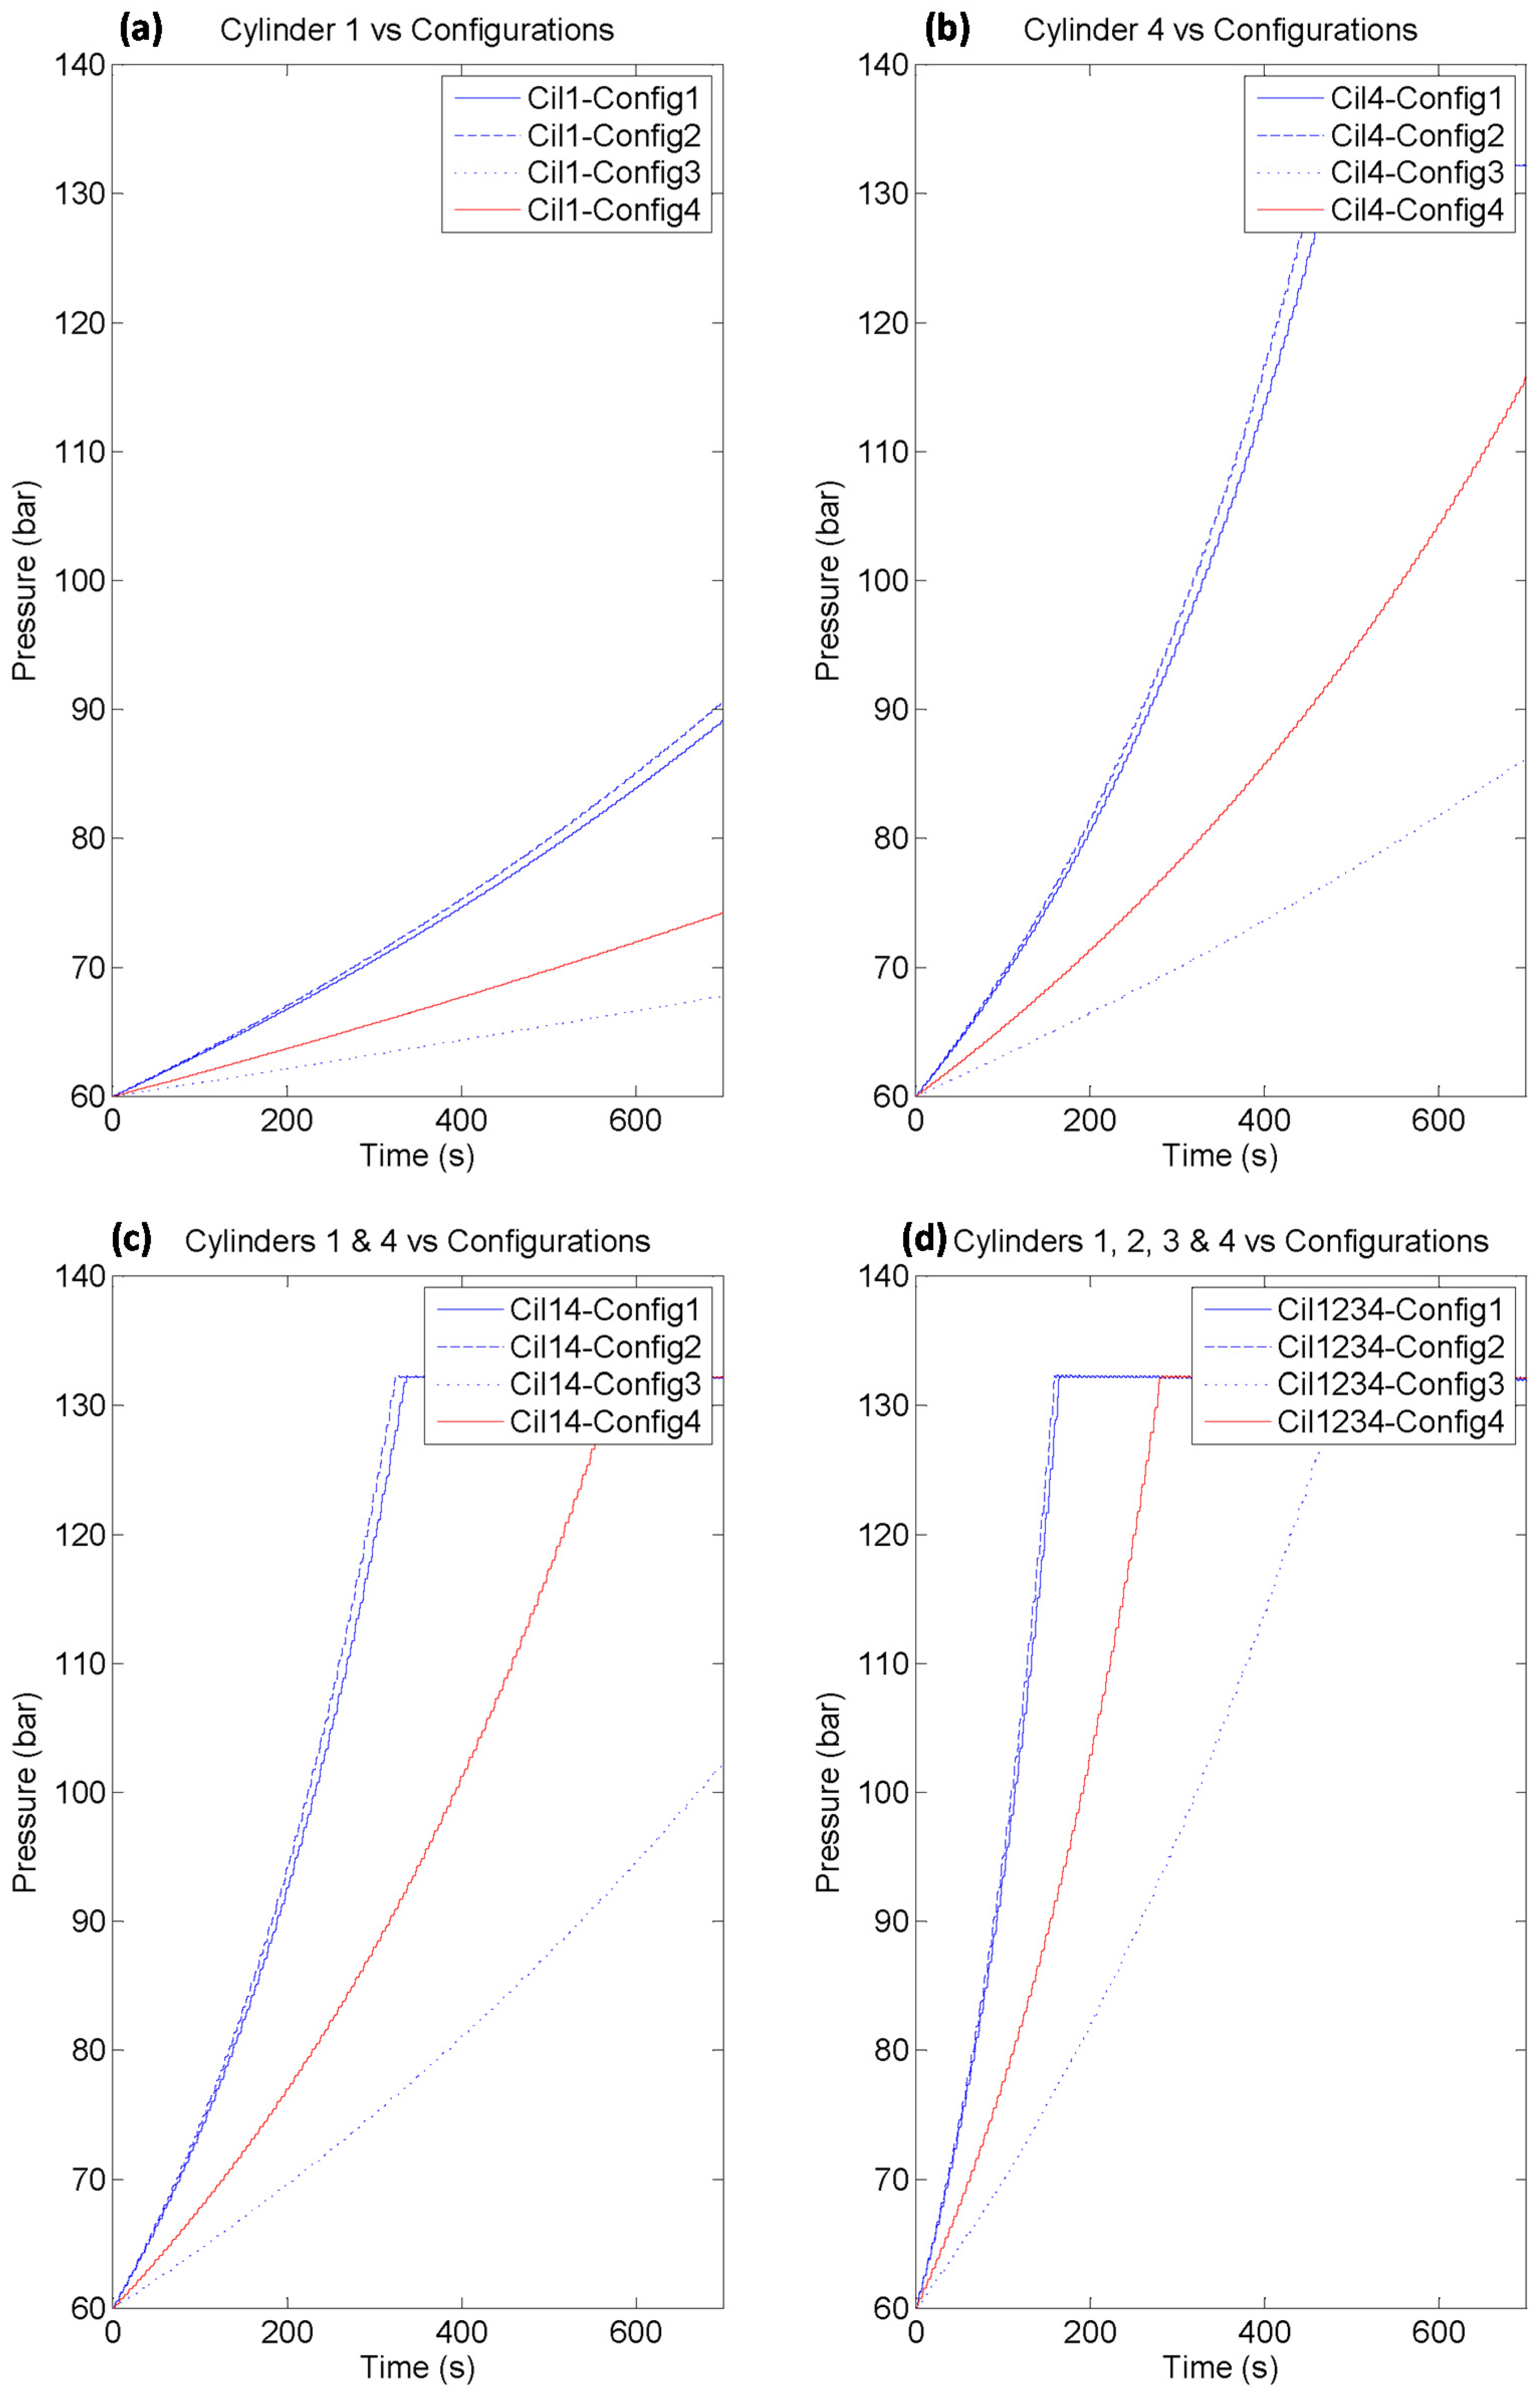
Each graph from
Figure 13 illustrates the evolution of the HP accumulator pressure maintaining the same hydraulic cylinder configuration active, whilst the geometrical configuration changes. When a specific hydraulic cylinder is active, the evolution of the HP accumulator pressure rate depends on the selected geometrical configuration. This fact is related to the maximum displacement allowed by each configuration. Config 1 will reach the required operation pressure faster than the other configurations.
Figure 13.
HP accumulator pressure evolution related to geometrical configuration, using a specific combination of active hydraulic cylinders. (a) Cylinder 1; (b) Cylinder 4; (c) Cylinders 1 and 4; (d) Cylinders 1, 2, 3 and 4.
Figure 13.
HP accumulator pressure evolution related to geometrical configuration, using a specific combination of active hydraulic cylinders. (a) Cylinder 1; (b) Cylinder 4; (c) Cylinders 1 and 4; (d) Cylinders 1, 2, 3 and 4.
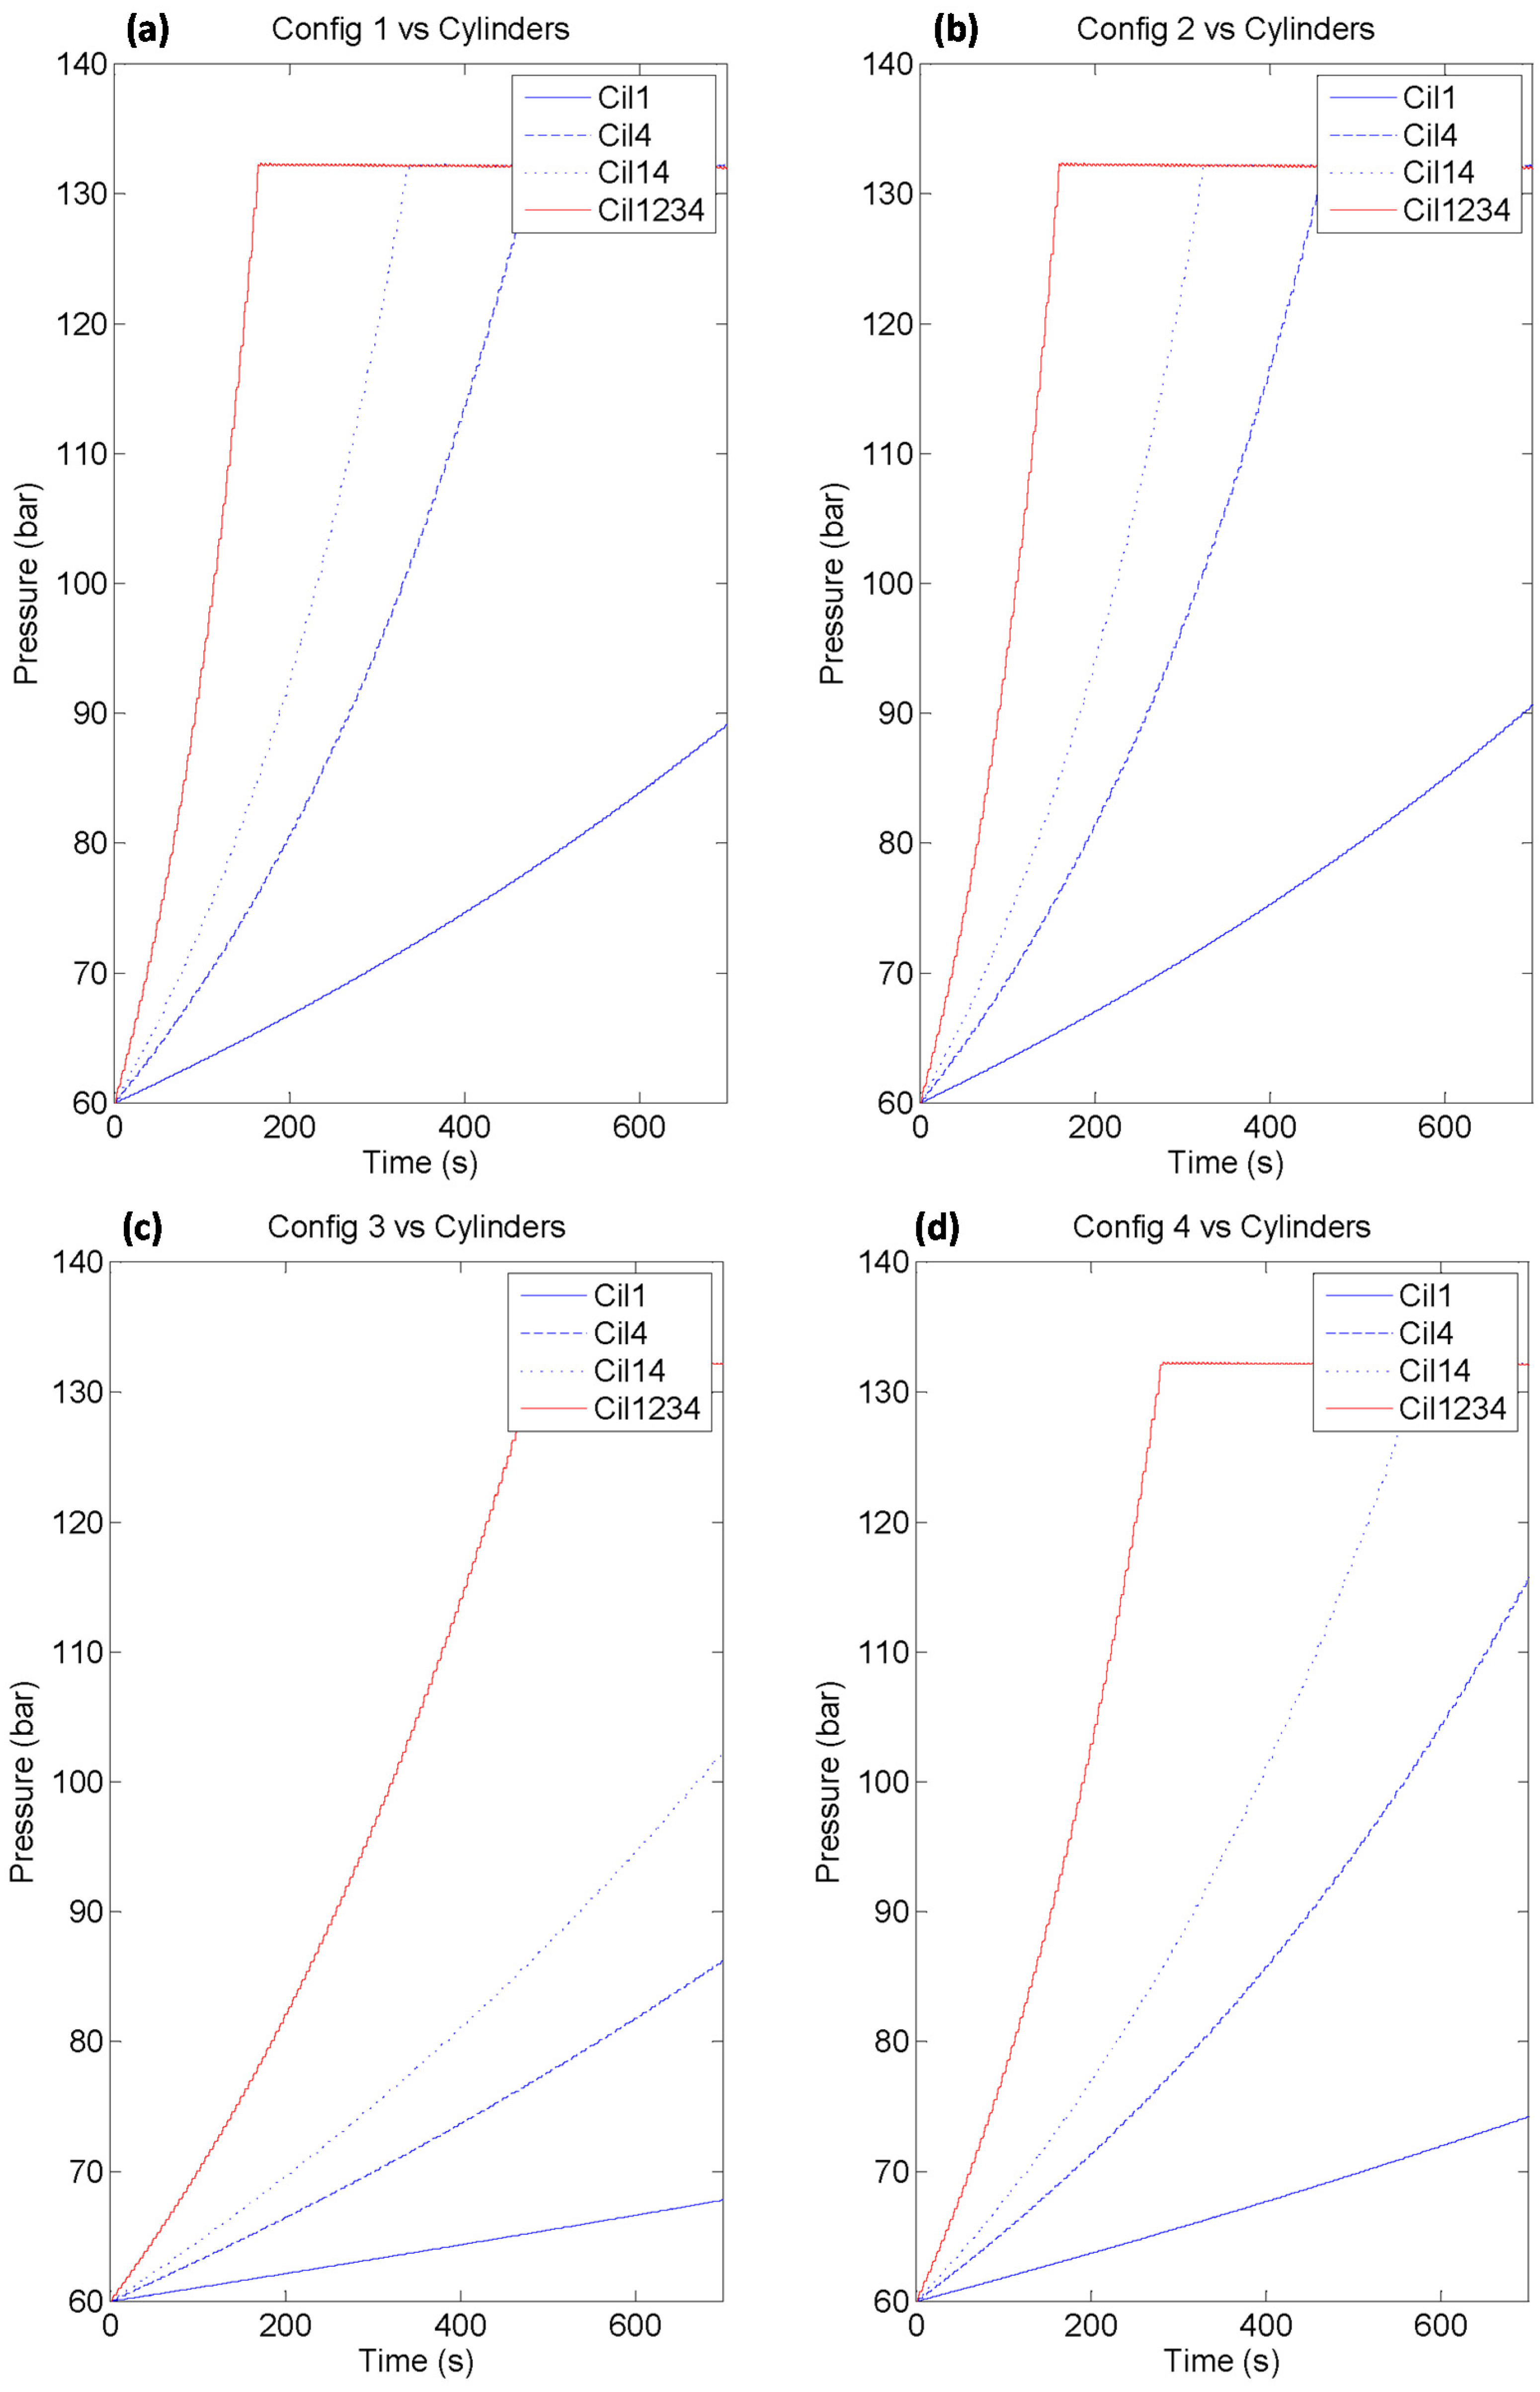
Each graph in
Figure 14 shows the behavior of each geometrical configuration when different hydraulic cylinders are activated. In this case, it is obvious that higher the number of activated hydraulic cylinders, the higher the rate of pressure evolution.
Figure 14.
High Pressure accumulator pressure evolution related to the active hydraulic cylinders, with a fixed specific geometrical configuration. (a) Config 1; (b) Config 2; (c) Config 3; (d) Config 4.
Figure 14.
High Pressure accumulator pressure evolution related to the active hydraulic cylinders, with a fixed specific geometrical configuration. (a) Config 1; (b) Config 2; (c) Config 3; (d) Config 4.
The pressure established at the HP accumulator, in conjunction with the area of the active hydraulic cylinders, allows the application of the restraining torque which will be used to brake the hypothetical wave energy capture device.
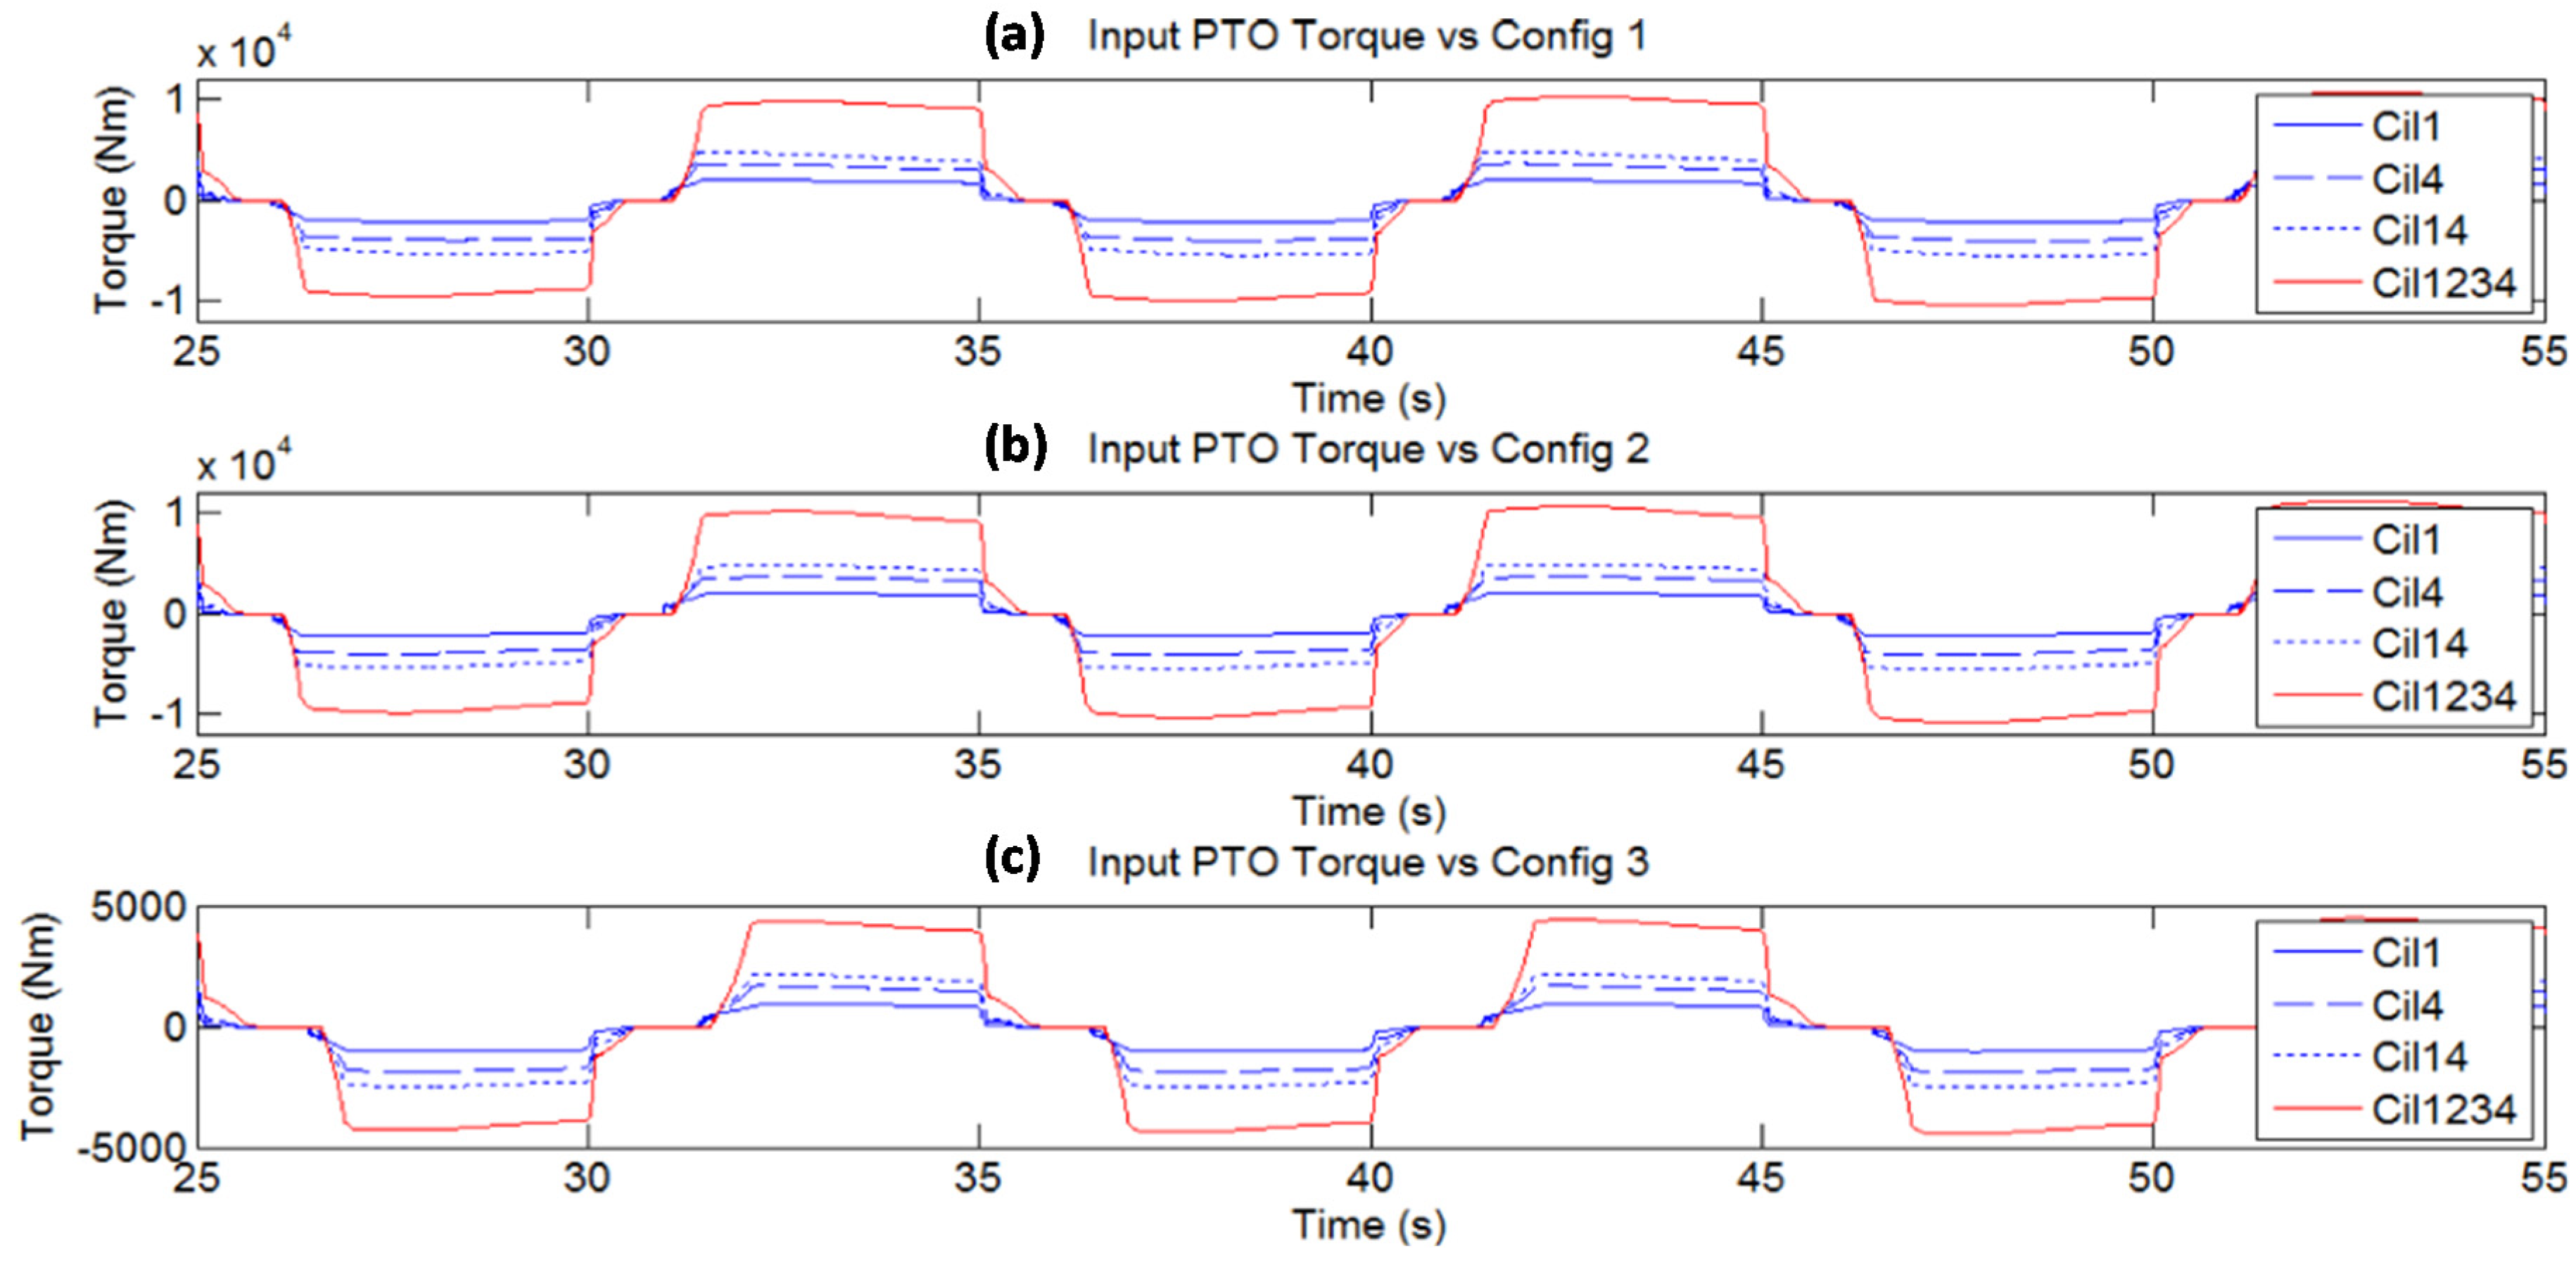
Figure 15 shows the evolution of the alternative restraining torque applied by the PTO input depending on the geometrical configuration and the active hydraulic cylinders. The shape of the plot of the torque against time is similar to the one of a Coulomb-type load. However in this case the restraining torque is modified by changing the areas and the geometrical parameters of the location of the hydraulic cylinders, AB and OB, with respect to the pivoting point, PP.
Figure 15.
Restraining Torque Evolution at the PTO input. Comparison between different Geometrical configurations using same activated hydraulic cylinders. (a) Config 1; (b) Config 2; (c) Config 3.
Figure 15.
Restraining Torque Evolution at the PTO input. Comparison between different Geometrical configurations using same activated hydraulic cylinders. (a) Config 1; (b) Config 2; (c) Config 3.
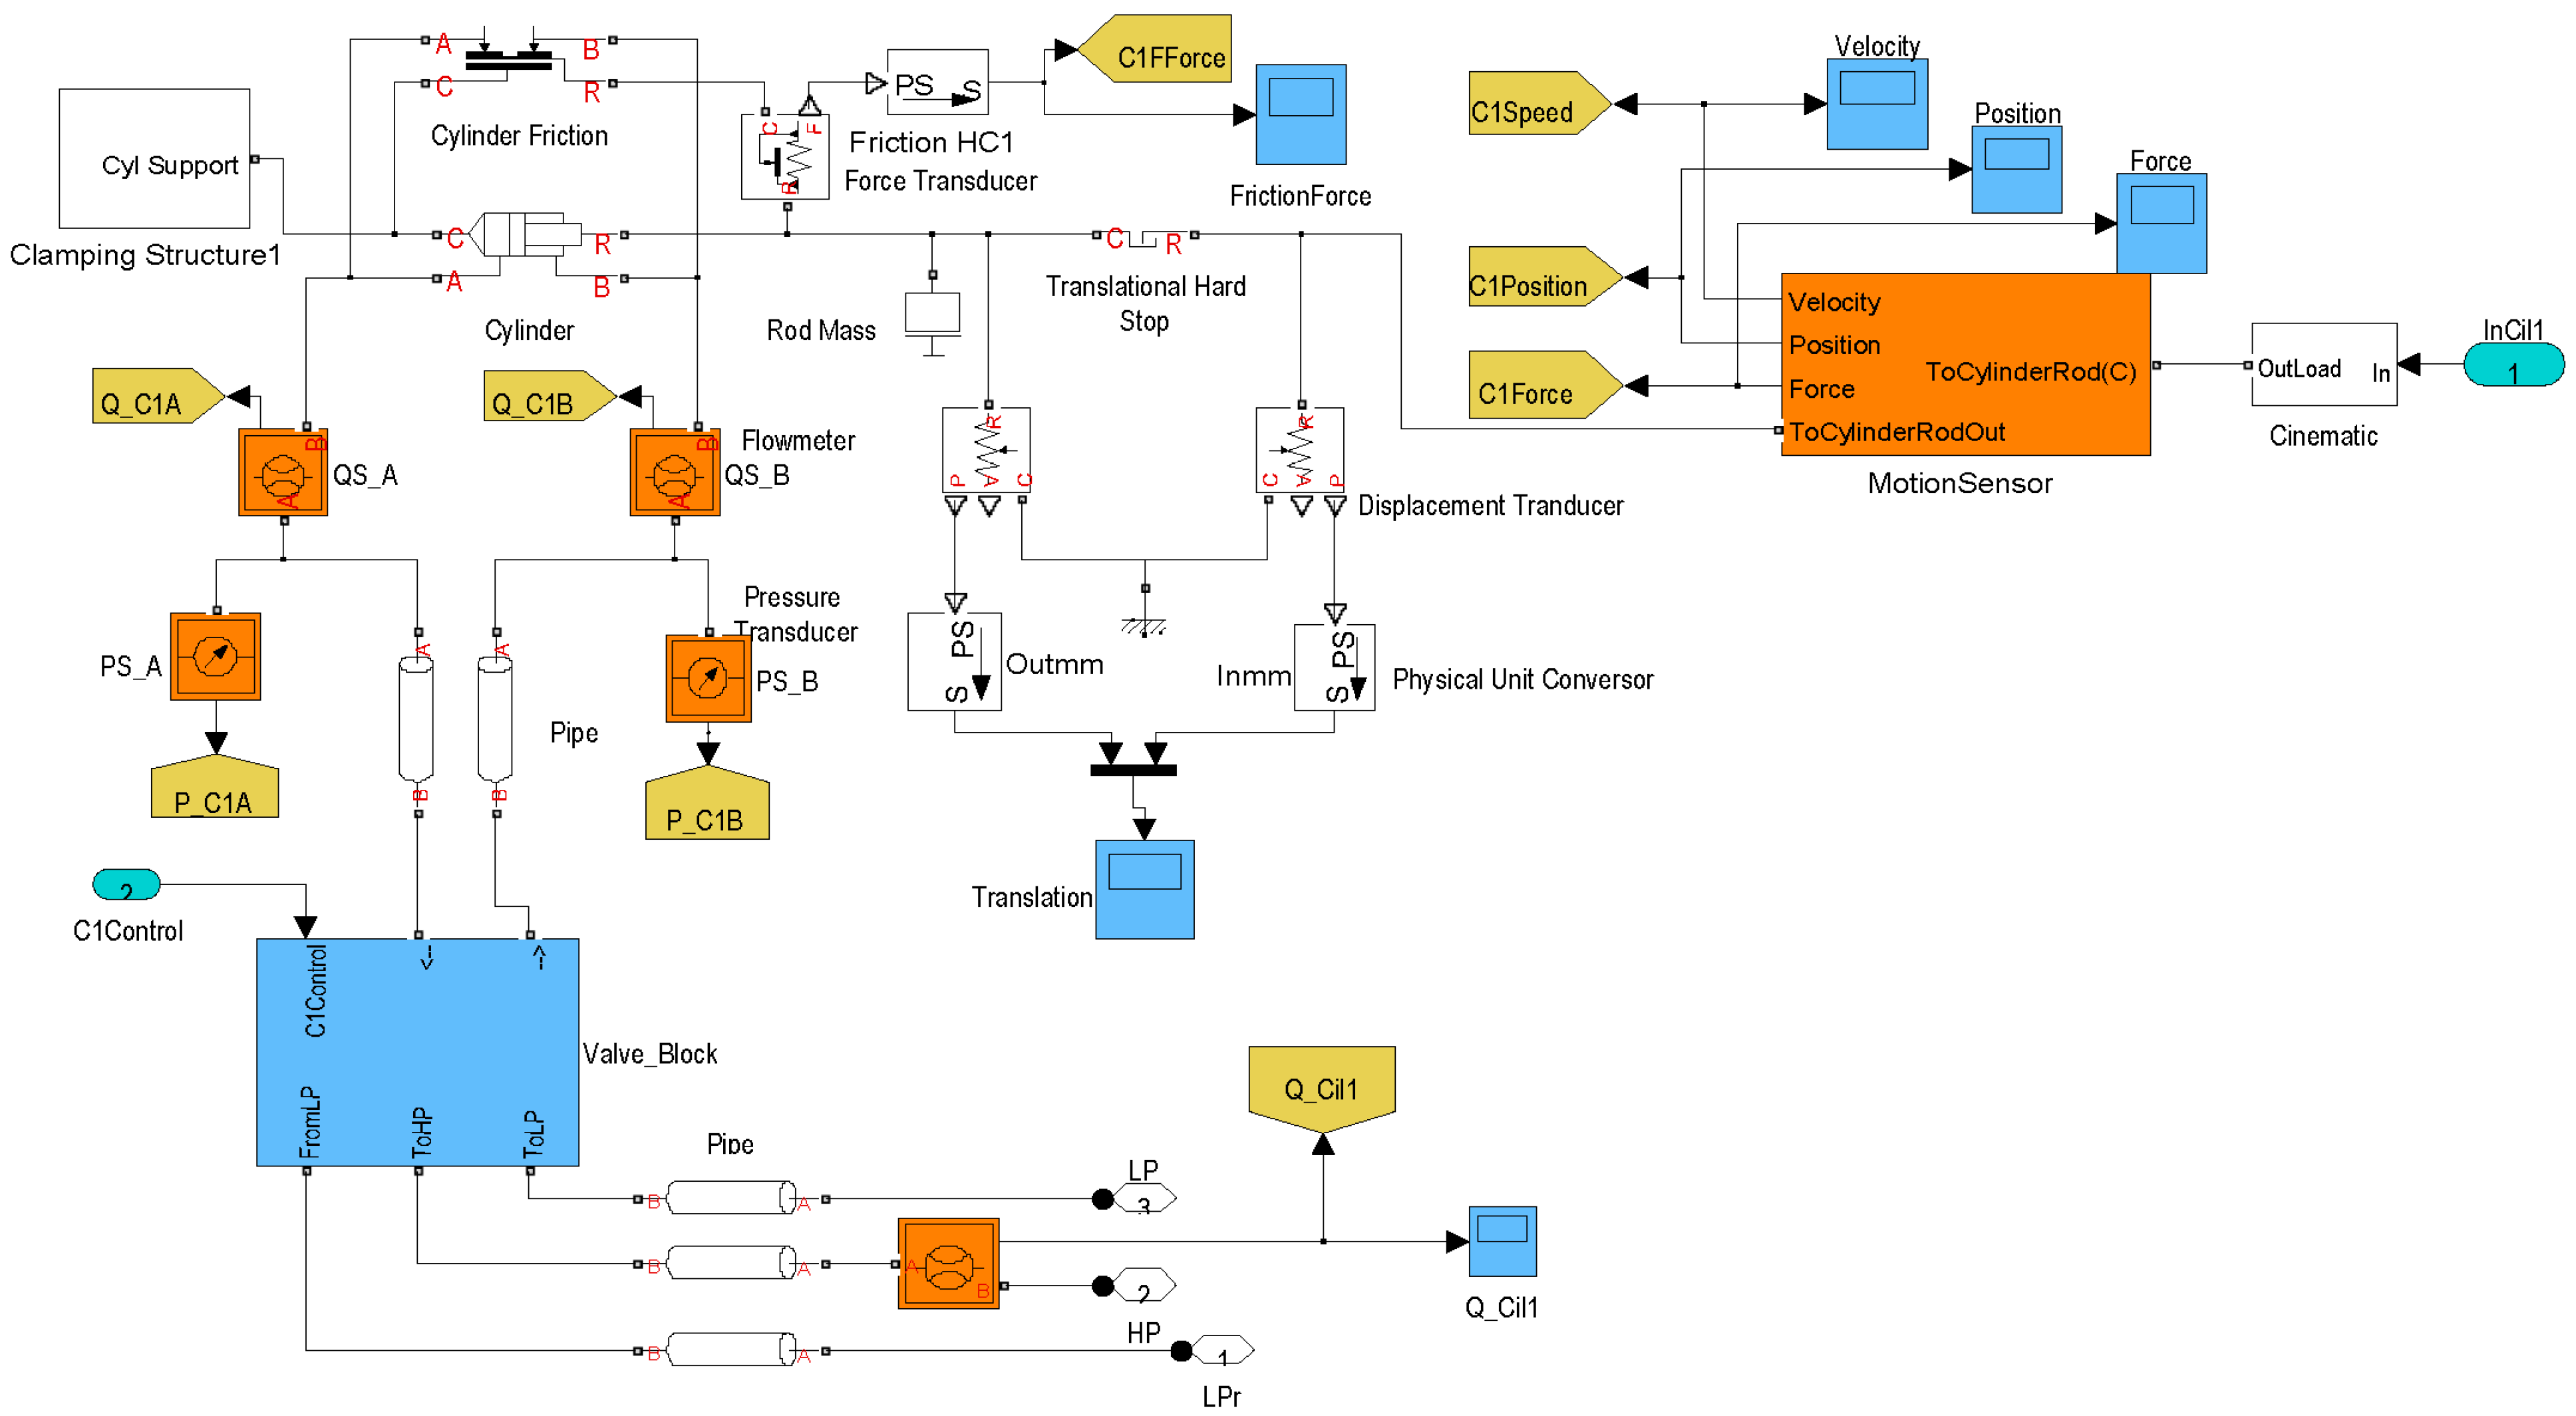
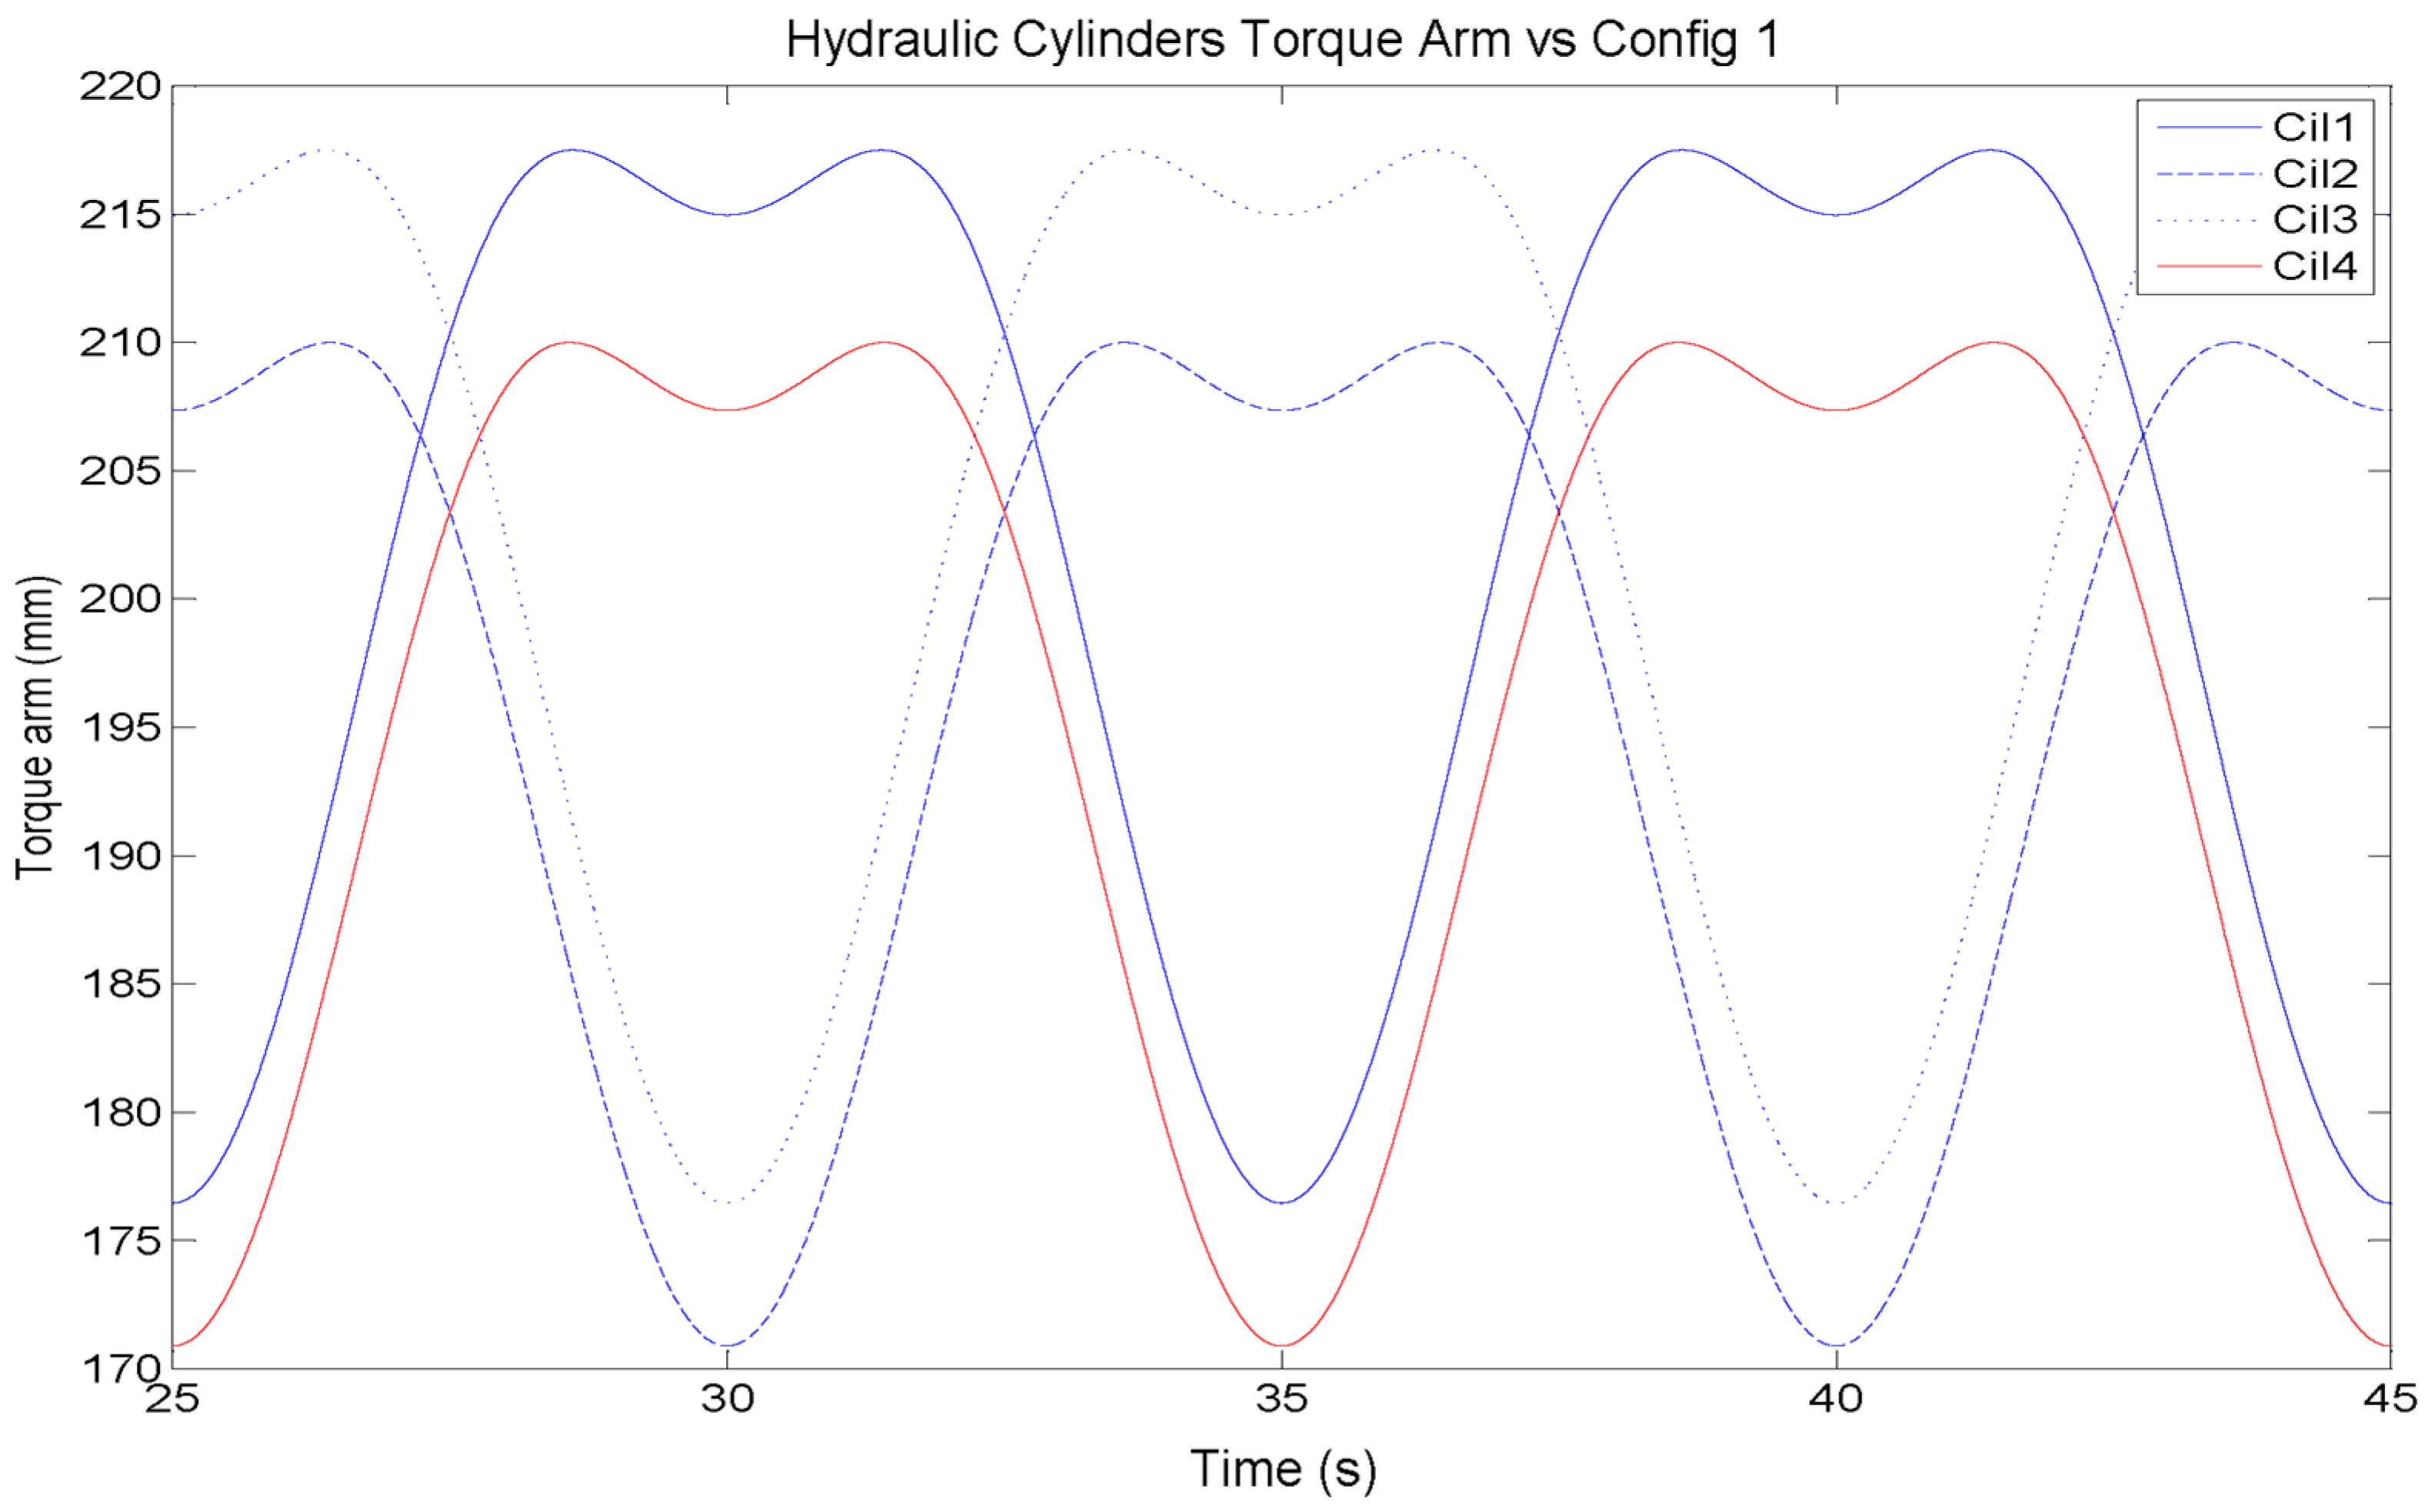
As can be seen, the higher the number of active hydraulic cylinders, the higher the restraining torque. Moreover, using the Config 1 geometrical configuration, a higher restraining torque than other configurations is obtained. In addition, it can be seen that by using lower displacements of the hydraulic cylinder rod (associated with configuration layout Config 3) the time in which the restraining torque is applied is reduced. This is due to the fact that the rod fixation of each hydraulic cylinder includes a translational hard stop, which restricts the motion of the rod between two limits reproducing a certain mechanical backlash. Furthermore, in Config 3, the restraining torque decreases when compared to other configurations. This is due to the fact that the torque arm is smaller than in Config 1, following the Equation (1). The inclusion of the translational hard stop block in the model (see
Figure 4) might provoke the appearance of 45° lines when the velocity approaches zero.
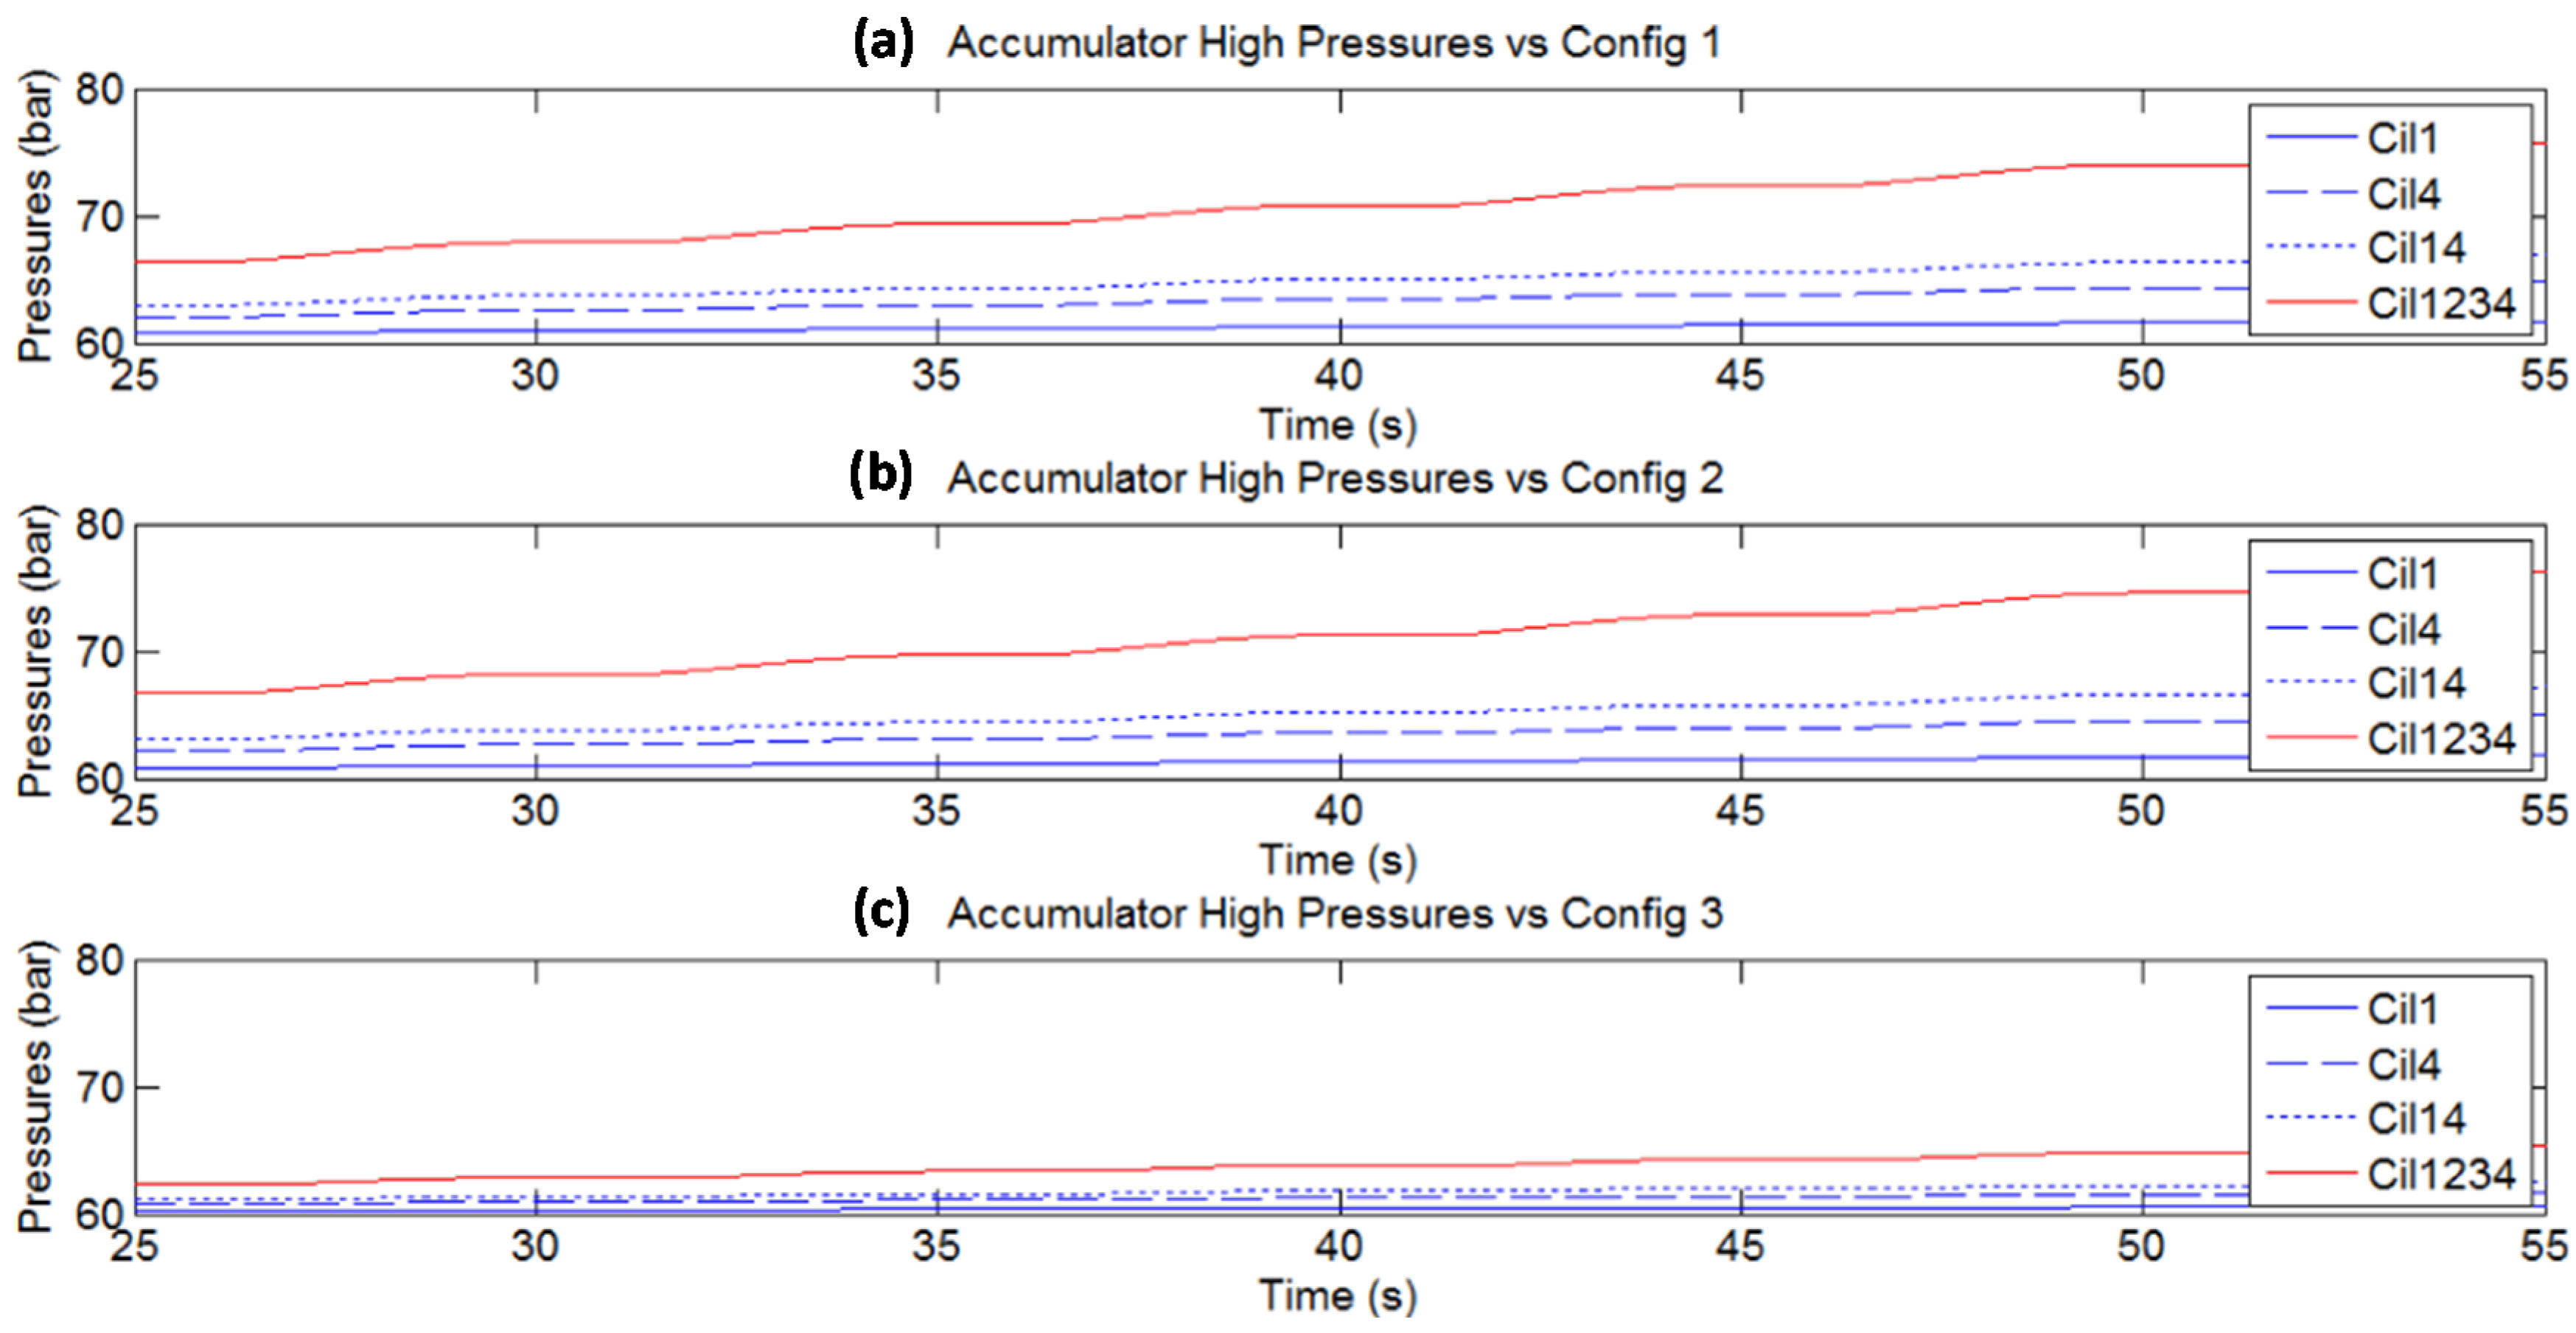
Figure 16 shows the HP Accumulator pressure evolutions when the restraining torques depicted in
Figure 15 are generated. The pressure evolution of the HP Accumulator is very low, so the restraining torque appears to be the same throughout the simulation. Although it has not been included in the graphs, the LP accumulator pressure decreases from approximately 8 bar in accordance with the oil supplied to the HP side.
Figure 16.
HP accumulator pressure Evolution. Comparison between different Geometrical configurations using the same activated hydraulic cylinders. (a) Config 1; (b) Config 2; (c) Config 3.
Figure 16.
HP accumulator pressure Evolution. Comparison between different Geometrical configurations using the same activated hydraulic cylinders. (a) Config 1; (b) Config 2; (c) Config 3.
4.1.3. Simulation Test III: PTO Behavior Using Variable Aperture of Control Valve
These simulation tests consist of applying the same sinusoidal input signal but keeping the control valve open at a certain aperture percentage after a certain programmed time. To carry out these simulation tests two hydraulic cylinders have been considered as active. In this case, one of the small cylinders (HC3.1) and one of the big cylinders (HC3.4) have been selected to pump the oil volume to the high pressure side. The simulations have been performed using the geometrical configuration, Config 1.
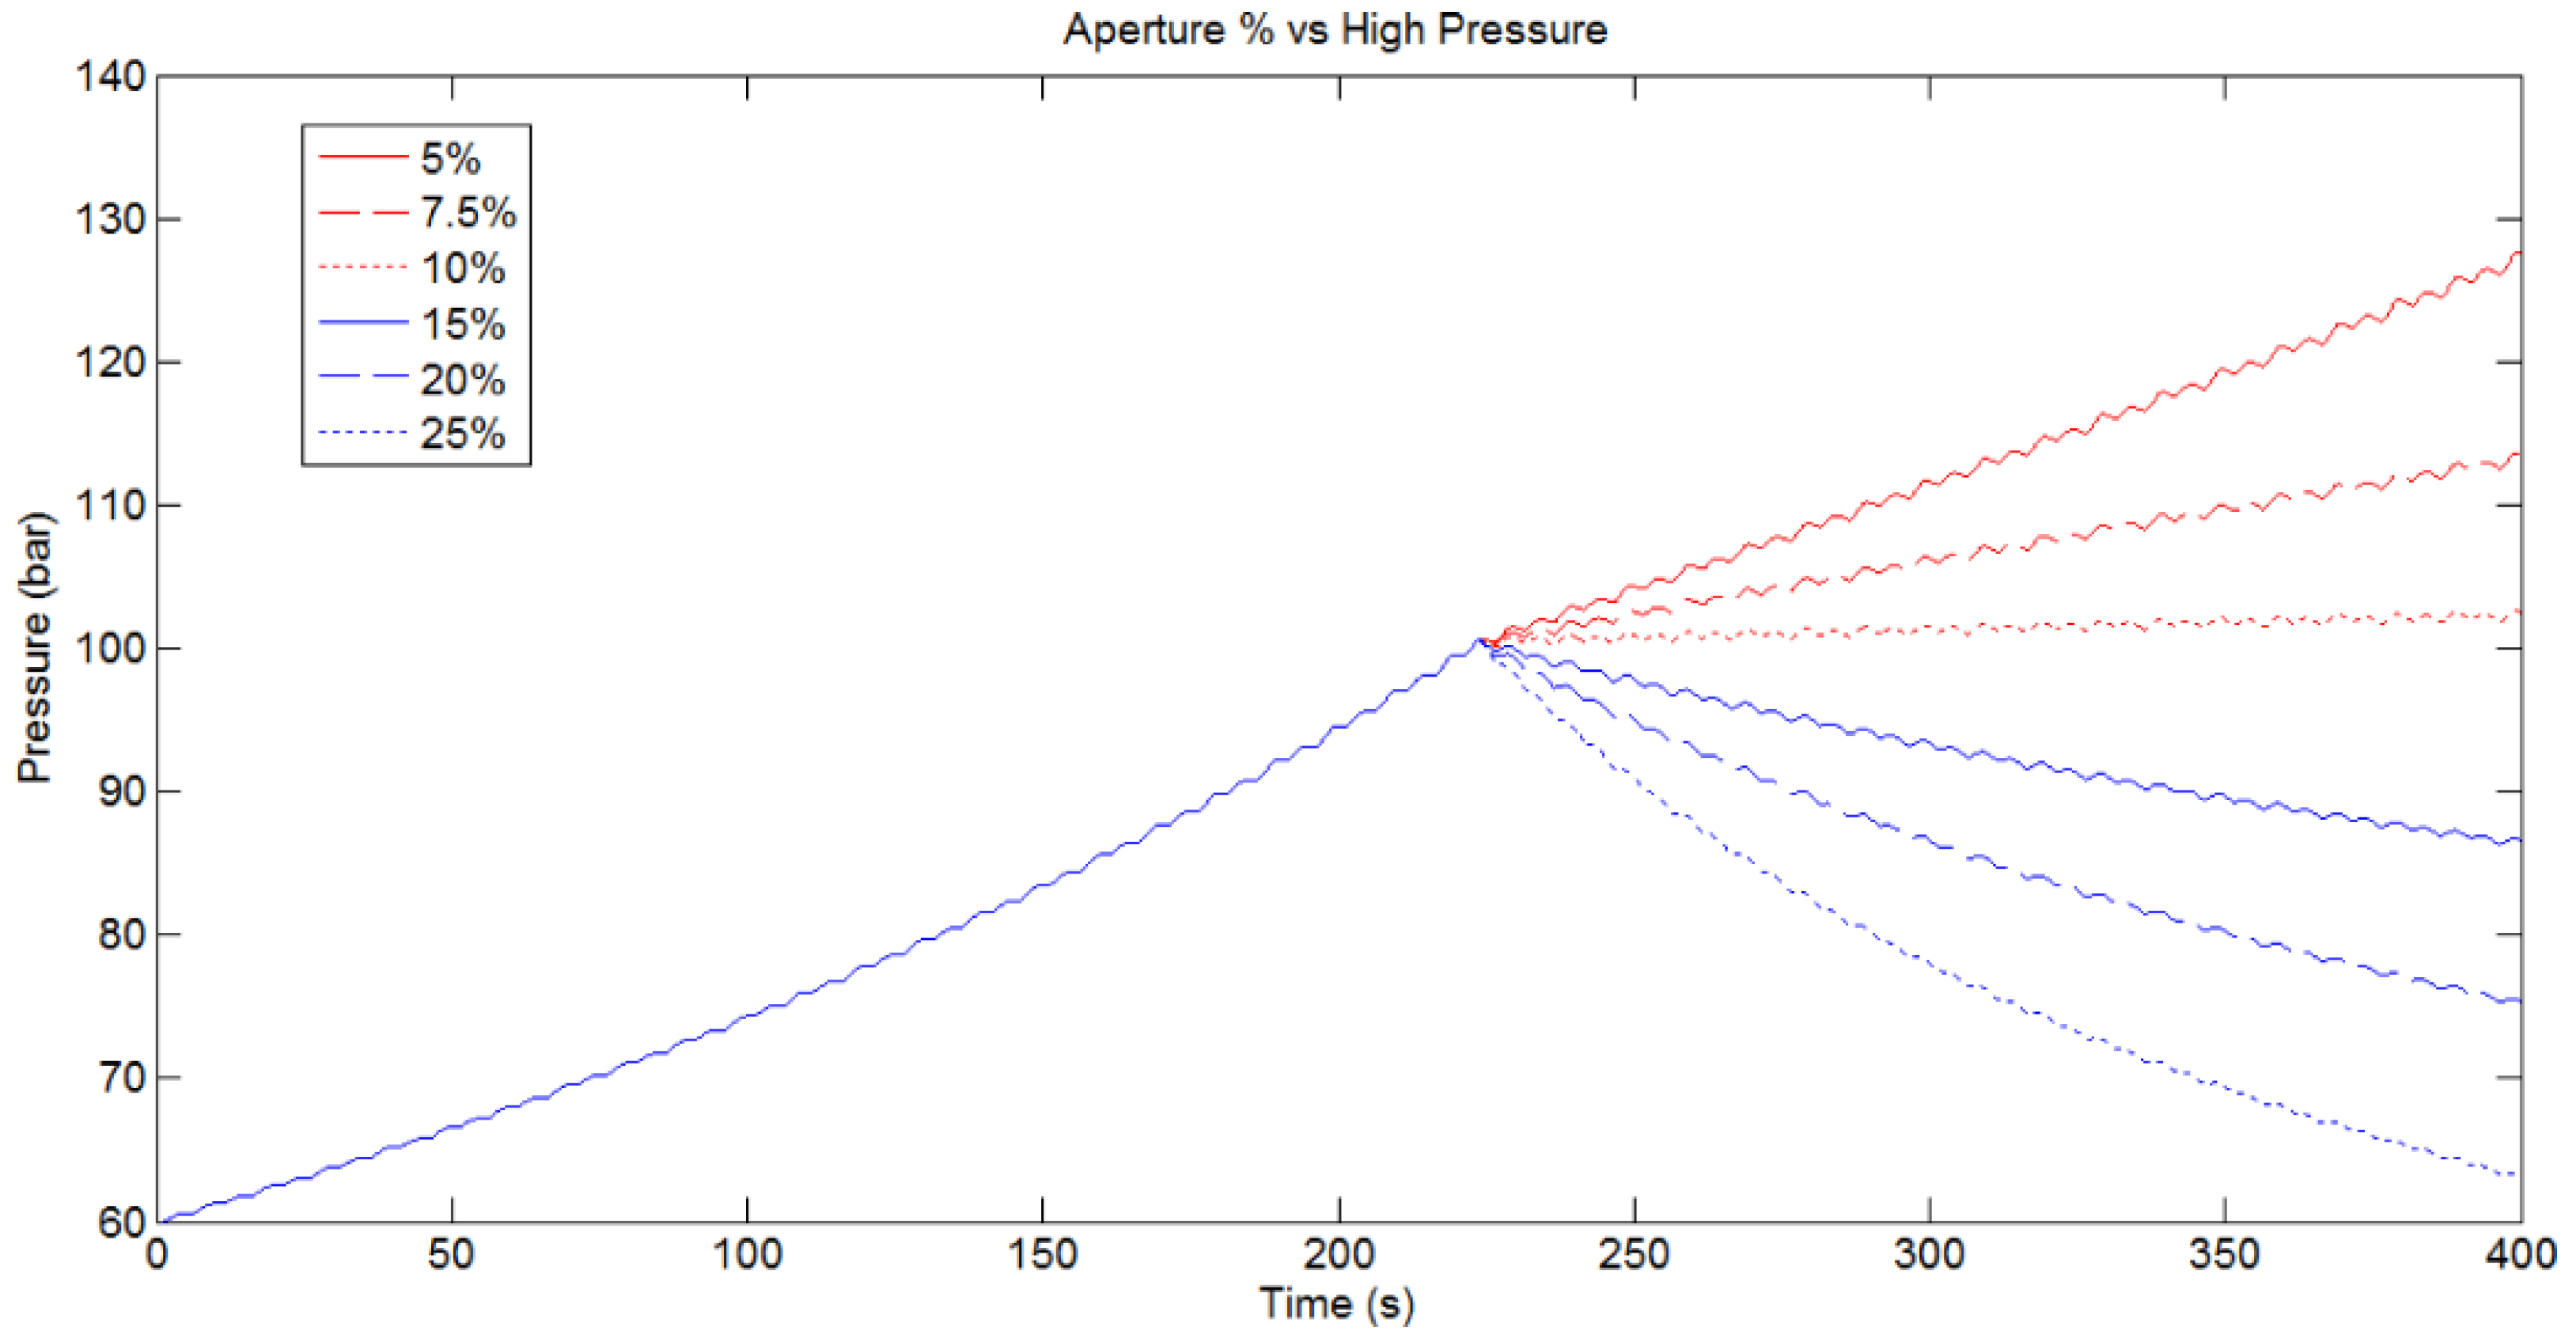
Figure 17 shows the evolution of the HP accumulator pressure, overlapping up to six different control valve percentages. All the simulations open the control valve when the pressure of the HP accumulator reaches 100 bar.
Figure 17.
HP accumulator pressure Evolution. Comparison between different control valve apertures using the same activated hydraulic cylinders (HC3.1 and HC3.4). Config 1.
Figure 17.
HP accumulator pressure Evolution. Comparison between different control valve apertures using the same activated hydraulic cylinders (HC3.1 and HC3.4). Config 1.
The figure shows that control valve aperture percentages below 10% receive an increment in the HP accumulator pressure whilst maintaining the same PTO input movement. Using control aperture percentages above 15% produces a decrement in the pressure of the HP accumulator. In the first case, the oil volume injected by the active hydraulic cylinders is higher than that demanded by the aperture of the control valve. Therefore the extra flow pumped by the hydraulic cylinders displacement is stored in the HP accumulator. In the other case, as the PTO input movement is not able to supply all the flow demanded by the control valve, the HP accumulator supplies a certain quantity of the stored oil volume to compensate for the lack of flow demanded by the control valve.
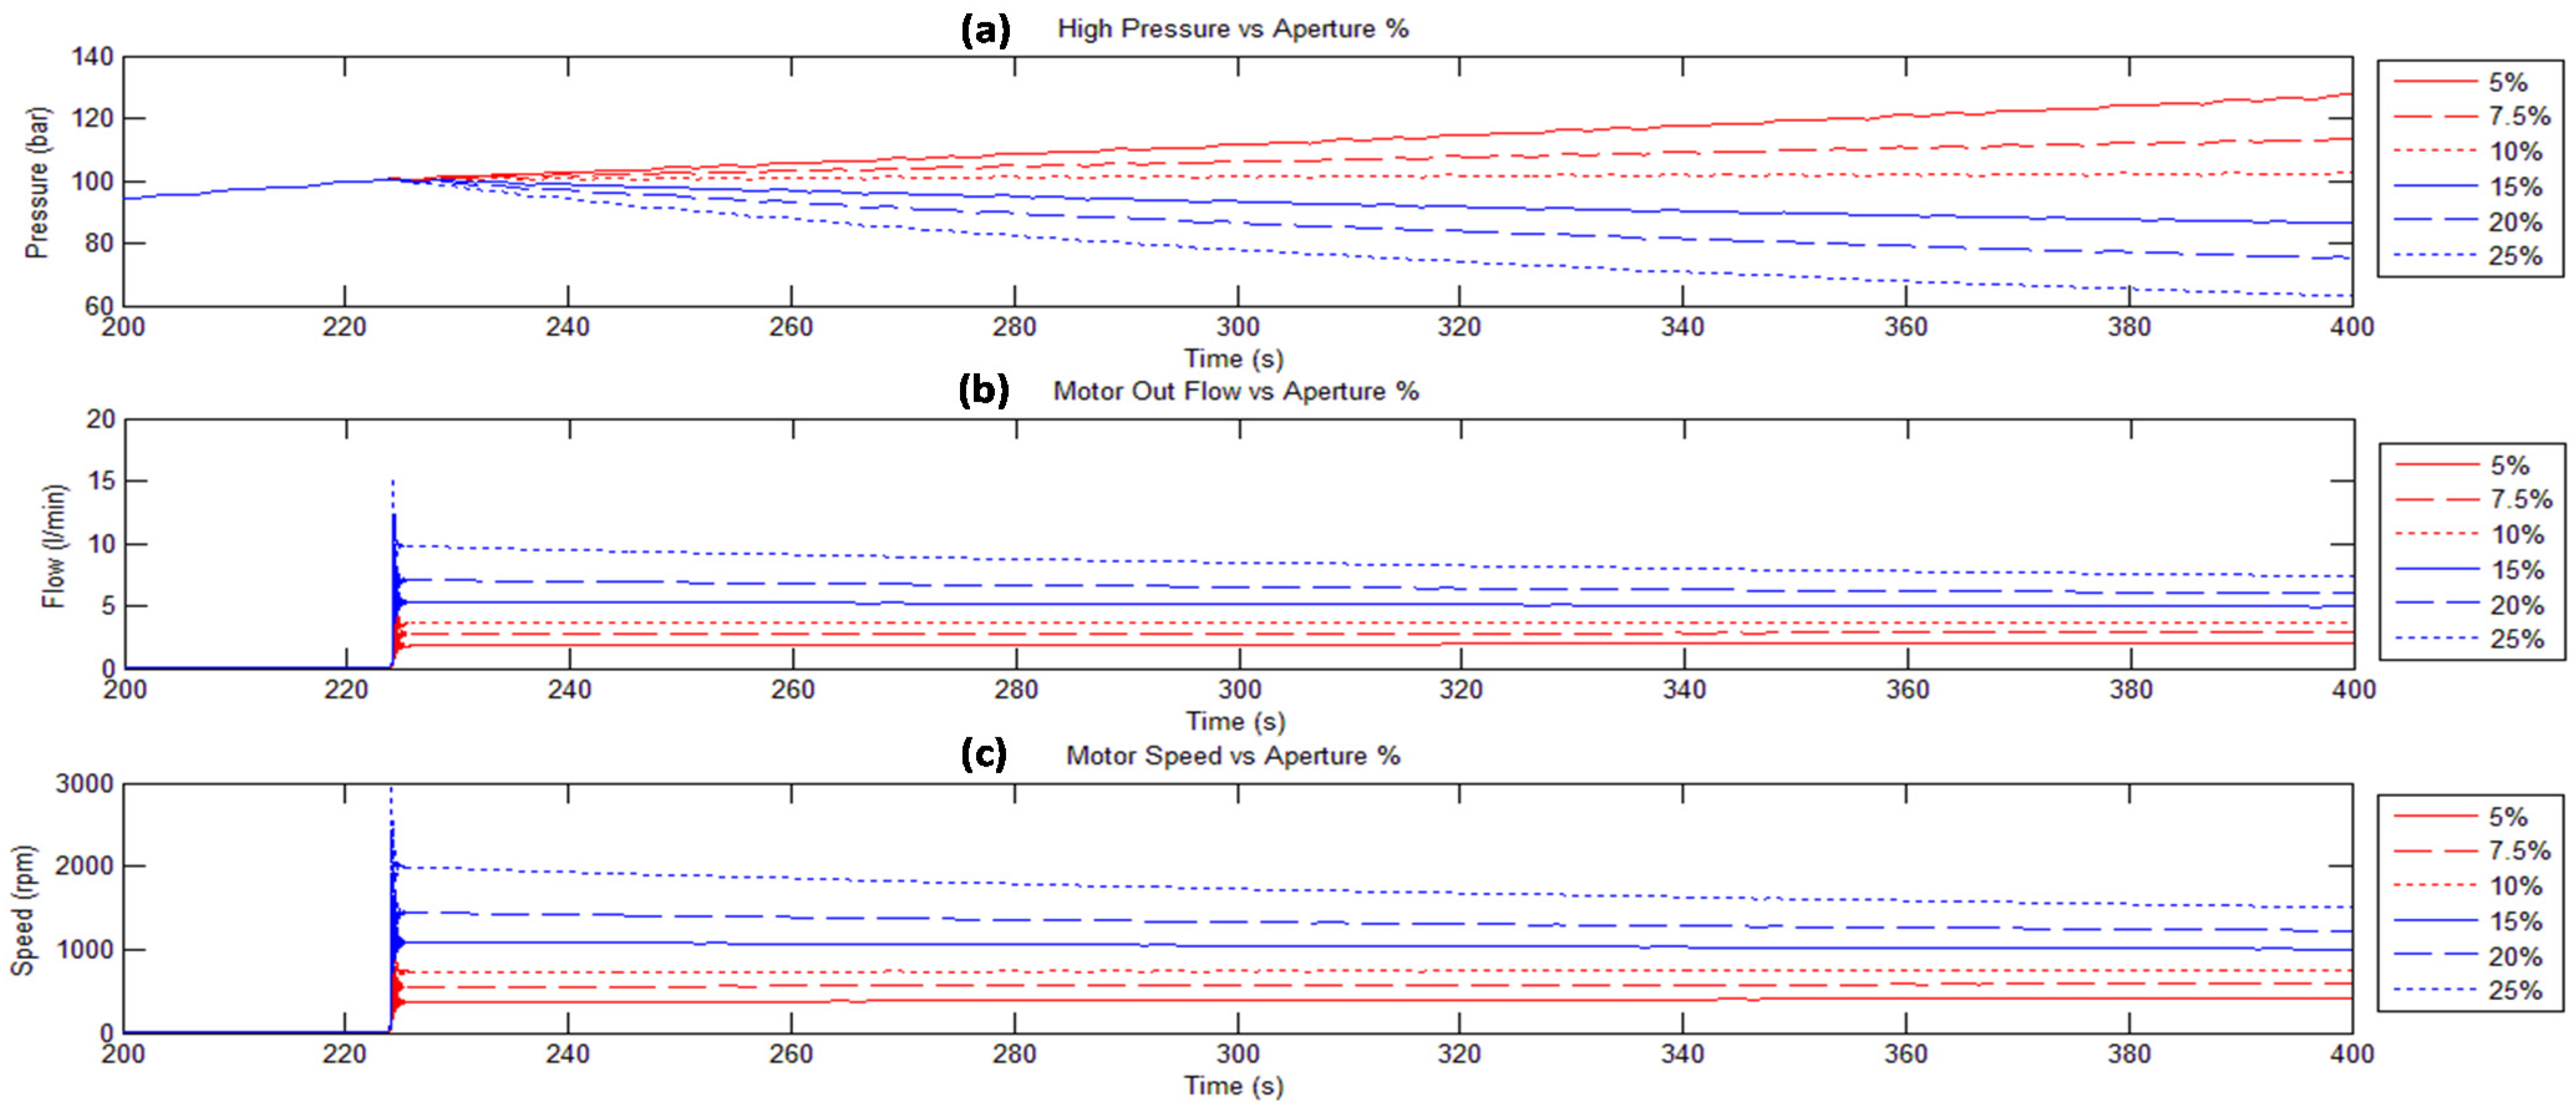
Figure 18 includes the flow through the hydraulic cylinder (L/min) and the hydraulic motor speed (rpm) between 200 and 400 s. The evolution of the pressure of the HP Accumulator,
P2, is also shown. In this figure the speed of the hydraulic motor is proportional to the flow through the hydraulic motor according to the Equation (9). As the aperture percentage of the control valve is constant, the speed of the hydraulic motor is practically constant in each case due to the fact that the second term of the Equation (9), representing its leakage, is very small. In these simulation tests, it is important to remark that the LP accumulator pressure is increasing as the HP accumulator pressure is decreasing with the time.
Figure 18.
HP accumulator pressure Evolution in bar (a). Hydraulic Motor Flow Evolution in L/min (b). Hydraulic Motor Speed in rpm (c). Comparison between different control valve apertures using same activated hydraulic cylinders (HC3.1 and HC3.4). Config 1.
Figure 18.
HP accumulator pressure Evolution in bar (a). Hydraulic Motor Flow Evolution in L/min (b). Hydraulic Motor Speed in rpm (c). Comparison between different control valve apertures using same activated hydraulic cylinders (HC3.1 and HC3.4). Config 1.
In addition to these simulations using different control aperture percentages whilst maintaining the PTO input movement active, several additional simulations have also been performed. These have been used to analyze the behavior of the pressure of the HP Accumulator (bar), the flow through the hydraulic motor (L/min) and the angular speed of the hydraulic motor (rpm). This results in the assessment of the PTO output, when the PTO input is blocked.
This situation could be found when the energy of the waves is not sufficient to move the energy capture device, so the input of the PTO is not able to move the hydraulic cylinders, hence, they are unable to supply any flow to the output.
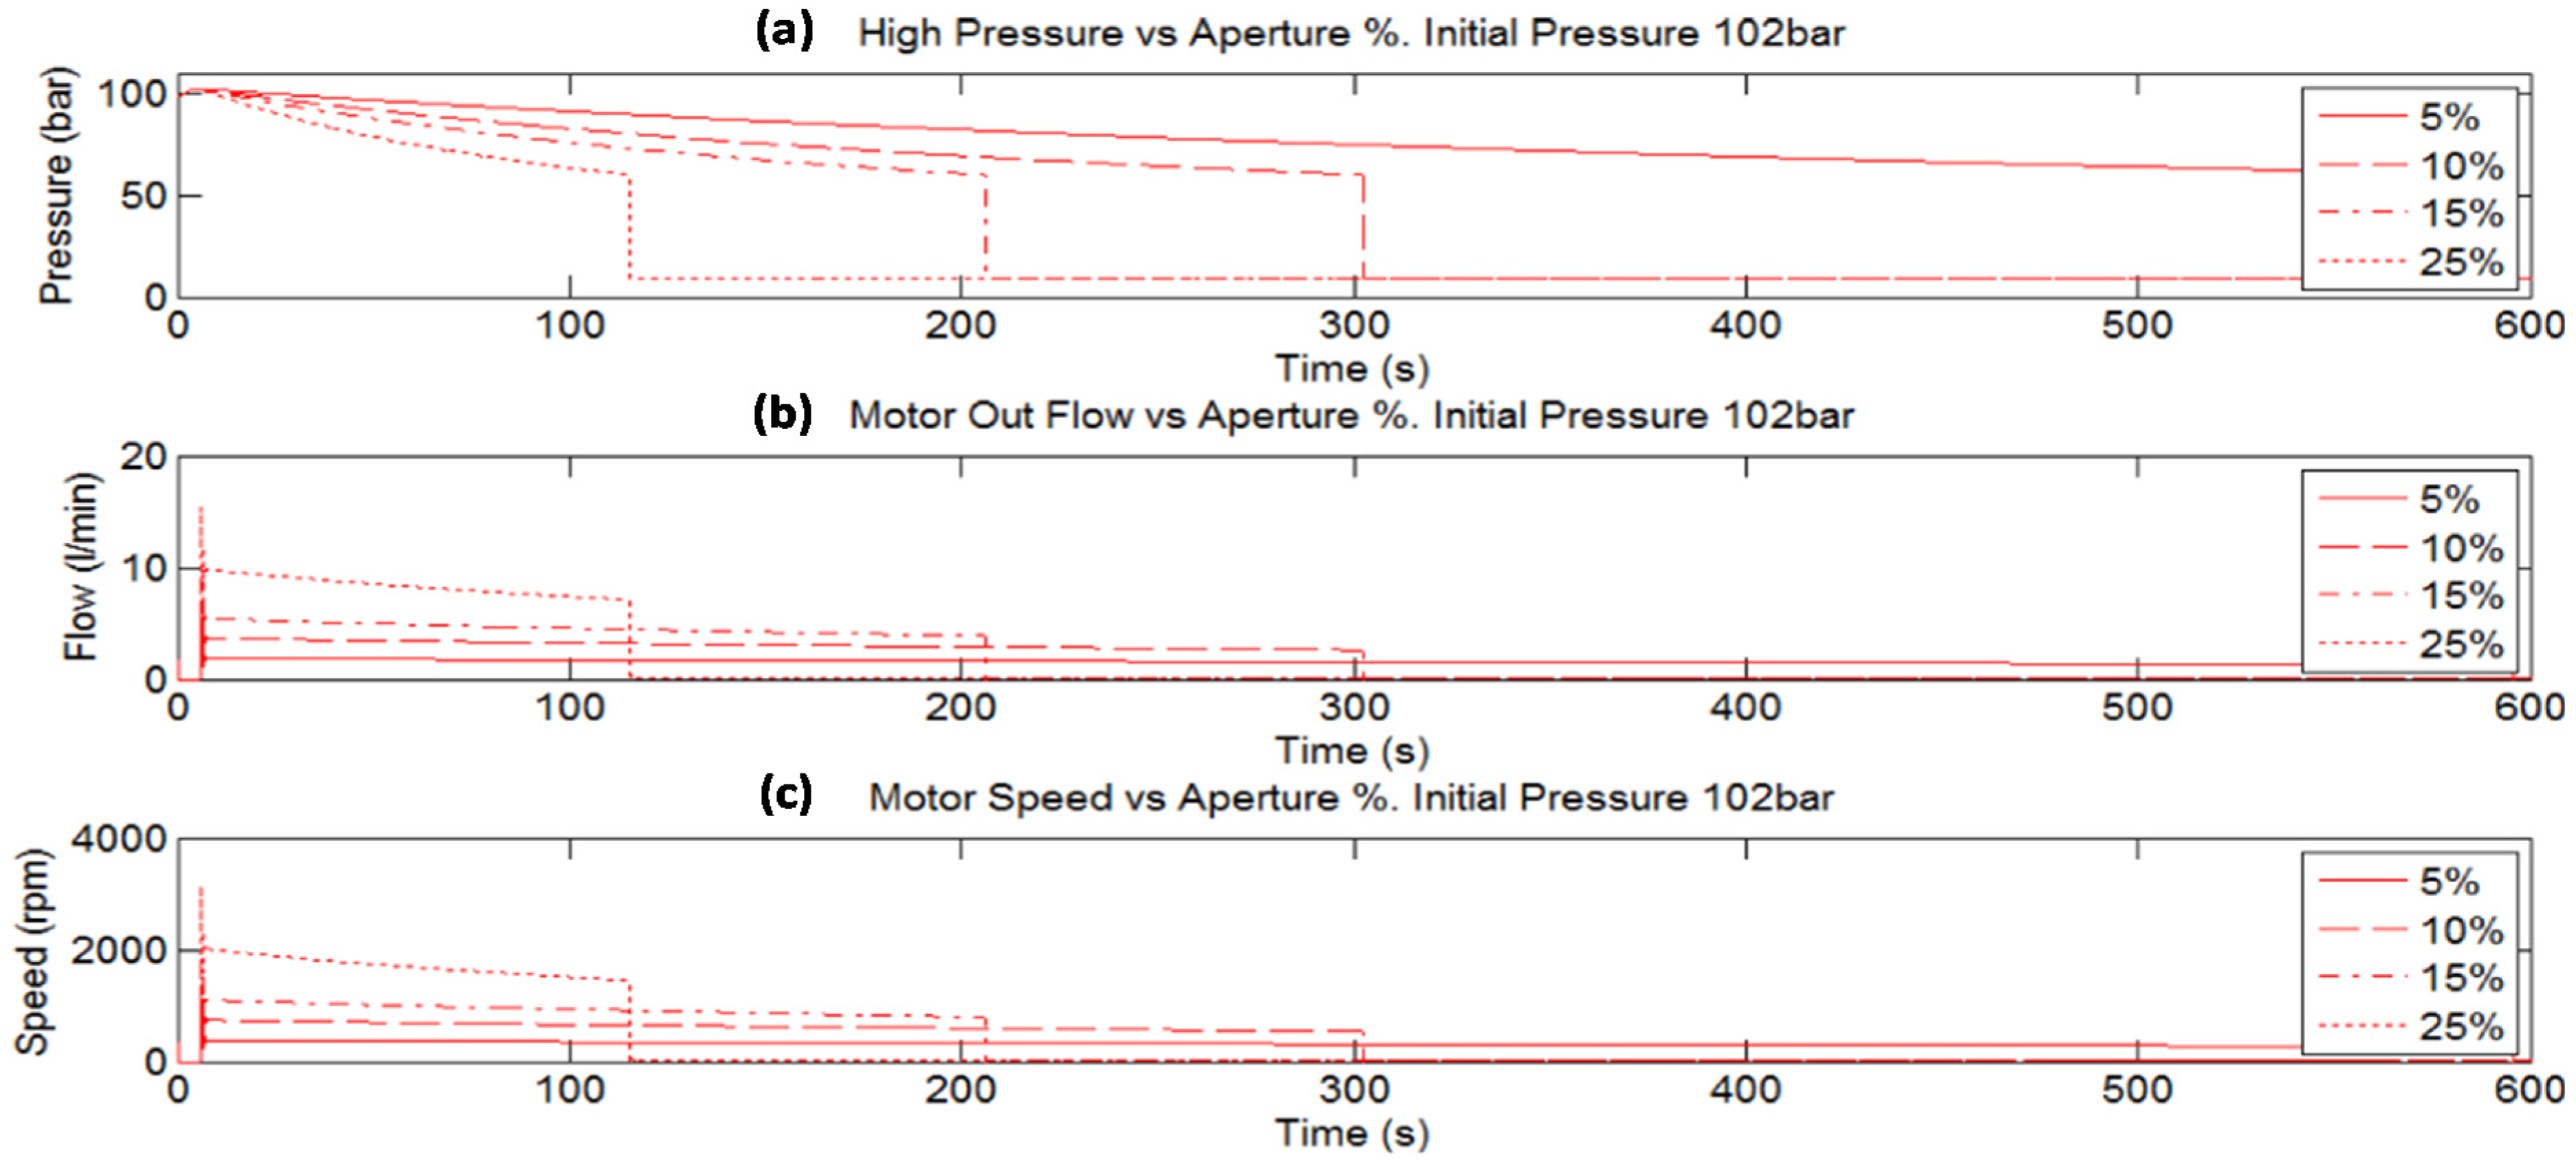
In this case, the ability of the hydraulic motor movement to generate energy is related to the oil volume stored in the HP Accumulator. In
Figure 19, the higher the control valve aperture percentage, the lower the autonomy of the volume stored by the HP accumulator.
Figure 19.
HP accumulator pressure evolution in bar (a). Hydraulic Motor Flow evolution in L/min (b). Hydraulic Motor Speed in rpm (c). Comparison between different control valve apertures when PTO input movement is blocked.
Figure 19.
HP accumulator pressure evolution in bar (a). Hydraulic Motor Flow evolution in L/min (b). Hydraulic Motor Speed in rpm (c). Comparison between different control valve apertures when PTO input movement is blocked.
For the sake of the simulations, results from an initial pressure of 102 bar are shown. The results are independent of the geometrical configuration of the hydraulic cylinders, as there is no movement at the Input of the PTO. The results of last simulation test could be used to implement a strategy to extend the period of continuous rotation of the hydraulic motor and generator group whilst the sea conditions remain calm.
4.2. Experimental Validation and Model Adjustment
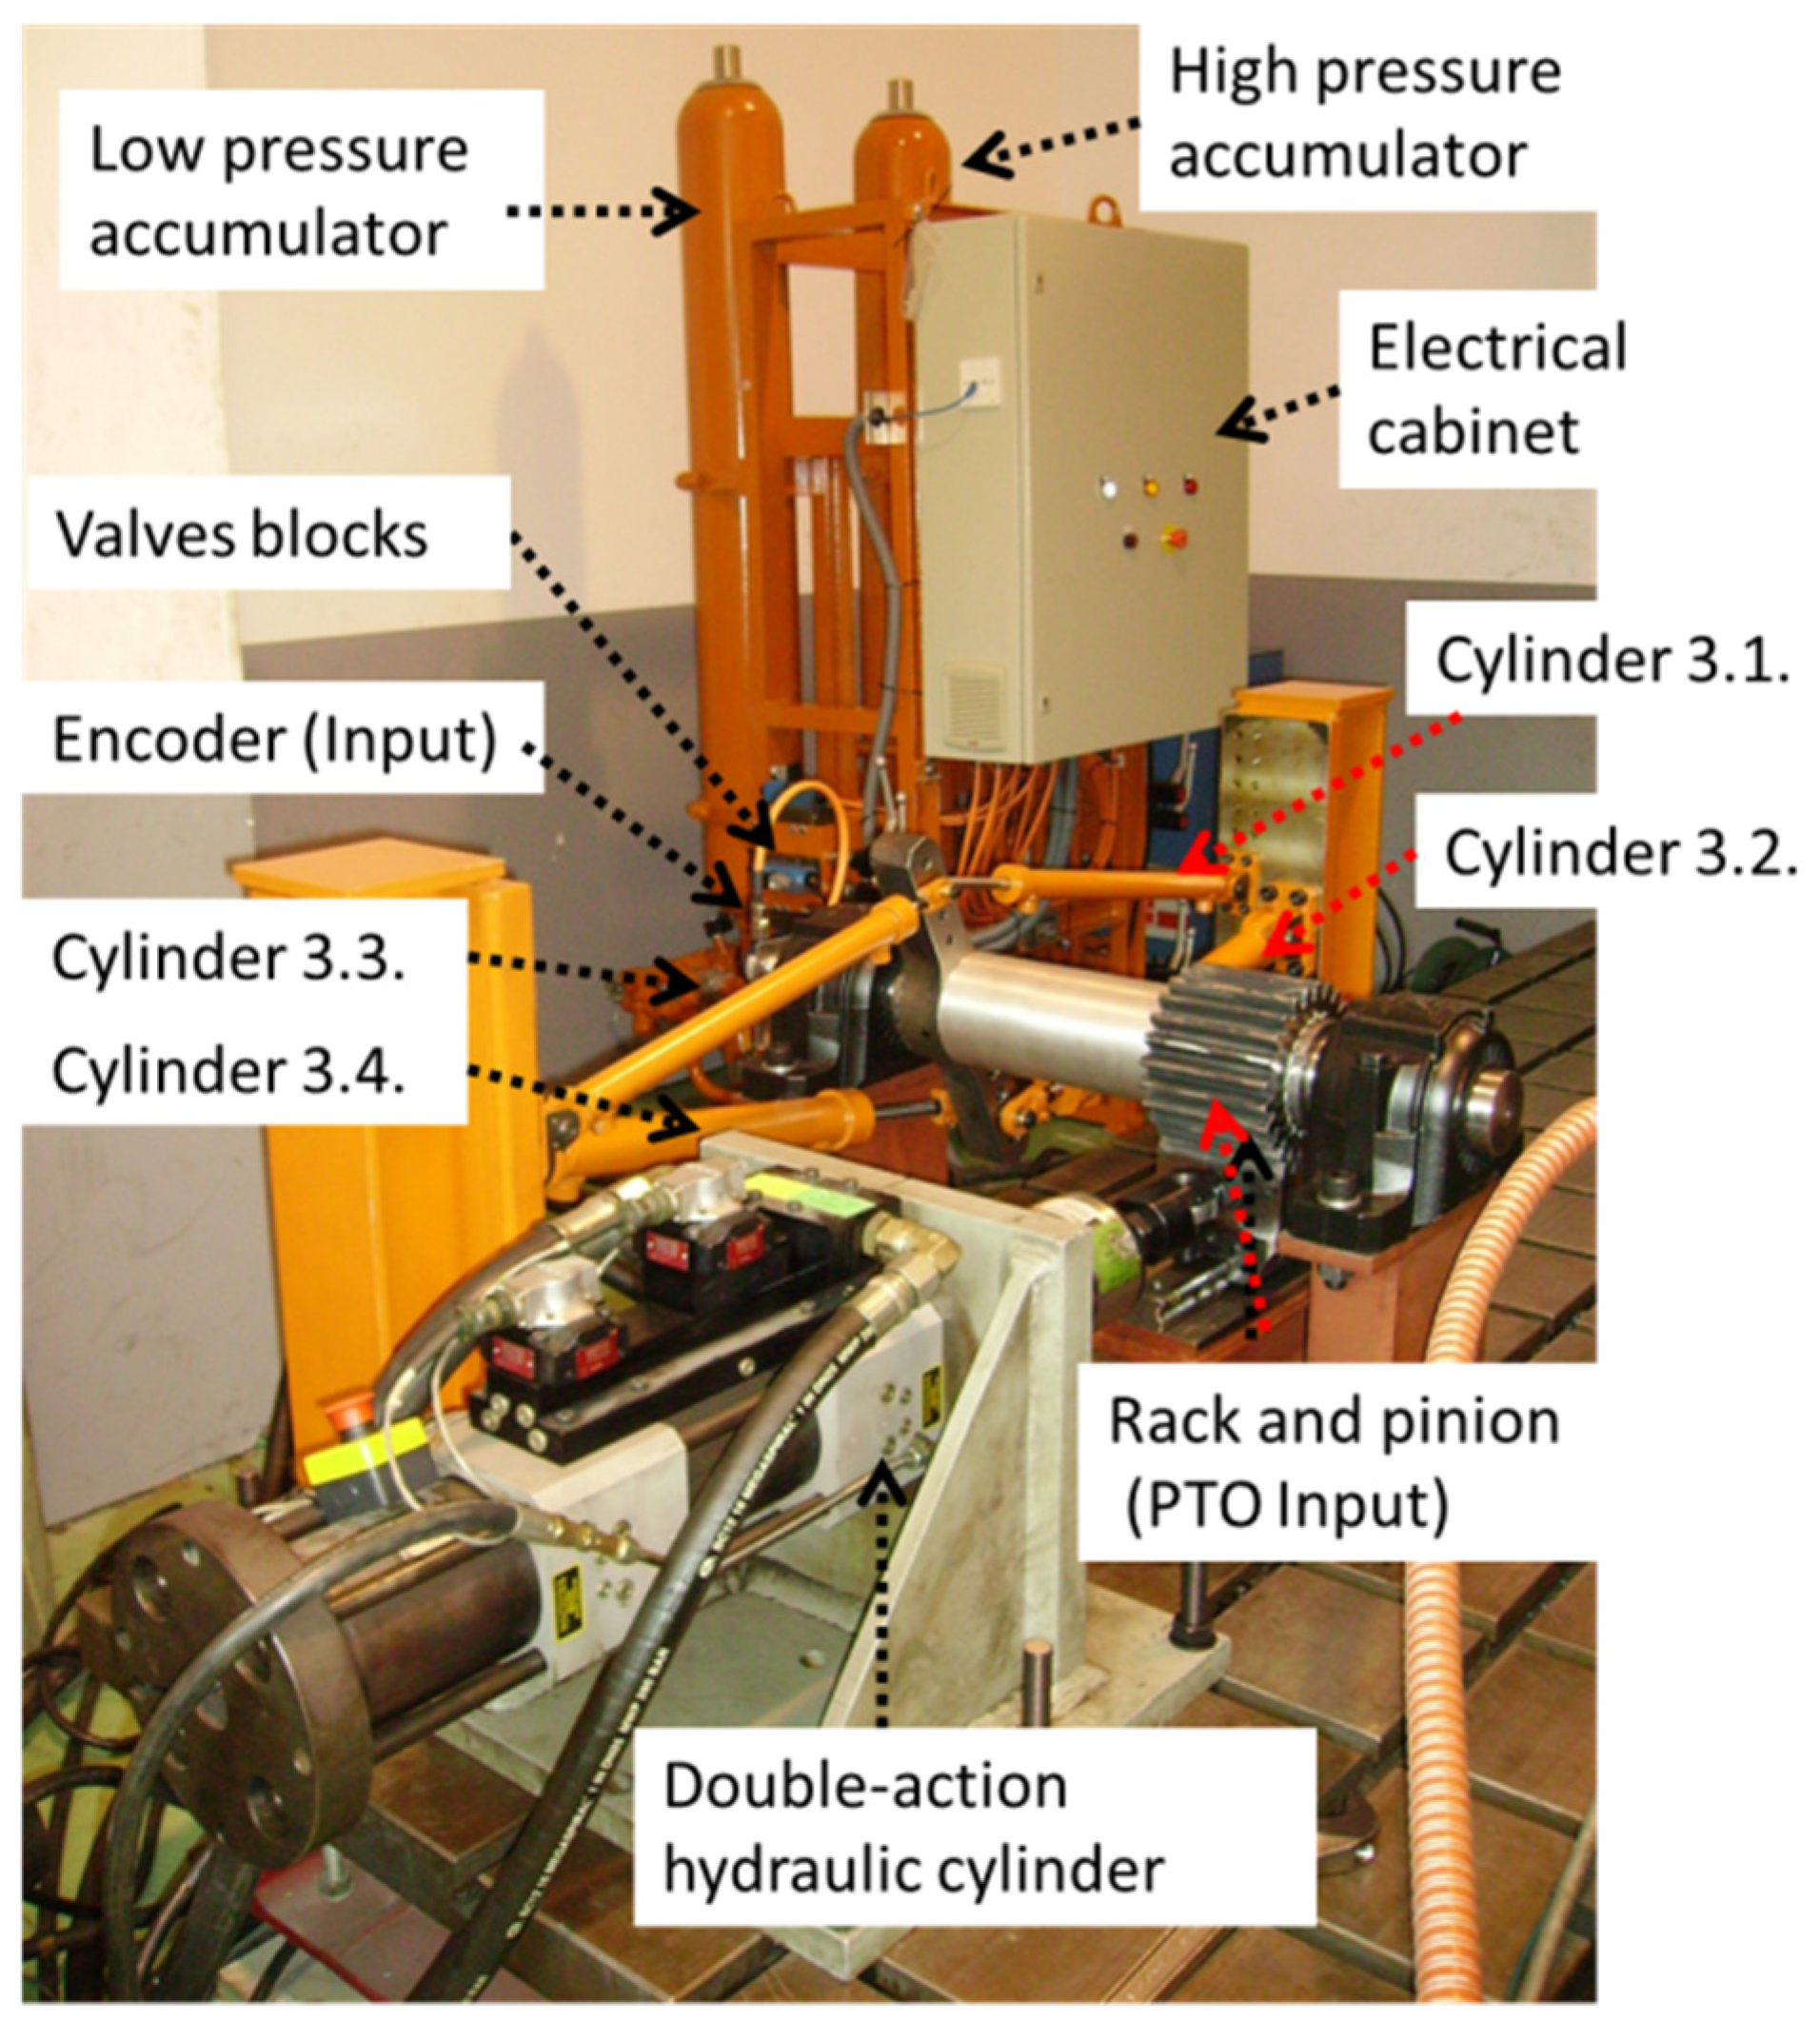
The following methodology has been carried out to perform the adjustment of the dynamic model, once it is optimized. Firstly, the parameters required for the components of the model have been completed using the datasheet of each manufacturer. Secondly, structural stiffness and damping of the mechanical test bench setup have been estimated using finite element software. Thirdly, the open loop behavior of the PTO has been adjusted using the Test bench shown in
Figure 20. This experimental evaluation has been carried out using the specific geometrical configuration for hydraulic cylinders, as defined in Config 1.
The objectives of these experimental tests are, firstly, to adjust the relative amount of trapped air inside the Hydraulic Fluid block of the model and, secondly, to define the discharge coefficient and look-up table of the control valve related to the aperture percentage.
To adjust the relative amount of trapped air in the model, experimental values of the high pressure gauge have been collected and compared with simulated values. The experimental evaluation has been performed using different active hydraulic cylinders starting at different initial pressures.
A double-acting hydraulic cylinder controlled by a third-party software has been used for moving the rack-pinion geared system which is defined as the PTO input. The amplitude and the frequency of a sinusoidal signal first have to be defined. A movement of ±40 mm at 0.1 Hz is applied to the rack-pinion geared system charging the HP Accumulator with the control valve closed. This input signal does not exceed the maximum design values of the PTO input, corresponding to an angular displacement of ±30° at low angular speed (0–5 rad/s) [
27].
Figure 20.
Hydraulic PTO. Main elements of the Test bench. PTO Input.
Figure 20.
Hydraulic PTO. Main elements of the Test bench. PTO Input.
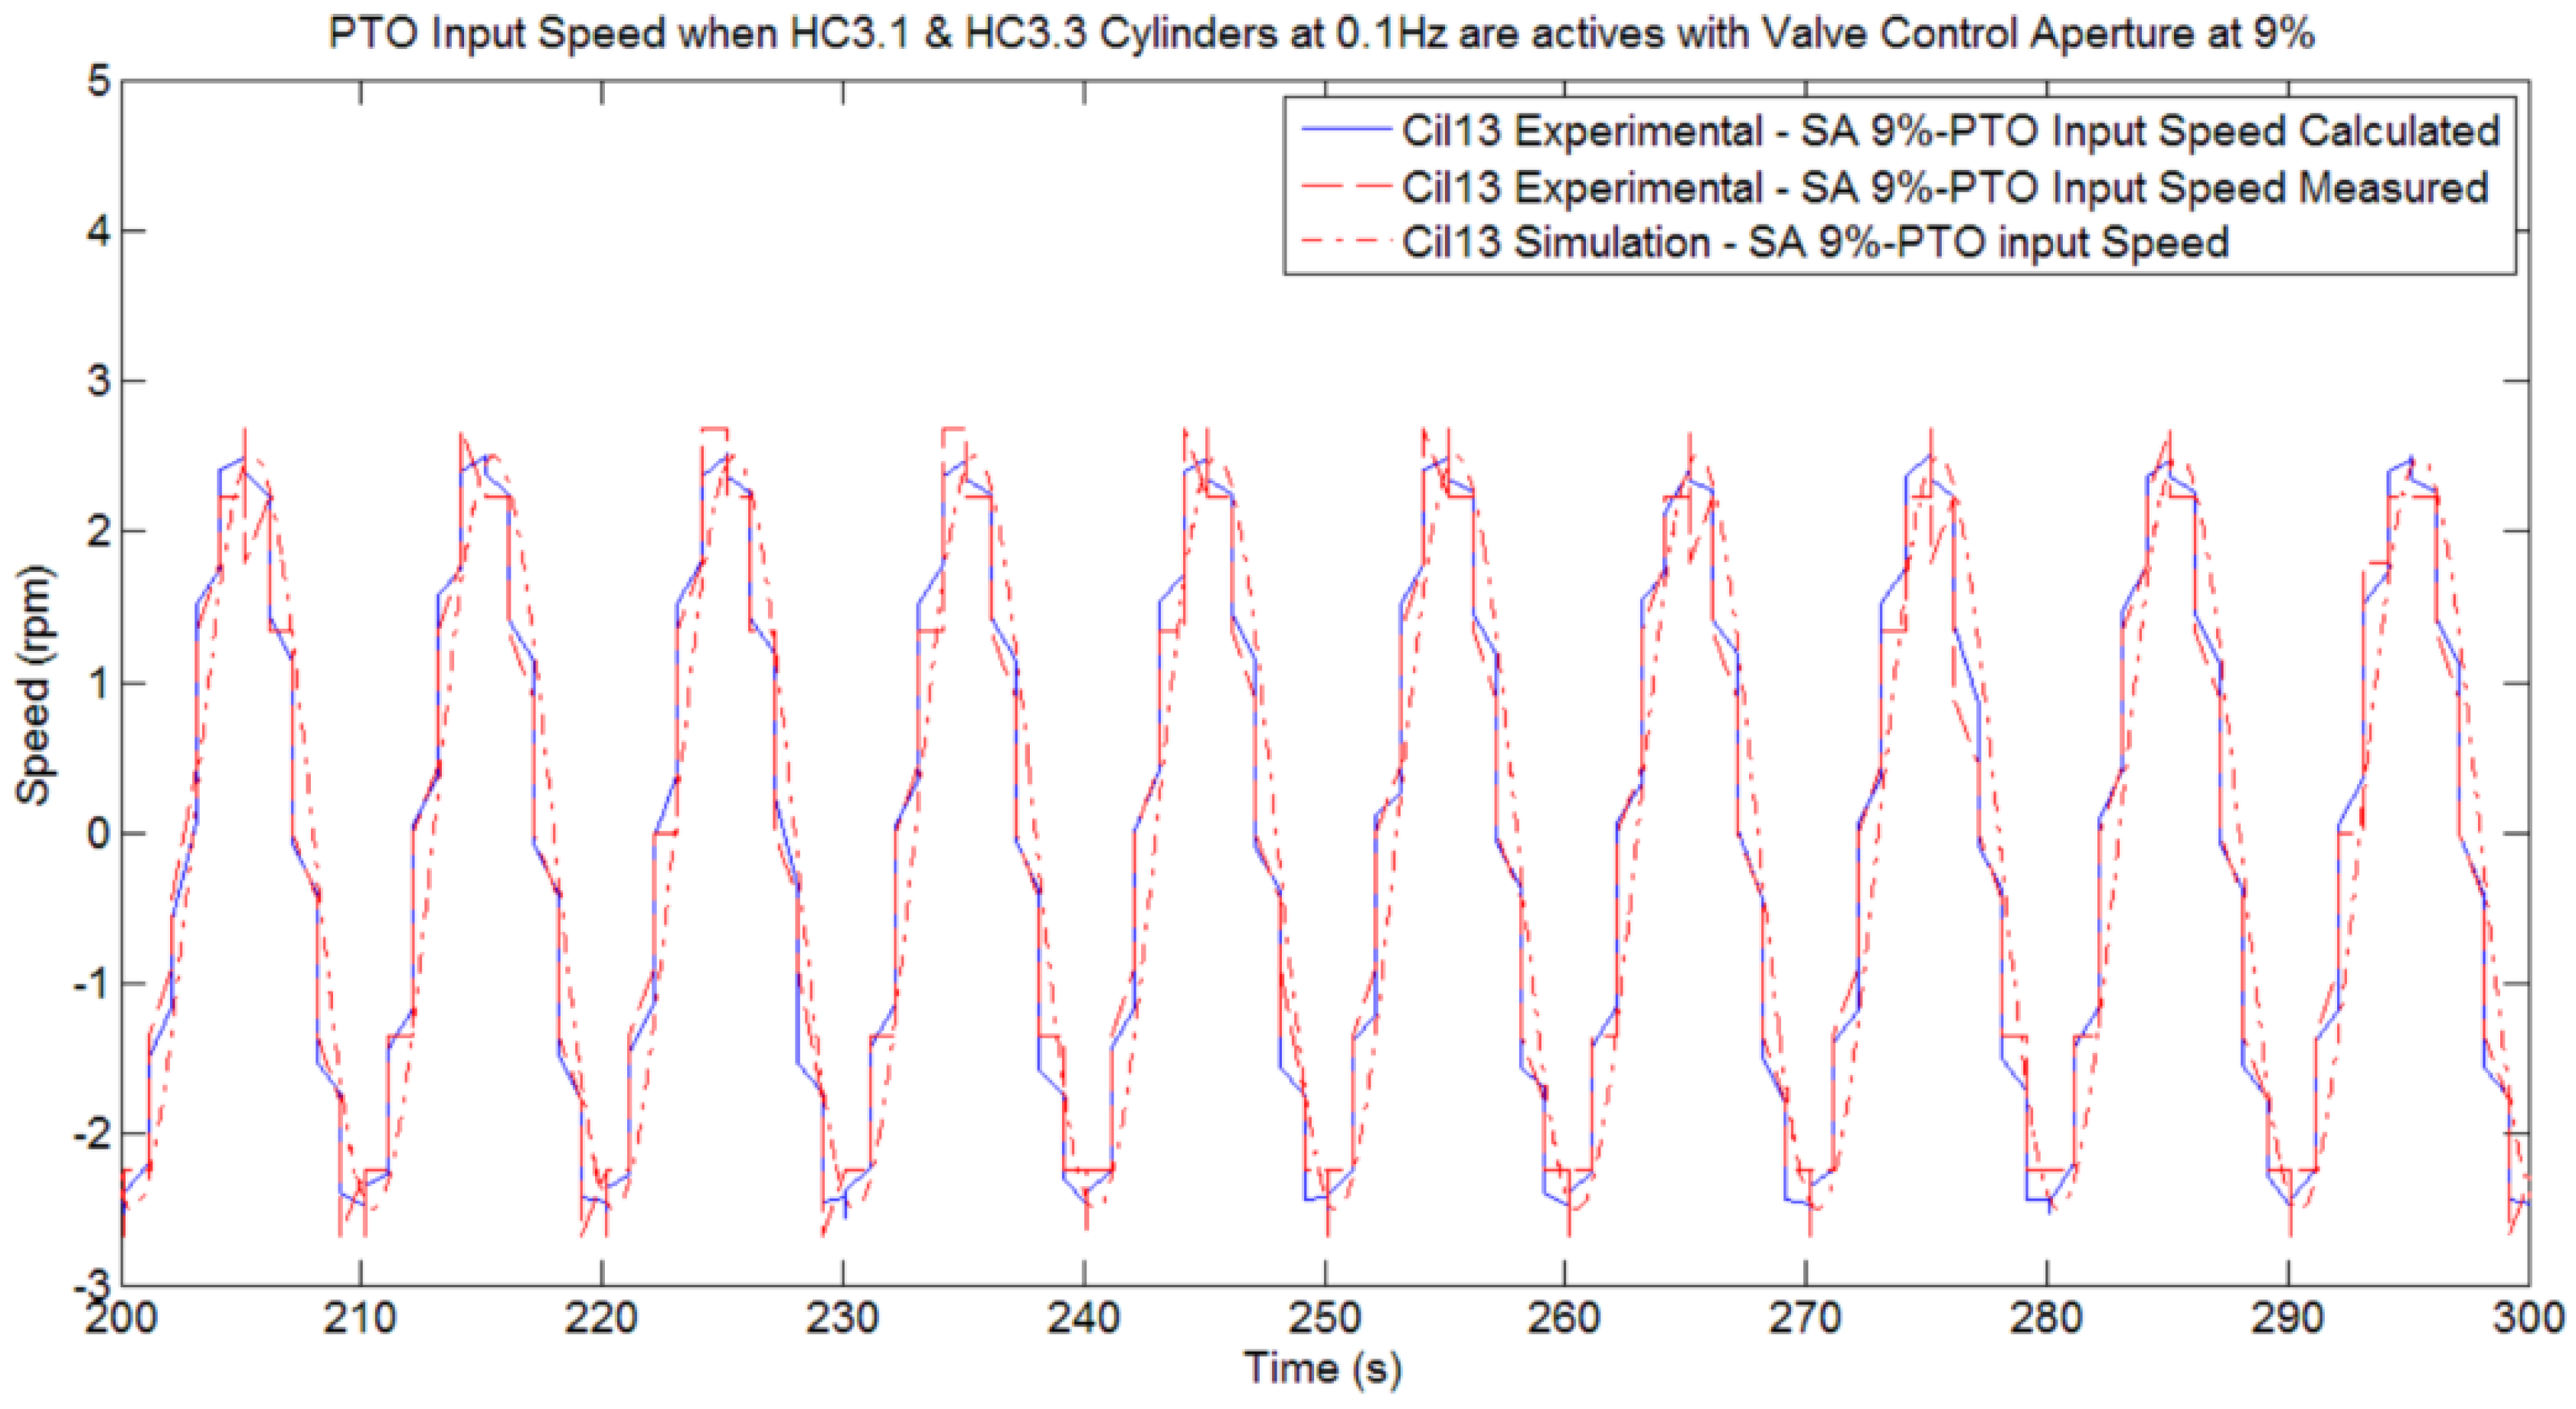
Figure 21 shows the simulated input speed, the on-line calculated input speed and the directly measured input speed obtained by the encoder placed in the Pivoting Axis (PTO input). The maximum input speed is approximately 2.5 rpm. The resolution of the encoder is not high enough to show a steady speed behavior.
Figure 21.
Comparison between Simulated PTO Input speed and Calculated/Measured PTO Input speed.
Figure 21.
Comparison between Simulated PTO Input speed and Calculated/Measured PTO Input speed.
This results in the curves representing the experimental values having a step like shape. This sinusoidal input speed is used in all tests performed to adjust the amount of trapped air, independently of the number of active hydraulic cylinders.
Figure 22,
Figure 23,
Figure 24 and
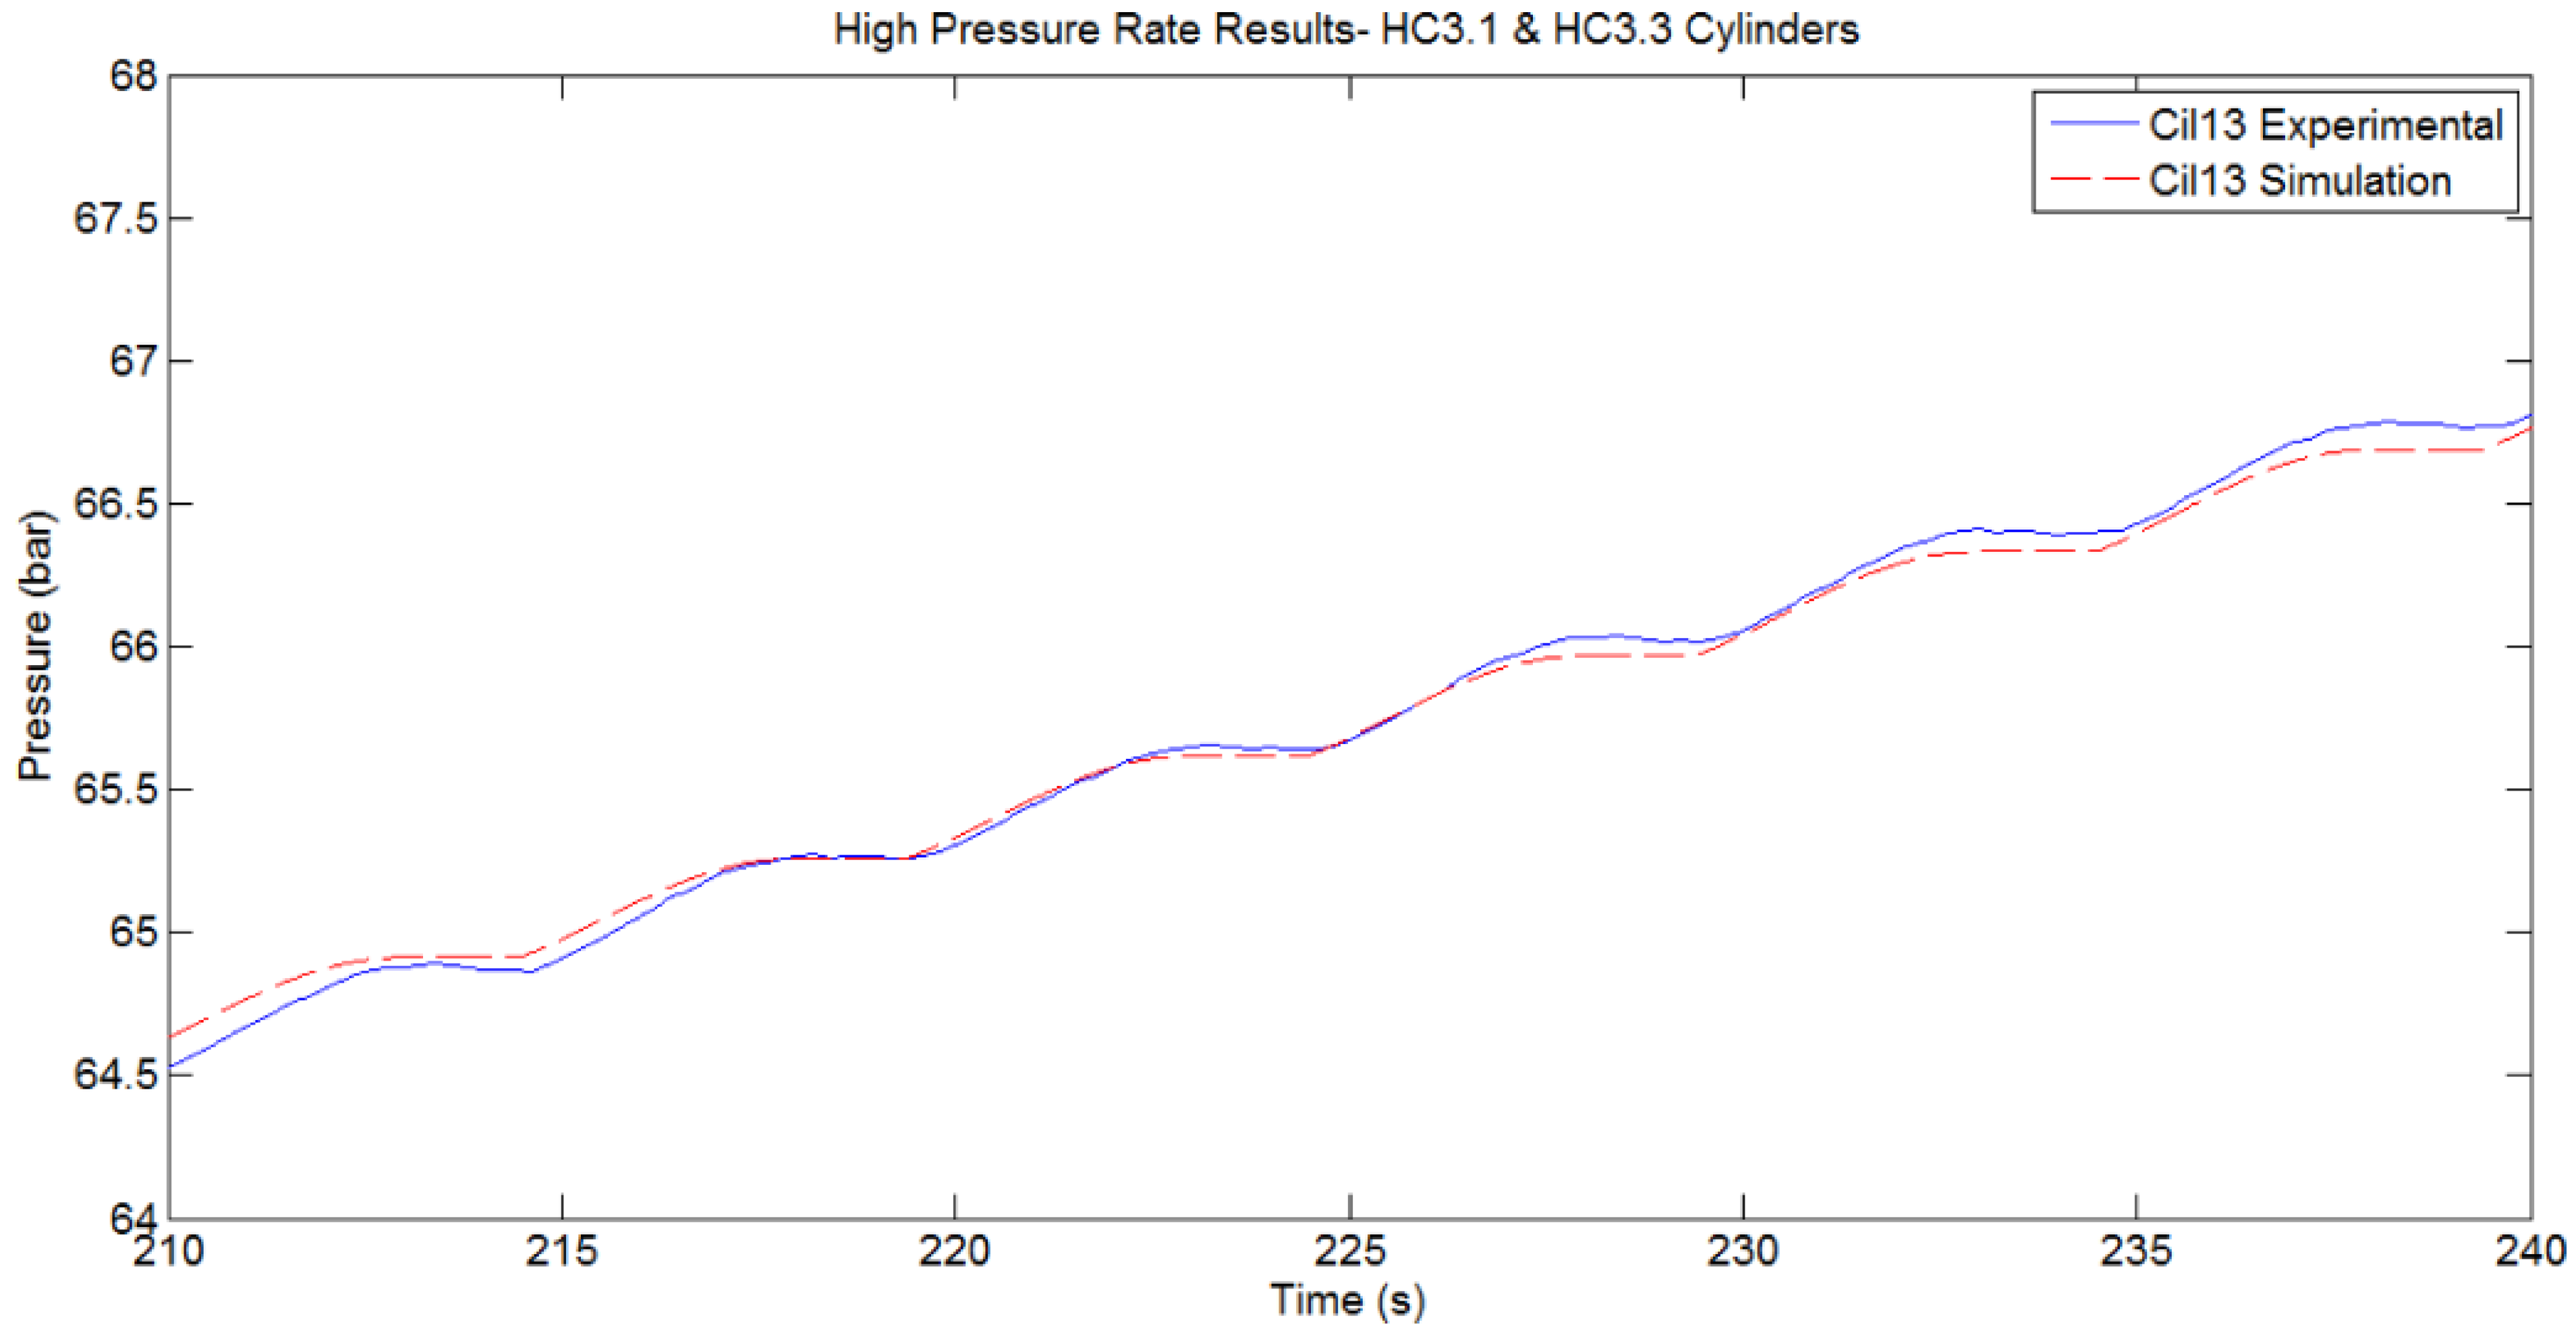
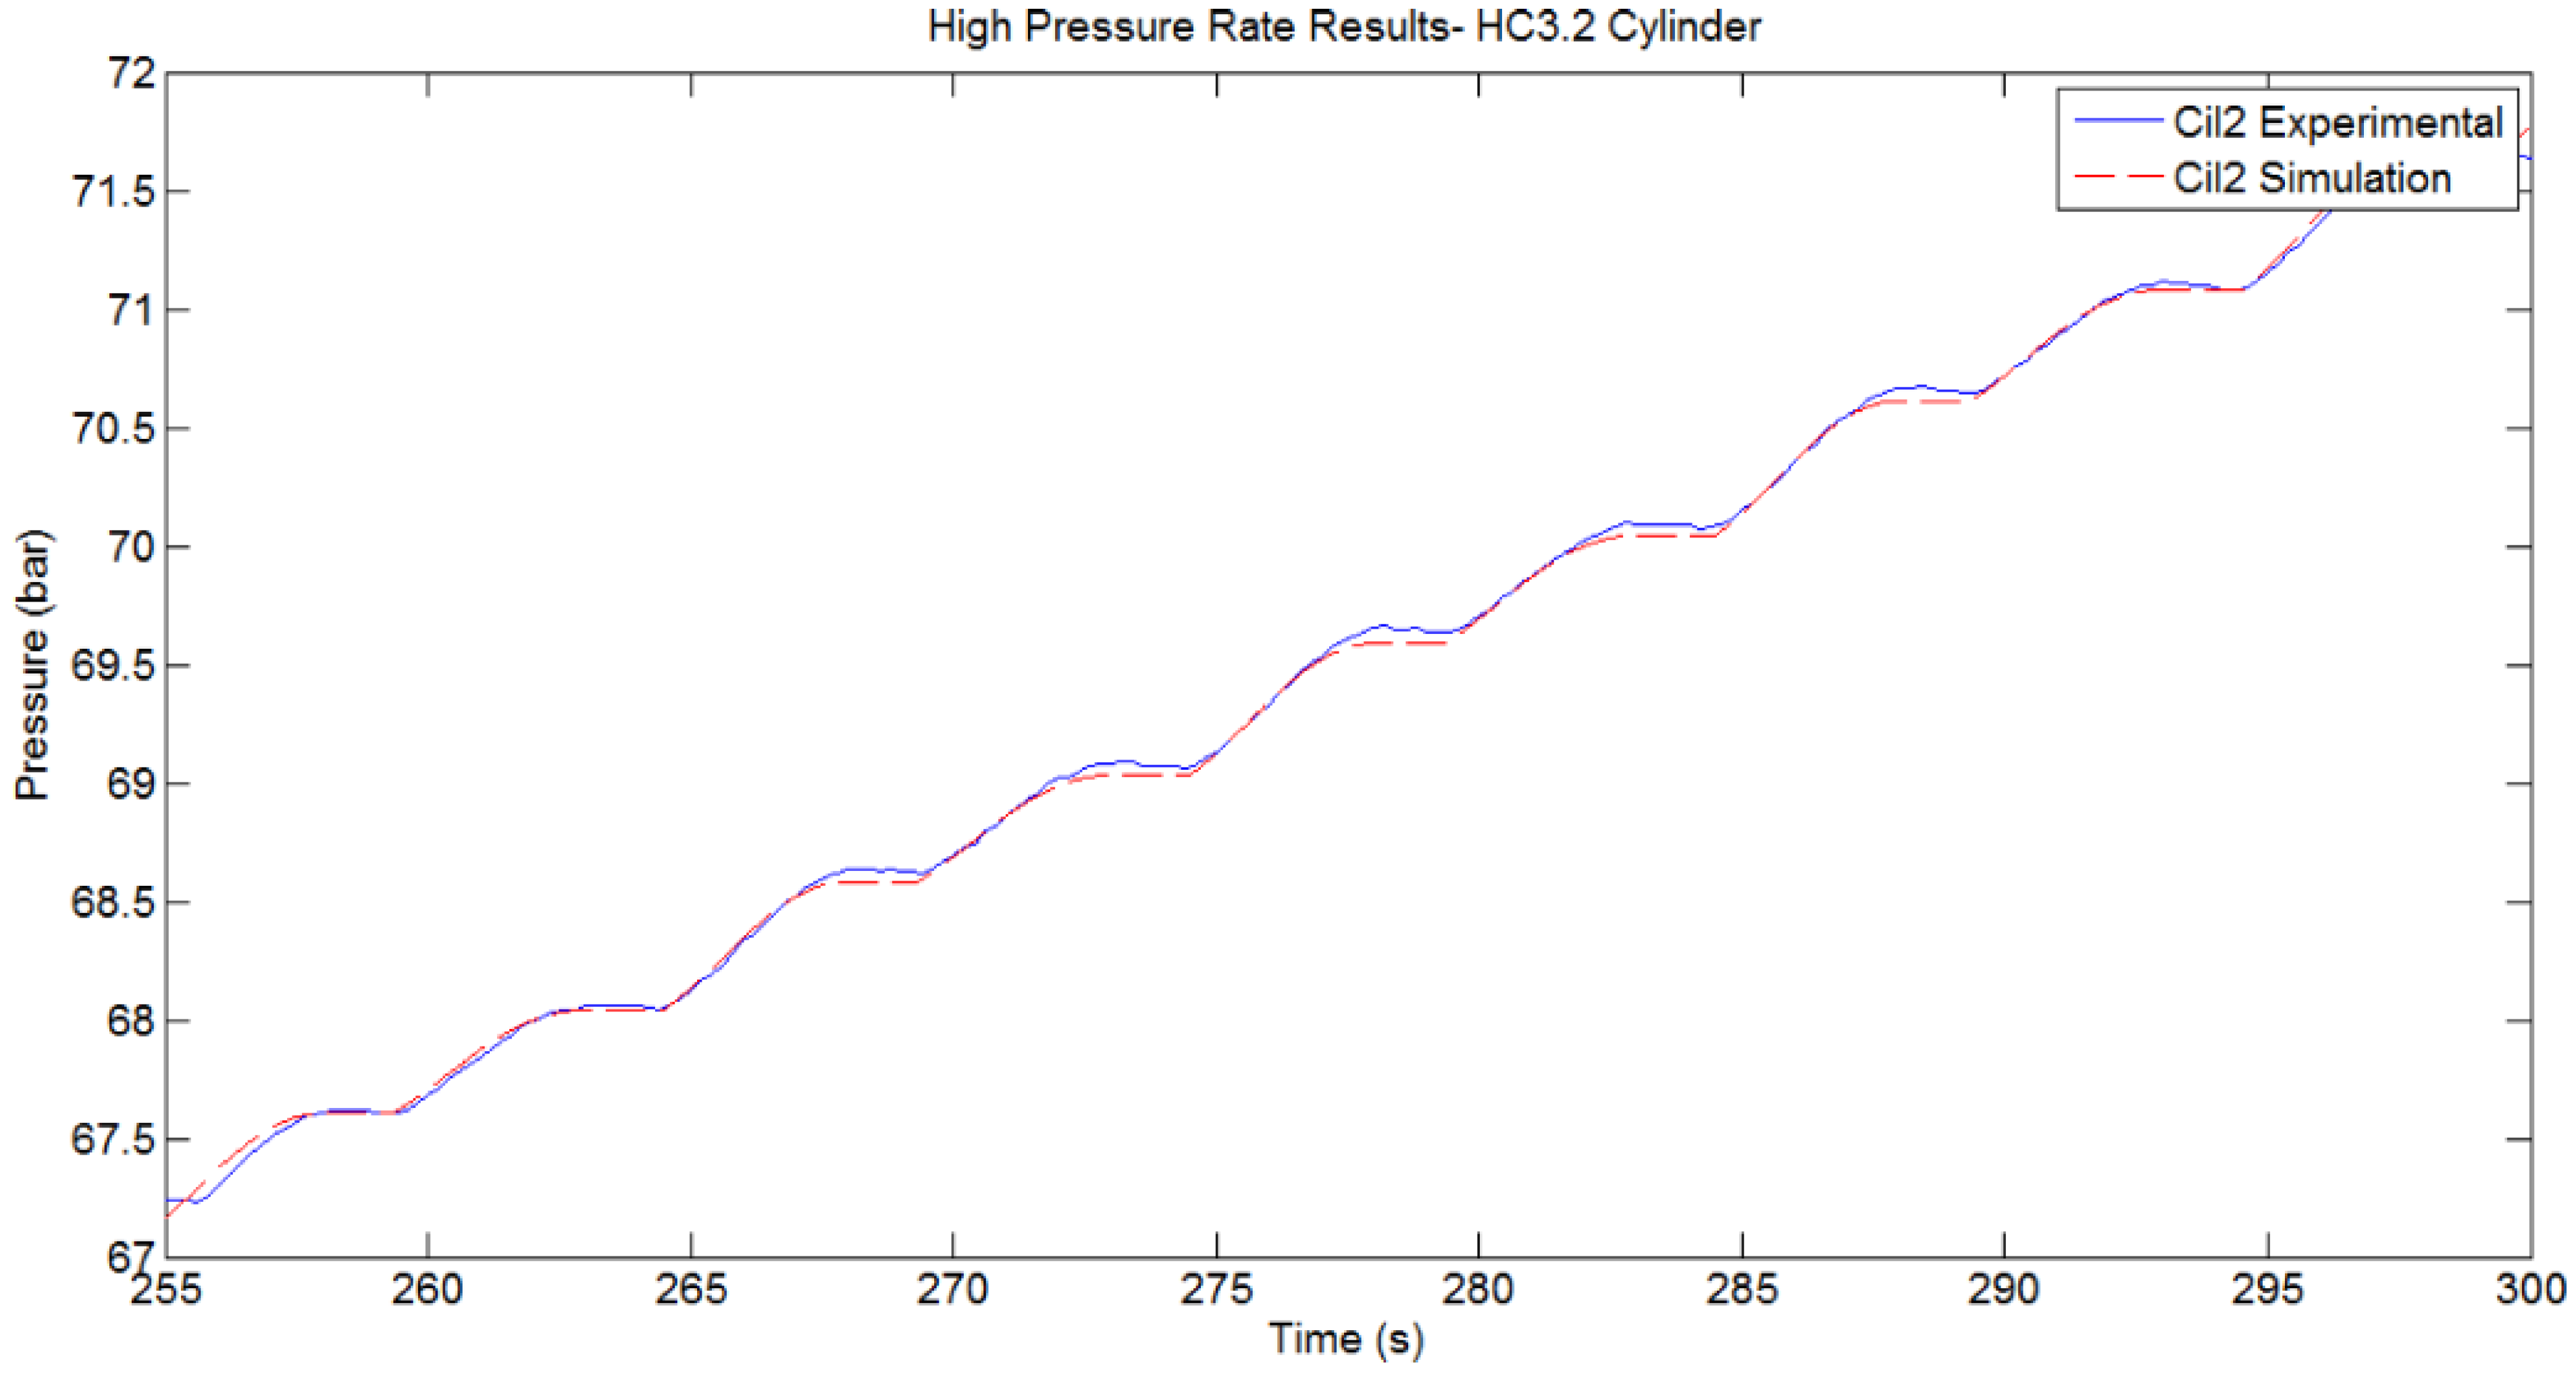
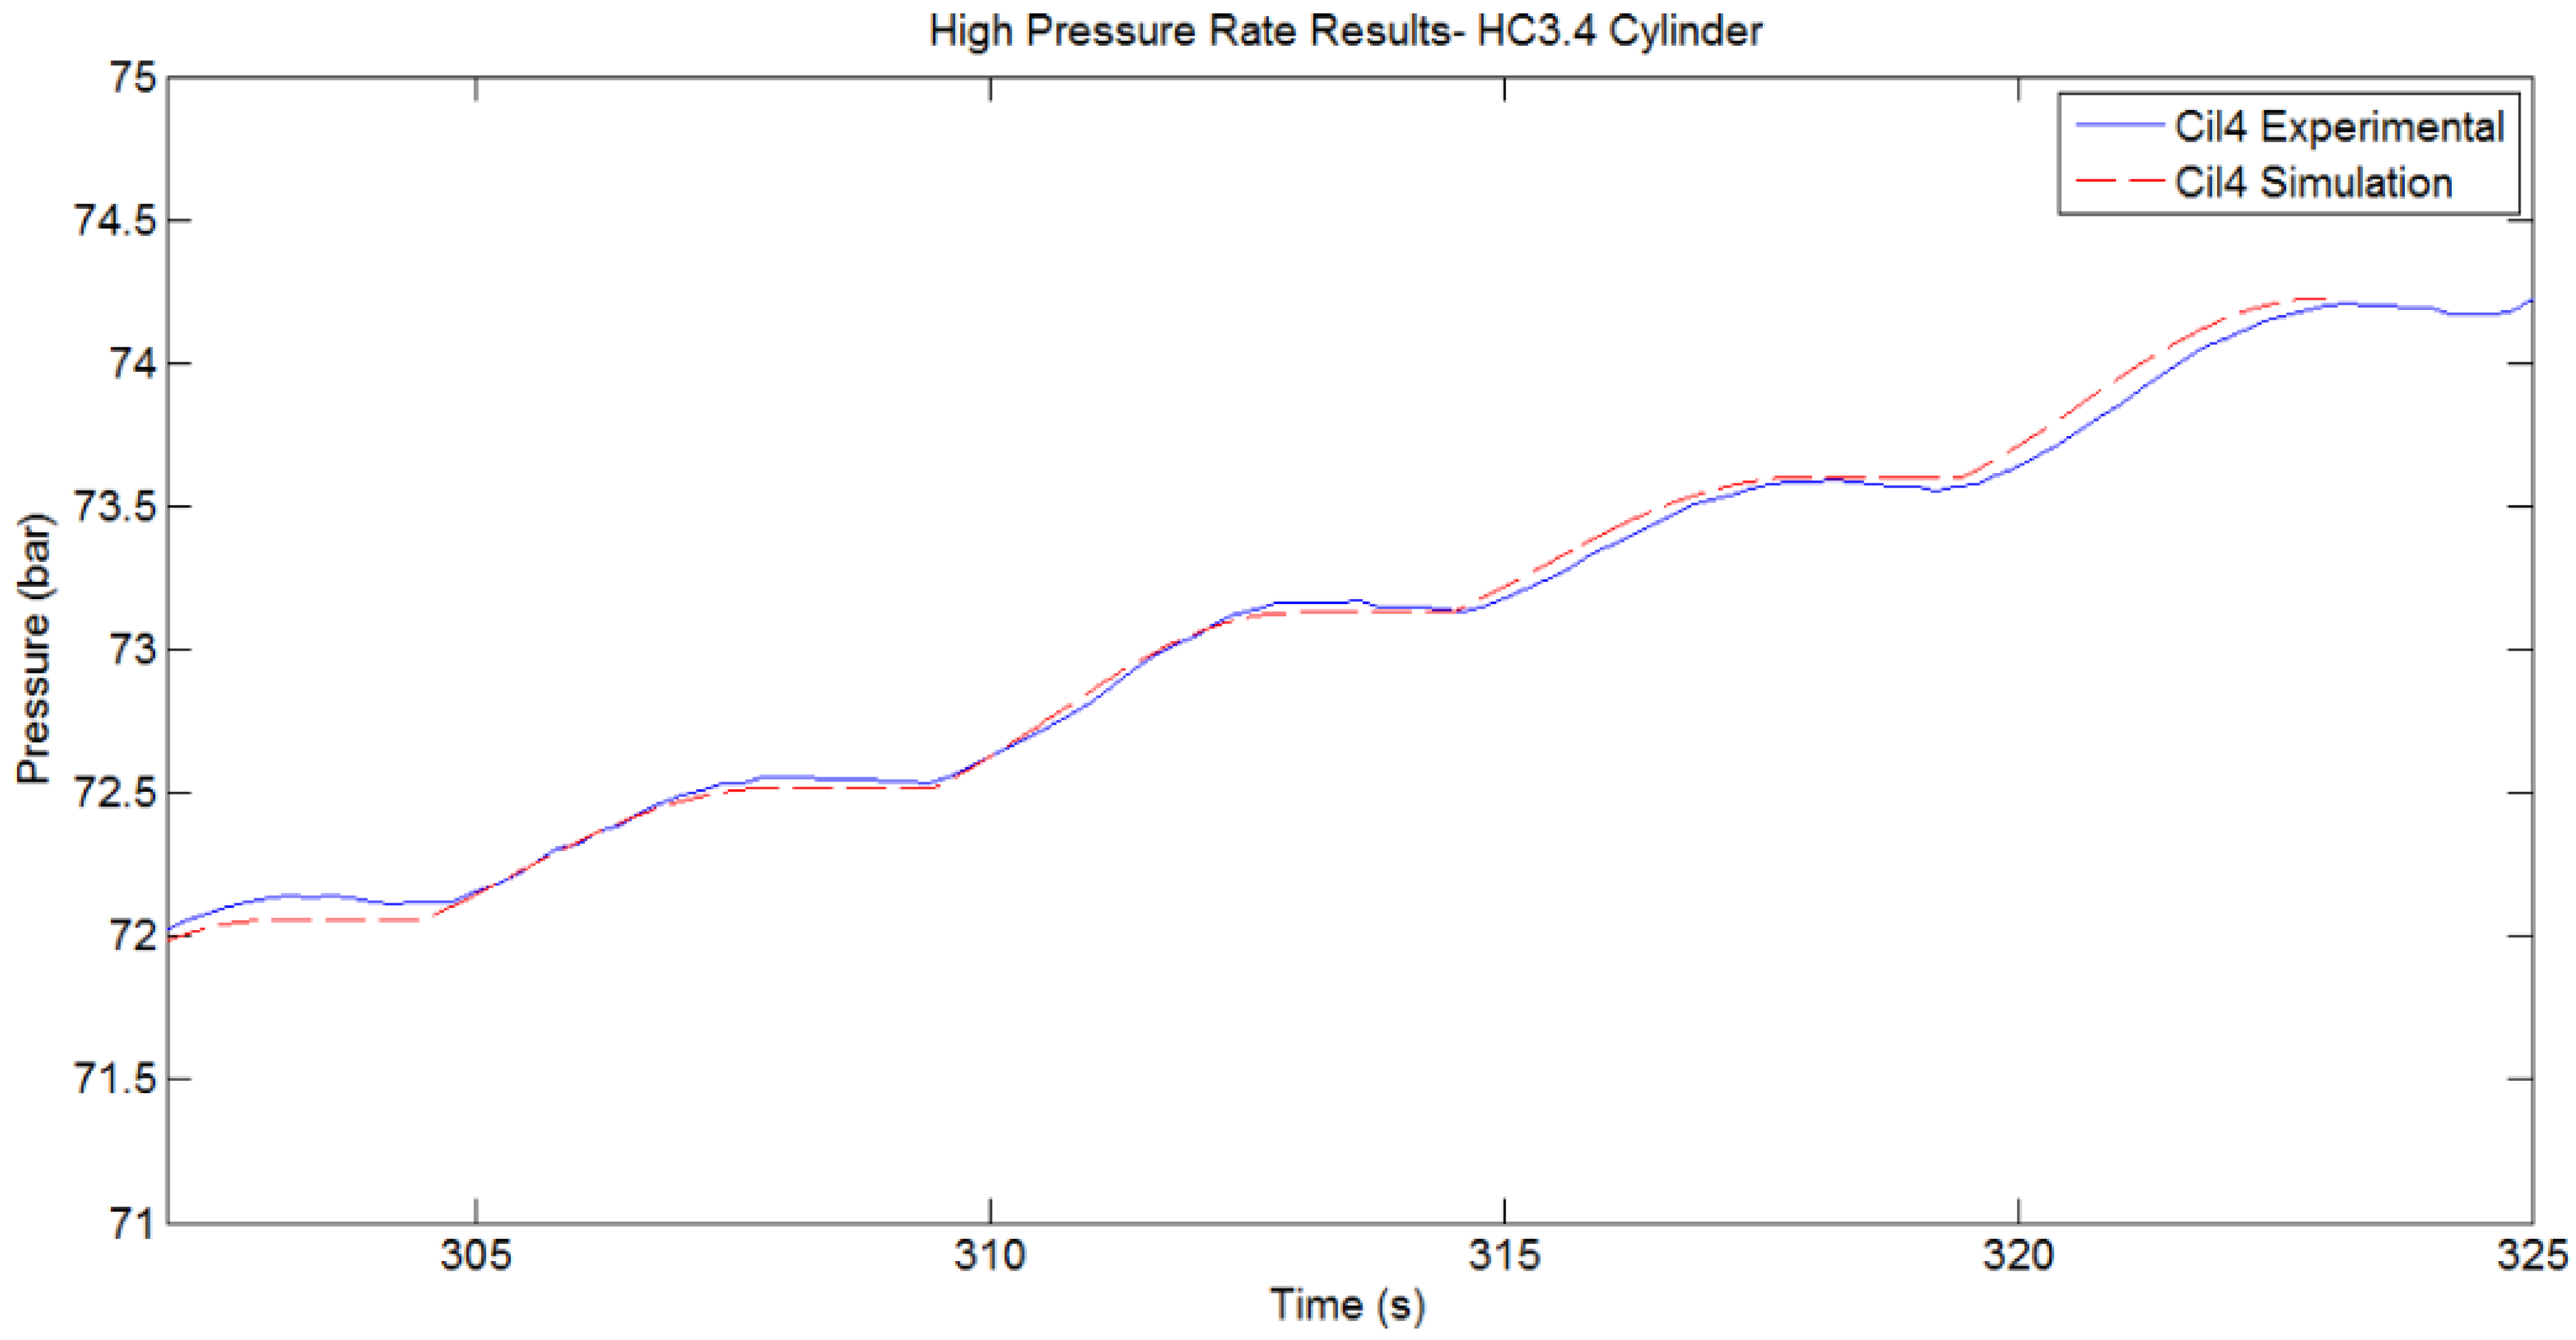
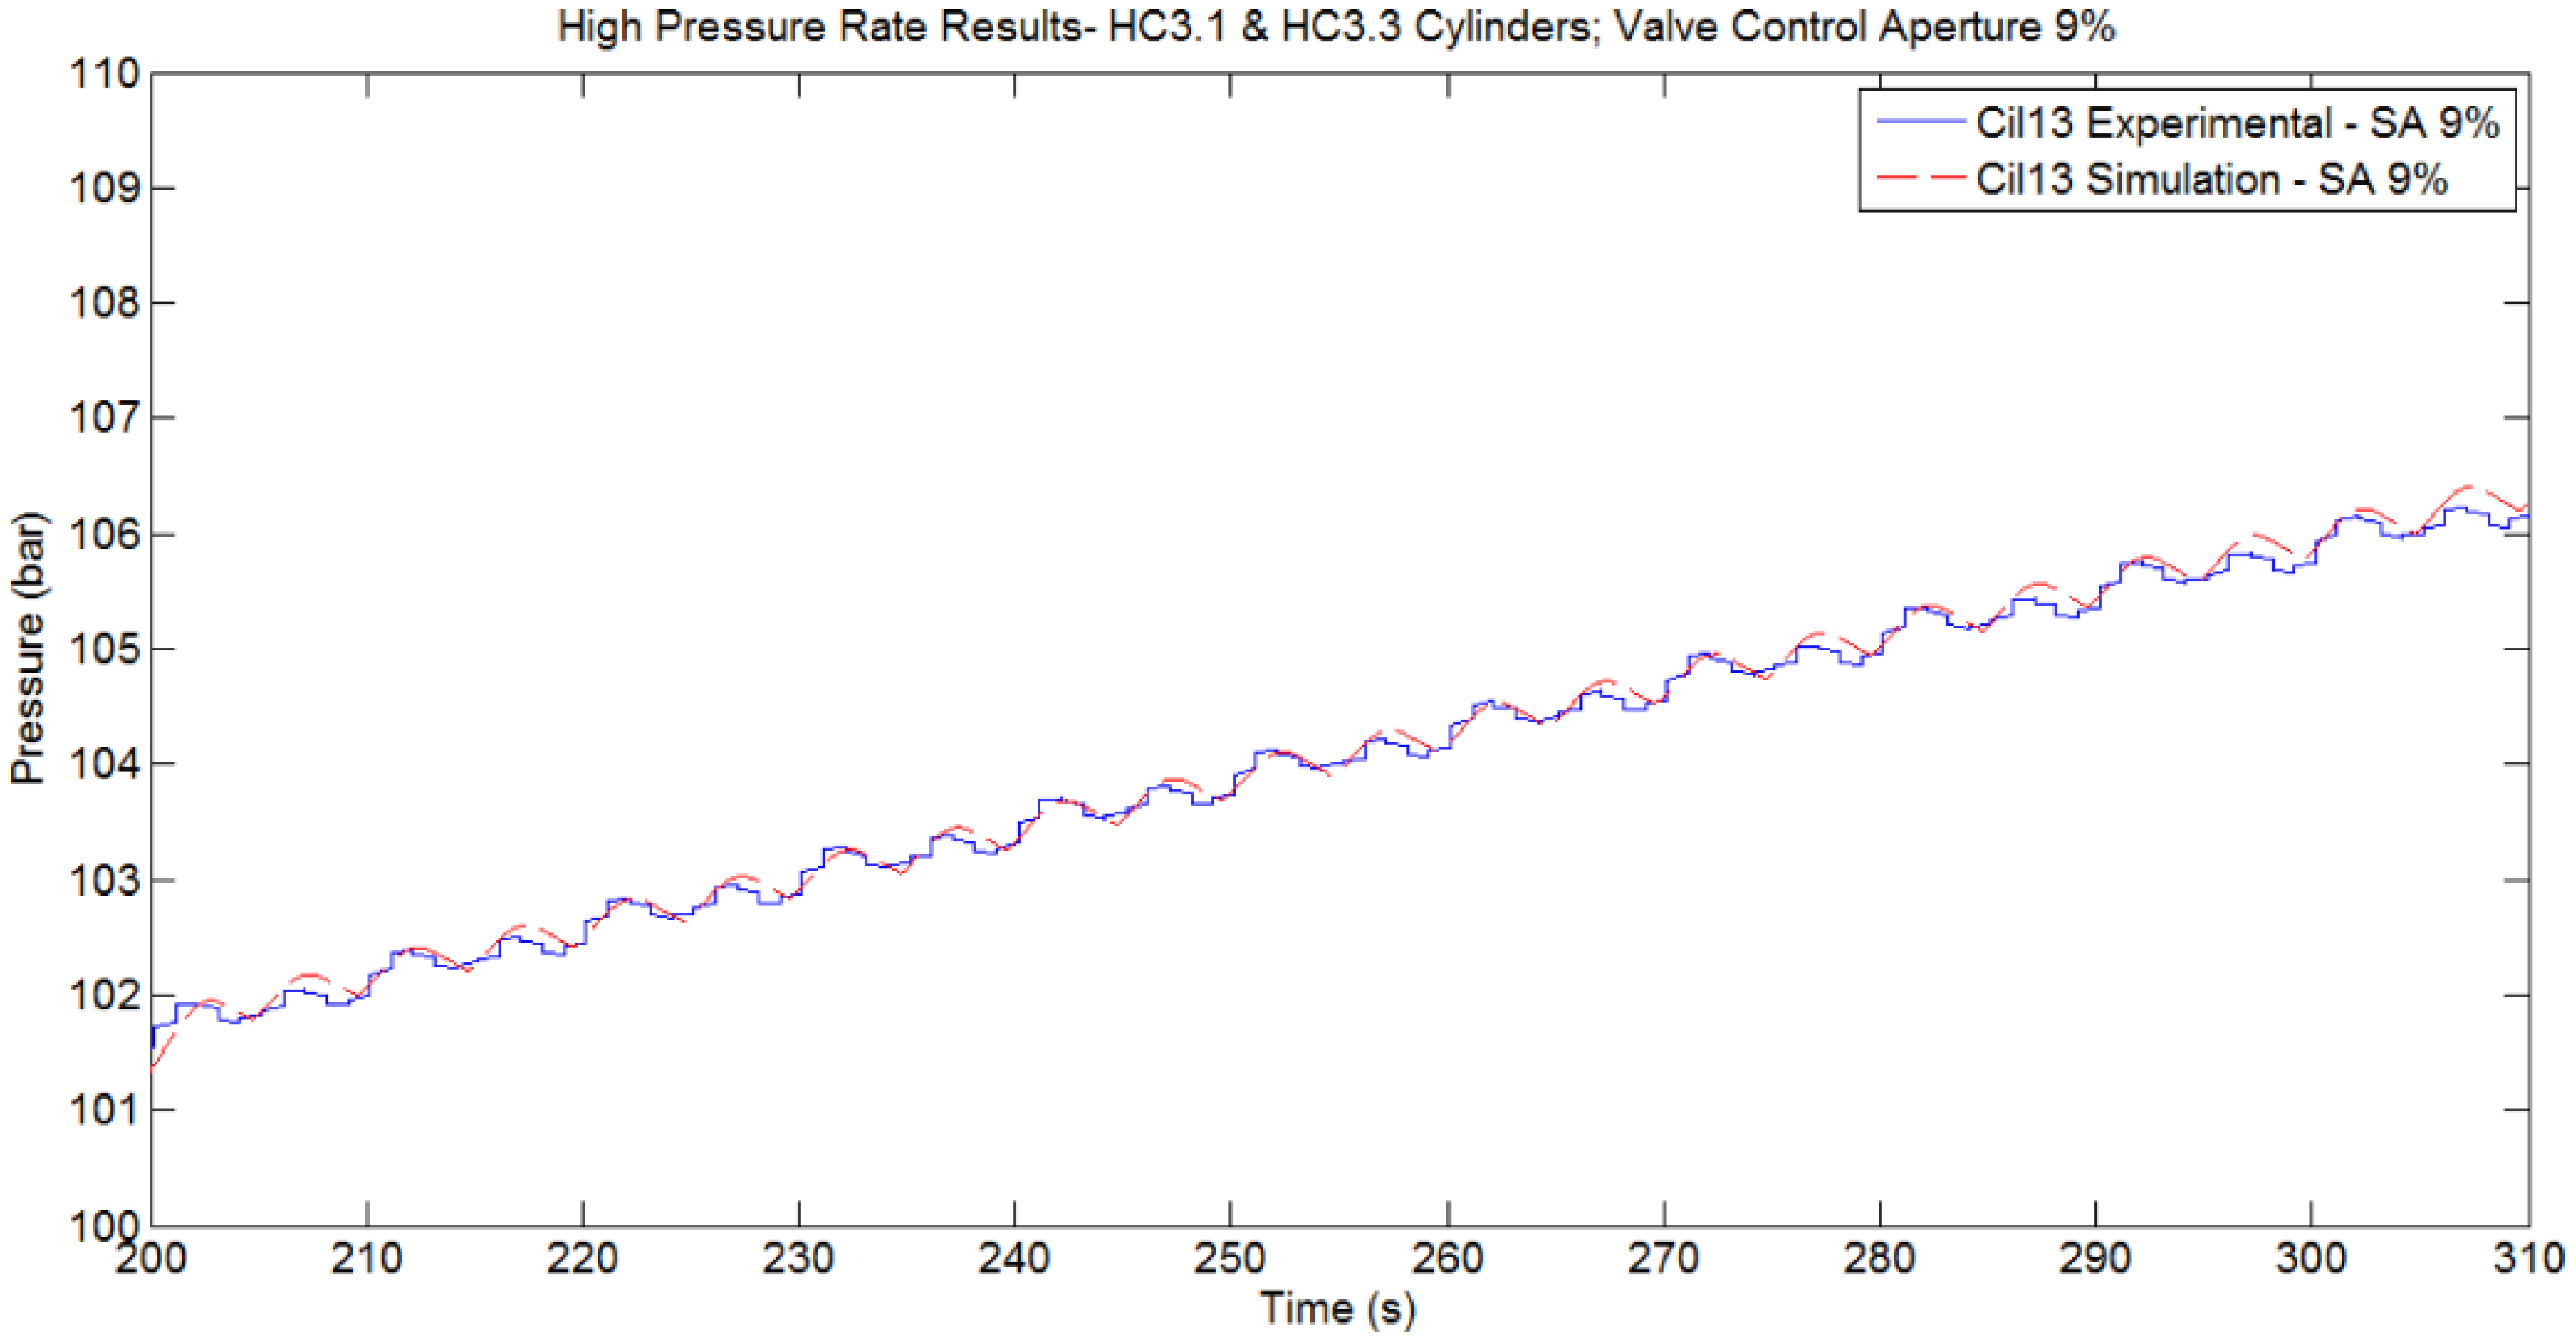
Figure 25 show the evolution of the simulated and experimentally measured pressure of the HP Accumulator after activating different hydraulic cylinders when the amount of trapped air has been adjusted to 6%. In all cases the simulated and experimental signals are very similar.
Figure 22.
Comparison between Simulated and Experimentally Measured pressure of HP Accumulator. Active cylinders HC3.1 and HC3.3. Initial Pres. 64.5 bar. Geometrical layout: Config 1.
Figure 22.
Comparison between Simulated and Experimentally Measured pressure of HP Accumulator. Active cylinders HC3.1 and HC3.3. Initial Pres. 64.5 bar. Geometrical layout: Config 1.
Figure 23.
Comparison between Simulated and Experimentally Measured pressure of HP Accumulator. Active cylinder HC3.2. Initial Pres. 67.2 bar. Geometrical layout: Config 1.
Figure 23.
Comparison between Simulated and Experimentally Measured pressure of HP Accumulator. Active cylinder HC3.2. Initial Pres. 67.2 bar. Geometrical layout: Config 1.
Figure 24.
Comparison between Simulated and Experimentally Measured pressure of HP Accumulator. Acitve cylinder HC3.4. Initial Pres. 72 bar. Geometrical layout: Config 1.
Figure 24.
Comparison between Simulated and Experimentally Measured pressure of HP Accumulator. Acitve cylinder HC3.4. Initial Pres. 72 bar. Geometrical layout: Config 1.
Figure 25.
Comparison between Simulated and Experimentally Measured pressure of HP Accumulator. Active cylinders HC3.1 and HC3.3. Valve Control Aperture 9%. Initial Pres. 101.5 bar. Geometrical layout: Config 1.
Figure 25.
Comparison between Simulated and Experimentally Measured pressure of HP Accumulator. Active cylinders HC3.1 and HC3.3. Valve Control Aperture 9%. Initial Pres. 101.5 bar. Geometrical layout: Config 1.
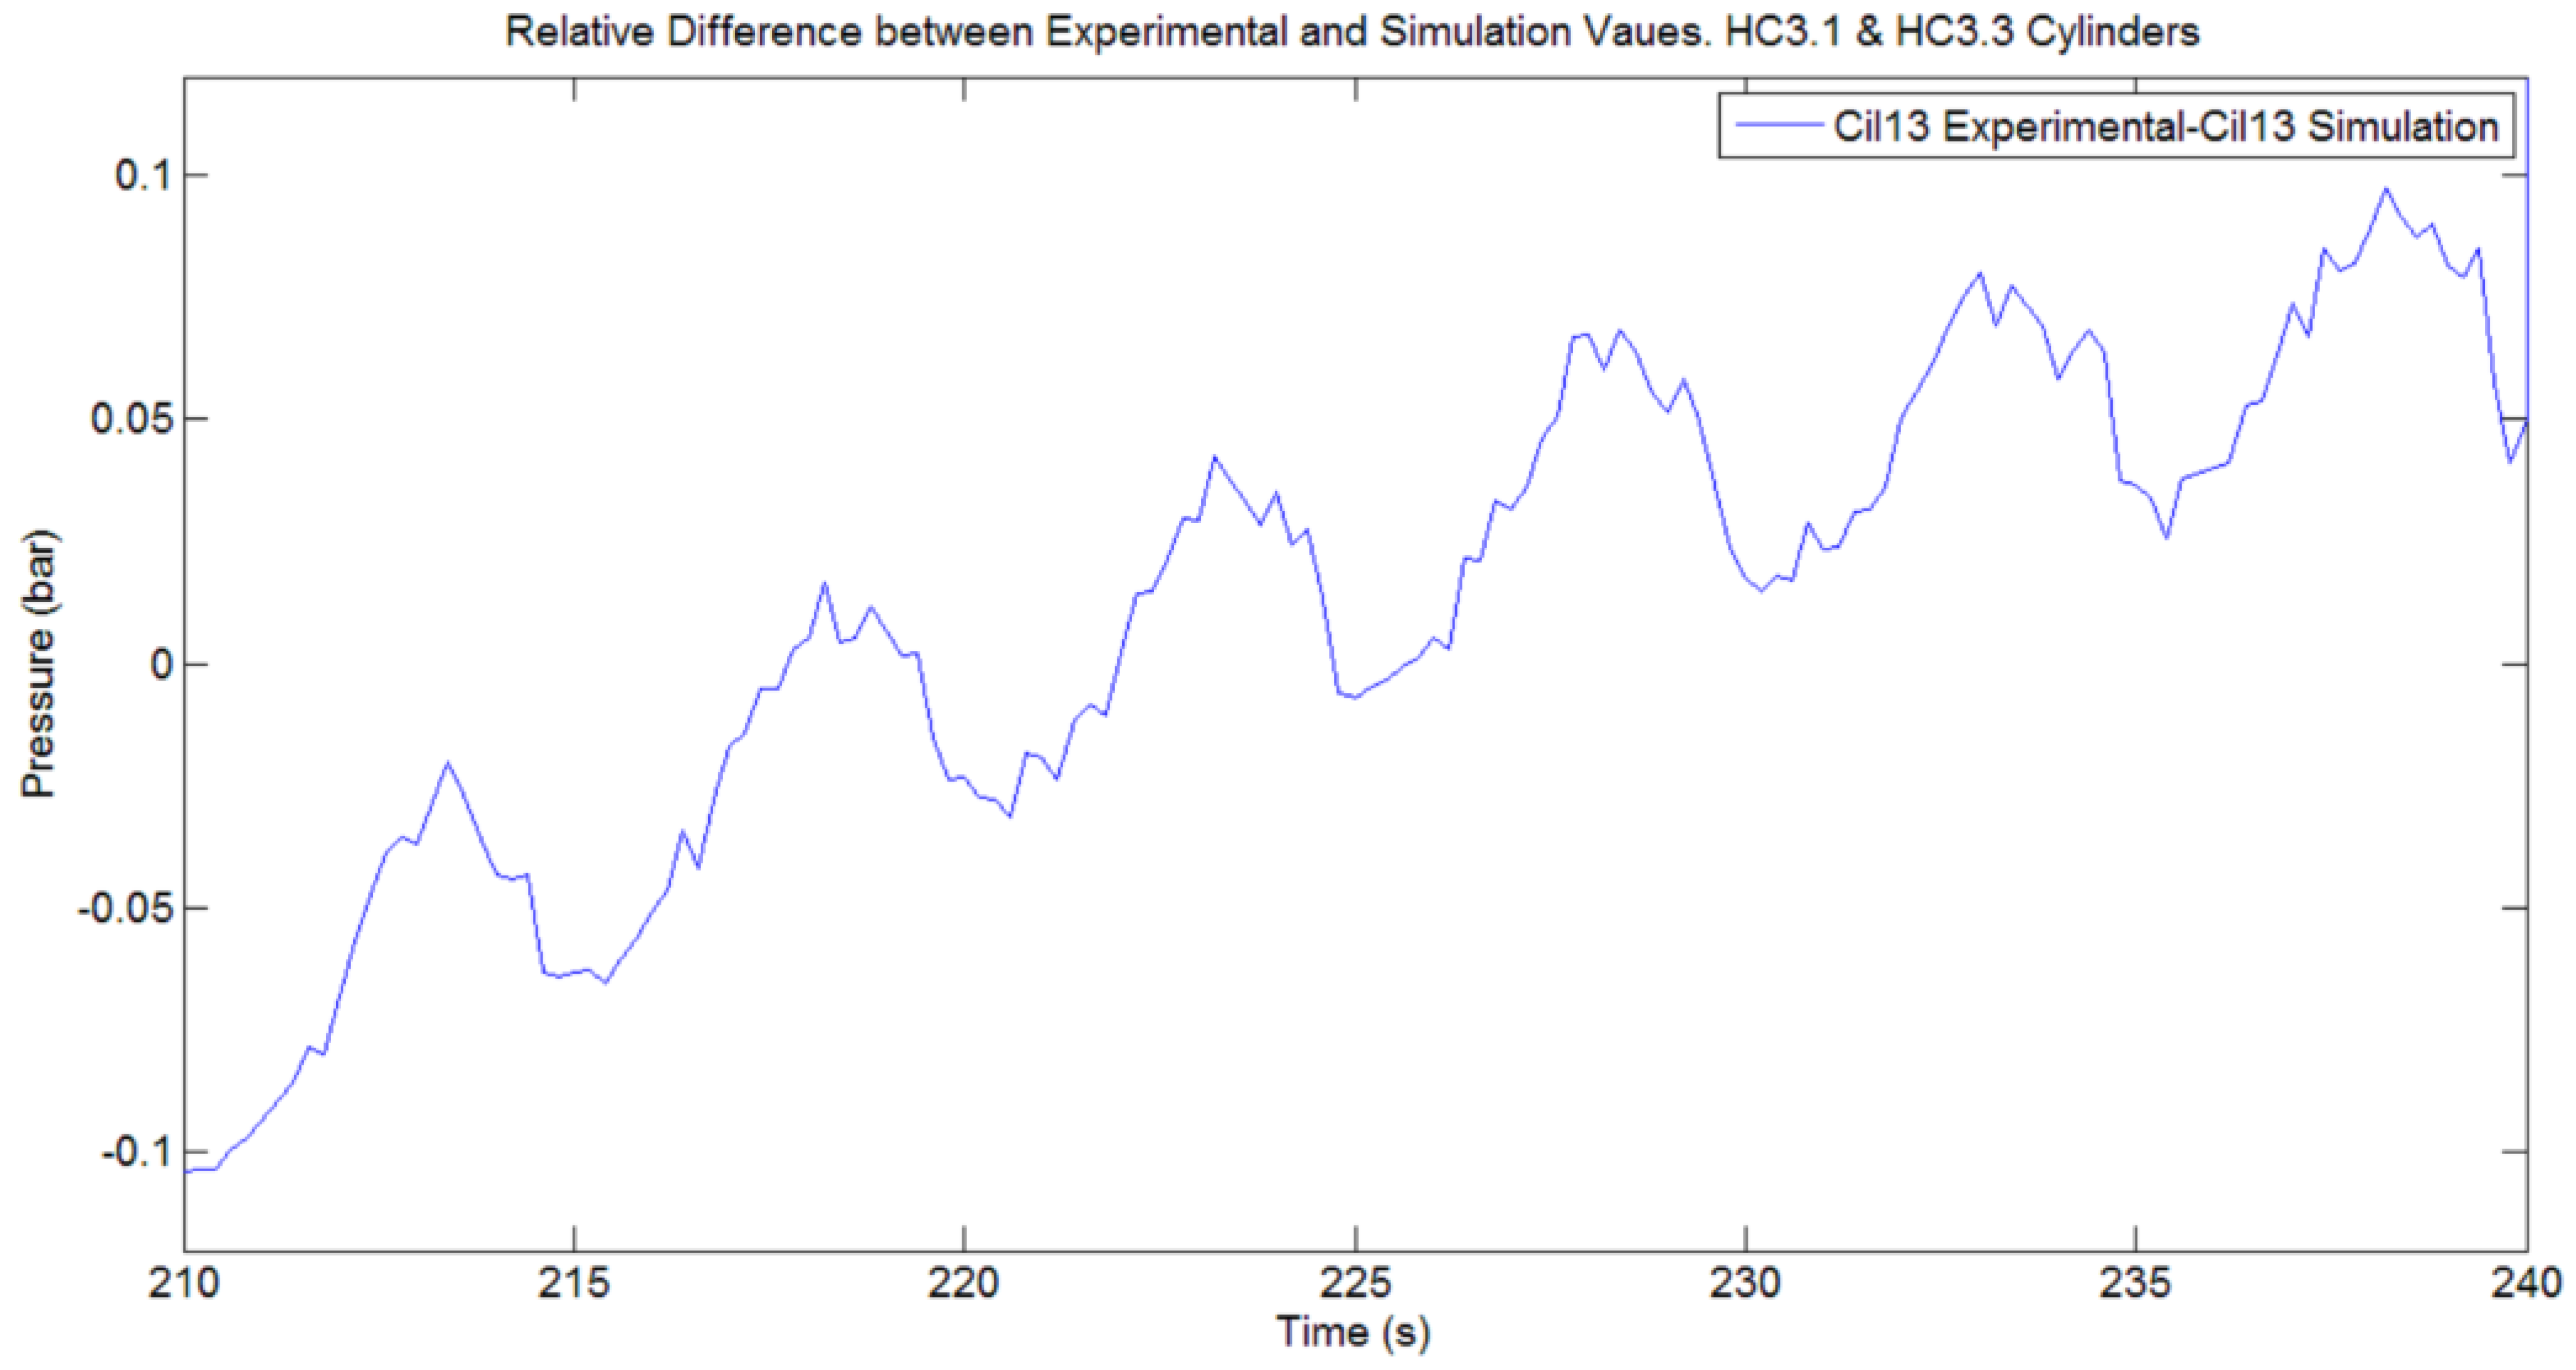
In order to demonstrate that the behavior is reasonably constant independent of the time interval, the following figures use different time intervals. In order to compare between simulated and experimentally measured pressures of HP accumulator,
Figure 26 depicts the relative difference between both signals using the experimental values as reference. The relative difference is very low and shows a slight increment with time.
Figure 26.
Relative Difference between Experimentally Measured and Simulated pressure of HP Accumulator. Active cylinders HC3.1 and HC3.3. Initial Pres. 64.5 bar. Geometrical layout: Config 1.
Figure 26.
Relative Difference between Experimentally Measured and Simulated pressure of HP Accumulator. Active cylinders HC3.1 and HC3.3. Initial Pres. 64.5 bar. Geometrical layout: Config 1.
The other experimental tests to be compared with those from the simulations are related to the PTO output and the control valve adjustment.
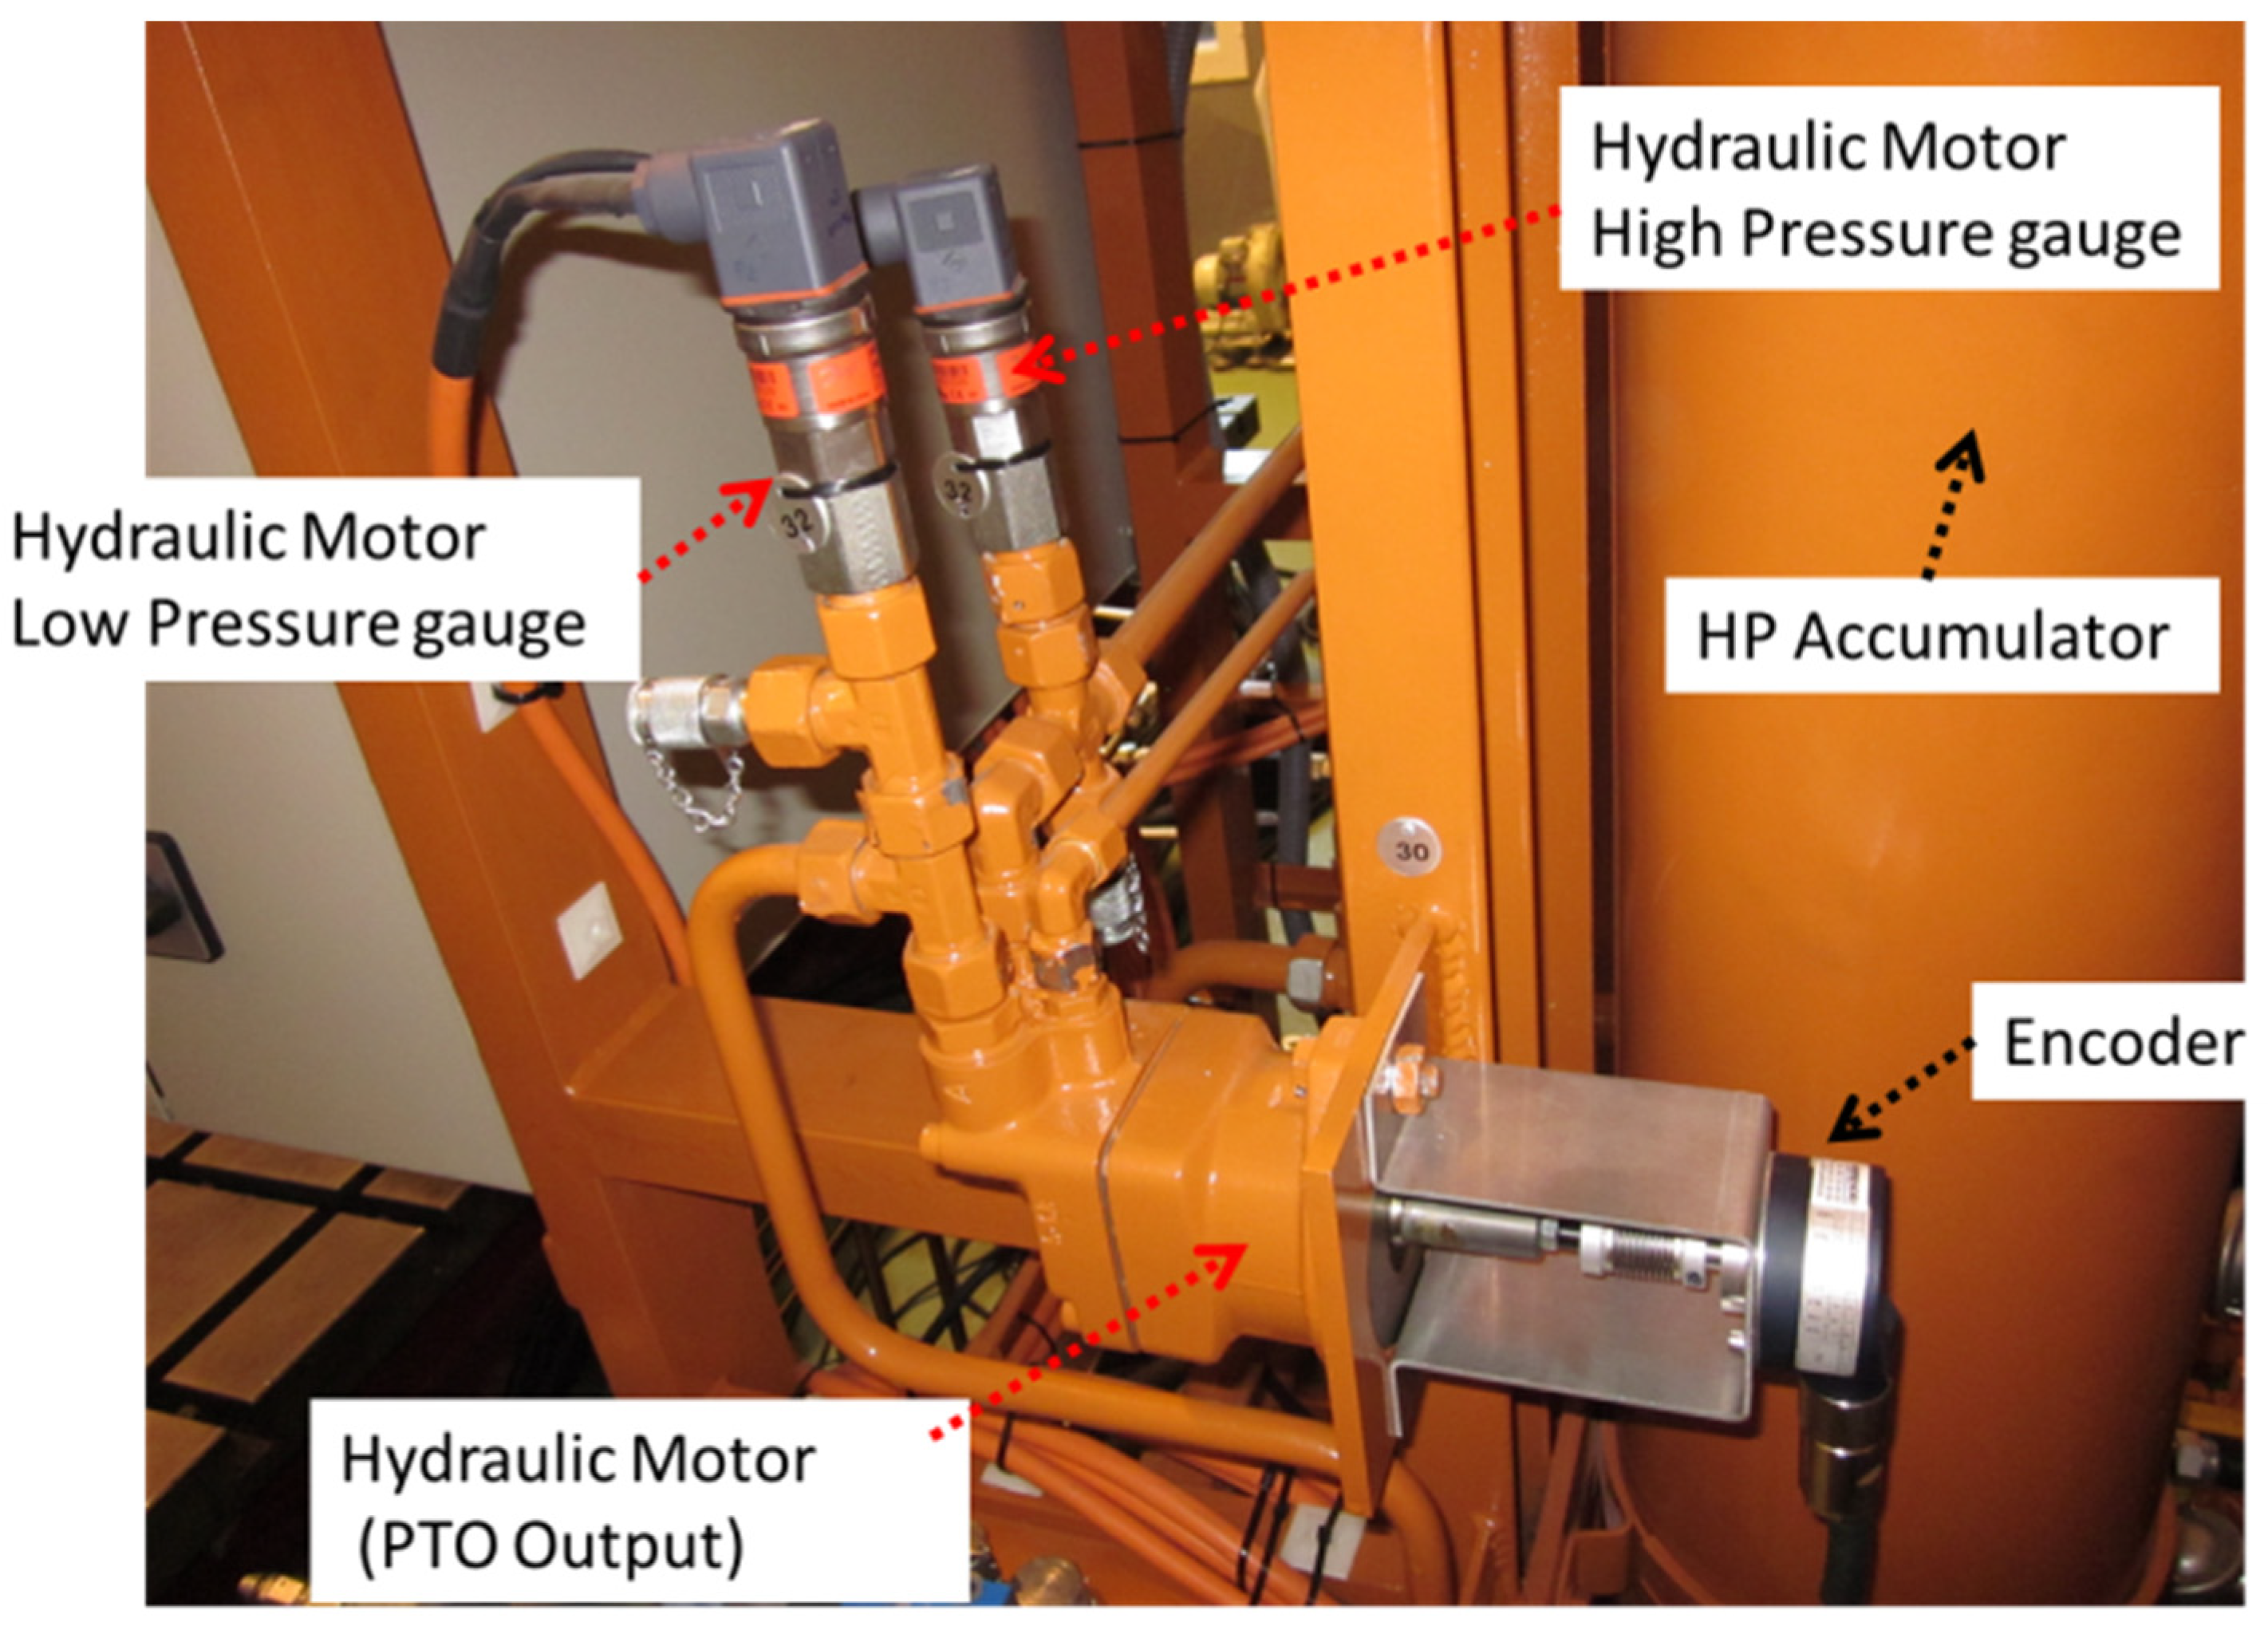
Figure 27 displays the main components of the PTO Output. The objective of these tests is to adjust the behavior of the control valve in order to obtain similar pressure decay in the pressure of the HP Accumulator and a similar output speed for the hydraulic motor (PTO Output).
Figure 27.
Hydraulic Motor. PTO Output.
Figure 27.
Hydraulic Motor. PTO Output.
These tests consist of charging the HP Accumulator at a specific pressure. Once the pressure is reached, the PTO input movement is stopped. Afterwards the control valve is opened to a specific aperture percentage and the pressure of the HP pressure and the speed of the hydraulic motor are measured.
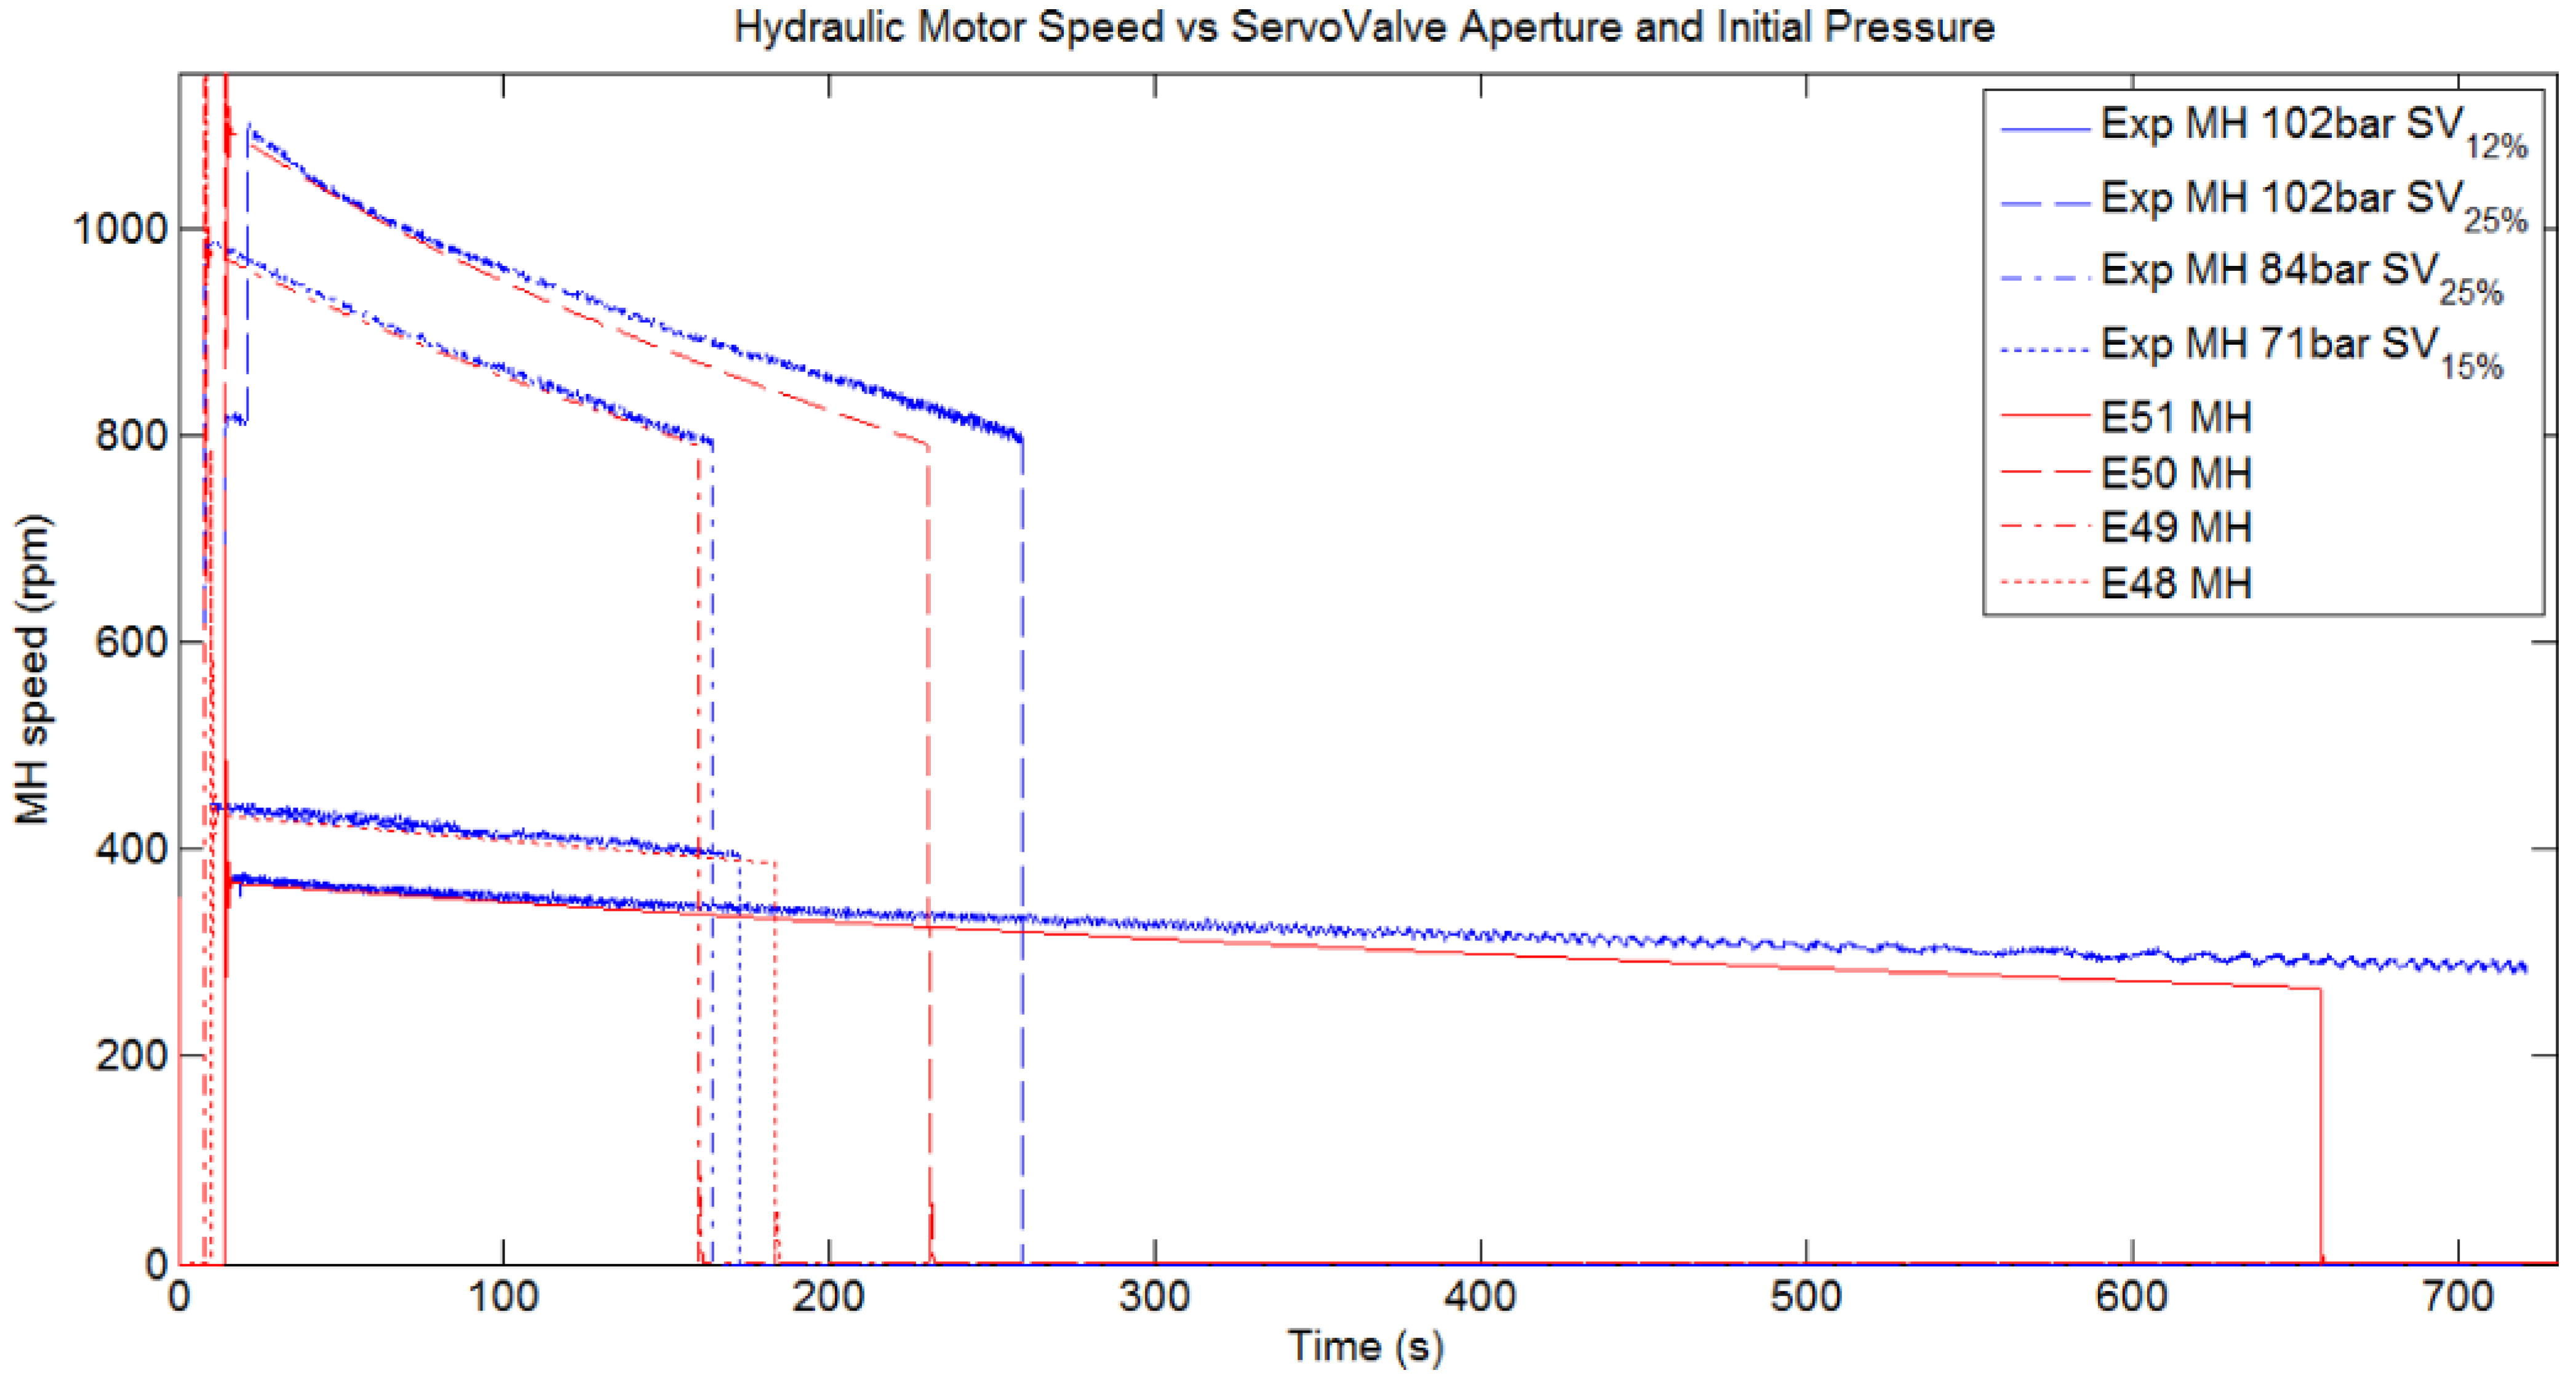
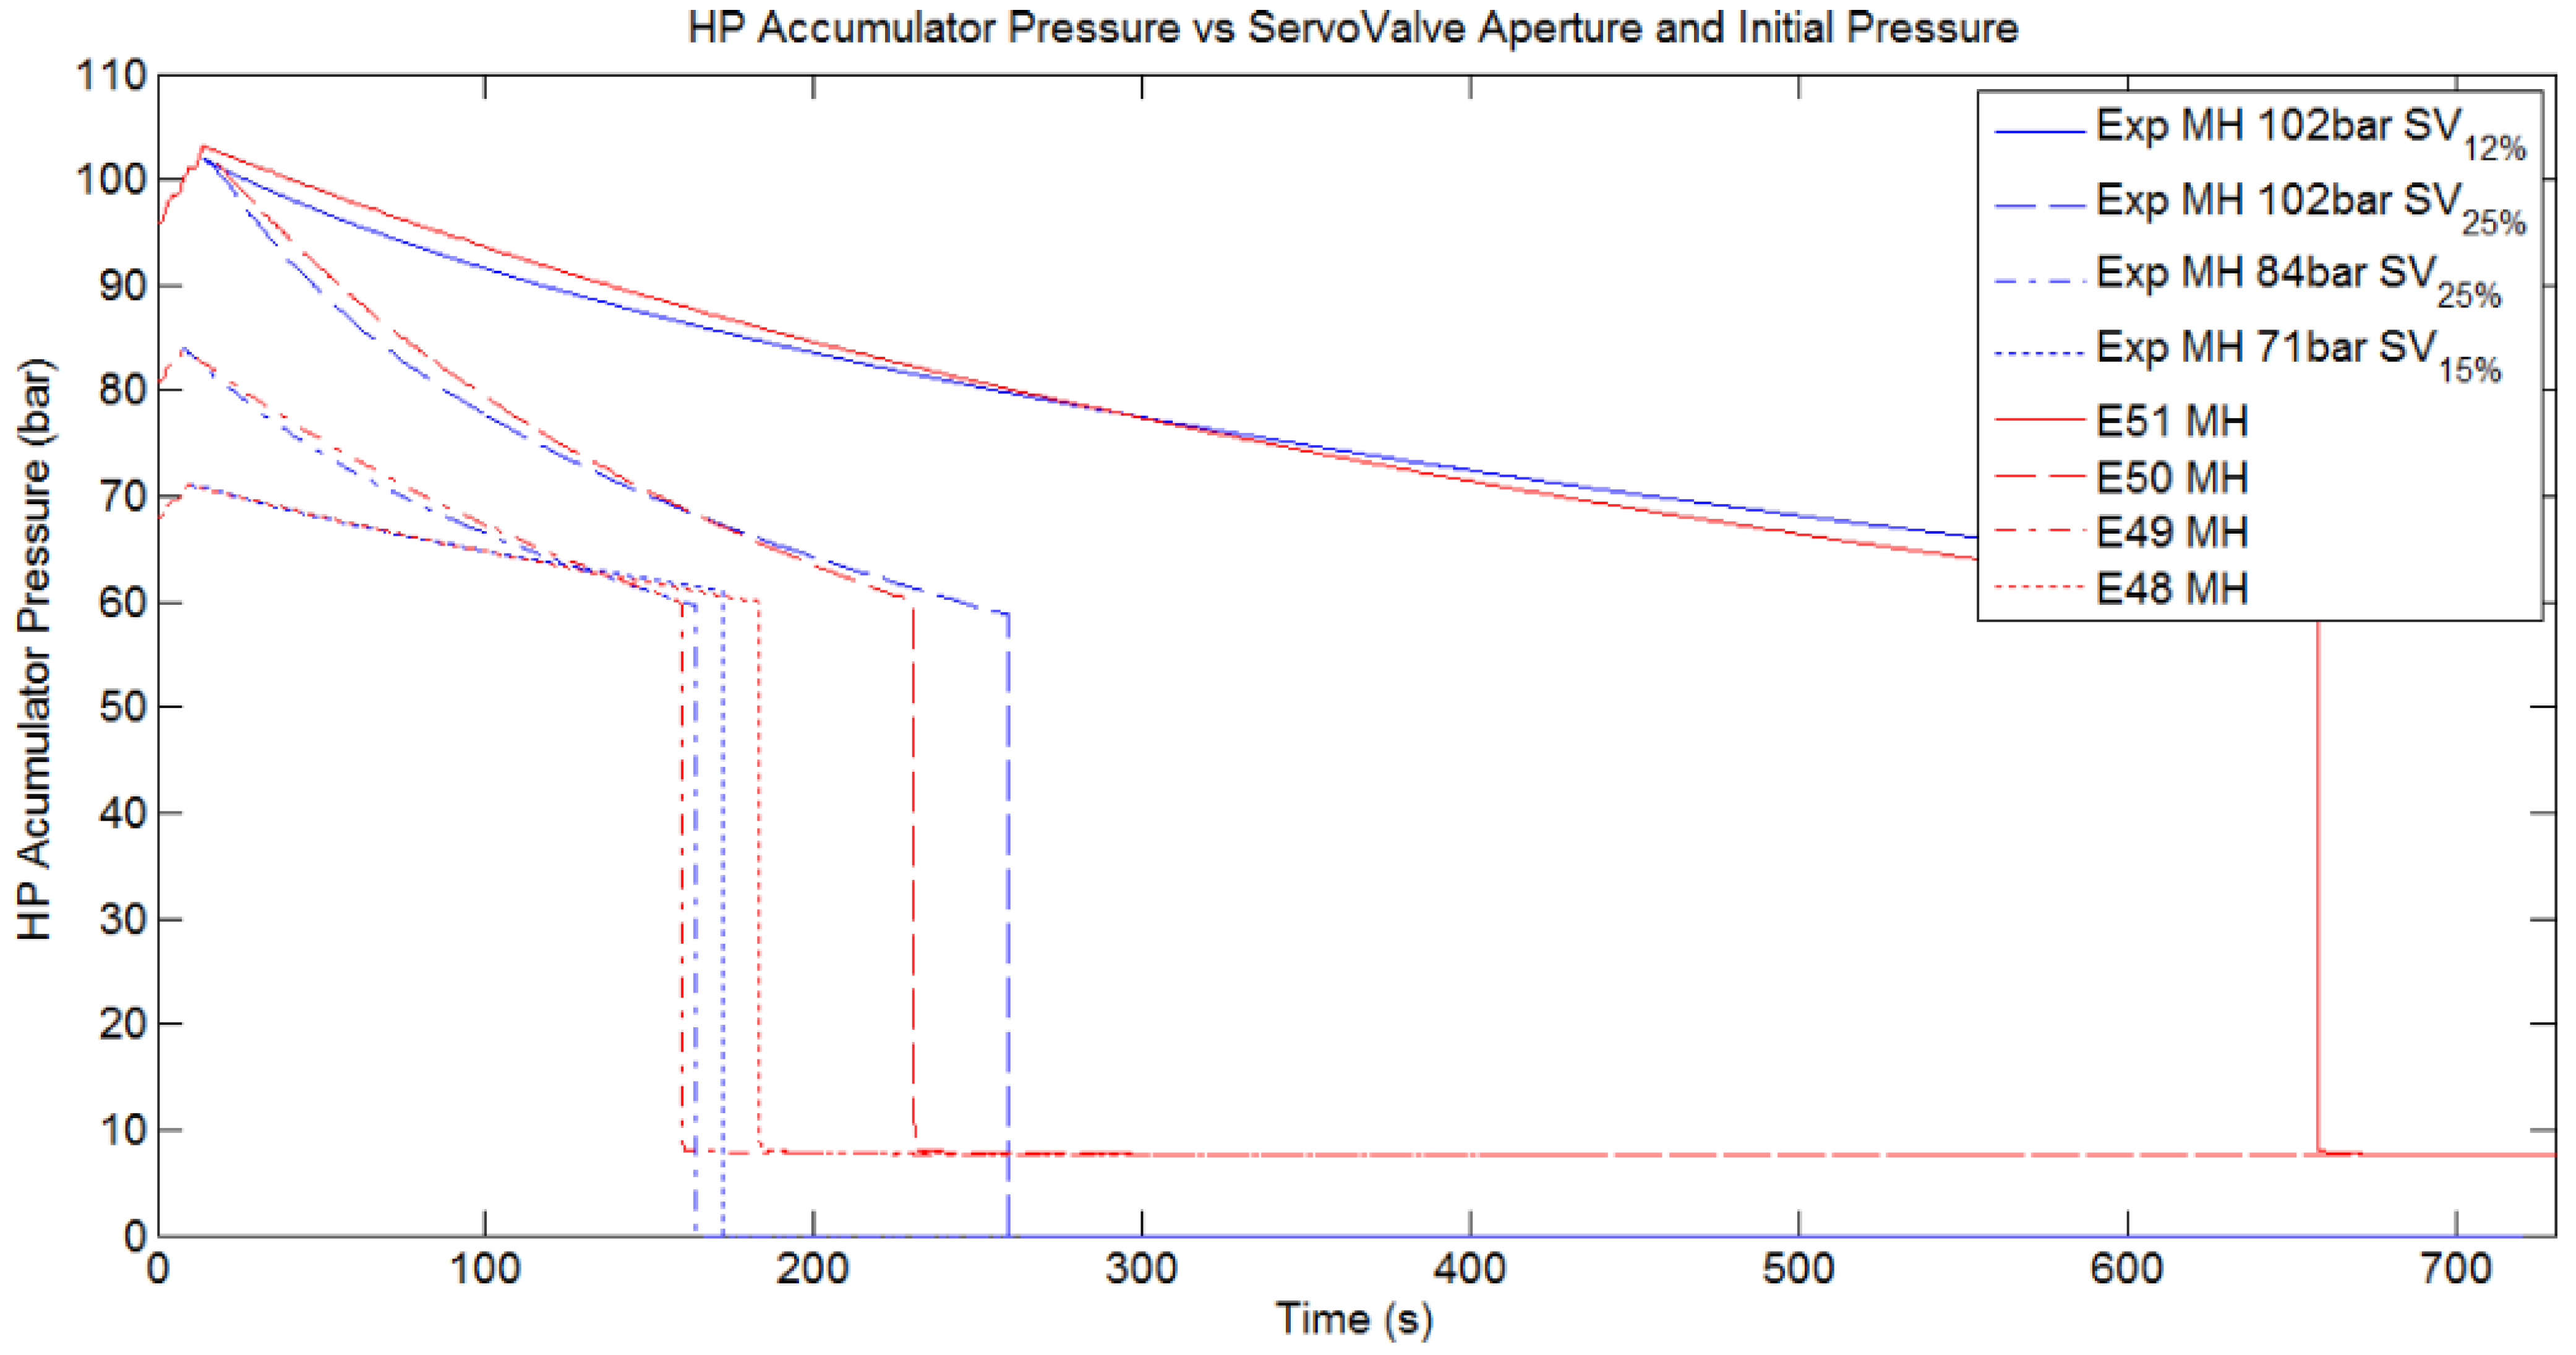
Figure 28 shows the comparison between the simulated and experimental measurements of the hydraulic motor speed (rpm), identified in red and blue respectively. The experimental tests start at different initial pressures (102, 84 and 71 bar) with the control valve opened to different aperture percentages (12%, 15% and 25%). To obtain the results in
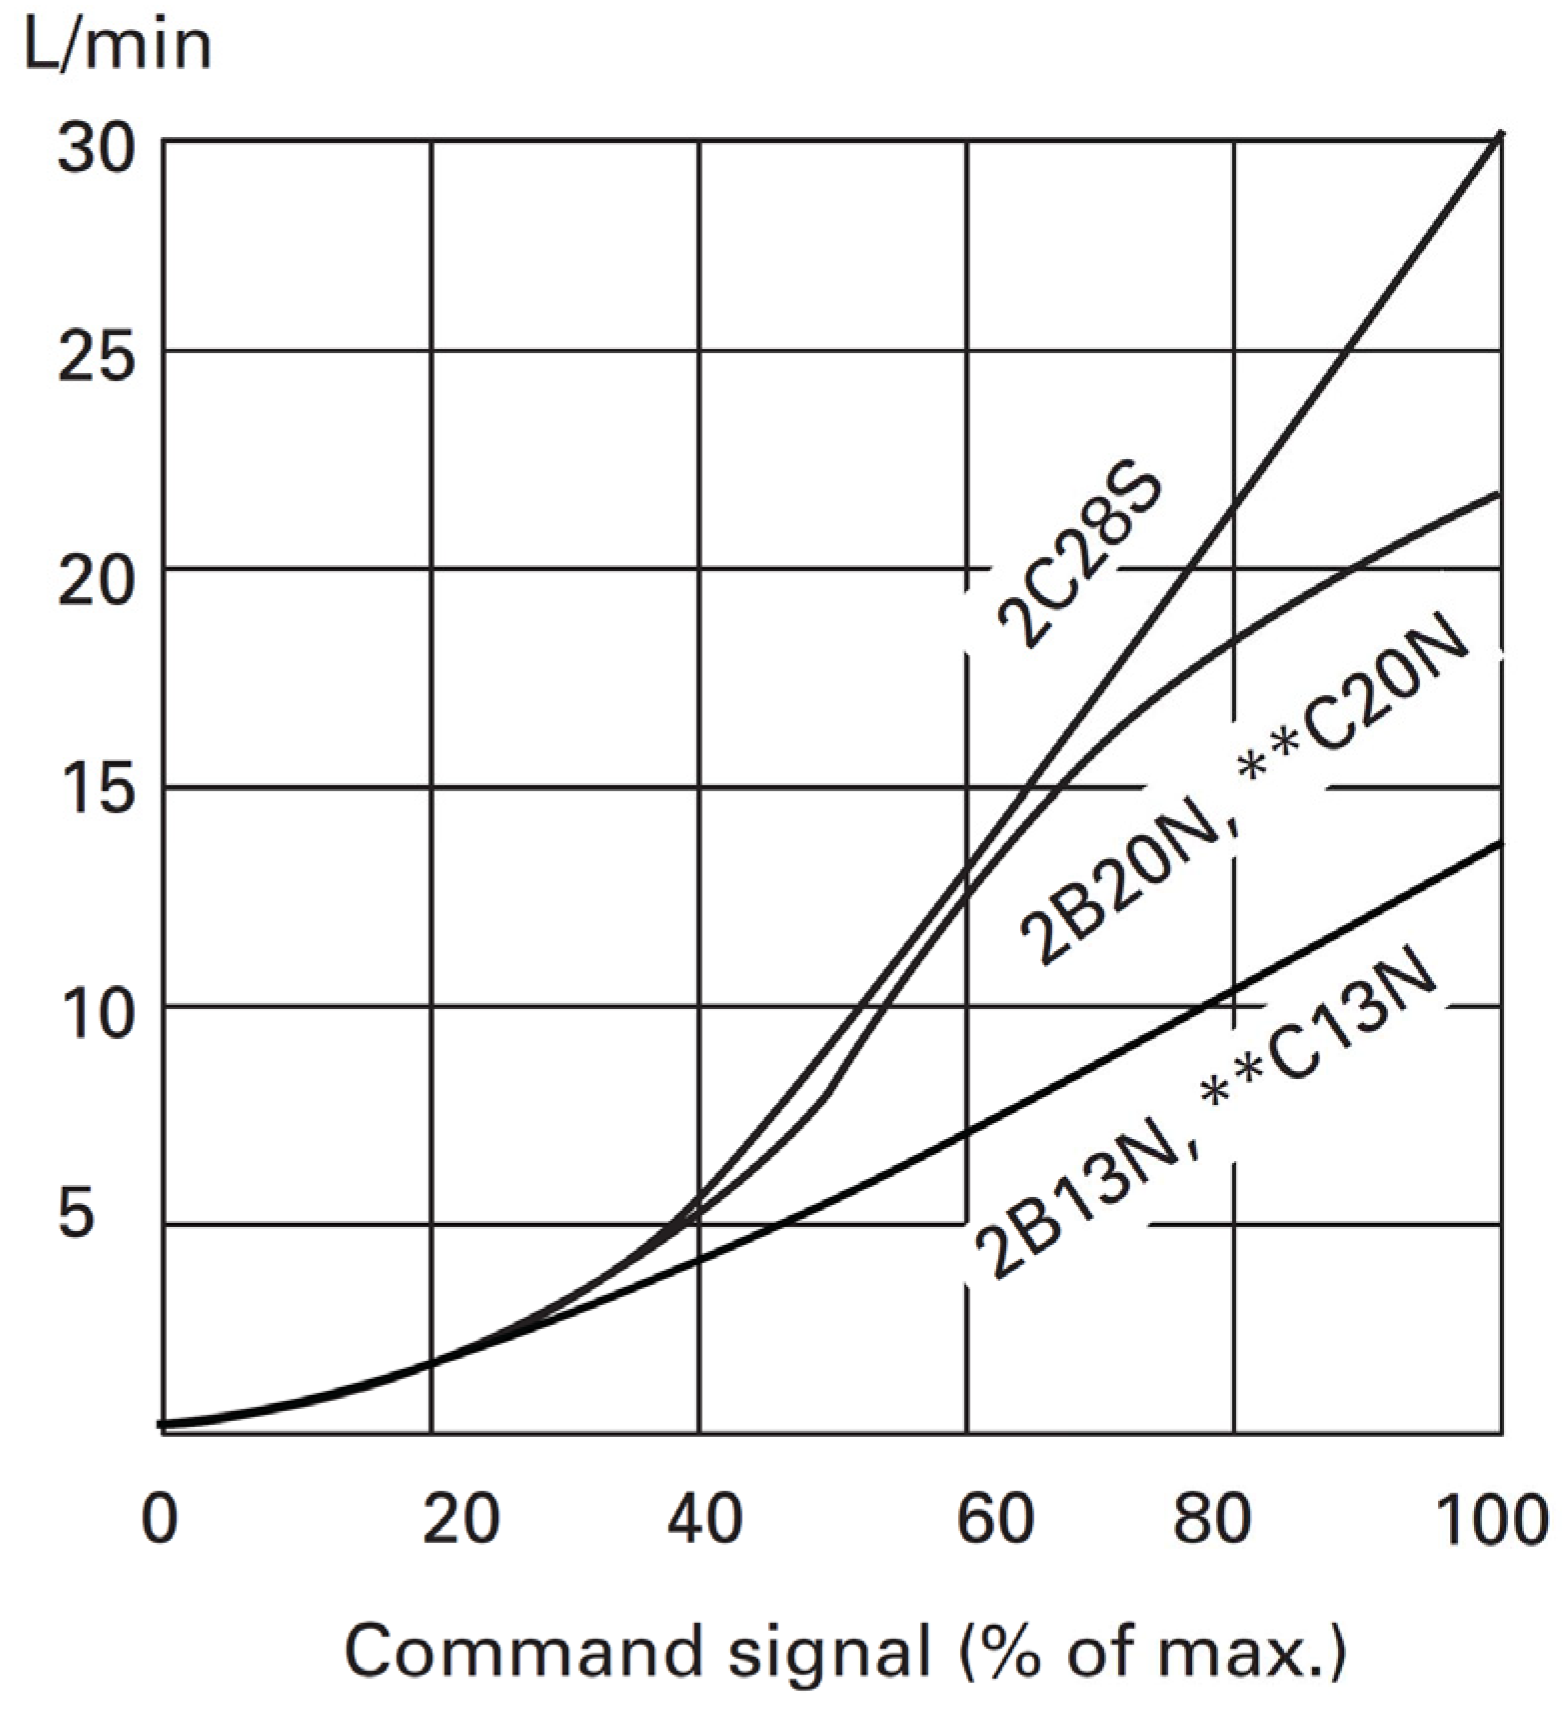
Figure 28, the control valve has been parameterized with a discharge coefficient of 0.154 and by applying the control valve area
versus control valve aperture percentages as identified in
Table 11.
Figure 28.
PTO Output. Hydraulic motor speed (rpm) comparison between simulated (red) and experimental (blue) tests.
Figure 28.
PTO Output. Hydraulic motor speed (rpm) comparison between simulated (red) and experimental (blue) tests.
Table 11.
Control valve aperture percentage versus control valve area.
Table 11.
Control valve aperture percentage versus control valve area.
| Parameter Description | Value |
|---|
| Control Valve Aperture (%) | [0,10,20,30,40,50,60,70,80,90,100] |
| Control Valve Area (mm2) | [0; 1.136; 2.756; 5.336; 8.876; 13.376; 18.836; 25.256; 32.636; 38.42; 44.18] |
Figure 28 and
Figure 29 show a good correlation between the experimental and simulated values in all of the tests, and they relate respectively to the hydraulic motor speed and the HP Accumulator pressure. However, it seems that experimental tests provide more autonomy than in the simulations. This behavior can be justified due to the method used for characterizing the control valve.
The characterization of the control valve has been performed assuming that the control valve allows a specific flow independent of the pressure drop in the control valve. The flow through the control valve also depends on the pressure drop between the inlet and outlet of the valve ports.
Figure 29.
PTO Output. HP Accumulator pressure (bar) comparison between simulated (red) and experimental (blue) tests.
Figure 29.
PTO Output. HP Accumulator pressure (bar) comparison between simulated (red) and experimental (blue) tests.
A better parameterization for these kind of control valves can be performed using the methods specified by Tchkalov [
52]. The transient response of the actuator can be optimized using this method. In addition, it is also possible to include the frequency response characteristics of the valve. However, all these methods are based on the application of optimization procedures with functions from the Optimization Toolbox, which were not available to the author.
