
Control-Informed Geometric Optimization of Wave Energy Converters: The Impact of Device Motion and Force Constraints


Abstract
:1. Introduction
2. Energy from Sea Waves
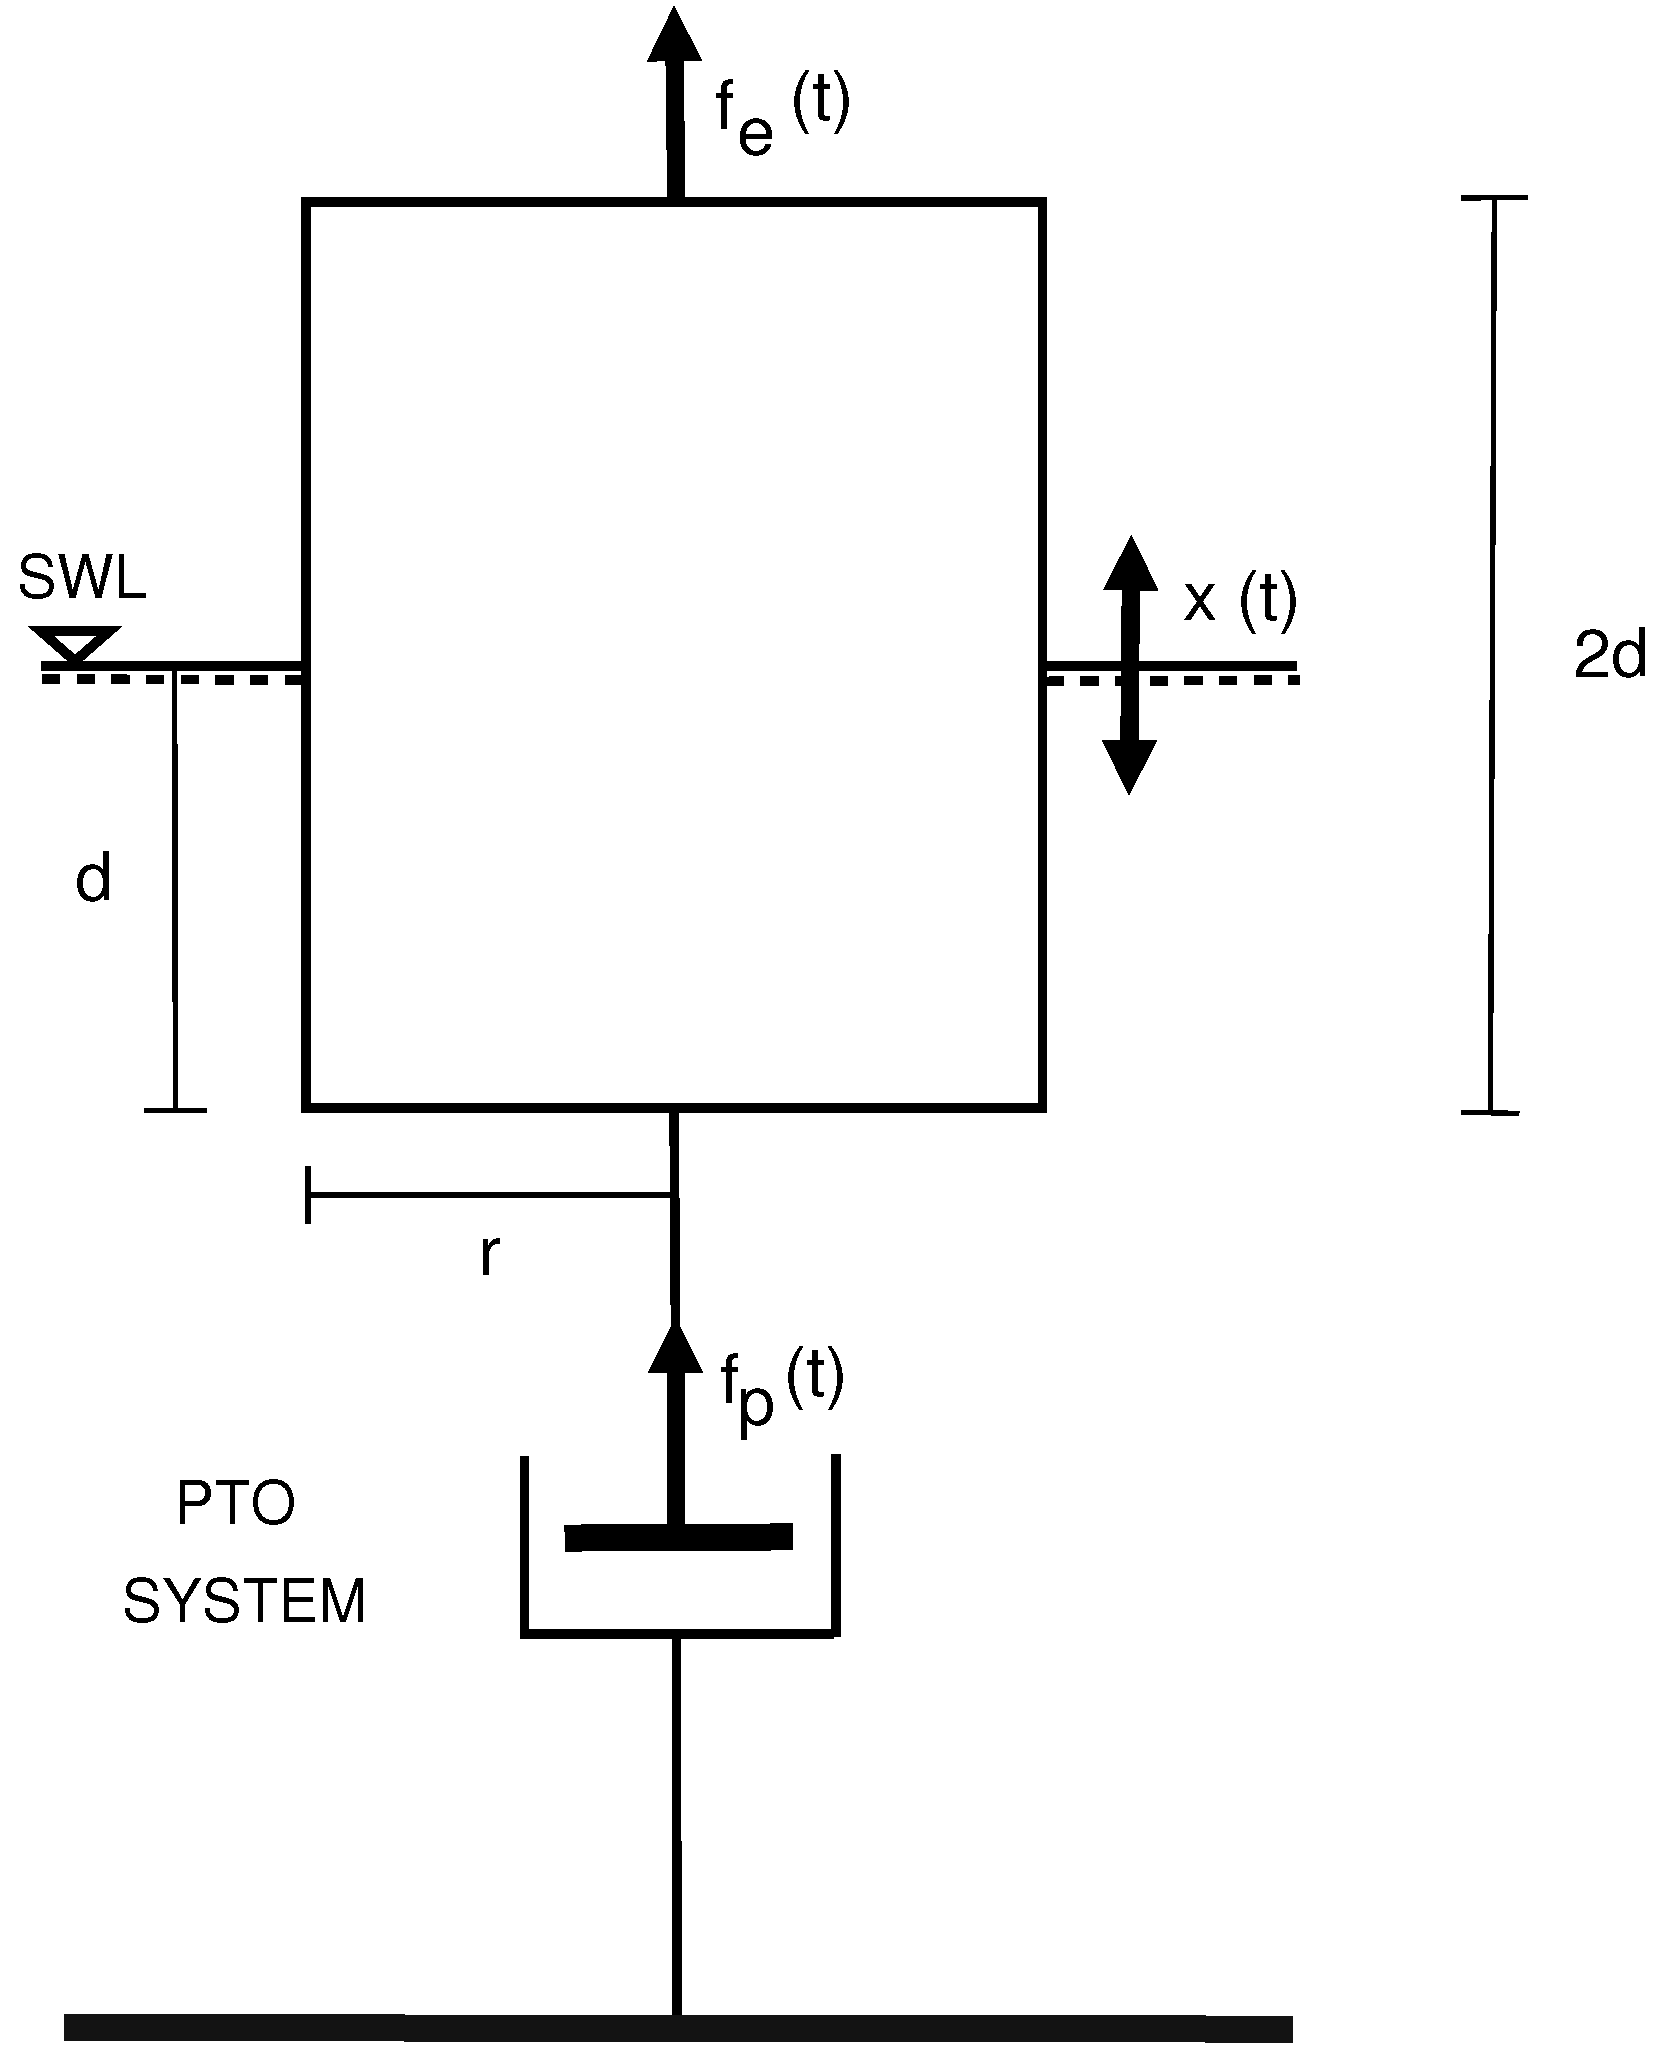
2.1. Mathematical Model of Oscillating Bodies

2.2. Upper Bounds for Wave Power Absorption
3. Control-Informed Geometry Optimization
3.1. Control Methods
3.1.1. Passive Control
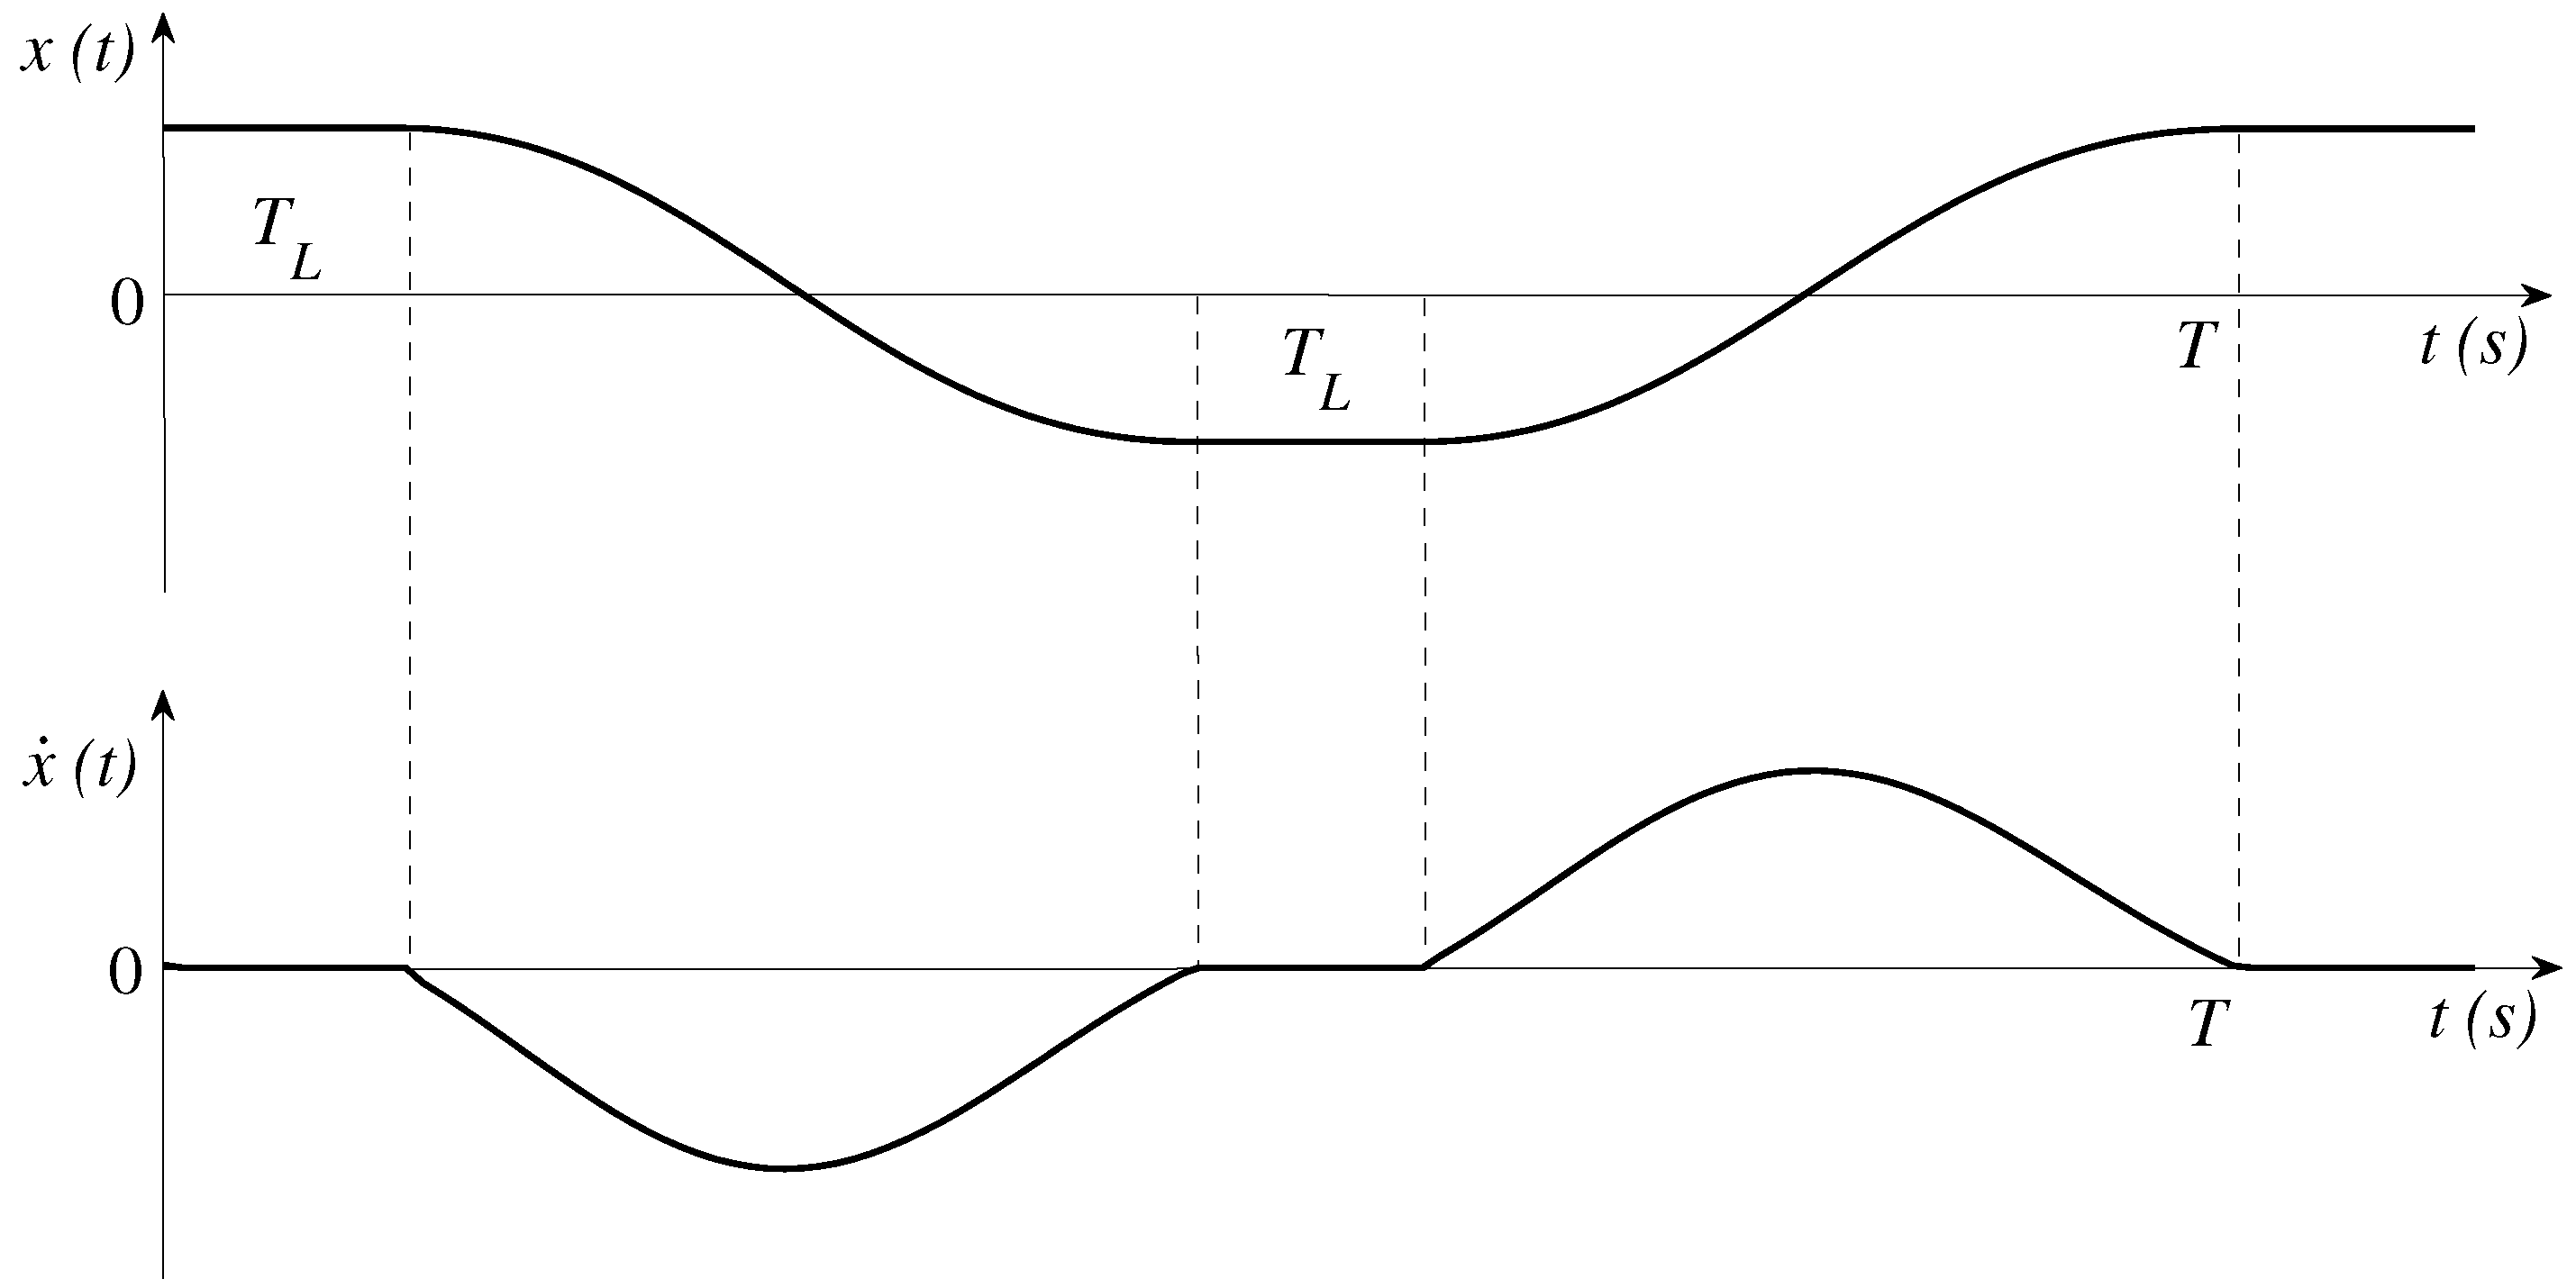
3.1.2. Latching Control
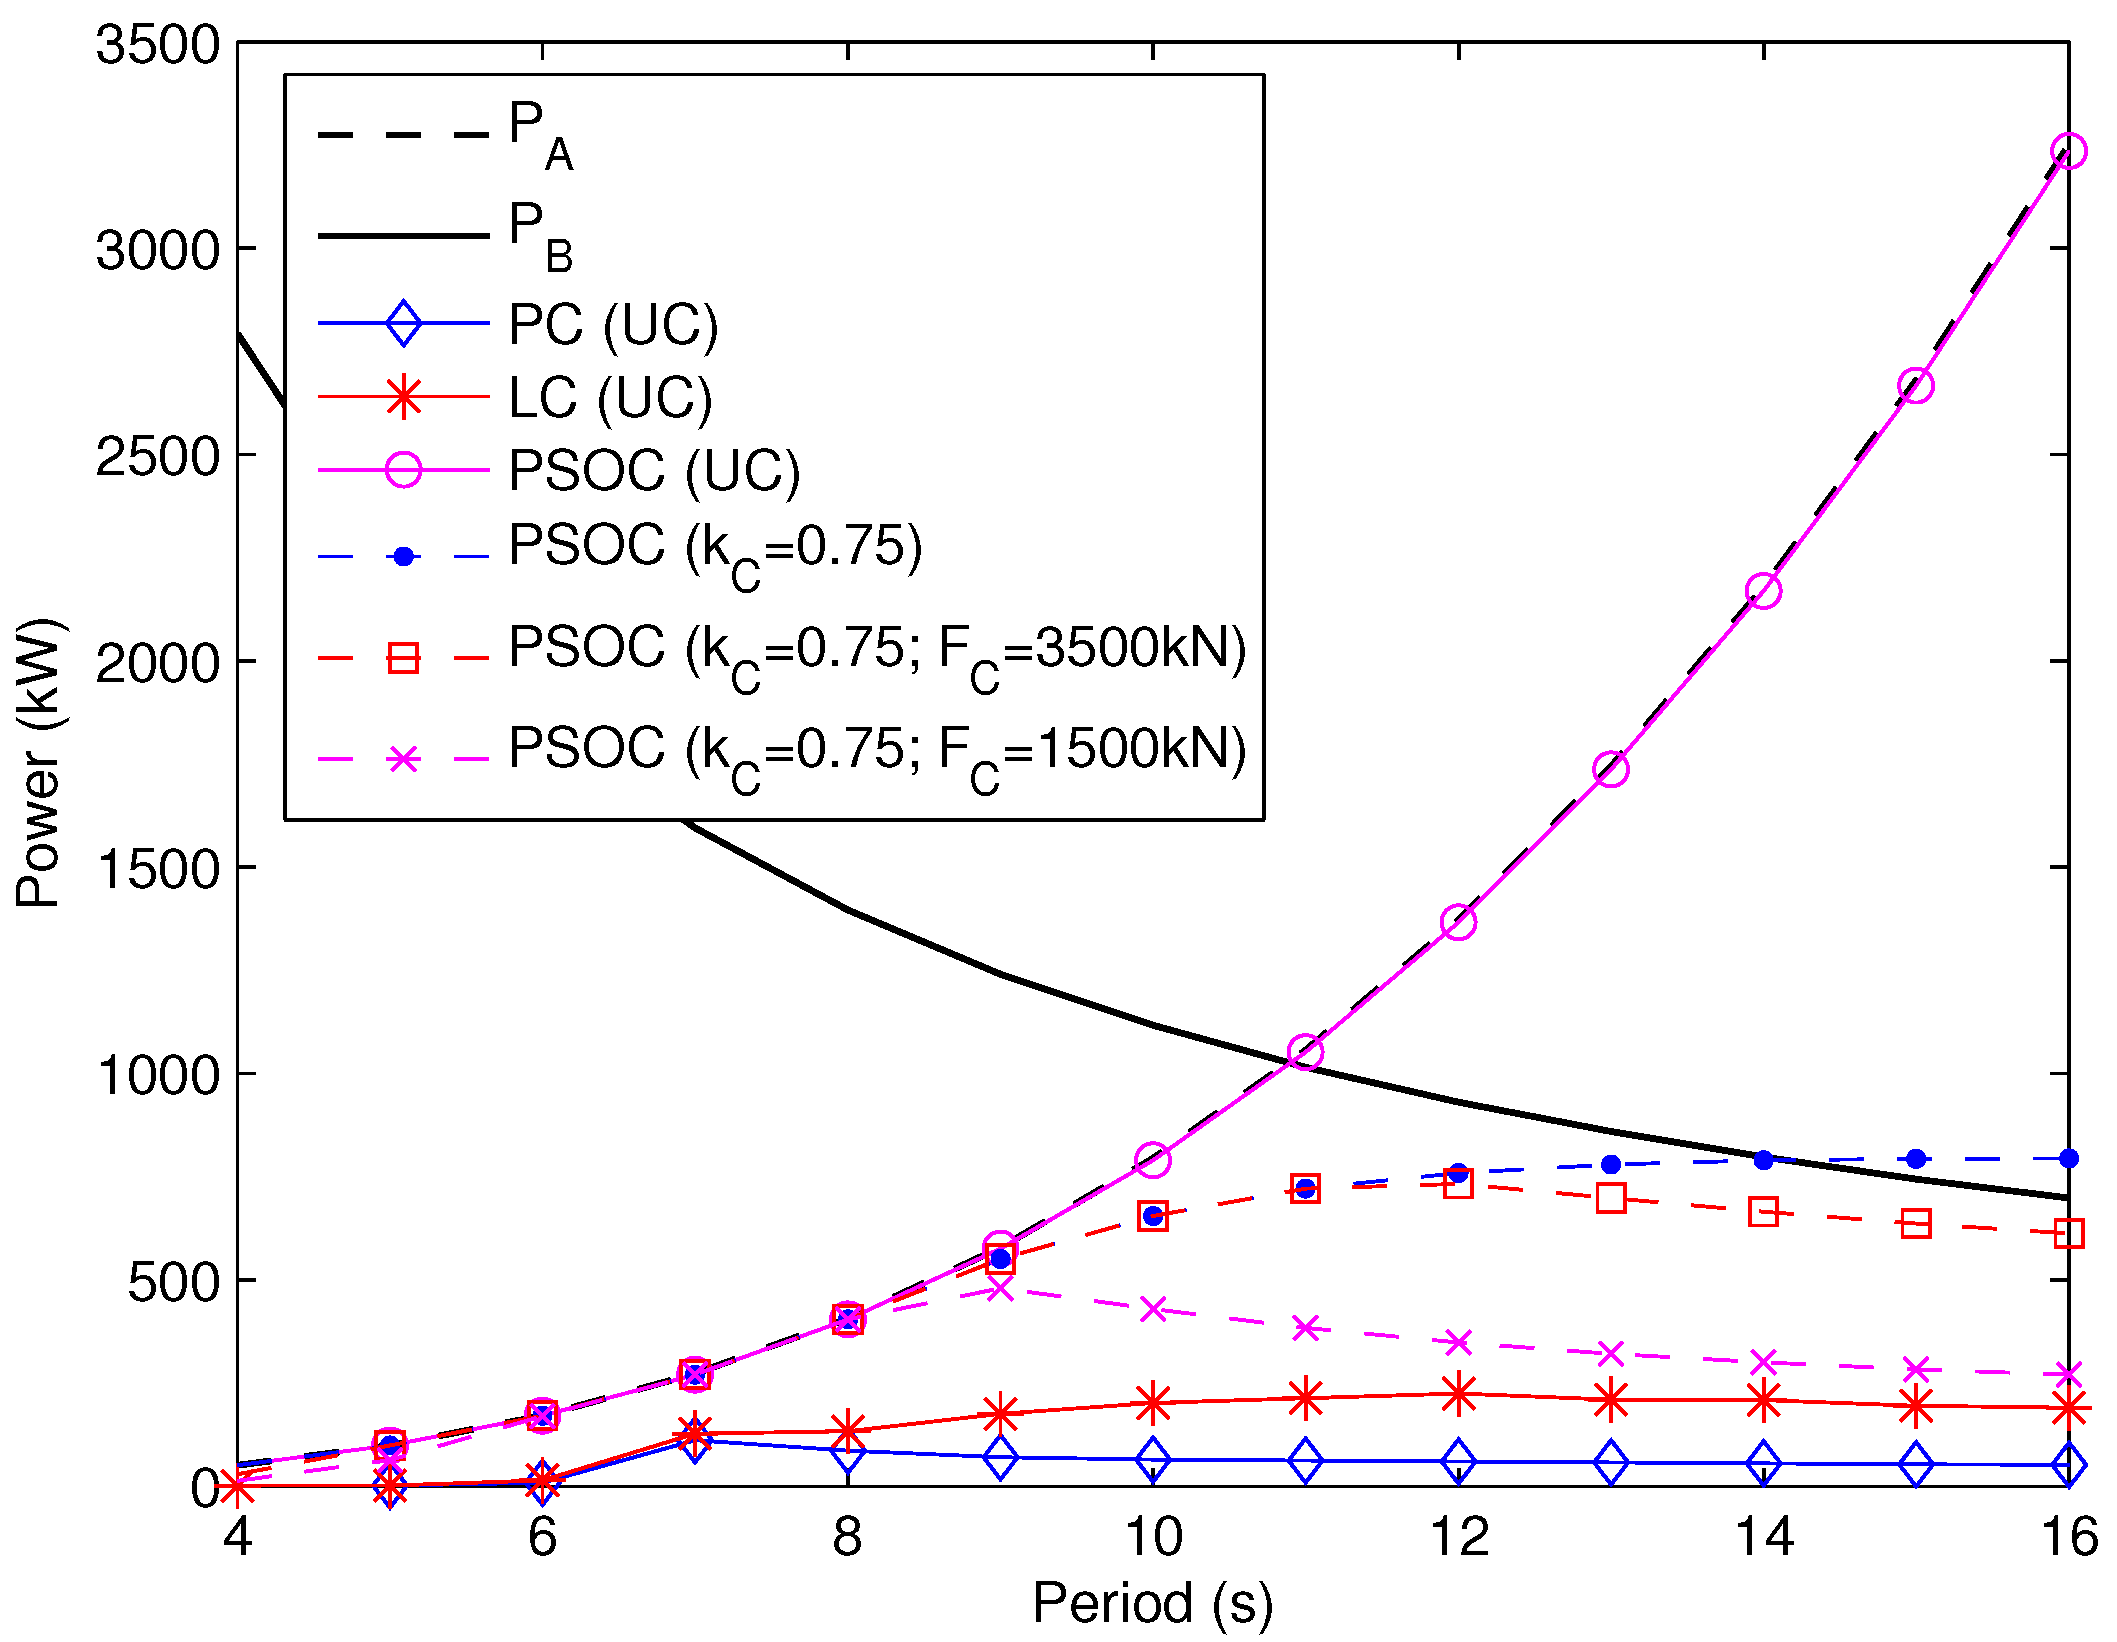
3.1.3. Pseudo-Spectral Optimal Control
4. Simulations Results
4.1. Simulation Parameters
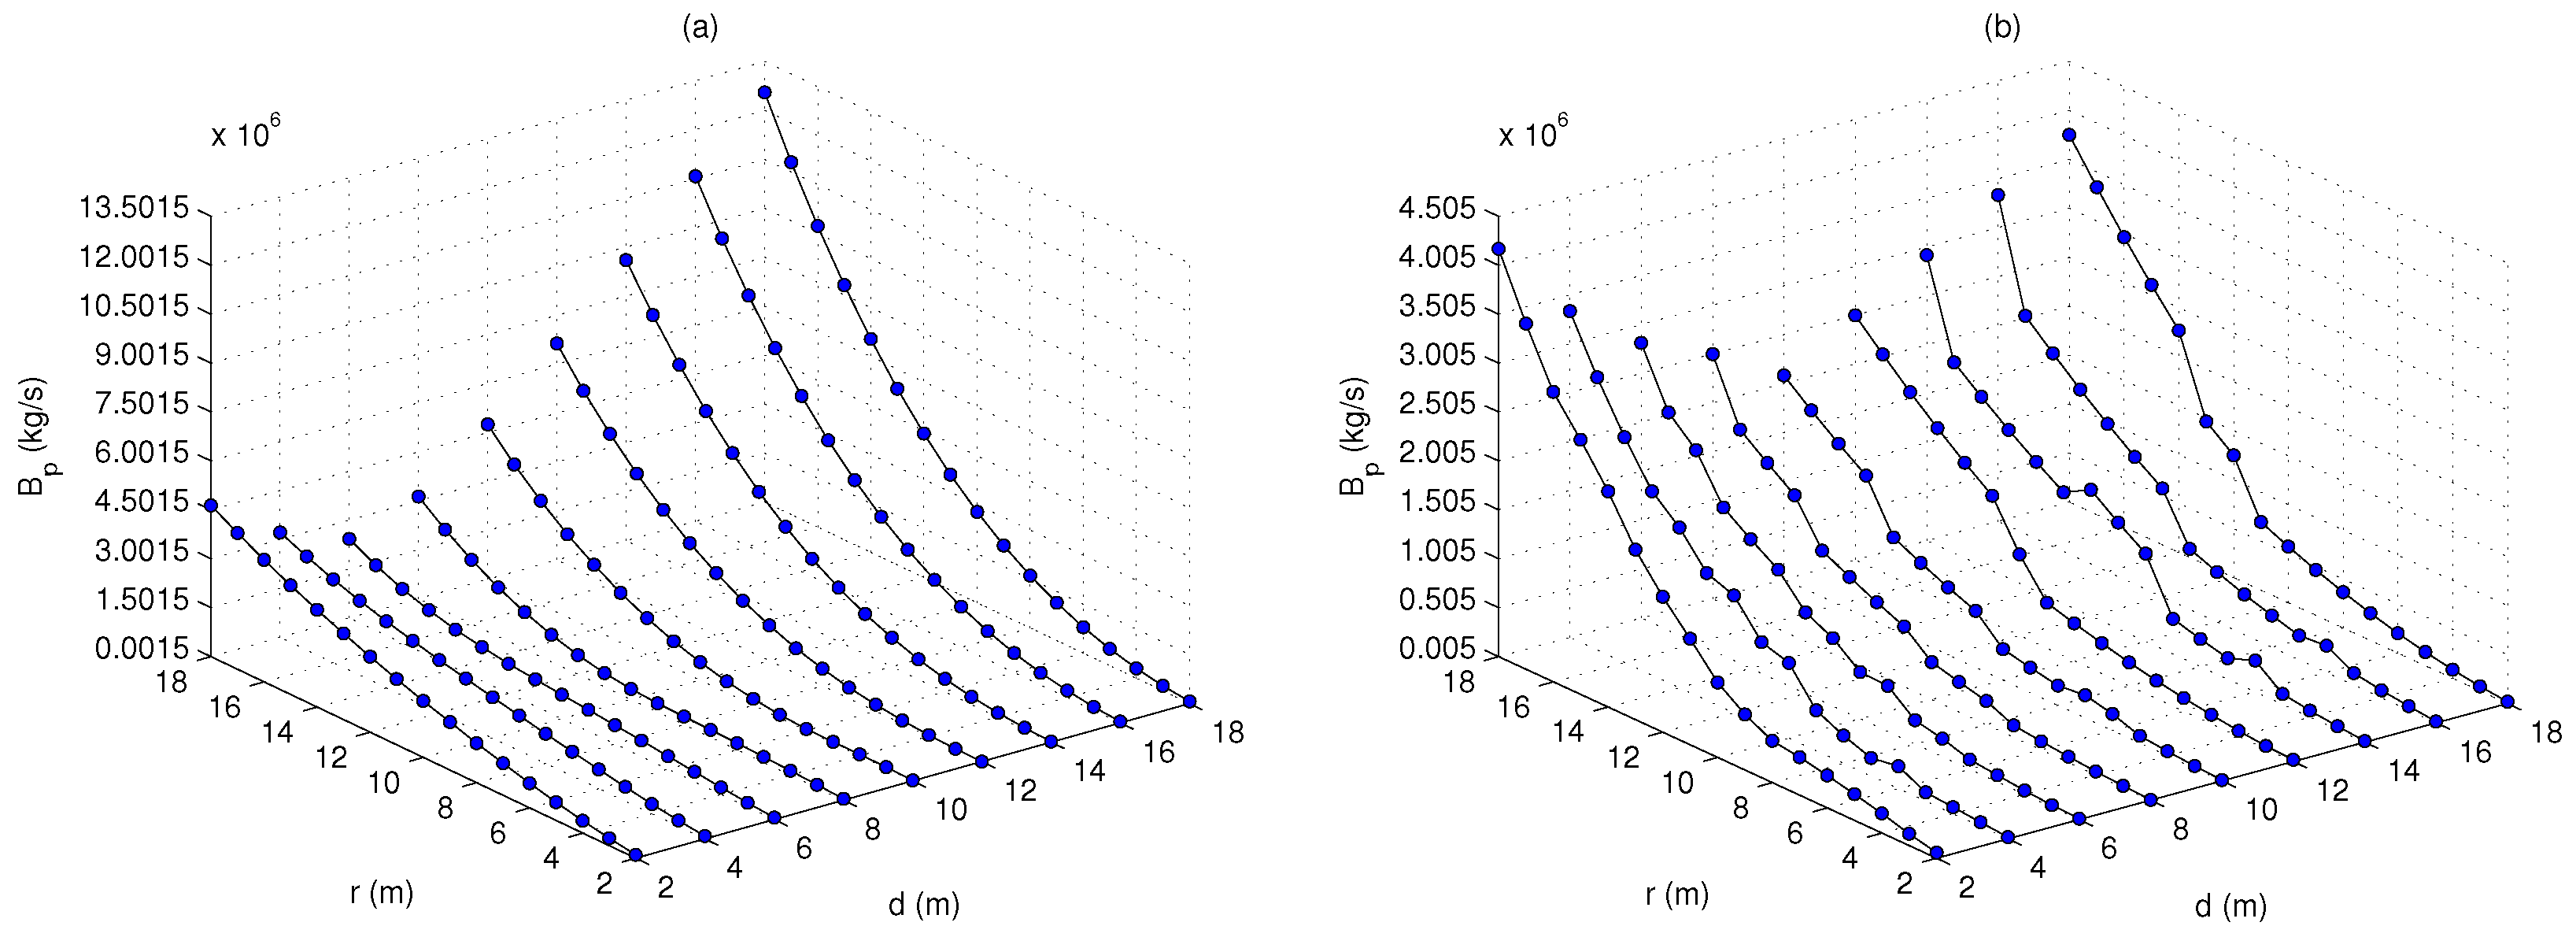
4.1.1. Passive Control and Latching Control Parameters

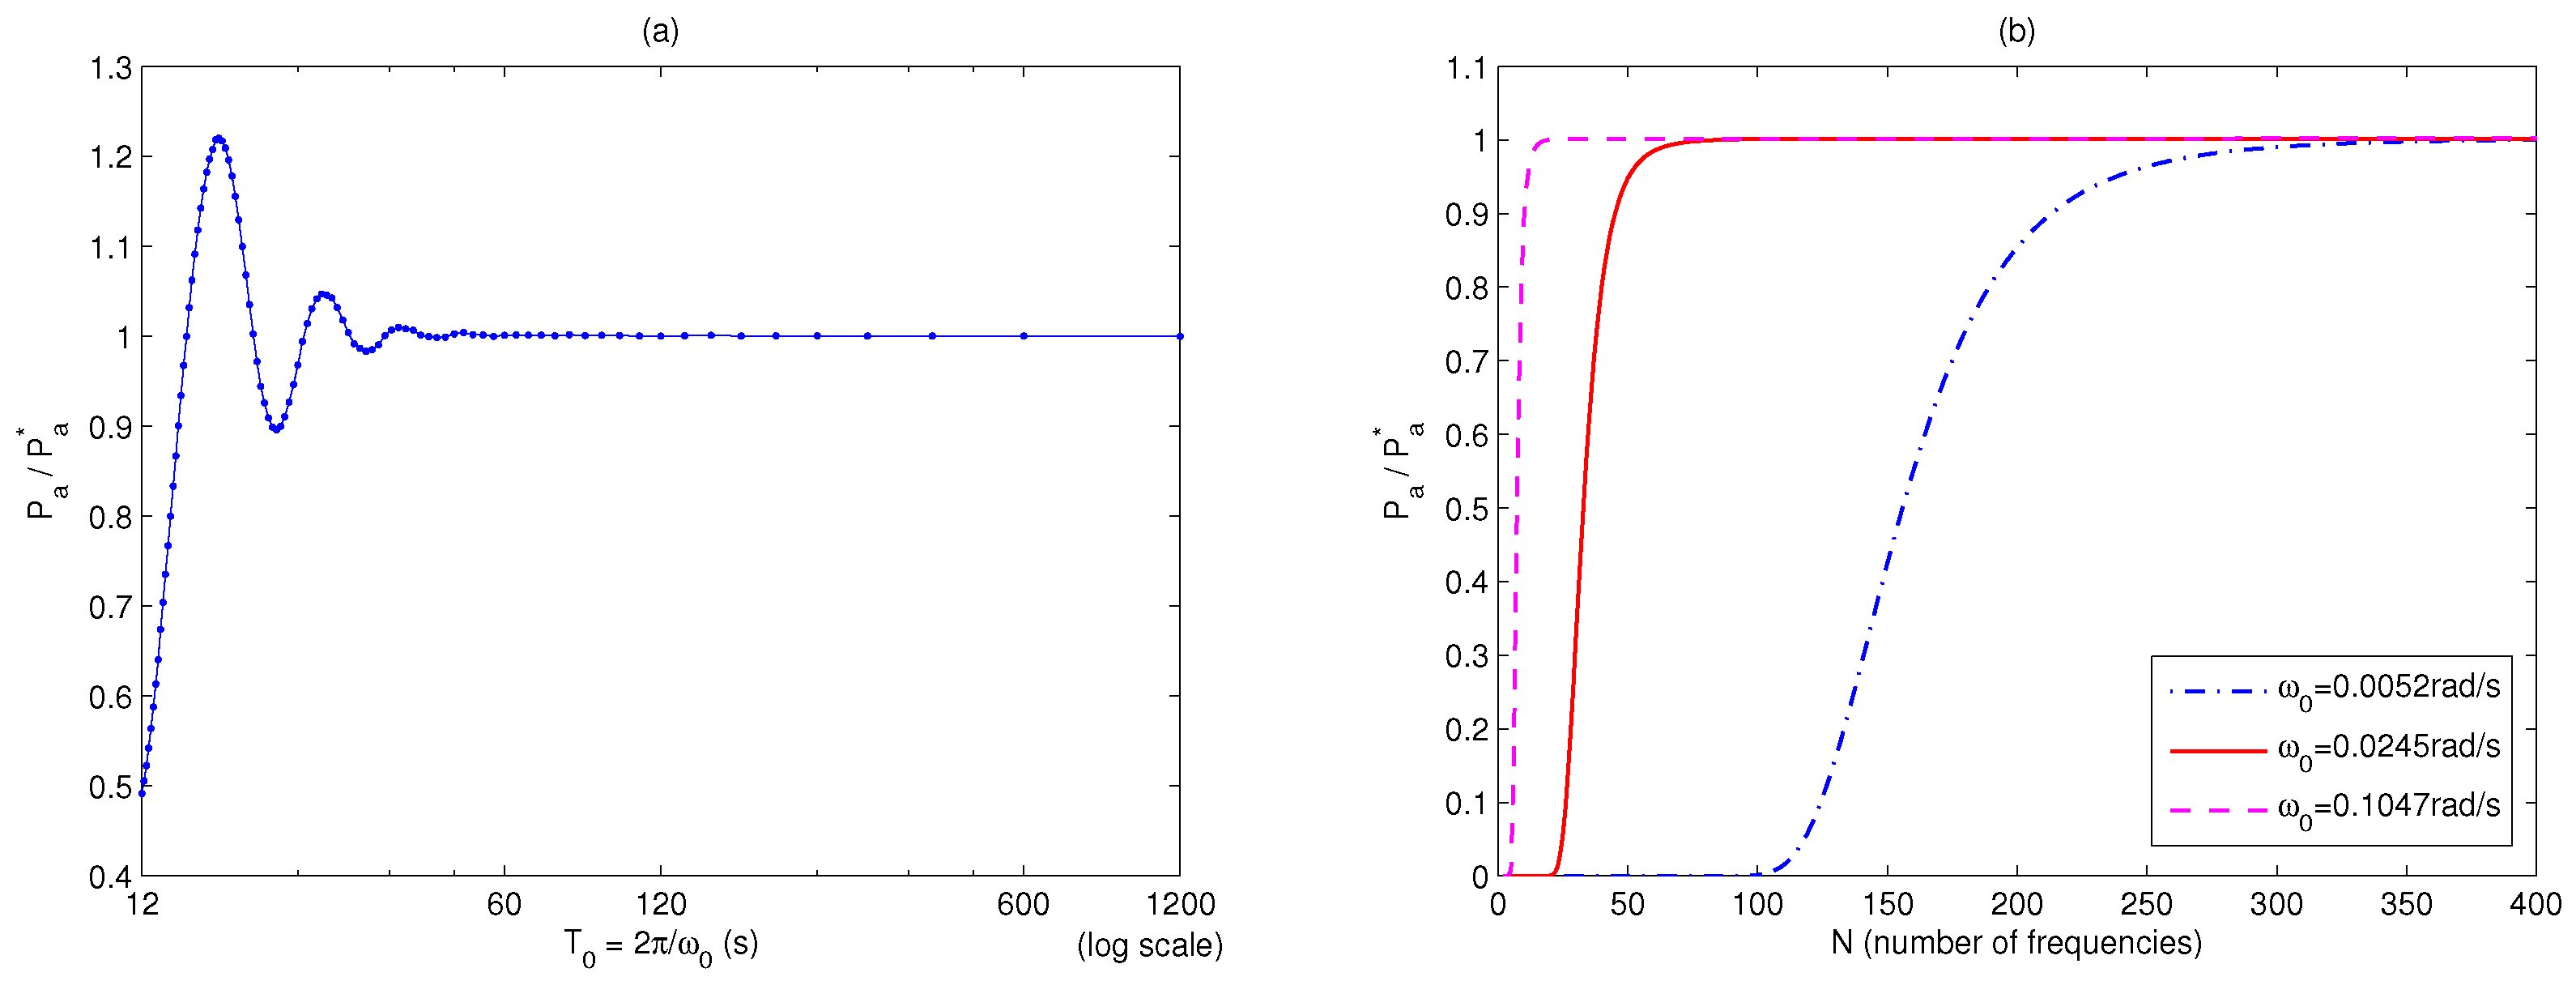
4.1.2. Pseudo-Spectral Optimal Control Parameters
4.1.3. Budal Diagram

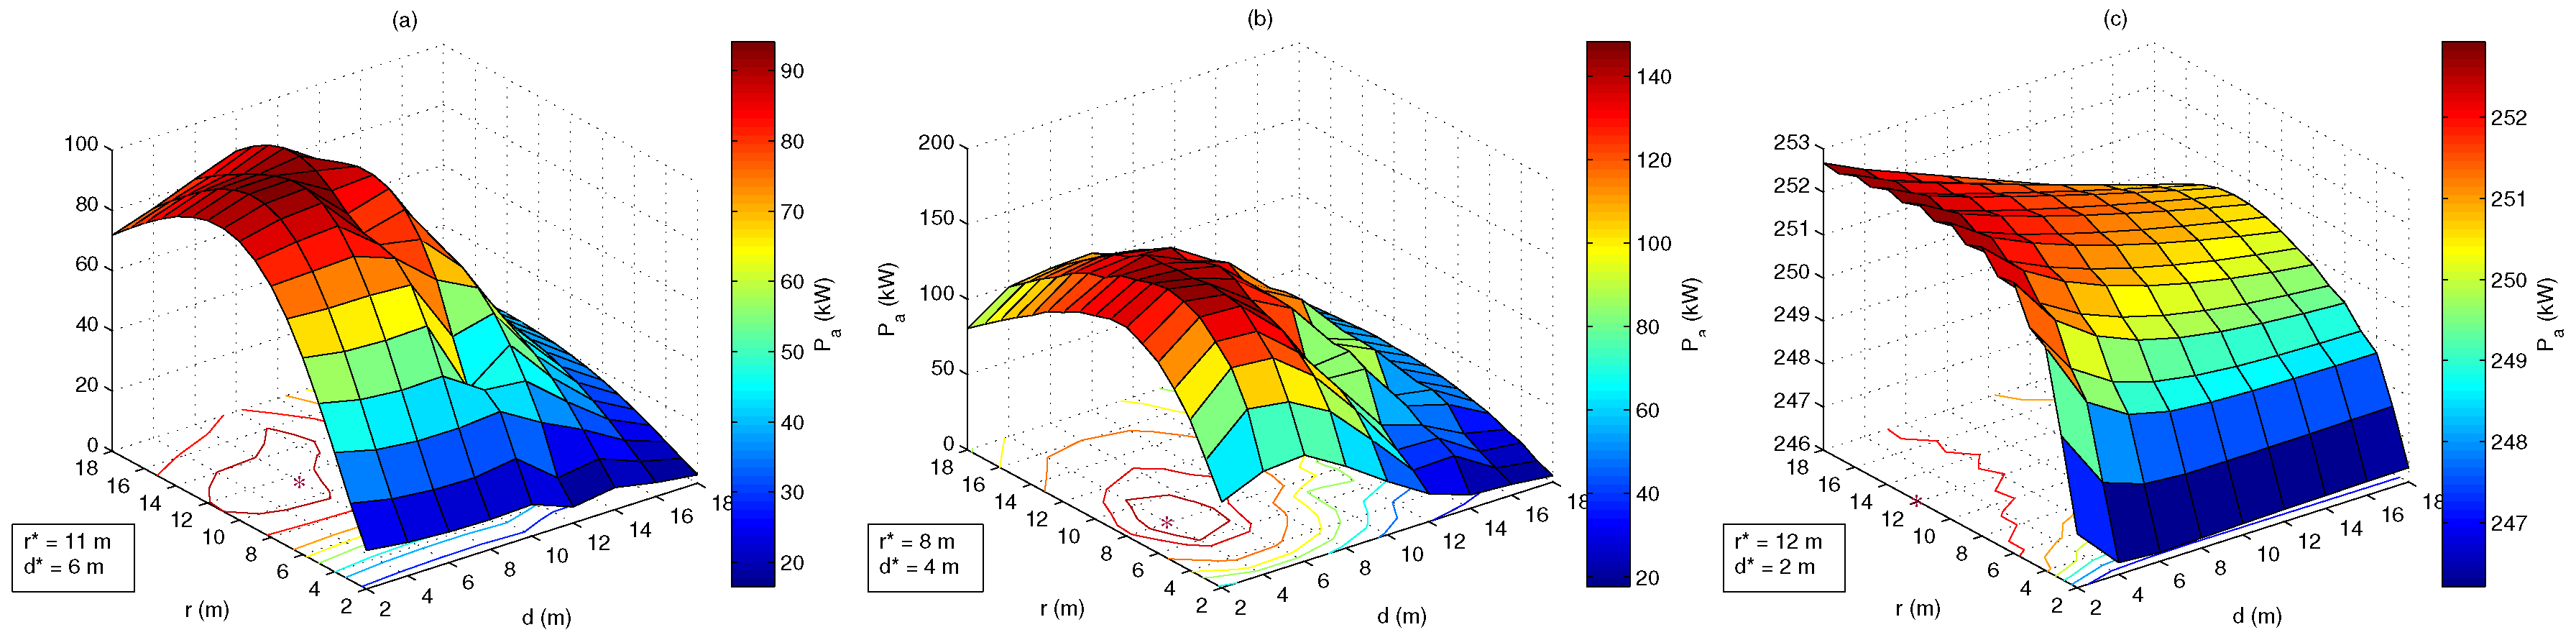
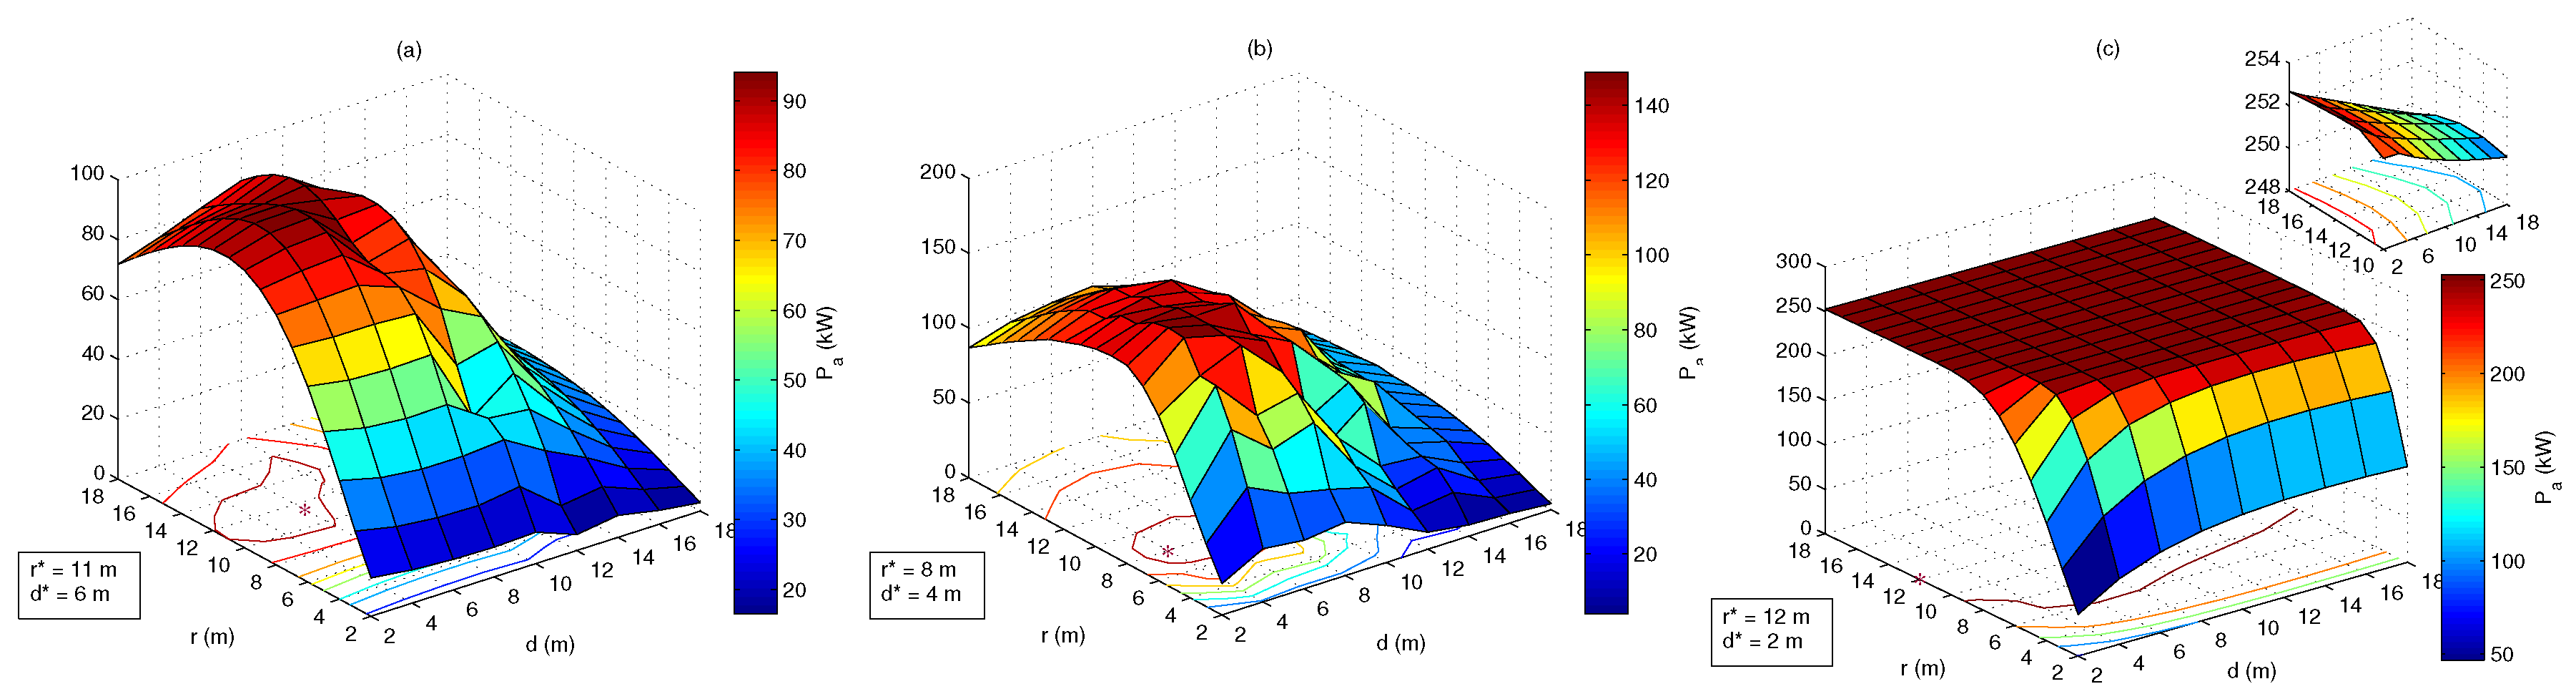
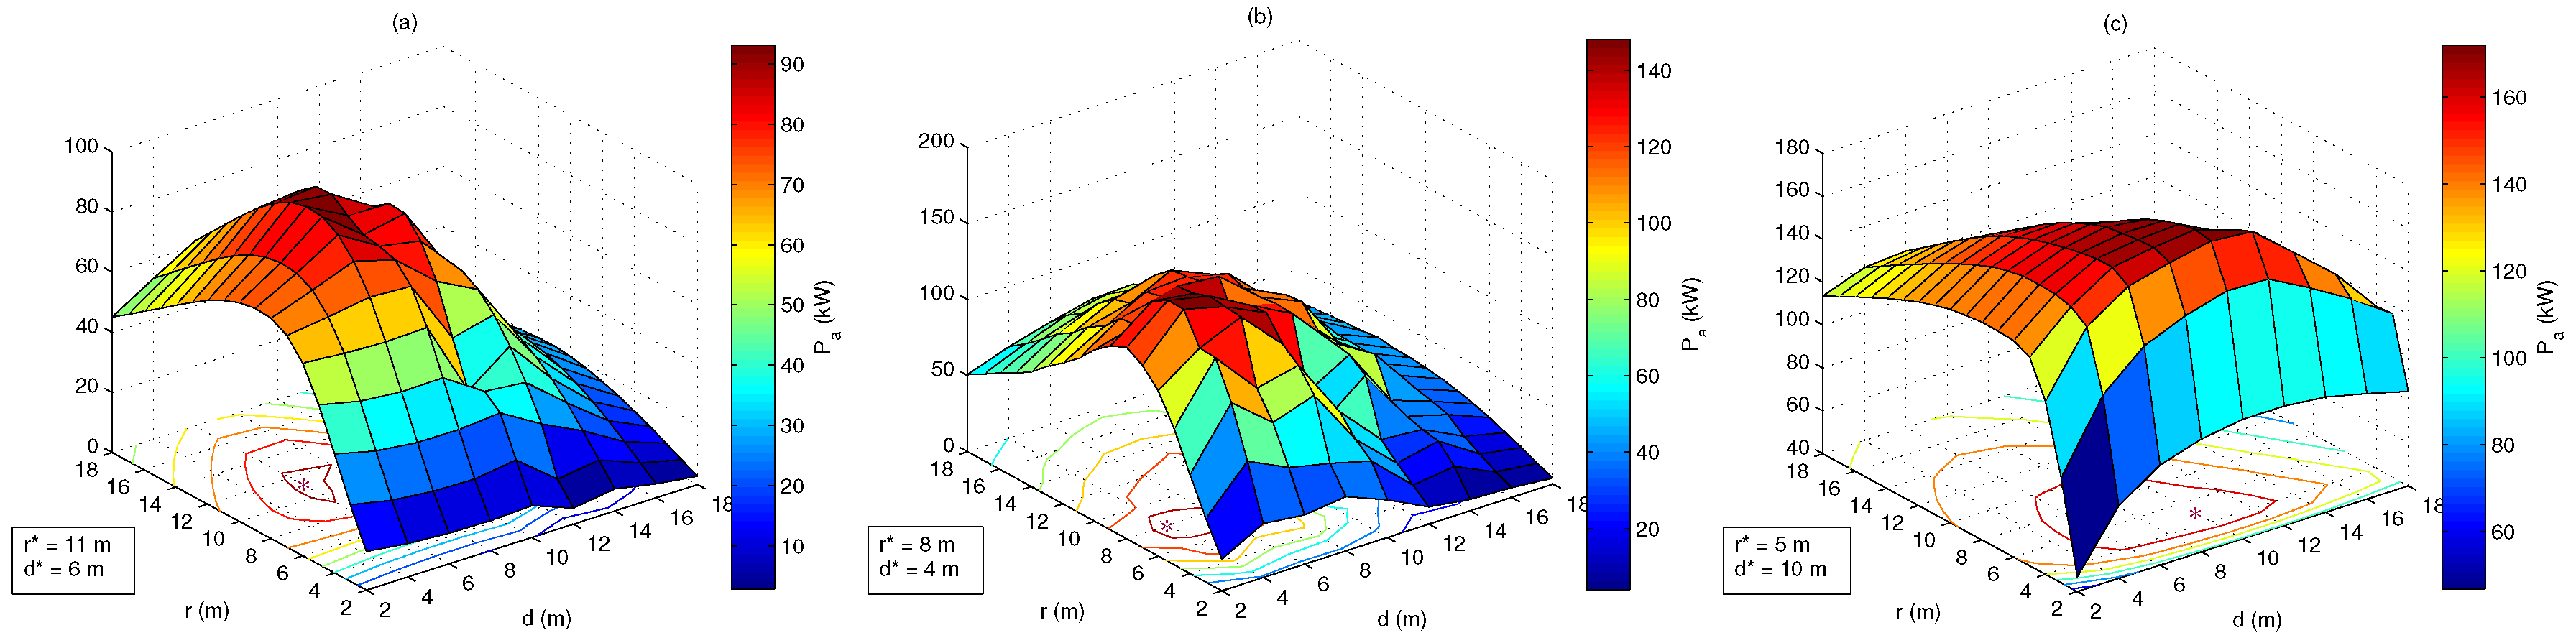
4.2. Optimal Geometries


| PC | LC | PSOC | |||||||||||
|---|---|---|---|---|---|---|---|---|---|---|---|---|---|
| Geometry | Geometry | Geometry | |||||||||||
| NC | NC | A | 11 | 6 | 7.06 | B | 8 | 4 | 5.91 | C | 12 | 2 | 5.78 |
| 0.75 | 3500 | 11 | 6 | 7.06 | 8 | 4 | 5.91 | 12 | 2 | 5.78 | |||
| 0.75 | 1500 | 11 | 6 | 7.06 | 8 | 4 | 5.91 | D | 7 | 6 | 6.43 | ||
| 0.75 | 500 | 11 | 6 | 7.06 | 8 | 4 | 5.91 | E | 5 | 10 | 7.32 | ||
| 0.75 | 250 | F | 9 | 8 | 7.37 | G | 6 | 6 | 6.27 | H | 4 | 10 | 7.16 |
| 0.75 | 125 | I | 8 | 8 | 7.22 | J | 5 | 6 | 6.08 | K | 3 | 12 | 7.55 |

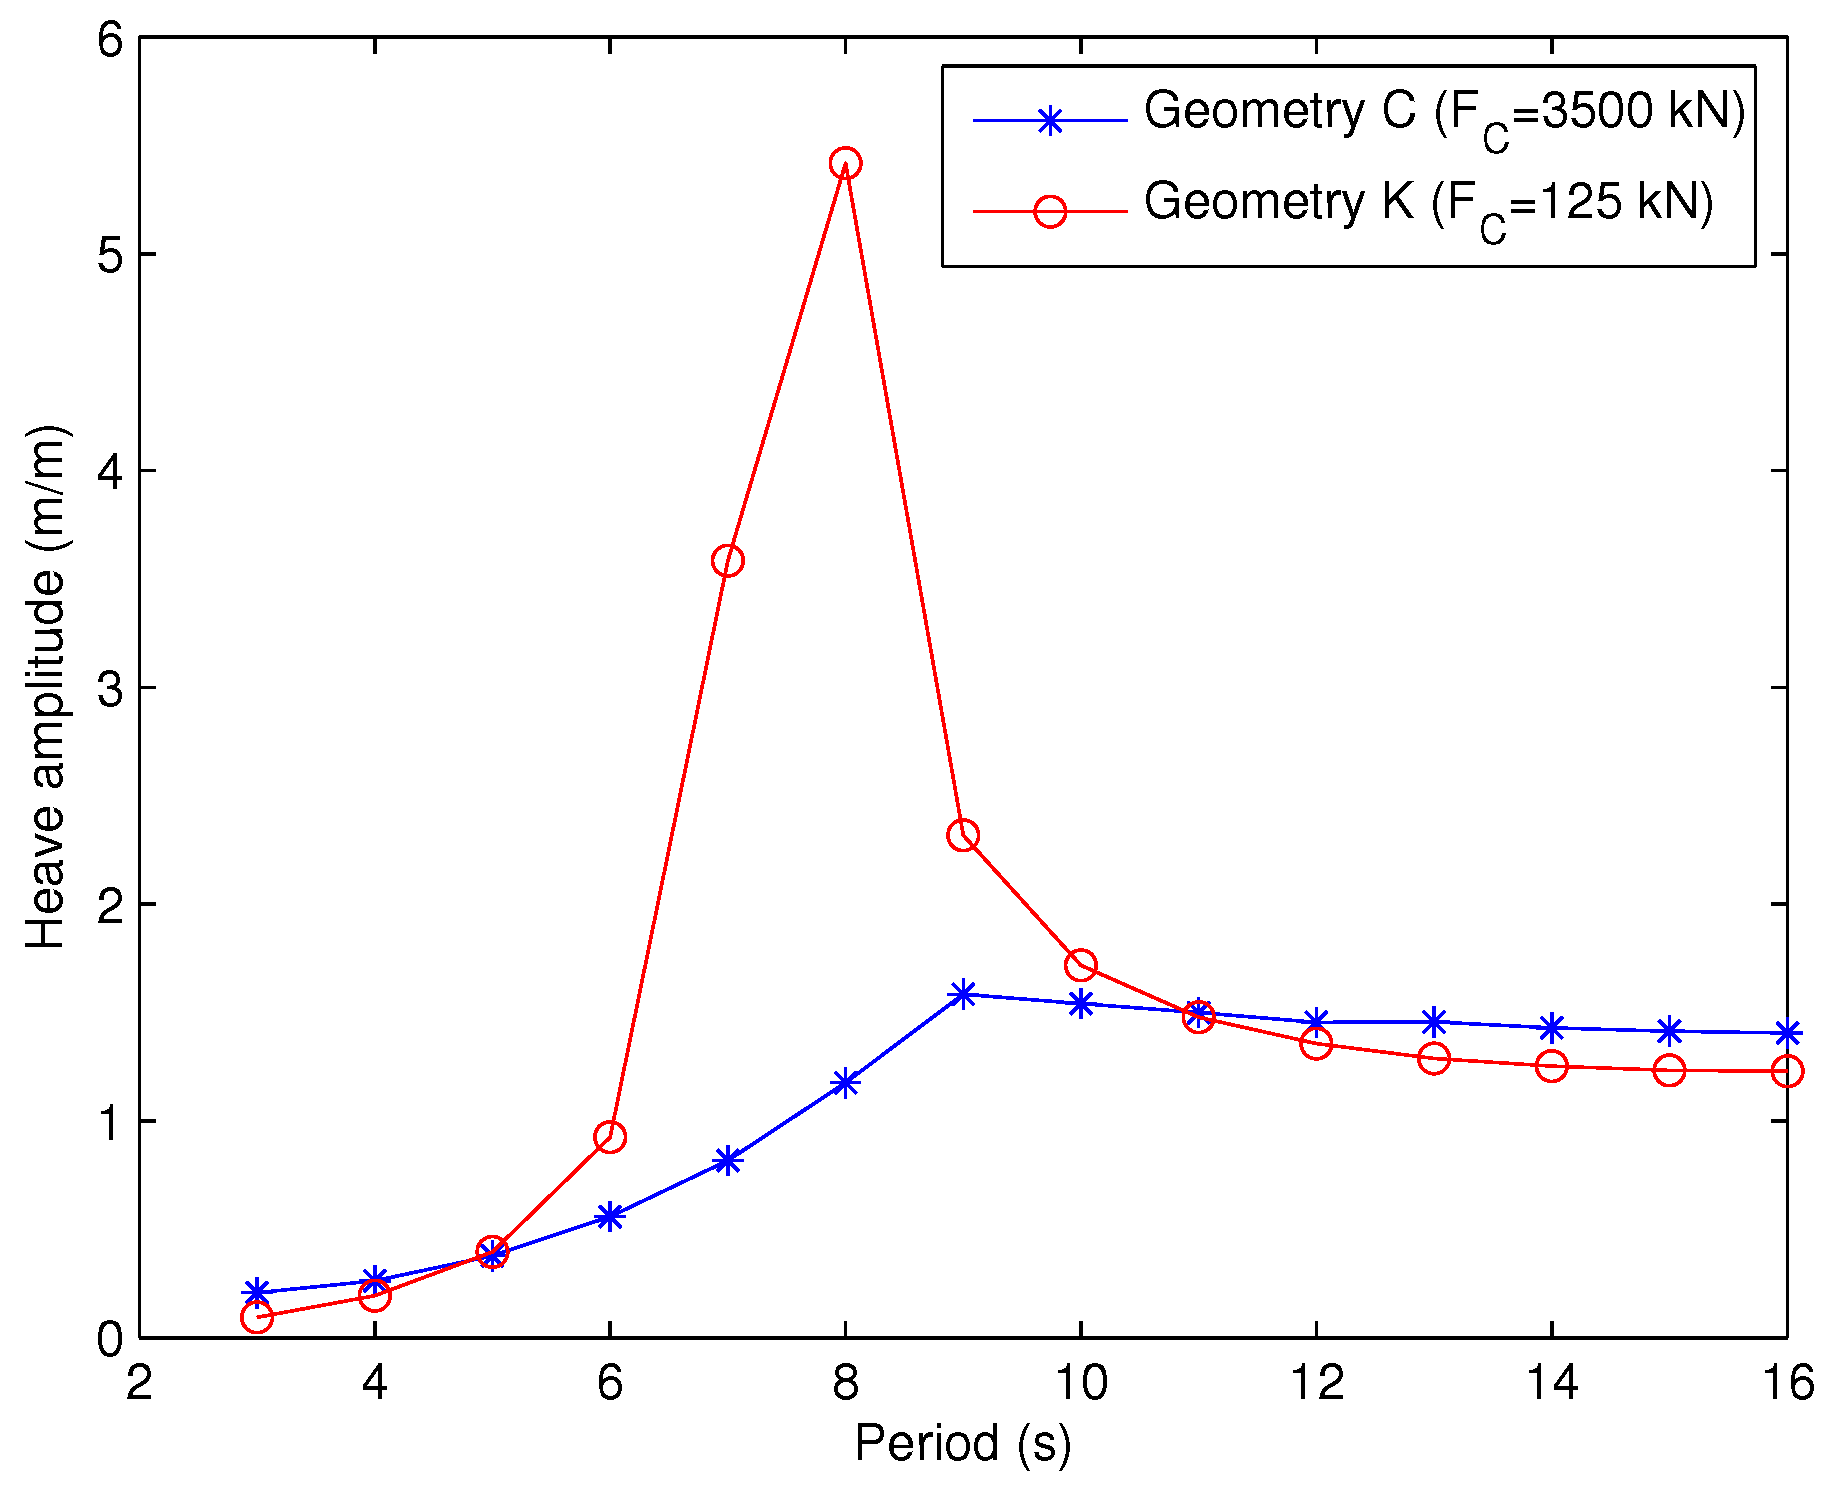
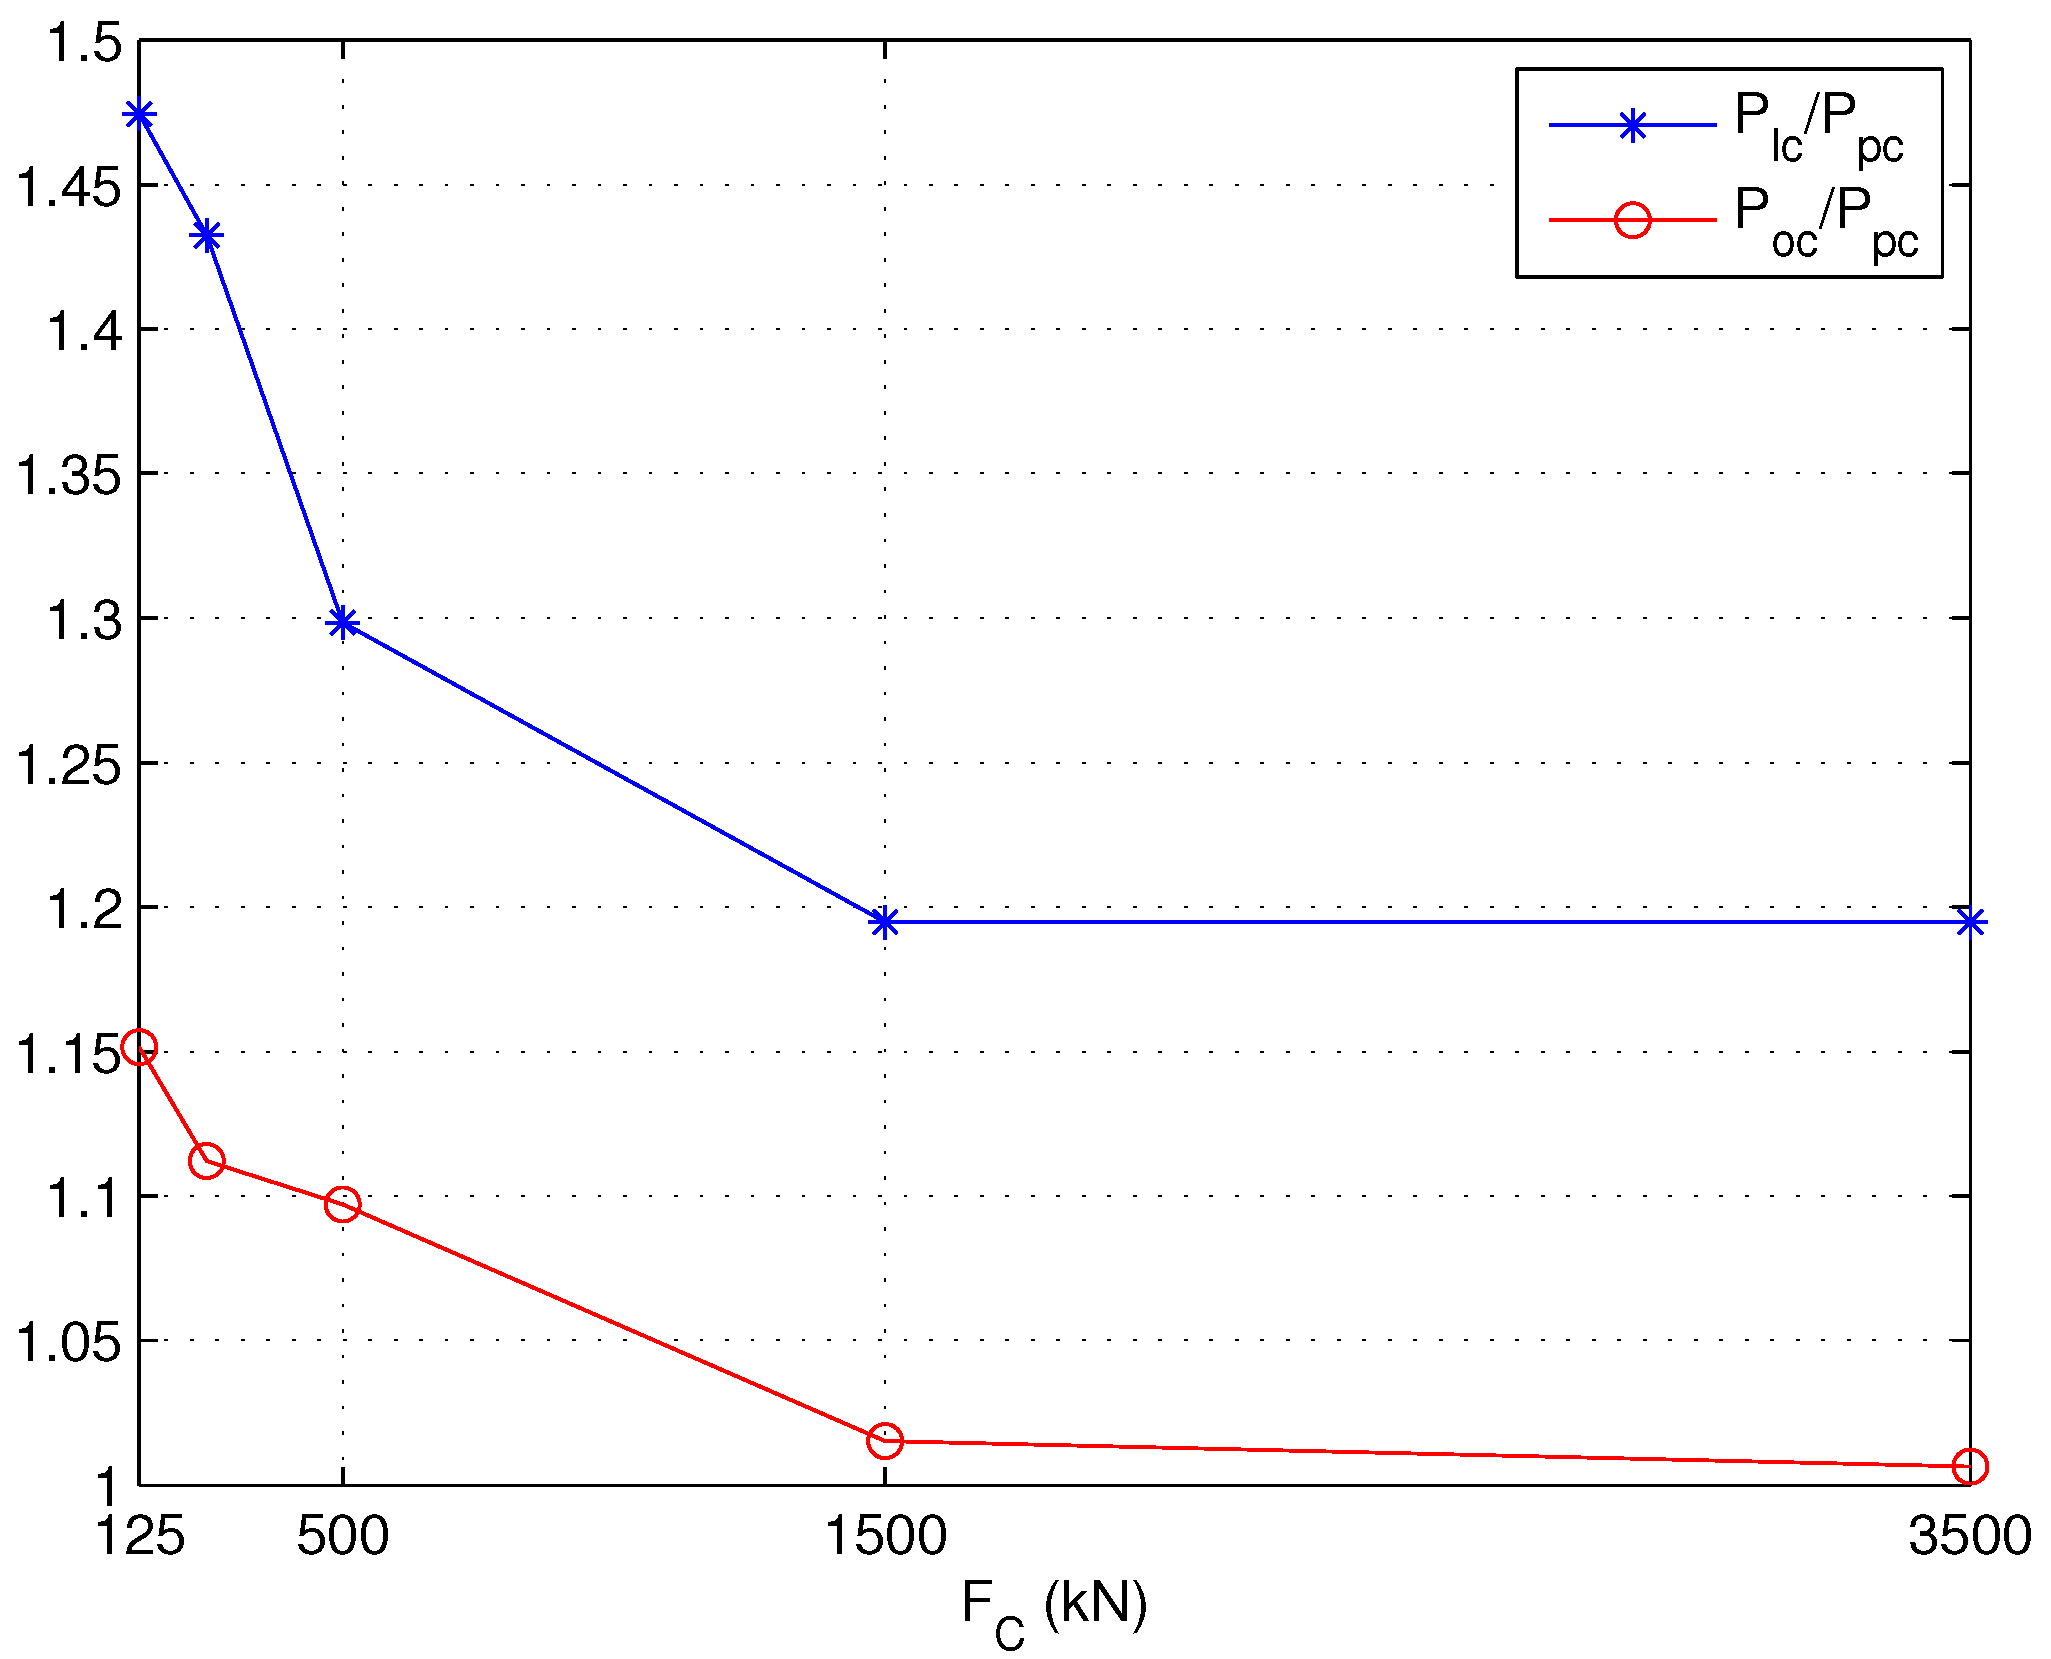
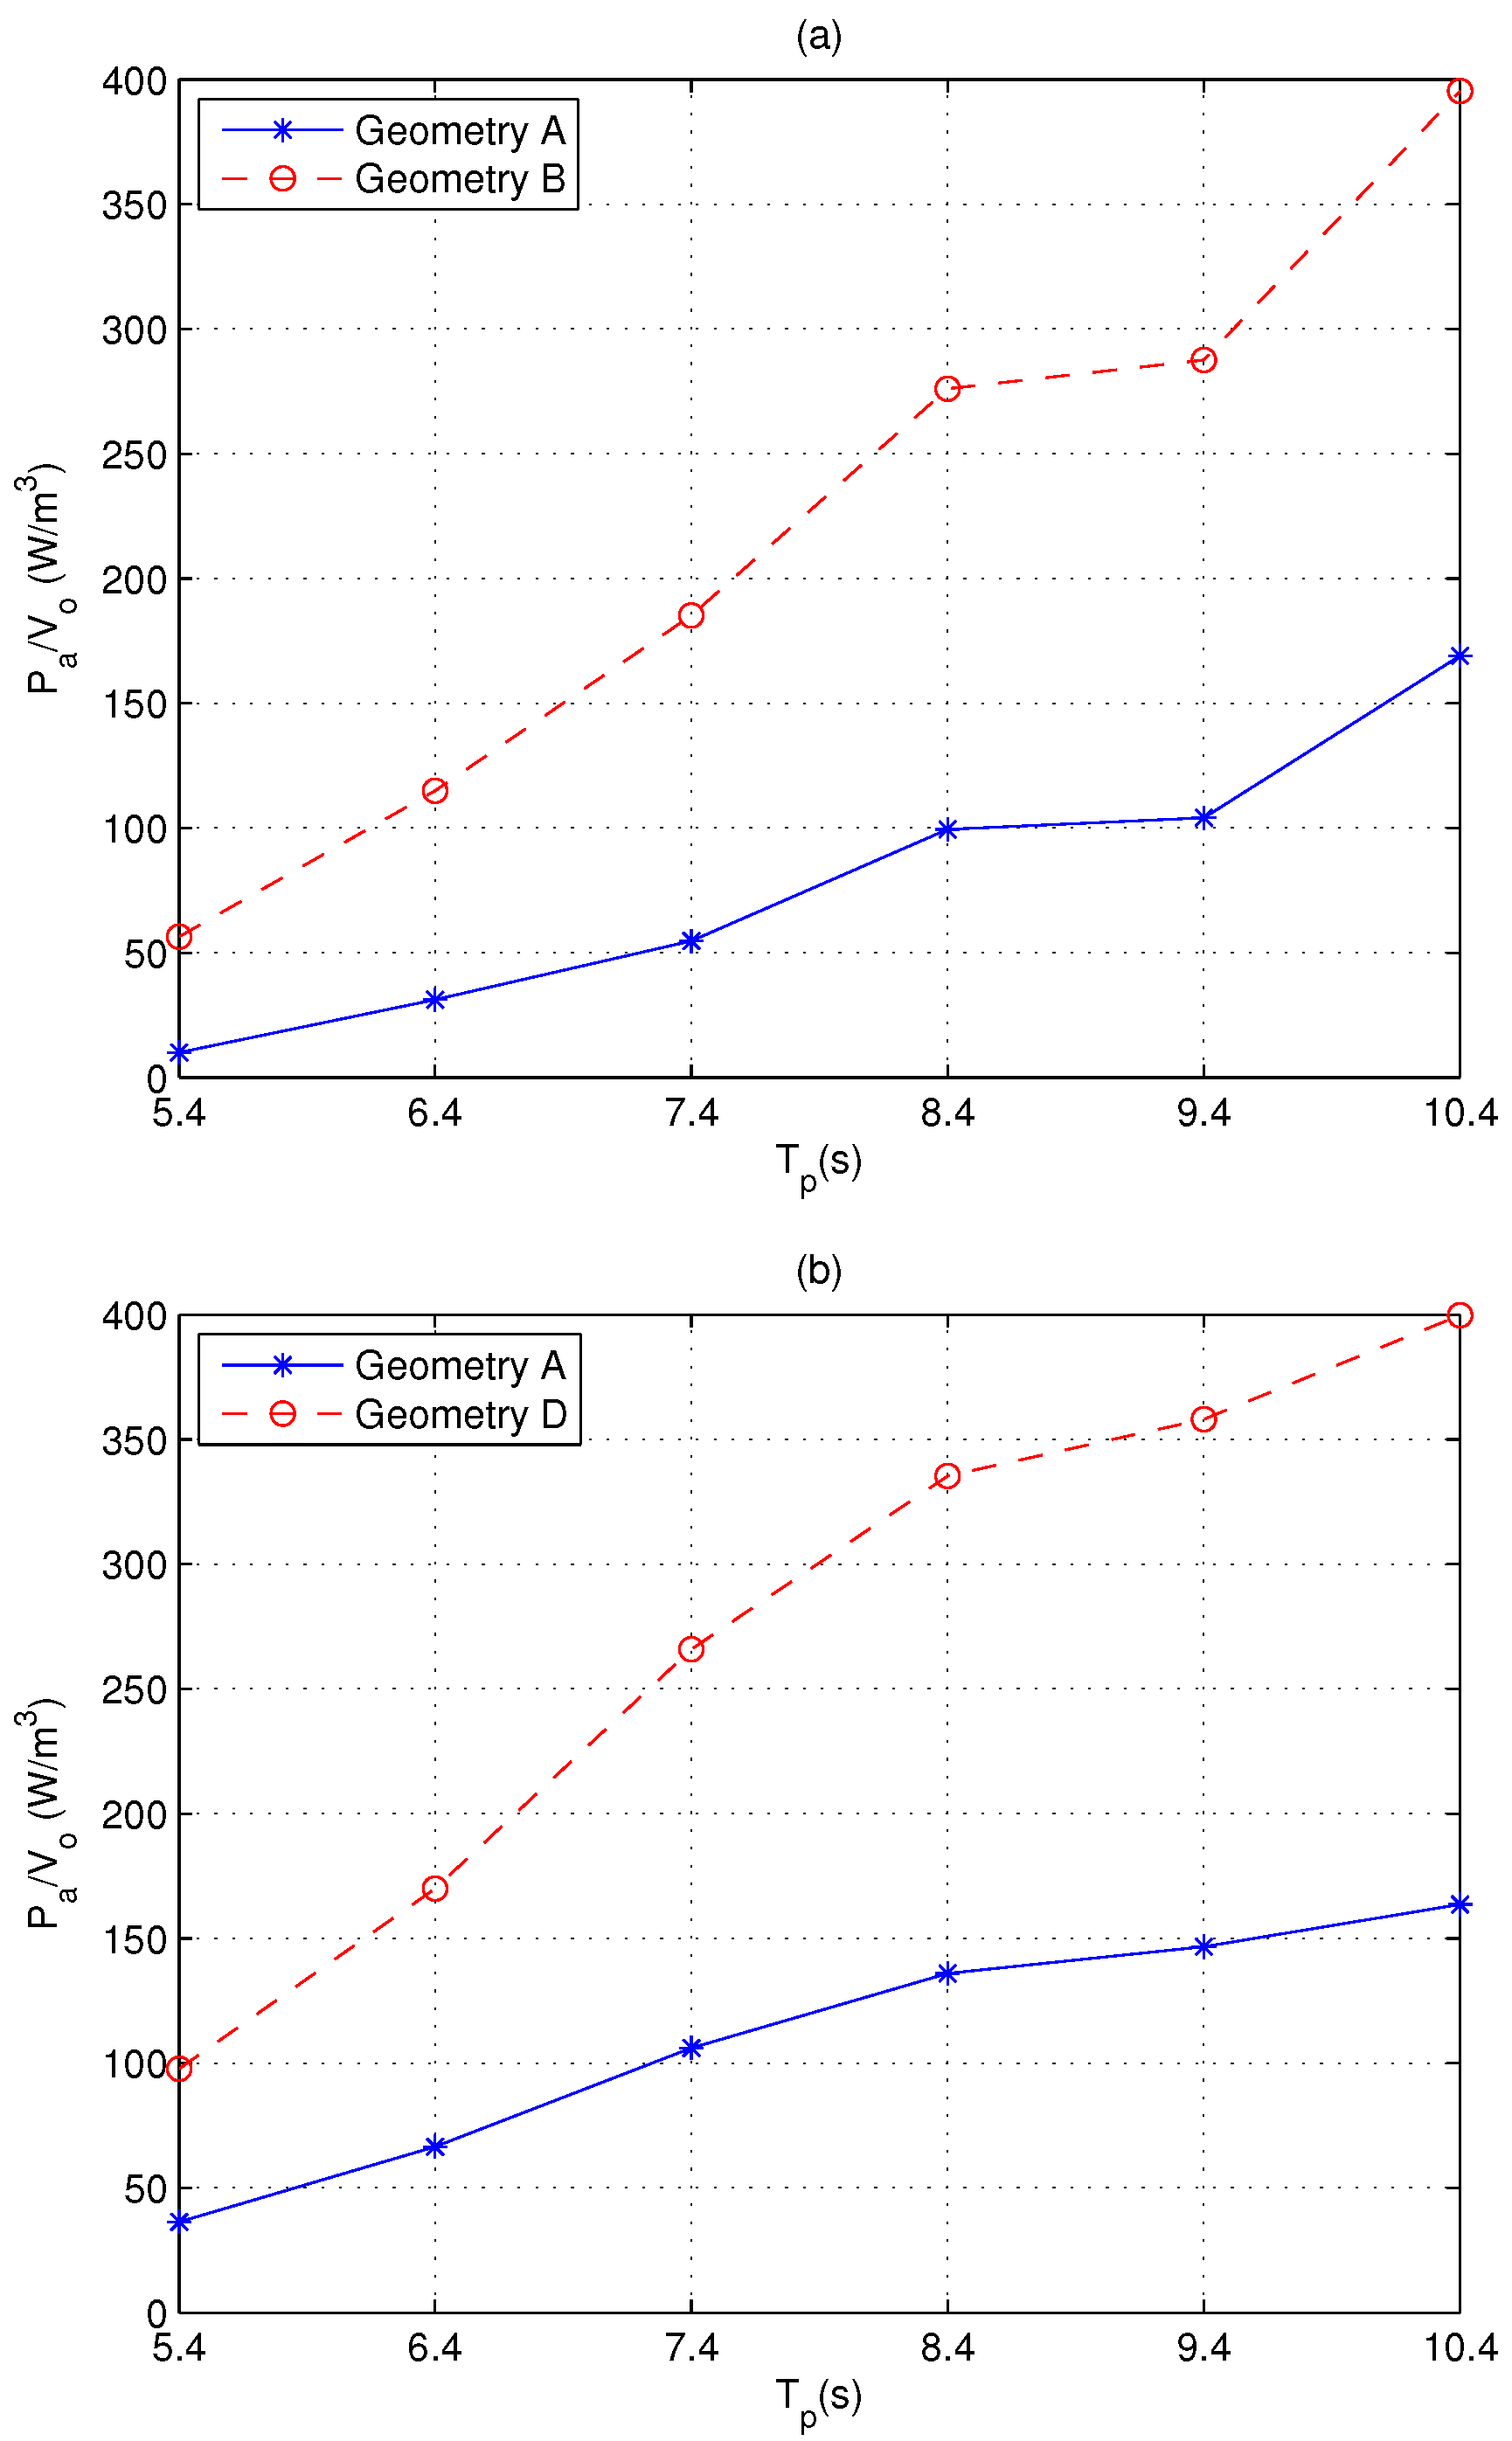
4.3. Discussion
| (kN) | PC | LC | PSOC | ||||
|---|---|---|---|---|---|---|---|
| 3500 | |||||||
| 1500 | |||||||
| 500 | |||||||
| 250 | |||||||
| 125 | |||||||


5. Conclusions
Acknowledgements
Author Contributions
Conflicts of Interest
References
- Falcão, A.F.O. Wave energy utilization: A review of the technologies. Renew. Sustain. Energy Rev. 2010, 14, 899–918. [Google Scholar] [CrossRef]
- Astariz, S.; Iglesias, G. The economics of wave energy: A review. Renew. Sustain. Energy Rev. 2015, 45, 397–408. [Google Scholar] [CrossRef]
- Ringwood, J.V.; Bacelli, G.; Fusco, F. Energy-Maximizing Control of Wave-Energy Converters. IEEE Control Syst. 2014, 34, 30–55. [Google Scholar] [CrossRef]
- Babarit, A.; Clément, A. Shape optimization of the SEAREV wave energy converter. In Proceedings of the IX World Renewable Energy Congress, Florence, Italy, 19–25 August 2006.
- Alves, M.; Traylor, H.; Sarmento, A. Hydrodynamic Optimization of a Wave Energy Converter Using a Heave Motion Buoy. In Proceedings of the 7th European Wave and Tidal Energy Conference, Porto, Portugal, 11–13 September 2007.
- McCabe, A.P.; Aggidis, G.A.; Widden, M.B. Optimizing the shape of a surge-and-pitch wave energy collector using a genetic algorithm. Renew. Energy 2010, 35, 2767–2775. [Google Scholar] [CrossRef]
- McCabe, A.P. Constrained optimization of the shape of a wave energy collector by genetic algorithm. Renew. Energy 2013, 51, 274–284. [Google Scholar] [CrossRef]
- Kurniawan, A.; Moan, T. Optimal Geometries for Wave Absorbers Oscillating About a Fixed Axis. J. Ocean. Eng. 2013, 38, 117–130. [Google Scholar] [CrossRef]
- Babarit, A.; Clément, A.H. Optimal latching control of a wave energy device in regular and irregular waves. Appl. Ocean Res. 2006, 28, 77–91. [Google Scholar] [CrossRef]
- Hals, J.; Falnes, J.; Moan, T. A Comparison of Selected Strategies for Adaptive Control of Wave Energy Converters. J. Offshore Mech. Arct. Eng. 2011, 133. [Google Scholar] [CrossRef]
- Garcia-Rosa, P.B.; Lizarralde, F.; Estefen, S.F. Optimization of the Wave Energy Absorption in Oscillating-Body Systems using Extremum Seeking Approach. In Proceedings of the 8th IFAC Conference on Control Applications in Marine Systems, Rostock, Germany, 15–17 September 2010; pp. 1011–1016.
- Fusco, F.; Ringwood, J.V. A simple and effective real-time controller for wave energy converters. IEEE Trans. Sustain. Energy 2013, 4, 21–30. [Google Scholar] [CrossRef]
- Garcia-Rosa, P.B.; Ringwood, J.V. On the Sensitivity of Optimal Wave Energy Device Geometry to the Energy Maximising Control System. IEEE Trans. Sustain. Energy 2015. [Google Scholar] [CrossRef]
- Cummins, W.E. The impulse response function and ship motions; David Taylor Model Basin Washington DC: Washington, DC, USA, 1962. [Google Scholar]
- Falnes, J. Ocean Waves and Oscillating Systems: Linear Interaction including Wave-Energy Extraction; Cambridge University Press: Cambridge, UK, 2002. [Google Scholar]
- Budal, K.; Falnes, J. A Resonant Point Absorber of Ocean Waves. Nature 1975, 256, 478–479. [Google Scholar]
- Newman, J.N. The Interaction of Stationary vessels with Regular Waves. In Proceedings of the 11th Symposium on Naval Hydrodynamics, London, UK, 28 March–2 April 1976; pp. 491–501.
- Evans, D.V. A theory for wave-power absorption by oscillating bodies. J. Fluid Mech. 1976, 77, 1–25. [Google Scholar] [CrossRef]
- Falnes, J. A review of wave-energy extraction. Mar. Struct. 2007, 20, 185–201. [Google Scholar] [CrossRef]
- Budal, K.; Falnes, J. Interacting Point Absorbers with Controlled Motion. In Power from Sea Waves; Count, B.M., Ed.; Academic Press: London, UK, 1980; pp. 381–399. [Google Scholar]
- Tom, N.; Yeung, R.W. Nonlinear Model Predictive Control Applied to a Generic Ocean-Wave Energy Extractor. J. Offshore Mech. Arct. Eng. 2014, 136. [Google Scholar] [CrossRef]
- Gill, P.E.; Murray, W.; Wright, M.H. Practical Optimization; Academic Press: New York, NY, USA, 1981. [Google Scholar]
- Babarit, A.; Duclos, G.; Clément, A.H. Comparison of latching strategies for a heaving wave energy device in random sea. Appl. Ocean Res. 2004, 26, 227–238. [Google Scholar] [CrossRef]
- Nolan, G.; Ringwood, J.V.; Butler, W.E.L.S. Optimal Damping Profiles for a Heaving Buoy Wave-Energy Converter. In Proceedings of the 15th International Society of Offshore and Polar Engineers Conference (ISOPE 2005), Seoul, Korea, 19–24 June 2005.
- Hals, J.; Bjarte-Larsson, T.; Falnes, J. Optimum Reactive Control and Control by Latching of a Wave-Absorbing Semisubmerged Heaving Sphere. In Proceedings of the 21st International Conference on Offshore Mechanics and Arctic Engineering, Oslo, Norway, 23–28 June 2002; Volume 8, pp. 415–423.
- Budal, K.; Falnes, J.; Iversen, L.C.; Lillebeken, P.M.; Oltedal, G.; Hals, T.; Onshus, T. The Norwegian wave-power buoy project. In Proceedings of the 2nd International Symposium on Wave Energy Utilization, Trondheim, Norway, 22–24 June 1982; pp. 323–344.
- Eidsmoen, H. Tight-moored amplitude-limited heaving buoy wave energy converter with phase control. Appl. Ocean Res. 1998, 20, 157–161. [Google Scholar] [CrossRef]
- Korde, U.A. Phase control of floating bodies from an on-board reference. Appl. Ocean Res. 2001, 23, 251–262. [Google Scholar] [CrossRef]
- Falcão, A.F.O. Phase control through load control of oscillating-body wave energy converters with hydraulic PTO system. Ocean Eng. 2008, 35, 358–366. [Google Scholar] [CrossRef]
- Lopes, M.F.P.; Hals, J.; Gomes, R.P.F.; Moan, T.; Gato, L.M.C.; Falcão, A.F.O. Experimental and numerical investigation of non-predictive phase-control strategies for a point-absorbing wave energy converter. Ocean Eng. 2009, 36, 386–402. [Google Scholar] [CrossRef]
- Henriques, J.C.C.; Lopes, M.F.P.; Gomes, R.P.F.; Gato, L.M.C.; Falcão, A.F.O. On the annual wave energy absorption by two-body heaving WECs with latching control. Renew. Energy 2012, 45, 31–40. [Google Scholar] [CrossRef]
- Feng, Z.; Kerrigan, E.C. Latching control of wave energy converters using derivative-free optimization. In Proceedings of the IEEE 52nd Annual Conference on Decision and Control, Firenze, Italy, 10–13 December 2013; pp. 7474–7479.
- Bacelli, G.; Ringwood, J.V. Numerical optimal control of wave energy converters. IEEE Trans. Sustain. Energy 2015, 6, 294–302. [Google Scholar] [CrossRef]
- Bacelli, G.; Ringwood, J.V.; Gilloteaux, J.C. A control system for a self-reacting point absorber wave energy converter subject to constraints. In Proceedings of the 18th IFAC World Congress, Milano, Italy, 28 August–2 September 2011; pp. 11387–11392.
- WAMIT User Manual, Version 7.0; WAMIT, Inc.: Chestnut Hill, MA, USA, 2013.
- Labeyrie, J. Stationary and Transient States of Random Seas. Mar. Strucut. 1990, 3, 43–58. [Google Scholar] [CrossRef]
© 2015 by the authors; licensee MDPI, Basel, Switzerland. This article is an open access article distributed under the terms and conditions of the Creative Commons by Attribution (CC-BY) license (http://creativecommons.org/licenses/by/4.0/).
Share and Cite
Garcia-Rosa, P.B.; Bacelli, G.; Ringwood, J.V. Control-Informed Geometric Optimization of Wave Energy Converters: The Impact of Device Motion and Force Constraints. Energies 2015, 8, 13672-13687. https://doi.org/10.3390/en81212386
Garcia-Rosa PB, Bacelli G, Ringwood JV. Control-Informed Geometric Optimization of Wave Energy Converters: The Impact of Device Motion and Force Constraints. Energies. 2015; 8(12):13672-13687. https://doi.org/10.3390/en81212386
Chicago/Turabian StyleGarcia-Rosa, Paula B., Giorgio Bacelli, and John V. Ringwood. 2015. "Control-Informed Geometric Optimization of Wave Energy Converters: The Impact of Device Motion and Force Constraints" Energies 8, no. 12: 13672-13687. https://doi.org/10.3390/en81212386
APA StyleGarcia-Rosa, P. B., Bacelli, G., & Ringwood, J. V. (2015). Control-Informed Geometric Optimization of Wave Energy Converters: The Impact of Device Motion and Force Constraints. Energies, 8(12), 13672-13687. https://doi.org/10.3390/en81212386