Abstract
Brazil has one of the largest electricity markets in South America, which needs to add 6000 MW of capacity every year in order to satisfy growing the demand from an increasing and more prosperous population. Apart from biomass, no other renewable energy sources, besides hydroelectricity, play a relevant role in the energy mix. The potential for wind and wave energy is very large. Brazil's Santa Catarina state government is starting a clean energy program in the state, which is expected to bring more than 1 GW of capacity. Assessment of wave energy resources is needed along the coastline. This work studied the potential wave energy along the north-central coasts of Santa Catarina, in Southern Brazil, by analysis of the hindcast data from the European Centre for Medium-Range Weather Forecasts (ECMWF). The annual offshore wave power was found to be equal to 15.25 kW/m, the bulk of which is provided by southeastern waves. The nearshore energetic patterns were studied by means of a numerical coastal propagation model (Mike21 SW). The mean wave power of 20 m isobaths is 11.43 kW/m. Supplementary considerations are drawn on realistic perspectives for wave energy converters installations.
1. Introduction
Brazil has the largest electricity market in South America. One of the great advantages for energy potential comes from having several different climate zones. A dry, sunny climate in the central area of the country provides an opportunity for the solar sector to be developed, and windy coasts, especially in the southeast, allow for great wind power potential. Additionally, the Amazon River and its tributaries offer abundant potential for hydropower. The energy market, and notably the electricity market, changed radically during the 1990s, to become a free and open market, which was attractive to private companies. With a very large increase in energy demand, the Brazilian government was forced to attract the private sector in order for the electricity sector to have the investment capital to develop quickly. Even though wave energy remains largely unknown in most of the country as a real energy alternative, this new and renewable energy shows many advantages. Considering that the majority of the population is centralized near the coast, tapping offshore wave power appears to be quite logical.
Wave energy is renewable, never-ending, and native resource. Installation success strongly depends on the development of wave energy converters (WECs) and their implications for marine ecosystems [1,2]. WECs can be located offshore or nearshore. Deep water is more profitable to install devices, even if installation costs rise. Shoreline devices are more convenient from the point of view of construction, access, maintenance, and grid connection, even if available energy at the shoreline is lower. Recent work demonstrated that the reduction of the technically usable resource is not that significant [3,4,5,6,7,8]. Over the last fifteen years, several attempts have been made to map the offshore wave energy resource and to develop packages that enable the nearshore wave energy resource to be calculated. A maps of the global wave energy resources have been published earlier in [9], based on the WorldWaves data. Considerable work has been undertaken on wave energy assessment in several areas of the European coastline [10,11,12,13,14,15,16,17,18,19,20,21,22,23,24,25,26,27,28] and in others regions around the world [29,30,31,32,33,34,35,36,37,38,39,40,41,42,43,44,45].
The present work focuses on wave power assessment of the Santa Catarina coasts in Southern Brazil (Figure 1). The state is bounded on the east by the Atlantic Ocean, and is characterized by an extensive coastline with two distinct coastal regions.
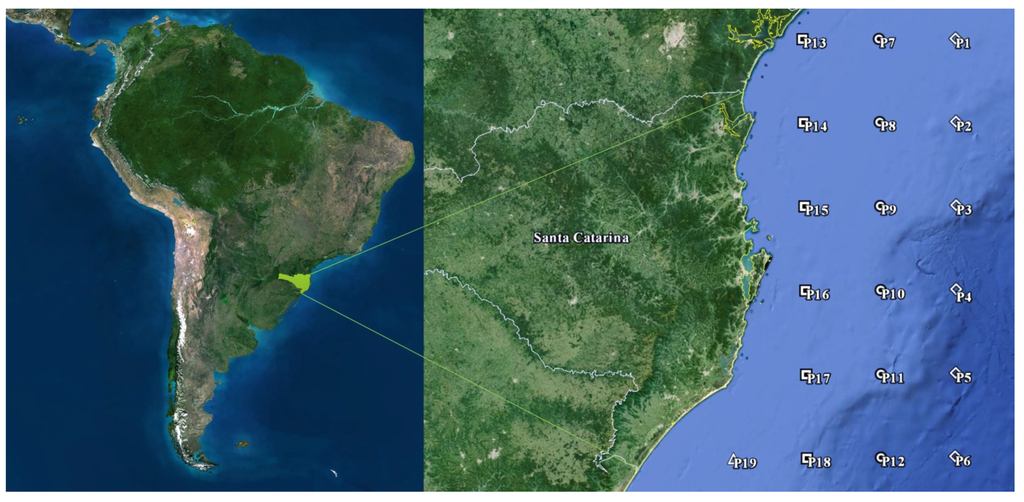
Figure 1.
Map of Santa Catarina coast showing the location of European Centre for Medium-Range Weather Forecasts (ECMWF) grid study points.
The north-central coastline is made up of a number of alternating features, including lagoons, bays, and sandy beaches. The overall orientation is N–S for about 450 km. The southern region is fronted by a continuous sandy beach with a uniform NE–SW orientation and a light sinuosity along its extension of 140 km. This study has focused on the north-central portion of Santa Catarina coast. The analysis is carried out using the hindcast data from the European Centre for Medium-Range Weather Forecasts (ECMWF). Both the offshore energetic patterns and the nearshore water conditions have been studied by means of the MIKE 21 SW coastal propagation model. To illustrate the involvement of different sea states, combined scatter and energy diagrams are created. Supplementary considerations are drawn on realistic perspectives for WEC farm installation.
2. Offshore Wave Energy Resource
2.1. Wave Data
Adequate buoy data are not available off the coast of Brazil; thus, the dataset used for the present work is derived from the European Centre for Medium-Range Weather Forecasts (ECMWF) data set. The ECMWF is a meteorological data assimilation project, where an atmosphere circulation reanalysis is integrated with a wave model. Weather predictions are based on the implementation of weather observations collected over decades through a single consistent analysis in forecast models. Operatively, a meteorological future state is derived on how the climate systems evolve with time from an initial condition. The sea state is described by the two-dimensional wave spectrum. No wave parameters are assimilated, making the sea surface conditions a hindcast run, where forecasts have always relied on accurate observations of the current weather. The dataset used is termed ERA-Interim (ECMWF Reanalysis from 1979 onward), continuously updated in real time. Significant wave height (Hs), mean period (Tm) and mean direction (θm), ranging from January 2004, to December 2014, were extracted from the ERA-Interim archive, available for download online [46]. This dataset constitutes the basis of the analyses conducted in this paper.
The Atlantic Ocean is covered by the base model grid with a resolution of 0.75° × 0.75°. In order to analyze the direct interaction between composited meteorological conditions of the wind field and ocean waves, very large temporal and spatial domain should be taken into account.
The approach to directly use the wave parameters instead of wind data, in further accordance with the dimension of coastlines, allows to analyze the variability of offshore wave power, but reducing the observational scale and, in turn, the number of reference points from ECMWF. Therefore, 19 grid points (P1–P19) were considered necessary, and have been selected to cover a latitude from 25.5°S to 29.25°S with a longitude ranging from 46.5°O to 48.75°O (Figure 1).
The geographical coordinates of the offshore points, and their distance from the coastline and seabed, are shown in Table 1.

Table 1.
Geographical information of European Centre for Medium-Range Weather Forecasts (ECMWF) grid points P1–P19.
| Point | Distance from Coast (km) | Depth (m) | Lat | Lon |
|---|---|---|---|---|
| P1 | 133 | 104 | 25°30′0.00′′S | 46°30′0.00′′O |
| P2 | 188 | 236 | 26°15′0.00′′ S | 46°30′0.00′′ O |
| P3 | 210 | 445 | 27°0′0.00′′S | 46°30′0.00′′O |
| P4 | 187 | 1646 | 27°45′0.00′′S | 46°30′0.00′′O |
| P5 | 214 | 2024 | 28°30′0.00′′S | 46°30′0.00′′O |
| P6 | 235 | 2306 | 29°15′0.00′′S | 46°30′0.00′′O |
| P7 | 76 | 55 | 25°30′0.00′′S | 47°15′0.00′′O |
| P8 | 126 | 101 | 26°15′0.00′′S | 47°15′0.00′′O |
| P9 | 118 | 144 | 27°0′0.00′′S | 47°15′0.00′′O |
| P10 | 114 | 270 | 27°45′0.00′′S | 47°15′0.00′′O |
| P11 | 136 | 301 | 28°30′0.00′′S | 47°15′0.00′′O |
| P12 | 165 | 1553 | 29°15′0.00′′S | 47°15′0.00′′O |
| P13 | 21 | 20 | 25°30′0.00′′S | 47°0′0.00′′O |
| P14 | 44 | 54 | 26°15′0.00′′S | 48°0′0.00′′O |
| P15 | 49 | 65 | 27°0′0.00′′S | 48°0′0.00′′O |
| P16 | 45 | 91 | 27°45′0.00′′S | 48°0′0.00′′O |
| P17 | 72 | 125 | 28°30′0.00′′S | 48°0′0.00′′O |
| P18 | 110 | 277 | 29°15′0.00′′S | 48°0′0.00′′O |
| P19 | 64 | 91 | 29°15′0.00′′S | 48°45′0.00′′O |
The ECMWF model uses the currently best description of the model physics, thus, the hindcasts from it can be considered reliable. Detailed data validation is not possible since only limited, measured wave time series are available for the region of interest [47].
2.2. Method
The offshore wave climate at any arbitrary site is comprised of a superposition of wave fields, including swells propagating from several distant sources and “sea” waves generated by local winds.
The energy flux or power, P, transmitted by a regular wave per unit crest width can be written as a vertical section of unit width, perpendicular to the wave propagation direction, equal to:
in which Cg is the group velocity. For natural a sea state, where waves are random in height, and period (and direction), the spectral parameters have to be used. The wave energy flux can be defined as:
where ρ is the sea water density, g is the gravity acceleration, f is the frequency, h is the water depth, S(f,θ) denotes the directional spectral density function, and Cg(f,h) denotes the wave group velocity, expressed as:
where k is the wave number.
Wave height computation is based on zero-order moment of the spectral function, and is readily estimated as follows:
In the method, the energy period, Te, is the preferred period parameter. The reason can be found in the conceptual definition of energy period; as the period of the sinusoidal wave that has the same parametric height and the same power density of the considered sea-state. In deep water, it can be defined in terms of the minus-one and the zeroth spectral moments:
where mn represents the spectral moment of order n.
The offshore wave power is not affected by refraction and shoaling, and can be computed directly from hindcast wave data using the approximate deep water expression (i.e., where h > L/2), simplified to:
From each hindcast point, the 6-h pair dataset was obtained. For each pair, the related power series was calculated. Furthermore, the power series was analyzed in order to get monthly and yearly power. Operatively, from the 6-h triple (Hs, Tm, θm) provided by the ERA-interim for grid points P1–P19, a 10-year averaged 6-h triple dataset was obtained. Then, the corresponding energy period, Te, was computed. The energy period is rarely specified and must be estimated from other variables (e.g., mean or peak period) when the spectral shape is unknown. When the peak period Tp is known, a possible approach could be assumed.
where the coefficient α depends on the frequency spectrum model.
The coefficient α was assumed equal to 1 in the assessing of the wave energy resource in Southern New England [48]. General speaking, α increases towards unity with decreasing spectral width [49]. In fact, for a Pierson-Moskowitz spectrum, which is only used for fully developed seas [50], α = 0.86 could be assumed, whereas for a standard JONSWAP (JOint North Sea WAve Project) spectrum with a peak enhancement factor of γ = 3.3, α reaches 0.90. The Santa Catarina real sea state is comprised of multiple wave systems, i.e., a local wind sea plus more swells approaching from different directions. It is beyond the scope of this study to evaluate correspondence of the spectral distributions to the spectrum model. Furthermore, being unknown, the peak period, a relationship with the mean period, should be used. In preparing the Atlas of UK Marine Renewable Energy Resources [51], it was assumed that Te = 1.14Tm. This approach seems more conservative, despite a direct correlation with peak period in the study area, where very long-period swell can be recognized. Therefore, it has been adopted in this study. Finally, the related power series was calculated using Equation (1). The power series were analyzed in order to get monthly and yearly power.
2.3. Results
The main parameters of wave climate at each grid point are reported in Table 2. The overall wave climate is characterized by overall averaged wave parameters, with a significant wave height of 1.76 m, a mean period of 8.07 s, and a mean direction of 126°. Very low variability around these mean values has been found, as confirmed by the small standard deviation of significant wave height and mean period for each point and averaged over the whole dataset (respectively σH, σT and σ in Table 2).

Table 2.
Main wave climate parameters (based on 10-year average) at ECMWF grid points.
| Point | Hs,mean | Hs,max | Hs,min | σH | Tm, mean | Tm, max | σT | Te,mean | θm |
|---|---|---|---|---|---|---|---|---|---|
| (m) | (m) | (m) | (m) | (s) | (s) | (s) | (s) | (°) | |
| P1 | 1.64 | 4.14 | 0.75 | 0.49 | 8.23 | 14.27 | 1.25 | 9.39 | 132 |
| P2 | 1.76 | 4.59 | 0.77 | 0.54 | 8.27 | 14.50 | 1.29 | 9.43 | 130 |
| P3 | 1.85 | 4.94 | 0.78 | 0.58 | 8.25 | 14.47 | 1.33 | 9.40 | 129 |
| P4 | 1.94 | 5.34 | 0.80 | 0.61 | 8.24 | 14.30 | 1.35 | 9.39 | 128 |
| P5 | 2.02 | 5.62 | 0.82 | 0.64 | 8.22 | 13.98 | 1.36 | 9.37 | 127 |
| P6 | 2.09 | 5.82 | 0.84 | 0.67 | 8.20 | 14.00 | 1.37 | 9.35 | 128 |
| P7 | 1.41 | 3.68 | 0.66 | 0.41 | 7.94 | 13.92 | 1.17 | 9.06 | 129 |
| P8 | 1.57 | 4.19 | 0.71 | 0.47 | 8.04 | 13.85 | 1.22 | 9.16 | 127 |
| P9 | 1.68 | 4.49 | 0.73 | 0.51 | 8.06 | 14.14 | 1.28 | 9.19 | 126 |
| P10 | 1.82 | 5.04 | 0.77 | 0.56 | 8.12 | 14.13 | 1.33 | 9.25 | 125 |
| P11 | 1.94 | 5.44 | 0.79 | 0.60 | 8.12 | 13.91 | 1.35 | 9.26 | 125 |
| P12 | 2.04 | 5.68 | 0.81 | 0.65 | 8.11 | 14.16 | 1.36 | 9.25 | 125 |
| P13 | 1.38 | 3.79 | 0.65 | 0.41 | 7.81 | 13.88 | 1.17 | 8.91 | 124 |
| P14 | 1.38 | 3.79 | 0.65 | 0.41 | 7.81 | 13.88 | 1.17 | 8.91 | 124 |
| P15 | 1.36 | 3.76 | 0.62 | 0.39 | 7.70 | 13.77 | 1.20 | 8.78 | 124 |
| P16 | 1.83 | 5.17 | 0.76 | 0.56 | 8.10 | 14.18 | 1.36 | 9.23 | 124 |
| P17 | 1.96 | 5.53 | 0.76 | 0.61 | 8.04 | 14.28 | 1.37 | 9.16 | 123 |
| P18 | 1.95 | 5.51 | 0.76 | 0.61 | 8.03 | 14.42 | 1.35 | 9.16 | 123 |
| P19 | 1.74 | 4.98 | 0.68 | 0.54 | 7.99 | 14.70 | 1.32 | 9.11 | 124 |
| Mean | 1.76 | 4.82 | 0.74 | 0.54 | 8.07 | 14.14 | 1.29 | 9.20 | 126 |
| σ | 0.24 | 0.74 | 0.06 | 0.09 | 0.16 | 0.26 | 0.07 | 0.18 | 2.66 |
Table 3 summarizes the seasonal and yearly mean power at each point. Standard deviation of power, σP, and the yearly energy flux in MWh/m are also reported. The seasonal data are regrouped according to the following months: January, February, and March (Summer); April, May, and June (Autumn); July, August, and September (Winter); and October, November, and December (Spring). The annual wave power was found to range between about 9 kW/m (P13) and 21 KW/m (P6), with a gross mean of 15.2 kW/m and a standard deviation based on all data points, σP, of 3.9 kW/m.
A tentative contour map (based on interpolation of power rate at 19 grid points) has been provided in Figure 2, where wave power isolines, spacing 2 kW/m, are depicted, ranging from 8 to 22 kW/m.
Considering only the grid point in deep water (i.e., >70 m water deep), hence excluding points P7, P13 and P14, the energy density averaged on the whole offshore region is approximately equal to 16.4 kW/m. Focusing on the furthest from the shore grid points (on longitude 46.5°O), it is possible to note, in Figure 3 and Figure 4, that the bulk of the power is provided by south-southeast waves, with the south component being more dominant for increasing latitudes. The results are graphically represented by diagrams assembled in Figure 3 and Figure 4.

Table 3.
Average seasonal and yearly wave power (based on 10-year average) at ECMWF grid points.
| Point | Average Yearly Power | Average Montly Power (kW/m) | |||||
|---|---|---|---|---|---|---|---|
| (kW/m) | (MWh/m) | Spring | Summer | Autumn | Winter | σ | |
| P1 | 13.00 | 113.87 | 11.58 | 10.09 | 14.89 | 15.42 | 2.58 |
| P2 | 15.18 | 132.98 | 13.41 | 11.72 | 17.48 | 18.12 | 3.11 |
| P3 | 16.86 | 147.67 | 14.72 | 12.99 | 19.56 | 20.16 | 3.55 |
| P4 | 18.52 | 162.19 | 15.90 | 14.08 | 21.77 | 22.31 | 4.14 |
| P5 | 20.15 | 176.48 | 17.08 | 15.11 | 23.87 | 24.53 | 4.75 |
| P6 | 21.73 | 190.35 | 18.24 | 16.08 | 25.82 | 26.77 | 5.36 |
| P7 | 9.21 | 80.71 | 8.53 | 7.40 | 10.23 | 10.71 | 1.53 |
| P8 | 11.65 | 102.05 | 10.62 | 9.29 | 13.04 | 13.65 | 2.04 |
| P9 | 13.43 | 117.68 | 12.05 | 10.62 | 15.21 | 15.85 | 2.51 |
| P10 | 16.01 | 140.26 | 14.02 | 12.40 | 18.52 | 19.10 | 3.31 |
| P11 | 18.29 | 160.19 | 15.73 | 13.88 | 21.42 | 22.12 | 4.10 |
| P12 | 20.37 | 178.47 | 17.30 | 15.18 | 23.98 | 25.03 | 4.87 |
| P13 | 8.38 | 73.42 | 7.95 | 6.94 | 9.06 | 9.57 | 1.17 |
| P14 | 9.32 | 81.68 | 8.85 | 7.72 | 10.08 | 10.65 | 1.30 |
| P15 | 12.31 | 107.87 | 11.69 | 10.22 | 13.30 | 14.04 | 1.71 |
| P16 | 15.57 | 136.41 | 13.64 | 12.06 | 18.03 | 18.56 | 3.22 |
| P17 | 17.74 | 155.42 | 15.30 | 13.40 | 20.70 | 21.57 | 4.01 |
| P18 | 17.59 | 154.07 | 15.22 | 13.30 | 20.43 | 21.40 | 3.94 |
| P19 | 14.47 | 126.78 | 12.84 | 11.26 | 16.56 | 17.23 | 2.88 |
| Mean | 15.25 | 133.61 | 13.40 | 11.78 | 17.58 | 18.25 | 3.16 |
| 3.92 | 34.32 | 3.01 | 2.69 | 4.94 | 5.05 | 1.25 | |
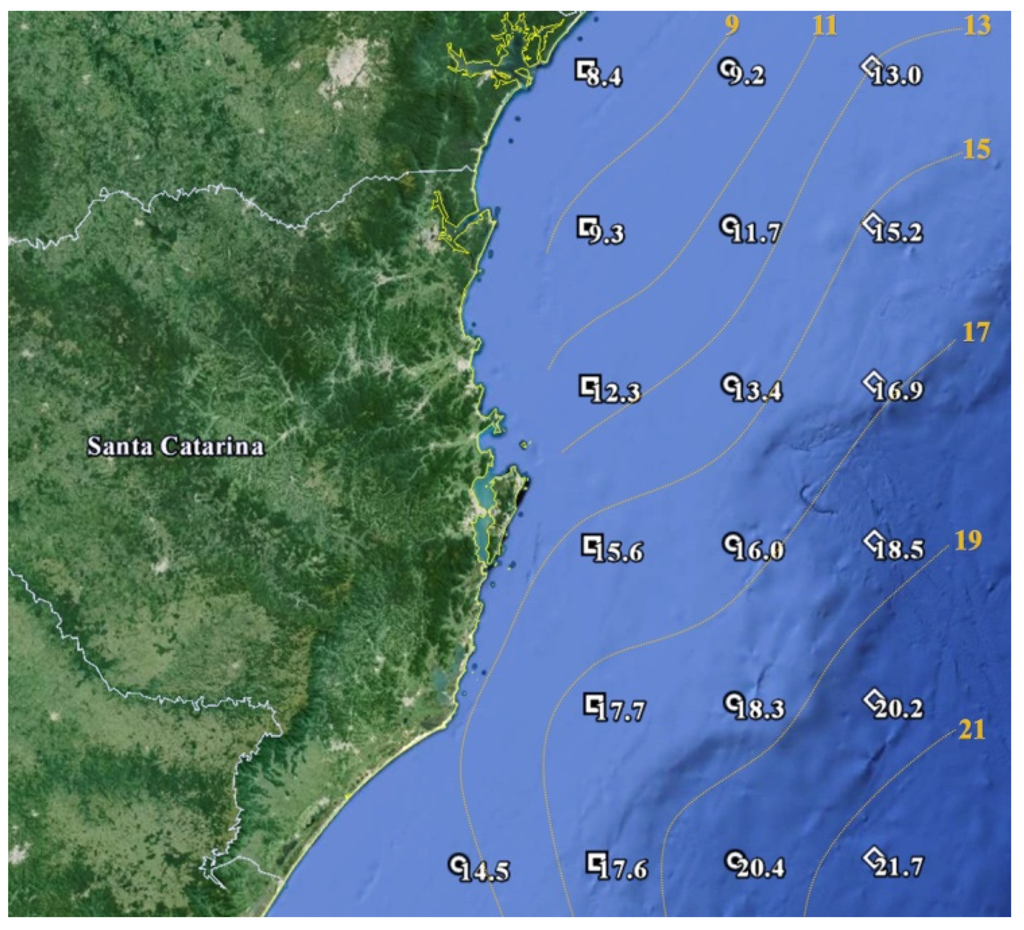
Figure 2.
Ten-year averaged energy flux for the 19 ECMWF grid point and contour lines of the estimated mean wave power flux per unit crest on the Santa Catarina coastline.
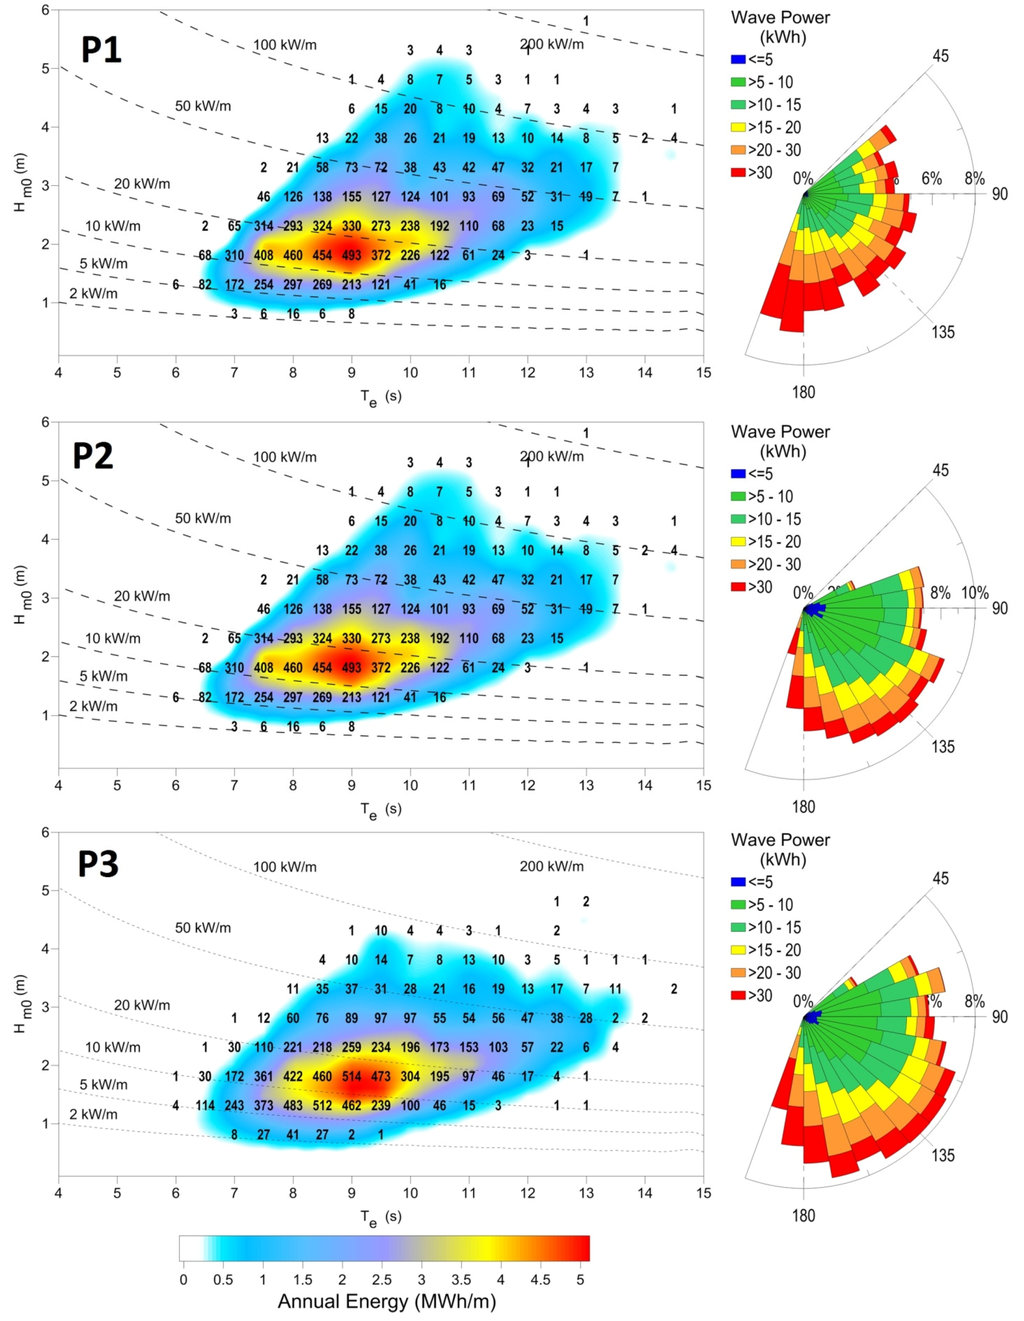
Figure 3.
Characterization of the yearly average wave energy points P1, P2 and P3, in terms of significant wave height (Hm0) and energy period (Te). The color scale represents annual energy per meter of wave front (in MWh/m). The numbers within the graphs indicate the occurrence of sea states (in number of hours per year) and the isolines refer to wave power.
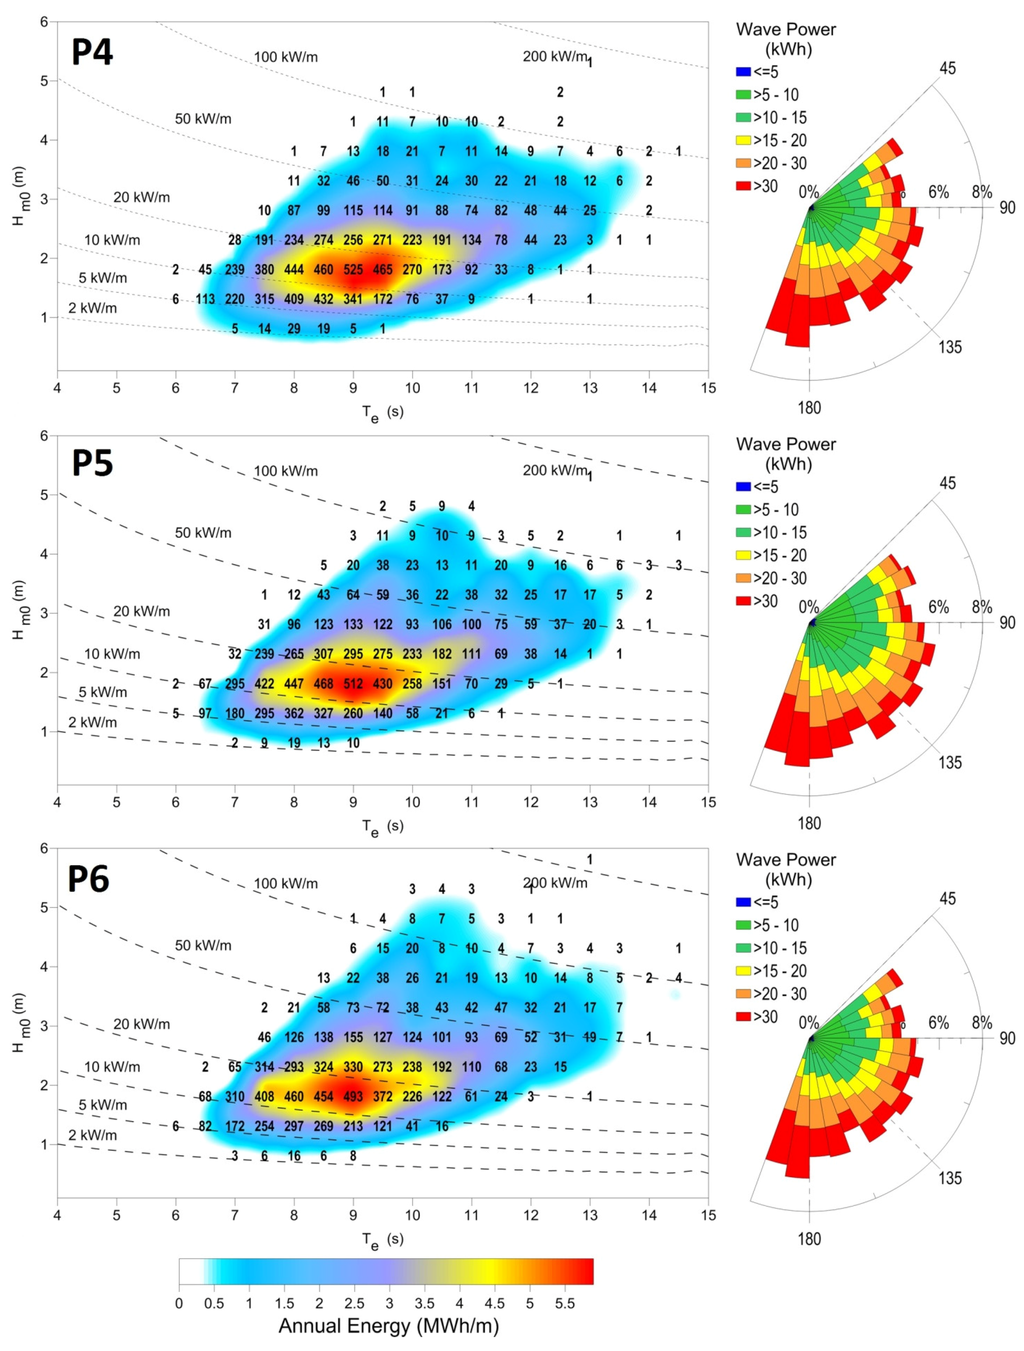
Figure 4.
Characterization of the yearly average wave energy points P4, P5, and P6 in terms of significant wave height (Hm0) and energy period (Te). The color scale represents annual energy per meter of wave front (in MWh/m). The numbers within the graphs indicate the occurrence of sea states (in number of hours per year) and the isolines refer to wave power.
About half of the annual wave energy (based on a 10-year average) is provided by waves with significant heights between 1.5 and 2.5 m and mean periods between 8 and 10 s (Table 2).
Annual wave energy is distributed almost uniformly in all seasons. In particular, the mean percentages of power provided by each season are 22%, 19%, 29%, and 30% for Spring, Summer, Autumn and Winter, respectively.
The important seasonal stability registered in the area is due to weather factors of a large scale. Brazilian southern coast experiences a great regularity, regardless of seasonality [52,53,54]. The principal reason is attributed to the rarity along South Atlantic Ocean of thunderstorms, organized on a large scale, such as hurricanes and tropical cyclones. This is the most remarkable feature of the South Atlantic weather system, completely opposite to its northern counterpart, which experiences hurricane season and, therefore, hurricane-generated waves. It is important to note, however, that South Atlantic tropical cyclones can be unusual weather events, but are not impossible. During March 2004, in fact, an extratropical cyclone formally transitioned into a tropical cyclone and made landfall on Brazil, after becoming a category 2 hurricane on the Saffir-Simpson hurricane wind scale. This storm, Cyclone Catarina, was defined as the first hurricane-intensity tropical cyclone ever recorded in the Southern Atlantic Ocean on 63 subtropical cyclones occurred between 1957 and 2007 [55].
The major atmospheric perturbations in the study area are the cold fronts that cross the region. An average of six cold frontal systems per month, reaching South America, was defined [56]. Monthly differences in wave power patterns can be related to the intensity and frequency of these meteorological systems, rather than their characteristics.
Wave characteristics reflect the wind regime over the South Atlantic, being the main share of energy flux supplied by south-southeast waves. Characterizing the wave energy source in terms of significant wave height at point P16, selected as more representative for the region of interest, it is highlighted in Figure 5a as 58% of annual wave energy (based on a 10-year average), is provided by waves with significant heights of between 1.5 and 2.5 m. About 50% of the total annual resources are related to waves with peak periods between 8 and 10 s (Figure 5b). For waves with periods greater than 10 s, the amount of energy is 32%, which is in accordance with the long fetch facing Santa Catarina and the above-mentioned local meteorological patterns.

Figure 5.
(a) Percentage of total wave energy vs. significant wave height at grid point P16; (b) Percentage of total wave energy vs. peak wave period at grid point P16.
For the same point, P16, Figure 6 and Figure 7 show, respectively, the monthly and seasonal distribution of the wave height patterns, averaged over the 10-year period of ECMWF wave forecasting data. The mean wave height is 1.83 m, ranging from 1.2 m and 1.7 m, respectively, in July and September. The maximum wave height was found to range between 3.8 m in January and 2.4 m in March, which is also the month where the minimum averaged wave height was found (0.65 m).
Whereas maximum averaged wave height is recorded in the summer period (from 21 December to 23 September), the energy flux in the winter period is higher than in the other periods (Figure 8), providing about 29.8% of total power. This value is not much higher than the autumn period (28.9%) and others seasons, which range approximately from 19.4% (Summer) to 21.9% (Spring). This poor seasonal dependence is also recognizable for wave direction, θ, shown in Figure 9, a monthly stable wave energy flux sector. The dominant direction is 124°, with a monthly average ranging from 107° and 148°.
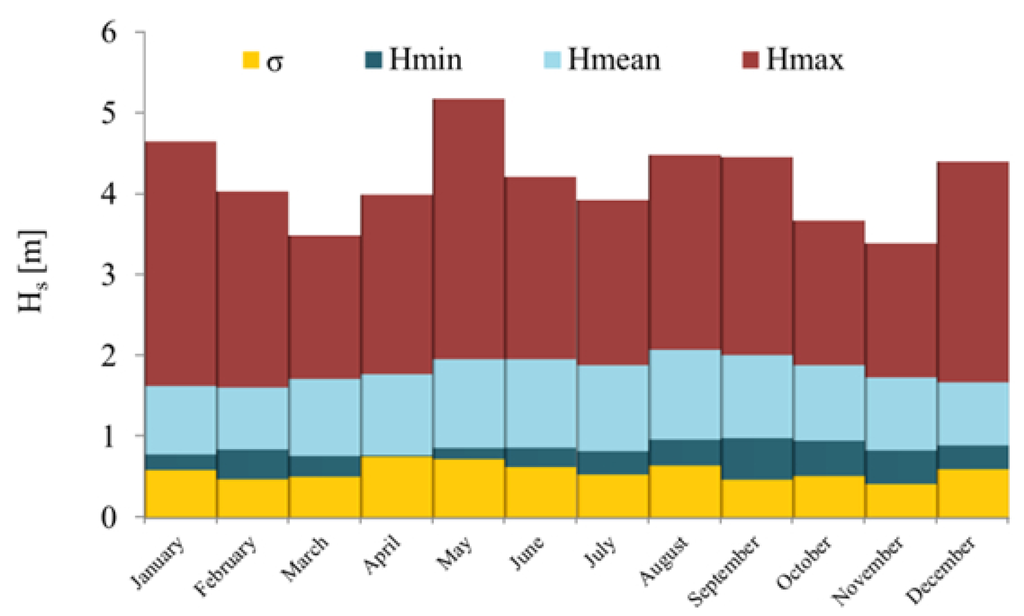
Figure 6.
Monthly wave climate characterization, in terms of significant wave height, averaged over 10 years at point P16.
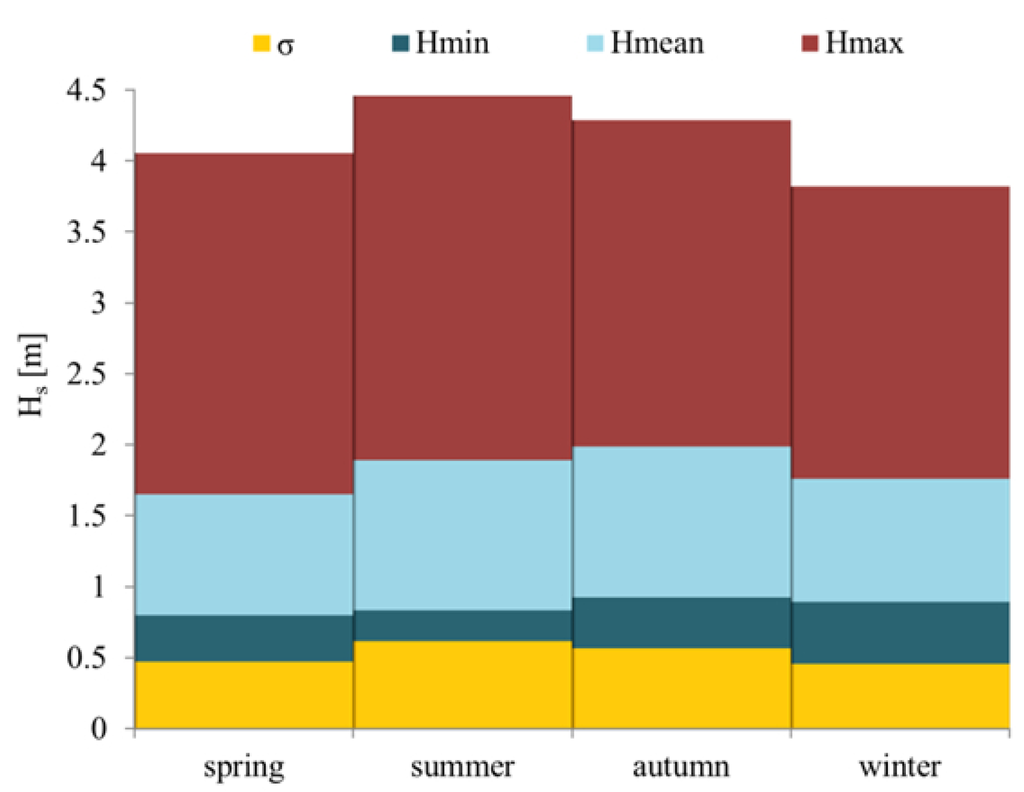
Figure 7.
Seasonal wave climate characterization, in terms of significant wave height, averaged over 10 years at point P16.
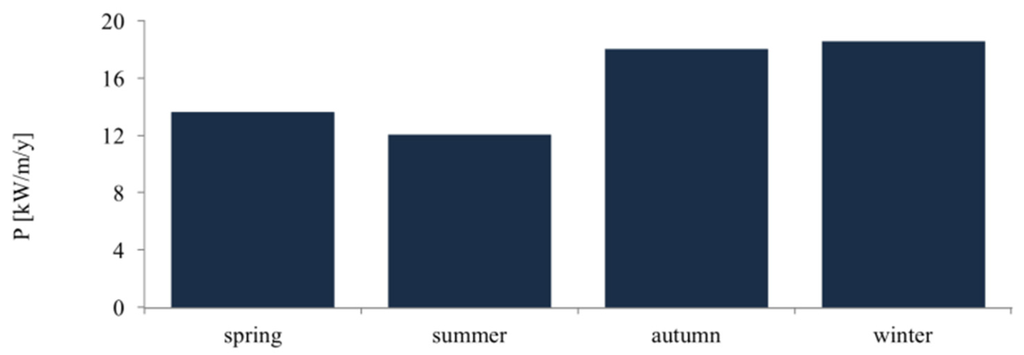
Figure 8.
Seasonal distribution of the wave energy flux, averaged over 10 years at point P16.
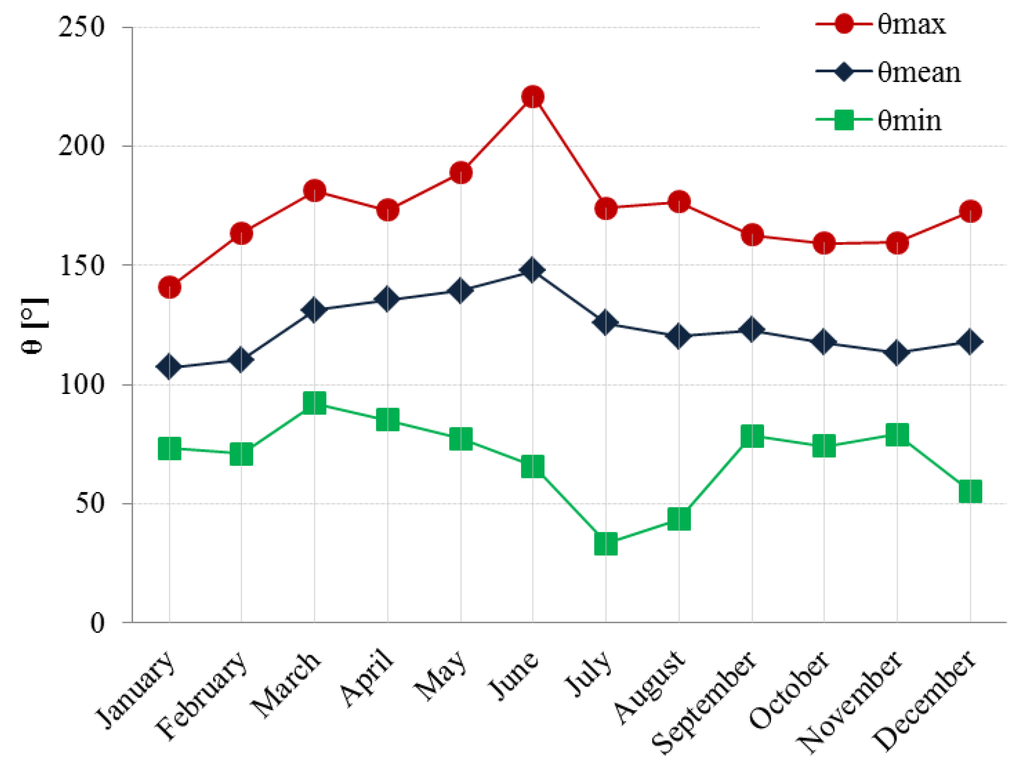
Figure 9.
Monthly distribution of the wave direction, averaged over 10 years at point P16.
3. Inshore Wave Energy
3.1. Objectives and Approach
It is well known that there is a clear distinction in wave power resource from offshore and nearshore conditions. The character of the waves approaching the coast from deep waters affect the pattern of these near-coast energy variations. In shallow waters, the wave conditions can change substantially, even between points located a few kilometres away (or even hundreds or tens of meters). The ocean waves travelling towards the coast diminish their wave height and change direction by means of refraction, diffraction, and, in general, interacting with the seabed. In order to consider the intricate spatial variations in wave power occurring nearshore of the Santa Catarina coast, nearshore energetic configurations have been accurately analyzed using numerical models.
This section deals with the inshore wave patterns, determined by means of the MIKE 21 SW model. This is a verified accurate numerical model for wave propagation in nearshore regions, developed by Danish Hydraulic Institute Water and Environment. The MIKE 21 SW model has been validated by comparison with data from buoys and satellites by several authors [24,27,41,42,44]. The MIKE 21 SW model can be verified in this study using data available from wave measurements for the period relative to 1996, presented by the authors of [57]. Their dataset was related to a campaign carried out during 1996, by the Federal University of Santa Catarina, at São Francisco do Sul Island, on the northern coast of the state of Santa Catarina. The field measurements include waves, currents, tides, sea-water temperature and salinity, and several meteorological parameters. Therefore, the location of that particular wave buoy has been selected as the first study site (S1 in the following) in this work. Unfortunately, missing values in wave time series reduce the representativeness of the sample. For this reason, verification has been carried out in the form of a sensitivity analysis by the histograms of Hs. Nevertheless, with the dissimilar measurement conditions, only a few differences are recognizable. Measured and calculated frequency of occurrence of Hs are, in fact, in very good agreement, despite the limited wave buoy data set (Figure 10), giving high confidence to the model and, indirectly, to its input hindcast data set.
In order to reduce simulation time and, at the same time, to improve accuracy in modeling results, wave, instead of wind, data hindcast dataset have been used to run the model. In particular, as initial conditions for the propagation model, the datasets analyzed in the previous section for four ECMWF reference points, P8, P9, P10 and P11, have been used. This approach make it possible to reduce the spatial computational domain, since no wind fields and related meteorological events should be taken into account.
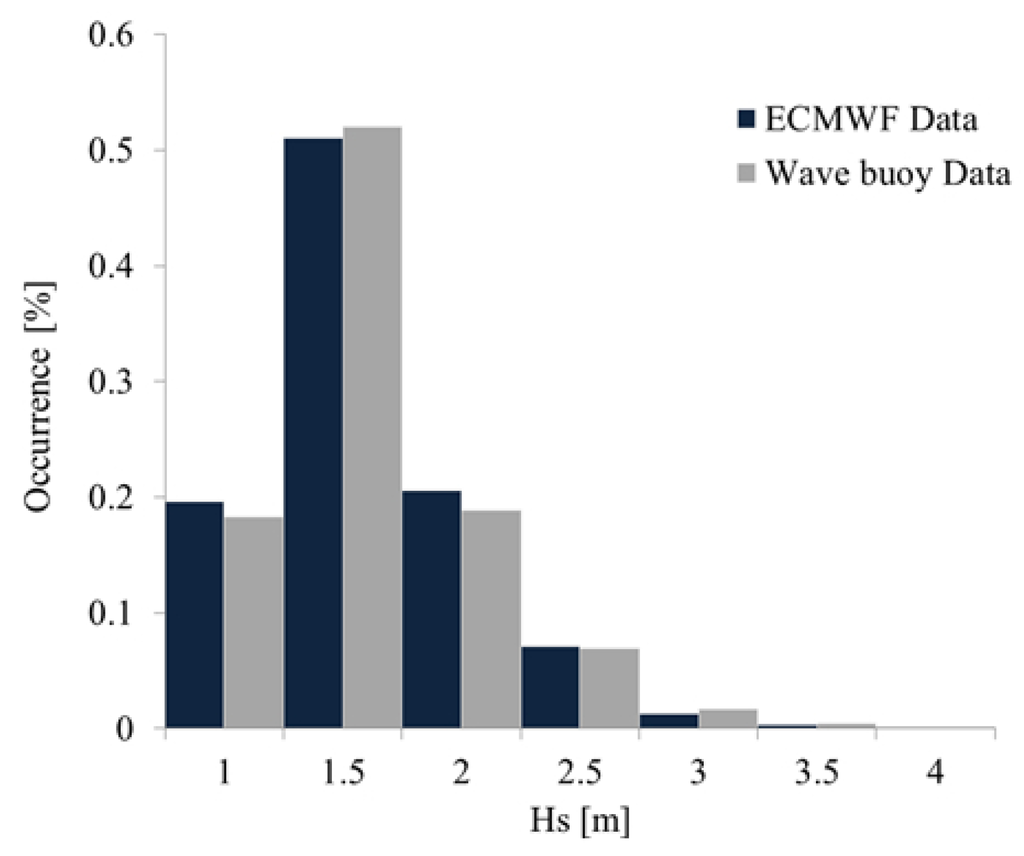
Figure 10.
Comparison of measured (1996) and calculated percentage of significant wave height occurrence at site S1.
Following the assessment of the available mean offshore power, a more detailed study of realistic prospective of energy production in selected areas, representative of the north-central portion of the Santa Catarina coastline, was carried out. In this vein, eight study sites have been analyzed. These points, termed S1–S8, are located in 20-m deep water (Figure 11). As explained above, this region shows a rugged coastline, where energy flux experiences significant spatial variability in relation to dissipation by bottom friction and wave breaking or refraction/diffraction. Therefore, the choice of maintaining the distance of study sites, related to the 20-m deep water, make it possible to display a quite general characterization of inshore energetic pattern results with more comparable results. Moreover, to accurately define wave patterns in very shallow water, a detailed bathymetry is required, which is not attainable by General Bathymetric Chart of the Oceans [58].
At the second stage, additional feasibility considerations are drawn from real perspectives for harvesting wave energy at the optimal WEC farm installation sites.
3.2. Data and Methods
In order to consider the intricate spatial variations in wave power occurring nearshore of the coast of Santa Catarina, the nearshore energetic patterns have been studied by means of the numerical suite Mike 21 SW spectral wave model. This is a stationary, directionally decoupled parametric model, which takes into account the effects of refraction and shoaling due to varying depths, local wind generation, and energy dissipation, due to bottom friction and wave-breaking. In order to consider the effects of currents, the basic equations in the model are derived from the conservation equation for the spectral wave action density, based on the approach proposed by the authors of [59]. The implicit assumption of this equation is that properties of the medium (water depth and current), as well as the wave field itself, vary over time and space scales that are much larger than the variation scales of a single wave. A parameterization of the conservation equation in the frequency domain is performed by introducing the zero-th and the first moment of the action spectrum as dependent variables. The MIKE 21 SW lateral boundary conditions were considered symmetrical. A high-resolution grid has been used to provide reliable estimates of wave power in coastal waters. Such a grid was characterized by an equally spaced mesh with the resolution Dx = Dy = 150 m. The reference bathymetry at the grid nodes was interpolated from a gridded bathymetrical data set, named GEBCO_2014 Grid. This is the latest release of the 30 arc-second global bathymetric grid provided by General Bathymetric Chart of the Oceans [58].
The wave model was run, forced wave-by-wave, with data from the ERA-interim, from January 2004, to December 2014, related to four source points: P8, P9, P10, and P11. The basic data necessary to fulfill the offshore requirements are the significant wave height (Hm0), mean wave period (Tm), and mean wave direction (θm), provided by 6-h hindcast wave data. The given waves were propagated from depths of 100–300 m (P8 and P11, respectively) to depths of 20 m. Wave power series has been calculated from the resulting dataset provided by the transformation model. In fact, for each nearshore wave, the corresponding energy period has been computed in order to allow the calculation of the related power value by Equation (1). The following energy density results are based, hence, on a 10-year-average.
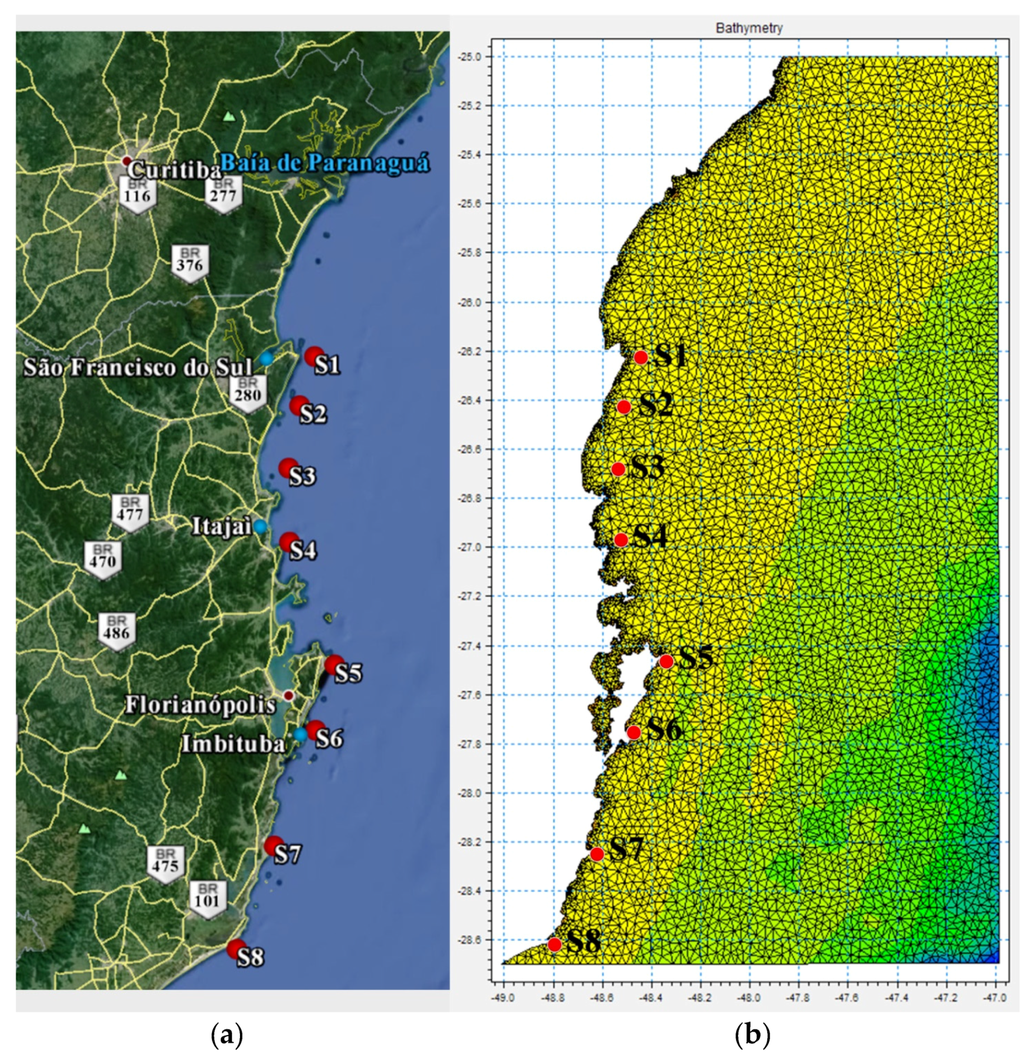
Figure 11.
(a) Map of Santa Catarina coast showing the location of 8 study sites and the location of ports (light blue points); (b) Bathymetry implemented in MIKE 21 SW.
3.3. Results
Table 4 reports the main wave climate parameters, while the mean wave power and yearly energy are shown in Table 5.

Table 4.
Main wave climate parameters at each study site.
| Site | Hs,mean | Hs,max | Hs,min | σH | Tm, mean | Tm, max | σT | Te,mean | θm |
|---|---|---|---|---|---|---|---|---|---|
| (m) | (m) | (m) | (m) | (s) | (s) | (s) | (s) | (°) | |
| S1 | 1.48 | 4.05 | 0.64 | 0.44 | 7.81 | 15.83 | 1.34 | 8.91 | 105 |
| S2 | 1.52 | 4.16 | 0.62 | 0.44 | 7.58 | 15.35 | 1.30 | 8.64 | 103 |
| S3 | 1.30 | 4.02 | 0.61 | 0.38 | 7.67 | 15.65 | 1.36 | 8.75 | 103 |
| S4 | 1.32 | 4.12 | 0.60 | 0.38 | 7.70 | 15.70 | 1.36 | 8.78 | 97 |
| S5 | 1.73 | 4.58 | 0.76 | 0.50 | 8.02 | 16.00 | 1.53 | 9.14 | 114 |
| S6 | 1.83 | 5.17 | 0.76 | 0.56 | 8.10 | 16.16 | 1.55 | 9.23 | 112 |
| S7 | 1.82 | 5.14 | 0.71 | 0.57 | 8.04 | 16.27 | 1.56 | 9.16 | 117 |
| S8 | 1.96 | 5.53 | 0.76 | 0.61 | 8.01 | 16.52 | 1.52 | 9.14 | 119 |
| Mean | 1.62 | 4.48 | 0.70 | 0.48 | 7.87 | 15.93 | 1.44 | 8.97 | 109 |
| σ | 0.25 | 0.74 | 0.06 | 0.09 | 0.20 | 0.38 | 0.11 | 0.23 | 7.68 |

Table 5.
Average wave power and yearly energy per meter of wave front at each study site.
| Point | Average Power (kW/m) | Yearly Energy (MWh/m) | Lat | Lon |
|---|---|---|---|---|
| S1 | 8.67 | 75.95 | 26°13′36.95′′S | 48°25′14.03′′O |
| S2 | 8.83 | 77.35 | 26°25′30.06′′S | 48°29′17.82′′O |
| S3 | 9.92 | 86.90 | 26°40′35.37′′S | 48°32′18.94′′O |
| S4 | 10.13 | 88.74 | 26°58′29.69′′S | 48°32′11.17′′O |
| S5 | 12.31 | 107.84 | 27°28′14.91′′S | 48°20′1.45′′O |
| S6 | 13.25 | 116.07 | 27°43′46.89′′S | 48°26′50.86′′O |
| S7 | 13.95 | 122.20 | 28°12′7.52′′S | 48°37′4.60′′O |
| S8 | 14.35 | 125.71 | 28°37′21.98′′S | 48°47′50.51′′O |
| Mean | 11.43 | 100.09 | ||
| σP | 2.31 | 20.22 |
To identify the influence of each sea state on the total wave power, diagrams on yearly average source were assembled in Figure 12 and Figure 13. In each class, the significant wave height and energy period values are spaced, respectively, at 0.5 m and 0.5 s.
The mean nearshore power is about 11.4 kW/m, corresponding to 100 MWh/m per year, with a standard deviation of 2.3 kW/m. According to offshore power pattern, the nearshore energy flux decrease goes towards the north. It is possible to note that the energy loss due to wave-seabed interactions from power rate registered on longitude 47.5°O is 1.76 kW/m on average, ranging between 1.13 kW/m (S1) to 2.15 kW/m (S8). Furthermore, a non-negligible modification in the directional sectors have been noted, with the mean direction decreasing of about 15° in accordance with the rotation of wave fronts due to refraction (Table 4).
Change in directional sectors providing energy are more evident for sites S2–S4, where southerly components are strongly reduced by the natural cover of Santa Catarina Island. The low percentage of waves registered can be addressed by reflected waves from nearest bays. This is well highlighted by comparison with wave climate at site S5, located off the Gulf of Itajaí. General speaking, the energy is kept almost constant from wide to inshore; this is probably due to the fact that most of the waves are within the range 1–2 m, and the interaction with the seabed is minimal. It should be clarified that one effect of wave refraction, perhaps the most important with a view to selecting prospective wave farm sites, is the concentration of wave energy in certain inshore areas as a result of the irregular bathymetry [21]. However, no “hot spots” have been identified.
It important to note that, for all sites, over 60% of the total annual resources is related to waves with mean periods between 8.5 and 10.5 s, in accordance with a waveform for fully developed sea conditions. Nearshore study sites, in fact, are located about 135 km from the offshore source ECMWF points, placed on the vertical boundary of spatial domain considered.
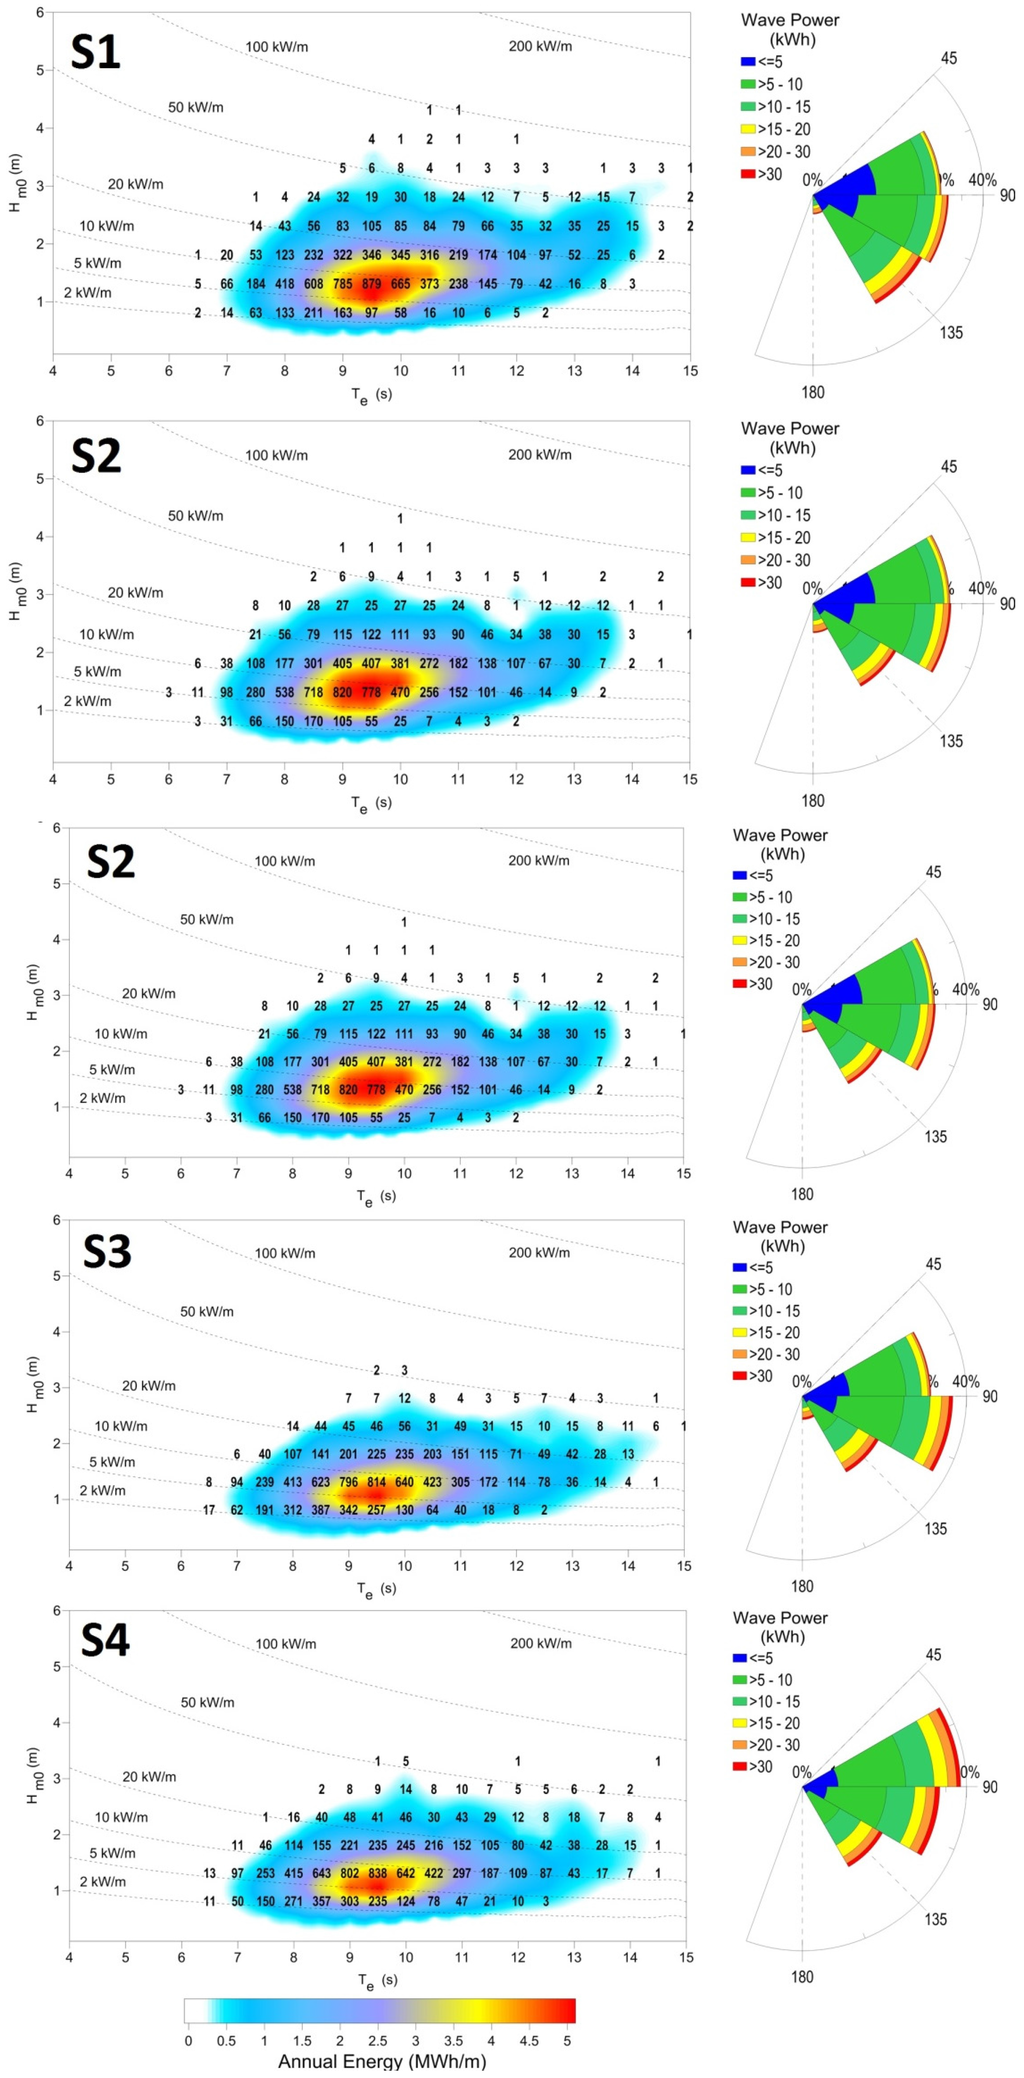
Figure 12.
Characterization of the yearly average wave energy points S1, S2, S3, S4 in terms of significant wave height (Hm0) and energy period (Te). The color scale represents annual energy per meter of wave front (in MWh/m). The numbers within the graph indicate the occurrence of sea states (in number of hours per year) and the isolines refer to wave power.
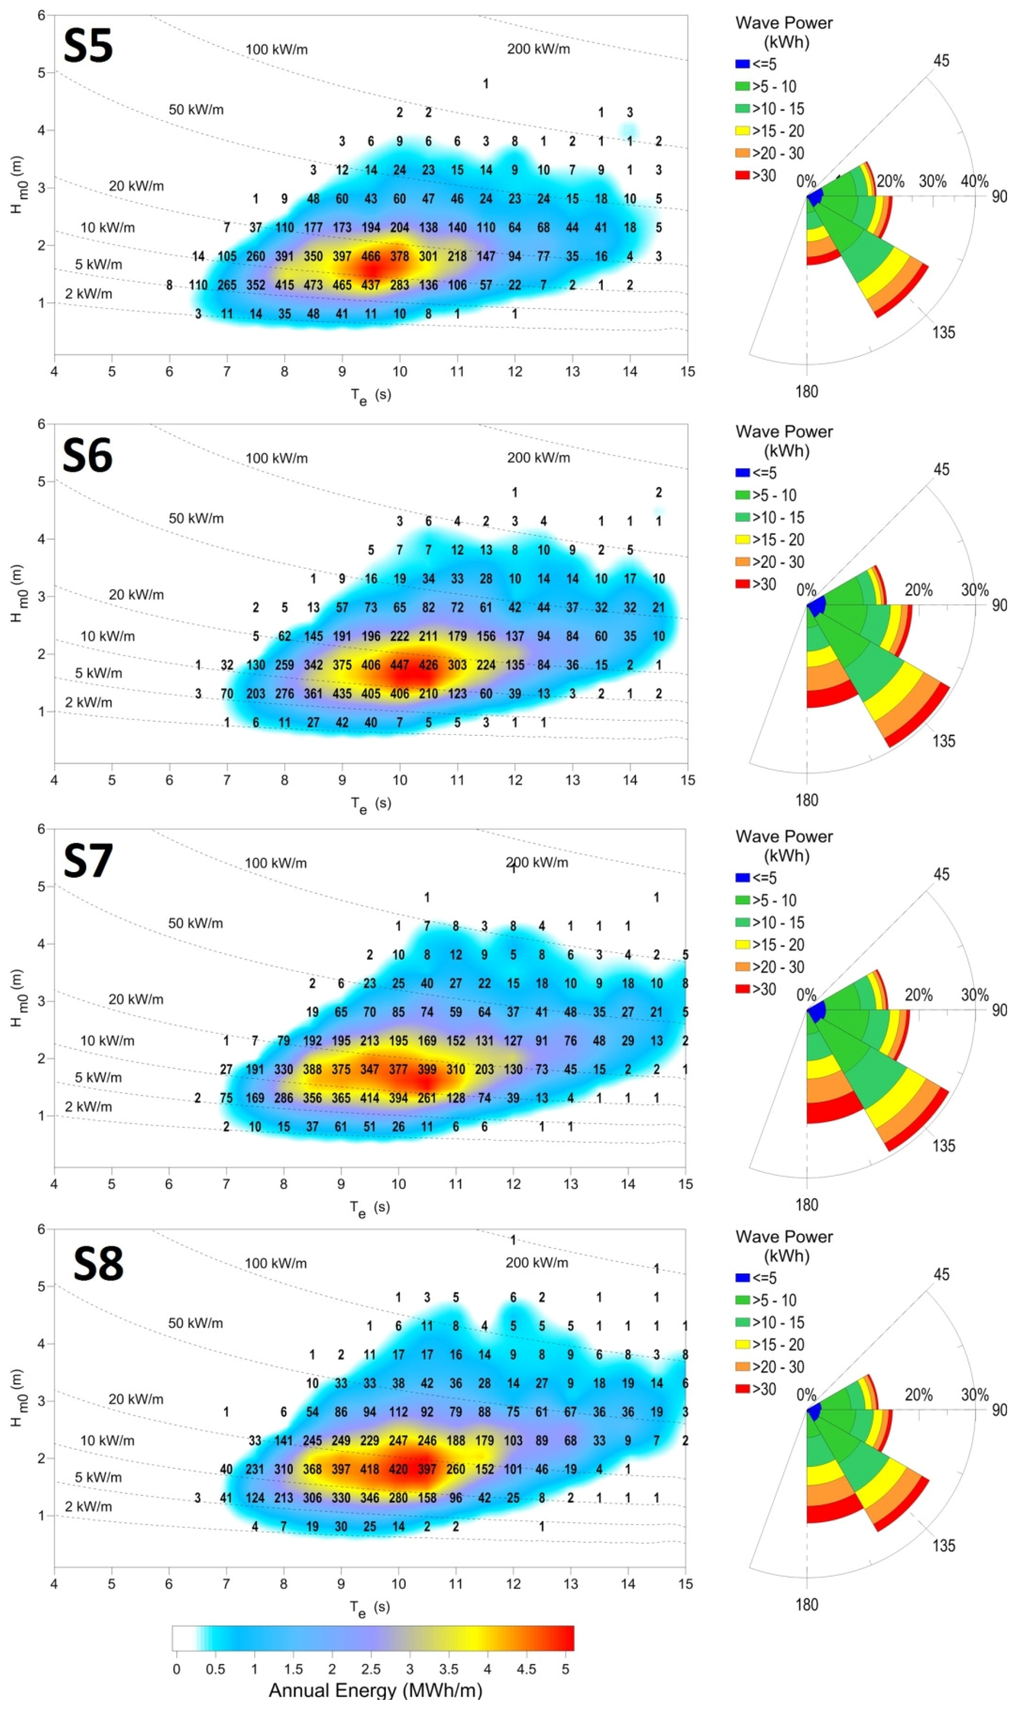
Figure 13.
Characterization of the yearly average wave energy points S5, S6, S7, S8 in terms of significant wave height (Hm0) and energy period (Te). The color scale represents annual energy per meter of wave front (in MWh/m). The numbers within the graph indicate the occurrence of sea states (in number of hours per year) and the isolines refer to wave power.
In order to envisage potential locations for WECs or WEC farms, an energy flux density contour on 20 m-isobaths was computed and shown by a color band, plotted along the analyzed coastline (Figure 14). The study sites could be related to potential locations for wave farms. However, despite overall positive requisites on wave sources, the realistic opportunity of extracting energy is always concluded by economic considerations. It is possible to note that, as 20 m is the average depth for both moored and founded WECs installations [24,60]. In fact, the greater the depth of the foundation/substructure/anchor system, the greater the costs. On the other hand, for installations in water depths less than 20 m, the WEC farm could experience a lower reliability due to more frequent breaking mechanisms and other nearshore related phenomena (corrosion due to sediment, increased fouling, etc.). Additionally, non-technical barriers (e.g., visual/environmental impact, minimum safety distance from coastline) could be more important.
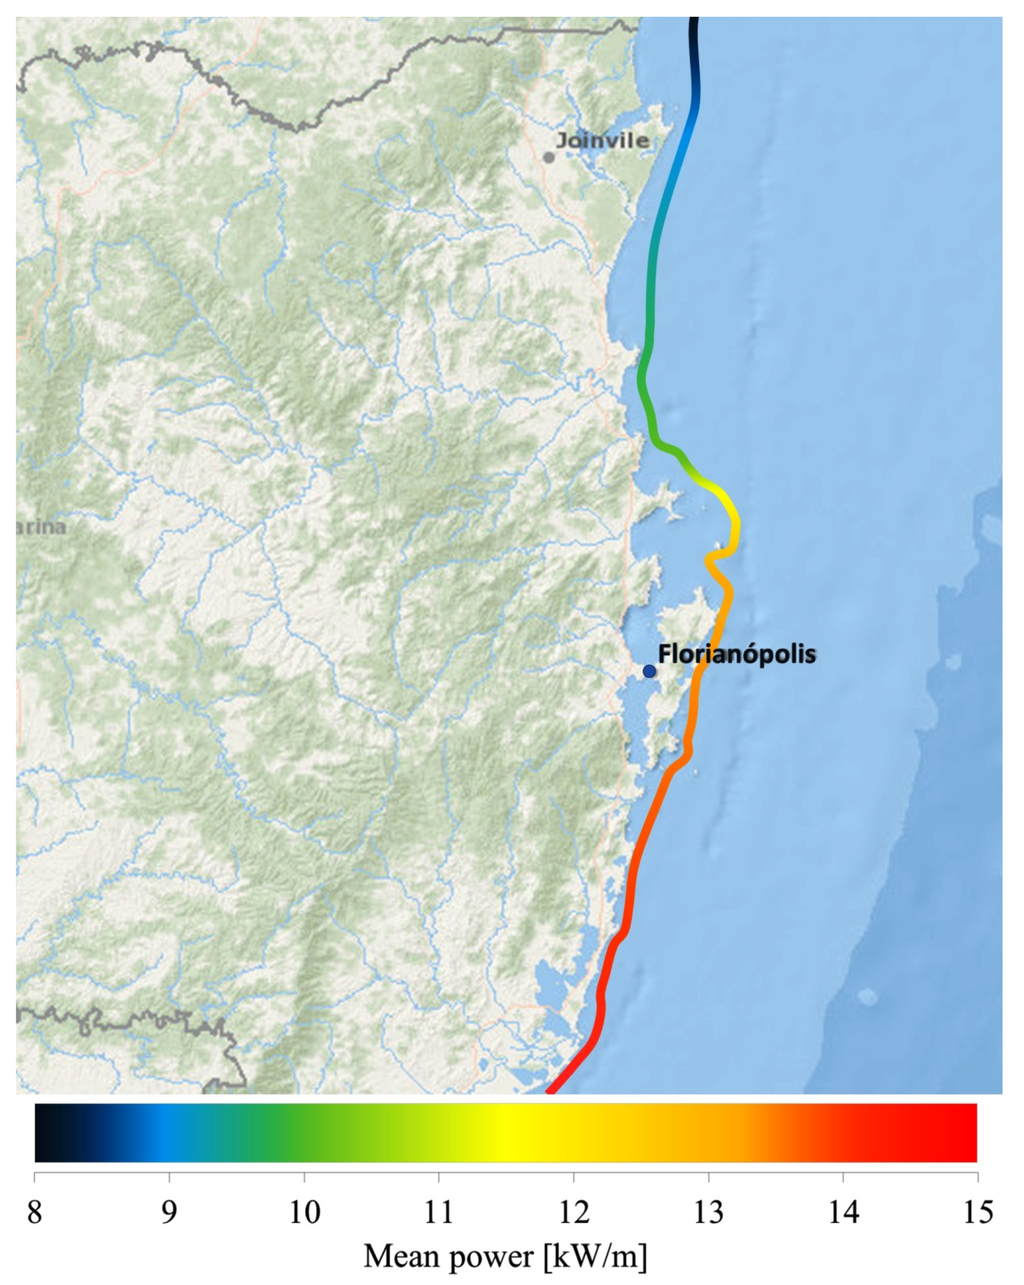
Figure 14.
Mean wave power flux per unit crest on north-central Santa Catarina coastline on 20 m-isobaths.
Based on the idea that construction and operational costs are related, principally, to accessibility from port facilities and to the proximity to grid transmission, the distances from port and urban aggregate were analyzed.
In Table 6, the distance of navigation of each site from ports (Itajaí, São Francisco do Sul and Imbituba) was reported. Table 7 shows the distance from which the crow flies: coastline, urban aggregate (as representative of presence of a distribution grid), and the nearest highway.

Table 6.
Distance of each site from the three ports in Santa Catarina.
| Sites | Dinstance from Port Facilities | ||
|---|---|---|---|
| São Franc. do Sul | Itajaí | Imbituba | |
| km | km | km | |
| S1 | 39 | 89 | 232 |
| S2 | 59 | 70 | 210 |
| S3 | 90 | 38 | 187 |
| S4 | 123 | 16 | 161 |
| S5 | 180 | 105 | 95 |
| S6 | 215 | 131 | 67 |
| S7 | 265 | 182 | 5 |
| S8 | 295 | 212 | 45 |

Table 7.
Distance of each site from the coastline, urban aggregate, and nearest highway.
| Sites | Distance from the Coastline | Distance from Urban Aggregate | Distance from Highway | ||
|---|---|---|---|---|---|
| km | km | Locality Name | km | Odonym | |
| S1 | 6 | 7 | Praia da Enseada | 7 | BR-280 |
| S2 | 13 | 12 | Bupeva | 16 | SC-415 |
| S3 | 14 | 15 | Barra Velha | 14 | SC-415 |
| S4 | 4 | 9 | Balneàrio Camboriù | 10 | SC-486 |
| S5 | 4 | 5 | Ingleses do Rio Vermelho | 7 | SC-406 |
| S6 | 6 | 6 | Campeche | 7 | SC-405 |
| S7 | 4 | 5 | Imbituba | 5 | SC-437 |
| S8 | 3 | 3 | Cabo de Santa Marta grande | 5 | SC-100 |
S2 and S3 are the furthest from the coastline. This means an increase in grid connection costs. S5, S6 and S8 are only a few kilometres away from villages that would be directly serviced with electricity, but the distance from port facilities is a drawback.
Crossing data from wave source and accessibility information, it is highlighted as S4 and S7 are the most obvious locations for wave farm installation. In fact, both sites are not far from port (about 16 km from Itajai and only 5 km from Imbituba, respectively) and from urban aggregates. In particular, the slightly greater distance of S4 from the electrical grid, compared to S7 (about 10 km against 5 km), and the comparison from an energetic point of view (10 kW/m against 14 kW/m) makes S7 one of the best locations for harvesting wave power.
4. Discussion
4.1. A Note on the Mean Period
The mean wave period of the ERA-Interim data base is defined as a zero-crossing mean wave period [61], i.e., the time interval between the start and the end of the wave (therefore defined with zero-crossing). The mean of this zero-crossing period, , can be defined as:
where i is the sequence number of the wave in the time record.
The mean zero-crossing period, also denoted as Tm02, can be obtained as:
It is well known [59] that the value of m2 is strongly sensitive to errors in the measurement or variations in analysis techniques for two main reasons: (1) the integration interval used to compute the moment from the spectrum should strictly range from f = 0 to f = ∞, whereas in actual practice it is from 0 to the Nyquist frequency, or less; and (2) the higher the order of the moment, the greater the enhancement of energy density at high frequencies. Therefore, another mean period is often used, defined as the inverse of the mean frequency of the wave spectrum:
This is, in fact, the mean wave period used in MIKE 21 SW. Now, the effective calculation procedure for Tm provided by ERA-interim dataset is not clear. In this vein, it should be noted as in [45] was highlighted that the average difference between the wave period from ERA-Interim and the energy wave period from the buoy was −0.3 s. In particular, the inter comparisons suggest that the ERA-Interim dataset shows encouraging agreement with the energy wave period. The validation of the ERA-Interim is out of the scope of the present paper, however, it is clear that the discrepancy in the calculation of the energy flux can be considerate acceptable from an engineering point of view. Furthermore, since the offshore/nearshore resource assessment is based on the same data source, and includes the same time period, the spatial pattern should remain broadly the same and the resource can be compared without bias.
4.2. Additional Consideration on Seasonal Stability
The low seasonal variability of wave energy sources in the study area represents one of the most important features of wave climate. It is well known that seasonal variations are in general considerably larger in the northern than in the southern hemisphere [62]. This makes the southern coasts of South America, Africa and Australia particularly attractive for wave energy exploitation [63]. A clear contrast can thus be exhibited between the high seasonal stability of wave potential along the coast of Santa Catarina and the significant variability of wave power production at other sites around the world. In Europe, where many wave energy test sites exist, and where many wave energy projects are under development, the seasonal wave power patterns indicate that the energy potential is larger in autumn and, particularly, in winter, while there is decay in spring and, especially, summer [20,21,22,24,25,26]. As shown by the authors of [25], there is considerable variability in the wave resources surrounding the Orkney archipelago (north of Scotland), with a stronger (~30–50 kW/m) resource during winter months, reducing to <10 kW/m during summer months, and [64] demonstrate that the wave power resources occurring during the winter months is four–five times greater than the summer potential. Off the Swedish west coast, the annual distribution of energy flux shows a markedly higher average energy flux, which is about six times higher than during the calm summer months [18].
Very important seasonal variability patterns can be obtained for the northern coastline of Spain [17,21] and along the Portuguese nearshore [20]. In the Central Mediterranean Sea, the seasonal variation is fairly high, rising to approximately 88% [26].
Hence, the very particular wave-climate stability makes the Santa Catarina coastline one of the most suitable regions for further installations of WEC pilots or pre-commercial WEC farms.
4.3. Characterization of the Wave Resource for Wave Energy Converter Selection
Large-scale wave energy has recently been found to provide a relatively high capacity value, and costs less to integrate than equivalent amounts of wind energy [65]. This is a key factor for accelerating the economic growth of wave energy in Brazil, which is the eighth-largest total energy consumer in the world and has the third-largest electricity sector in the Americas, behind the United States and Canada.
Conventional wisdom holds that a high wave power level is the determinant requirement for the productivity of a wave farm. However, the relationship is much more complex than this simple formulation. The gross wave energy resource is not an appropriate measure for determining the productivity of a site. In fact, wave power makes no allowance for the temporal and directional distribution of incident waves and the limitations of the WECs to capture energy in low and high energetic sea states.
The offshore and onshore characterization of wave climate along the north-central coastline of Santa Catarina allows some considerations. Despite the fact that wave climate is relatively mild, in terms of potential usefulness, this area represents one of the most favorable in the Atlantic Ocean.
The reason is straightforward and can be summarized as follow:
- practically all the energy flux comes from the sector 100°–170° and is provided by waves of significant height, between 1.5 and 2.5 m, with peak periods between 8 and 10 s;
- a good level of seasonal stability, as highlighted, with a mean standard deviation of about 3 kW/m;
- very poor occurrence (about 4%) of a calm sea state (i.e., wave climate characterized by wave height less than 0.85 m);
- few extreme storms are possible, meaning that WECs are exposed to less severe, large environmental forces.
The quality of the wave source, in this case, can be measured by the amount of the exploitable wave power per unit of total energy flux. Underestimating the importance of this aspect (and its economic implications) could be a mistake. In other words, the characteristics of the waves providing the power should always be taken into account. This could be a more adequate measure of feasibility of a wave farm in terms of energy production, and appear to vary considerably in accordance with energy flux distribution and directional analyses. The “on site” WEC calibration may be established as function of these effective productive sea states, in order to guaranty that performances are not compromised. Obviously, if the effective sea states have a narrow range of wave parameters and show seasonal stability, the tuning phase is simplified and the WEC will operate more frequently at a full regime. In this vein, an example application is provided in the following subsection.
Wave Energy Converter application at Imbituba Port
One issue that has been considered could be the perspective of an expansion of the existing port in Imbituba. The hypothesis of a new maritime dam could be of interest in the harvesting of wave potential through a WEC integrated in the breakwater. This application presents some advantages:
- operation and maintenance are easier compared to an offshore installation;
- sharing of infrastructures and, hence, reduction in WEC construction costs.
The very high cost of the wave energy converters (WECs) is one of the main disadvantages for the future commercialization of these innovative devices. A solution for their integration in coastal defense structures could bring several advantages. Coastal engineers generally design breakwaters with the aim to “dissipate incoming wave energy”, mainly by wave-breaking and porous flow in the mound, and/or partly reflecting wave back to the sea, and transmission into a harbor due to penetration and overtopping. Modern coastal engineers should start to move from this traditional design approach to a new concept of “capturing the wave energy”.
Under the aspects highlighted in the previous section, considering the main maritime defense of Imbituba port is a 1-km in length, rubble mound breakwater, the performance of an innovative embedded wave energy converter is evaluated. To date, there exist few demonstrations of wave power plants supplying electricity to the grid. However, the only specific technology used for rubble mound integrated installations is a device named OBREC (Overtopping Breakwater for Energy Converter). The device consists of a rubble mound breakwater with a front reservoir, designed with the aim of capturing wave overtopping in order to produce electricity. The energy is extracted via low head turbines, using the difference in water levels between the reservoir and the mean sea water (Figure 15). It is worth-mentioning that OBREC can be integrated, not only in new breakwater, but the design can also be applied in harbor expansion or existing breakwater maintenance [6].
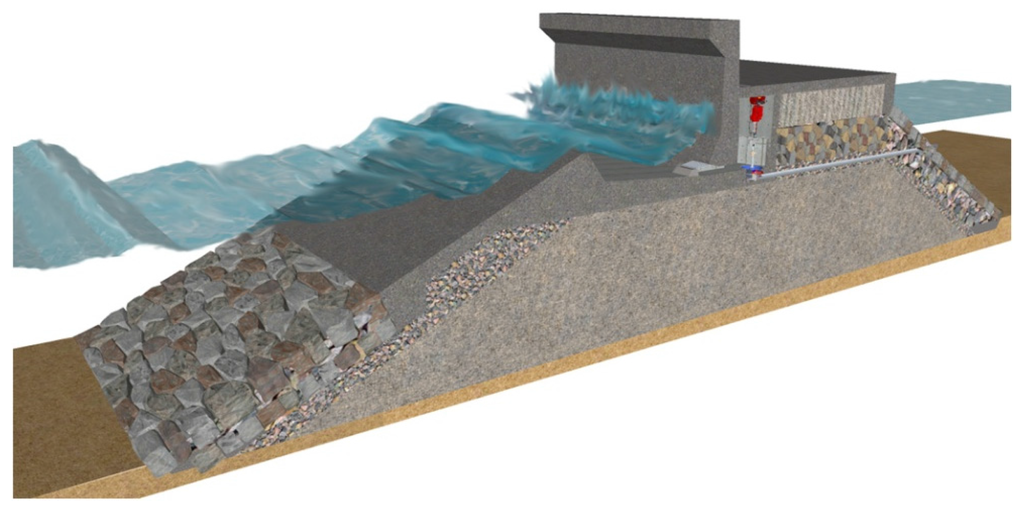
Figure 15.
3D Overtopping Breakwater for Energy Converter (OBREC) model, with the innovative seawall placed on rubble mound breakwater.
The characteristics of the waves that provide the power appear to vary considerably in accordance with previous energy flux propagation and directional analyses. The approximately 12-m deep water at the toe of breakwater ensures no great dissipation from point S7 at 20m-isobaths. For directional analyses, it is assumed that the bulk of energy comes from a sector of 90°. The exiting breakwater is oriented to 160°N, while the extension could be considered at 180° in order to maintain a safe manoeuvring area at the harbor entrance. Therefore, in the simulation, only waves coming from the sector of 45°–135° have been considered. Hence, the wave climate obtained for point S7 was the first limited according to this narrower sector. As consequence, about 8% of calm was derived. The resulting wave climate has been summarized in Table 8.

Table 8.
Wave climate at Imbituba Port, summarized in percentage of occurrence during the year, for three main directions.
| Hs (m) | Frequency of Occurrence | ||
|---|---|---|---|
| NE | E | SE | |
| 0.75 | 0.44 | 3.40 | 0.67 |
| 1.25 | 2.54 | 12.59 | 2.83 |
| 1.75 | 1.20 | 7.30 | 2.89 |
| 2.25 | 0.44 | 2.90 | 1.54 |
| 2.75 | 0.09 | 0.76 | 0.56 |
| 3.25 | 0.05 | 0.43 | 0.30 |
| 3.75 | 0.00 | 0.09 | 0.10 |
| 4.25 | 0.00 | 0.04 | 0.02 |
Then, the waves were grouped by classes of Hs–Te. In particular, a value of Hs is assigned by performing a weighted average of the values of Hs in the neighbor classes, based on their annual frequency. The power level decreases from the total 13.95 kW/m to an exploitable level of 5.1 kW/m. Each power class has been computed by the code OBRECsim, a specially designed numerical model used to simulate energy production for OBREC.
The model take into account the level of efficiency:
- -
- Efficiency of the ramp, i.e., rate of total incident power overtopping the crests;
- -
- Efficiency of the reservoir, in terms of potential energy stored or lost for overflow in the reservoirs;
- -
- Low head Kaplan turbines efficiency, as potential energy transformed into kinetic energy by turbines and related to start/stop penalties and whole electromechanical power take-off (PTO) and generator efficiency.
Generation of the time series is based on the mean water flow into the reservoir. The mean water flow is found using experiments with a model of OBREC, carried out in 2014 at Aalborg University [66]. An optimal ramp crest freeboard of 2 m above mean water level was determined. Being the first full-scale prototype installed at Naples Harbor (Italy), and with monitoring having started in November 2015, no definitive power matrix is available; therefore, conservative values for efficiency parameters are adopted.
The OBREC power rate in Imbituba was computed in about 0.8 kW/m (i.e., wave to wire efficiency of 15.6%). In the hypothesis of an extension of 500 m of the exiting breakwater, over 3500 MWh of electricity could be provided by the embedded device. This energy could provide household consumption for 6500 habitants, i.e., 16% of the total population in Imbituba. The main reason why coastal managers should be interested in this technology is that its installation is not much more expensive than building a traditional rubble mound breakwaters with cyclopean artificial stones and a crown wall. Furthermore, improvements of the OBREC breakwater, compared to a traditional solution, can provide others potential advantage, such as:
- -
- recirculation of water inside the harbor;
- -
- minimal environmental impact of the operating system
- -
- broad social acceptance due to “blue energy” production and its environmentally sustainable solution.
5. Conclusions
The present study has provided a preliminary assessment of wave energy resources available in the state of Santa Catarina (Brazil). This Brazilian state revealed the highest economic well-being and where wave power could be a promising alternative to traditional energy supplies. Wave climate has been analyzed and characterized in terms of wave direction, height, and period using a 10-year period, ECMWF wave forecasting data for 19 grid points. The nearshore energetic patterns have been studied by means of a numerical coastal propagation model (Mike21 SW). The average wave power density at 20 m water deep ranges between 8 kW/m in sheltered areas to about 14.5 kW/m. If related to the others southernmost states facing the Atlantic, the wave power prospective in Santa Caterina seas is poorer, as predicted. Nevertheless, despite the fact that a relatively lower power level was registered, wave resources show a very high seasonal stability, which represents a prominent feature if considering the state-of-the-art in wave energy harvester technology. Furthermore, the bulk of energy flux comes from the sector 100°–170° and is provided by waves of significant height, between 1.5 and 2.5 m, with peak periods between 8 and 10 s. There is little doubt that the north-central Santa Catarina coastline represents one of the most suitable regions for further installations of WEC pilots or the first commercial WEC farms. The poor dispersion of wave parameters around theirs mean values, in fact, allows simplification of the design of WECs, since the tuning parameters may be more simply established to optimize WEC performance. The rarity of tropical hurricanes ensure that the WECs’ structures are not exposed to large environmental forces, which could be catastrophic in economic terms. This coastal area, hence, is an important candidate to be the next optimal study site for several kind of WECs. For the beaches along the coast of Santa Catarina, in particular, multifunctional structures like harbor or coastal protection breakwaters, equipped with a WEC, are recommended. A study case has been analyzed in the locality of Imbituba, making the hypothesis of an extension of the exiting breakwater with an innovative embedded WEC technology, and satisfactory results could be found. In the case of relatively low energetic locations, in fact, this configuration seems like a promising compromise in order to share the construction costs, thus enhancing its value of use.
Acknowledgments
The work described in this paper was supported by the EC FP7 Marie Curie Actions People, Contract PIRSES-GA-2011-295162–ENVICOP project (Environmentally Friendly Coastal Protection in a Changing Climate). The authors would like to thank Marcus Polette and Universidade do Vale do Itajaí for their cheerfulness, tolerance and considerable assistance. The numerical model OBRECsim and experimental analysis were developed during the National Operational Programme for ′′Research and Competitiveness′′ 2007–2013 (NOP for R&C) founded project PON04a3_00303 titled “DIMEMO-DIga Marittima per l’Energia del Moto Ondoso” (Maritime Breakwater for Wave Energy Conversion). Authors gratefully acknowledge the Italian Ministry of Education, University and Research (MIUR) for supporting this innovative research.
Author Contributions
Pasquale Contestabile wrote the paper draft. Diego Vicinanza and Vincenzo Ferrante revised the paper draft and Pasquale Contestabile updated the paper according to their review.
Conflicts of Interest
The authors declare no conflict of interest.
References
- Azzellino, A.; Conley, D.; Vicinanza, D.; Kofoed, J.P. Marine renewable energies: Perspectives and implications for marine ecosystems. Spec. Issue Sci. World J. 2013, 1, 1–3. [Google Scholar] [CrossRef] [PubMed]
- Azzellino, A.; Ferrante, V.; Kofoed, J.P.; Lanfredi, C.; Vicinanza, D. Optimal siting of offshore wind-power combined with wave energy through a marine spatial planning approach. Int. J. Mar. Energy 2013, 3, 11–25. [Google Scholar] [CrossRef]
- Vicinanza, D.; Ciardulli, F.; Buccino, M.; Calabrese, M.; Koefed, J.P. Wave loadings acting on an innovative breakwaters for energy production. J. Coastal Res. 2011, 64, 608–612. [Google Scholar]
- Vicinanza, D.; Margheritini, L.; Kofoed, J.P.; Buccino, M. The SSG wave energy converter: Performance, status and recent developments. Energies 2012, 5, 193–226. [Google Scholar] [CrossRef]
- Buccino, M.; Banfi, D.; Vicinanza, D.; Calabrese, M.; del Giudice, G.; Carravetta, A. Non breaking wave forces at the front face of seawave slotcone generators. Energies 2012, 5, 4779–4803. [Google Scholar] [CrossRef]
- Vicinanza, D.; Contestabile, P.; Nørgaard, J.; Andersen, L.T. Innovative rubble mound breakwaters for overtopping wave energy conversion. Coastal Eng. 2014, 88, 154–170. [Google Scholar] [CrossRef]
- Buccino, M.; Stagonas, D.; Vicinanza, D.; Muller, G. Development of a composite sea wall wave energy converter system. Renew. Energy 2015, 81, 509–522. [Google Scholar] [CrossRef]
- Buccino, M.; Vicinanza, D.; Salerno, D.; Banfi, D.; Calabrese, M. Nature and magnitude of wave loadings at seawave slot-cone generators. Ocean Eng. 2015, 95, 34–58. [Google Scholar] [CrossRef]
- Cruz, J. Ocean Wave Energy. In Current Status and Future Perspectives; Springer: Heidelberg, Germany, 2008. [Google Scholar]
- Nielsen, K.; Meyer, N.I. The danish wave energy programme. In Proceedings of the 3rd European Wave Energy Conference, Patras, Greece, 30 September–2 October 1998.
- Pontes, M.T. Assessing the European wave energy resource. J. Offshore Mech. Arct. Eng. 1998, 120, 226–231. [Google Scholar] [CrossRef]
- Pontes, M.T.; Athanassoulis, G.A.; Barstow, S.; Bertotti, L.; Cavaleri, L.; Holmes, B. The European wave energy resource. In Proceedings of the 3rd European Wave Energy Conference, Patras, Greece, 30 September–2 October 1998.
- Thorpe, T.W. The wave energy programme in the UK and the European wave energy network. In Proceedings of the 4th European Wave Energy Conference, Aalborg, Denmark, 4–6 December 2000.
- Clement, A.; McCullen, P.; Falcao, A.; Fiorentino, A.; Gardner, F.; Hammarlund, K.; Lemonis, G.; Lewis, T.; Nielsen, K.; Petroncini, S.; et al. Wave energy in Europe: Current status and perspectives. Renew. Sustain. Energy Rev. 2002, 6, 405–431. [Google Scholar] [CrossRef]
- Pontes, M.T.; Aguiar, R.; Pires, H.O. A nearshore wave energy atlas for Portugal. J. Offshore Mech. Eng. 2005, 127, 249–255. [Google Scholar] [CrossRef]
- Folley, M.; Whittaker, T.J.T. Analysis of the nearshore wave energy resource. Renew. Energy 2009, 24, 1709–1715. [Google Scholar] [CrossRef]
- Iglesias, G.; Carballo, R. Wave energy potential along the Death Coast (Spain). Energy 2009, 34, 1963–1975. [Google Scholar] [CrossRef]
- Waters, R.; Engstrom, J.; Isberg, J.; Leijon, M. Wave climate off the Swedish west coast. Renew. Energy 2009, 34, 1600–1606. [Google Scholar] [CrossRef]
- Mollison, D.; Pontes, M.T. Assessing the Portuguese wave-power resource. Energy 2009, 17, 255–268. [Google Scholar] [CrossRef]
- Rusu, E.; Guedes Soares, C. Numerical modeling to estimate the spatial distribution of the wave energy in the Portuguese nearshore. Renew. Energy 2009, 34, 1501–1516. [Google Scholar] [CrossRef]
- Iglesias, G.; Carballo, R. Wave energy resource in the Estaca de Bares area (Spain). Renew. Energy 2010, 35, 1574–1584. [Google Scholar] [CrossRef]
- Iglesias, G.; Carballo, R. Wave resource in El Hierro—An island towards energy self-sufficiency. Renew. Energy 2011, 36, 689–698. [Google Scholar] [CrossRef]
- Vicinanza, D.; Cappietti, L.; Ferrante, V.; Contestabile, P. Estimation of the wave energy in the Italian offshore. J. Coastal Res. 2011, 64, 613–617. [Google Scholar]
- Vicinanza, D.; Contestabile, P.; Ferrante, V. Wave energy potential in the north-west of Sardinia (Italy). Renew. Energy 2013, 50, 506–521. [Google Scholar] [CrossRef]
- Neill, S.P.; Lewis, M.J.; Haschemi, M.R.; Slater, E.; Lawrence, J.; Spall, S.A. Inter-annual and inter-seasonal variability of the Orkney wave power resource. Appl. Energy 2014, 132, 339–348. [Google Scholar] [CrossRef]
- Iuppa, C.; Cavallaro, L.; Vicinanza, D.; Foti, E. Investigation of suitable sites for wave energy converters around Sicily (Italy). Ocean Sci. 2015, 11, 1–15. [Google Scholar] [CrossRef]
- Venugopal, V.; Nemalidinne, R. Wave resource assessment for Scottish waters using a large scale North Atlantic spectral wave model. Renew. Energy 2015, 76, 503–525. [Google Scholar] [CrossRef]
- Jadidoleslam, N.; Özger, M.; Airaliolu, N. Wave power potential assessment of Aegean Sea with an integrated 15-year data. Renew. Energy 2016, 86, 1045–1059. [Google Scholar] [CrossRef]
- Lanfredi, N.W.; Pousa, J.L.; Mazio, C.A.; Dragani, W.C. Wave-power potential along the coast of the province of Buenos Aires, Argentina. Energy 1992, 17, 997–1006. [Google Scholar] [CrossRef]
- Cornett, A. Inventory of Canada’s Marine Renewable Energy Resources; Canadian Hydraulics Centre, National Research Council of Canada: Ottawa, ON, Canada, 2006. [Google Scholar]
- Wilson, J.H.; Beyene, A. California wave energy resource evaluation. J. Coastal Res. 2007, 23, 679–690. [Google Scholar] [CrossRef]
- Define, Z.; Haas, K.A.; Fritz, H.M. Wave power potential along the Atlantic coast of the Southeastern USA. Renew. Energy 2009, 34, 2197–2205. [Google Scholar] [CrossRef]
- Dunnett, D.; Wallace, J.S. Electricity generation from wave power in Canada. Renew. Energy 2009, 34, 179–195. [Google Scholar] [CrossRef]
- Chen, F.; Lu, S.M.; Tseng, K.T.; Lee, S.C.; Wang, E. Assessment of renewable energy reserves in Taiwan. Renew. Sustain. Energy Rev. 2010, 14, 2511–2528. [Google Scholar] [CrossRef]
- Hemer, M.A.; Griffin, D.A. The wave energy resource along Australia’s Southern margin. J. Renew. Sustain. Energy 2010, 2. [Google Scholar] [CrossRef]
- Hughes, M.G.; Heap, A.D. National-scale wave energy resource assessment for Australia. Renew. Energy 2010, 35, 1783e91. [Google Scholar] [CrossRef]
- Kim, G.; Jeong, W.M.; Lee, K.S.; Jun, K.; Lee, M.E. Offshore and nearshore wave energy assessment around the Korean Peninsula. Energy 2011, 36, 1460–1469. [Google Scholar] [CrossRef]
- Lenee-Bluhm, P.; Paasch, R.; Özkan-Haller, H.T. Characterizing the wave energy resource of the US Pacific Northwest. Renew. Energy 2011, 36, 2106–2119. [Google Scholar] [CrossRef]
- Stopa, J.E.; Cheung, K.F.; Chen, Y.L. Assessment of wave energy resources in Hawaii. Renew. Energy 2011, 36, 554–567. [Google Scholar] [CrossRef]
- Zheng, C.; Pan, J.; Li, J. Assessing the China Sea wind energy and wave energy resources from 1988 to 2009. Ocean Eng. 2013, 65, 39–48. [Google Scholar] [CrossRef]
- Aydogan, B.; Ayat, B.; Yüksel, Y. Black Sea wave energy atlas from 13 years hindcasted wave data. Renew. Energy 2013, 57, 436–447. [Google Scholar] [CrossRef]
- Ly, D.K.; Aboobacker, V.M.; Abundo, S.M.L.; Srikanth, N.; Tralich, P. Wave energy resource assessment for Southeast Asia. In Proceedings of the 5th International Conference on Sustainable Energy and Environment (SEE), Science, Technology and Innovation for Association of Southeast Asian Nations (ASEAN) Green Growth, Bangkok, Thailand, 19–21 November 2014.
- Robertson, B.; Hiles, C.; Buckham, B. Characterizing the nearshore energy resources on the west coast of Vancouver Island. Renew. Energy 2014, 71, 665–678. [Google Scholar] [CrossRef]
- Appendini, C.M.; Urano-Latorre, C.P.; Figueroa, B.; Dagua-Paz, C.J.; Torres-Freyermuth, A.; Salles, P. Wave energy potential assessment in the Caribbean Low Level Jet using wave hindcast information. Appl. Energy 2015, 137, 375–384. [Google Scholar]
- Sanil Kumar, V.; Anoop, T.R. Wave energy resource assessment for the Indian shelf seas. Renew. Energy 2015, 76, 212–219. [Google Scholar] [CrossRef]
- European Centre for Medium-Range Weather Forecasts. Available online: http://www.ecmwf.int/ (accessed on 31 July 2015).
- Pianca, C.; Mazzini, P.L.F.; Siegle, E. Brazilian offshore wave climate based on NWW3 reanalysis. Braz. J. Oceanogr. 2010, 58, 53–70. [Google Scholar] [CrossRef]
- Hagerman, G. Southern New England wave energy resource potential. In Proceedings of Building Energy, Boston, MA, USA, 21–24 March 2001.
- Cornett, A.M. A global wave energy resource assessment. In Proceedings of the International Offshore and Polar Engineering Conference, Vancouver, BC, Canada, 6–11 July 2008.
- Tucker, M.J. Wave in Ocean Engineering; Ellis Horwood: New York, NY, USA, 1991. [Google Scholar]
- ABP Marine Environmental Research Ltd. Atlas of UK Marine Renewable Energy Resources: Technical Report; Report No. R.1106 Prepared for the UK Department of Trade and Industry; ABP Marine Environmental Research Ltd.: Southampton, UK, 2004. [Google Scholar]
- Taljaard, J.J. Development, distribution and movement of cyclones and anticyclones in the Southern Hemisphere during the IGY. J. Appl. Meteorol. Climatol. 2008, 6, 973–987. [Google Scholar] [CrossRef]
- Nimer, E. Climatology of Brazil; IBGE Instituto Brasileiro de Geografia e Estatística: Rio de Janeiro, Brazil, 1989. [Google Scholar]
- Lima, L.C.E.; Satyamurti, H.E. An observational study of formation and trajectory of extratropical cyclones in South America. Proc. Braz. Congress Meteorol. 1992, 2, 706–710. [Google Scholar]
- Evans, J.L.; Braun, A.J. A climatology of subtropical cyclones in the South Atlantic. J. Clim. 2012, 25, 7328–7340. [Google Scholar] [CrossRef]
- Nobre, C.A.; Cavalcanti, M.A.G.; Nobre, P.; Kayano, M.T.; Rao, V.B.; Bonatti, J.P.; Satyamurti, P.; Uvo, C.B.; Cohen, J.C. Aspectos da Climatologia Dinâmica do Brasil; Climanálise Número Especial: Cachoeira Paulista, Brasil, 1986; p. 124. [Google Scholar]
- Alves, J.G.M.; Melo, E. Measurement and modeling of wind waves at the northern coast of Santa Catarina. Brazil Rev. Bras. Oceanogr. 2001, 49. [Google Scholar] [CrossRef]
- General Bathymetric Chart of the Oceans. Available online: http://www.gebco.net/ (accessed on 31 July 2015).
- Holthuijsen, L.H.; Booij, N.; Herbers, T.H.C. A prediction model for stationary, short-crested waves in shallow water with ambient currents. Coastal Eng. 1989, 13, 23–54. [Google Scholar] [CrossRef]
- Leijon, M.; Waters, R.; Rahm, M.; Svensson, O.; Bostrom, C.; Stromstedt, E.; Engstrom, J.; Tyrberg, S.; Savin, A.; Gravrakmo, H.; et al. Catch the wave from electricity. IEEE Power Energy Mag. 2009, 7, 50–54. [Google Scholar] [CrossRef]
- Dee, D.P.; Uppala, S.M.; Simmons, A.J.; Berrisford, P.; Poli, P.; Kobayashi, S.; Andrae, U.; Balmaseda, M.A.; Balsamo, G.; Bauer, P.; et al. The ERA-Interim reanalysis: Configuration and performance of the data assimilation system. Quart. J. R. Meteorol. Soc. 2011, 137, 553–597. [Google Scholar] [CrossRef]
- Barstow, S.; Gunnar, M.; Mollison, D.; Cruz, J. The wave energy resource. In Ocean Wave Energy; Cruz, J., Ed.; Springer: Berlin, Germany, 2008; pp. 93–132. [Google Scholar]
- Falcão AFDO. Wave energy utilization: A review of the technologies. Renew. Sustain. Energy Rev. 2010, 14, 899–918. [Google Scholar]
- Neill, S.P.; Hashemi, M.R. Wave power variability over the northwest European shelf seas. Appl. Energy 2013, 106, 31–46. [Google Scholar] [CrossRef]
- Parkinson, S.; Dragoon, K.; Reikard, G.; Garcia-Medina, G.; Ozkan-Haller, H.T.; Brekken, T.K.A. Integrating ocean wave energy at large-scales: A study of the US Pacific Northwest. Renew. Energy 2015, 76, 551–559. [Google Scholar] [CrossRef]
- Iuppa, C.; Contestabile, P.; Cavallaro, L.; Foti, E.; Lykke Andersen, T.; Vicinanza, D. Experimental investigation of rubble mound breakwaters for wave energy conversion. In Proceedings of the 11th European Wave and Tidal Energy Conference, Nantes, France, 6–11 September 2015.
© 2015 by the authors; licensee MDPI, Basel, Switzerland. This article is an open access article distributed under the terms and conditions of the Creative Commons by Attribution (CC-BY) license (http://creativecommons.org/licenses/by/4.0/).