Article

An Assessment of the Security of China’s Natural Gas Supply System Using Two Network Models

1
State Key Joint Laboratory of Environment Simulation and Pollution Control, School of Environment/No. 19, Xinjiekouwai Street, Beijing Normal University, Beijing 100875, China
2
Key Laboratory of Yangtze River Water Environment, Ministry of Education, Tongji University, Shanghai 200092, China
3
School of Chemistry and Environmental Engineering, Wuhan Institute of Technology, Wuhan 430205, China
*
Author to whom correspondence should be addressed.
Energies 2015, 8(12), 13710-13725; https://doi.org/10.3390/en81212392
Submission received: 9 October 2015 / Revised: 14 November 2015 / Accepted: 25 November 2015 / Published: 2 December 2015

Abstract

:
In the context of climate change, natural gas is becoming increasingly important for low-carbon development in China. The gap between the demand and supply of natural gas, domestically, and China’s high dependence on foreign sources, highlights the importance of ensuring a secure system for supplying natural gas in the country. This study applied ecological network analysis, a powerful systems-oriented method, to simulate interactions between different nodes of the natural gas supply system and to evaluate the system’s security level. Two network models were constructed at the regional and national layers, respectively, by dividing external natural gas suppliers into multiple regions and countries. These models were used to evaluate the overall security level and related characteristics of China’s natural gas supply system from 2000 to 2012. The results showed stable improvement in the system’s security during this period. With the exceptions of some specific indicators (e.g., the mutualism index (MI)), analyses of network information and structure yielded the mostly similar results for the two models. In conclusion, a regional layer (RL) network model is considered more economical than a national layer (NL) model for evaluating the overall security of China’s natural gas supply system, especially when available data are limited.

1. Introduction

Natural gas is a cleaner and safer energy than either coal or oil, with a higher calorific value. In the prevailing context of climate change and growing environmental concerns, the demand for natural gas, worldwide, has been rising. The International Energy Agency (IEA) has predicted that the global demand for natural gas will increase by more than 50% by 2040, with China and the Middle East being the main consumers of natural gas [1].
In recent years, the rise in China’s natural gas consumption has occurred at an especially rapid pace in parallel with the country’s socioeconomic development. It has increased from 20.89 billion cubic meters in 2000 to 116.75 billion cubic meters in 2012 [2,3,4,5,6,7,8,9,10,11,12]. An analysis of historical data on the domestic production and consumption of natural gas in China has revealed that the country was self-sufficient in meeting its requirements for natural gas prior to 2007, but subsequently became a net importer of natural gas. The import volume of natural gas rapidly increased, and the degree of dependence on foreign suppliers of natural gas correspondingly rose steeply from 2.01% in 2007 to 26.56% in 2012. The extent of China’s dependence on foreign natural gas suppliers was projected to continue to rise, reaching about 35% by 2015 [13]. This heavy reliance on foreign suppliers of natural gas highlights the urgent need to conduct an investigation of the security of China’s natural gas supply system, especially when considering the increasing demand and consumption of domestic natural gas and the potential instability of the international market for natural gas.
This paper aims to systematically evaluate China’s natural gas supply security, by integrating the related factors involved in the supply process in a system. Concretely speaking, it tries to: (1) identify the key nodes with relatively great influence on the entire system; (2) investigate the primary properties of the system; and (3) establish a preliminary baseline for an assessment model of natural gas supply security.
The following sections are structured as follows: Section 2 introduces related literature review of natural gas supply analysis; the subsequent methodology describes how to construct the network models for China’s natural gas supply system, as well as related calculations; then the results of the study based on data during 2000–2012 and further discussion are presented; and the conclusions are presented in the last section of the paper.

2. Literature Review of Analysis of Natural Gas Supply System

A number of studies have analyzed natural gas supply systems in different countries, with most focusing on simulating the impact of a single factor on the system. These studies have examined economic factors (e.g., economic growth) [14,15,16,17,18], social factors (e.g., legislation and politics) [19,20,21,22,23], technical factors (e.g., improved mining technology) [24,25,26], and external environment factors (e.g., geopolitics of natural gas and international environment) [27,28,29,30,31]. There have also been some integrated studies, both quantitative and qualitative, that have analyzed the impacts of multiple factors on a natural gas supply system. Quantitative studies have analyzed the impacts of economic, social, environmental, and other factors on natural gas supply systems. In doing so, they have applied econometric models [32], distribution planning models [33], and system dynamics models [34,35,36] or have been based on various indicators (e.g., the diversity index of Shannon’s coefficient [37]). For instance, one study by Sun et al. [35], constructed a supply and demand systems model to simulate trends in natural gas supply and demand in China through the integration of endogenous, exogenous, and excluded factors. The study found that the impacts of China’s energy structure on natural gas supply and demand were more apparent than those of natural gas resources and investment levels [35]. Qualitative studies have also been conducted to assess the current situation of natural gas supply, identify key existing problems, and put forward potential solutions to these problems [38,39,40,41,42]. From the political, economic, and social perspectives, the status quo and development trends in the demand for and supply of natural gas in China have been analyzed, and the main problems have been identified. These include fierce competition over natural gas imports, single supply sources, lack of infrastructure, and fluctuating gas prices [41].
All of these studies are undoubtedly important for understanding the current situation of natural gas supply systems. However, two key issues require further investigation. These relate to how the natural gas supply “system” operates, how the system can operate sustainably, and perform with enough security. The system can be more effectively regulated only after determining its composition and developing a better understanding of the interactive relationships among its different components which enable it to operate.
In light of these concerns, this study evaluates the security level of China’s natural gas supply system by applying the method of ecological network analysis. This is a powerful general tool for simulating and quantifying both direct and indirect relationships among different components within an entire system [43,44,45], which has been widely applied in simulations of economic systems [46], urban energy metabolism systems [47], and the nitrogen cycle [48], etc. Both simple and complex network models for the natural gas supply system were constructed and compared, based on the consideration that the system’s division into components could influence the structure and size of the constructed model and further influence certain properties of the system (e.g., the connectivity, efficiency, and resilience) simulated by the model. This could ultimately influence the security level of the natural gas supply system [49].

3. Methodology

3.1. The Concerns of Natural Gas Supply Security

There is no well-acknowledged concept of energy security, due to its characteristics of complexity, multidiscipline, and dynamics. The widely used concept of energy security developed by IEA [50] is referred to in this paper, which is defined as “the stable physical availability of energy at an affordable price while considering environment impacts”, emphasizing both the stability of energy supply and the security of energy use. Specifically, we pay attention to the natural gas supply security with a holistic perspective, concerning whether the natural gas supply system can perform well in efficiency and resilience and finally operate sustainably. Considering the multiple interactive factors related to natural gas supply as a network system, the natural gas supply security can be represented by the overall sustainability of the system and analyzed by investigating the system properties.

3.2. Data Sources

The construction of network models for China’s natural gas supply system requires a considerable quantity of data, whose availability may determine the final structure and size of the network models to a certain extent. The required data mainly include natural gas production, refining, reserve, and consumption in China, as well as those on imports and exports of natural gas to and from China. Most of the required data can be collected from relevant official statistical yearbooks. For example, the China Energy Statistical Yearbooks [2] contain data on the country’s production, imports, and exports of natural gas, as well as on the refinement and consumption of natural gas in China. The detailed data of China’s natural gas imports to and exports from different areas (e.g., countries and regions) can be collected from the China Customs Statistics Yearbooks [51,52,53,54,55,56,57,58,59,60,61,62,63]. And the data of imports and exports of natural gas for those related areas can be obtained from the BP Statistical Review of World Energy (2001–2013) [64].

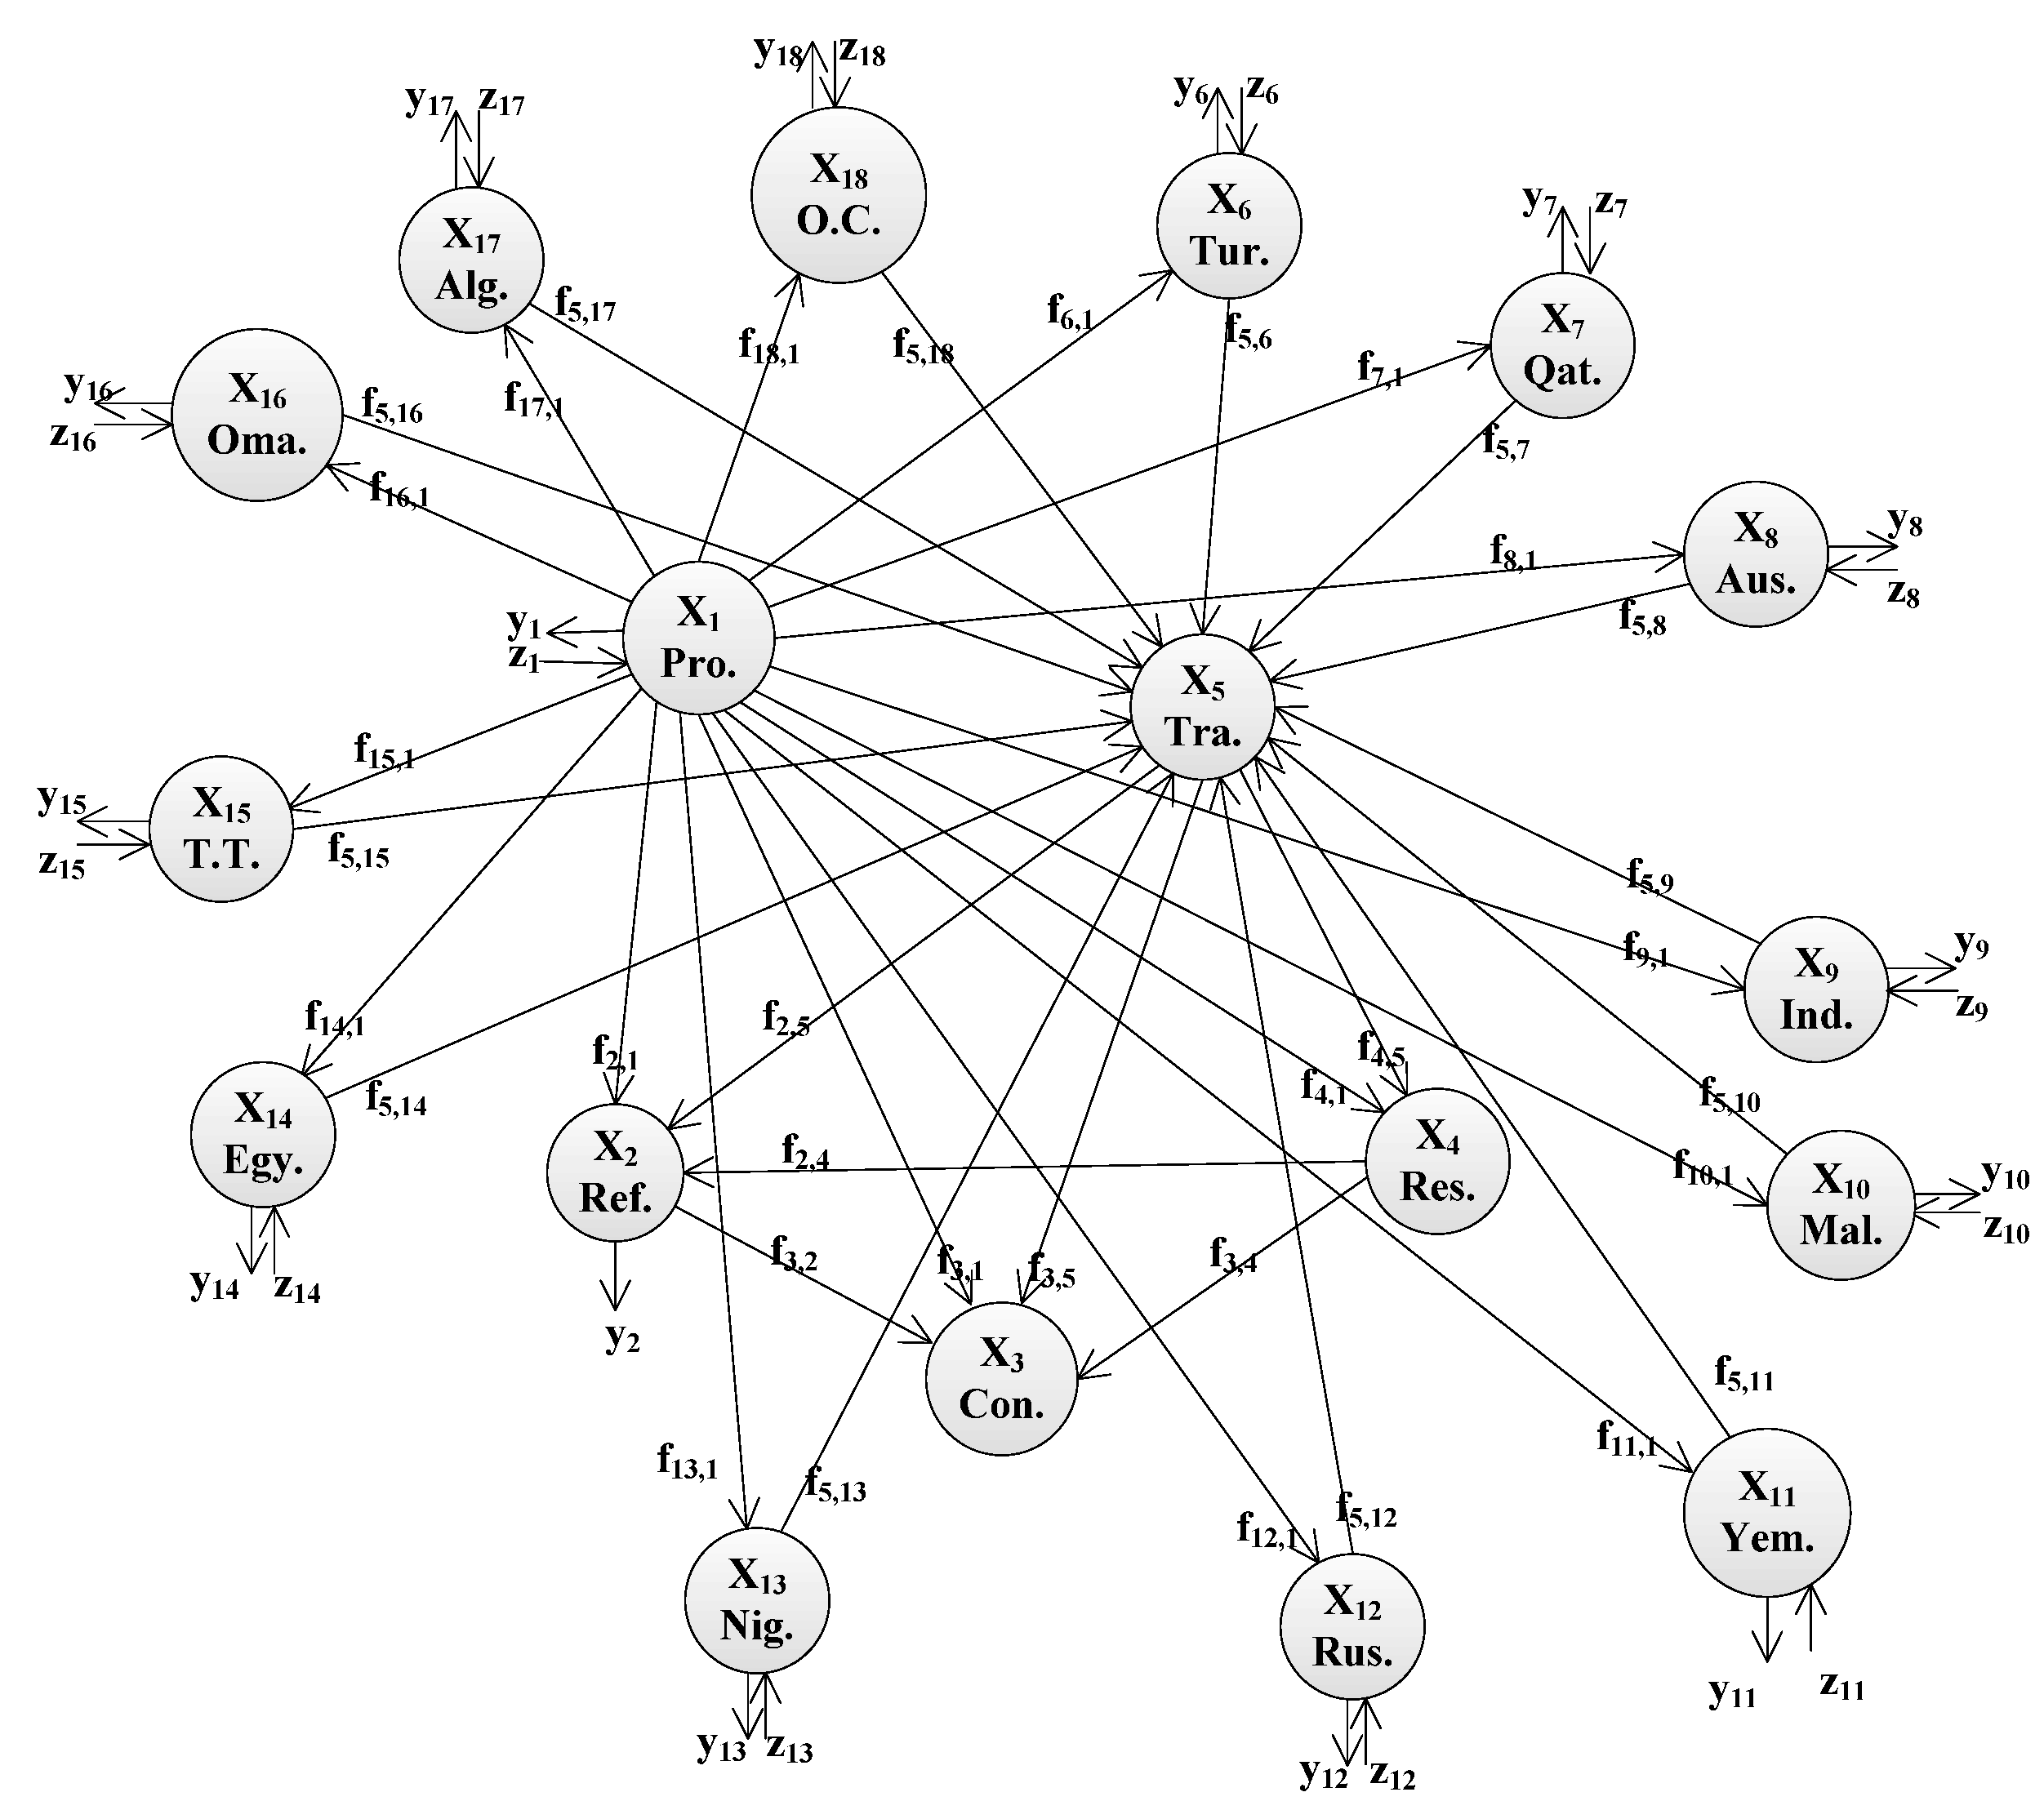
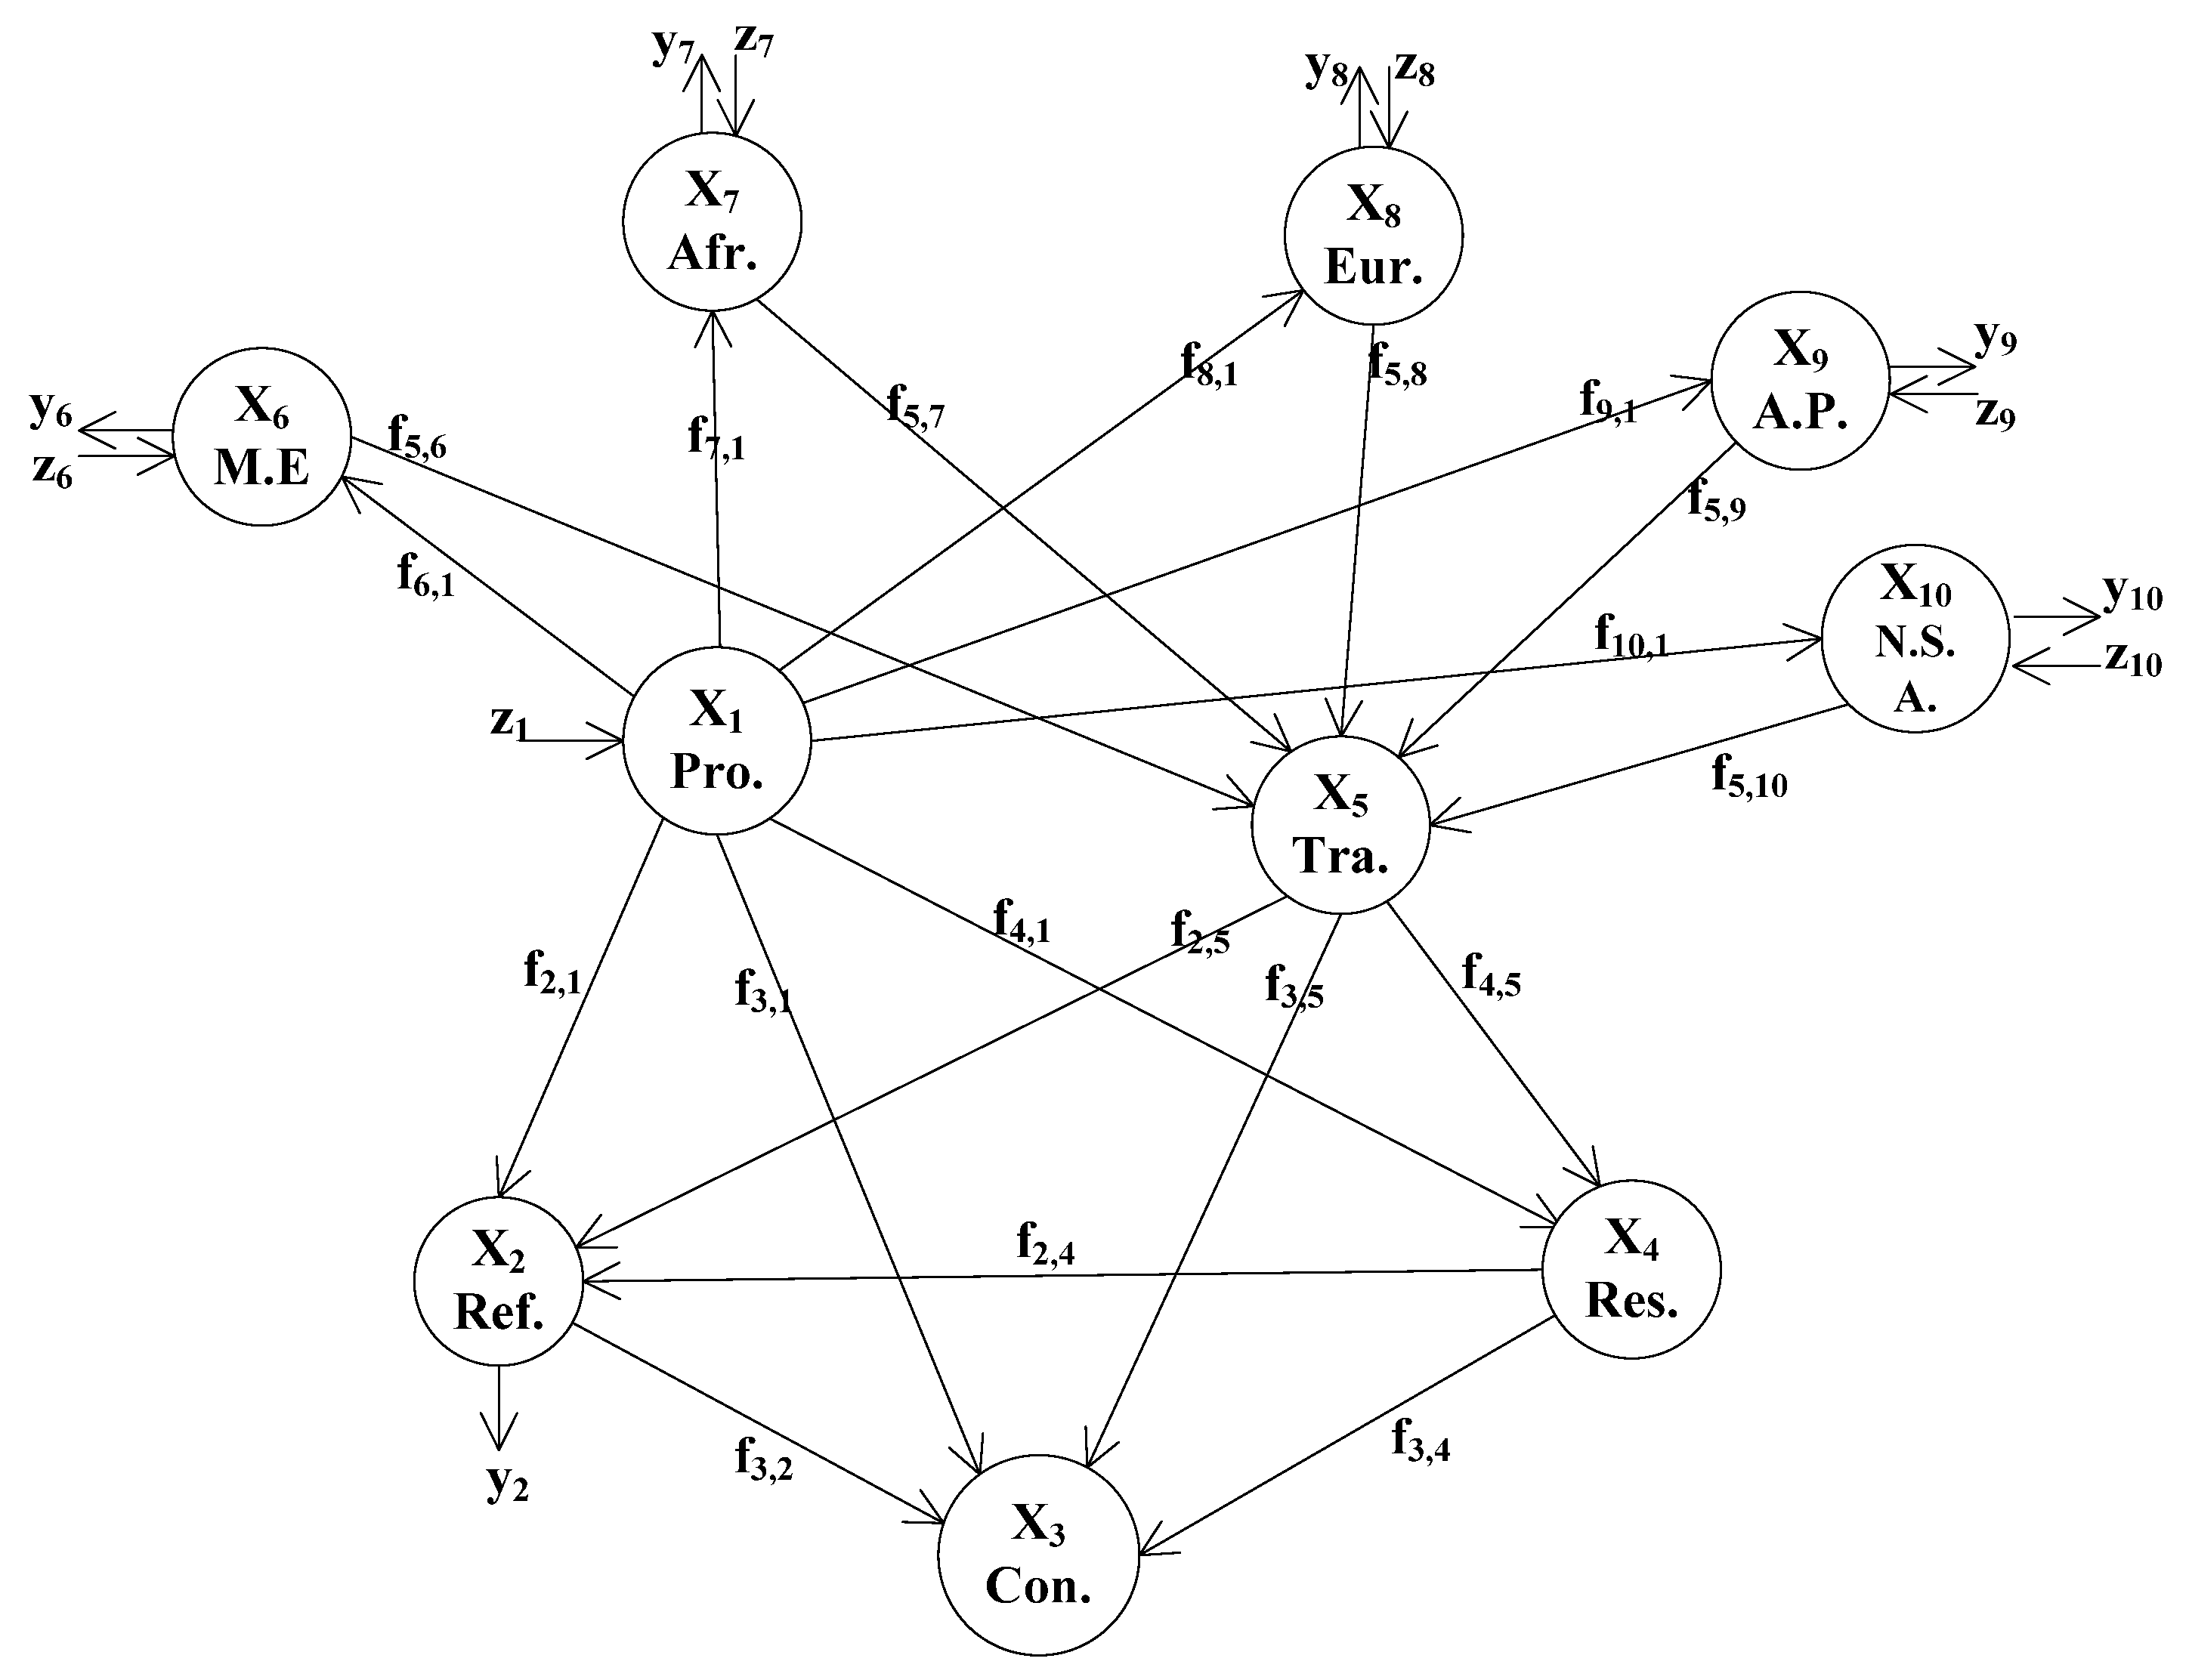
3.3. An Ecological Network Model of China’s Natural Gas Supply System

Considering the merit of ecological network analysis in holistically simulating and analyzing systems with multiple components and complex interactions, it is adopted herein to measure the overall security level of China’s natural gas supply system and reveal the concrete characteristics of the system. A system’s compartmentalization greatly influences the construction of a network model, which is closely related to the availability of data. Focusing on the division of supply sources, two network models of China’s natural gas supply system were built by dividing the external supply sources from different layers, when combining with the data availability. The first was the regional layer (RL), based on the division of China’s external suppliers of natural gas into different regions (e.g., the Middle East and Africa). A second network model was constructed on the national layer (NL), with China’s external suppliers of natural gas being subdivided into the main exporting countries (e.g., Turkmenistan, Qatar, Australia, and Indonesia) and other countries. Different ways of compartmentalizing the system may lead to different results. For this study, we, therefore, established two models on different layers and compared the results obtained with each model.
The RL network model of China’s natural gas supply system was developed through the integration of various nodes within the natural gas supply system as shown in Figure 1. The following sectors: production, refining, consumption, reserve, and transit constituted the internal system within China. A further five nodes comprised China’s external suppliers of natural gas, namely, the Middle East, Africa, Europe, the Asia-Pacific region, and North and South America. Figure 2 shows the NL network model established for China’s natural gas supply system. Here, external suppliers were Turkmenistan, Qatar, Australia, Indonesia, Malaysia, Yemen, the Russian Federation, Nigeria, Egypt, Trinidad and Tobago, Oman, Algeria, and other countries (e.g., India and Panama) from which China imported lower quantities of natural gas.
Figure 1. Network model of China’s natural gas supply system on the regional layer (RL). X1 (Pro.): natural gas production sector, X2 (Ref.): natural gas refining sector, X3 (Con.): natural gas consumption sector, X4 (Res.): natural gas reserve sector, X5 (Tra.): natural gas transit sector, X6 (M.E.): Middle East, X7 (Afr.): Africa, X8 (Eur.): Europe, X9 (A.P.): Asian-Pacific region, X10 (N.S.A.): North and South America, fij: flow from node j to node i, zi: flow into node i from outside the network, yj: flow out of the network from node j.
Energies 08 12392 g001
Figure 2. Network model of China’s natural gas supply system on the national layer (NL). X1 (Pro.): natural gas production sector, X2 (Ref.): natural gas refining sector, X3 (Con.): natural gas consumption sector, X4 (Res.): natural gas reserve sector, X5 (Tra.): natural gas transit sector, X6 (Tur.): Turkmenistan, X7 (Qat.): Qatar, X8 (Aus.): Australia, X9 (Ind.): Indonesia, X10 (Mal.): Malaysia, X11 (Yem.): Yemen, X12 (Rus.): the Russian Federation, X13 (Nig.): Nigeria, X14 (Egy.): Egypt, X15 (T.T.): Trinidad and Tobago, X16 (Oma.): Oman, X17 (Alg.): Algeria, X18 (O.C.): other countries, fij: flow from node j to node i, zi: flow into node i from outside the network, yj: flow out of the network from node j.
Energies 08 12392 g002

3.4. Network Information Analysis

Network information analysis can be conducted to quantify the activity level and organizational ability of a system. Whether or not a system is able to maintain long-term development mainly depends on two attributes: its efficiency (A) and resilience (Φ) [65,66]. Both of these attributes are related to the system’s diversity and connectivity and are complementary.
A = i = 1 n + 2 j = 0 n f i j  log 2 f i j T .. f i . f . j
= i = 1 n + 2 j = 0 n f i j  log 2 f i j 2 f i . f . j
T .. = i = 1 n + 2 j = 0 n T i j
where fij represents the flow from node j to i, fi. represents all flows into node i, f.j represents all flows from node j, T.. represents the total system’s throughput, and n represents the number of nodes in the network system. Exogenous inputs come from node 0; usable exports enter node n + 1, and unusable exports enter node n + 2 [67]. Concretely speaking, yj in the model means the usable exports from node j to n + 1, zj means the inputs from the environment (node 0) to node j, and dissipation collected in node n + 2 is not considered herein.
Considering the complexity of interactions between efficiency and resilience, the value C, also termed the development capacity (sustainability) of a system, was introduced to express the overall security level of the natural gas supply system:
C = A + = i = 1 n + 2 j = 0 n f i j  log 2 f i j T ..
With high sustainability (C), it implies that the system performs well in both efficiency (A, the system’s capacity to perform in a sufficiently organized and efficient manner as to maintain its integrity over time [68]) and resilience (Ø, the system’s ability to respond to the disturbances and maintain its structure and functions based on diversity of actions and flexible alternative positions and pathways [69,70,71]), and reaches a balance between them. Under such circumstance, the natural gas supply system also possesses high security level.

3.5. Network Structure Analysis

By calculating the weight (W) of each node within the system, an analysis of the network’s structure could be performed to identify the nodes with the most influence on the entire natural gas supply system. The final calculations are expressed by Equations (5)–(8) [70,72]:
G = gij = fij/Tj
N = ( I G ) 1
Y = N * diag ( T )
W = i = 1 n y i j i = 1 n j = 1 n y i j
where G represents the direct flow of the system, N represents the integral flow of the system, diag (T) is the diagonalized through-flow vector, and W indicates the weight of different nodes within the natural gas supply system.

3.6. Network Properties

This study also investigated the primary properties of the system, including synergism, mutualism, dominance of indirect effects, and homogenization [44], by applying the RL and NL network models. Based on these properties, we could analyze the potential influence of the system’s size on its characteristics, and their influence, consequently, on its overall security level.

3.6.1. Network Synergism and Mutualism

The network utility matrix was first introduced by Patten to express relative benefit/cost relationships within interactive networks [73]. The sign of each element in the utility matrix (usually including the direct utility matrix D and the integral utility matrix U) denotes the relationship between each pair of nodes within the network. The values of D and U can be calculated using Equations (9) and (10):
d i j = ( f i j f j i ) T i
U = ( I D ) 1
where dij (the element in matrix D) denotes the utility of the flow from node j to i.
Usually, the (+) and(−) signs and (0) indicate what is obtained, lost, and neutrality, respectively [74]. The nine combinations of signs that can occur for pairs of nodes are shown in Table 1.
Table 1. The nine sign combinations for relationships of paired nodes in the network system.
SignsRelationshipSignsRelationshipSignsRelationship
(+, +)mutualism(+, −)exploitation(−, +)altruism
(−, −)competition(+, 0)anabolism(0, +)commensalism
(−, 0)catabolism(0, −)amensalism(0, 0)neutralism
The nine binary relationships reflect observable direct and unobservable indirect between the two nodes [74]. Referring to the definition of relationships in ecology, these relationships can reflect the direction and effect of the interaction between nodes [75]. The basic assumption is that energy (or food, materials) transfer is beneficial, i.e., not toxic or detrimental. Mutualism (+, +) and competition(−, −) means that each node benefits or harms from their interaction, respectively. The exploitation (+, −) means that energy transfers from the lost (−) to the obtained (+) node, and the obtained node performs like the predators in the ecosystem. Correspondingly, in the relationship of altruism (−, +), the lost node performs like the prey in the ecosystem. When there is no interaction between the two nodes, it is expressed as neutralism (0, 0). Anabolism (+, 0) and commensalism (0, +) express the relationships where one node benefits from the other without affecting it. Correspondingly, catabolism (−, 0) and amensalism (0, −) mean one node is harmed while the other is unaffected.
The mutualism index (MI) was also applied to measure the degree of mutualism of the system under study [70]:
MI = Sign U ( + ) Sign U ( )
where  Sign U ( + ) = max ( Sign ( u i j ) ,   0 ) and Sign U ( ) = min ( Sign ( u i j ) ,   0 ) .
More positive than negative relationships were found to exist within the system when MI > 1, thus indicating the occurrence of mutualism. When MI < 1, there were more negative than positive relationships within the system, implying that certain unfavorable relationships required attention and management [74,76].

3.6.2. The Dominance of Indirect Effects

We could compare the contribution of indirect and direct flows to the entire network using the following equation:
I D = i , j = 1 N n i j g i j e i j / i , j = 1 n g i j
where eij represents the unit matrix. When I/D > 1, this means that indirect flows play a central role in the natural gas supply system.

3.6.3. Network Homogenization

Homogenization was also assessed to compare the distribution of the resource between direct and integral flows [77]. Homogenization occurred when the coefficient of variation of G (marked as CV(G)) was greater than coefficient of variation of N (marked as CV(N)),implying that the network flow was more evenly distributed in the integral matrix than in the direct matrix.

4. Results and Discussion

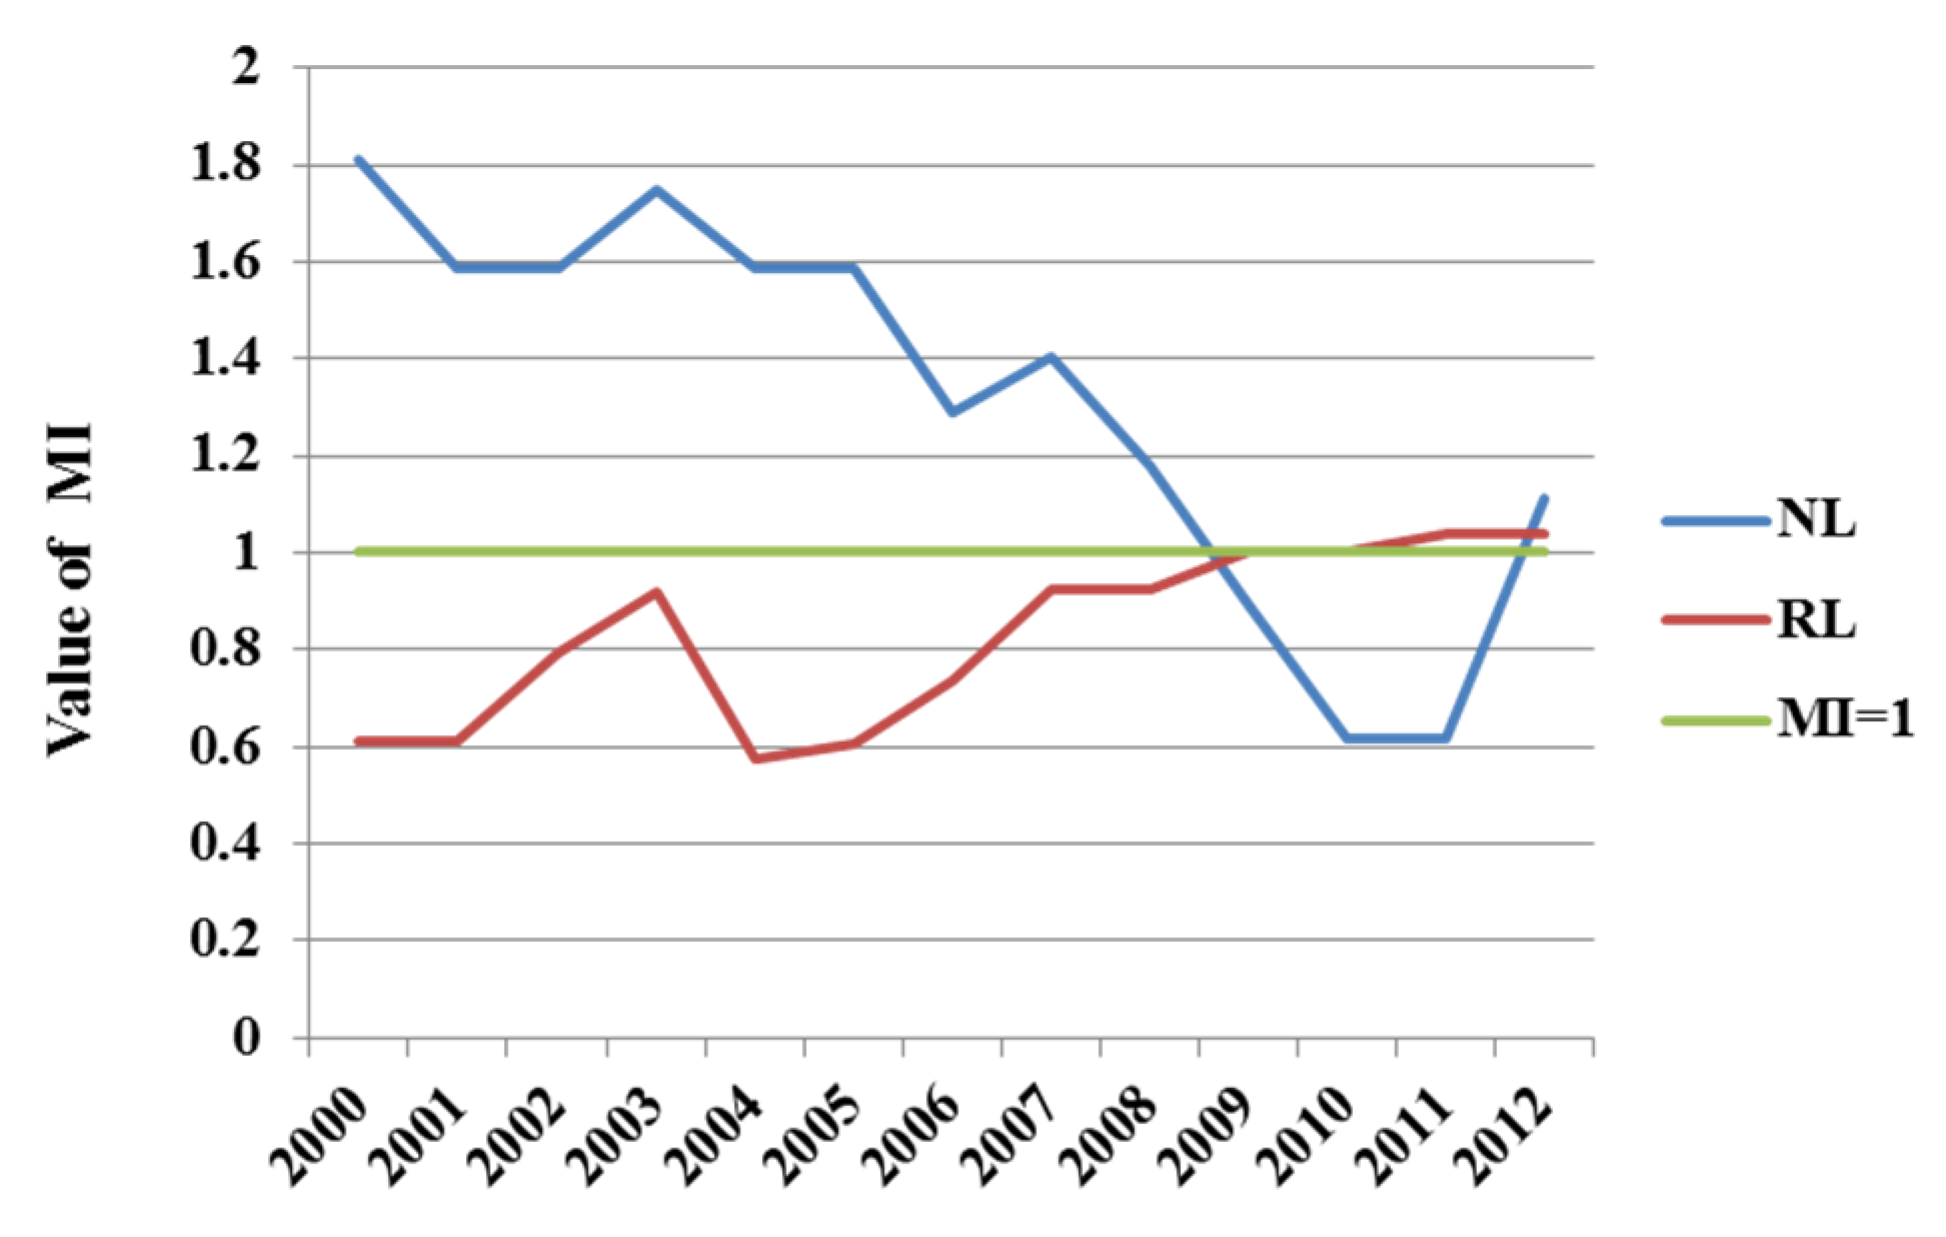
4.1. Overall Security Level of China’s Natural Gas Supply System

As indicated in Figure 3, the overall security (Curve C) of China’s natural gas supply system evidenced stable improvement from 2000 to 2012, while efficiency (Curve A) and resilience (Curve Φ) both increased during the same period. The growth in natural gas imports and the decrease in exports (see Figure 4) contributed to the increase in the security level of the natural gas supply system. Specifically, the first evident growth phase relating to security was observed from 2003 to 2004. This may have been associated with the remarkable reduction in the volume of gas exports that occurred in 2003 and 2004. Another phase of greater growth occurred from 2009 to 2010, coinciding with the import of liquefied natural gas into China which began in 2010. Subsequently, the amount of liquefied natural gas imports increased gradually. This growth trend is consistent with the continuous increase of the sustainability of China’s natural gas industry from 2008 to 2013 [78], which is found mainly contributed by growing supply and demand of natural gas, beneficial policy, technological innovation, and the reformation of the gas market in China.
Figure 3. Changes in the security level of China’s natural gas supply system from 2000 to 2012 based on network models: (a) The RL and (b) The NL.
Energies 08 12392 g003
Figure 4. The changes of China’s natural gas supply from 2000 to 2012.
Energies 08 12392 g004
In relation to the performance of the system at different layers (RL and NL), the study revealed that trends were generally similar at these layers and that the values of A, Φ, and C at the RL were higher than those at the NL. These findings indicate that security may have decreased with a decline in the system’s connectivity (Table 2). Moreover, resilience (Φ) contributed more to the overall security of the natural gas supply system than did efficiency (A).
Table 2. The connectivity and link density of the two models at different layers.
Parameters of the NetworkRegional Layer (RL)National Layer (NL)
N1018
L3164
Connectivity (L/N2)0.310.1975309
Link density (L/N)3.13.5555556
Note: N represents the number of nodes in the network, and L represents the number of links in the network.

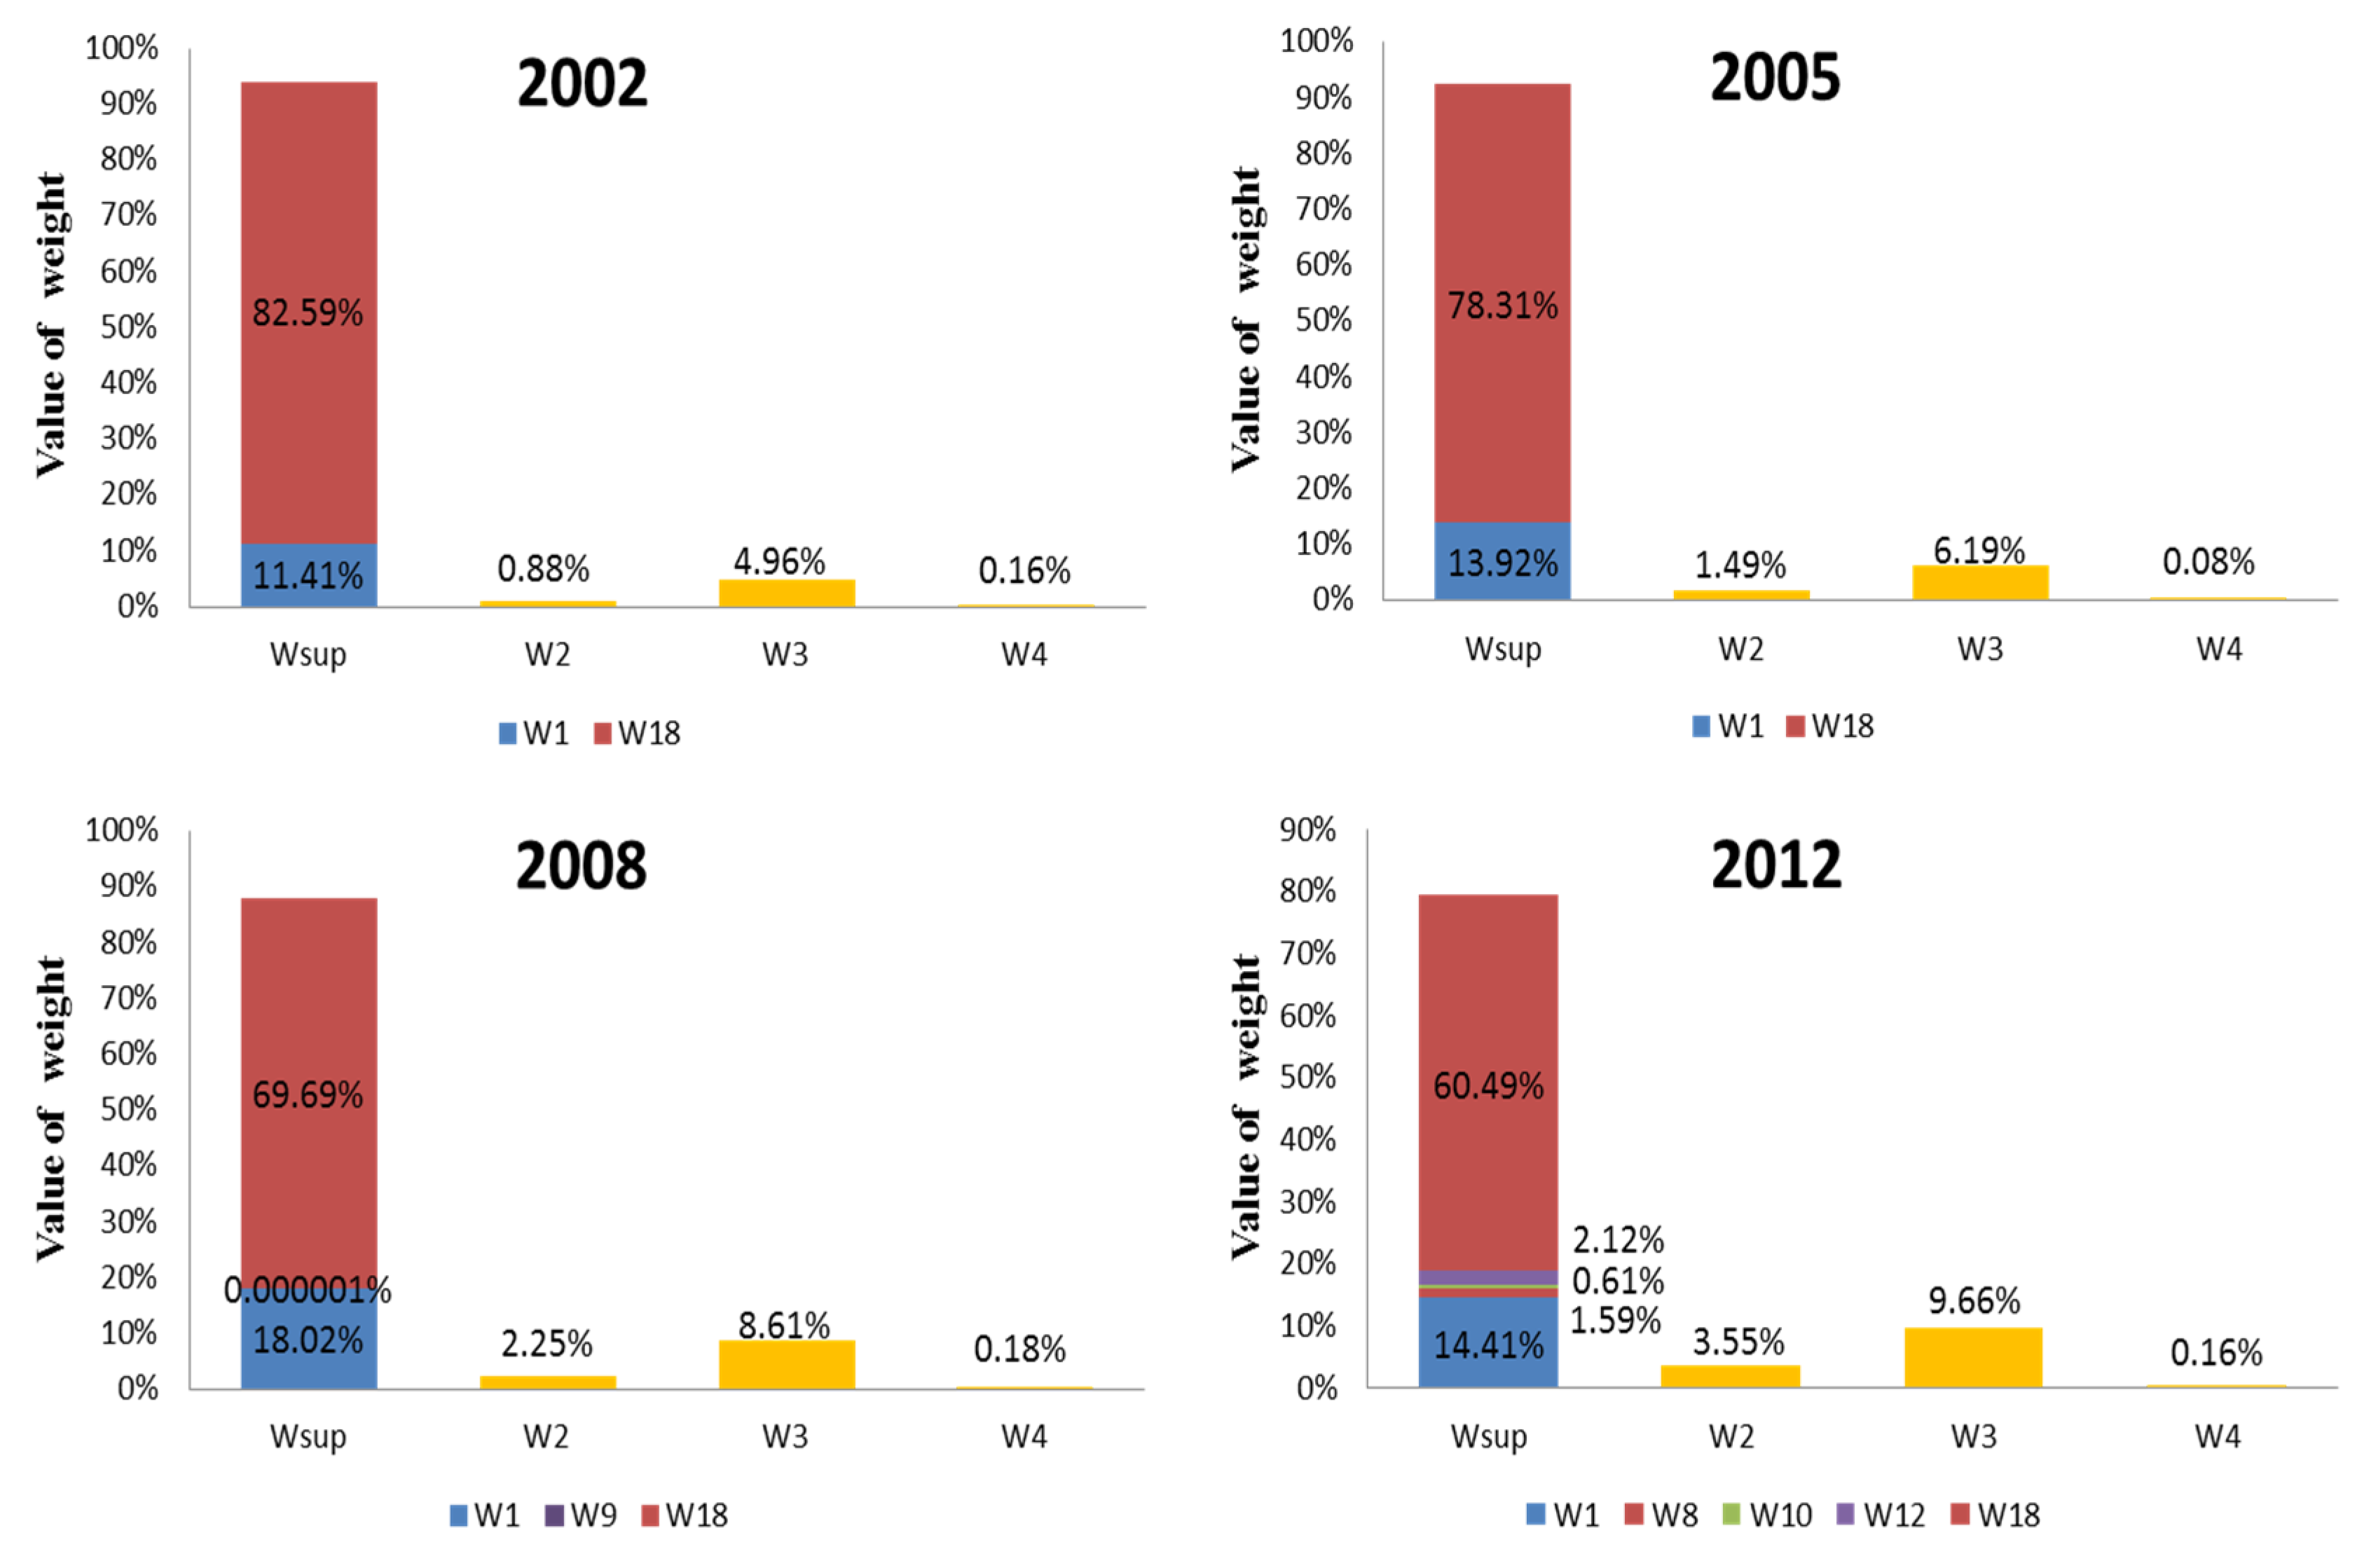
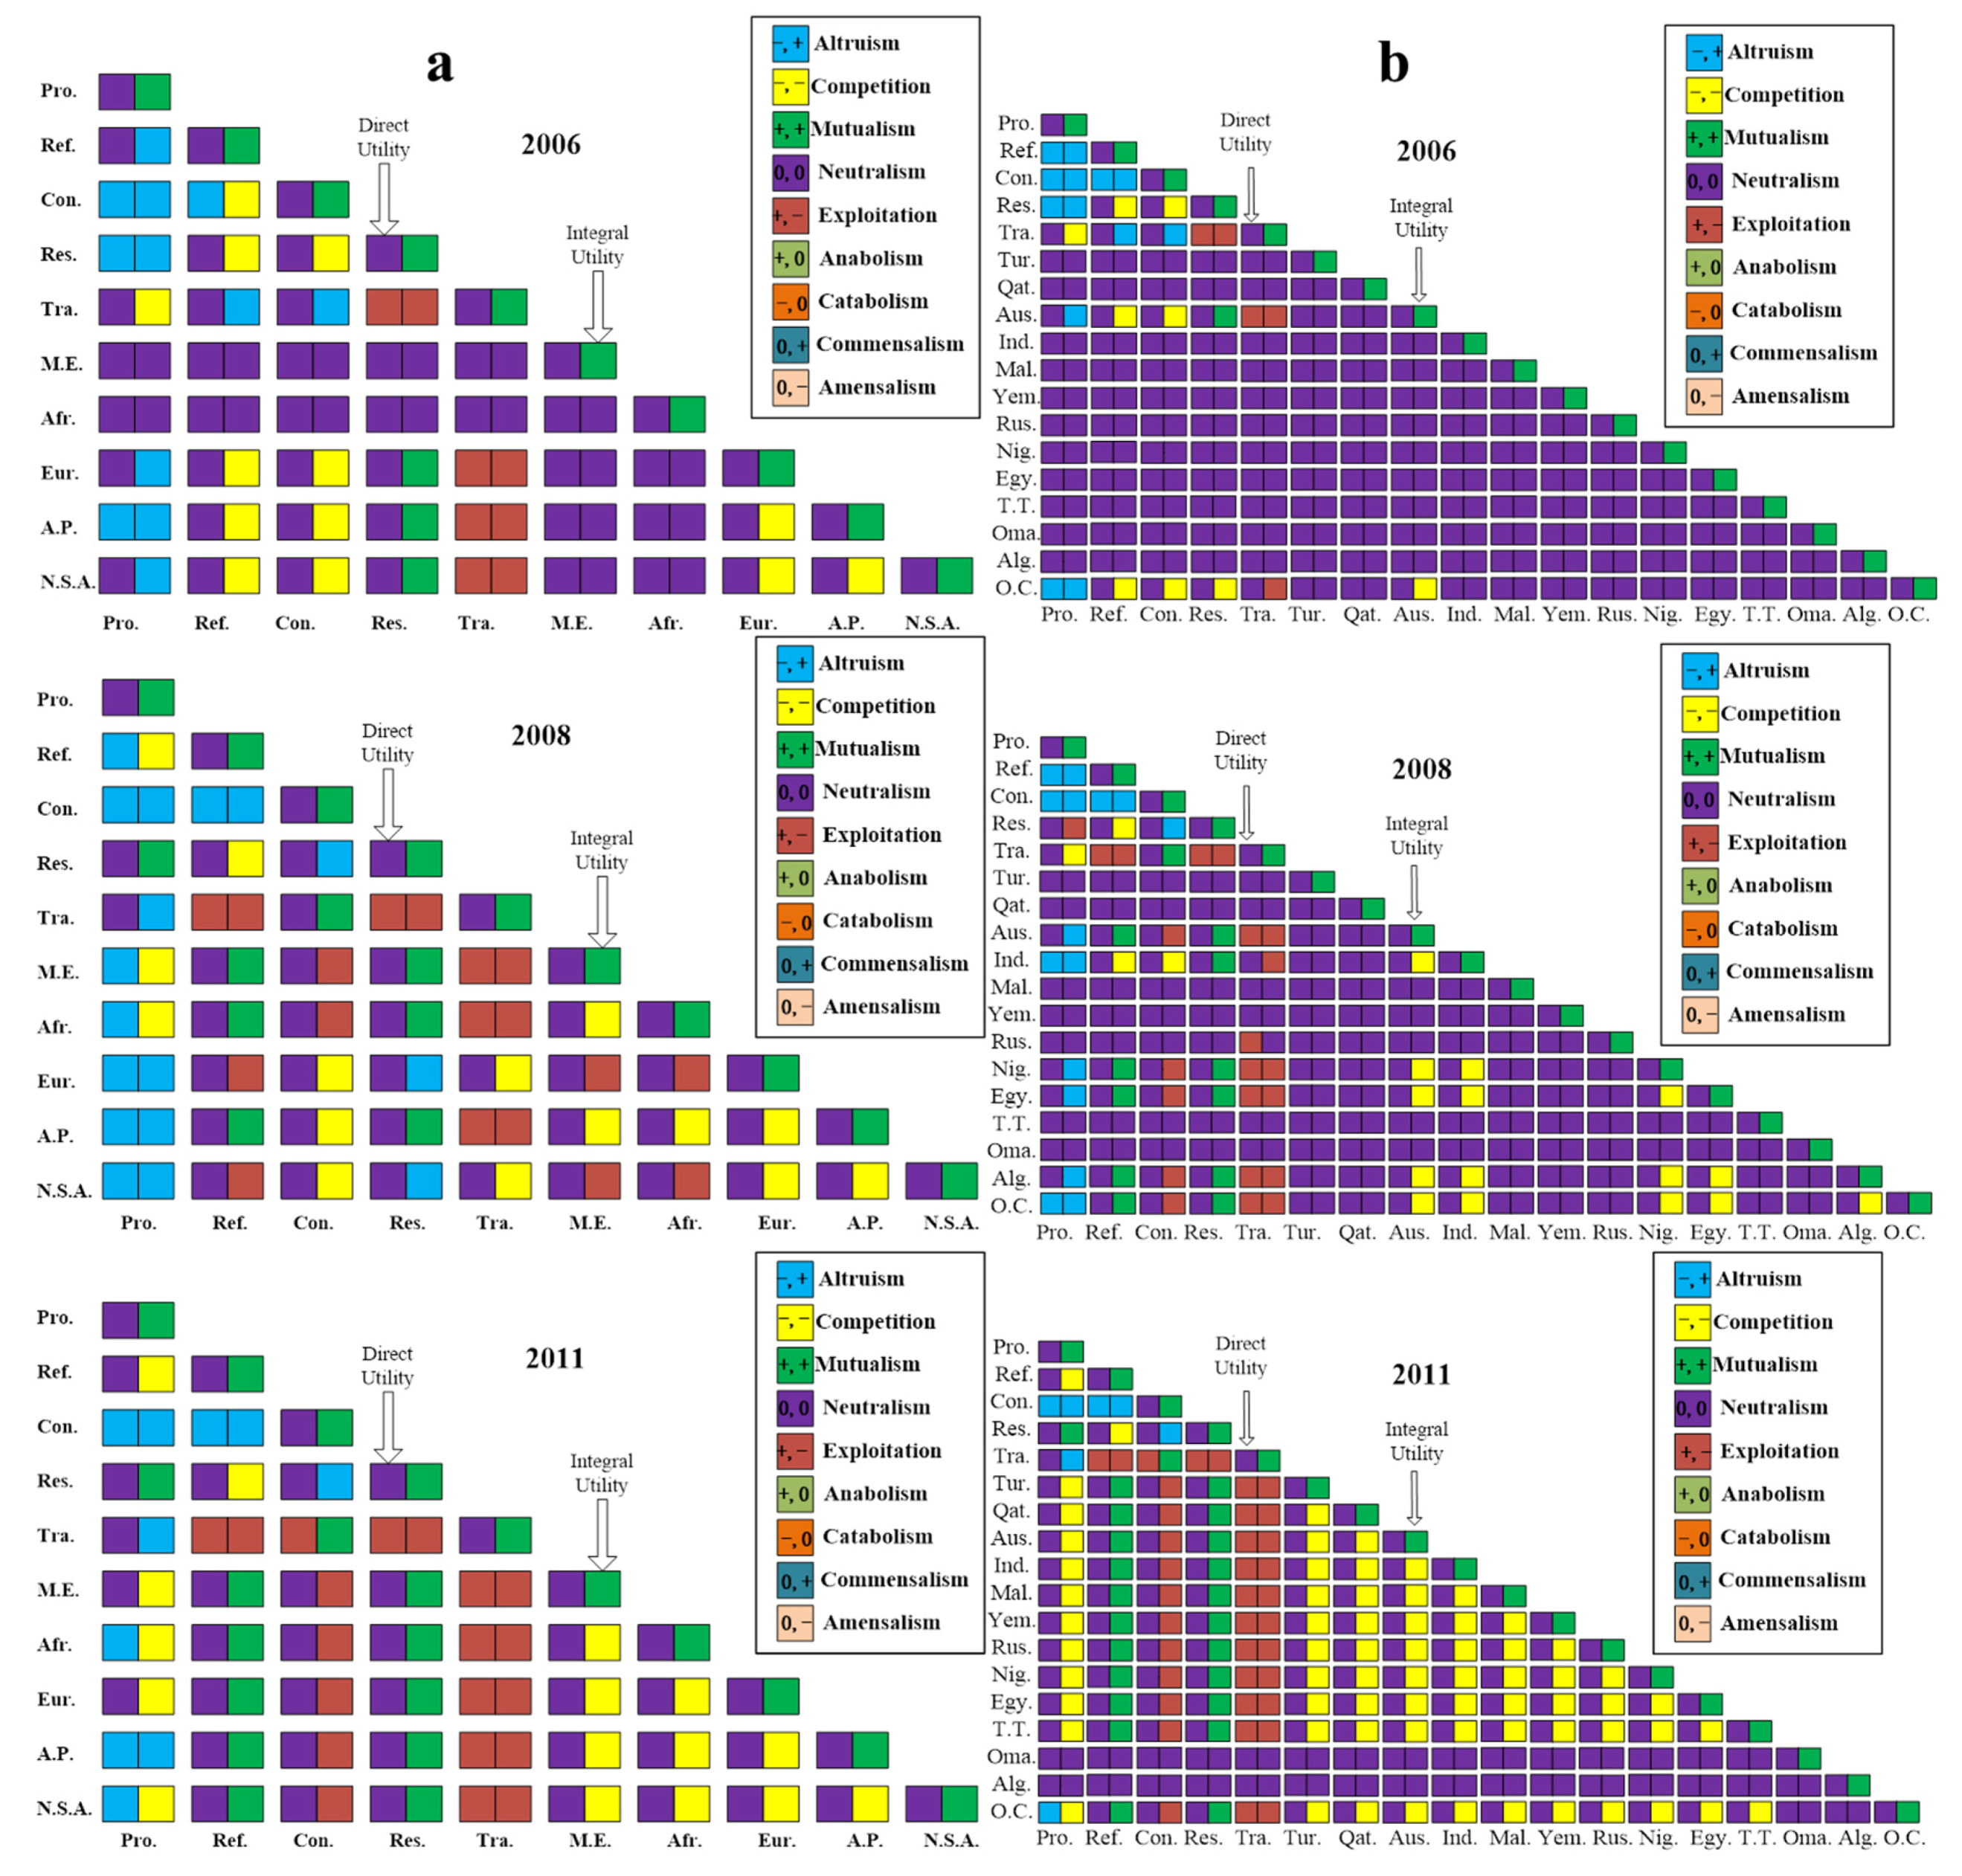
4.2. The Structure of China’s Natural Gas Supply System

Figure 5 and Figure 6 depict changes in the contributions of different nodes to the natural gas supply system during four selected years (2002, 2005, 2008, and 2012). These figures depict the results for the RL and NL network models, respectively.
Figure 5. The weights of different nodes of China’s natural gas supply system from 2000 to 2012 based on a network model constructed on the RL. The first column, named Wsup, indicates the weights of supply sources, including internal sources. Within the Wsup column, the blue column at the bottom, denoted as W1, indicates the production sector. External sources are shown in other colors in the first column. They are denoted as W6, W7, W8, W9, and W10, representing the weights of the Middle East, Africa, Europe, Asia-Pacific, and North and South America, respectively. The second, third, and fourth columns represent the weights of the sectors of refining, consumption, and reserve, respectively, denoted as W2, W3, and W4.
Energies 08 12392 g005
The study revealed that the weights of the different nodes showed similar and basically stable structures during the study period, regardless of the layer of the network model (RL or NL) used. In both models, the supply sources had the maximum weight, followed by the consumption and refining sectors, and last by the reserve sector. This is accordant with the general results of other studies [35,36,79]. With systems-oriented evaluation based on ENA model, the weights obtained in this study can show the relative influence of different sectors on the overall natural gas supply security in a more quantitative and concise way, which is beneficial for forthcoming systematic optimization.
Figure 6. The weights of different nodes of China’s natural gas supply system from 2000 to 2012 based on a network model constructed on the NL. The first column, named Wsup, indicates the weights of supply sources, including internal sources. Within the Wsup column, the blue bar at the bottom, denoted as W1, indicates the production sector. External sources are shown in other colors in the first column. They are denoted as W8, W9, W10, W12, and W18, representing the weights of Australia, Indonesia, Malaysia, the Russian Federation, and other countries, respectively. However, the weights of other countries were too small to be displayed in this figure. The second, third, and forth column represent the weights of the refining, consumption, and reserve sectors are indicated by W2, W3, and W4, respectively.
Energies 08 12392 g006
The analysis indicated that the production sector (W1) strongly influenced the natural gas supply system and that an increase in its weight was maintained prior to 2010. However, in 2010, the introduction of liquefied natural gas in China resulted in a decrease in the weight of the domestic production sector. The impact of the consumption sector (W3) on the system increased over time during the study period. However, the impacts of the refining (W2) and reserve (W4) sectors on the system were minimal. On the one hand, it implies that the domestic production and consumption of natural gas should be maintained to assure stable development of China’s natural gas supply system. On the other hand, it reminds us to greatly strengthen the strategic reserve to improve adaptability in response to emergencies and the overall level of China’s natural gas supply security.
Of the external supply sources, Australia (W8), Indonesia (W9), and Malaysia (W10) exerted the greatest influence on the system at the NL, with Australia having the greatest weight, followed by Malaysia. However, both Australia and Indonesia showed a downward trend in weight during the study period, although Indonesia’s weight increased slightly. At the NL, other countries (W18) were predominant among the external suppliers of natural gas during the study period although the amount of imported natural gas is much less than that imported from other external sources. However, it should be noted that the weight of other countries declined gradually during this period as the influence of certain external suppliers (e.g., Australia, Indonesia, Malaysia, and the Russian Federation) on China’s natural gas supply system also began to gradually increase. This implies growing diversification of natural gas supplies in China which may, in turn, contribute to greater sustainability of the system. It reminds that we need to further decrease dependence on a small number of supply sources and strengthen cooperation with more countries and areas to balance different supply sources, and develop new supply sources to gradually diversify the suppliers.

4.3. The Properties of China’s Natural Gas Supply System

Table 2 shows differences in some of the basic parameters of the two models of China’s natural gas supply system on different layers. These differences indicate that the NL network model, which is a more complex model, showed much lower connectivity and a slightly higher link density than the simpler network RL model. This implies that when the number of nodes increases, the system’s connectivity cannot increase synchronously in the absence of sufficient links.
As indicated in Figure 7, China’s natural gas supply system was mainly affected by direct flows, with indirect effects being dominant only during certain years (2009 and 2010) according to the NL network model. Similarly, the degree of homogenization only exceeded one during the same two years for the NL model.
Figure 7. Dominance of indirect effects and homogenization of China’s natural gas supply system based on network models on the RL and the NL.
Energies 08 12392 g007
Based on an analysis of utility, three broad stages were evident in the relationships between pairs of nodes from 2000 to 2012. These occurred during the following years: 2000–2006, 2007–2008, and 2009–2012. Figure 8 depicts the situation using the following years as examples: 2006, 2008, and 2011.
The application of both models on different layers indicated that the diversity and complexity of relationships between different nodes increased during the study period. Changes in the signs of the integral utility matrix were more apparent than those of the direct utility matrix, with relationships of competition and mutualism showing increases over time. During the early stage, mutualism was only apparent between the same pairs of nodes. However, it was also observed between different nodes at a late stage, for example, between the reserve and production sectors.
Given differences in the external suppliers in the two models, relationships between nodes during any of the three stages correspondingly differed. However, at any point in time, relationships among the production, refining, consumption, reserve, and transit sectors were almost identical for the two models.
Figure 9 shows changes in the MI from 2000 to 2012 which differed for the two models. Thus, the MI generally increased for the RL model during the study period, whereas it generally decreased for the NL model. Moreover, it was lower than one prior to 2009 and higher than one after that time for the RL model. Conversely, the MI was higher than one prior to 2009 and lower than one after that time for the NL model.
Figure 8. Direct and integral utility of China’s natural gas supply system in 2006, 2008, and 2011 based on network models on: (a) the RL and (b) the NL. Mutual relationships between two sectors are shown in different colors, whose direct and integral utilities were also isolated in two boxes. Pro.: natural gas production sector, Ref.: natural gas refining sector, Con.: natural gas consumption sector, Res.: natural gas reserve sector, Tra.: natural gas transit sector, M.E.: Middle East, Afr.: Africa, Eur.: Europe, A.P.: Asian-Pacific region, N.S.A.: North and South America, Tur.: Turkmenistan, Qat.: Qatar, Aus.: Australia, Ind.: Indonesia, Mal.: Malaysia, Yem.: Yemen, Rus.: the Russian Federation, Nig.: Nigeria, Egy.: Egypt, T.T.: Trinidad and Tobago, Oma.: Oman, Alg.: Algeria, O.C.: other countries.
Energies 08 12392 g008
With more interactive nodes, the NL model possessed higher diversity and resilience than RL model, which contributes to the mutualism attribute of the system. Thus, there were more positive relationships within the system than negative ones (i.e., MI>1) before 2009. However, when the nodes continued increasing and surpassed a certain range, the system’s connectivity could not increase synchronously in the absence of sufficient links and thus caused the decline of MI during a certain period. This is also coherent with the fact shown in Figure 8 that more negative relationships amongst external supply sources appeared at the late stage. Subsequently, the system developed maturely and showed mutualism attribute again. On the contrary, the RL model showed more negative relationships within the system than positive ones (i.e., MI<1) before 2009 due to its lower diversity and resilience. When the nodes continued increasing and reached an inflection point, the system began to show mutualism attribute.
Figure 9. Mutualism index (MI) values of China’s natural gas supply system from 2000 to 2012 for network models on the RLs and NLs.
Energies 08 12392 g009
Combining with the historical data shown in Figure 4, another finding is that there might exist certain time lag between the reflection of the change of the system’s property (shown in 2009) and the actual change of the situation of the natural gas supply (happened in 2007). This time lag of the system’s response should be considered in the future research and decision-making.

5. Conclusions

To realistically simulate the operation of China’s natural gas supply system, this study applied ecological network analysis which connects all nodes within a network and quantitatively measures the inherent relationships among them. This analysis provides a new systemic perspective for assessing and evaluating the overall security level of China’s natural gas supply system from 2000 to 2012. Moreover, the study examined the influence of different nodes on the entire supply system, as well as the pattern of interactions among nodes. The basic properties of the system (including synergism, mutualism, dominance of indirect effects, and homogenization) were also measured, as these are helpful for decision-makers concerned with improving the security level of China’s natural gas supply system.
For this study, two network models were simultaneously constructed and compared, based on the consideration that the division of the system into nodes could influence its structure, size, connectivity, and other essential properties. Focusing on the natural gas supply security, the two models differed in the division of external supply sources, i.e., one divided the external supply sources into different regions while another divided into different countries. Change trends relating to security from 2000 to 2012 were similar for the two models. However, the model on the RL showed a slightly higher security level than the model at the NL. The influences of different nodes on the entire system within the two models also revealed a similar structure. This was observed in the ranking of the supply sources and the consumption, refining, and reserve sectors, indicating that there is a need to considerably strengthen the strategic reserve. A comparison of the two models based on network utility analysis showed differential impacts of external suppliers on the regional and national layers. In particular, the MI in the two models differed significantly. MI should be applied with caution for different models in light of the need to fully understand the underlying cause of significant variations.
To conclude, the RL network model is a simpler model that is more economical for evaluating the overall security level of China’s natural gas supply than the more complex NL model. This is especially the case when limited data are available. When sufficient data on both gas imports and exports for China and other countries are available, the NL network model can be applied to provide more direct guidance for policy decisions relating to the trade of international natural gas.
For comparative purposes, the network model was constructed on two different layers with the aim of providing a reference for the construction of future models. However, this was only an initial attempt. In further studies, more data can be collected over a longer timeframe to explore the potential evolution principle of the natural gas supply system. Second, the network model can be further refined. For example, the consumption sector can be subdivided and the performance of natural gas consumption can be evaluated; or the importing countries of natural gas from China can be further refined to develop more complete model on the NL. A third area for future work entails combining other methods (e.g., system dynamics) to integrate the impacts of other factors (e.g., social, economic, and technological factors) on the natural gas supply system.

Acknowledgments

This work was supported by the Fund for Innovative Research Group of the National Natural Science Foundation of China (Grant No. 51421065), the National Natural Science Foundation of China (No. 41371482), the National Key Technology R&D Program (No. 2012BAK30B03), and the Fundamental Research Funds for the Central Universities.

Author Contributions

Meirong Su conceived the research. Meirong Su and Mingqi Zhang designed and wrote the paper. Weiwei Lu collected the data and established the model. Chunhua Su performed the results analysis.

Conflicts of Interest

The authors declare no conflict of interest.

References

  1. World Energy Outlook 2014; International Energy Agency: Paris, France, 2014; Available online: https://www.iea.org/publications/freepublications/publication/WEO_2014_ES_English_WEB.pdf (accessed on 5 October 2015).
  2. Energy Statistics Division, National Bureau of Statistics. The China Energy Statistical Yearbooks (2000–2002); China Statistics Press: Beijing, China, 2004; Available online: http://tongji.cnki.net/kns55/Navi/YearBook.aspx?id=N2006050897&floor=1 (accessed on 1 December 2015).
  3. Energy Statistics Division, National Bureau of Statistics. The China Energy Statistical Yearbooks (2004); China Statistics Press: Beijing, China, 2005; Available online: http://tongji.cnki.net/kns55/Navi/YearBook.aspx?id=N2006050898&floor=1 (accessed on 1 December 2015).
  4. Energy Statistics Division, National Bureau of Statistics. The China Energy Statistical Yearbooks (2005); China Statistics Press: Beijing, China, 2006; Available online: http://tongji.cnki.net/kns55/Navi/YearBook.aspx?id=N2009100028&floor=1 (accessed on 1 December 2015).
  5. Energy Statistics Division, National Bureau of Statistics. The China Energy Statistical Yearbooks (2006); China Statistics Press: Beijing, China, 2007; Available online: http://tongji.cnki.net/kns55/Navi/YearBook.aspx?id=N2009100078&floor=1 (accessed on 1 December 2015).
  6. Energy Statistics Division, National Bureau of Statistics. The China Energy Statistical Yearbooks (2007); China Statistics Press: Beijing, China, 2008; Available online: http://tongji.cnki.net/kns55/Navi/YearBook.aspx?id=N2008070077&floor=1 (accessed on 1 December 2015).
  7. Energy Statistics Division, National Bureau of Statistics. The China Energy Statistical Yearbooks (2008); China Statistics Press: Beijing, China, 2008; Available online: http://tongji.cnki.net/kns55/Navi/YearBook.aspx?id=N2009060138&floor=1 (accessed on 1 December 2015).
  8. Energy Statistics Division, National Bureau of Statistics. The China Energy Statistical Yearbooks (2009); China Statistics Press: Beijing, China, 2010; Available online: http://tongji.cnki.net/kns55/Navi/YearBook.aspx?id=N2010080088&floor=1 (accessed on 1 December 2015).
  9. Energy Statistics Division, National Bureau of Statistics. The China Energy Statistical Yearbooks (2010); China Statistics Press: Beijing, China, 2011; Available online: http://tongji.cnki.net/kns55/Navi/YearBook.aspx?id=N2011030123&floor=1 (accessed on 1 December 2015).
  10. Energy Statistics Division, National Bureau of Statistics. The China Energy Statistical Yearbooks (2011); China Statistics Press: Beijing, China, 2011; Available online: http://tongji.cnki.net/kns55/Navi/YearBook.aspx?id=N2012020066&floor=1 (accessed on 1 December 2015).
  11. Energy Statistics Division, National Bureau of Statistics. The China Energy Statistical Yearbooks (2012); China Statistics Press: Beijing, China, 2012; Available online: http://tongji.cnki.net/kns55/Navi/YearBook.aspx?id=N2013020081&floor=1 (accessed on 1 December 2015).
  12. Energy Statistics Division, National Bureau of Statistics. The China Energy Statistical Yearbooks (2013); China Statistics Press: Beijing, China, 2013; Available online: http://tongji.cnki.net/kns55/Navi/YearBook.aspx?id=N2014030143&floor=1 (accessed on 1 December 2015).
  13. Lin, B.; Jiang, Z. Estimates of energy subsidies in China and impact of energy subsidy reform. Energy Econ. 2011, 33, 273–283. [Google Scholar] [CrossRef]
  14. Lin, B.Q.; Wesseh, P.K. Energy consumption and economic growth in South Africa reexamined: A nonparametric testing apporach. Renew. Sustain. Energy Rev. 2014, 40, 840–850. [Google Scholar] [CrossRef]
  15. Sagen, E.L.; Tsygankova, M. Russian natural gas exports—Will Russian gas price reforms improve the European security of supply? Energy Policy 2008, 36, 867–880. [Google Scholar] [CrossRef]
  16. Kaliski, M.; Siemek, J.; Sikora, A.; Szurlej, A. Possible Scenarios of the European Union Energy Policy Versus Stable Deliveries of Natural Gas to Central and Eastern Europe Based on the Russian Energy Policy. Rynek Energii 2009, 3, 2–12. [Google Scholar]
  17. Chen, J.L.; Shan, Q. Access Pricing Policy Reform Suggestions in China’s Natural Gas Pipeline Industry Based on the Experiences in America. Adv. Mater. Res. 2014, 869, 443–447. [Google Scholar] [CrossRef]
  18. Bilgin, M. Scenarios on European energy security: Outcomes of natural gas strategy in 2020. Futures 2011, 43, 1082–1090. [Google Scholar] [CrossRef]
  19. Damigos, D.; Tourkolias, C.; Diakoulaki, D. Households’ willingness to pay for safeguarding security of natural gas supply in electricity generation. Energy Policy 2009, 37, 2008–2017. [Google Scholar] [CrossRef]
  20. Fubara, T.; Cecelja, F.; Yang, A. Model-based Assessment of the Role of Natural Gas-based Micro-CHP in Residential Energy Supply Systems. In Computer Aided Chemical Engineering; Andrzej, K., Ilkka, T., Eds.; Elsevier: Amsterdam, The Netherlands, 2013; Volume 32, pp. 343–348. [Google Scholar]
  21. Wright, P. Liberalisation and the security of gas supply in the UK. Energy Policy 2005, 33, 2272–2290. [Google Scholar] [CrossRef]
  22. Chaudry, M.; Skea, J.; Wang, X.; Jenkins, N. Modelling UK energy system response to natural gas supply infrastructure failures. Proc. Inst. Mech. Eng. A J. Power Energy 2012, 226, 501–513. [Google Scholar] [CrossRef]
  23. Lochner, S.; Dieckhoner, C. Civil unrest in North Africa-Risks for natural gas supply? Energy Policy 2012, 45, 167–175. [Google Scholar] [CrossRef]
  24. Wang, J.L.; Feng, L.Y.; Zhao, L.; Snowden, S. China’s natural gas: Resources, production and its impacts. Energy Policy 2013, 55, 690–698. [Google Scholar] [CrossRef]
  25. Zhou, Q.M.; Dilmore, R.; Kleit, A.; Wang, J.Y. Evaluating gas production performances in marcellus using data mining technologies. J. Nat. Gas Sci. Eng. 2014, 20, 109–120. [Google Scholar] [CrossRef]
  26. Huang, S.J.; Zhang, H.; Shang, C.J.; Jing, S.L. Key Technologies of Rebuilding Underground Natural Gas Storages from Carbonate Buried Hill Gas Reservoirs. Adv. Mater. Res. 2012, 347, 1561–1567. [Google Scholar] [CrossRef]
  27. Bilgin, M. Geopolitics of European natural gas demand: Supplies from Russia, Caspian and the Middle East. Energy Policy 2009, 37, 4482–4492. [Google Scholar] [CrossRef]
  28. Abada, I.; Massol, O. Security of supply and retail competition in the European gas market: Some model-based insights. Energy Policy 2011, 39, 4077–4088. [Google Scholar] [CrossRef]
  29. Zhao, S.R.; Cheng, S.P. Study on China’s Natural Gas Industry Development Strategy under the Framework of International Energy Security Cooperation-Taking Natural Gas Industry in Sichuan Province as an Example. In Proceedings of the 2012 International Conference on Management Science & Engineering, Dallas, TX, USA, 20–22 September 2012; pp. 1686–1691.
  30. Vonlanzenauer, C.H.; James, W.G.; Wright, D.D. Insufficient Supply in a Natural Gas Distribution System: A Risk Analysis. Eur. J. Oper. Res. 1992, 56, 41–53. [Google Scholar] [CrossRef]
  31. Erdogdu, E. Bypassing Russia: Nabucco project and its implications for the European gas security. Renew. Sustain. Energy Rev. 2010, 14, 2936–2945. [Google Scholar] [CrossRef] [Green Version]
  32. Chedid, R.; Kobrosly, M.; Ghajar, R. A supply model for crude oil and natural gas in the Middle East. Energy Policy 2007, 35, 2096–2109. [Google Scholar] [CrossRef]
  33. Hamedi, M.; Zanjirani Farahani, R.; Husseini, M.M.; Esmaeilian, G.R. A distribution planning model for natural gas supply chain: A case study. Energy Policy 2009, 37, 799–812. [Google Scholar] [CrossRef]
  34. Chi, K.C.; Nuttall, W.J.; Reiner, D.M. Dynamics of the UK natural gas industry: System dynamics modelling and long-term energy policy analysis. Technol. Forecast. Soc. Chang. 2009, 76, 339–357. [Google Scholar]
  35. Sun, J.C.; Lv, D.; Wu, F. The simulated system dynamics analysis of the natural gas supply and demand. Kybernetes 2010, 39, 1262–1269. [Google Scholar]
  36. Li, J.C.; Dong, X.C.; Shangguan, J.X.; Hook, M. Forecasting the growth of China’s natural gas consumption. Energy 2011, 36, 1380–1385. [Google Scholar] [CrossRef]
  37. Jansen, J.C.; van Arkel, W.; Boots, M.G. Designing Indicators of Long-Term Energy Supply Security; Energy Research Centre of Netherlands: Petten, The Netherlands, 2004. [Google Scholar]
  38. Johnson, C.; Boersma, T. Energy (in)security in Poland the case of shale gas. Energy Policy 2013, 53, 389–399. [Google Scholar] [CrossRef]
  39. Szikszai, A.; Monforti, F. GEMFLOW: A time dependent model to assess responses to natural gas supply crises. Energy Policy 2011, 39, 5129–5136. [Google Scholar] [CrossRef]
  40. Weisser, H. The security of gas supply—A critical issue for Europe? Energy Policy 2007, 35, 1–5. [Google Scholar] [CrossRef]
  41. He, C.L.; Zhou, G.D. Safe supply of natural gas in China under global environment. Nat. Gas Ind. 2010, 30, 123–126. (In Chinese) [Google Scholar]
  42. Downs, E.S. China and the global energy crisis: Development and prospects for China’s oil and natural gas. China Q. 2007, 191, 762–763. [Google Scholar]
  43. Patten, B.C. Systems Approach to the Concept of Environment. Ohio J. Sci. 1978, 7, 206–222. [Google Scholar]
  44. Fath, B.D.; Patten, B.C. Review of the foundations of network environ analysis. Ecosystems 1999, 2, 167–179. [Google Scholar] [CrossRef]
  45. Latham, L.G. Network flow analysis algorithms. Ecol. Model. 2006, 192, 586–600. [Google Scholar] [CrossRef]
  46. Huang, J.; Ulanowicz, R.E. Ecological Network Analysis for Economic Systems: Growth and Development and Implications for Sustainable Development. PLoS ONE 2014, 9. [Google Scholar] [CrossRef]
  47. Zhang, Y.; Zheng, H.M.; Fath, B.D.; Liu, H.; Yang, Z.F.; Liu, G.Y.; Su, M.R. Ecological network analysis of an urban metabolic system based on input-output tables: Model development and case study for Beijing. Sci. Total Environ. 2014, 468, 642–653. [Google Scholar] [CrossRef] [PubMed]
  48. Small, G.E.; Sterner, R.W.; Finlay, J.C. An Ecological Network Analysis of nitrogen cycling in the Laurentian Great Lakes. Ecol. Model. 2014, 293, 150–160. [Google Scholar] [CrossRef]
  49. Baird, D.; Fath, B.D.; Ulanowicz, R.E.; Asmus, H.; Asmus, R. On the consequences of aggregation and balancing of networks on system properties derived from ecological network analysis. Ecol. Model. 2009, 220, 3465–3471. [Google Scholar] [CrossRef]
  50. World Energy Outlook 2010; International Energy Agency: Paris, France, 2010; Available online: http://www.worldenergyoutlook.org/weo2010/ (accessed on 1 December 2015).
  51. General Administration of Customs of the P.R.C. The China Customs Statistics Yearbooks (2001); China Customs: Beijing, China, 2001; pp. 1657–2930.
  52. General Administration of Customs of the P.R.C. The China Customs Statistics Yearbooks (2002); China Customs: Beijing, China, 2002; pp. 1554–3202.
  53. General Administration of Customs of the P.R.C. The China Customs Statistics Yearbooks (2003); China Customs: Beijing, China, 2004; Available online: http://tongji.cnki.net/kns55/navi/YearBook.aspx?id=N2013040092&floor=1 (accessed on 1 December 2015).
  54. General Administration of Customs of the P.R.C. The China Customs Statistics Yearbooks (2004); China Customs: Beijing, China, 2005; Available online: http://tongji.cnki.net/kns55/navi/YearBook.aspx?id=N2013040093&floor=1 (accessed on 1 December 2015).
  55. General Administration of Customs of the P.R.C. The China Customs Statistics Yearbooks (2005); China Customs: Beijing, China, 2006; Available online: http://tongji.cnki.net/kns55/navi/YearBook.aspx?id=N2013040094&floor=1 (accessed on 1 December 2015).
  56. General Administration of Customs of the P.R.C. The China Customs Statistics Yearbooks (2006); China Customs: Beijing, China, 2007; Available online: http://tongji.cnki.net/kns55/navi/YearBook.aspx?id=N2013040095&floor=1 (accessed on 1 December 2015).
  57. General Administration of Customs of the P.R.C. The China Customs Statistics Yearbooks (2007); China Customs: Beijing, China, 2008; Available online: http://tongji.cnki.net/kns55/navi/YearBook.aspx?id=N2013040096&floor=1 (accessed on 1 December 2015).
  58. General Administration of Customs of the P.R.C. The China Customs Statistics Yearbooks (2008); China Customs: Beijing, China, 2009; Available online: http://tongji.cnki.net/kns55/navi/YearBook.aspx?id=N2013040097&floor=1 (accessed on 1 December 2015).
  59. General Administration of Customs of the P.R.C. The China Customs Statistics Yearbooks (2009); China Customs: Beijing, China, 2010; Available online: http://tongji.cnki.net/kns55/navi/YearBook.aspx?id=N2013040098&floor=1 (accessed on 1 December 2015).
  60. General Administration of Customs of the P.R.C. The China Customs Statistics Yearbooks (2010); China Customs: Beijing, China, 2011; Available online: http://tongji.cnki.net/kns55/navi/YearBook.aspx?id=N2013040099&floor=1 (accessed on 1 December 2015).
  61. General Administration of Customs of the P.R.C. The China Customs Statistics Yearbooks (2011); China Customs: Beijing, China, 2012; Available online: http://tongji.cnki.net/kns55/navi/YearBook.aspx?id=N2013050023&floor=1 (accessed on 1 December 2015).
  62. General Administration of Customs of the P.R.C. The China Customs Statistics Yearbooks (2012); China Customs: Beijing, China, 2013; pp. 1657–4924.
  63. General Administration of Customs of the P.R.C. The China Customs Statistics Yearbooks (2013); China Customs: Beijing, China, 2013; pp. 1945–5796.
  64. British Petroleum Company. BP Statistical Review of World Energy (2001–2013). Available online: http://www.bp.com/en/global/corporate.html (accessed on 1 December 2015).
  65. Ulanowicz, R.E.; Goerner, S.J.; Lietaer, B.; Gomez, R. Quantifying sustainability: Resilience, efficiency and the return of information theory. Ecol. Complex. 2009, 6, 27–36. [Google Scholar] [CrossRef]
  66. Goerner, S.J.; Lietaer, B.; Ulanowicz, R.E. Quantifying economic sustainability: Implications for free-enterprise theory, policy and practice. Ecol. Econ. 2009, 69, 76–81. [Google Scholar] [CrossRef]
  67. Hirata, H.; Ulanowicz, R.E. Information Theoretical Analysis of Ecological Networks. Int. J. Syst. Sci. 1984, 15, 261–270. [Google Scholar] [CrossRef]
  68. Trenbath, B.R. Multispecies cropping systems in India—Predictions of their productivity, stability, resilience and ecological sustainability. Agrofor. Syst. 1999, 45, 81–107. [Google Scholar] [CrossRef]
  69. Walker, B.H.; Anderies, J.M.; Kinzig, A.P.; Ryan, P. Exploring resilience in social-ecological systems through comparative studies and theory development: Introduction to the special issue. Ecol. Soc. 2006, 11, 12. Available online: http://www.ecologyandsociety.org/vol11/iss1/art12/. [Google Scholar]
  70. Zhang, Y.; Yang, Z.F.; Fath, B.D. Ecological network analysis of an urban water metabolic system: Model development, and a case study for Beijing. Sci. Total Environ. 2010, 408, 4702–4711. [Google Scholar] [CrossRef] [PubMed]
  71. Holling, C.S. The resilience of terrestrial ecosystems: Local surprise and global change. Sustain. Dev. Biosph. 1986, 1986, 292–317. [Google Scholar]
  72. Zhang, Y.; Yang, Z.F.; Fath, B.D.; Li, S.S. Ecological network analysis of an urban energy metabolic system: Model development, and a case study of four Chinese cities. Ecol. Model. 2010, 221, 1865–1879. [Google Scholar] [CrossRef]
  73. Patten, B.C. Network ecology: Indirect determination of the life-environment relationship inecosystems. In Theoretical Studiesof Ecosystems: The Network Perspective; Higashi, M., Burns, T.P., Eds.; Cambridge University Press: Cambridge, UK, 1991; pp. 288–351. [Google Scholar]
  74. Fath, B.D. Network mutualism: Positive community-level relations in ecosystems. Ecol. Model. 2007, 208, 56–67. [Google Scholar] [CrossRef]
  75. Wootton, J.T.; Emmerson, M. Measurement of interaction strength innature. Annu. Rev. Ecol. Evol. Syst. 2005, 36, 419–444. [Google Scholar] [CrossRef]
  76. Patten, B.C. Energy, Emergy and Environs. Ecol. Model. 1992, 62, 29–69. [Google Scholar] [CrossRef]
  77. Patten, B.C.; Higashi, M.; Burns, T.P. Trophic dynamics in ecosystem networks: Significance of cycles and storage. Ecol. Model. 1990, 51, 1–28. [Google Scholar] [CrossRef]
  78. Dong, X.C.; Guo, J.; Hook, M.; Pi, G.L. Sustainability Assessment of the Natural Gas Industry in China Using Principal Component Analysis. Sustainability 2015, 7, 6102–6118. [Google Scholar] [CrossRef]
  79. Shi, G.H.; Jing, Y.Y.; Wang, S.L.; Zhang, X.T. Development status of liquefied natural gas industry in China. Energy Policy 2010, 38, 7457–7465. [Google Scholar] [CrossRef]

