
Unit Commitment Model Considering Flexible Scheduling of Demand Response for High Wind Integration

Abstract
:1. Introduction
- (1)
- What is the effect of DR on the system operation flexibility of a power grid with large-scale renewable energy integration?
- (2)
- How can the effectiveness be maximized at minimum cost using the flexible scheduling strategies of DR considering the coupling characteristics of centralized, controlled DR resources?
- (3)
- Which characteristic of DR will affect the flexible schedule performance and what is the turnkey? What are the impacts of the transmission constraints?
2. Problem Definition
2.1. Stochastic Unit Commitment
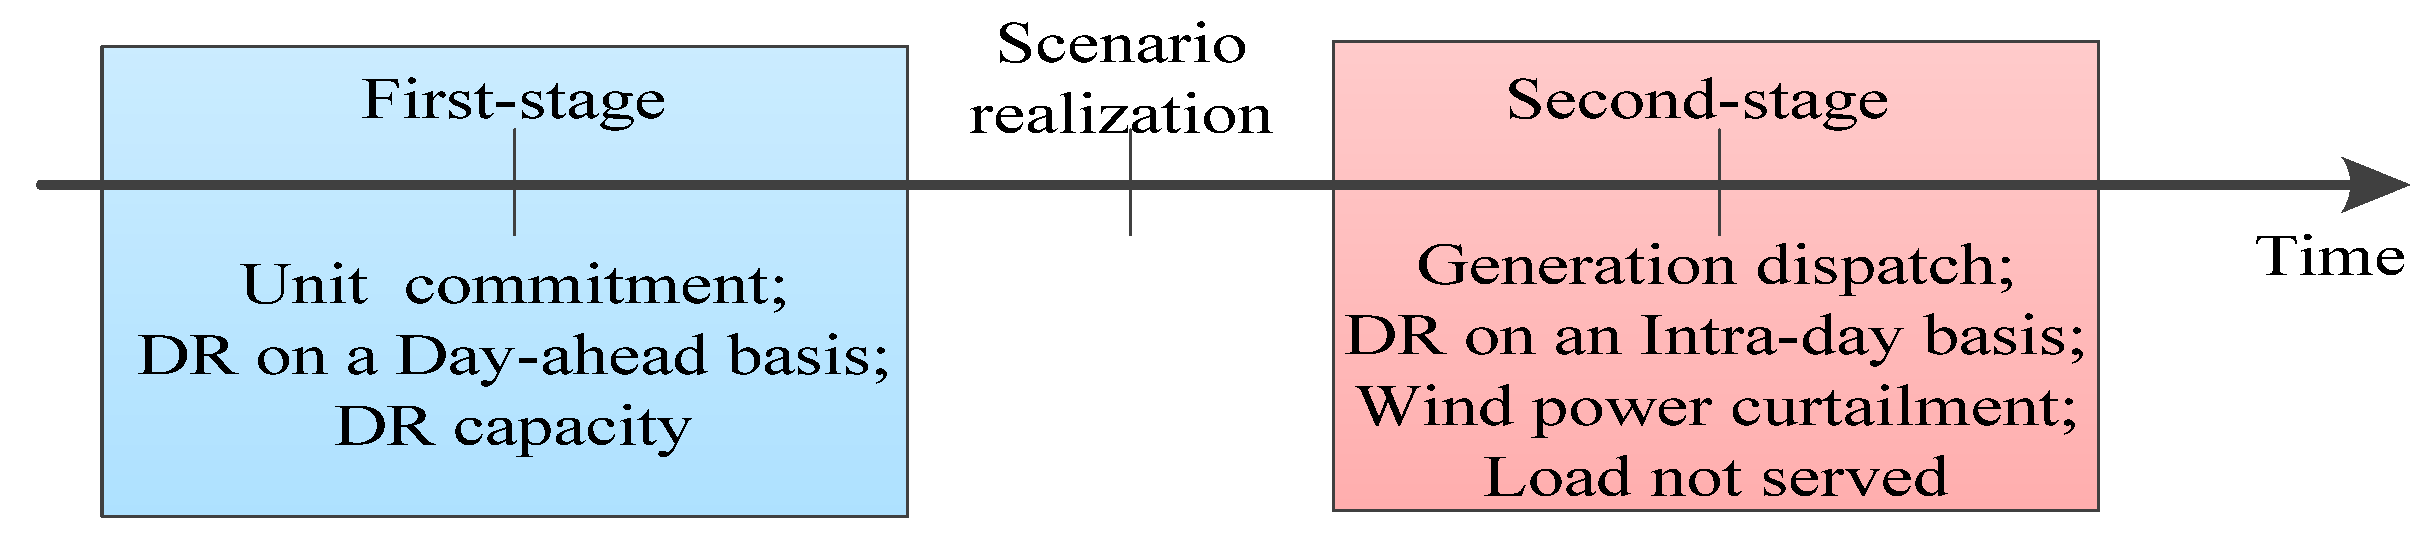
2.2. Demand Flexibility
- (1)
- Constraints for the first stage:
- minimum onsite hours called once;
- maximum times called during a defined period;
- minimum/maximum responsive capacity.
- (2)
- Constraints for the second stage:
- maximum responsive capacity.
- (3)
- Coupled constraints for both stages:
- maximum capacity of DR of the sum of two stages.
3. Problem Formulation
3.1. Objective Function
3.2. Constraints
3.2.1. Power Balance
3.2.2. Network Constraint
3.2.3. Constraints for Conventional Units
3.2.4. Constraints for DR
3.2.5. Non-Negativity
4. Case Study
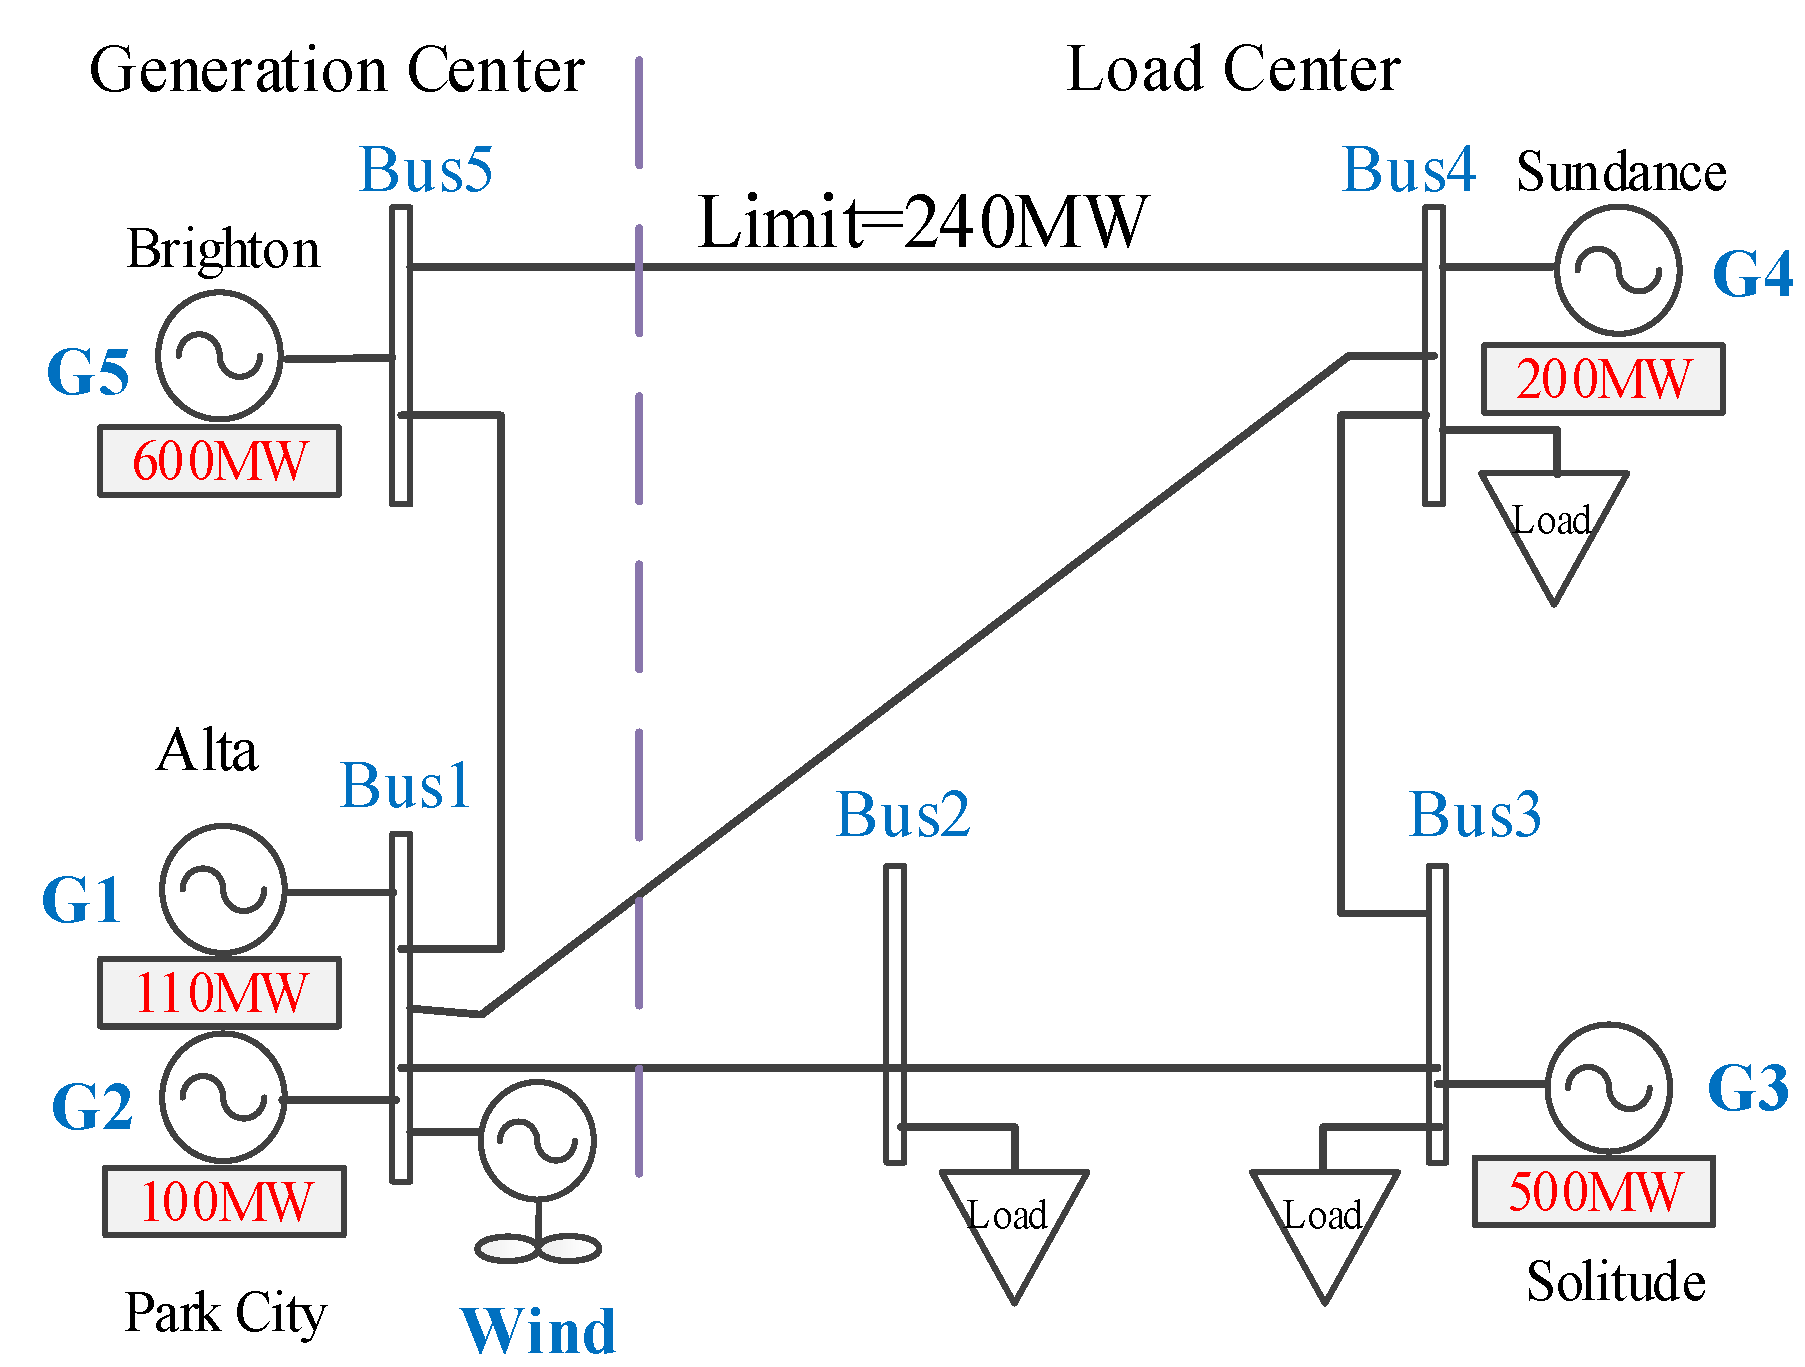
4.1. PJM5-Bus System
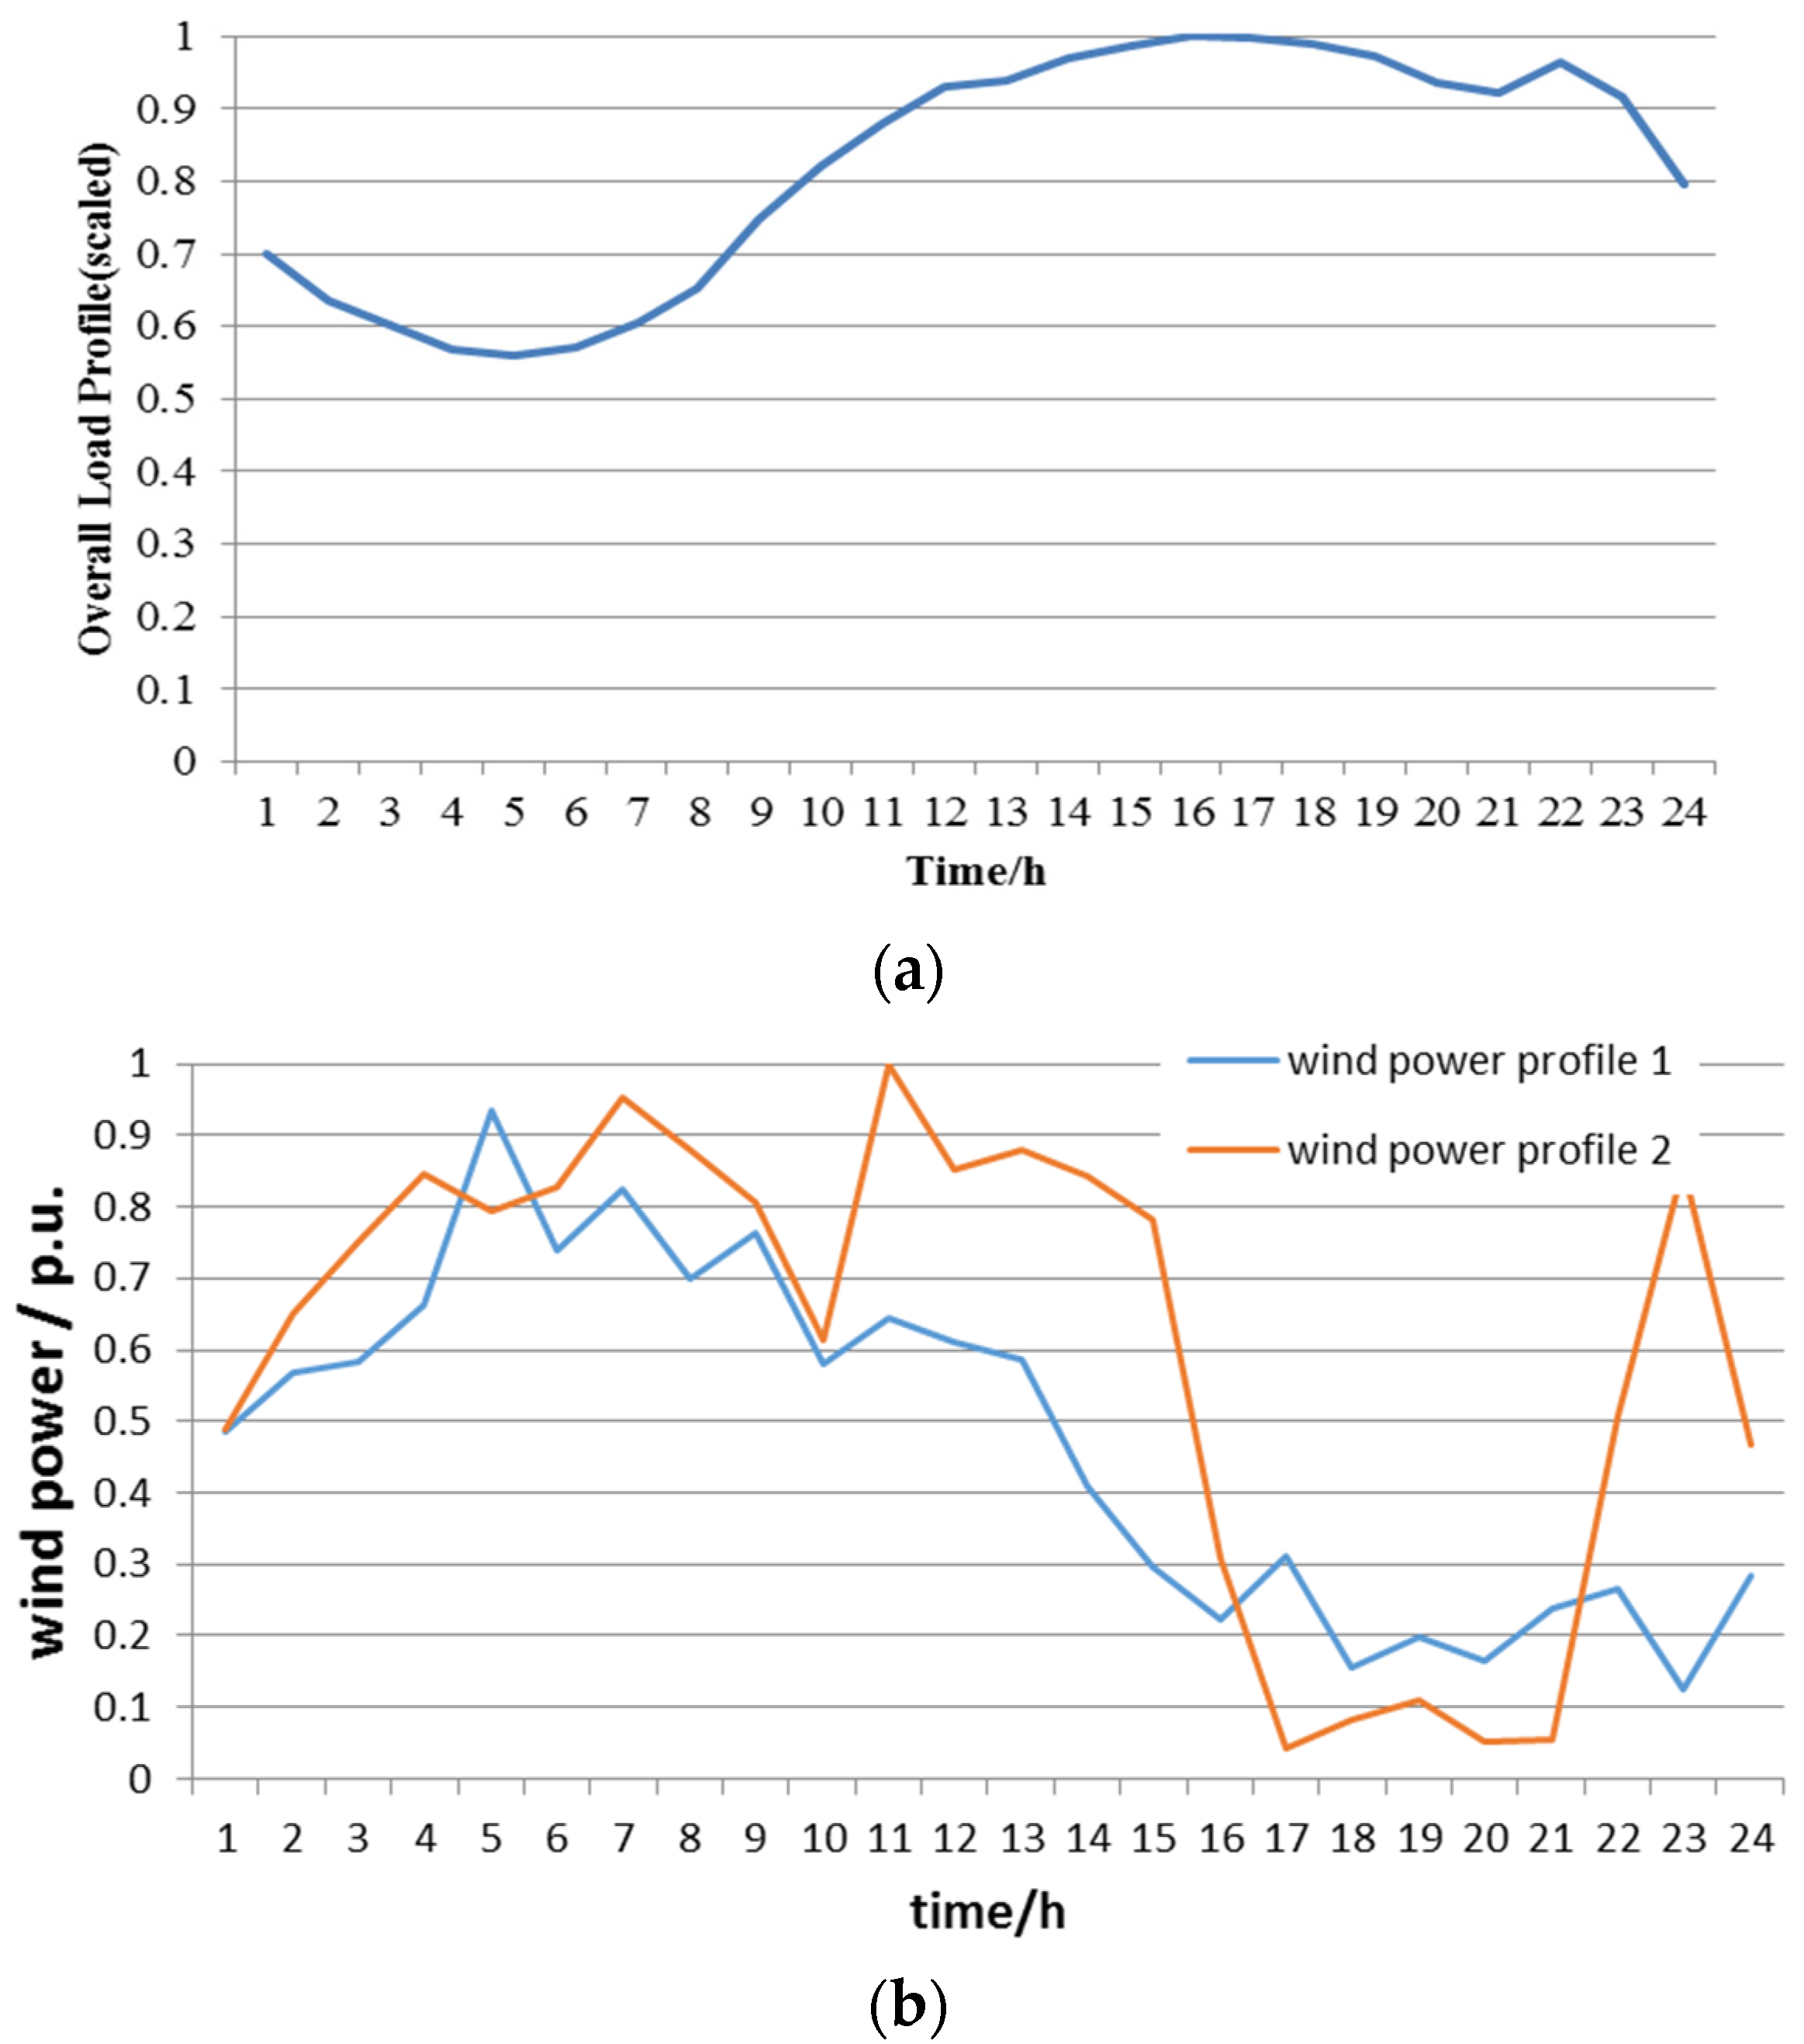
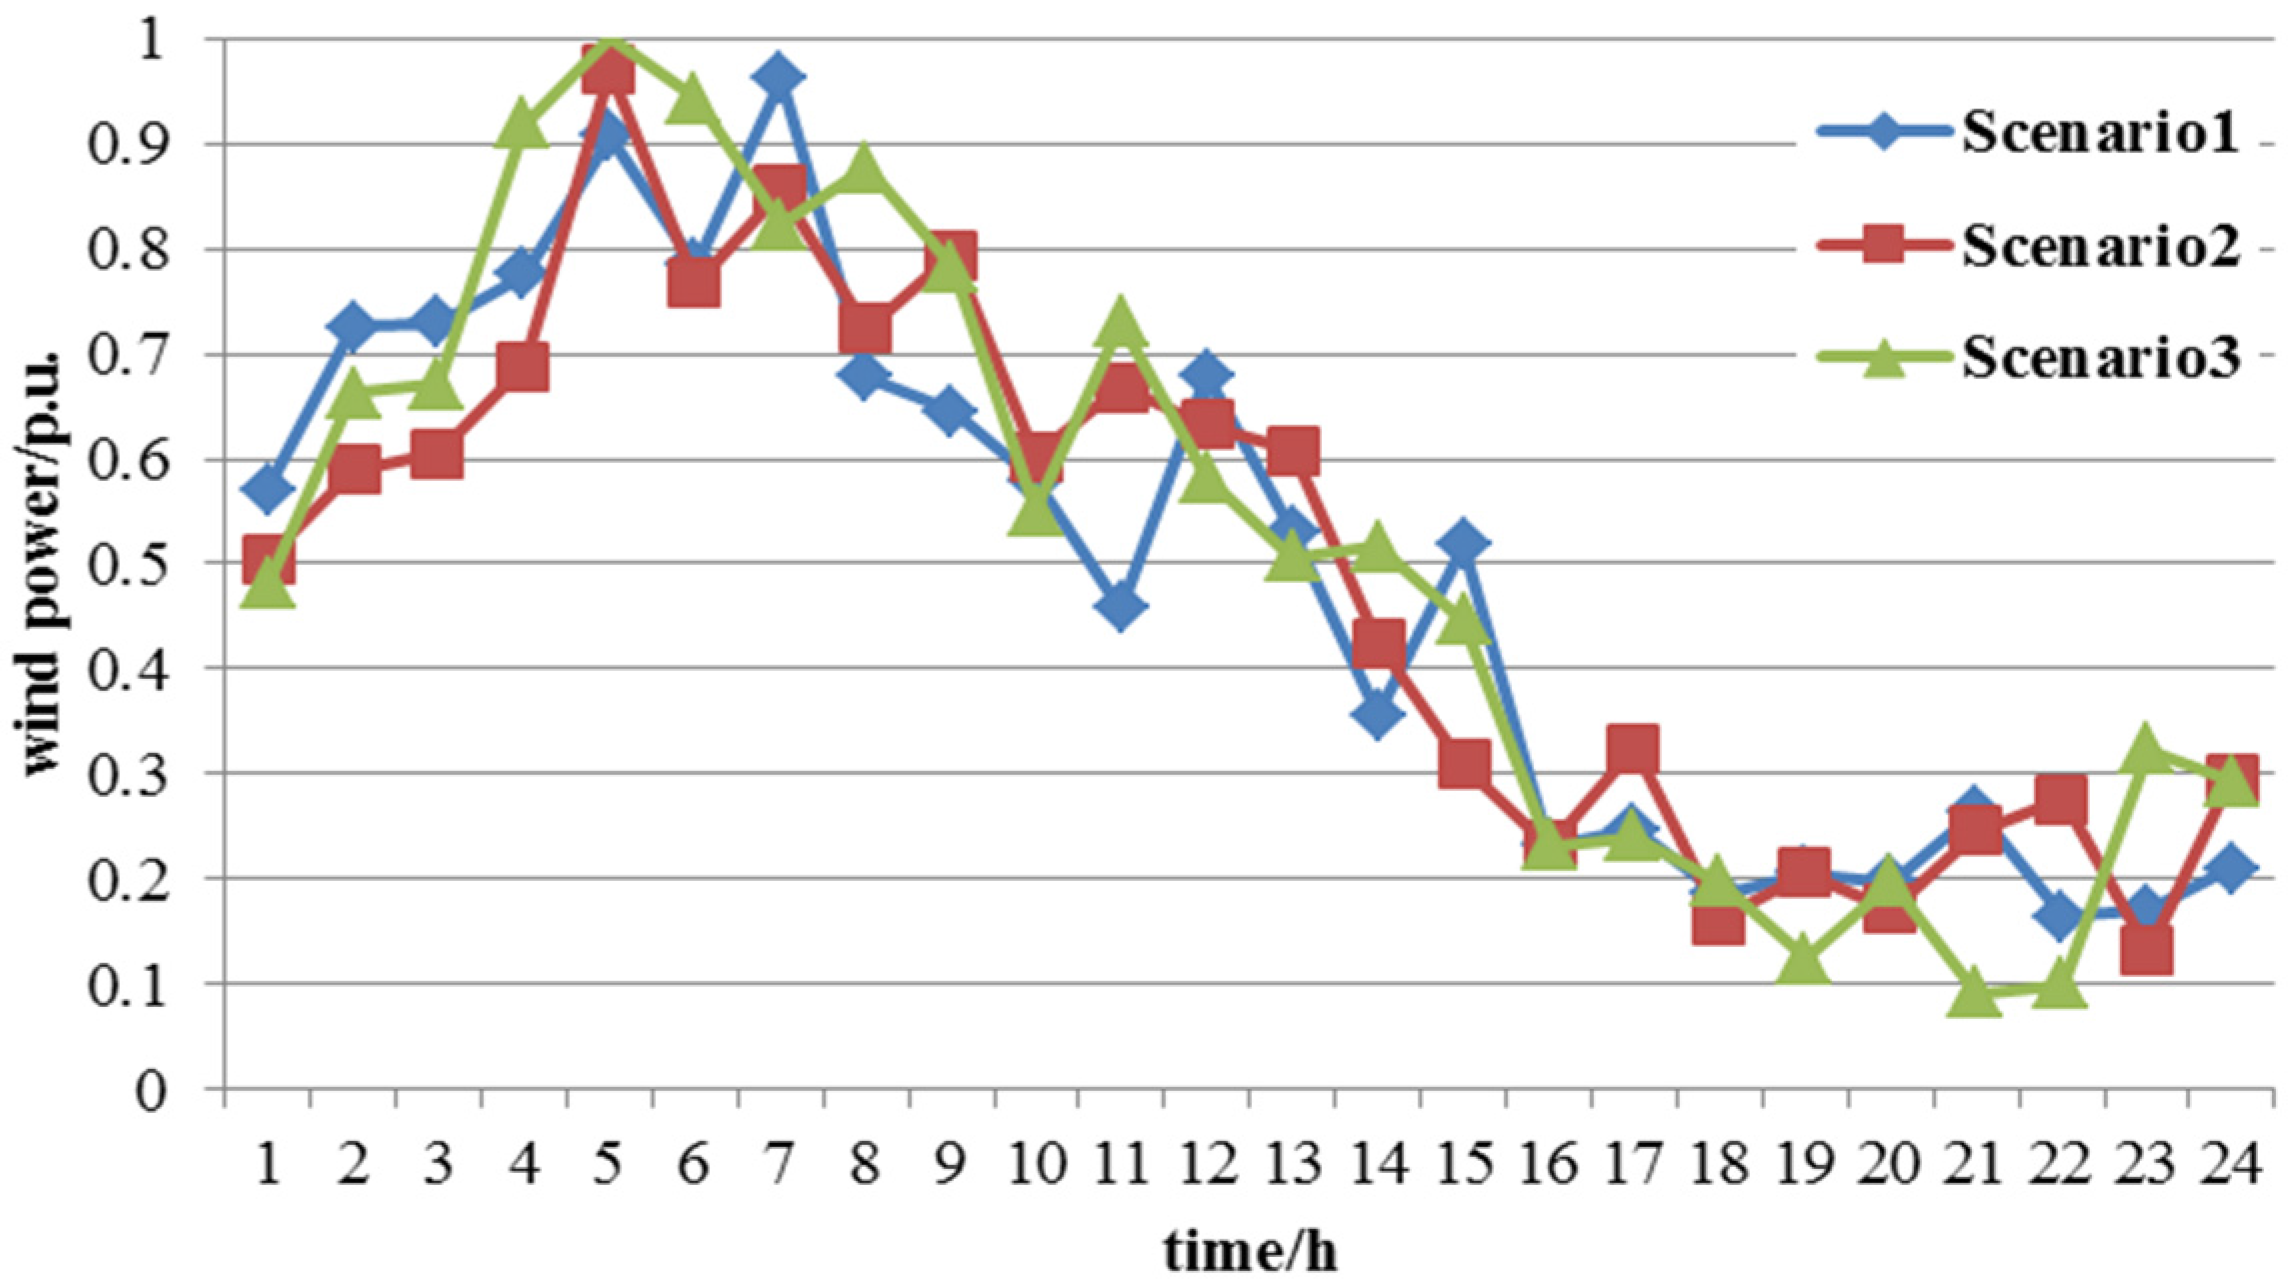
4.1.1. Data Assumption


| Unit | (MW) | (MW) | Incremental Cost ($/MWh) | Scn ($) | MDn/ MUn (h) | / (MW/min) |
|---|---|---|---|---|---|---|
| G1 | 22 | 110 | 14 | 450 | 6/6 | 0.45 |
| G2 | 20 | 100 | 15 | 900 | 6/6 | 0.42 |
| G3 | 100 | 500 | 30 | 300 | 4/4 | 2 |
| G4 | 60 | 200 | 40 | 150 | 1/1 | 0.8 |
| G5 | 120 | 600 | 20 | 1200 | 6/6 | 2.5 |
| DR Aggregators | (MW) | (MW) | (h) | / ($/MWh) | ($/MW) |
|---|---|---|---|---|---|
| 1 | 35 | 3.5 | 4 | 8/20 | 15 |
| 2 | 25 | 2.5 | 4 | 6/25 | 15 |
| 3 | 25 | 2.5 | 8 | 5/16 | 15 |
| 4 | 35 | 3.5 | 8 | 2/23 | 15 |
| 5 | 20 | 2 | 1 | 10/15 | 15 |
4.1.2. Results and Discussion
(1) DR Scheduling Modes Impact on Costs
| Mode | ODR | FDR | SDR | F&SDR (Proposed Model) |
|---|---|---|---|---|
| Total Cost (103$) | Base (597.85) | −5.37 | −60.05 | −62.32 |
| Generation Cost (103$) | Base (540.33) | −11.16 | −7.25 | −11.88 |
| Start-up Cost (103$) | Base (0.30) | +0 | +0 | +0 |
| Wind Curtailment Cost (103$) | Base (0.59) | −0.56 | −0.59 | −0.59 |
| Load not served Cost (103$) | Base (56.63) | +0.56 | −56.63 | −56.63 |
| DR Capacity Cost (103$) | Base (0) | +1.27 | +0.62 | +1.21 |
| DR operating cost (103$) | Base (0) | +4.52 | +3.80 | +5.57 |
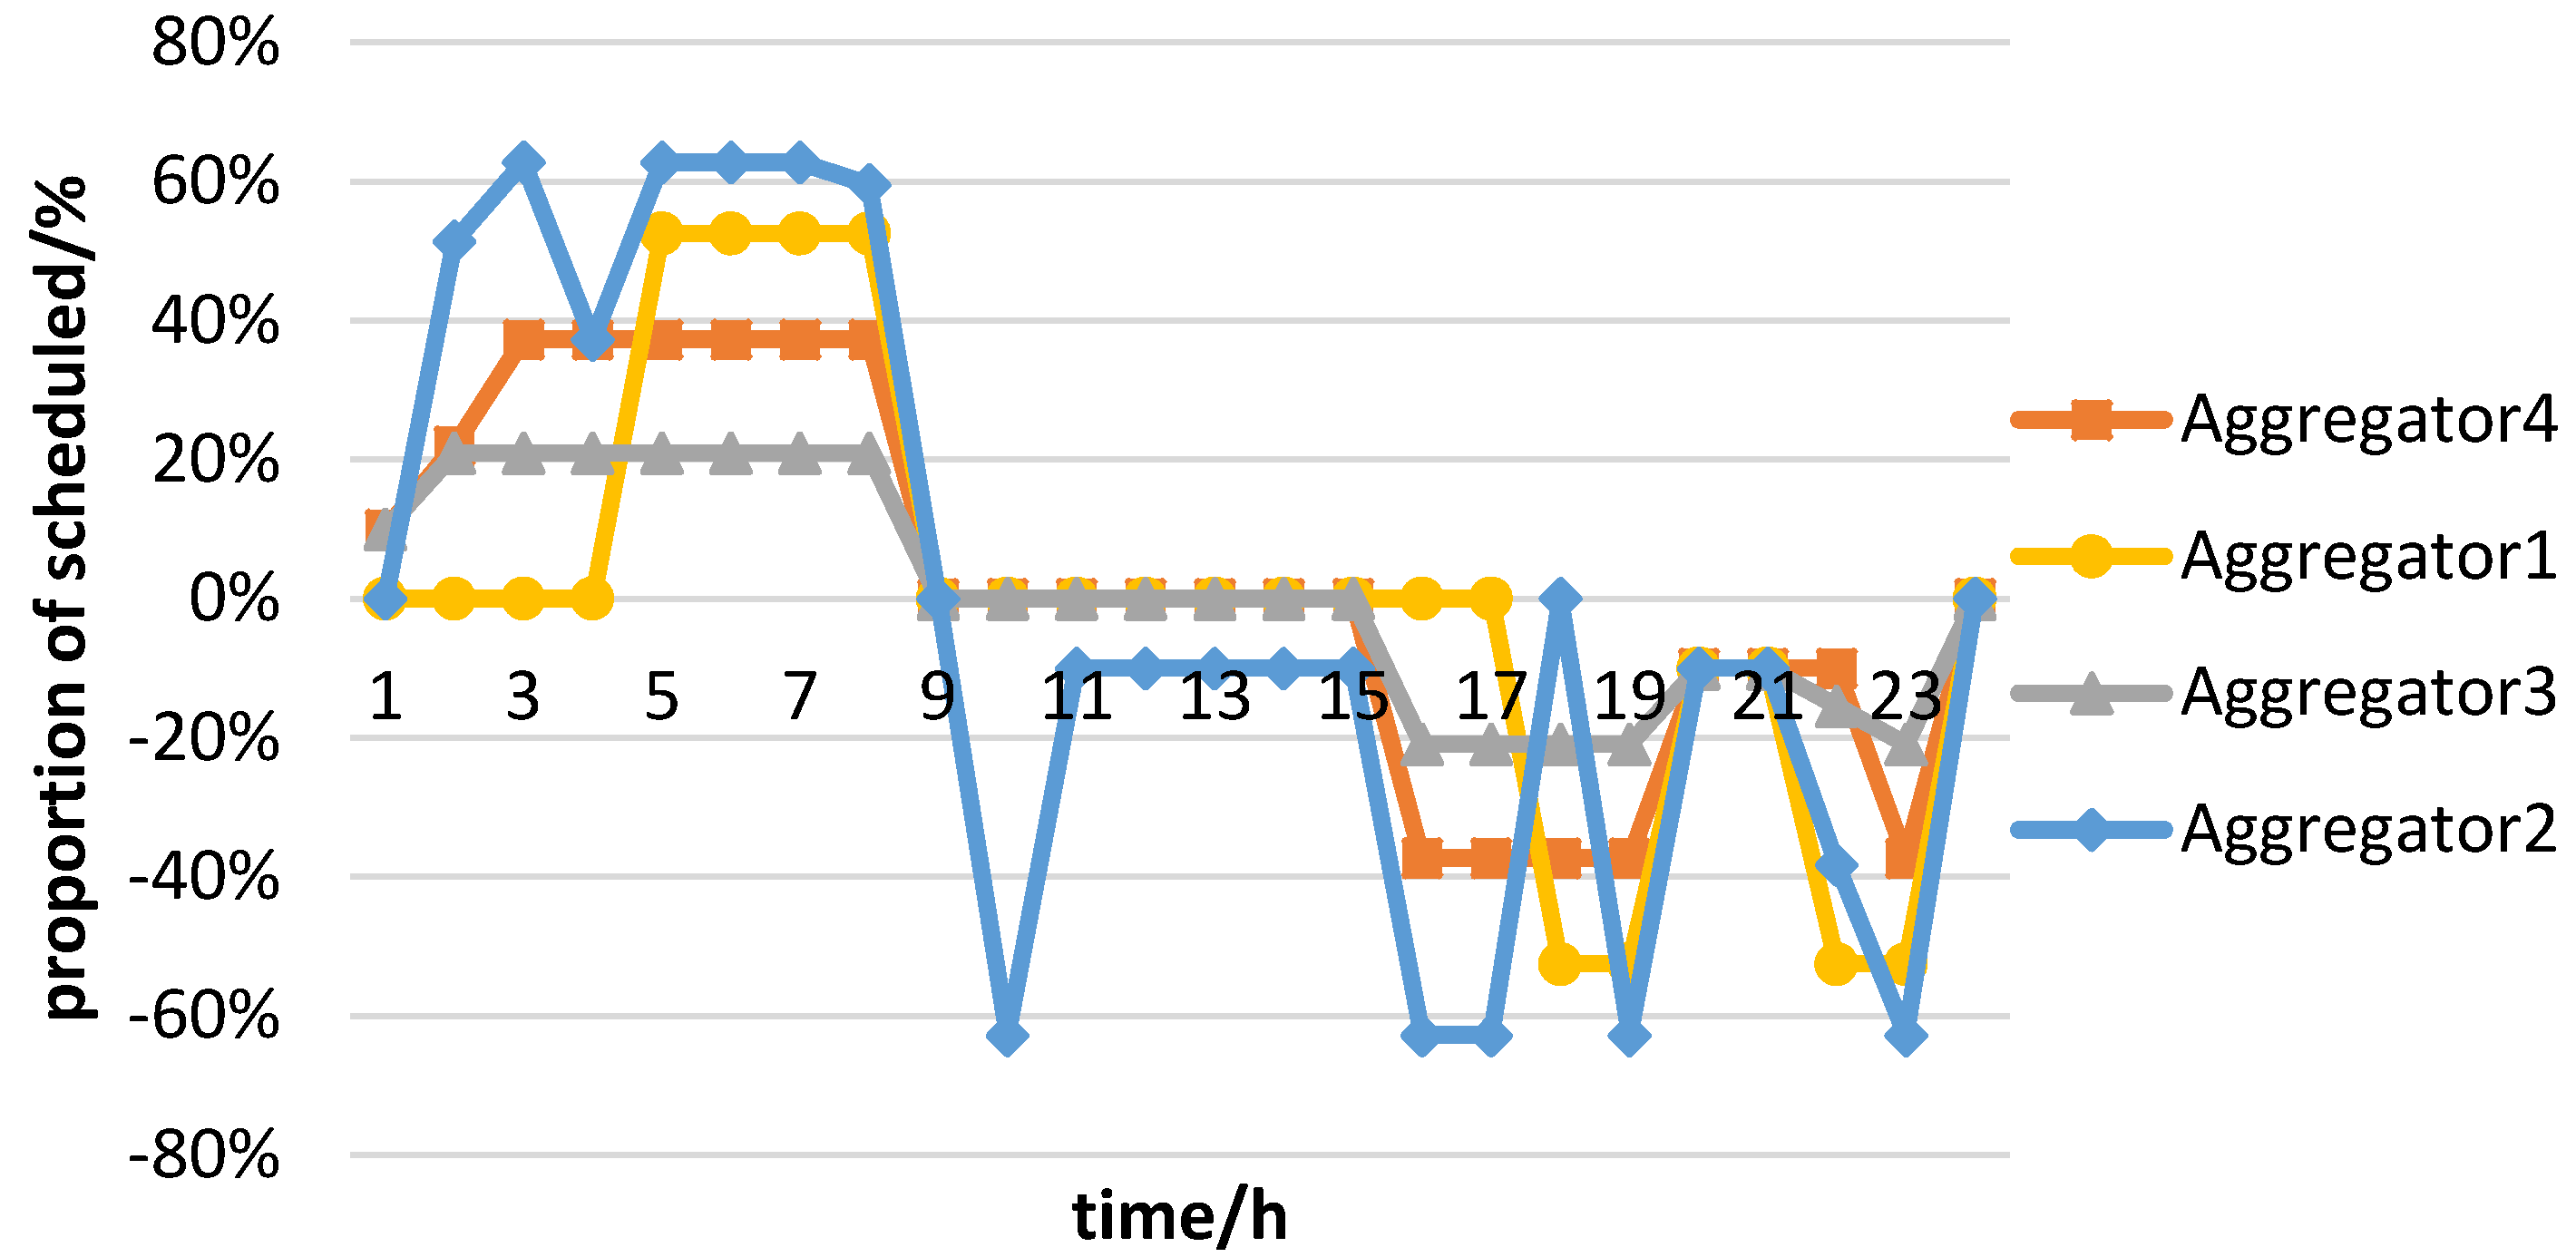
(2) DR Allocation among Aggregators with Different Characteristics: no Transmission Constraints
| DR Aggregators | First_s a | Second_s1 b | Second_s2 b | Second_s3 b |
|---|---|---|---|---|
| 1 | 0% | 0% | 0% | 7.13% |
| 2 | 0% | 0% | 0% | 0% |
| 3 | 26.32% | 11.48% | 18.41% | 17.59% |
| 4 | 83.33% | 0% | 0% | 0% |
| 5 | 0% | 16.96% | 22.97% | 26.31% |

| DR Aggregators | (MW) | (MW) | (h) | / ($/MWh) | ($/MW) |
|---|---|---|---|---|---|
| 1 | 35 | 3.5 | 4 | 5/14 | 15 |
| 2 | 25 | 2.5 | 4 | 5/14 | 15 |
| 3 | 25 | 2.5 | 8 | 6/15 | 15 |
| 4 | 35 | 3.5 | 8 | 6/15 | 15 |
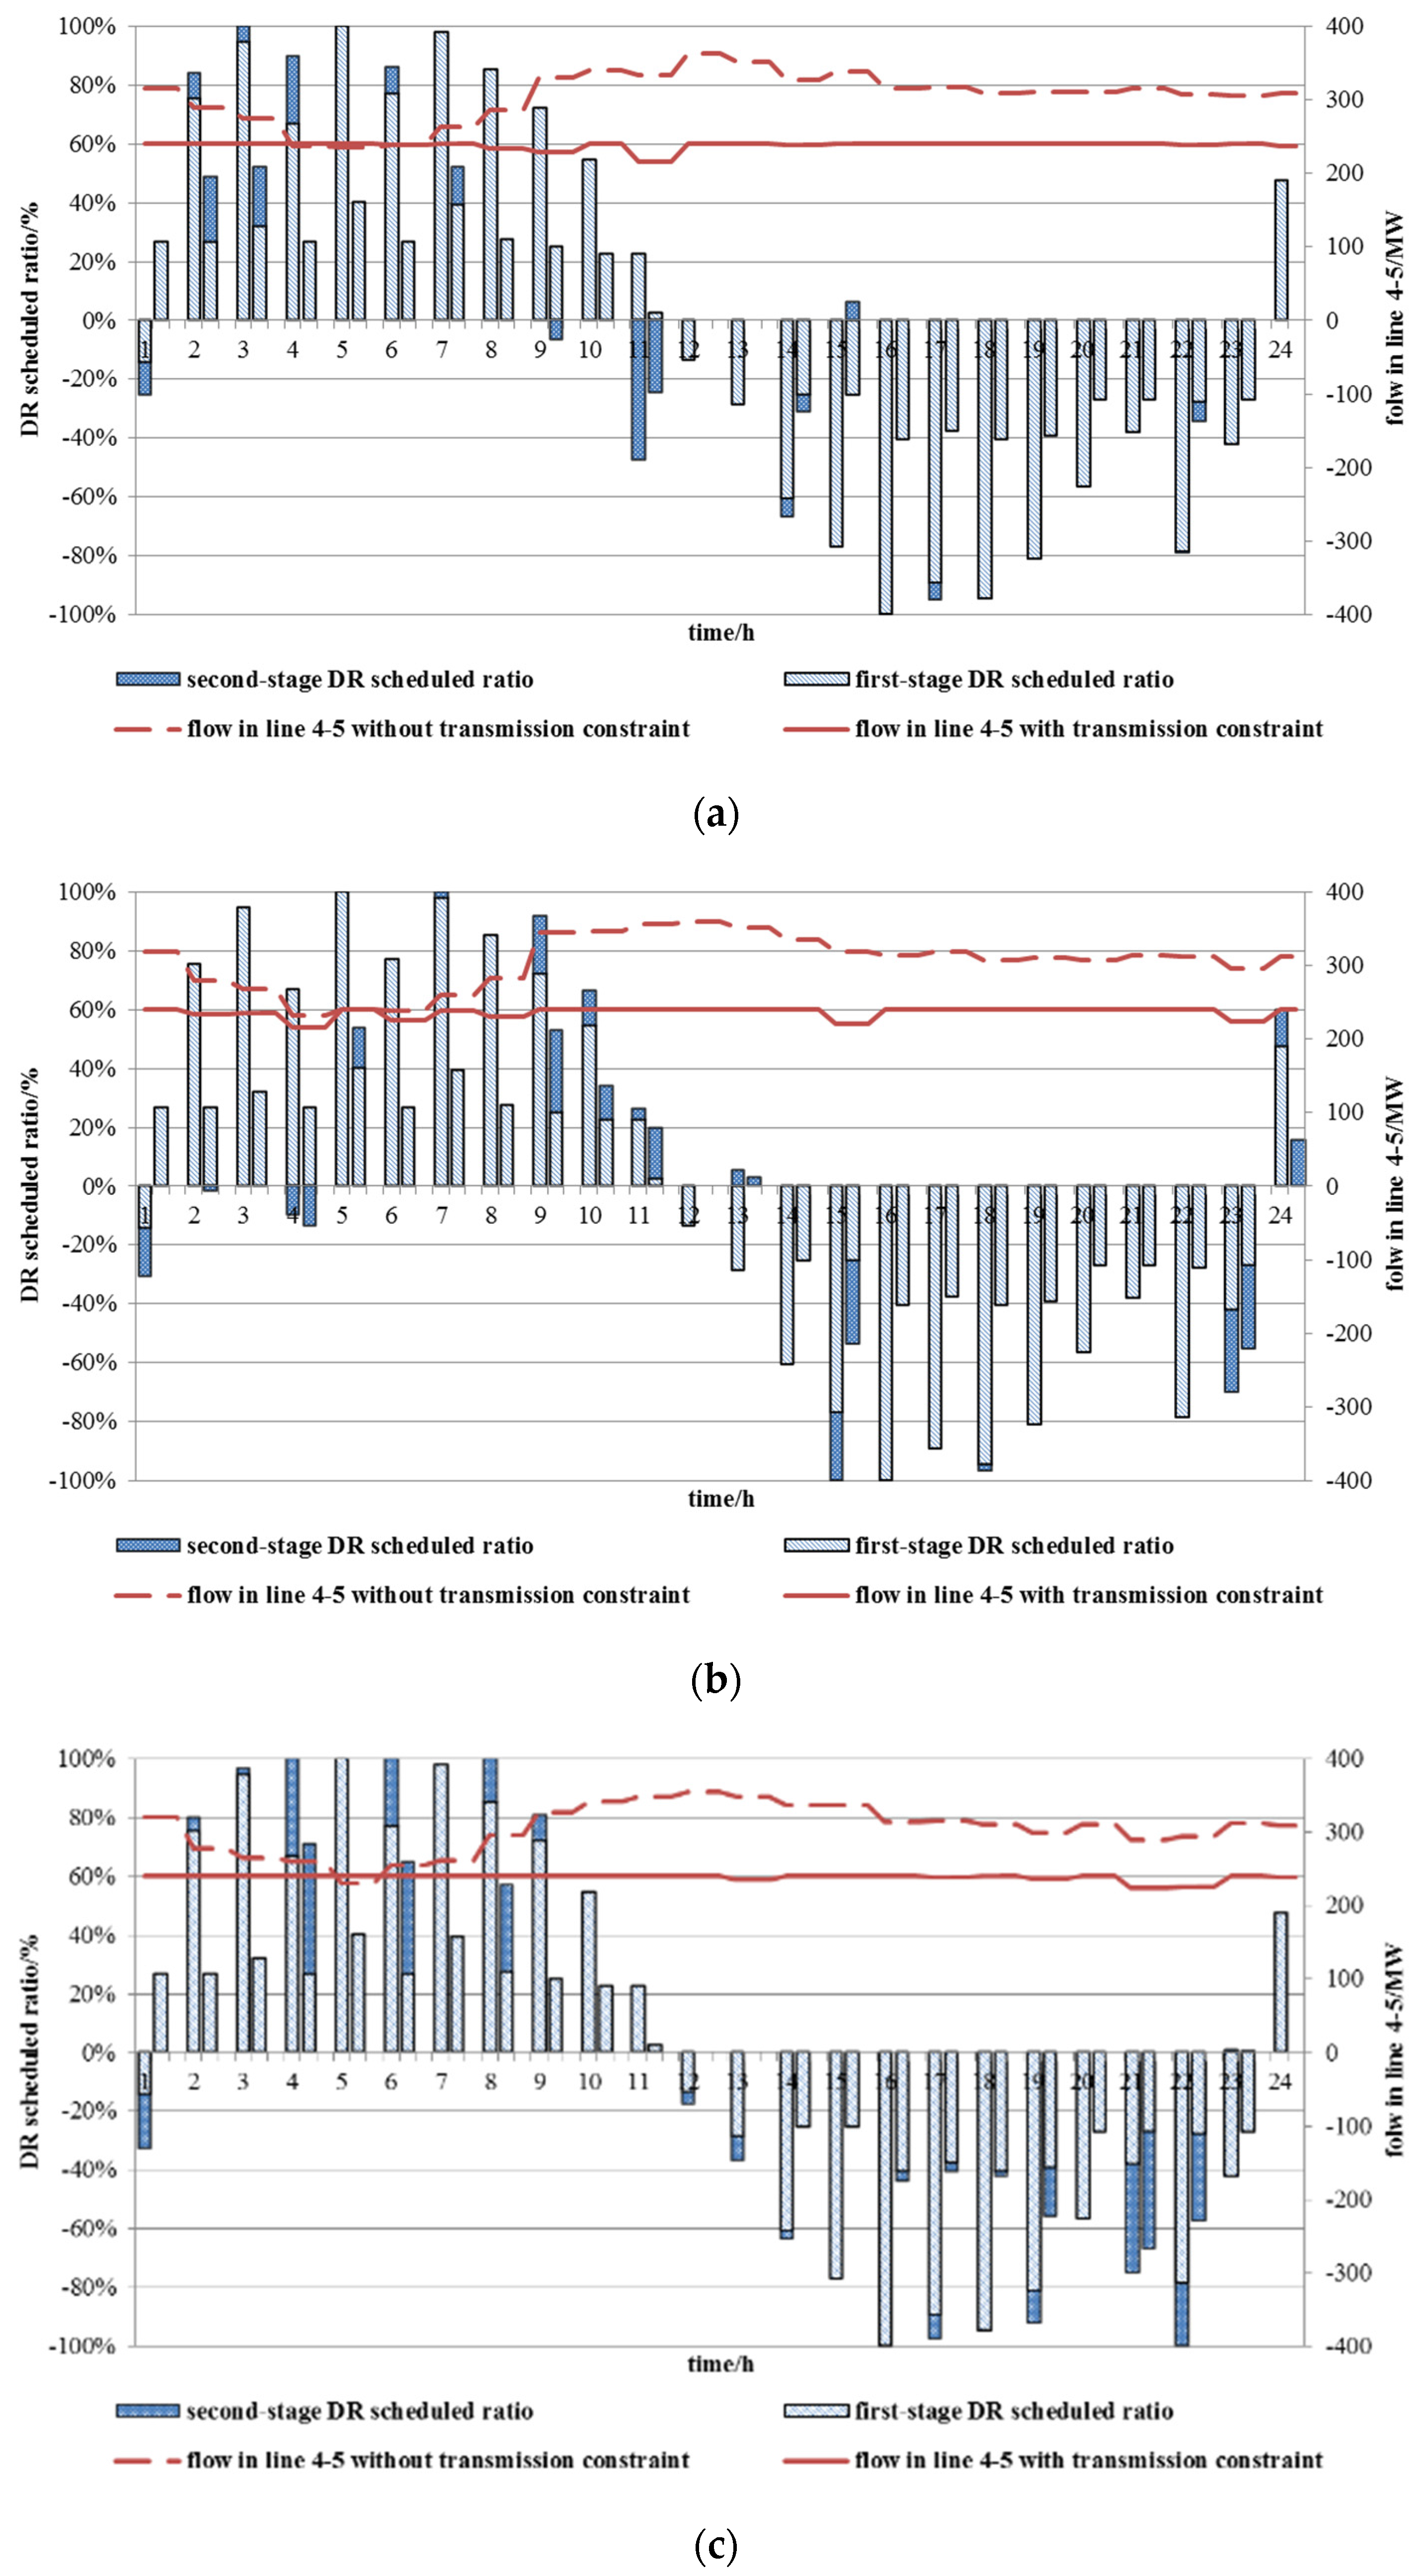
(3) Results Considering Transmission Constraints
| Mode | ODR | FDR | SDR | F&SDR (Proposed Model) |
|---|---|---|---|---|
| Total Cost (103$) | Base (1141.40) | −508.76 | −525.95 | −556.52 |
| Generation Cost (103$) | Base (529.54) | +30.92 | +35.71 | +35.58 |
| Start-up Cost (103$) | Base (0.3) | +0 | +0 | +0 |
| Wind Curtailment Cost (103$) | Base (2.80) | −2.76 | −2.80 | −2.80 |
| Load not Served Cost (103$) | Base (608.79) | −551.54 | −605.67 | −605.67 |
| DR Capacity Cost (103$) | Base (0) | +2.1 | +2.1 | +2.1 |
| DR Operating Cost (103$) | Base (0) | +12.50 | +44.69 | +14.24 |
| Mode | ODR | FDR | SDR | F&SDR (Proposed Model) |
|---|---|---|---|---|
| Total Cost (103$) | Base (976.590) | −427.33 | −406.55 | −431.16 |
| Generation Cost (103$) | Base (492.66) | +29.71 | +30.51 | +29.81 |
| Start-up Cost (103$) | Base (0.6) | −0.3 | −0.3 | −0.3 |
| Wind Curtailment Cost (103$) | Base (1.14) | −1.14 | −1.14 | −1.14 |
| Load not Served Cost (103$) | Base (482.19) | −468.03 | −472.13 | −472.13 |
| DR Capacity Cost (103$) | Base (0) | +2.1 | +2.1 | +2.1 |
| DR Operating Cost (103$) | Base (0) | +10.34 | +34.41 | +10.51 |
| DR Aggregators | First Stage | Second_s1 | Second_s2 | Second_s3 |
|---|---|---|---|---|
| 1 | 49.67% | 5.12% | 1.58% | 9.44% |
| 2 | 74.27% | 0% | 0% | 0.13% |
| 3 | 76.67% | 6.67% | 9.17% | 6.67% |
| 4 | 90.93% | 0% | 0% | 0% |
| 5 | 21.81% | 16.37% | 24.47% | 32.82% |
| DR Aggregators | First_stage | Second_s1 | Second_s2 | Second_s3 | Second_s4 | Second_s5 |
|---|---|---|---|---|---|---|
| 1 | 35.15% | 0.51% | 0.48% | 0.48% | 0.48% | 2.55% |
| 2 | 59.44% | 0% | 0% | 0% | 0% | 0% |
| 3 | 70.83% | 4.17% | 6.46% | 4.17% | 5.40% | 4.17% |
| 4 | 83.33% | 0% | 0% | 0% | 0% | 0% |
| 5 | 28.65% | 4.84% | 3.21% | 19.19% | 3.96% | 7.25% |
4.2. IEEE 118 Case
4.2.1. Data Assumption
| DR Aggregators | (MW) | (MW) | (h) | / ($/MWh) | ($/MW) |
|---|---|---|---|---|---|
| 1 | 42 | 4.2 | 4 | 8/20 | 15 |
| 2 | 30 | 3.0 | 4 | 6/25 | 15 |
| 3 | 30 | 3.0 | 8 | 5/16 | 15 |
| 4 | 42 | 4.2 | 8 | 2/23 | 15 |
| 5 | 24 | 2.4 | 1 | 10/15 | 15 |
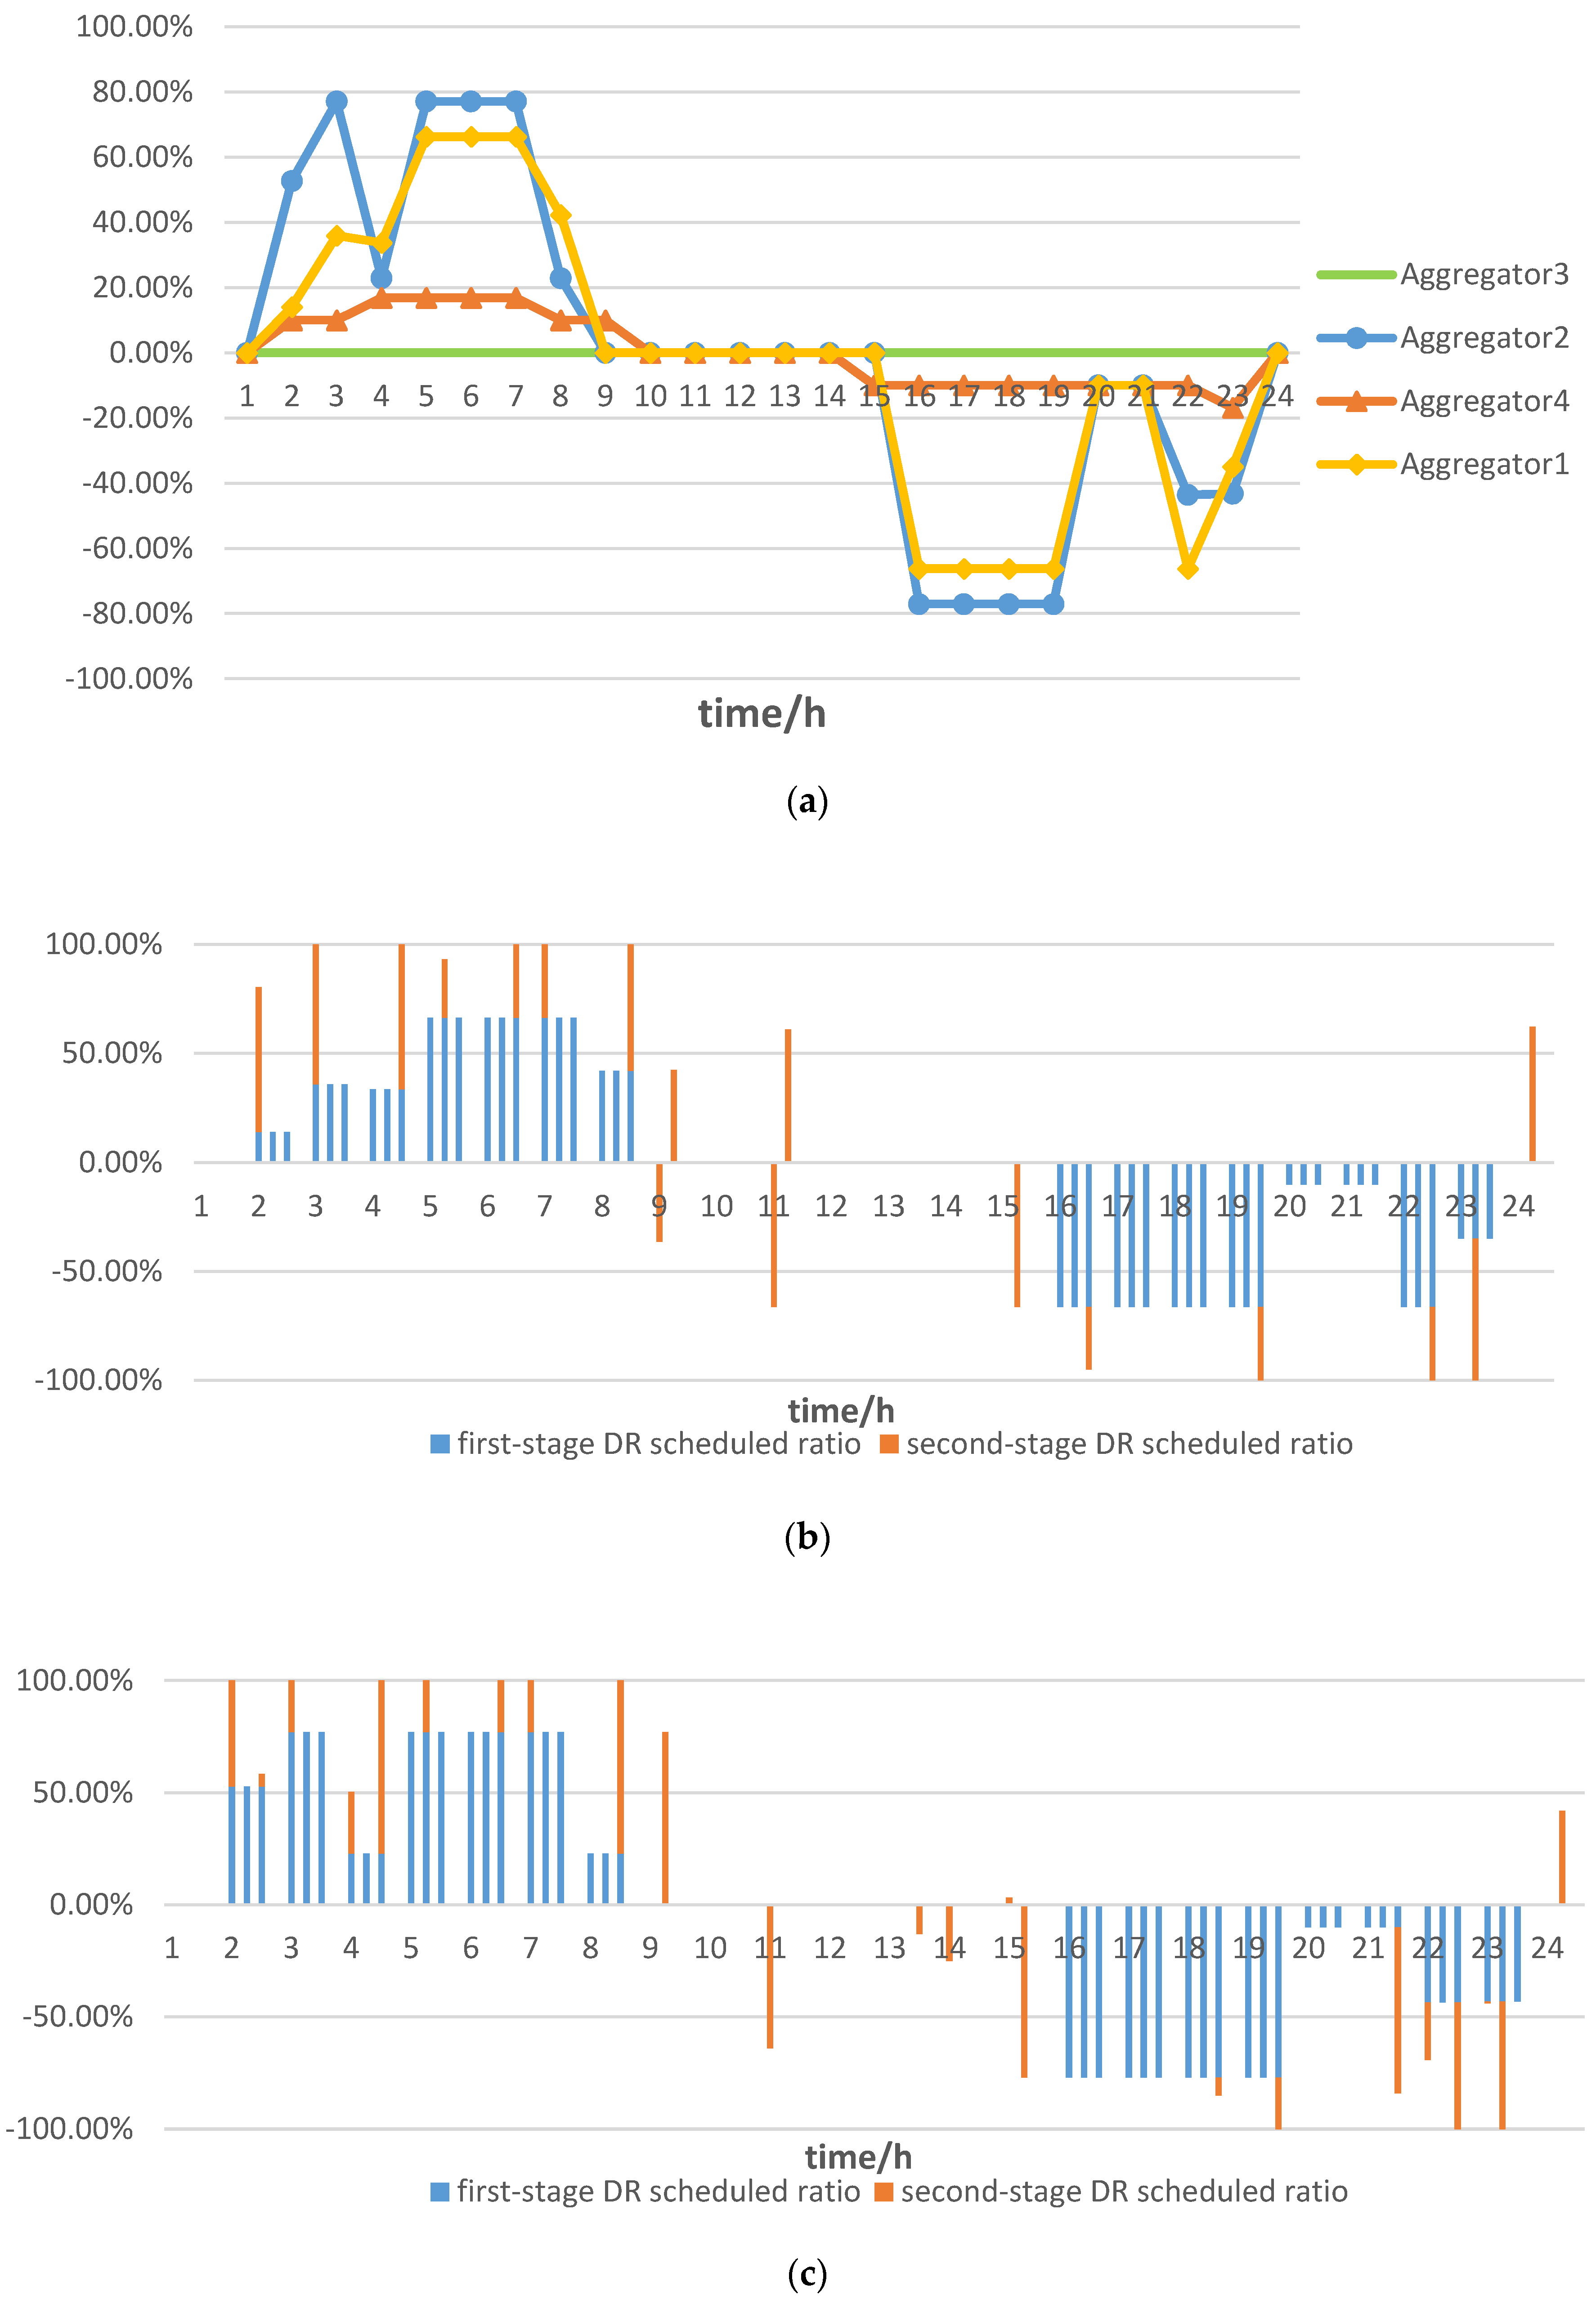
4.2.2. Results and Discussion
| DR Aggregators | First_s | Second_s1 | Second_s2 | Second_s3 |
|---|---|---|---|---|
| 1 | 8.75% | 2.08% | 2.08% | 2.41% |
| 2 | 10.83% | 0% | 0% | 0% |
| 3 | 15.42% | 2.08% | 3.07% | 6.25% |
| 4 | 66.67% | 0% | 0% | 0% |
| 5 | 4.17% | 4.17% | 4.17% | 8.33% |
5. Conclusions
- (1)
- The tight coupling characteristics of specific DR resources on available time and capacity are considered in the proposed stochastic model. Specifically, if sufficient incentives are paid to consumers, some DR resources can be scheduled both in the first stage as resources on a day-ahead basis to integrate the wind power with lower uncertainty and in the second stage as resources on an intra-day basis to integrate the wind power with higher uncertainty. Flexible DR scheduling can achieve the maximal DR values with the minimal cost, combining the cost advantage of DR on a day-ahead basis and the flexibility advantage of DR on an intra-day basis, which is beneficial with high wind power penetration.
- (2)
- The responsive cost rather than the characteristics of flexibility, including “minimum on-site time” and “minimum responsive capacity”, is the most critical factor, but “minimum onsite hours” plays a more important role when only the characteristic of flexibility is considered.
- (3)
- The first stage DR should be dispatched more frequently when transmission congestion is expected to occur.
Acknowledgments
Author Contributions
Conflicts of Interest
Nomenclature
Indices:
| n | Index for thermal units, n = 1–Ng |
| t | Index for time interval, t = 1–NT s: Index for scenarios, s = 1–Ns |
| d | Index for DR users, d = 1–Nd |
| i, j | Index for buses in the grid, i = 1–Nb, j = 1–Nb |
| Gi | Index for conventional units connected to ii |
| Di | Index for DR users connected to i. |
Parameters:
| Prs,ts | Probability of occurrence of scenario s in interval t |
| Windω,t,s | Power output, wind farm ω, in t, s (MW) |
| Windω | Capacity, wind farm ω (MW) |
| Bij | Line susceptance from bus i to j |
| Loadi,t | Forecast demand level without effect of demand response, in t, s (MW) |
| TRCij | Transmission limit from bus i to j (MW) |
| Pnmax | Maximum output when committed, unit n (MW) |
| Pnmin | Minimum output when committed, unit n (MW) |
| Rnup | Up-ramp limit, unit n, (MW/interval) |
| Rndown | Down-ramp limit, unit n, (MW/interval) |
Permissible real power adjustment, unit n (MW) | |
| MDn | Minimum off-site time, unit n, (interval) |
| MUn | Minimum on-site time, unit n, (interval) |
| MUn | Minimum on-site time, unit n, (interval) |
| DRdmin | Minimum demand change on a day-ahead basis, user d (MW) |
| DRdmax | Maximum demand change on a day-ahead basis, user d (MW) |
| MDTd | DR Minimum on-site time on a day-ahead basis, user d (interval) |
| Scn | Start-up costs, unit n |
| Ccd | DR capacity costs user d ($/MW) |
DR variable operating cost of increasing consumption on a day-ahead basis, user d ($/MWh) | |
DR variable operating cost of decreasing consumption on a day-ahead basis, user d ($/MWh) | |
DR variable operating cost of increasing consumption on an intra-day basis, user d ($/MWh) | |
DR variable operating cost of decreasing consumption on an intra-day basis, user d ($/MWh) | |
| Penaω | Wind curtailment cost, wind farm ω ($/MWh) |
| Penal | Load not served cost ($/MWh) |
Decision variables:
| un,t | Binary on/off variable, unit n, in t |
| pn,t,s | Generation (MW) unit n, in t, s |
| s_costn,t | Start-up costs ($), unit n, in t |
Voltage angle, bus i, in t, s | |
DR binary on/off variables, users d in t | |
DR capacity, (MW) user d | |
Demand level growth on a day-ahead basis, user d, in t (MW) | |
Demand level reduction on a day-ahead basis, user d, in t (MW) | |
Demand level growth on an intra-day basis, user d, in t, s (MW) | |
Demand level reduction on an intra-day basis, user d, in t, s (MW) | |
Wind power curtailment, wind farm connected to i, in t, s (MW) | |
Load not served at bus i, in t, s (MW) |
References
- Wang, B.; Hobbs, B.F. A flexible ramping product: Can it help real-time dispatch markets approach the stochastic dispatch ideal. Electr. Power Syst. Res. 2014, 109, 128–140. [Google Scholar] [CrossRef]
- Chong, C.; Ni, W.; Ma, L.; Liu, P.; Li, Z. The use of energy in Malaysia: Tracing energy flows from primary source to end use. Energies 2015, 8, 2828–2866. [Google Scholar] [CrossRef]
- Kiliccote, S.; Sporborg, P.; Sheik, I. Integrating Renewable Resources in California and the Role of Automated Integrating Renewable Resources in California and the Role of Automated Demand Response; Lawrence Berkeley National Laboratory: Berkeley, CA, USA, 2010. [Google Scholar]
- Li, F.; Wei, Y. A probability-driven multilayer framework for scheduling intermittent renewable energy. IEEE Trans. Sustain. Energy 2012, 3, 455–461. [Google Scholar] [CrossRef]
- Gu, W.; Yu, H.; Liu, W.; Zhu, J.; Xu, X. Demand response and economic dispatch of power systems considering large-scale plug-in hybrid electric vehicles/electric vehicles (PHEVs/EVs): A review. Energies 2013, 6, 4394–4417. [Google Scholar] [CrossRef]
- Dietrich, K.; Latorre, J.M.; Olmos, L. Demand response in an isolated system with high wind integration. IEEE Trans. Power Syst. 2012, 27, 20–29. [Google Scholar] [CrossRef]
- Sioshansi, R. Evaluating the impacts of real-time pricing on the cost and value of wind generation. IEEE Trans. Power Syst. 2010, 25, 741–748. [Google Scholar] [CrossRef]
- Javad, S.; Mohammad, H.J. Economic evaluation of demand response in power systems with high wind power penetration. J. Renew. Sustain. Energy 2014, 6, 1–17. [Google Scholar]
- Sioshansi, R.; Short, W. Evaluating the impacts of real-time pricing on the usage of wind generation. IEEE Trans. Power Syst. 2009, 24, 516–524. [Google Scholar] [CrossRef]
- Madaeni, S.H.; Sioshansi, R. Using demand response to improve the emission benefits of wind. IEEE Trans. Power Syst. 2013, 28, 1385–1394. [Google Scholar] [CrossRef]
- Amirhossein, K.; Mohsen, K. Optimal generation dispatch incorporating wind power and responsive loads: A chance-constrained framework. J. Renew. Sustain. Energy 2015, 7, 1–21. [Google Scholar]
- De Jonghe, C.; Hobbs, B.F.; Belmans, R. Value of demand response for wind integration in daily power generation scheduling: Unit commitment modeling with price responsive load. In Proceedings of the USAEE/IAEE North American Conference, Washington, DC, USA, 9–12 October 2011.
- Madaeni, S.H.; Sioshansi, R. The impacts of stochastic programming and demand response on wind integration. Energy Syst. 2013, 4, 109–124. [Google Scholar] [CrossRef]
- Bahreyni, S.A.H.; Khorsand, M.A.; Jadid, S. A stochastic unit commitment in power systems with high penetration of smart grid technologies. In Proceedings of the 2nd Iranian Conference on Smart Grids (ICSG), Tehran, Iran, 15–17 May 2012.
- Falsafi, H.; Zakariazadeh, A.; Jadid, S. The role of demand response in single and multi-objective wind-thermal generation scheduling: A stochastic programming. Energy 2014, 64, 853–867. [Google Scholar] [CrossRef]
- Torres, D.; Crichigno, J.; Padilla, G.; Rivera, R. Scheduling coupled photovoltaic, battery and conventional energy sources to maximize profit using linear programming. Renew. Energy 2014, 72, 284–290. [Google Scholar] [CrossRef]
- Parvania, M.; Fotuhi-Firuzabad, M. Demand response scheduling by stochastic SCUC. IEEE Trans. Smart Grid 2010, 1, 89–98. [Google Scholar] [CrossRef]
- Wang, J.; Botterud, A.; Miranda, V.; Monteiro, C.; Sheble, G. Impact of wind power forecasting on unit commitment and dispatch. In Proceedings of the 8th International Workshop Large-Scale Integration of Wind Power into Power Systems, Bremen, Germany, 14–15 October 2009.
- Gyamfi, S.; Krumdieck, S.; Urmee, T. Residential peak electricity demand response-highlights of some behavioural issues. Renew. Sustain. Energy Rev. 2013, 25, 71–77. [Google Scholar] [CrossRef]
- Benefits of Demand Response in Electricity Markets and Recommendations for Achieving Them: A Report to the United States Congress Pursuant to Section 1252 of the Energy Policy Act of 2005; Department of Energy: Washington, DC, USA, 2006.
- Lei, W.; Shahidehpour, M.; Li, Z. Comparison of scenario-based and interval optimization approaches to stochastic SCUC. IEEE Trans. Power Syst. 2012, 27, 913–921. [Google Scholar]
- Wang, J.; Shahidehpour, M.; Li, Z. Security-constrained unit commitment with volatile wind power generation. IEEE Trans. Power Syst. 2008, 23, 1319–1327. [Google Scholar] [CrossRef]
- Yuan, Y.; Chung, S. Dispatch of direct load control using dynamic programming. IEEE Trans. Power Syst. 1991, 6, 1056–1061. [Google Scholar] [CrossRef]
- Strbac, G. Demand side management: Benefits and challenges. Energy Policy 2008, 36, 4419–4426. [Google Scholar] [CrossRef]
- Pennsylvania-New Jersey-Maryland (PJM). PJM Training Materials (LMP101). Available online: http://www.pjm.com/Globals/Training/Courses/ip-lmp-ftr-101.aspx/ (accessed on 26 November 2015).
- University of Washington. Power System Test Case Archive. Available online: http://www.ee.washington.edu/research/pstca/ (accessed on 25 November 2015).
- Energy, G. Western Wind and Solar Integration Study; National Renewable Energy Laboratory (NREL): Golden, CO, USA, 2010. [Google Scholar]
- Gröwe-Kuska, N.; Heitsch, H.; Römisch, W. Scenario reduction and scenario tree construction for power management problems. In Proceedings of the 2003 IEEE Bologna PowerTech Conference, Bologna, Italy, 23–26 June 2003.
- Ma, X.; Sun, Y.; Fang, H. Scenario generation of wind power based on statistical uncertainty and variability. IEEE Trans. Sustain. Energy 2013, 4, 894–904. [Google Scholar] [CrossRef]
- Koc, A.; Ghosh, S. Optimal scenario tree reductions for the stochastic unit commitment problem. In Proceedings of the 2012 Winter Simulation Conference (WSC), Berlin, Germany, 9–12 December 2012; pp. 1–12.
- Sumaili, J.; Keko, H.; Miranda, V. Finding representative wind power scenarios and their probabilities for stochastic models. In Proceedings of the 2011 16th International Conference on Intelligent System Application to Power Systems (ISAP), Hersonissos, Greece, 25–28 September 2011; pp. 1–6.
- Barth, R. Deliverable D6.2 (b)—Documentation Methodology of the Scenario Tree Tool, Institute of Energy Economics and the Rational Use of Energy (IER); University of Stuttgart: Stuttgart, Germany, 2006. [Google Scholar]
- Wang, B.; Dennice, F.G.; Liu, X.; Yuan, C. Optimal siting and sizing of demand response in a transmission constrained system with high wind penetration. Int. J. Electr. Power Energy Syst. 2015, 68, 71–80. [Google Scholar] [CrossRef]
- Papavasiliou, A.; Oren, S. A stochastic unit commitment model for integrating renewable supply and demand response. In Proceedings of the IEEE Power and Energy Society General Meeting 2012, San Diego, CA, USA, 2012; pp. 1–6.
- Gayme, D.; Topcu, U. Optimal power flow with large-scale storage integration. IEEE Trans. Power Syst. 2013, 28, 709–717. [Google Scholar] [CrossRef]
- Energy, G.E. Western Wind and Solar Integration Study. Subcontract Technical Representative Report NREL/SR-550–47434. 2010. Available online: http://www.osti.gov/bridge/ (accessed on 12 December 2014). [Google Scholar]
- Papavasiliou, A. Coupling Renewable Energy Supply with Deferrable Demand; University of California: Berkeley, CA, USA, 2011. [Google Scholar]
- Dvorkin, Y.; Pandzic, H.; Ortega-Vazquez, M. A hybrid stochastic/interval approach to transmission-constrained unit commitment. IEEE Trans. Power Syst. 2015, 30, 621–631. [Google Scholar] [CrossRef]
- Hamidi, V.; Li, F.; Yao, L. Value of wind power at different locations in the grid. IEEE Trans. Power Deliv. 2011, 26, 526–537. [Google Scholar] [CrossRef]
© 2015 by the authors; licensee MDPI, Basel, Switzerland. This article is an open access article distributed under the terms and conditions of the Creative Commons by Attribution (CC-BY) license (http://creativecommons.org/licenses/by/4.0/).
Share and Cite
Wang, B.; Liu, X.; Zhu, F.; Hu, X.; Ji, W.; Yang, S.; Wang, K.; Feng, S. Unit Commitment Model Considering Flexible Scheduling of Demand Response for High Wind Integration. Energies 2015, 8, 13688-13709. https://doi.org/10.3390/en81212390
Wang B, Liu X, Zhu F, Hu X, Ji W, Yang S, Wang K, Feng S. Unit Commitment Model Considering Flexible Scheduling of Demand Response for High Wind Integration. Energies. 2015; 8(12):13688-13709. https://doi.org/10.3390/en81212390
Chicago/Turabian StyleWang, Beibei, Xiaocong Liu, Feng Zhu, Xiaoqing Hu, Wenlu Ji, Shengchun Yang, Ke Wang, and Shuhai Feng. 2015. "Unit Commitment Model Considering Flexible Scheduling of Demand Response for High Wind Integration" Energies 8, no. 12: 13688-13709. https://doi.org/10.3390/en81212390
APA StyleWang, B., Liu, X., Zhu, F., Hu, X., Ji, W., Yang, S., Wang, K., & Feng, S. (2015). Unit Commitment Model Considering Flexible Scheduling of Demand Response for High Wind Integration. Energies, 8(12), 13688-13709. https://doi.org/10.3390/en81212390