Article

An Assessment of Direct on-Farm Energy Use for High Value Grain Crops Grown under Different Farming Practices in Australia

Institute for Agriculture and the Environment, University of Southern Queensland, Toowoomba, Queensland 4350, Australia
*
Author to whom correspondence should be addressed.
Energies 2015, 8(11), 13033-13046; https://doi.org/10.3390/en81112353
Submission received: 21 October 2015 / Revised: 10 November 2015 / Accepted: 11 November 2015 / Published: 17 November 2015
(This article belongs to the Special Issue Energy for Agriculture)

Abstract

:
Several studies have quantified the energy consumption associated with crop production in various countries. However, these studies have not compared the energy consumption from a broad range of farming practices currently in practice, such as zero tillage, conventional tillage and irrigated farming systems. This study examines direct on-farm energy use for high value grain crops grown under different farming practices in Australia. Grain farming processes are identified and “typical” farming operation data are collected from several sources, including published and unpublished literature, as well as expert interviews. The direct on-farm energy uses are assessed for 27 scenarios, including three high value grain crops―wheat, barley and sorghum―for three regions (Northern, Southern and Western Australia) under three farming conditions with both dryland (both for conventional and zero-tillage) and irrigated conditions. It is found that energy requirement for farming operations is directly related to the intensity and frequency of farming operations, which in turn is related to tillage practices, soil types, irrigation systems, local climate, and crop types. Among the three studied regions, Western Australia requires less direct on-farm energy for each crop, mainly due to the easily workable sandy soils and adoption of zero tillage systems. In irrigated crops, irrigation energy remains a major contributor to the total on-farm energy demand, accounting for up to 85% of total energy use.

Graphical Abstract

1. Introduction

Despite several efforts, from 2000 to 2010, global greenhouse gas (GHG) emissions grew more quickly (2.2%/year) during that period than in each of the three previous decades (1.3%/year) and reached 49 Gt CO2e/year in 2010 [1]. Development of new infrastructure in rapidly developing countries, especially in transition countries such as India and China, accounts for much of the increase [2]. This trajectory shows that the avoidance of two degrees of warming proposed by the United Nations Framework Convention on Climate Change (UNFCCC) at Cancun is problematic to reach. In order to meet the two degrees target, the current de-carbonization rate of 1.2%/year needs to be increased to 6.2%/year, every year from now till 2100 [3]. If we stick with current trajectory we will end up at four degrees increase by the end of 2100 [3]. When climate change policy was being developed in the 1990s, developing countries accounted for only 40% of global emissions and this increased to 54.3% in 2004 and is expected to increase to 66% by 2030 [4]. Therefore, every country, whether developed or developing, needs to share emissions reduction responsibility [5].
As a developed country and a major party of UNFCCC, Australia has a significant responsibility for emissions reduction. Currently, Australia shares 1.18% of global GHG emissions, 1.21% of global GDP and 0.33% of the global population [6]. From 2008 to 2013, Australia reduced its annual average carbon intensity by 4.6% [3], and in fact, this was the world record. This was achieved mainly by structural changes, new technologies, fuel switching and improvements in energy efficiency [7]. However, as noted, this is not enough yet.
Globally, agriculture is one of the major sources of energy consumption and therefore GHG emissions. With more intensive and modernized farming systems, during the period 1990–2005, global GHG emissions from agriculture increased by 14%, at an annual rate of 49 Mt CO2e/year [8]. In 2010, GHG emissions from agriculture are estimated to be 5.6 Gt CO2e/year to 6.4 Gt CO2e/year [9,10,11], i.e., about 11.4% to 13.1% of global emissions. If the production of agricultural inputs and various downstream activities are considered, the agricultural sector contributes a further 3% to 6% of global emissions [12].
Australia is one of the largest GHG emitting countries from the agriculture sector in the world. Its agricultural sector accounts for 15% of national GHG emissions and is the second largest source of emissions [13]. This proportion is significantly higher than those in Central and Eastern Europe, the former Soviet Union and the USA [14]. In order to reduce GHG emissions from the agricultural sector, the previous Australian Government implemented Carbon Farming Initiatives (CFIs). The current Government replaced it with the Direct Action Plan called “Emission Reduction Fund (ERF)” and allocated A$2.55 billion to establish the Fund in the 2014–2015 budgets [15]. ERF allows farmers and other land managers to earn carbon credits by storing carbon or reducing GHG emissions on land. This would allow them to adopt some best management practices and earn carbon credits and reputational benefits at the same time.
The uptake of ERF is likely to be good. As of 31 August 2015, 390 projects are registered and 16.3 million Australian Carbon Credit Units (ACCUs) have been issued to these projects [16]. Australia has set 5% unconditional emission reduction targets for 2020 from 2000 levels, and with this initiative agriculture is expected to meet this target [16]. So far, the majority of the registered projects under the ERF are from sequestration projects, mainly from forestry activities. However, the grain industry in Australia could have a good opportunity in reducing energy consumption and thereby GHG emissions. However, due to limited research the grain industry is not able to target where they have an opportunity to increase energy efficiency and participate in the ERF. This study aims to examine and compare on-farm energy use for three high value grain crops grown under three major farming practices in three agro-ecological zones in Australia. This will help farmers to understand the range of energy uses and also to pinpoint where their energy use is highest and the potential savings achievable.
Several studies have quantified the energy consumption associated with crop production in various countries including: (1) sugar beet production in the UK [17]; (2) arable and outdoor vegetable production in New Zealand [18]; (3) field crops (wheat, cotton, maize, sesame) and vegetables (tomato, melon, watermelon) [19], tomato [20], sugar beet [21], stake-tomato [22] and grape production [23] in Turkey; (4) wheat production in India [24]; and cotton and lucerne production in Australia [25,26,27]. However, these studies have not compared the energy consumption from a broad range of farming practices currently in practice such as zero tillage, conventional tillage and irrigated farming systems. This paper is the first in this direction.
In this study, direct energy used for various on-farm operations such as tillage, fertiliser application, boom spraying, planting, aerial spraying and water pumping is considered. A large amount of indirect energy is also required for: (1) the production, packaging, storing and transportation of various farm inputs such as fertilisers, chemicals (herbicides, insecticides, fungicides and plant regulator), fuels and farm machineries; and (2) post-harvesting operations such as transportation and drying of harvested products. However, energy used for these operations are not considered in this study. Similarly, human energy is also required for on-farm operation but it is insignificant as the production system in Australia is highly mechanised. Therefore, human energy is also not considered in this study.

2. A Brief Snapshot of the Grain Industry in Australia and Rationale for Selecting Three Farming Practices

The grain industry in Australia operates in all states and makes a major contribution to the state and national economies. Australia produced over 48.5 million tonnes of grain in 2011–2012. However, in 2012–2013, grain production in Australia fell to 38.7 million tonnes [27]. Reduced grain production was a result of increased climatic variability, and decreased production area largely due to rising input prices—including those for energy—and volatility of grain prices [28].
The grain industry in Australia is broadly divided into three agro-ecological regions: (1) the Southern Region that covers south-eastern Australia, including central and southern New South Wales, Victoria, Tasmania, and south-eastern South Australia. Soils in this area are generally poor (low fertility) with many subsoil constraints, such as salinity, sodicity and toxic levels of some elements; (2) the Northern Region which covers Queensland and northern New South Wales. This region has relatively good soils, but relatively high seasonal rainfall variability and therefore production; and (3) the Western Region which covers Western Australia. This region has poor soils and crop yields largely depend on the winter and spring rainfall [28].
Due to large geographical dispersion, there is a wide range of climatic conditions within each region. In general, rainfall decreases from north to south and from coastal to inland areas. Northern Region has a tropical and subtropical climate, whereas the Southern Region has a temperate climate and the Western Region has a Mediterranean climate.
Depending on the availability and price of water for irrigation, grains in these regions are produced either on irrigated or dryland “rain-fed” conditions. Overall, grain growers are increasingly moving from conventional tillage systems to reduced or zero tillage systems because: (1) continuing cultivation systems result in a loss of soil carbon, and about 75% of Australian agricultural lands have less than 1% soil organic carbon [29]. For example, over a 60 year period, cereal cropping soils of Northern New South Wales and Southern Queensland have lost over 40 t C/ha (146.7 t CO2e) and 4 t N/ha [30]; (2) the loss of soil carbon adversely affects soil fertility, the soil water holding capacity and plant-available water capacity [31]; and (3) continuous cultivation systems leave soils vulnerable to water and wind erosion, increasing agricultural runoff, degrading soil productivity and releasing GHG by disturbing soils and burning fossil fuels for farm machinery [32,33].
On the other hand, the zero tillage practice reverses these processes by minimizing mechanical soil disturbance, providing permanent soil cover by organic materials and diversifying crop species grown in sequence and/or association [33]. Zero tillage also has adaptation benefits. Soils under zero tillage can hold more moisture and therefore under drought conditions the crops are more resilient and produce more [34]. Therefore, state agriculture departments, regional natural resources management organisations, and local landholder groups generally recommend that farmers move from traditional dryland farming systems to reduced tillage systems and where appropriate towards a zero tillage system [35]. This system is also an eligible activity through the Australian Government ERF, and participating landholders may claim a refundable tax offset of 15% of the purchase price of an eligible no-till seeder. It is likely that a higher proportion of grain production in dryland area will be grown under zero till practices in the future [
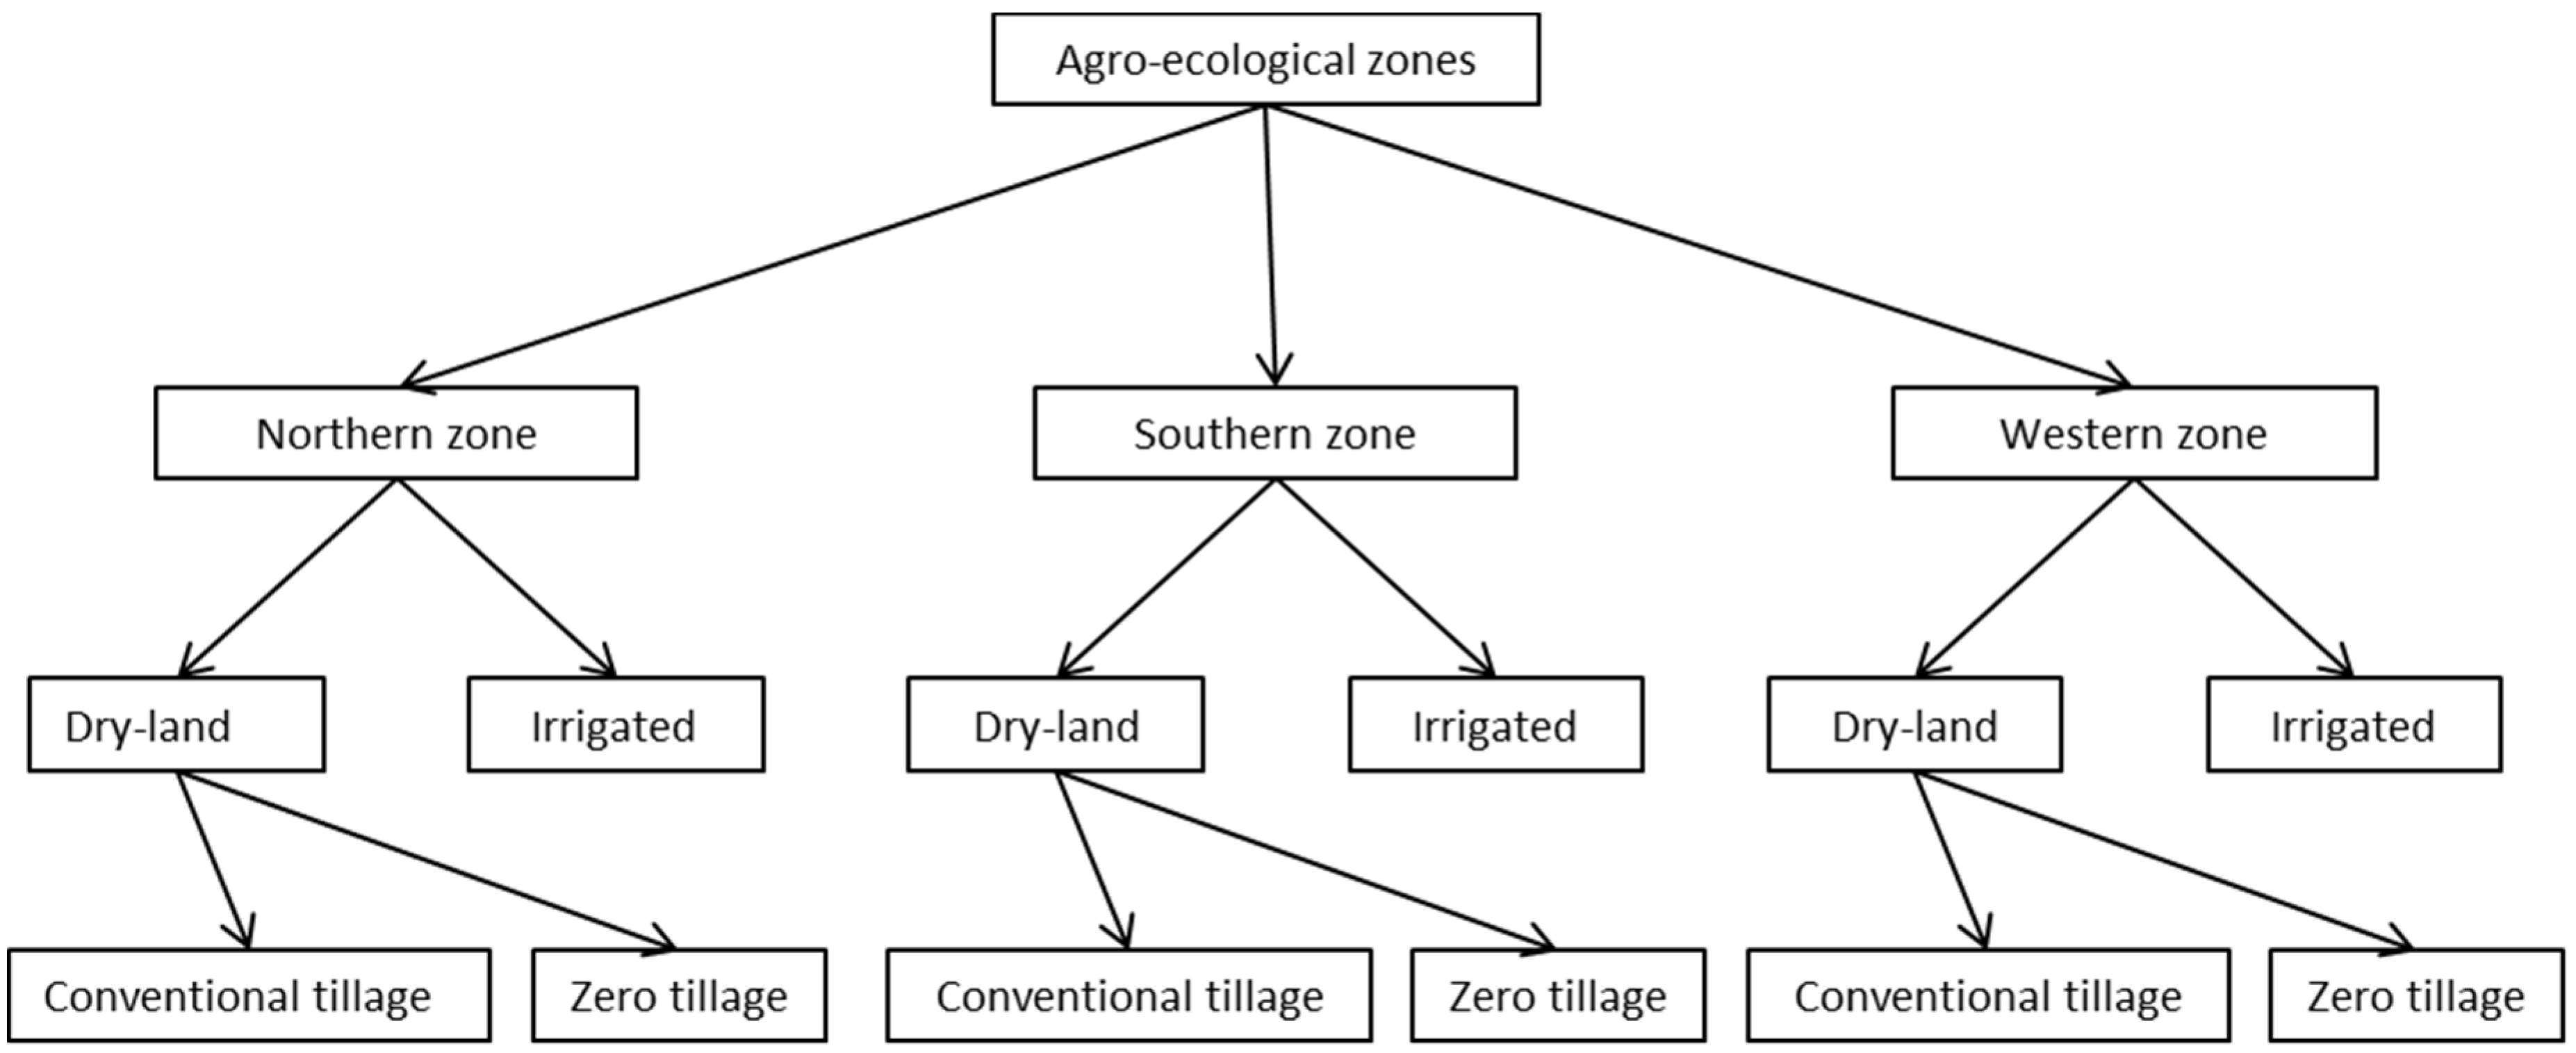
36]. Therefore, this study aims to examine and compare direct on-farm energy use for all three agro-ecological regions, under both irrigated and dry-land conditions and under dry-land both for conventional and zero-tillage systems (Figure 1).
Now a question may arise why irrigated farming systems are not divided into two categories as in the dry-land farming system. As noted, zero tillage has been largely practiced with rain-fed (dryland) crops as farmers are increasingly realising its value for soil moisture conservation [37]. A global meta-analysis shows that zero tillage performs best under rain-fed conditions in dry climates, either matching or exceeding conventional tillage yields for crops, whereas crop yields declined in irrigated conditions [38]. However, in recent years there are some practices of zero tillage in irrigated crops but they are not common and also the data are not available [36,39]. Therefore, in this study, irrigated condition is not divided into different categories.
Figure 1. Showing different farming practices in the three agro-ecological regions in Australia.
Energies 08 12353 g001

3. Methodology

3.1. Selection of Three High Value Grain Crops

As noted, this study focuses on three high value grain crops. In order to determine the high value grain crops, grains yield data for various years, and the prices of these grain crops in seven different time periods (April–June 2012; July–September 2012; October–December 2012; January–March 2013; April–June 2013; July–September 2013; and October–December 2013) were taken from the Australian Bureau of Agricultural and Resource Economics [40]. From these data the five-year average yields and domestic average prices of seven periods were calculated and total values of the grains were estimated (Table 1).
Table 1. Total value of different grain and oilseed crops.
CropsFive-year Average to 2012–2013Average Domestic Price of 7 Periods * (A$/Tonne)Total Value (Million A$)
Area Planted (in 1000 Ha)Yield (Tonne/Ha)Total Production in Kilo-Tonne
Winter crops
Wheat13,5181.8224,6062927185 **
Barley40921.9679092672112 **
Canola22261.2027095481485
Chickpeas4901.22586521305
Faba beans1541.68264NANA
Field peas2861.16330366121
Lentils1551.29212NANA
Lupins6331.19756NANA
Oats7951.481165229267
Summer crops
Grain sorghum6303.272076279579 **
Corn (maize)675.94401339136
Sunflower371.284652324
Note: NA is not available. Production figures could be slightly different to the “product of yield and area planted” figures due to rounding up. * Seven period are: April–June 2012; July–September 2012; October–December 2012; January–March 2013; April–June 2013; July–September 2013; and October–December 2013. ** Selected high value grain crops.
The top three high value grain crops were wheat, barley and canola. However, canola is used for oil and therefore the fourth highest value crop “grain sorghum” is considered instead. Two of the selected grain crops are winter crops (wheat and barley) and the third one is a summer crop (grain sorghum).

3.2. Data Collection

Compared to other parts of the world (such as USA, Iran, UK, New Zealand) on-farm energy use data are scarce in Australia. In contrast, carbon footprint data are available for wheat in WA, Victoria and NSW. However, as we are concerned only on on-farm energy use data, these data are of little use.
In this research, a bottom-up approach is taken to estimate the energy uses. Grain farming processes were first identified through literature review and discussed with the relevant experts (see the Acknowledgments). “Typical” farming operation data were then collected from published and unpublished literature for all three grain zones (Northern, Southern and Western) and for three different tillage types (irrigated, dryland-zero tillage and dryland-conventional tillage). Where such data were not available, relevant government organisations and experts were approached and consulted to fill the data gaps. A summary of these field operation data are provided in Table 2, Table 3 and Table 4, which represent the typical farming systems and practices in these areas. These data were used to calculate the on-farm fuel and energy use later. The footnotes in these three tables provide the details about the experts who provided data for the analysis. As these people are renowned experts in the given areas, it was believed that the acquired data are of high quality. However, they should be applied to the given farming conditions and cannot be generalised.
In the Northern Grain region, wheat under conventional tillage system has the highest amount of secondary tillage, followed by barley under the same tillage system. As expected, all crops under zero tillage have lower farming activities than their counterparts in conventional and irrigated systems. However, where irrigation related activities are included, irrigated crops have a higher energy demand than others. In both Northern and Southern Grain Regions (Table 2 and Table 3), it is noted that: (1) surface/furrow irrigation is the dominant irrigation system. However, barley in the Northern Grain Region often uses pressured irrigation; and (2) sorghum needs greater irrigation than the two other crops (wheat and barley). In general, wheat and barley need 2.5 ML of water per hectare whereas sorghum needs 2.93 ML to 7.5 ML per hectare, depending on the soil type and climatic conditions (Table 2 and Table 3). In the case of Western Australia (Western Grain Region), about 90% of grain is produced using zero-till systems. There are neither irrigated grain crops nor dryland sorghum crops. Thus, irrigation is not assumed to take place in Western Australia (Table 4).
Table 2. On-farm operation data for three high value grain crops in Northern Grain Region (example from Darling Downs region).
Farming OperationDiesel (L Per Ha Per Operation)Number of Times for Dry Land (Conventional Tillage)Number of Times for Dry Land (Zero Tillage)Number of Times for Irrigated Land
WheatBarleySorghumWheatBarleySorghumWheatBarleySorghum
Primary tillage18110000011
Secondary tillage8321000000
Fertiliser application51001 1110
Boom spraying2.25121663520
Planting5111111111
Aerial spray3100110102
Harvesting (diesel L/ha) 6.68.18.06.68.18.012.912.911.5
Type of irrigation and amount of water used2.5 ML (furrow)2.5 ML (side roll)2.93 ML (furrow)
Note: Sorghum data are taken from Mr Gary Sandell, Research Engineer, National Centre for Engineering in Agriculture, University of Southern Queensland; all other data are taken from Maraseni and Cockfield [36,39].
Table 3. On-farm operation data for high value grain crops in Southern Grain Region (example from Victoria).
Farming OperationDiesel (L Per Ha Per Operation)Number of Times for Dry Land (Conventional Tillage)Number of Times for Dry Land (Zero Tillage)Number of Times for Irrigated Land
WheatBarleySorghumWheatBarleySorghumWheatBarleySorghum
Primary tillage18110000000
Secondary tillage80–3 (1.5)0–3 (1.5)0000000
Fertiliser application5110000000
Boom spraying2.251110–5 (2.5)0–5 (2.5)20–5 (2.5)0–5 (2.5)0
Planting 5111111111
Aerial spray3000002000
Harvesting (diesel L/ha) * 6.68.18.06.68.18.012.912.911.5
Type of irrigation and amount of water used **2.5 ML(surface)2.5 ML (surface)7.5 ML (surface)
Note: Source: * Amount of diesel used for each operation was taken from Maraseni and Cockfield [36,39]. Number of times of different farming operation for dry land (zero till) sorghum was taken from Mr Gary Sandell (Research Engineer, National Centre for Engineering in Agriculture, University of Southern Queensland). This value is for a typical farm in Tamworth. The rest of the data was taken from Darryl Pearl (Project Officer, Productive Soils (Mallee/Wimmera), Rural Recovery Coordinator Mallee, FSV Grains Agriculture Productivity, Department of Environment and Primary Industries, Victoria). The numbers in the brackets are average of given values and they are used for further analysis. ** The amounts of irrigation water for irrigated crops were taken from DPI Victoria [41]. Most of the irrigation in Victoria is surface irrigation (pers comm with Dr S Mushtaq, Deputy Director, International Centre for Applied Climate Sciences, University of Southern Queensland).
Table 4. On-farm operation data for high value grain crops in Western Grain Region (Western Australia).
Farming OperationDiesel (L Per Ha Per Operation)Number of Times for Dry Land (Conventional Tillage)Number of Times for Dry Land (Zero Tillage)Number of Times for Irrigated Land
WheatBarleySorghumWheatBarleySorghumWheatBarleySorghum
Primary tillage511NA00NANANANA
Secondary tillage000NA00NANANANA
Fertiliser application000NA00NANANANA
Boom spraying0.533NA33NANANANA
Planting411NA11NANANANA
Aerial sprayNANANANANANANANANANA
Harvesting (diesel L/ha) 55NA55NANANANA
Type of irrigation and amount of water usedNANANA
Note: Source: Glen Riethmuller, Development Officer, Department of Agriculture and Food, Western Australia, Dryland Research Institute, WA.

3.3. Energy Conversion Factors

In all farming operations diesel is used, for which energy conversion factor of 38.6 GJ/kL is used [42]. Similarly, diesel water pumps are common in both Northern and Southern Grain Regions. About 60 MJ of energy is used for per ML water pumped per meter total dynamic head. This means about 0.5 GJ of energy will be used for each megalitre of water under surface irrigation. This value for side roll irrigation is 0.775 GJ/ML [43]. Therefore, energy conversion factors of 0.5 GJ/ML and 0.775 GJ/ML are used for surface irrigation and side roll irrigation systems, respectively.

4. Results and Discussion

4.1. Fuel Consumption

Table 5, Table 6 and Table 7 present the fuel (diesel) consumption data for three grain crops in Northern, Southern and Western Grain Regions, respectively.
Table 5. Fuel (diesel, L/ha) consumption (except irrigation fuel) for three high value grain crops in Northern Grain Region (From Darling Downs region).
Farming 0perationFuel Consumption (L/ha) for Dry Land (Conventional Tillage)Fuel Consumption (L/ha) for Dry Land (Zero Tillage)Fuel Consumption (L/Ha) for Irrigated Land
WheatBarleySorghumWheatBarleySorghumWheatBarleySorghum
Primary tillage1818000001818
Secondary tillage24168000000
Fertiliser application500505550
Boom spraying2.254.52.2513.513.56.7511.254.50
Planting555555555
Aerial spray300330306
Harvest 6.68.186.68.1812.912.911.5
Total diesel (L/ha)63.8551.623.2533.129.624.7537.1545.440.5
Table 6. Fuel (diesel, L/ha) consumption (except irrigation fuel) for three high value grain crops in Southern Grain Region (From Victoria).
Farming OperationFuel Consumption (L/ha) for Dry Land (Conventional Tillage)Fuel Consumption (L/ha) for Dry Land (Zero Tillage)Fuel Consumption (L/Ha) for Irrigated Land
WheatBarleySorghumWheatBarleySorghumWheatBarleySorghum
Primary tillage18.0018.000.000.000.000.000.000.000.00
Secondary tillage12.0012.000.000.000.000.000.000.000.00
Fertiliser application5.005.000.000.000.000.000.000.000.00
Boom spraying2.252.252.255.635.634.505.635.630.00
Planting5.005.005.005.005.005.005.005.005.00
Aerial spray0.000.000.000.000.006.000.000.000.00
Harvest 6.608.108.006.608.108.0012.9012.9011.50
Total diesel (L/ha)48.8550.3515.2517.2318.7323.5023.5323.5316.50
Table 7. Fuel (diesel, L/ha) consumption (except irrigation fuel) for three high value grain crops in Western Grain Region.
Farming OperationFuel Consumption (L/ha) for Dry Land (Conventional Tillage)Fuel Consumption (L/ha) for Dry Land (Zero Tillage)Fuel Consumption (L/Ha) for Irrigated Land
WheatBarleySorghumWheatBarleySorghumWheatBarleySorghum
Primary tillage5.005.00NA0.000.00NANANANA
Secondary tillage0.000.00NA0.000.00NANANANA
Fertiliser application0.000.00NA0.000.00NANANANA
Boom spraying1.501.50NA1.501.50NANANANA
Planting4.004.00NA4.004.00NANANANA
Aerial spray0.000.00NA0.000.00NANANANA
Harvest 5.005.00NA5.005.00NANANANA
Total diesel (L/ha)15.5015.50NA10.5010.50NANANANA
The highest amounts of diesel for farming operations (other than the diesel for irrigation) were required by the wheat and barley farming systems (both under conventional tillage system in the Northern Grain Region), followed by the same crops under a similar tillage system in the Southern Grain Region. Western Region grains required the least amount of diesel. This is mainly due to prevalence of sandy soils and thereby the lower number of farming activities, as sandy soils have large mineral or solid particles and therefore they have more extensive air between the particles. As a result, they are loose and easier to cultivate. For example, on average a primary tillage in Northern and Southern Australian soils requires 18 L of diesel whereas 5 L diesel is enough for the same tillage in the sandy soil in Western Australia.
By getting the average of all three regions, it can be found (Table 5) that wheat (42.7 L/ha) and barley (39.2 L/ha) under the conventional tillage system required the highest amounts of diesel, followed by barley (34.5 L/ha), wheat (30.3 L/ha) and sorghum (28.5 L/ha) under the irrigated farming system. As expected, crops under the zero tillage required the least amount of on-farm diesel usage among the other crops. This finding is in agreement with some other studies [44,45].

4.2. Energy Consumption

Figure 2 and Figure 3 and Table 8 present energy consumption data for three grain crops in Northern, Southern and Western Grain Regions. It can be seen that energy consumption from diesel for farming operations (except for irrigation-related diesel) follows similar patterns as diesel consumption. In both Northern and Southern Grain Regions, crops under the zero tillage system required less on-farm energy inputs than the conventional and irrigated systems. In all cultivation types, crops grown in Western Australian region require the smallest amount of energy when compared to their counterparts in other regions, as zero tillage systems are practiced.
This finding is in agreement with the results of Baillie [46] and Maraseni and Cockfield [36]. Baillie [46] compared energy use from three scenarios on Keytah (irrigated cotton and grains farming operation west of Moree in Northern NSW) and found that reduced and zero tillage operations could result in 12% and 24% energy savings, respectively. Similarly, Maraseni and Cockfield [36] conducted research in the Darling Downs District and reported that the fossil fuel-related emissions from wheat, durum, barley and chickpea cultivation under a zero tillage system is much lower than that of other cultivation systems.
Figure 2. Energy consumption (GJ/ha) for three high value grain crops in Northern Grain Region.
Energies 08 12353 g002
Figure 3. Energy consumption (GJ/ha) for three high value grain crops in Southern Grain Region.
Energies 08 12353 g003
Table 8. Energy consumption (GJ/ha) for three high value grain crops in Western Grain Region.
Farming OperationFuel Consumption (L/ha) for Dry Land (Conventional Tillage)Fuel Consumption (L/ha) for Dry Land (Zero Tillage)Fuel Consumption (L/Ha) for Irrigated Land
WheatBarleySorghumWheatBarleySorghumWheatBarleySorghum
Farming operation energy0.600.60NA0.410.41NANANANA
Note: Farming operation energy and total energy is same as there is no irrigation energy in Western Region.
It can be seen from Figure 2 and Figure 3 that when irrigation is practiced, it required the highest amounts of diesel fuel energy for all three crops. Australia wide, the highest amount of energy was required for sorghum crops (4.4 GJ/ha) grown under irrigated systems in the Southern Grain Region, followed by barley (3.7 GJ/ha) and sorghum (3.0 GJ/ha) grown under irrigated systems in the Northern Grain Region. Irrigation-related energy also accounted for a higher proportion of total on-farm direct energy use for all grains in Southern Grain Region than that of their counterparts in the Northern Grain Region.
In both the Southern and Northern Regions, both wheat and barley required the same amount of irrigation water (2.5 ML/ha), but sorghum required a higher amount of irrigation water, especially in the Southern Grain Region (7.5 ML/ha). The most common irrigation system in both regions was surface irrigation. However, pressured irrigation was the most common irrigation system for barley in the Northern Grain Region. Because a pressured irrigation system requires a higher amount of energy than surface irrigation systems, barley in the Northern Grain Region thus consumed higher amounts of energy than wheat and barley in the Southern Grain Region. Therefore, sorghum in Southern Grain Region required the highest amount of irrigation related energy (3.8 GJ/ha), followed by barley in the Northern Grain Region (1.9 GJ/ha).

4.3. How Our Results Compare with Other Studies

Recent international literature on energy use by the arable cropping industry is relatively limited. Pellizzi et al. [47] found that in Europe, for wheat-like cereals, about 2.5–4.3 GJ/ha of direct energy is used. Similarly, Safa et al. [48] found that about 6.5 GJ/ha and 3.2 GJ/ha of direct energy (fuel and electricity) is used for irrigated and dryland wheat crops in New Zealand, respectively. Pellizzi et al.’s estimate is similar to our results from dryland and irrigated farming systems in the Northern Grain Region. However, New Zealand estimates are higher than our results, especially in case of the irrigated wheat cropping system. This is mainly due to use of energy-intensive irrigation systems (i.e., gun, centre pivot and rotary rainers) in New Zealand, whereas in our case it was gravity-fed surface and furrow irrigation systems.
Back in Australia, direct energy use for the production of wheat and barley was investigated by Khan et al. [49], based on the farm survey data in Coleambally Irrigation Areas (CIA) and Murrumbidgee Irrigation Area (MIA) of New South Wales. Their estimates (5.8 GJ/ha for wheat and 5.7 GJ/ha for barley) are slightly higher than our estimates, mainly due to use of energy-intensive pressurised irrigation systems and water pumping from greater depths. Similarly, Sandell et al. [50] investigated the energy saving opportunities for various farming enterprises in Western Australia. The average on-farm energy use was 0.83 GJ/ha. Biswas et al. [51] found this can be as low as 0.35 GJ/ha in Southwestern Australia. Our estimates are in agreement with Biswas et al. [51].

5. Conclusions and Recommendations

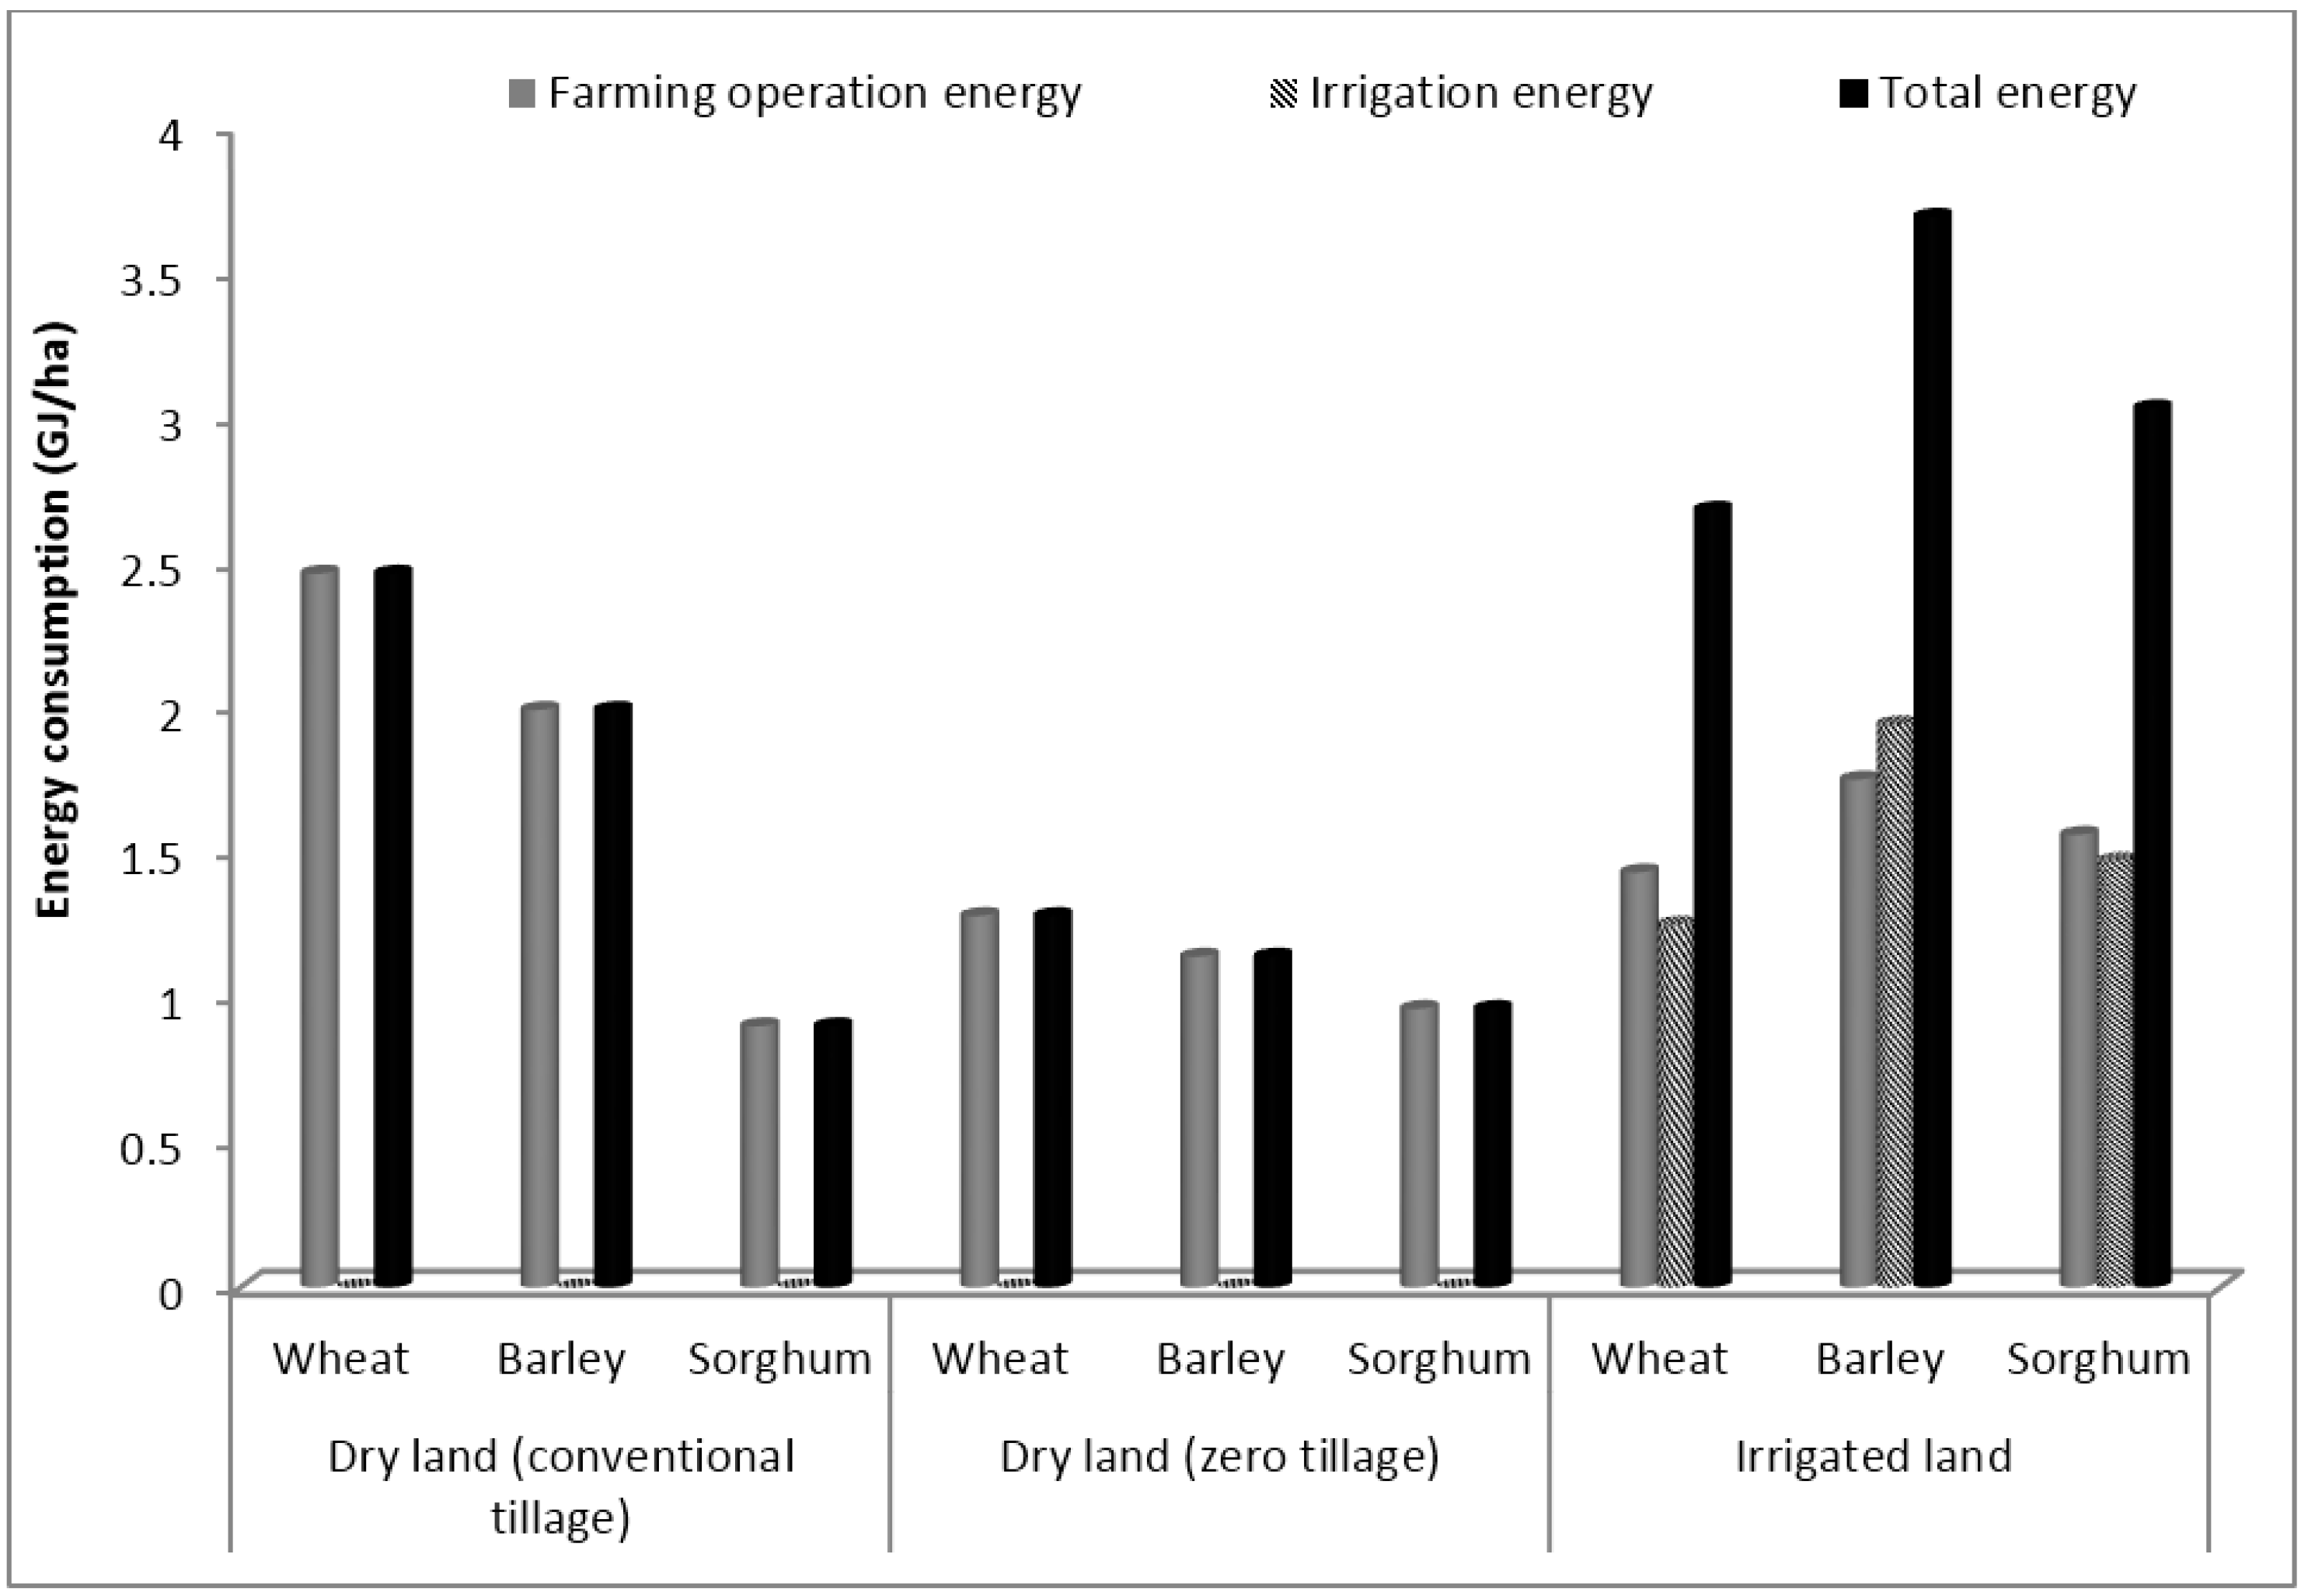
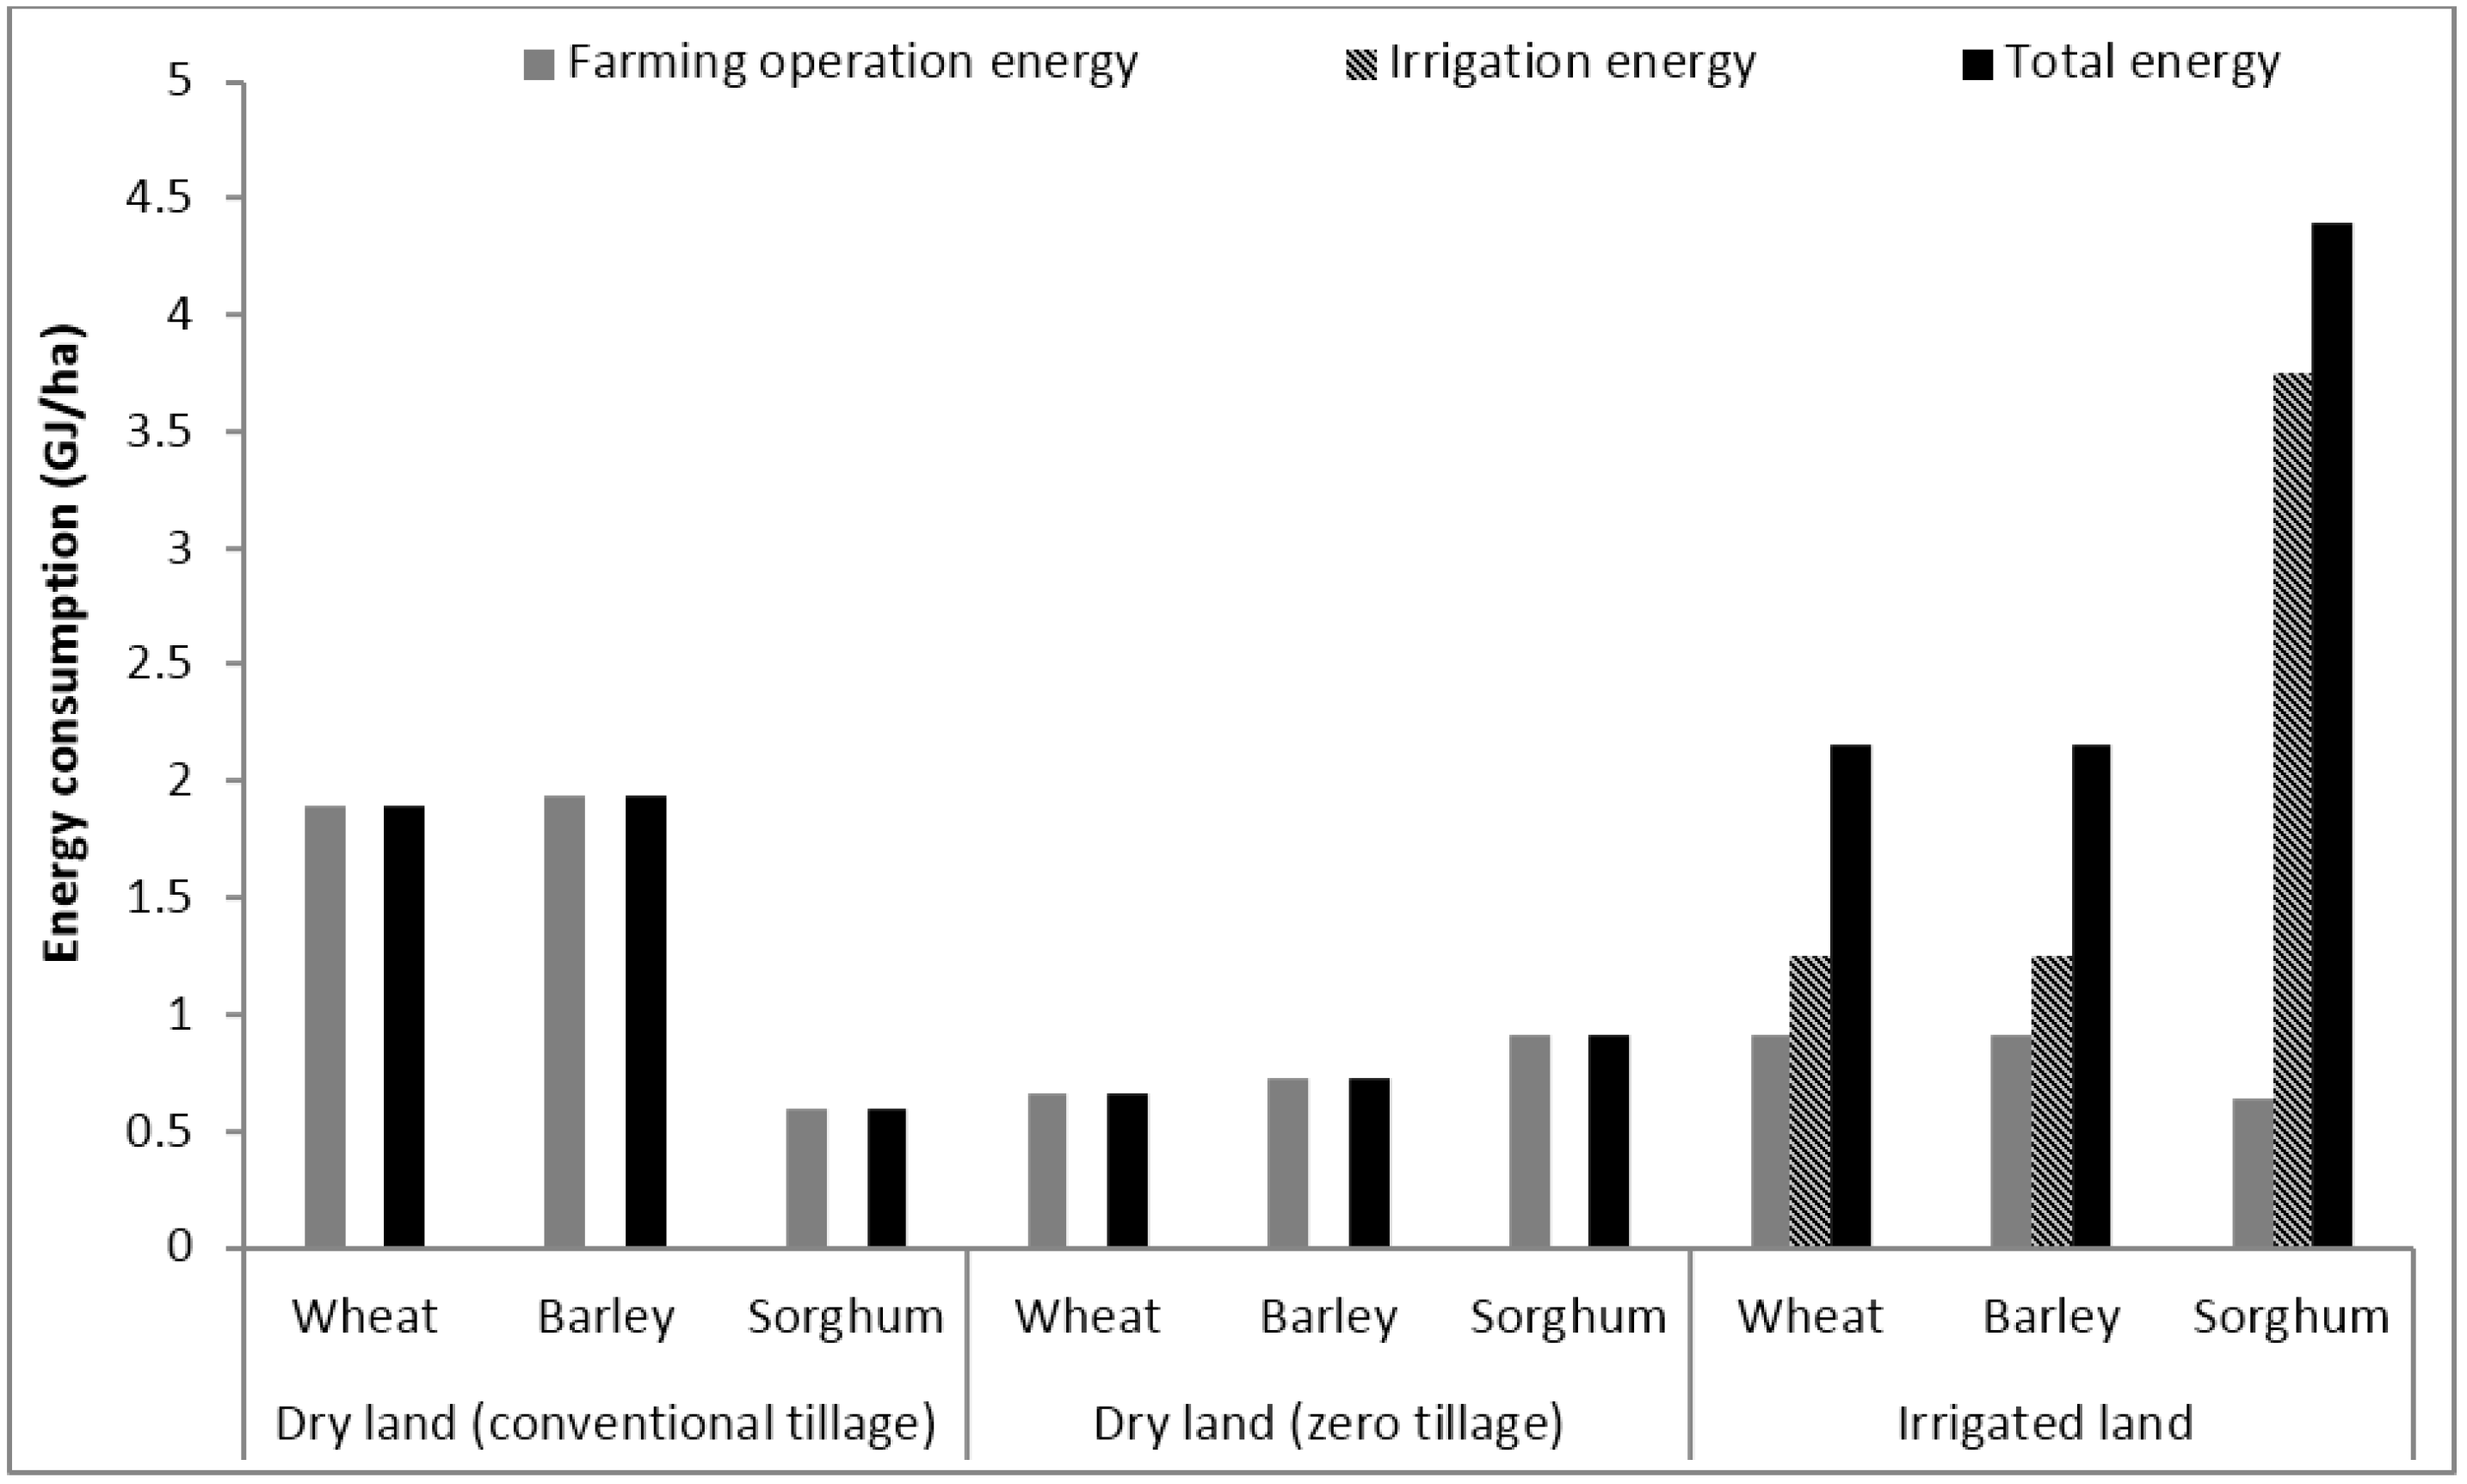
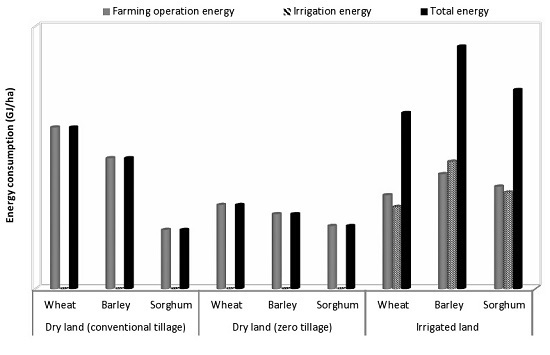
This study has assessed on-farm energy usages for three high value grain crops grown under three major farming practices in three agro-ecological zones of Australia. As expected, it has been found that fuel input in grain production in dryland systems is less than in irrigated systems. The highest amount of energy is required for sorghum crops (4.4 GJ/ha) grown under irrigated systems in the Southern Grain Region, followed by barley (3.7 GJ/ha) and sorghum (3.0 GJ/ha) grown under irrigation in the Northern Grain Region. Under dryland conditions, crops under zero tillage require less energy per hectare for each crop than conventional tillage. Among the three regions, Western Australia requires less energy for each crop, mainly due to its easily workable sandy soils. The lowest energy requirements (0.4 GJ/ha) are for wheat and barley grown in dryland by zero tillage methods in Western Australia. This data provides significant insights for energy use by different crops in different farming systems.
In irrigated crops, irrigation energy has been identified as a major contributor (47%–86%) of total energy use. It is noted that farmers are now increasingly utilising pressurised irrigation systems powered by electricity. Therefore, identifying strategies that are both water and energy efficient would be a matter of priority for further research.
Energy consumption for on-farm cropping activities depends on several factors such as tillage practices, irrigation type, water source, depth of ground water and soil type. Australia being a diverse continent, these factors not only vary between the different grain regions, but also vary within a grain region. However, in this study, only the most common (“average farm”) attributes are considered for each region, which may not necessarily reflect specific areas within the region. Therefore, more research across a larger number of sites is recommended in order to determine if the results found in this project are sufficiently indicative of the given regions.
Furthermore, in order to improve the sustainability of food production, a complete life cycle analysis may be needed. This is because energy is not only consumed for the direct on-farm operations such as cultivation, fertilising, irrigating and harvesting activities, but also indirectly for production, storage and transportation of several other farm inputs such as machinery, fertiliser, herbicides, insecticides, fungicides, and plant growth regulators, etc. [52,53]. The first part, also called direct energy, is covered by this study but the second part, called indirect energy, is not covered.

Acknowledgments

The authors would like to acknowledge the support of the RIRDC for funding this project. The authors would also like to thank the contributions and useful discussions of many people, among them particularly include Craig Baillie, Gary Sandell, Shahbaz Mushtaq, Darryl Pearl, Geoff Cockfield and Glen Riethmuller. Their detailed comments and feedback have significantly improved the quality and relevance of this work, and this is greatly appreciated by the whole project team.

Author Contributions

Tek Maraseni, Guangnan Chen, Thomas Banhazi and Jochen Bundschuh designed research; Tek Maraseni collected and analysed the data; all authors wrote the manuscript and approved the final version.

Conflicts of Interest

The authors declare no conflict of interest.

References

  1. Intergovernmental Panel on Climate Change (IPCC). Technical Summary of Climate Change 2014: Mitigation of Climate Change, Working Group III Contribution to the IPCC Fifth Assessment Report (AR5); IPCC: New York, NY, USA, 2014. [Google Scholar]
  2. Liu, L.C.; Wu, G.; Wang, J.N.; Wei, Y.M. China’s carbon emissions from urban and rural households during 1992–2007. J. Clean Prod. 2011, 19, 1754–1762. [Google Scholar] [CrossRef]
  3. PricewaterhouseCoopers International Limited (PWC). Two Degrees of Separation: Ambition and Reality, Low Carbon Economy Index 2014; PWC: London, UK, 2014. [Google Scholar]
  4. Department of the Prime Minister and Cabinet. Australia’s Climate Change Policy Our Economy, Our Environment, Our Future; One National Circuit: Barton, Australia, 2007; p. 46. [Google Scholar]
  5. Maraseni, T.N.; Maroulis, J.; Cockfield, G. An analysis of Australia’s carbon pollution reduction scheme. Int. J. Environ. Stud. 2009, 66, 591–603. [Google Scholar] [CrossRef] [Green Version]
  6. Climate Change Performance Index. Climate Change Performance Index Component. 2014. Available online: https://germanwatch.org/en/download/8601.pdf (accessed on 11 August 2014).
  7. Climate Change Authority. Final Reports on Australia’s Future Emissions Reduction Targets; Climate Change Authority: Canberra, Australia, 2015; p. 10. [Google Scholar]
  8. United States Environmental Protection Agency (US-EPA). Global Anthropogenic Non-CO2 Greenhouse Gas Emissions: 1990–2020; US-EPA: Washington, DC, USA, 2006. [Google Scholar]
  9. Ceschia, E.; Béziat, P.; Dejoux, J.F.; Aubinet, M.; Bernhofer, C.; Bodson, B.; Buchmann, N.; Carrara, A.; Cellier, P.; Tommasi, D.I.; et al. Management effects on net ecosystem carbon and GHG budgets at European crop sites. Agric. Ecosyst. Environ. 2010, 139, 363–383. [Google Scholar] [CrossRef] [Green Version]
  10. FAOSTAT. FAOSTAT Database. Food and Agriculture Organization of the United Nations. 2013. Available online: http://faostat.fao.org/ (accessed on 12 August 2015).
  11. Tubiello, F.; Salvatore, M.; Rossi, S.; Ferrara, A. Analysis of global emissions, carbon intensity and efficiency of food production. Energia Ambient. Innov. Anno 2013, 4–5, 87–93. [Google Scholar]
  12. Vermuelen, S.J.; Campbell, B.M.; Ingram, J.S.I. Climate change and food systems. Ann. Rev. Environ. Resour. 2012, 37, 195–222. [Google Scholar] [CrossRef]
  13. Department of Climate Change and Energy Efficiency (DCCEE). Australia’s Emissions Projections; DCCEE: Canberra, Australia, 2012. [Google Scholar]
  14. Smith, P.; Martino, D.; Cai, Z.; Gwary, D.; Janzen, H.H.; Kumar, P.; McCarl, B.; Ogle, S.; O’Mara, F.; Rice, C.; et al. Greenhouse gas mitigation in agriculture. Phil. Trans. R. Soc. B 2008, 363, 789–813. [Google Scholar] [CrossRef] [PubMed]
  15. Australian Government. Emissions Reduction Fund Overview; Commonwealth of Australia: Canberra, Australia, 2015; p. 2.
  16. Department of Environment. Carbon Farming Initiatives News; Government of Australia: Canberra, Australia, 2015.
  17. Tzilivakis, J.; Warner, D.J.; May, M.; Lewis, K.A.; Jaggard, K. An assessment of the energy inputs and greenhouse gas emissions in sugar beet (Beta vulgaris) production in the UK. Agric. Syst. 2005, 85, 101–119. [Google Scholar] [CrossRef]
  18. Barber, A. Seven Case Study Farms: Total Energy and Carbon Indicators for New Zealand Arable and Outdoor Vegetable Production; AgriLINK: Kumeu, New Zealand, 2004. [Google Scholar]
  19. Canakci, M.; Topakci, M.; Akinci, I.; Ozmerzi, A. Energy use pattern of some field crops and vegetable production: Case study for Antalya Region, Turkey. Energy Convers. Manag. 2005, 46, 655–666. [Google Scholar] [CrossRef]
  20. Hatirli, S.A.; Ozkan, B.; Fert, C. Energy inputs and crop yield relationship in greenhouse tomato production. Renew. Energy 2006, 31, 427–438. [Google Scholar] [CrossRef]
  21. Erdal, G.; Esungun, K.; Erdal, H.; Gunduz, O. Energy use and economical analysis of sugar beet production in Tokat province of Turkey. Energy 2007, 32, 35–41. [Google Scholar] [CrossRef]
  22. Esungun, K.; Erdal, G.; Gunduz, O.; Erdal, H. An economic analysis and energy use in stake-tomato production in Tokat province of Turkey. Renew. Energy 2007, 32, 1873–1881. [Google Scholar] [CrossRef]
  23. Ozkan, B.; Fert, C.; Karadeniz, C.F. Energy and cost analysis for greenhouse and open-field grape production. Energy 2007, 32, 1500–1504. [Google Scholar] [CrossRef]
  24. Singh, H.; Singh, A.K.; Kushwaha, H.L.; Singh, A. Energy consumption pattern of wheat production in India. Energy 2007, 32, 1848–1854. [Google Scholar] [CrossRef]
  25. Maraseni, T.N.; Mushtaq, S.; Reardon-Smith, K. Climate change, water security and the need for integrated policy development: The case of on-farm infrastructure investment in the Australian irrigation sector. Environ. Res. Lett. 2012, 7, 1–12. [Google Scholar] [CrossRef] [Green Version]
  26. Mushtaq, S.; Maraseni, T.N.; Reardon-Smith, K. Climate change and water security: Estimating the greenhouse gas costs of achieving water security through investments in modern irrigation technology. Agric. Syst. 2013, 117, 78–89. [Google Scholar] [CrossRef]
  27. Australian Bureau of Agricultural and Resource Economics and Sciences (ABARE). Australian Crop Reports and Agricultural Commodities (Formerly Australian Commodities) Reports; Australian Government: Canberra, Ausrtalia, 2013.
  28. Grain Research and Development Corporation (GRDC). Annual Report 2012–2013; Grain Research and Development Corporation: Canberra, Australia, 2013. [Google Scholar]
  29. Rssell, K. Zero waste Australia. A Letter Submitted to the Garnaut Climate Change Review, Melbourne. 2008. Available online: http://www.zerowasteaustralia.org (accessed on 17 March 2014).
  30. Dalal, R.; Wang, W. EEnergy Use and Carbon Emissions in NNSW/SQLD Farming Systems—Are We Ahead or Behind? 2010. Available online: http://www.grdc.com.au/Research-and-Development/GRDC (accessed on 18 March 2014).
  31. Pattanayak, S.K.; Mccarl, B.A.; Sommer, A.J.; Murray, B.C.; Bondelid, T.; Gillig, D.; Deangelo, B. Water quality co-effects of greenhouse gas mitigation in US agriculture. Clim. Chang. 2005, 71, 341–372. [Google Scholar] [CrossRef]
  32. Llewellyn, R.S.; D’emden, F.H. Adoption of No-Till Cropping Practices in Australian Grain Growing Regions; Grain Research and Development Corporation: Canberra, Australia, 2010. [Google Scholar]
  33. FAO. Conservation Agriculture. Agriculture and Consumer Protection Department. 2013. Available online: http://www.fao.org/ag/ca/ (accessed on 18 March 2014).
  34. FAO. Advancement and Impact of Conservation Agriculture/No-Till Technology Adoption in Kazakhstan. 2012. Available online: http://www.fao.org/ag/ca/doc/Importance_Zero_Tillage_Northern_Kazakhstan.pdf (accessed on 18 March 2014).
  35. Australian Greenhouse Office (AGO). Reducing GHG Emissions from Australian Agriculture: The Role of Benchmarking in Driving Best Management Practice; Australian Greenhouse Office: Canberra, Australia, 2006. [Google Scholar]
  36. Maraseni, T.N.; Cockfield, G. Does the adoption of zero tillage reduce greenhouse gas emissions? An assessment for the grains industry in Australia. Agric. Syst. 2011, 104, 451–458. [Google Scholar] [CrossRef]
  37. Friedrich, T.; Derpsch, R.; Kassam, A. Overview of the Global Spread of Conservation Agriculture: Field Actions Science Reports, Special Issue 6; 2012. Available online: http://factsreports.revues.org/1941 (accessed on 4 November 2015).
  38. Pittelkow, C.M.; Linquist, B.A.; Lundy, M.E.; Liang, X.; van Groenigen, K.J.; Lee, J.; van Gestel, N.; Six, J.; Venterea, R.T.; van Kessel, C. When does no-till yield more? A global meta-analysis. Field Crop. Res. 2015, 183, 156–168. [Google Scholar] [CrossRef]
  39. Maraseni, T.N.; Cockfield, G. Including the costs of water and greenhouse gas emissions in a reassessment of the profitability of irrigation. Agric. Water Manag. 2012, 103, 25–32. [Google Scholar] [CrossRef]
  40. Australian Bureau of Agricultural and Resource Economics (ABARE). Australian Crop Report; No.169; Department of Agriculture, Australian Government: Canberra, Australia, 2014.
  41. Department of Primary Industries (DPI). Victoria. Northern Victoria Irrigated Cropping Gross Margins 2009–2010; Department of Primary Industries: Victoria, Australia, 2010; p. 42. [Google Scholar]
  42. Department of Climate Change (DCC). National Greenhouse Gas Accounts (NGA) Factors; Department of Climate Change: Canberra, Australia, 2009. [Google Scholar]
  43. Jacob, S. Comparison of Life Cycle Energy Consumption of Alternative Irrigation Systems; University of Southern Queensland: Queensland, Australia, 2006. [Google Scholar]
  44. Tullberg, J.N. Traffic effects on tillage energy. J. Agric. Eng. Res. 2000, 75, 375–382. [Google Scholar] [CrossRef]
  45. McLaughlin, N.B.; Drury, C.F.; Reynolds, W.D.; Yang, X.M.; Li, Y.X.; Welacky, T.W.; Stewart, G. Energy inputs for conservation and conventional primary tillage implements in a clay loam soil. Trans. ASABE 2008, 51, 1153–1163. [Google Scholar] [CrossRef]
  46. Baillie, C. Energy and Carbon Accounting Case Study on Keytah, a Project Report for the Cotton Research and Development Corporation (CRDC); National Centre for Engineering in Agriculture University of Southern Queensland: Toowoomba, Australia, 2009. [Google Scholar]
  47. Pellizzi, G.; Cavalchini, A.G.; Lazzari, M. Energy Savings in Agricultural Machinery and Mechanization; Elsevier Science Publishing Co.: New York, NY, USA, 1998. [Google Scholar]
  48. Safa, M.; Samarasinghe, S.; Mohssen, A. Field study of energy consumption in wheat production in Canterbury, New Zealand. Energy Convers. Manag. 2011, 52, 2526–2532. [Google Scholar] [CrossRef]
  49. Khan, S.; Khan, M.A.; Latif, N. Energy requirements and economic analysis of wheat, rice and barley production in Australia. Soil Environ. 2010, 29, 61–68. [Google Scholar]
  50. Sandell, G.R.; Szabo, P.M.; Baillie, C.P.; Woodhouse, N.P.; Schmidt, E. North-East Farming Futures R & D Support: Increasing the Knowledge and Adoption of Energy Saving Initiatives Amongst Farming Enterprises in Western Australia; National Centre for Engineering in Agriculture: Toowoomba, Australia, 2013. [Google Scholar]
  51. Biswas, W.K.; Barton, L.; Carter, D. Global warming potential of wheat production in Western Australia: A life cycle assessment. Water Environ. J. 2008, 22, 6–16. [Google Scholar]
  52. Maraseni, T.N.; Cockfield, G.; Maroulis, J. An assessment of greenhouse gas emissions from the Australian vegetables industry. J. Environ. Sci. Health B 2010, 45, 578–588. [Google Scholar] [CrossRef] [PubMed]
  53. Maraseni, T.N.; Cockfield, G.; Maroulis, J. An assessment of greenhouse gas emissions: Implications for the Australian cotton industry. J. Agric. Sci. 2010, 148, 501–510. [Google Scholar] [CrossRef]

