Article

Industrial Photovoltaic Systems: An Economic Analysis in Non-Subsidized Electricity Markets

1
Department of Industrial and Information Engineering and Economics, University of L’Aquila, Via G. Gronchi 18, L’Aquila 67100, Italy
2
Department of Management, Economics and Industrial Engineering, Politecnico di Milano, Piazza L. Da Vinci 32, Milano 20133, Italy
*
Author to whom correspondence should be addressed.
Energies 2015, 8(11), 12865-12880; https://doi.org/10.3390/en81112350
Submission received: 4 June 2015 / Revised: 31 October 2015 / Accepted: 11 November 2015 / Published: 12 November 2015

Abstract

:
Photovoltaic (PV) systems are becoming a relevant electricity source, characterised by a growing trend in the last years. This paper analyses the economic feasibility of investments in industrial PV systems of different sizes (200 kW, 400 kW, 1 MW, and 5 MW), in the absence of subsidies, and in a mature market (Italy). The selected indicators for this kind of assessment are net present value (NPV) and discounted payback time (DPBT). Furthermore, the environmental advantage in comparison to fossil sources of energy is evaluated through the reduction of carbon dioxide emissions (ERcd). Finally, a sensitivity analysis on critical variables (percentage of self-consumed energy, average annual insolation rate, annual electricity purchase price, annual electricity sale price, unitary investment cost and opportunity cost) is conducted. Results highlight the strategic role of self-consumption in a market characterised by an absence of public policy incentives and the presence of interesting economic opportunities for industrial applications.

1. Introduction

Renewable energy sources (RES) are able to cope with global economic crisis, unpredictable oil price oscillations and environmental issues [1,2,3,4]. In fact, renewable energy technologies, pushed also by governmental incentives, saw in the last decade an incredible increase in their application, both in private and public contexts. Among them, PV systems present a significant growth. In fact, the European Photovoltaic Industry Association (EPIA) [5] shows that PV technology has grown globally over the past five years with a remarkable rate (from 24 GW worldwide in 2009 to 178 GW in 2014), and is now seen as a strategic electricity source. Europe’s contribution to the cumulative PV installations was equal to 49% in 2014, while was 59% in 2013.
Furthermore, solar energy can be used not only for electricity production, but also for heat generation. For example, the combination of solar systems and heat pumps (HP) can add profits and reduce environmental pollution with a net saving rate of about 41% of energy consumption per unit investment for cooling and 35% for heating [6,7]. Another interesting application is represented by a combination of an energy storage system (ESS) with a PV system [8]. This way, with an ESS it is possible to increase the self-consumption quota by 10%–24% with 0.5–1 kWh per installed kW of PV power [9]. The other main technology in able to increase PV self-consumption is the demand side management (DSM) [10]. A review on this topic quantifies this value in 2%–15% points [9]. DSM can be combined also with ESS to further increase the self-consumption. In a futuristic scenario, characterized by an expansion of the distributed generation of energy, smart grids could help to better integrate RES with distribution and transmissions systems [11]. In fact, they are able to provide several beneficial utilities, like the optimization of production and consumption of energy, power monitoring and data provision [12]. Micro-grids are a very specific portion of a smart grid [13]: the first operates in order to optimize energy fluxes, while the second tries to solve power’s unbalances issues and other technical problems in real time [14]. Consequently, forecasting methods could play a fundamental role in this context [15] and the use of micro-grids powered by PV systems could contribute significantly to global energy requests [13].
The role of PV systems in industrial contexts is extremely important to reach the World’s sustainability goals [16]. From the sustainability point of view (both in economic and environmental terms), these technologies are been analysed by many authors [17,18,19,20]. Feed-in Tariff (FiT) incentive schemes encourage and accelerate the deployment of PV installations in several countries, and represent the preferable tool to develop new markets [21]. Otherwise, in the absence of support mechanisms, the profitability of PV facilities is completely related to the self-consumption share [22,23,24]. This paper performs an economic assessment of PV systems in industrial applications. The analysis is based on an economic model and includes a sensitivity analysis considering different ranges of several important decision parameters. This assessment will be contextualized in the Italian PV sector, and could give a clear view to other national governments that are going to introduce enabling strategies for the diffusion of RES.

2. Materials and Methods

2.1. The Italian Photovoltaic (PV) Sector Status

The Italian electric sector is characterized by a strong presence of RES. In 2014, they represented 43.3% of the national production and 37.5% of the national consumption. The PV systems growth rate was significant (Figure 1) [25]:
  • The installed power increased from 477 MW to 18,285 MW in the 2008–2014 period, with 52% of installations in 2011;
  • The electric generation grew from 193 GWh to 23,229 GWh in the 2008–2014 period, with a 2014 growth rate of 9% in comparison to 2013;
  • The PV electric production is equal to 8.7% of the national production and to 7.5% of the national consumption. These values in 2008 were less than 0.1%;
  • The 2014 installed power mainly referred to residential plants (about 59% of them has a power ≤20 kW). Big plants were hugely reduced (12% and 4% for 201–1000 kW and >1 MW power plants, respectively);
  • The 2014 installed power was mainly located in the northern part of Italy, characterized by less favourable insolation rates (Lombardia 14.2%, Veneto 12.1%, Emilia Romagna 11.6%, Lazio 7.9%, Piemonte 7.7% and Toscana 7.4%).

2.2. Policy Aspects

The 4th FiT scheme applied a specific tariff to the energy produced. Instead, the 5th FiT scheme considered an all-inclusive FiT for the share of net energy injected into the grid and a premium rate on the share for net energy consumed on site. After the 5th FiT scheme, the Decree approved by the Italian Council of Ministers foresees a 50% tax deduction (compared to the usual 36%) for PV plants for private and small individual businesses purposes.
The deduction is divided into ten equal yearly amounts [17]. Furthermore, Gestore Servizi Energetici (GSE—the institutional actor responsible for the control of renewable energies plants) provides additional support services, as the Net Metering Service. It, activated on request by the parties, regulates the electricity generated by a consumer/producer in an eligible on-site plant and injected into the grid and the one withdrawn from the grid. Hence, a contribution is paid to customers based on both injections and withdrawals of electricity in a given calendar year and on their market values (for PV plants up to 500 kW). Under simplified purchase and resale hypotheses, producers sell the electricity generated and injected into the grid to GSE at the local price or at a minimum price guaranteed on the first 2 million kWh per year. A new interesting opportunity for customers is represented by the Efficient Systems for Users (SEU). In this case, the energy produced and consumed within the SEU is free from grid and system fees, with lower rates if compared to energy withdrawn from the public grid. For producers, the benefit lies in the sale of the energy at an above-market price [26].
Figure 1. The growth of photovoltaic (PV) in Italy (2008–2014) Source: [25]. * = Cumulative value (<2008–2014); ^ = Specific value (2014).
Energies 08 12350 g001

2.3. Environmental Impact

The substitution of fossil fuels with RES allows the reduction of environmental pollution, premature mortality, lost workdays and overall healthcare costs [27,28,29]. In order to evaluate the environmental advantages, a comparison between CO2 emissions released by a PV plant per unit of produced energy ( E cd PV ) and the ones released by fossil fuels ( E cd FF ) is required. These data will be multiplied by the overall produced energy (EOut) [30].
Some authors have quantified emissions released by a PV plant at 81 gCO2eq/kWh, of which 93.7% are caused by PV panel manufacture [31]. Instead, fossil sources emissions were quantified in 771 gCO2eq/kWh [32]. This last value sees oil and natural gas weighing in at 47% and 36%, respectively. Coal only accounts for 17% because, even if more pollutant than the previous sources, it is less present within the Italian energy mix. Hence, it is possible to estimate the environmental savings at 690 gCO2eq/kWh. It is important to underline that a PV plant allows an interesting reduction of pollutant emissions, but it is not possible to define with precision this value, given the uncertainty characterizing emission values related to each energy source [33]. Furthermore, the environmental benefit is quantified equal to 20.1 tCO2eq per installed kW during the entire lifecycle of a PV plant (about 20 years) [32].
Finally, the scientific literature shows that the recycling of PV modules is an actual and interesting topic [34]. From an environmental point of view, they allow a savings of about 800–1200 kgCO2eq per 1 ton of silicon PV modules [35]. However, from an economic point of view, there is a loss of about 4.2 € and 1.9 € per kg of treated PV modules, calculated for two recycling plants with capacities of 185 t and 1480 t, respectively [36]. Some authors have observed that the optimized scale able to guarantee profitability is 19,000 t [37]. However, a current solution could be represented also by a correct mix of different e-wastes [38].

2.4. Economic Assessment

Profits coming from the implementation of PV plants are related to both incentive tariffs in developing markets [19] and self-consumption in developed markets [22]. On the one hand, incentives allowed the development of a supply chain and a relevant turnkey plant cost reduction (which can increase the competitiveness of the sector), with benefits in terms of electric system sustainability. On the other hand, the cost needed to support this development was transferred as tariffs onto electricity bill and, consequently, added to consumers’ costs. The environmental advantage can be quantified in economic terms through the Social Cost of Carbon (SCC). It is evaluated in 20 €/tCO2eq [39], or equal to an initial value of about 15 €/tCO2eq, increasing over time [40]; a recent paper suggested a decrease of this value, equal to 6 €/tCO2eq [41].
From the financial perspective, the main variable influencing revenues is represented by incentive tariffs, whatever the size. In fact, this value can be equal to 59%–65% [32] or 50%–57% [42]. From the cost point of view, investments greatly influence the profitability of plants. However, cost reductions in 2014 were relevant, if compared to 2010 data [22]. Costs decreased from 4500 €/kW to 2000 €/kW (excluding Value Added Tax) for 3 kW plants, from 3500 €/kW to 1280 €/kW and from 2800 €/kW to 800 €/kW for 200 kW and 1 MW plants, respectively. Finally, another operational parameter influencing results is the insolation rate. Thus, some regions in the southern part of Italy can register NPVs that are double than the ones in the northern part of Italy [43].
The assessment of the economic performance of residential PV plants was assessed by [17] under different incentive structures. These range from 4519 €/inhabitant to 5050 €/inhabitant under a feed-in premium tariff in 2012, to 2756–3150 €/inhabitant under all-inclusive FiT in 2013, to 1920–2210 €/inhabitant under the 50% tax deduction scenario in 2013, up to 2300–2460 €/inhabitant under both 50% tax deduction in 2014 with a reduction of investment costs in comparison to the previous year. Table 1 shows some plant dimensions related to industrial applications. In general, there is a clear non-profitability of some plants focused on selling all of the produced energy.
Table 1. Economic analysis of industrial PV systems.
SizeValue (€/kW)ReferenceSizeValue (€/kW)Reference
200 kW(−115)–180 1[22]1 MW400–550 1[22]
200 kW(−740)–560 2[22]1 MW90–740 2[22]
400 kW160–310 1[22]1 MW800–1200 2[42]
400 kW(−150)–500 2[22]1 MW274–2638 2[44]
1 MW1561 1[32]5 MW(−510)–3200 2[45]
1 MW576–2513 2[32]5 MW1225 1[32]
1 MW(−296)–3691 2[45]5 MW340–2128 2[32]
1 Baseline scenario; 2 Alternative scenario.
The PV plants’ profitability evaluation under non-incentivized electric markets scenarios has a relevant role. In fact, the incentive policy mission is the support of the sector development till it becomes competitive, and not a perpetual assistance [24,46,47].

2.5. Model Assumptions

The profitability analysis of residential PV plants investments is conducted on the base of Discounted Cash Flow (DCF) [22,48]. NPV is defined as the sum of present values of individual cash flows and DPBT represents the number of years needed to balance cumulative discounted cash flows and initial investment. Furthermore, it is possible to evaluate the ERcd, that defines the environmental advantage from the amount of energy produced (EOut) using a PV system compared to the use of fossil fuels. The annual energy output of a PV system depends on several factors and it can be calculated by considering several factors: average annual insolation rate, optimum angle of tilt, module efficiency, balance of system (BoS) efficiency, active surface, nominal power of PV modules and number of PV modules to be installed [17,31,49]. Due to the degradation time of the PV system components’ performances, the efficiency cannot be constant over time and, consequently, an efficiency reduction factor is considered. A useful technical parameter is the performance ratio (PR). PR, defined as the ratio of actual and theoretically possible energy outputs, can be used to determine the efficiency of PV systems [50]. Consequently, it can be evaluated after both the realization of the project and the sampling period (about 1 year). Nowadays, PR is equal to 90% in some PV systems [51].
The used model is based on recent scientific papers [22,46] and it considers all the relevant items and gives values that are similar to the ones found in business plans proposed to consumers. This way, it can be used directly for real applications. Furthermore, a survey conducted among senior managers, policy makers, and researchers with experience in energy decision-making processes, highlighted that NPV is the indicator presenting the highest relevance in reaching the sustainability goal. The potential revenues from PV plants come from: (i) energy internal consumption savings and (ii) sale of energy not for internal consumption. The investment cost is the main item of expenditure and it is covered by third party funds. The operating cost is low due to the free nature of solar radiation and the limited maintenance costs. The reference mathematic model is described as follows:
NPV = t = 0 N C t / ( 1 + r ) t = t = 0 N ( I t O t ) / ( 1 + r ) t
t = 0 DPBT C t / ( 1 + r ) t = 0
I t = S C el , t + S P el , t   t = 1 ,    · · ,  N
O t = C lcs , t + C lis , t + C m , t + C ass , t + C ae , 0 + C ri , 10 + C tax , t   t = 1 ,    · · ,  N
S C el , t = x t c × p t c   t = 1 ,    · · ,  N
S P el , t = x t s  *  p t s   t = 1 ,    · · ,  N
x t c = ω self , c × E Out , t
x t s = ω sold × E Out , t   ω self , c + ω sold = 1
E Out , t = t r × K f × ƞ m × ƞ bos × A cell × P f × ƞ f
E Out , t + 1 = E Out , t × ( 1 d E f )   t = 1 , · · · ,  N
p t + 1 c =   p t c × ( 1 + inf el )
p t + 1 s =   p t s × ( 1 + inf el )
C inv = C inv , unit × P f × η f
C lcs , t = C inv / N debt   t = 0     N debt 1
C lis , t = ( C inv C lcs , t ) × r d   t = 0     N debt 1
C m , t = P Cm × C inv × ( 1 + inf )   t = 1 ,    · · ,  N
C ass , t = P Cass × C inv × ( 1 + inf )   t = 1 ,    · · ,  N
C ri , 10 = P Ci × C inv
C tax , t = S P el , t × P Ctax   t = 1 ,    · · ,  N
E R cd = t = 1 N ( E cd FF E cd PV ) × E Out , t
As already underlined in Section 2.4, the economic result is directly influenced by decisions related to both dimensions (standards size of industrial plants are 200 kW, 400 kW, 1 MW and 5 MW) and location of the plant (the authors selected an average value characterizing Italy, equal to 1450 kWh/m2*y). Alternative scenarios will be assessed with the sensitivity analysis. Economic and technical inputs considered in this analysis are presented in Table 2. The contribution related to the net metering service (given the complexity and the number of variables to be considered), is evaluated by increasing the energy price produced and sold to the grid of a certain delta, according with [22].
Table 2. Economic and technical input data-sources: [17,52].
VariableValueVariableValue
Acell7 m2/kWp p t c 13 cent€/kWh
Cae12.5 1–15.6 2–25 3–70 4 k€ p t s 3.9 3,4–8.3 1,2 cent€/kWh
Cinv,unit1280 1–1040 2–800 3–700 4 €/kW P C ass 0.4%
dEf0.7% P C i 15%
Ebos85% P C m 1%
Ef16% P Ctax 43.5%
inf2% P f f (size)
infel1.5%r5%
kf1.13rd3%
N20 ytr1450 kWh/m2·y
Ndebt15 y ω self , c 50%
η f f (size) ω sold 50%
Size: 1 = 200 kW; 2 = 400 kW; 3 = 1 MW; 4 = 5 MW.

3. Results

A photovoltaic (PV) system intercepts sunlight and permits the generation of electric energy. Starting from Equations (9) and (10) it is possible to calculate the amount of energy produced over the entire useful life of plants, set equal to 20 years. This electric energy allows two main results (Table 3): (i) a reduction of pollutant emissions and (ii) the generation of economic opportunities.
Table 3. Indicators–baseline scenario.
Indicators200 kW400 kW1 MW5 MW
Energy output of PV system (MWh)578711,57428,936144,680
Reduction in the emissions of carbon dioxide (tCO2eq)3993798619,96699,830
Discounted payback time (DPBT) (y)16542
Net present value (NPV) (k€)56.2236.7655.13928.9
NPV/power (€/kW)281592655786
Regarding ERcd, it is calculated according to Equation (20). For example, by considering the 200 kW system, a value of 3993 tCO2eq (5787 MWh × 690 gCO2eq/kWh) is obtained. Given the following linear relationship, and considering the same location for all plants, the environmental advantage related to the 400 kW system will be double that of the previous plant. Results will be therefore equal to 20 tCO2eq per kW installed and it is almost the same as proposed in Section 2.3. In addition, with the aim of making the production of electricity greener, the use of PV panels allows the achievement of greater energy independence.
Looking at economic results, in accordance with Equations (1) and (2), it is clear as DPBT is advantageous, independently from the considered dimensions. However, the 200 kW plant is not interesting from an industrial point of view, given its cut off period equal to 16 years [22]. The 5 MW plant presents the best performance (2 years), similar to values proposed by [32]. NPV results are coherent with DPBT values. The profitability of PV systems is verified in non-subsidized markets. Values range from 281 €/kW for the 200 kW plant to 786 €/kW for the 5 MW plant. These results are generally lower in comparison to values reported in Table 1, but nevertheless economic opportunities are present. It is useful to underline the following points:
  • The 400 kW plant results (if compared to 200 kW), and 5 MW plants results (if compared to 1 MW), are expected, given they have the same energy selling price and the same unitary investment cost reduction;
  • 200 kW and 400 kW plants, while exploiting the net metering service, present less advantageous economic results. This means that cost reduction is more significant than revenue items.
In order to give solidity to the obtained results, the following section will economically evaluate alternative scenarios, representing multiple case studies.

4. Sensitivity Analysis

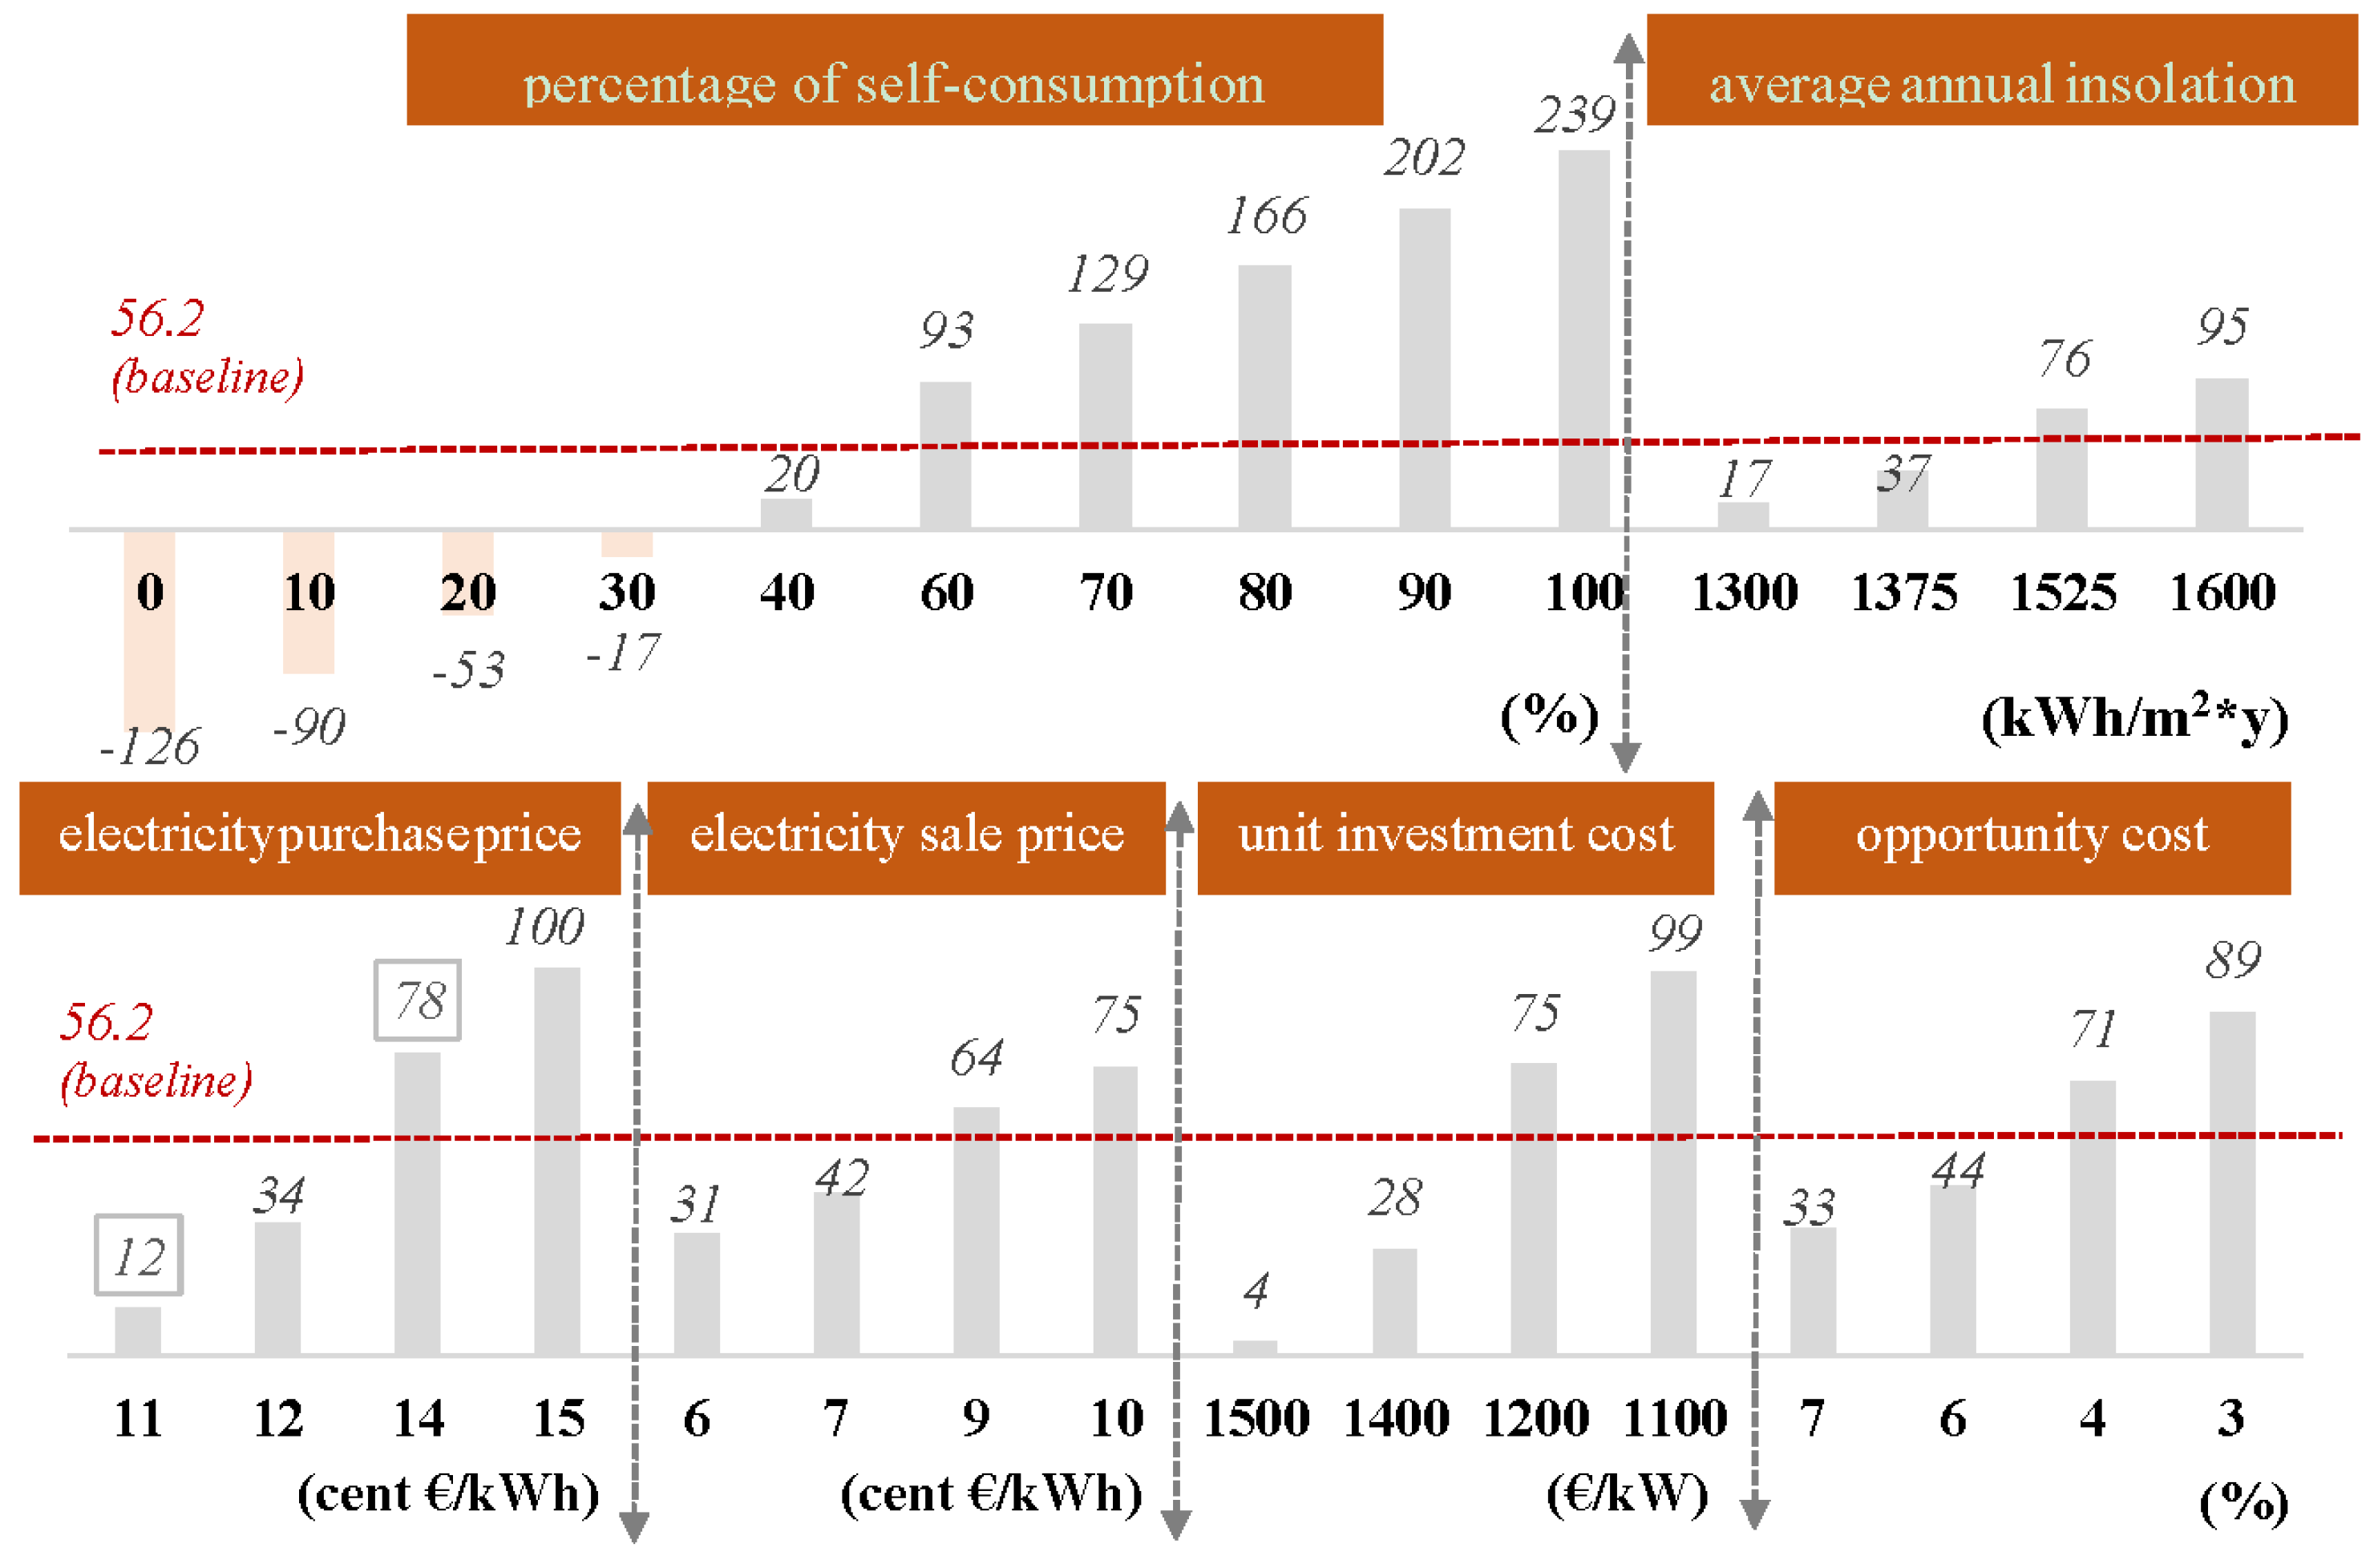
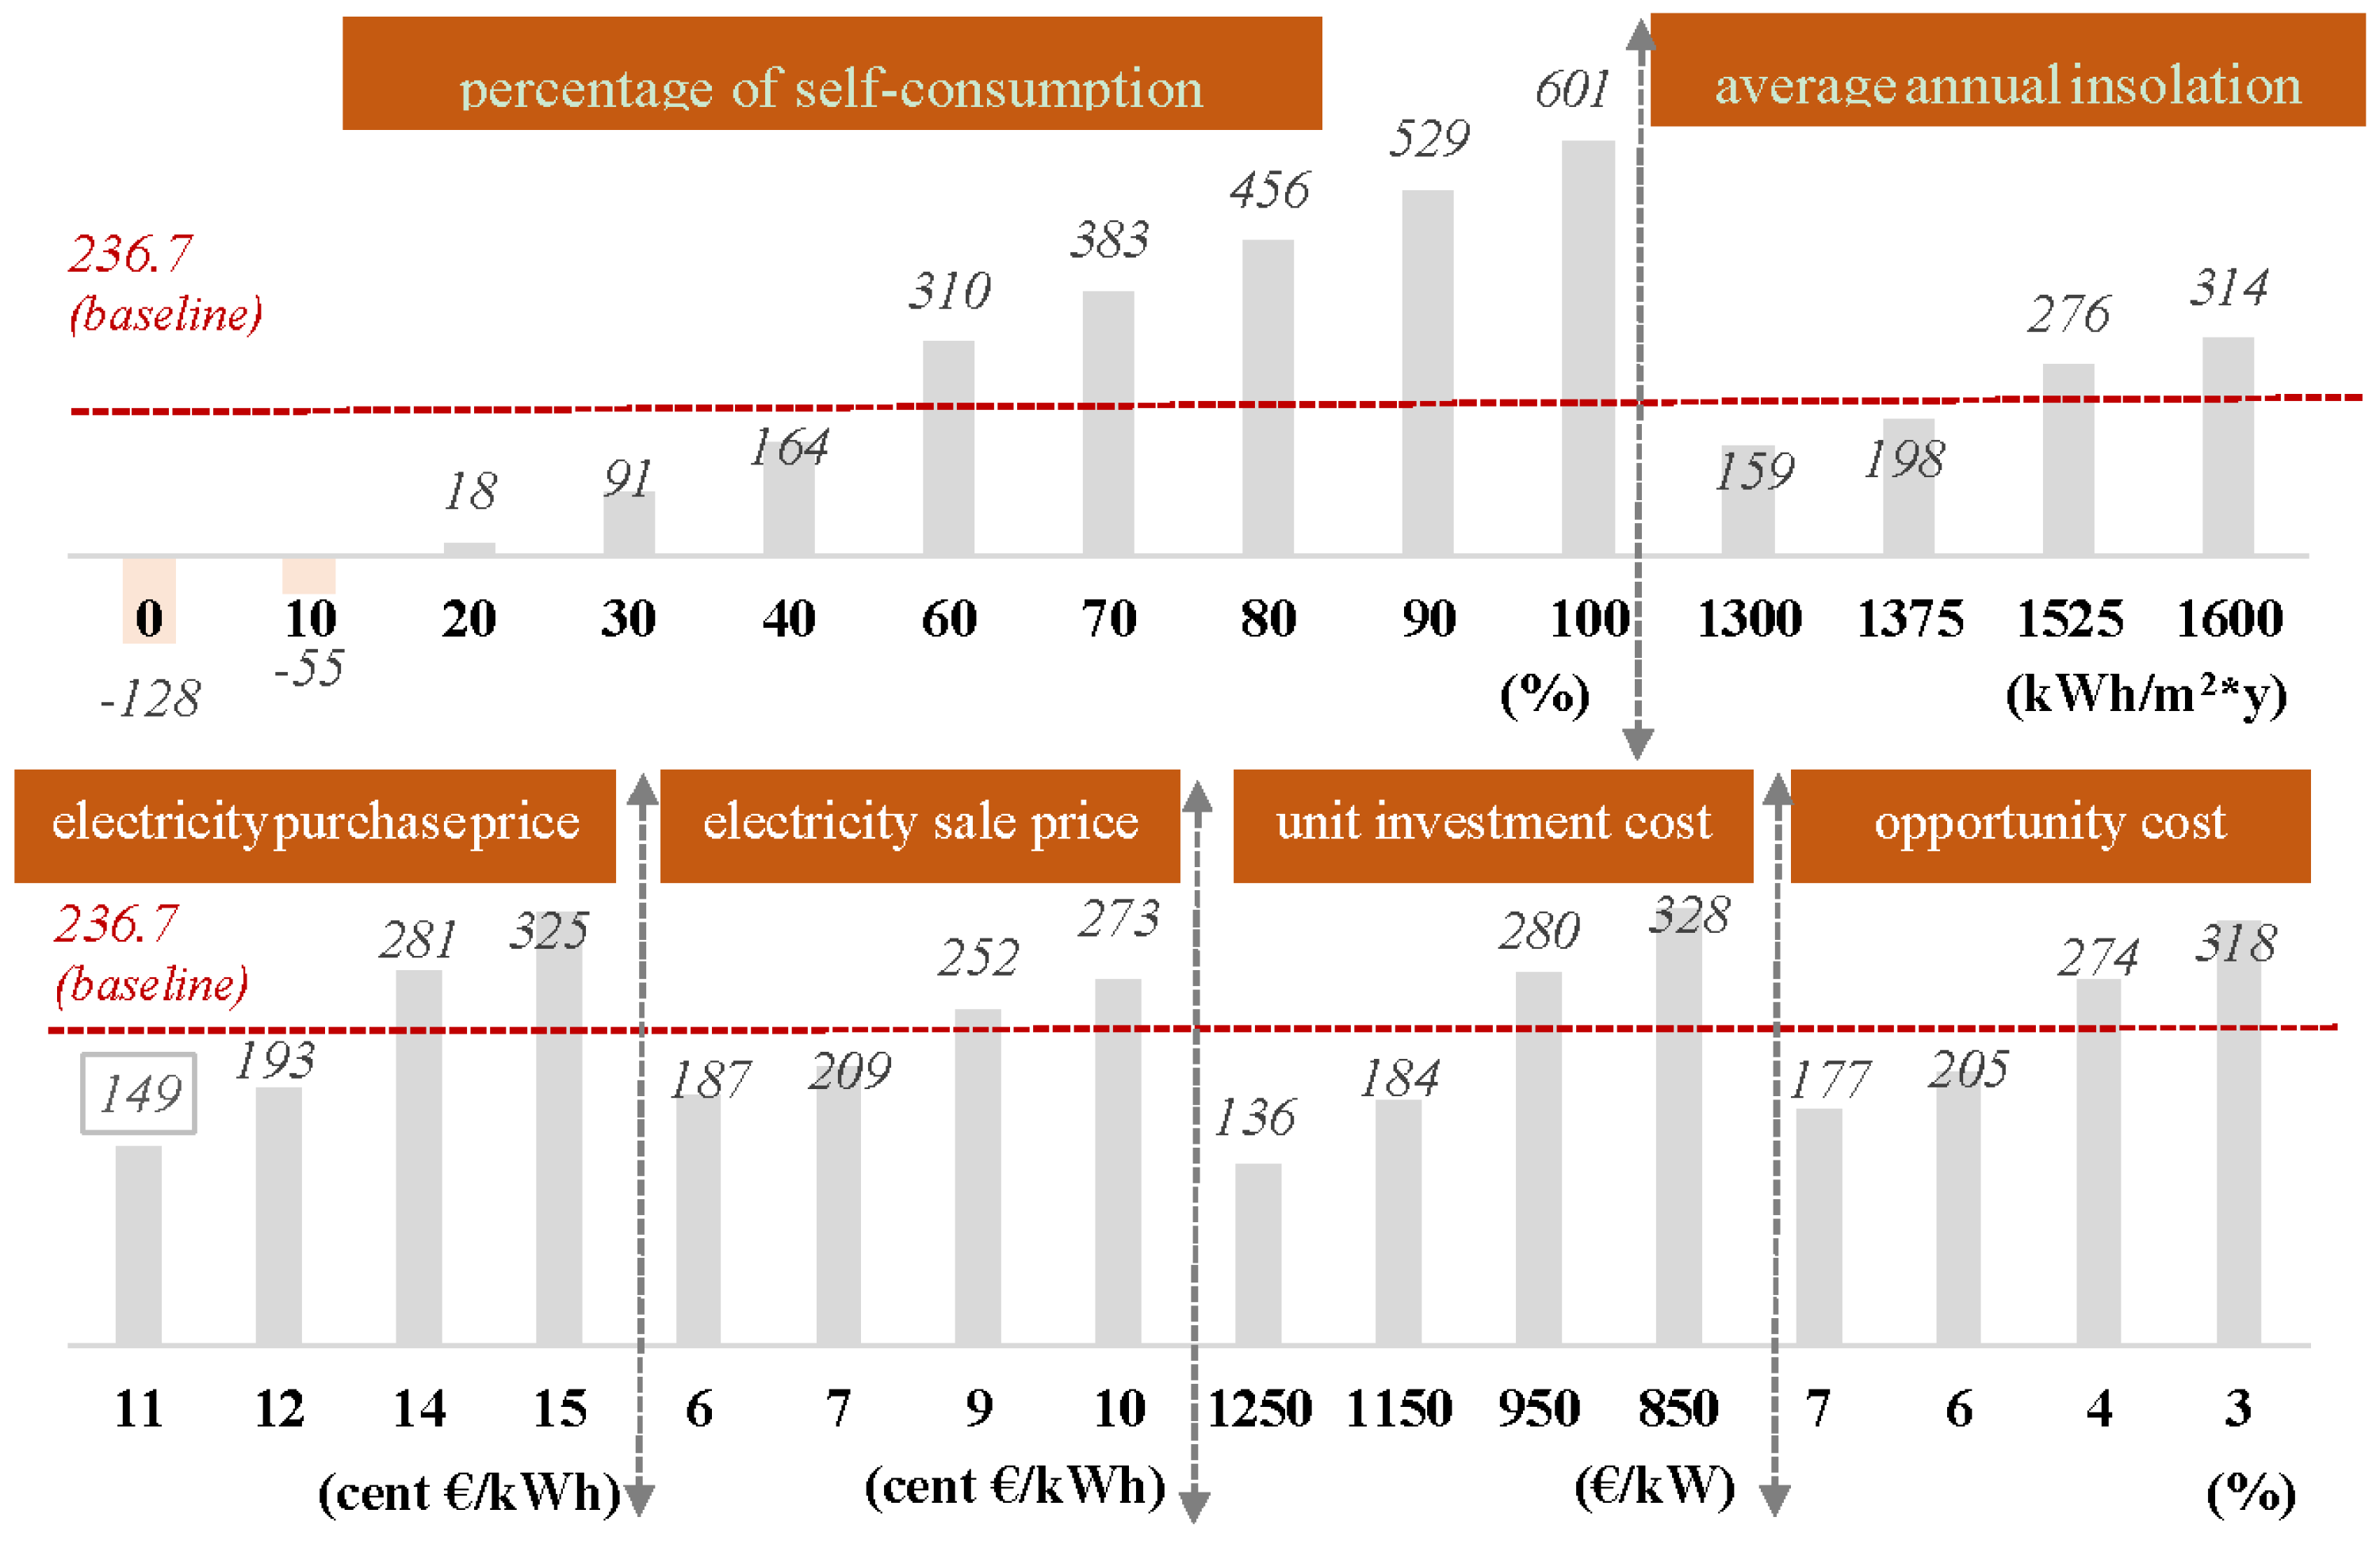
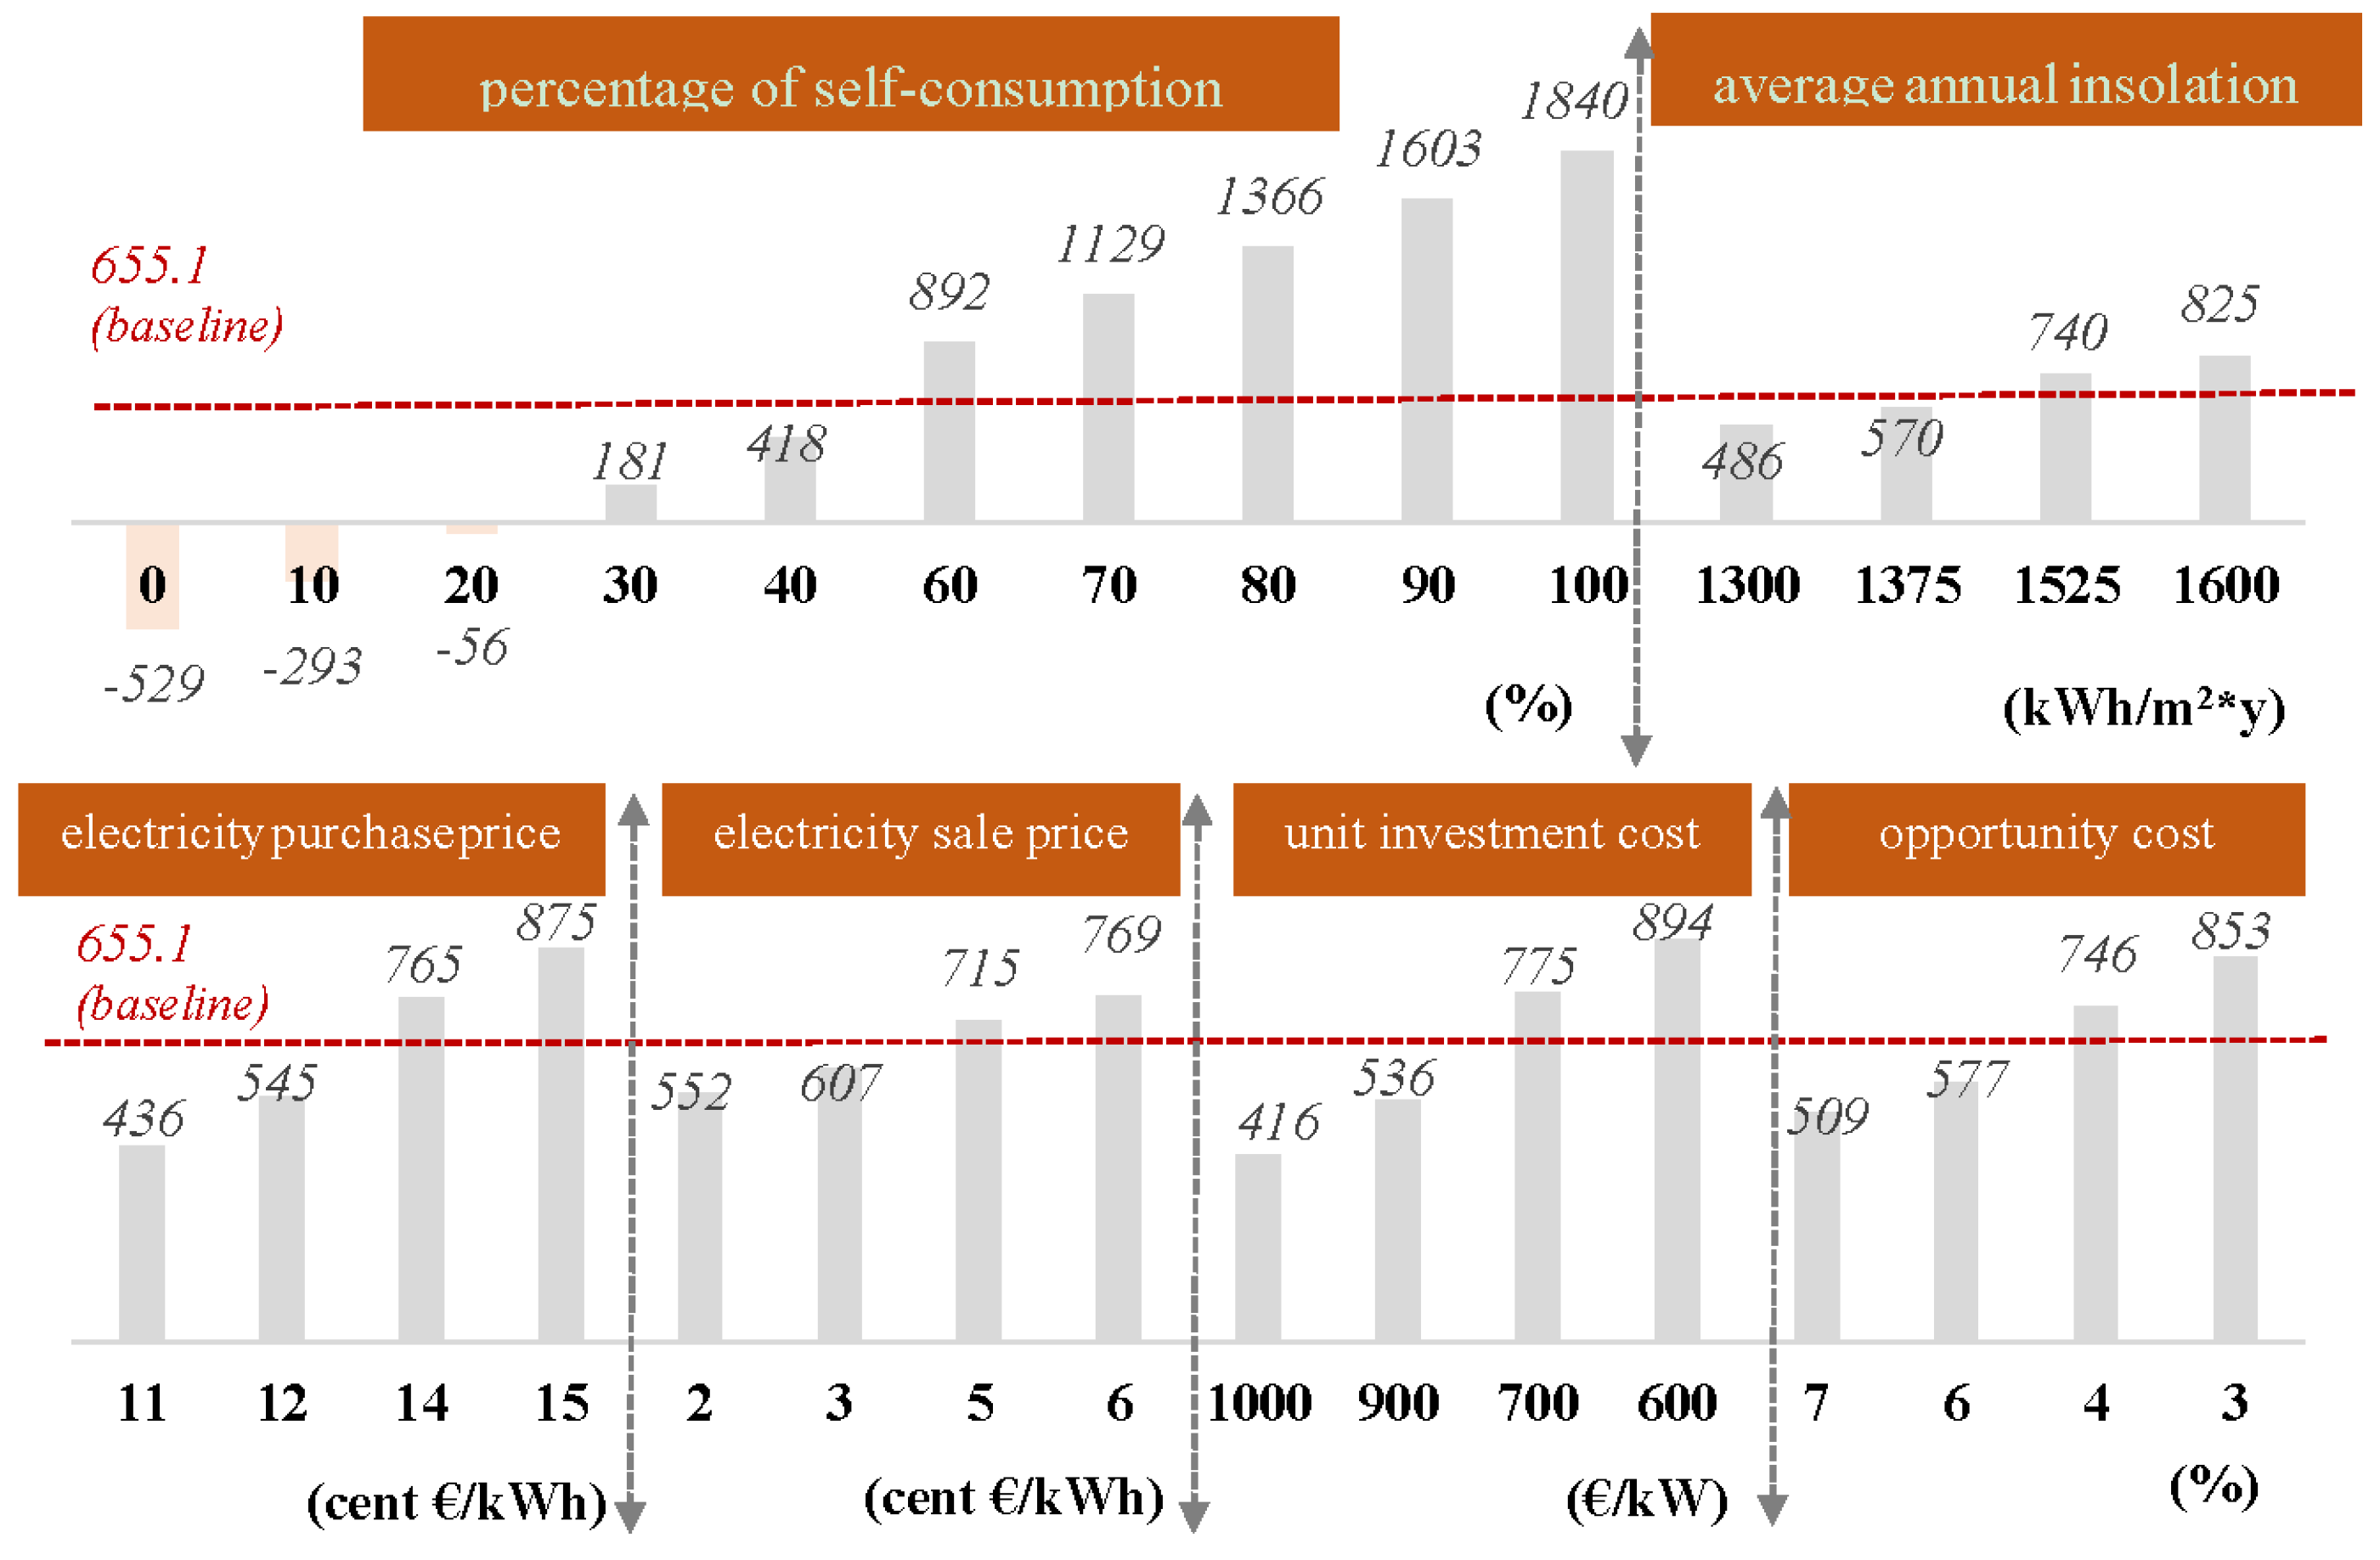
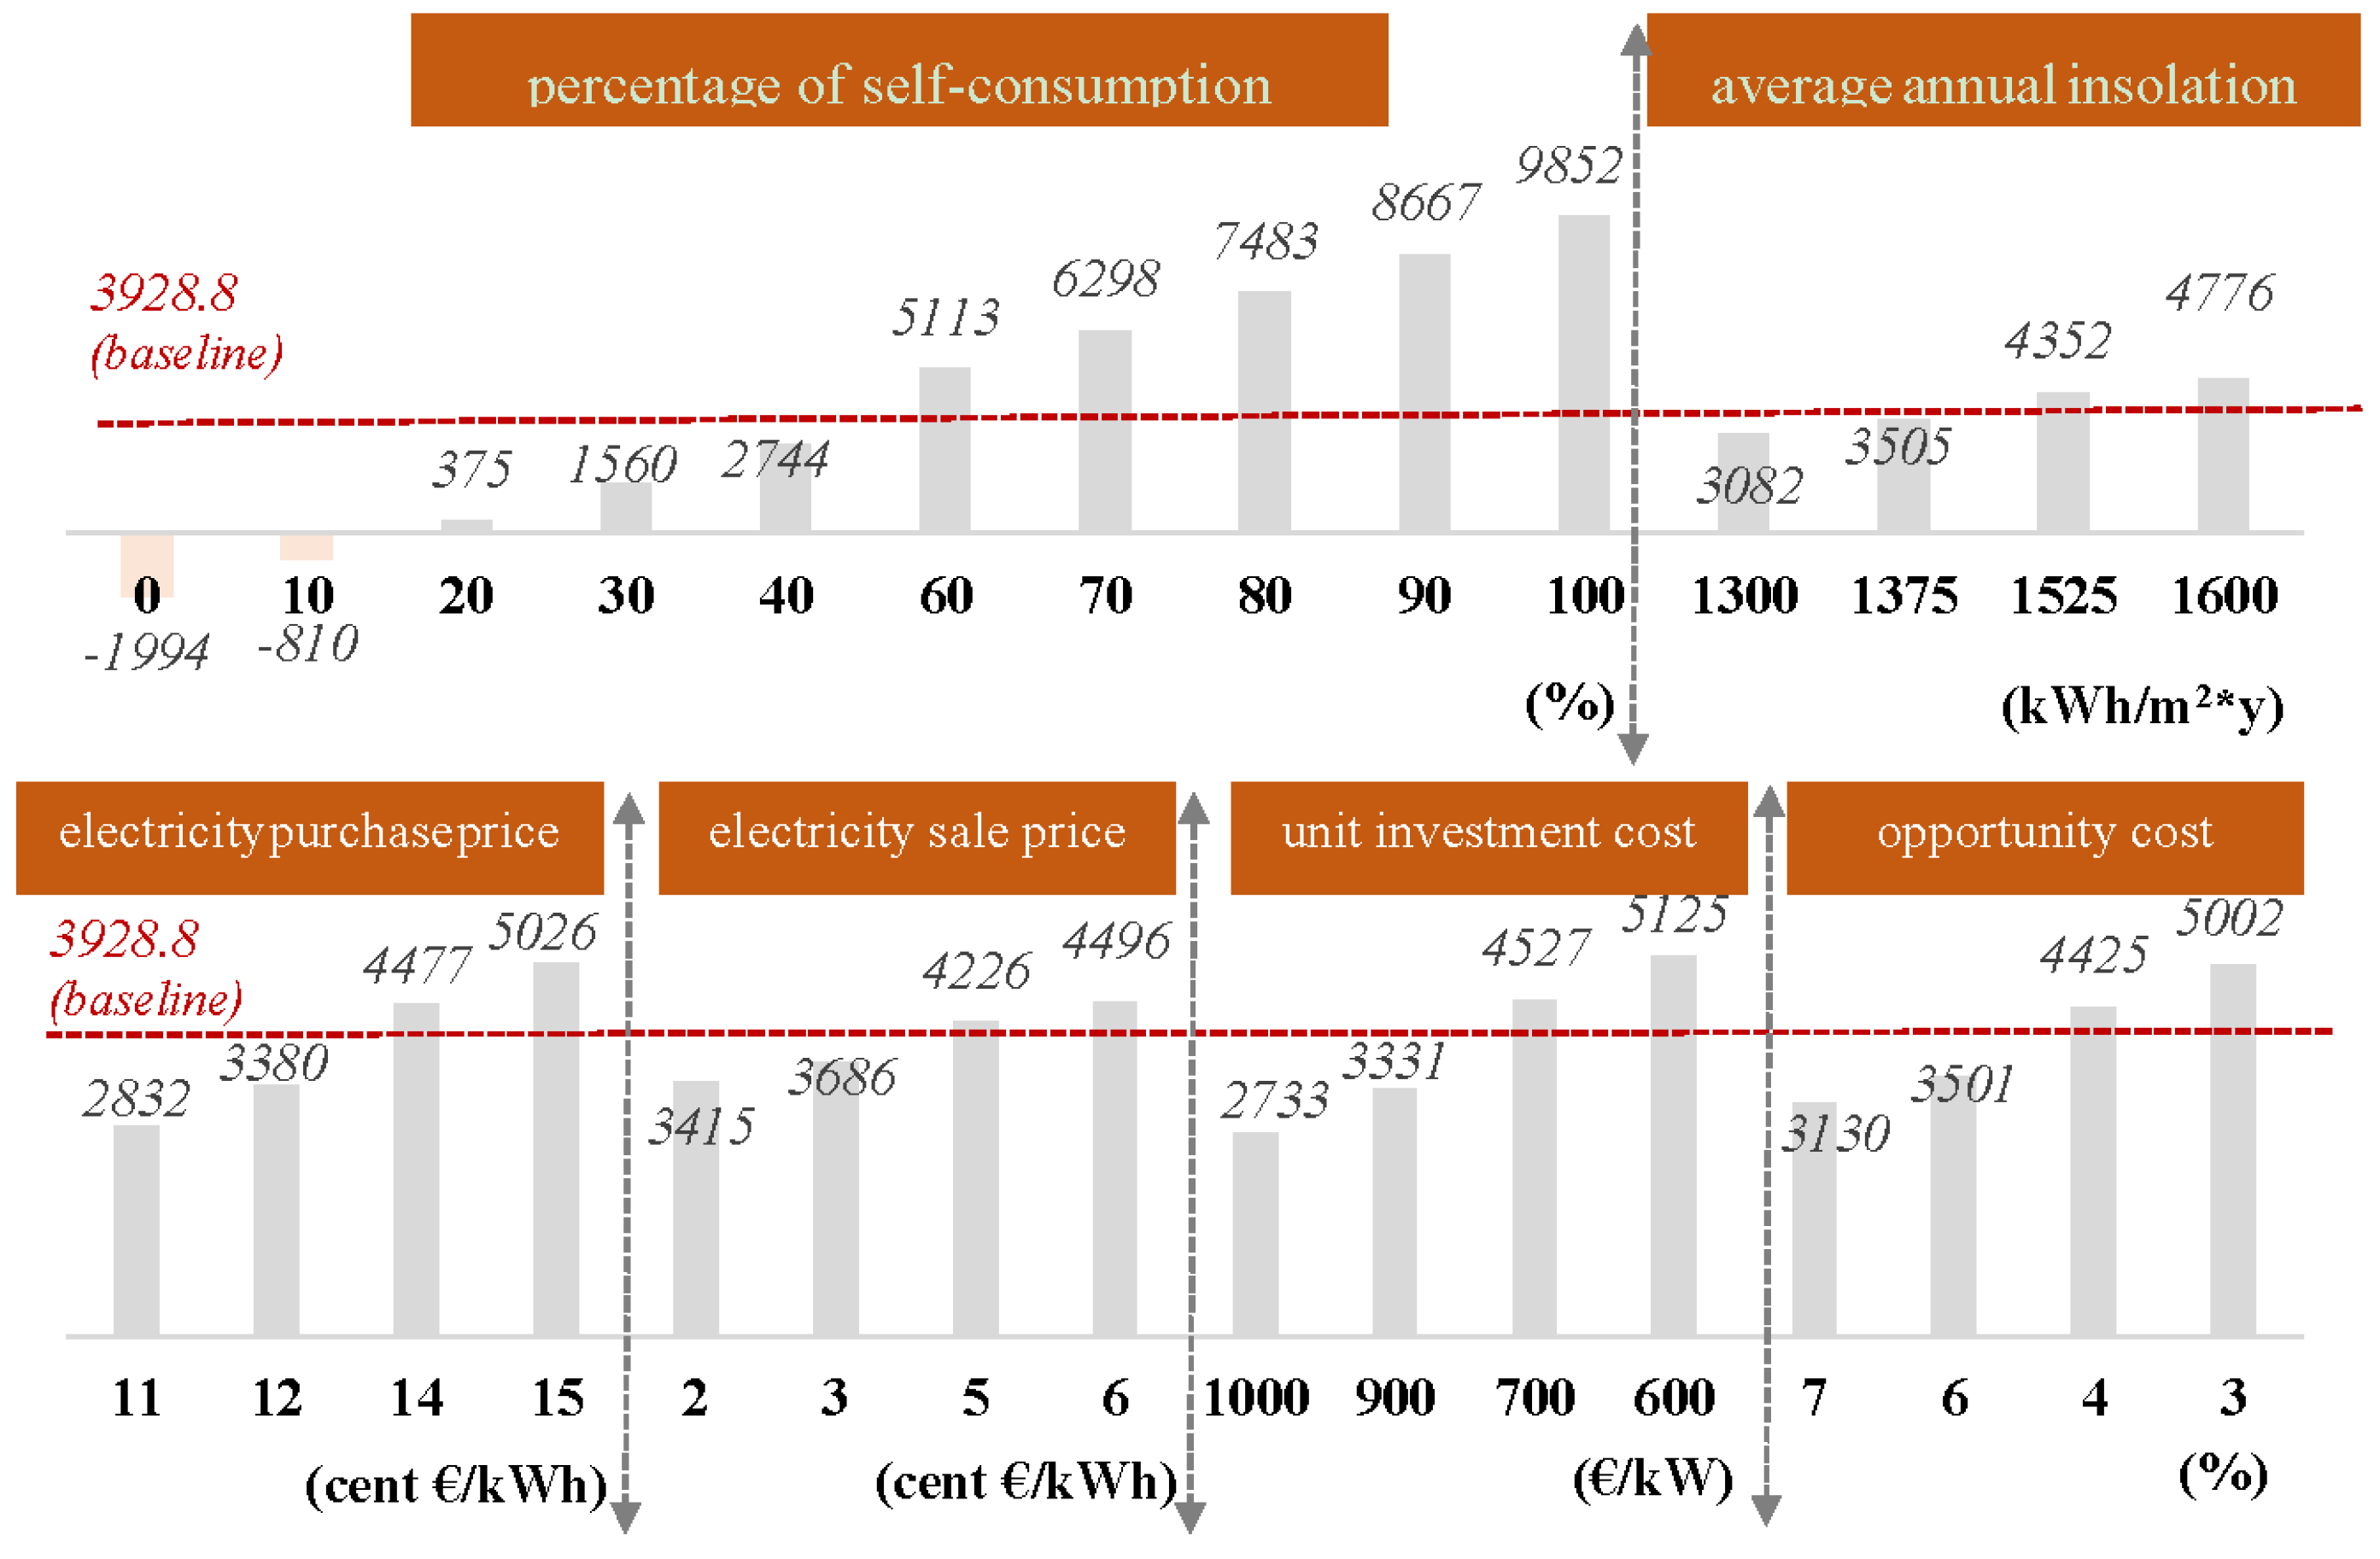
The obtained results are related to hypotheses on input variables. Hence, a strong variance of the expected economic profitability results could occur. This limit can be addressed by implementing a sensitivity analysis on critical variables [43]. In this sense, such an analysis is able to define dynamic scenarios, in line with similar studies [13,24]. The assessment can be done by considering different plant dimensions, such as 200 kW (Figure 2), 400 kW (Figure 3), 1 MW (Figure 4) and 5 MW (Figure 5) and sensitivity analysis is performed, varying only one critical variable:
  • Percentage of self-consumed energy ( ω self , c ), assesses the level of harmonization between consumption and production of energy. This variable is relevant for the economic feasibility assessment. Based on both consumption behaviours and change adaptation of investors different scenarios are defined, with additional increments of about 10% (in extreme cases, ωself,c is equal to 0% if all the produced energy is sold, and equal to 100% if all the produced energy is consumed).
  • Average annual insolation (tr), assesses the level of insolation of the plant. Italy, because its conformation, presents different insolation levels. Hence, respect to the base value of about 1450 kWh/m2 per year, four scenarios are considered, two pessimistic (1300 kWh/m2·y and 1375 kWh/m2·y), and two optimistic (1525 kWh/m2·y and 1600 kWh/m2·y) ones, where extreme values characterize the country’s northern and southern regions respectively.
  • Annual electricity purchase price (pc), assesses the reduction of electrical energy costs reported in the energy bill. This is the main revenue item in non-incentivized contexts. An increment of pc is a positive scenario for PV investors. Variations are in the range of about 1–2 cent €/kWh, both in positive and negative terms. Given that, this variable can assume values going from 11 cent €/kWh up to 12 cent €/kWh (pessimistic scenarios), or 14 cent €/kWh up to 15 cent €/kWh (optimistic scenarios).
  • Annual electricity sales price (ps), assesses incomes coming from the selling of extra energy. This is similar to the previous variable and, so, it has the same variation. For example, ps (that in the baseline scenario with a 5 MW plant can be equal to 3.9 cent €/kWh, can reach values going from 2 cent €/kWh and 3 cent €/kWh (pessimistic scenarios), or 5 cent €/kWh and 6 cent €/kWh (optimistic scenarios).
  • Unitary investment cost (Cinv,unit), saw a drastic reduction during the last years. Hence, it is possible to hypothesize reductions from 100 up to 200 € if compared to basic scenarios. However, these optimistic scenarios are compared to pessimistic ones where a reduction of the same value (for example, Cinv,unit related to a 200 kW plant-equal to 1280 €/kW in the basic scenario–is considered equal to 1100 €/kW and 1200 €/kW in optimistic scenarios, or 1400 €/kW and 1500 €/kW in pessimistic scenarios).
  • Opportunity cost (r), assesses a measure of the return coming from an alternative investment similar to the considered one in terms of risk level. If compared to the basic value (5%), some increases and decreases of about 1% and 2% are assessed.
The investments profitability is verified in 91% of scenarios taken into consideration and is strongly linked to the energy self-consumption level. The self-consumption variable has a significant role and it is possible to estimate its breakeven point value explaining the investment profitability:
  • 35% for 200 kW plant;
  • 18% for 400 kW plant;
  • 24% for 1 MW plant;
  • 17% for 5 MW plant.
Figure 2. Sensitivity analysis–NPV (k€) for a 200 kW power system. NPV: net present value.
Energies 08 12350 g002
Figure 3. Sensitivity analysis–NPV (k€) for a 400 kW power system.
Energies 08 12350 g003
Figure 4. Sensitivity analysis–NPV (k€) for a 1 MW power system.
Energies 08 12350 g004
Figure 5. Sensitivity analysis–NPV (k€) for a 5 MW power system.
Energies 08 12350 g005
Consequently, eleven of the assessed scenarios presented a negative NPV. Today, the idea to implement a PV plant up to sell the entire energy produced is not feasible. In fact, these scenarios are unprofitable. Specifically, in an industrial context, even the comparison among different plant dimensions is useless. In fact, they are selected only in function of the energy consumption. In this view, actors involved in the solar market tend to sell even less products and even more to sell services [53,54].
This work defined that the installation of a PV plant, if compared to the purchase of electric energy from the grid, is convenient and the advantage increases if the self-consumption of energy increases. Going from 50% up to 60% self-consumption, 200 kW and 400 kW plants improve their NPV of about 180 € per kW installed (NPV equal to 93 k€ and 180 k€, respectively). Instead, 1 MW and 5 MW plants increase their NPV of about 240 € per installed kW (NPV equal to 892 k€ and 5113 k€, respectively). This is caused by the selling prices of energy that characterize 1 MW and 5 MW plants, which in fact, as highlighted in Table 2, is lower for these facilities. Figure 6 reports the increase of financial results corresponding to an increase of self-consumed energy. It is clear that, independently from the analysed size, profitable results are reachable (see Table 1). As evidenced in Section 1, technological solutions (e.g., ESS and/or DSM) suitable to this scope were presented in several scientific papers, but an economic feasibility is required to guarantee their diffusion. This work quantifies the revenue increases. For example, in a 200 kW plant they are equal to 27 k€ (if the adopted solution allows a 10% increase of the self-consumed energy) or 73 k€ (if the increase is equal to 20%), in a baseline scenario where it is equal to 50%. This cash inflow would be compared to investment and operational costs related to that technologies for the definition of the economic feasibility. Furthermore, the obtained results from the sensitivity analysis can even influence initial choices of the PV plant sizing. In fact, starting from the calculation of the energy consumption trend, and from the related distribution in several days of the year, the choice can be an undersized plant, by opting for a reduction in investments. However, that solution could be disadvantageous because of a series of aspects: (i) the non-exploitation of available economies of scale; (ii) the non-fulfilment of energetic peaks caused by their own energy demand; (iii) the non-consideration of future scenarios where energy demand could be synchronized with the PV plant production.
Figure 6. Sensitivity analysis–NPV/Power (€/kW) in function of percentage of self-consumption.
Energies 08 12350 g006
As evidenced in Section 3, investment costs were reduced in a relevant way, thus increasing the solar market competitiveness. Whenever the unitary investment cost is reduced of about 100 €/kW, an NPV increase of about 90–120 € per kW installed follows. In fact, by considering a 200 kW plant, NPV is equal to 75 k€ and 775 k€ in a 1 MW plant. A previous survey evidenced that the selling price of a PV plant depends by several aspects [55]. Today, companies that are better positioned in the market are the structured ones that, relying on their technological and managerial expertise, can successfully gain share of foreign markets and continue to preside over a national market, which does not have the volumes of past years but is still attractive.
Results show that 200 kW and 400 kW plants constructed in regions with an insolation rate higher than 75 kWh/m2 per year compared to the baseline scenario present an higher NPV of about 100 € per kW installed (NPV equal to 76 k€ and 276 k€ respectively). 1 MW and 5 MW have a less relevant increase equal to 85 € per kW installed, even because of the different selling price (NPV equal to 740 k€ and 4352 k€, respectively). Investments in southern regions are more advantageous, but data in Section 2.1 shows as northern regions invest more. Hence, for southern regions, there exists an opportunity that, currently, is not exploited.
Regarding the electricity selling price, an increase equal to 1 cent €/kWh determines an improvement in NPV of about 40–60 € per kW installed. In fact, by considering a 200 kW plant, NPV is equal to 64 k€ and 715 k€ in a 1 MW plant. The national energetic policy highly influences this value. If a high purchasing price is applied, a centralized system is favoured and the non-consumed energy is valued more, particularly with the use of net metering services. Instead, when a low value is adopted, the delta profit coming from the non-consumed energy is reduced. Hence, this pushes consumers to synchronize their consumptions basing on most productive hours.
Future scenarios where energy bill costs will be higher than now push consumers to implement PV plants. In fact, in the presence of an increase of about 1 cent €/kWh, avoided costs tend to increase and NPV goes up of 110 € per kW installed. For example, by considering a 200 kW plant, NPV is equal to 78 k€ and 765 k€ in a 1 MW plant. The political approach at the base of this variable is, hence, to ask for a higher energy fee from actors using a more polluting energetic mix. This way, they are pushed towards more sustainable plants. Avoided costs on the energetic bill are the main revenue item. However, the great influence on results arises from the percentage of self-consumed energy, and not from the electricity purchase price.
The opportunity cost of capital is assessed in different scenarios, because an alternative value can be selected basing on national macro-economic conditions, the type of investor and the investment reference industrial sector. For example, by considering a lower value of about 4%, the NPV related to a 200 kW plant is equal to 71 k€, while is equal to 4425 k€ for a 5 MW plant. By consequence, the range variation is contained between 75 € and 100 € per installed kW.

5. Discussion and Policy Implications

PV is a policy-driven market. In fact, some countries that adopted new FiT policies are characterized by a significant increase of their markets. Instead, other countries that declined political support for PV are characterized by a reduction of their markets. The economic crisis characterizing a great part of the European landscape can be matched by exploiting the green economy as a restarting engine (as highlighted by acts of the conference titled “Circular Economy: boosting business, reducing waste” organised by European Commission on 25 June 2015 [56]). Renewable energy progress reports released by European Commission on 16 June 2015 define that “the sun is the World’s primary source of energy, and a clean energy source for heat or electricity”. The increases of installed PV power, and the simultaneous reduction of European weight in the global mix, demonstrate as these energy choices are taken also from non-European countries.
This paper confirms that the objectives of environmental protection and economic profit can co-exist investing in PV plants. Furthermore, the development of RES contributes to the achievement of greater energy independence. The analysis of the Italian market is particularly interesting since it is a mature market, useful to underline the following points:
  • The incentivizing policy favoured the sector development and, together with efforts done by the actors involved in the whole supply chain, allowed it to achieve great results in terms of very advantageous investment costs proposed to their customers;
  • The use of PV panels, together with heat pumps, can be economically feasible when the thermal energy purchase price is at least higher than the electricity selling price;
  • The development of hybrid plants, typically coupled with biomass–characterised by a non-intermittent nature, could be adequate for an industrial context with high-energy consumptions in the evening hours. In that sense, an important role is played by ESS, even if they are currently characterised by high costs;
  • SEUs can constitute an important opportunity, by focusing on the increase of self-consumption. In the current state, there are some regulation doubts, (it is applied only for mono-user plants), and debates about possible imbalances on distribution network burdens are still without an answer;
  • PV investments may be undertaken as an increase of the overall sustainability of the firm and, hence, the improvement of the external brand image (also when PV plant’s profits to be not in line with company’s benchmarks);
  • The net metering service can offer interesting opportunities and the increase from 200 kW to 500 kW defined by the government is a positive signal, but has to be related to both bureaucratic simplifications and reduction of uncertainty in regulations;
  • Unitary tax deduction, set at 50%, is the legislative support for such investments; the basic rate is, in fact, 36%. This policy measure is defined as strategic for the residential sector.
During the incentives period the plants dimensions were selected also for speculative aims, because of the high economic return given by these investments. In the last years, a secondary market was developed, in which existing PV plants were bought up in order to obtain greater economic returns through the increase of their efficiency with new technological solutions.
The results of this paper define that:
  • The profitability of PV systems is strictly linked to the self-consumption share in non-subsidized electricity markets, in which electricity purchase price (or savings on the energy bill) is greater than the electricity selling price;
  • Sensitivity analysis, considering different ranges of several critical variables, provides a solid foundation to the obtained results. The profitability is verified in several scenarios;
  • Revenues derived from an increase of self-consumption can be used in order to evaluate the relative costs of alternative solutions, such as: (i) integrated PV-battery systems and/or (ii) integrated PV-HP systems.
Future research will aim to assess the profitability of these alternative scenarios.

6. Conclusions

The PV sector registered in the last years significant changes. The growth was exponential, initially developing in European regions such as Germany and Italy, and widely spreading in the last years in China, USA and Japan. The non-intermittent production, that initially represented a strong limitation, today is seen as a simple disadvantage. The scientific literature has confirmed the sustainability of this source. Again, the adoption of incentivizing policies has improved the maturity level of the sector and its competitiveness.
This work specifically assessed the Italian context that, being one of the leading nations in the sector, can offer valid elements of reflection. Past criticisms against this sector were essentially three: (i) incentives that, initially, were offered basing on the energy produced by a PV plant and not on the quantity of energy delivered to the grid; (ii) very high incentive values were subsequently translated into cost items on the energy bill of the users; and (iii) incentives did not favour only strategic investments, but also speculative behaviours with big plants that converted agricultural lands with the only aim to sell electrical energy to the grid. It is possible to reach relevant economic results, only when there is a harmonization between energetic consumption and production. From the PV plant manufacturer side, there is the need to increasingly focus on the selling of services. From the PV plant buyer side, the most promising strategy can be the gathering of economic profits from this investment and the improvement of the green image of their brand.
The productions of guaranteed and clean energy, together with economic chances, offer the PV sector a strategic role within the national energy mix. After a relevant growth, 2014 and the beginning of 2015 saw a critical decrease, also caused by administrative uncertainties and above-cited criticisms. This paper has demonstrated that PV systems can represent an investment with interesting perspectives and limited risks, even in a non-subsidised market. Given that the mission of incentive schemes is to support the development of the sector until it becomes competitive, and it is not a perpetual assistance, consequently all countries will see the elimination of incentives. PV systems contribute to sustainable development and are a strategic player in the global electricity market. Since the electricity contributes more than any other power sector to reduce the share of fossil fuels in the global energy mix, consequently PV energy will deliver clean, safe and affordable energy to the greater number of citizens all over the world. Even if the residential sector can offer a valid contribution in reaching sustainability targets, the industrial sector involvement—characterized by bigger plants—is needed. An investment in PV plants makes economic sense and this work has considered multiple application cases supporting this affirmation, even in non-incentivized markets. Results highlight that the profitability is strictly linked to the self-consumption share and consumers can maximize the profits when using the energy in the periods of greatest solar productivity and/or have intelligent machinery. In conclusion, this paper defines that the profitability of PV in industrial applications does not depend on potential sales to the wholesale electricity market, but rather on energy bill savings through self-consumption.

Author Contributions

All authors equally contributed to the development of the concepts presented in this paper.

Conflicts of Interest

The authors declare no conflict of interest.

Nomenclature

AcellActive surface
bosBalance of system
CDiscounted cash flows
CaeAdministrative and electrical connection cost
CassAssurance cost
CinvTotal investment cost
Cinv,unitUnitary investment cost
ClcsLoan capital share cost
ClisLoan interest share cost
CmMaintenance cost
CriReplacement inverter cost
CtaxTaxes
DCFDiscounted Cash Flow
dEfDecrease efficiency of system
DPBTDiscounted payback time
DSMDemand side management
EfEfficiency of system
E cd PV Emissions released by a PV plant per unit of produced energy
E cd FF Emissions released by fossil fuels per unit of produced energy
ERcdReduction of carbon dioxide emissions
EOutEnergy output of the system
EPIAEuropean Photovoltaic Industry Association
ESSEnergy storage system
FiTFeed-in Tariff
GSEGestore Servizi Energetici
HPHeat pump
IDiscounted cash inflows
infRate of inflation
infelRate of energy inflation
KfOptimum angle of tilt
NLifetime PV system
NdebtPeriod of loan
NPVNet present value
ȠbosBos efficiency
ƞfNumber of PV modules to be installed
ƞmModule efficiency
ODiscounted cash outflows
pcElectricity purchase price
psElectricity sales price
PCassPercentage of assurance cost
PCiPercentage of inverter cost
PCmPercentage of maintenance cost
PCtaxpercentage of taxes
PfNominal power of a PV module
PRPerformance Ratio
PVPhotovoltaic
rOpportunity cost of capital
rdInterest rate on loan
RESRenewable energy system
SCelSaving energy internal consumption
SCCSocial Cost of Carbon
SEUEfficient Systems for Users
SPelSale of energy not for internal consumption
tSingle period
trAverage annual insolation
xcAmount of self-consumed electricity
xsAmount of electricity sold to the grid
ω self , c Percentage of energy self-consumption
ω sold Percentage of the produced energy sold to the grid

References

  1. Lacerda, J.S.; van den Bergh, J.C.J.M. International Diffusion of Renewable Energy Innovations: Lessons from the Lead Markets for Wind Power in China, Germany and USA. Energies 2014, 7, 8236–8263. [Google Scholar] [CrossRef]
  2. Cuellar, A.D.; Herzog, H. A Path Forward for Low Carbon Power from Biomass. Energies 2015, 8, 1701–1715. [Google Scholar] [CrossRef]
  3. Feldpausch-Parker, A.M.; Burnham, M.; Melnik, M.; Callaghan, M.L.; Selfa, T. News Media Analysis of Carbon Capture and Storage and Biomass: Perceptions and Possibilities. Energies 2015, 8, 3058–3074. [Google Scholar] [CrossRef]
  4. Re Rebaudengo, A. Ripensare il mercato elettrico: Evoluzione industriale e convergenza Europea. In Proceedings of the Convegno assoRinnovabili, Roma, Italy, 25 March 2015. (In Italian)
  5. European Photovoltaic Industry Association. Europe’s solar market falls over 30 percent in 2014 as global solar installations continue to grow. In Proceedings of the 10th Annual Market Workshop of the European Photovoltaic Industry Association, Brussels, Belgium, 26 March 2015.
  6. Tsai, H.-L. Design and Evaluation of a Photovoltaic/Thermal-Assisted Heat Pump Water Heating System. Energies 2014, 7, 3319–3338. [Google Scholar] [CrossRef]
  7. Renno, C.; de Giacomo, M. Dynamic Simulation of a CPV/T System Using the Finite Element Method. Energies 2014, 7, 7395–7414. [Google Scholar] [CrossRef]
  8. Marcos, J.; de la Parra, I.; García, M.; Marroyo, L. Control Strategies to Smooth Short-Term Power Fluctuations in Large Photovoltaic Plants Using Battery Storage Systems. Energies 2014, 7, 6593–6619. [Google Scholar] [CrossRef]
  9. Luthander, R.; Widén, J.; Nilsson, D.; Palm, J. Photovoltaic self-consumption in buildings: A review. Appl. Energy 2015, 142, 80–94. [Google Scholar] [CrossRef]
  10. Pascual, J.; Sanchis, P.; Marroyo, L. Implementation and Control of a Residential Electrothermal Microgrid Based on Renewable Energies, a Hybrid Storage System and Demand Side Management. Energies 2014, 7, 210–237. [Google Scholar] [CrossRef]
  11. Song, G.; Chen, H.; Guo, B. A Layered Fault Tree Model for Reliability Evaluation of Smart Grids. Energies 2014, 7, 4835–4857. [Google Scholar] [CrossRef]
  12. Rodríguez-Molina, J.; Martínez-Núñez, M.; Martínez, J.-F.; Pérez-Aguiar, W. Business Models in the Smart Grid: Challenges, Opportunities and Proposals for Prosumer Profitability. Energies 2014, 7, 6142–6171. [Google Scholar] [CrossRef]
  13. Xavier, G.; Filho, D.; Martins, J.; Monteiro, P.; Diniz, A. Simulation of Distributed Generation with Photovoltaic Microgrids—Case Study in Brazil. Energies 2015, 8, 4003–4023. [Google Scholar] [CrossRef]
  14. Sbordone, D.A.; Martirano, L.; Falvo, M.C.; Chiavaroli, L.; di Pietra, B.; Bertini, I.; Genovese, A. Reactive power control for an energy storage system: A real implementation in a Micro-Grid. J. Netw. Comput. Appl. 2015, in press. [Google Scholar] [CrossRef]
  15. Dolara, A.; Grimaccia, F.; Leva, S.; Mussetta, M.; Ogliari, E. A Physical Hybrid Artificial Neural Network for Short Term Forecasting of PV Plant Power Output. Energies 2015, 8, 1138–1153. [Google Scholar] [CrossRef] [Green Version]
  16. Rahmann, C.; Castillo, A. Fast frequency response capability of photovoltaic power plants: The necessity of new grid requirements and definitions. Energies 2014, 7, 6306–6322. [Google Scholar] [CrossRef]
  17. Cucchiella, F.; D’Adamo, I. Residential photovoltaic plant: Environmental and economical implications from renewable support policies. Clean Technol. Environ. Policy 2015, 17, 1929–1944. [Google Scholar] [CrossRef]
  18. Ghosh, S.; Nair, A.; Krishnan, S.S. Techno-economic review of rooftop photovoltaic systems: Case studies of industrial, residential and off-grid rooftops in Bangalore, Karnataka. Renew. Sustain. Energy Rev. 2015, 42, 1132–1142. [Google Scholar] [CrossRef]
  19. Gao, A.M.-Z.; Fan, C.-T.; Kai, J.-J.; Liao, C.-N. Sustainable photovoltaic technology development: Step-by-step guidance for countries facing PV proliferation turmoil under the feed-in tariff scheme. Renew. Sustain. Energy Rev. 2015, 43, 156–163. [Google Scholar] [CrossRef]
  20. Hasan, A.; McCormack, S.J.; Huang, M.J.; Norton, B. Energy and Cost Saving of a Photovoltaic-Phase Change Materials (PV-PCM) System through Temperature Regulation and Performance Enhancement of Photovoltaics. Energies 2014, 7, 1318–1331. [Google Scholar] [CrossRef]
  21. Mundo-Hernández, J.; de Celis Alonso, B.; Hernández-Álvarez, J.; de Celis-Carrillo, B. An overview of solar photovoltaic energy in Mexico and Germany. Renew. Sustain. Energy Rev. 2014, 31, 639–649. [Google Scholar] [CrossRef]
  22. Chiaroni, D.; Chiesa, V.; Colasanti, L.; Cucchiella, F.; D’Adamo, I.; Frattini, F. Evaluating solar energy profitability: A focus on the role of self-consumption. Energy Convers. Manag. 2014, 88, 317–331. [Google Scholar] [CrossRef]
  23. Pötzinger, C.; Preißinger, M.; Brüggemann, D. Influence of Hydrogen-Based Storage Systems on Self-Consumption and Self-Sufficiency of Residential Photovoltaic Systems. Energies 2015, 8, 8887–8907. [Google Scholar] [CrossRef]
  24. Squatrito, R.; Sgroi, F.; Tudisca, S.; Trapani, A.M.D.; Testa, R. Post feed-in scheme photovoltaic system feasibility evaluation in Italy: Sicilian case studies. Energies 2014, 7, 7147–7165. [Google Scholar] [CrossRef]
  25. Terna Statistical Prevision. Available online: http://www.terna.it/ (accessed on 3 June 2015).
  26. Purchase/Resale & Net Metering. Available online: http://www.gse.it/ (accessed on 3 June 2015).
  27. Machol, B.; Rizk, S. Economic value of U.S. fossil fuel electricity health impacts. Environ. Int. 2013, 52, 75–80. [Google Scholar] [CrossRef] [PubMed]
  28. Dale, A.T.; Pereira de Lucena, A.F.; Marriott, J.; Borba, B.S.M.C.; Schaeffer, R.; Bilec, M.M. Modeling future life-cycle greenhouse gas emissions and environmental impacts of electricity supplies in Brazil. Energies 2013, 6, 3182–3208. [Google Scholar] [CrossRef]
  29. Hardisty, P.E.; Clark, T.S.; Hynes, R.G. Life cycle greenhouse gas emissions from electricity generation: A comparative analysis of Australian energy sources. Energies 2012, 5, 872–897. [Google Scholar] [CrossRef]
  30. Cucchiella, F.; D’Adamo, I. Issue on supply chain of renewable energy. Energy Convers. Manag. 2013, 76, 774–780. [Google Scholar] [CrossRef]
  31. Cucchiella, F.; D’Adamo, I. Estimation of the energetic and environmental impacts of a roof-mounted building-integrated photovoltaic systems. Renew. Sustain. Energy Rev. 2012, 16, 5245–5259. [Google Scholar] [CrossRef]
  32. Cucchiella, F.; D’Adamo, I.; Gastaldi, M. Financial analysis for investment and policy decisions in the renewable energy sector. Clean Technol. Environ. Policy 2015, 17, 887–904. [Google Scholar] [CrossRef]
  33. Edenhofer, O.; Pichs-Madruga, R.; Sokona, Y.; Seyboth, K.; Kadner, S.; Zwickel, T.; Eickemeier, P.; Hansen, G.; Schlömer, S.; von Stechow, C.; et al. Renewable energy sources and climate change mitigation. In Special Report Prepared by Working Group III of the Intergovernmental Panel on Climate Change; Cambridge University Press: Cambridge, UK, 2012. [Google Scholar]
  34. Thiel, C.L.; Campion, N.; Landis, A.E.; Jones, A.K.; Schaefer, L.A.; Bilec, M.M. A materials life cycle assessment of a net-zero energy building. Energies 2013, 6, 1125–1141. [Google Scholar] [CrossRef]
  35. PV Cycle Annual Report 2012. Available online: http://www.pvcycle.org/ (accessed on 3 June 2015).
  36. Cucchiella, F.; D’Adamo, I.; Rosa, P. End-of-Life of used photovoltaic modules: A financial analysis. Renew. Sustain. Energy Rev. 2015, 47, 552–561. [Google Scholar] [CrossRef]
  37. Choi, J.-K.; Fthenakis, V. Crystalline silicon photovoltaic recycling planning: Macro and micro perspectives. J. Clean. Prod. 2014, 66, 443–449. [Google Scholar] [CrossRef]
  38. Cucchiella, F.; D’Adamo, I.; Lenny Koh, S.C.; Rosa, P. Recycling of WEEEs: An economic assessment of present and future e-waste streams. Renew. Sustain. Energy Rev. 2015, 51, 263–272. [Google Scholar] [CrossRef]
  39. Mandell, S. Carbon emission values in cost benefit analyses. Transp. Policy 2011, 18, 888–892. [Google Scholar] [CrossRef]
  40. Cucchiella, F.; D’Adamo, I.; Gastaldi, M.; Koh, L.S.C. Renewable energy options for buildings: Performance evaluations of integrated photovoltaic systems. Energy Build. 2012, 55, 208–217. [Google Scholar] [CrossRef]
  41. Cucchiella, F.; D’Adamo, I.; Gastaldi, M. Sustainable management of waste-to-energy facilities. Renew. Sustain. Energy Rev. 2014, 33, 719–728. [Google Scholar] [CrossRef]
  42. Bortolini, M.; Gamberi, M.; Graziani, A.; Mora, C.; Regattieri, A. Multi-parameter analysis for the technical and economic assessment of photovoltaic systems in the main European Union countries. Energy Convers. Manag. 2013, 74, 117–128. [Google Scholar] [CrossRef]
  43. Cucchiella, F.; D’Adamo, I. Feasibility study of developing photovoltaic power projects in Italy: An integrated approach. Renew. Sustain. Energy Rev. 2012, 16, 1562–1576. [Google Scholar] [CrossRef]
  44. Cucchiella, F.; D’Adamo, I.; Gastaldi, M. Modeling optimal investments with portfolio analysis in electricity markets. Energy Educ. Sci. Technol. Part A Energy Sci. Res. 2012, 30, 673–692. [Google Scholar]
  45. Cucchiella, F.; D’Adamo, I.; Gastaldi, M. Optimizing plant size in the planning of renewable energy portfolios. Lett. Spat. Resour. Sci. 2015. [Google Scholar] [CrossRef]
  46. Cucchiella, F.; D’Adamo, I. A Multicriteria Analysis of Photovoltaic Systems: Energetic, Environmental, and Economic Assessments. Int. J. Photoenergy 2015, 2015. [Google Scholar] [CrossRef]
  47. Sgroi, F.; Tudisca, S.; di Trapani, A.M.; Testa, R.; Squatrito, R. Efficacy and efficiency of Italian energy policy: The case of PV systems in greenhouse farms. Energies 2014, 7, 3985–4001. [Google Scholar] [CrossRef]
  48. Liu, Z.; Zhang, W.; Zhao, C.; Yuan, J. The Economics of Wind Power in China and Policy Implications. Energies 2015, 8, 1529–1546. [Google Scholar] [CrossRef]
  49. Wissem, Z.; Gueorgui, K.; Hédi, K. Modeling and technical–economic optimization of an autonomous photovoltaic system. Energy 2012, 37, 263–272. [Google Scholar] [CrossRef]
  50. Huld, T.; Amillo, A. Estimating PV Module Performance over Large Geographical Regions: The Role of Irradiance, Air Temperature, Wind Speed and Solar Spectrum. Energies 2015, 8, 5159–5181. [Google Scholar] [CrossRef] [Green Version]
  51. Reich, N.H.; Mueller, B.; Armbruster, A.; van Sark, W.G.J.H.M.; Kiefer, K.; Reise, C. Performance ratio revisited: Is PR > 90% realistic? Progress Photovolt. Res. Appl. 2012, 20, 717–726. [Google Scholar] [CrossRef]
  52. Cucchiella, F.; D’Adamo, I.; Koh, L.S.C. Environmental and economic analysis of building integrated photovoltaic systems in Italian regions. J. Clean. Prod. 2015, 98, 241–252. [Google Scholar] [CrossRef]
  53. Rosa, P.; Terzi, S. Proposal of a global product development strategy assessment tool and its application in the Italian industrial context. Int. J. Prod. Lifecycle Manag. 2014, 7, 266–291. [Google Scholar] [CrossRef]
  54. Copani, G.; Rosa, P. DEMAT: Sustainability assessment of new flexibility-oriented business models in the machine tools industry. Int. J. Comput. Integr. Manuf. 2014, 28, 408–417. [Google Scholar] [CrossRef]
  55. Chiaroni, D.; Chiesa, M.; Chiesa, V.; Cucchiella, F.; D’Adamo, I.; Frattini, F. An Analysis of Supply Chains in Renewable Energy Industries: A Survey in Italy. In Sustainable Future Energy Technology and Supply Chains; Springer: Cham, Switzerland, 2015; pp. 47–71. [Google Scholar]
  56. European Commission. Circular Economy Boosting Business, Reducing Waste. Available online: http://ec.europa.eu/environment/circular.ecnomy/index_en.htm (accessed on 25 June 2015).