1. Introduction
Microbubbles (MBs) are very tiny bubbles in liquids, with diameters of several tens of micrometers [
1]. One typical use of MBs is water purification, achieved by increasing the dissolved oxygen concentration in polluted water. As an extension of the use of MBs to a wider range of applications, the recovery of fine particles [
2] and the precipitation of CaCO
3 using Ca(OH)
2 [
3] have been reported. This application is apparently related to a physical property of the MBs not found in ordinary bubbles in liquids, namely that the concentration of a specific gas in a liquid remains higher for longer if the gas is contained in MBs.
Equation (1) explains the stability of the size of MBs:
where, σ,
G, and
A are the surface tension, Gibbs free energy, and surface area, respectively, of a CO
2 bubble:
where,
is the concentration rate of CO
2 diffused in the
z direction (mol/m
2·s),
is the diffusion coefficient of CO
2 through the suspension (m
2/s),
is the CO
2 concentration difference (mol/m
3), and
is the length difference in the
z direction (m).
The surface tension (σ) increases as the surface area (
A) of the bubble decreases, if the energy (
G) in the two states is identical. Additionally, decreasing the surface area means decreasing the volume and floatation rate of the bubble. Therefore, MBs can remain suspended for longer than ordinary bubbles. The increased concentration of a gas in an aqueous phase enhances the diffusion rate. Fick’s first law of diffusion, presented in Equation (2), shows that the diffusion rate of CO
2 is enhanced in the
z direction, if the concentration of CO
2 increases. The impact of these qualities of MBs in increasing the concentration of a gas is different from that of ordinary bubbles (as is evident on breathing into water through a straw). We have reported that a microbubble generator (MBG) precipitated smaller calcium carbonate particles faster than an ordinary air diffuser with 3 cm diameter did [
3]. Feng
et al. [
4] also obtained smaller CaCO
3 particles by reducing the frit pore size used for CO
2 bubbling in a Ca(OH)
2 suspension: The carbonate mineralization (CM) method is used to fix CO
2 as a carbonate mineral (
i.e., CaCO
3). With this method, carbonates are formed as precipitates from the chemical reaction between CO
2 and alkali earth metals such as calcium [
5,
6,
7]. This method originated from a process for producing precipitated CaCO
3 [
8]. Although this chemical reaction is simple and well known, as pointed out by Haywood
et al. [
9], some consideration of the reaction rate and efficiency of metal extraction is needed to realize a successful CO
2 fixation method. Ca(OH)
2 or CaO (the dehydrated form of Ca(OH)
2) is the calcined form of CaCO
3 (formed by dissociation of CO
2 when heated above 900 K). Therefore, for the purpose of CO
2 fixation, Ca(OH)
2 is not a good choice as a calcium source. Naturally obtainable gypsum is a better calcium-supply material for CM than Ca(OH)
2 because gypsum does not emit CO
2 as it does not involve thermal decomposition. Previously, we examined CM using CaSO
4·2H
2O (gypsum) as the calcium source with a NaOH solution, and using CO
2 MBs. Our results confirmed the enhanced efficiency of the reaction with this calcium source [
10]. The crystal phases of gypsum, calcite, and portlandite were affected by the experimental conditions, such as differences in the concentration ratio of OH
− to Ca
2+. Herein, the particle size (PS) and specific surface area (SSA) of CaCO
3 (calcite) produced by CM from gypsum are compared with those of particles precipitated using the precipitated calcium carbonate (PCC) method with Ca(OH)
2 as the calcium source. Additionally, the effect of CO
2 bubble size of larger bubbles from an air diffuser (AD) and tiny bubbles from MBG on the PS and SSA was estimated by the results from the experiments and the reference [
4]. The PS and SSA results presented here for the PCC method are from our previous research [
11]. The results from the current study should be useful for designing a CM process to achieve two aims: effective CO
2 fixation, and production of CaCO
3 with properties useful for industrial use.
3. Results and Discussion
The average particle size of the raw gypsum was 42.9 μm (
Table 1). The initial pH of the gypsum suspension without NaOH solution was around 8.5. While the gypsum suspension circulated with CO
2 MBs at 0.8 L/min through the MBG, the pH of the suspension decreased to ~7 and remained stable from the 4th minute of the process. After 16 min of circulation, the size of the gypsum particles was 25 µm. This reduction in size was not introduced by CM because NaOH was not added to the gypsum suspension; this was not a favorable condition for production of carbonate ions. The reduction in PS was due to frequent and random collisions between the suspended particles, CO
2 MBs, and parts of the MBG, owing to the turbulent flow resulting from the high flow rate [
12]. The much smaller calcium-supply particles created by the MBs had much greater surface area and increased the reaction rates of both methods (CM and PCC). Ramachandran and Sharma [
13] showed that, in theory, smaller particles should enhance chemical reactions between gas and liquid phases.
After 100 mL of NaOH solution was added, the gypsum suspension and CO
2 MBs were circulated through the MBG. The particles were collected when the suspension was around pH 7 and steady (after about 13 min circulation). XRD analysis revealed that all the collected particles were calcite [
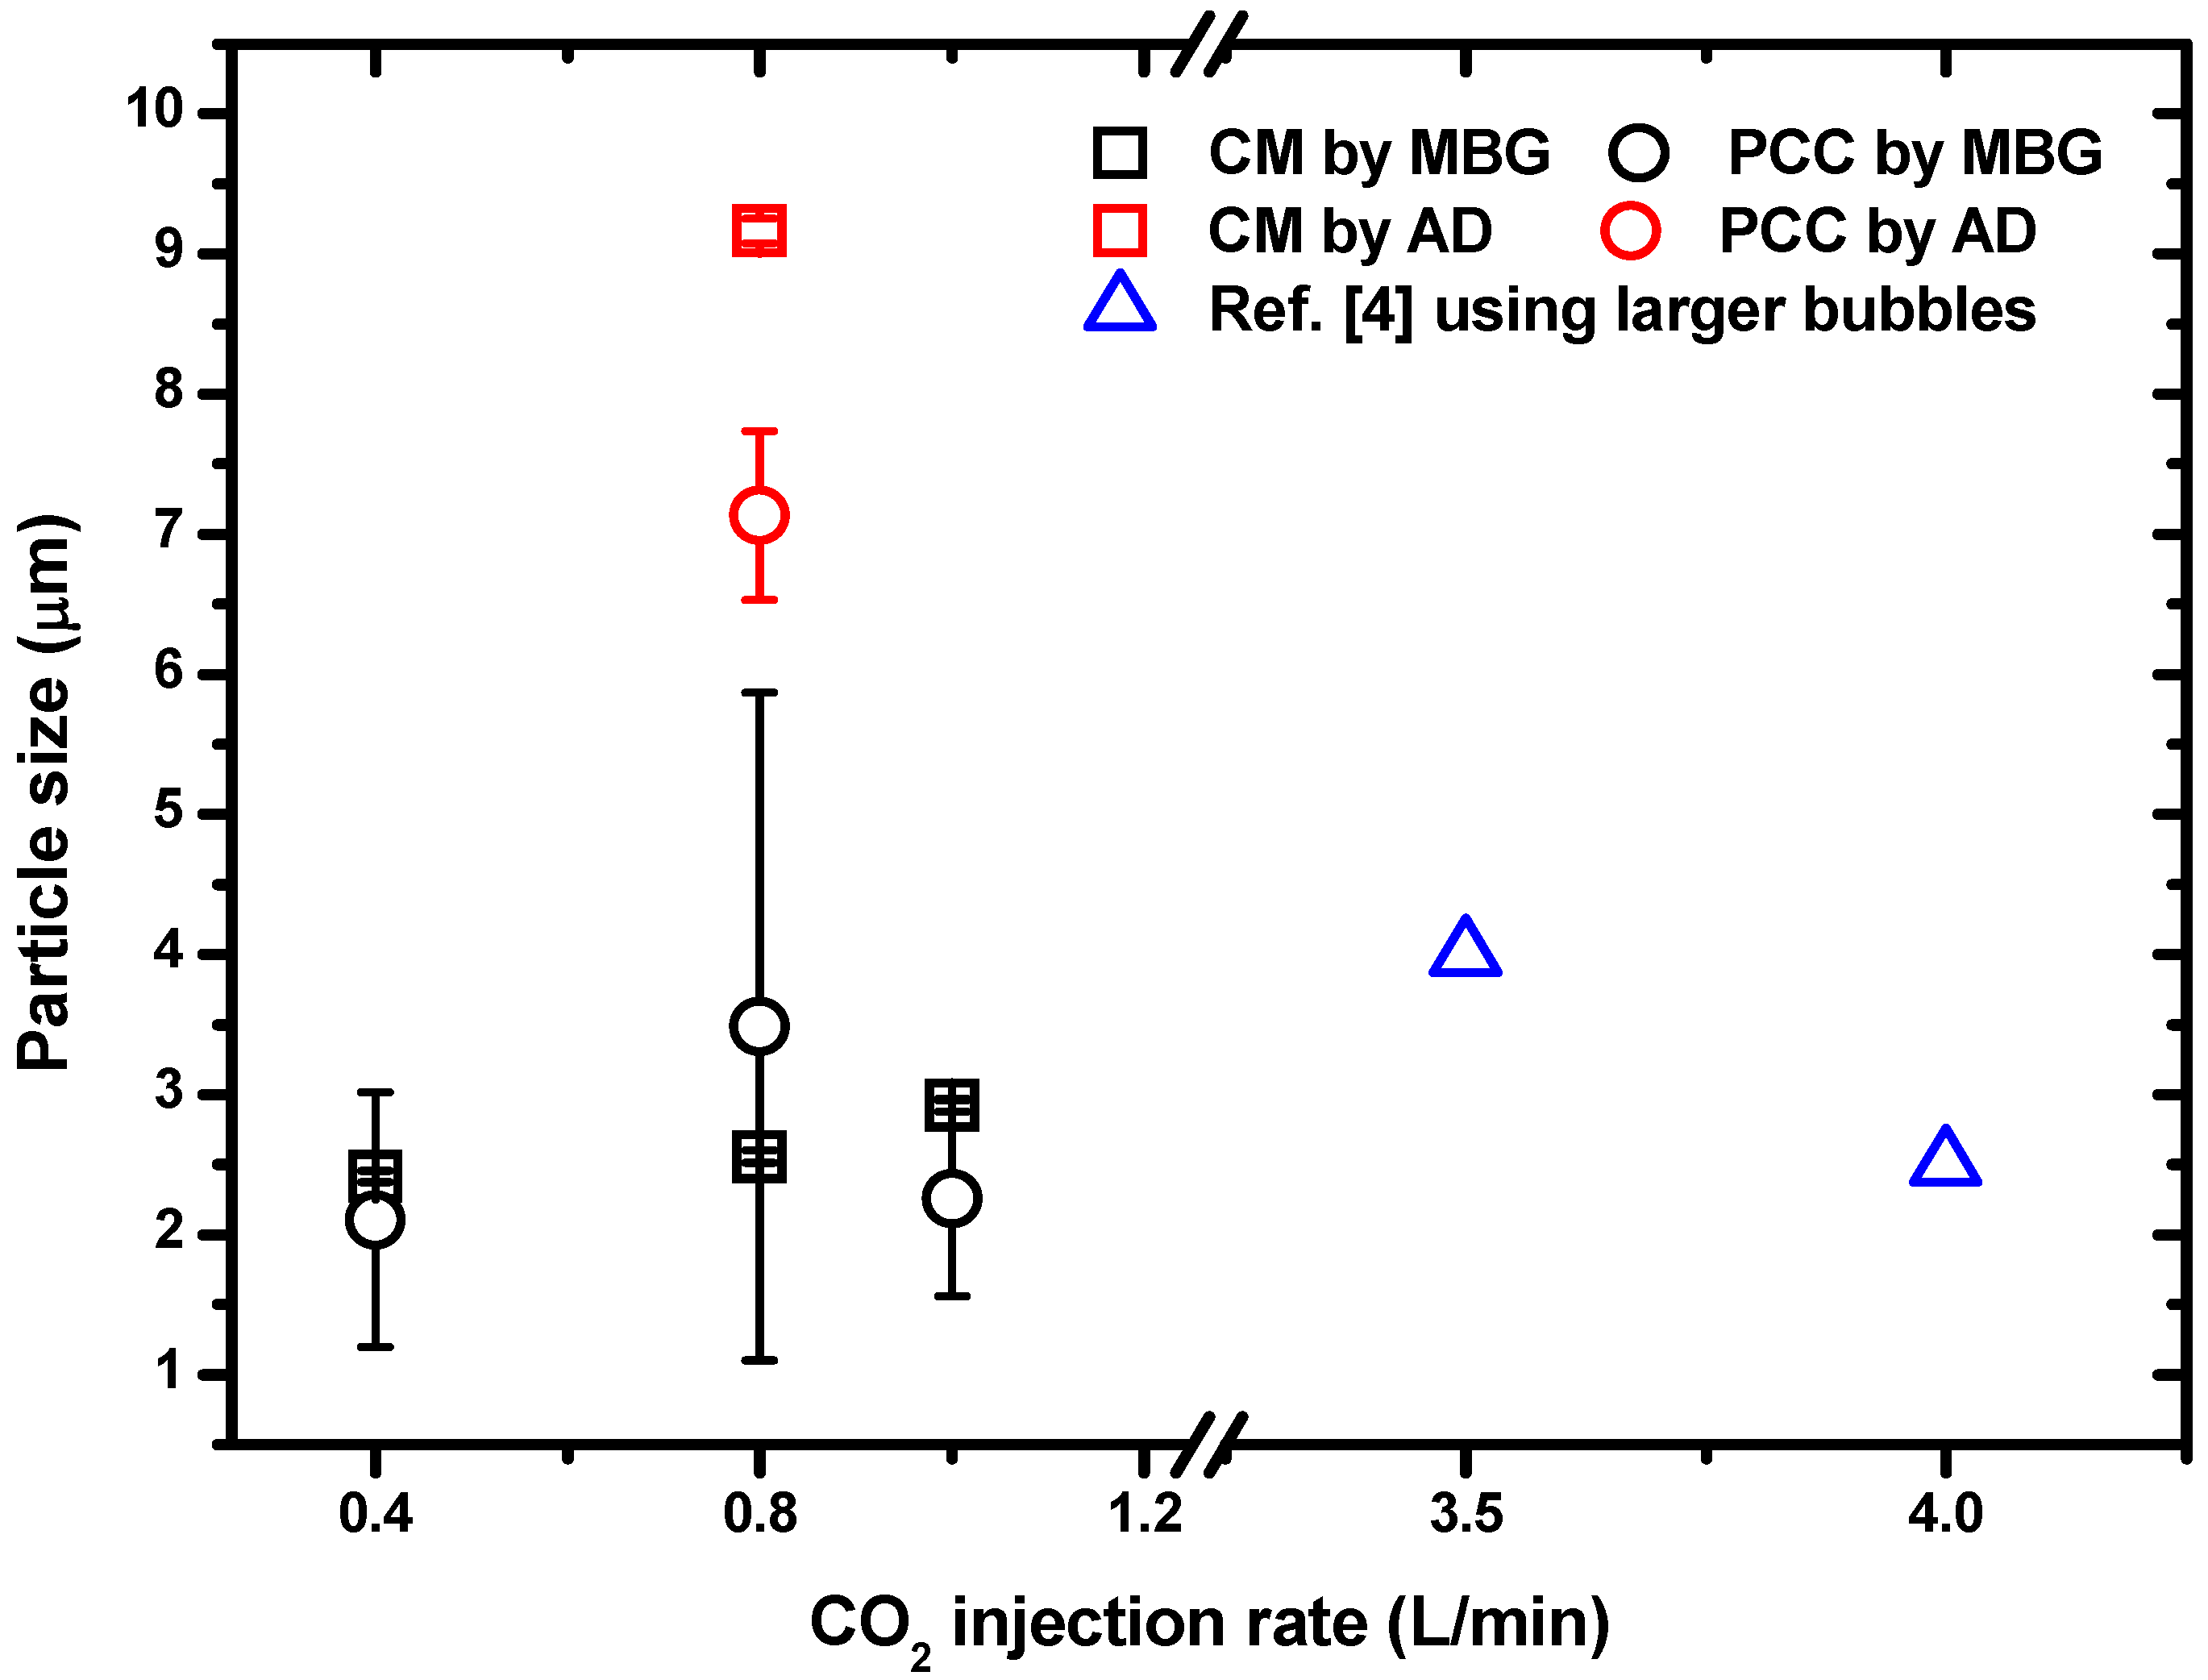
10]. The particle sizes obtained by CM with gypsum suspension were 2.4, 2.6 and 2.9 μm (black squares (□) in
Figure 2), when the CO
2 injection rates were 0.4, 0.8 and 1.0 L/min, respectively. The average PS was 2.6 μm with a standard deviation of 0.3 μm.
Figure 2.
Particle size (PS) of CaCO
3 produced by carbonate mineralization (CM) and precipitated calcium carbonate (PCC) from gypsum (squares □) and Ca(OH)
2 (circles ○). The effect of CO
2 injection methods (microbubble generator (MBG) and air diffuser (AD)) on the PS were marked additionally in black and red, respectively. The horizontal axis indicates the CO
2 injection rate into the calcium-source suspensions. The PS results using Ca(OH)
2 are from our previous paper [
11]. The values in blue triangles are from reference [
4] when 101–160 µm bubbles were used, and these are approximate values. The standard deviation was obtained from the repeated experimental results at least twice.
For comparison, the size of the particles obtained by PCC with a suspension of Ca(OH)
2 were 2.1, 3.5 and 2.3 μm (black circles (○) in
Figure 2) when the CO
2 injection rates were 0.4, 0.8 and 1.0 L/min, respectively. The average PS was 2.6 ± 0.8 μm [
11]. It is interesting that the size of the CaCO
3 particles was almost the same regardless of the type of calcium source, when the MBG was used for either the CM or the PCC method.
However, the PS was not the same when an AD was used to inject CO
2 into the calcium-source suspension, for CM (9.2 ± 0.1 μm) or PCC (7.1 ± 0.6 μm) (red marks in
Figure 2). Much smaller CaCO
3 particles were produced using the MBG than with the AD, regardless of the calcium source. Under the same CO
2 injection rate of 0.8 L/min into the calcium source suspension, tiny CO
2 bubbles by MBG produced the calcite particles sized in from 2.6 to 3.5 μm, and larger CO
2 bubbles by AD did the calcite particles sized in from 7.1 to 9.2 μm. MBG makes the CO
2 concentration higher even when the flow rate of CO
2 into the calcium-source suspension was low. For this reason, supersaturation of carbonate ions can be induced in the suspension, which will precipitate smaller CaCO
3 particles because of the higher nucleation rate [
14]. It was observed that the PS of CaCO
3 was not sensitive to the CO
2 flow rate when a MBG was used. In contrast, when an AD or a gas distributor was used, the PS was significantly affected by the gas flow rate. Feng
et al. [
4] investigated the effect of CO
2 flow rate and bubble size on the PS of CaCO
3. A flow rate increment from 3.5 to 4 L/min, reduced the PS from 4 to 2.5 μm. For comparison, their results are also included as blue triangles (∆) in
Figure 2.
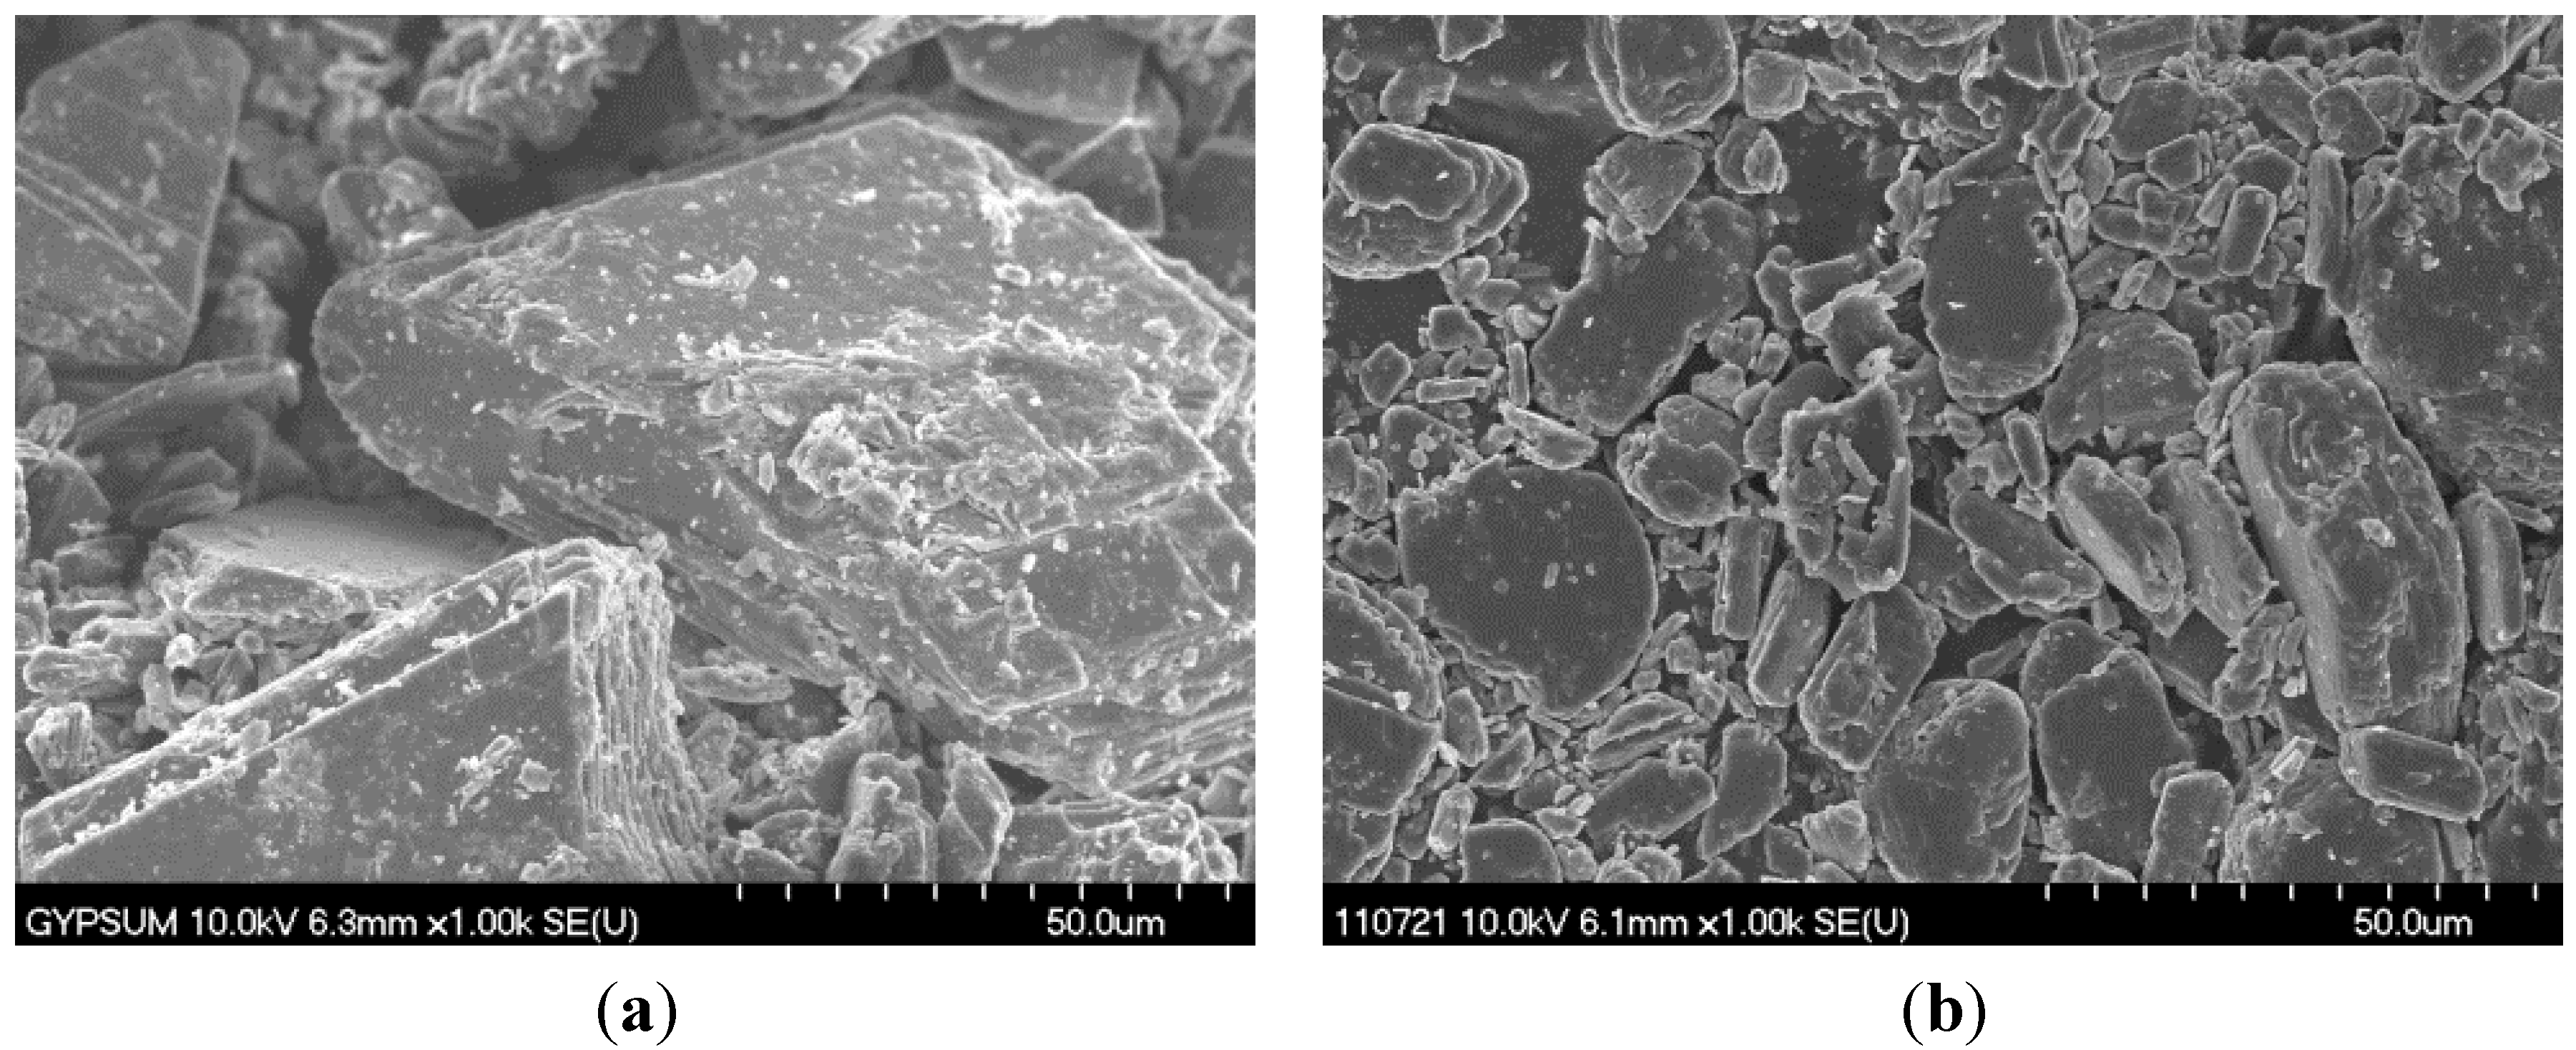
Figure 3 shows SEM images of
Figure 3a raw gypsum and
Figure 3b gypsum circulated through the MBG for 16 min without a dose of NaOH. Evidently, the gypsum particles become significantly smaller during circulation. Therefore, the SSA of the particles was expected to increase owing to this refinement. The raw gypsum crystals were covered by numerous fine particles (
Figure 3a), which greatly increased the surface area. Therefore, the surface area would be decreased if these surface particles were dissolved during circulation. The very flat surface of gypsum after circulation (
Figure 3b) supports this explanation. The expected increase in the measured SSA was not observed. Instead, the SSA of the gypsum decreased from 9.9 to 6.1 m
2/g during circulation, despite significant reduction in the PS. The reason for this discrepancy can be observed in the SEM images. The high flow rate provided by the MBG is expected to readily dissolve these tiny particles on the surface of gypsum crystals.
Figure 3.
Scanning Electron Microscope (SEM) images of gypsum: (a) Raw gypsum with tiny particles (<2 µm) on the surface of larger particles; (b) Gypsum after circulation for 16 min through the MBG: The tiny particles disappeared and the large particles were broken into smaller ones.
Figure 3.
Scanning Electron Microscope (SEM) images of gypsum: (a) Raw gypsum with tiny particles (<2 µm) on the surface of larger particles; (b) Gypsum after circulation for 16 min through the MBG: The tiny particles disappeared and the large particles were broken into smaller ones.
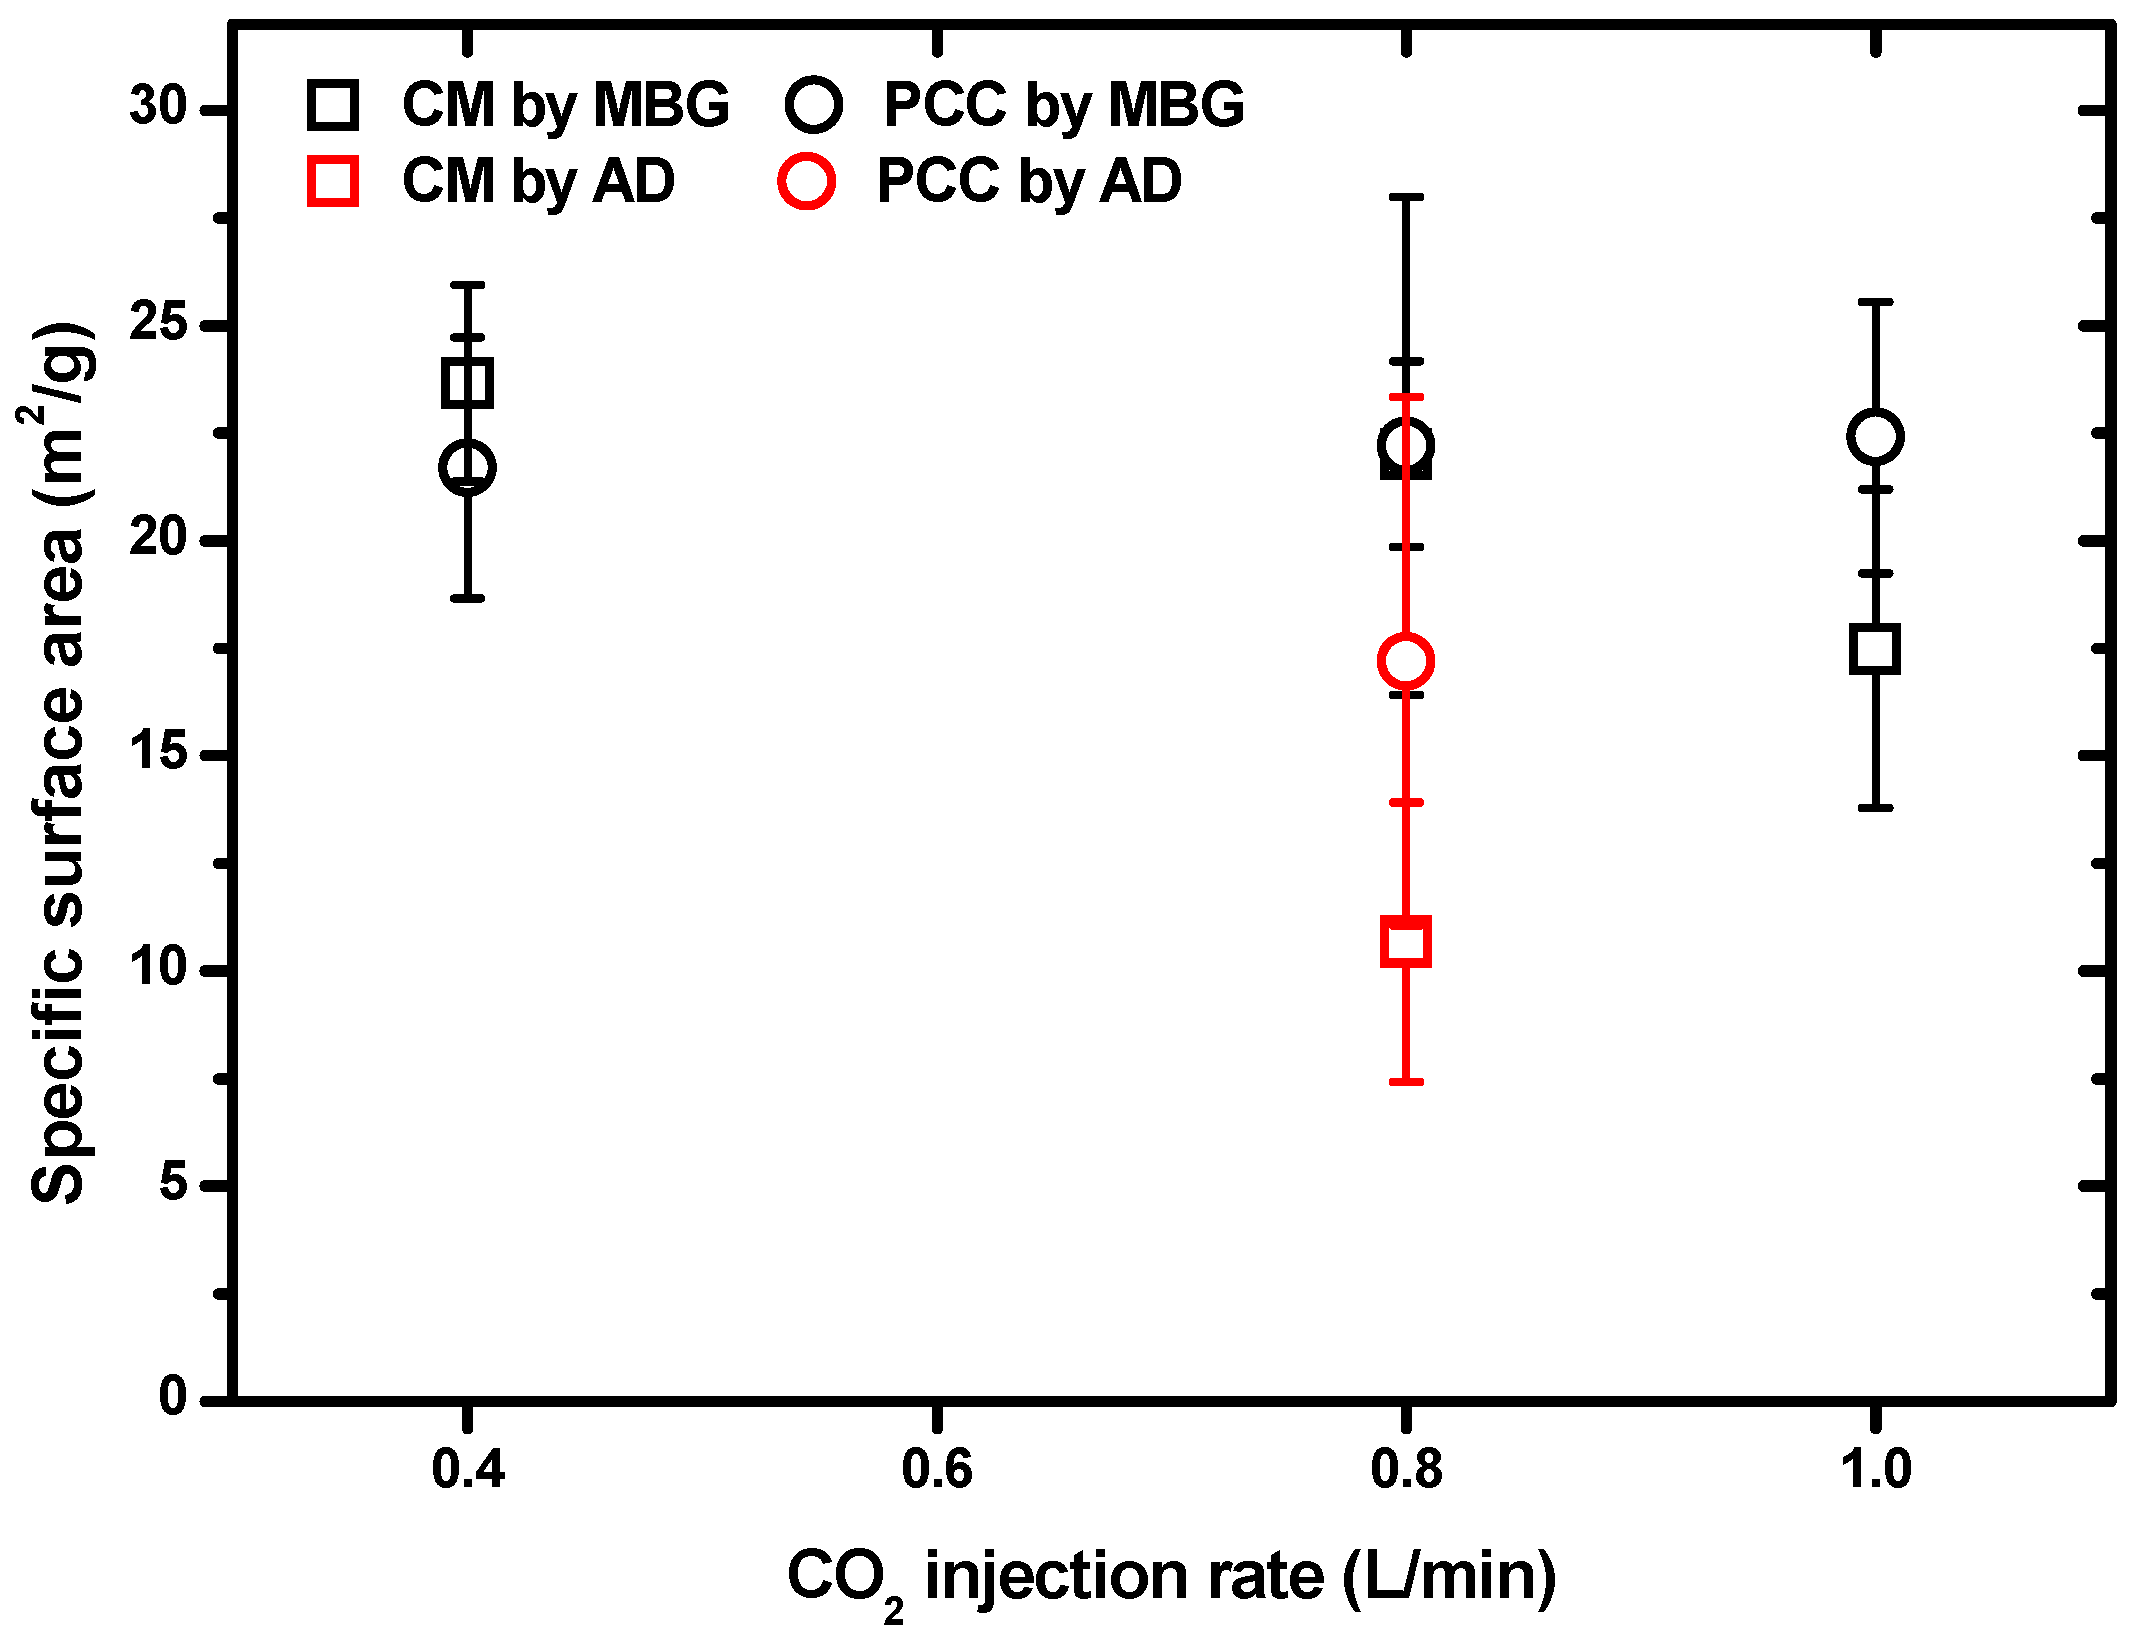
The SSAs of the CaCO
3 particles prepared by CM or PCC with CO
2 MBs were similar whether the calcium source was Ca(OH)
2 or gypsum.
Figure 4 shows the effect of the CO
2 injection rate on the SSA for both the MBG and AD. The SSA of the particles from the gypsum suspension after the MBG process (black squares (□) in
Figure 4) was 23.7, 22.0 and 17.5 m
2/g at the CO
2 rates of 0.4, 0.8 and 1.0 L/min, respectively. The average value was 21.1 ± 3.20 m
2/g: the standard deviation of 15% being rather high. In comparison, the SSA of particles produced by PCC with Ca(OH)
2 was 21.7, 22.2 and 22.4 m
2/g at CO
2 rates of 0.4, 0.8 and 1.0 L/min, respectively (black circles (○) in
Figure 4), with an average SSA of 22.1 ± 0.36 m
2/g [
11]. This result agrees with the PS data in the sense that the SSA values are almost constant when using the MBG, regardless of the calcium source. The SSA of particles prepared at a CO
2 flow rate of 0.8 L/min, using the AD (red marks in
Figure 4), were significantly less than for those obtained using the MBG. In this case, the particles prepared by CM with gypsum had a SSA of 10.7 ± 3.3 m
2/g, whereas those prepared with Ca(OH)
2 had a SSA of 17.2 ± 6.1 m
2/g as AD supplied larger CO
2 into the calcium source suspension; MBG with tiny CO
2 bubbles produce the calcite particles with larger SSA (22.0–22.2 m
2/g).
Figure 4.
SSA of CaCO
3 produced by CM and PCC from gypsum (squares □) and Ca(OH)
2 (circles ○) respectively. The effect of the CO
2 injection methods (MBG and AD) on the SSA were marked in black and red, respectively. The horizontal axis indicates the CO
2 injection rate into the calcium-source suspensions. The SSA results using Ca(OH)
2 are from our previous paper [
11]. The standard deviation was obtained from the repeated experimental results at least twice.
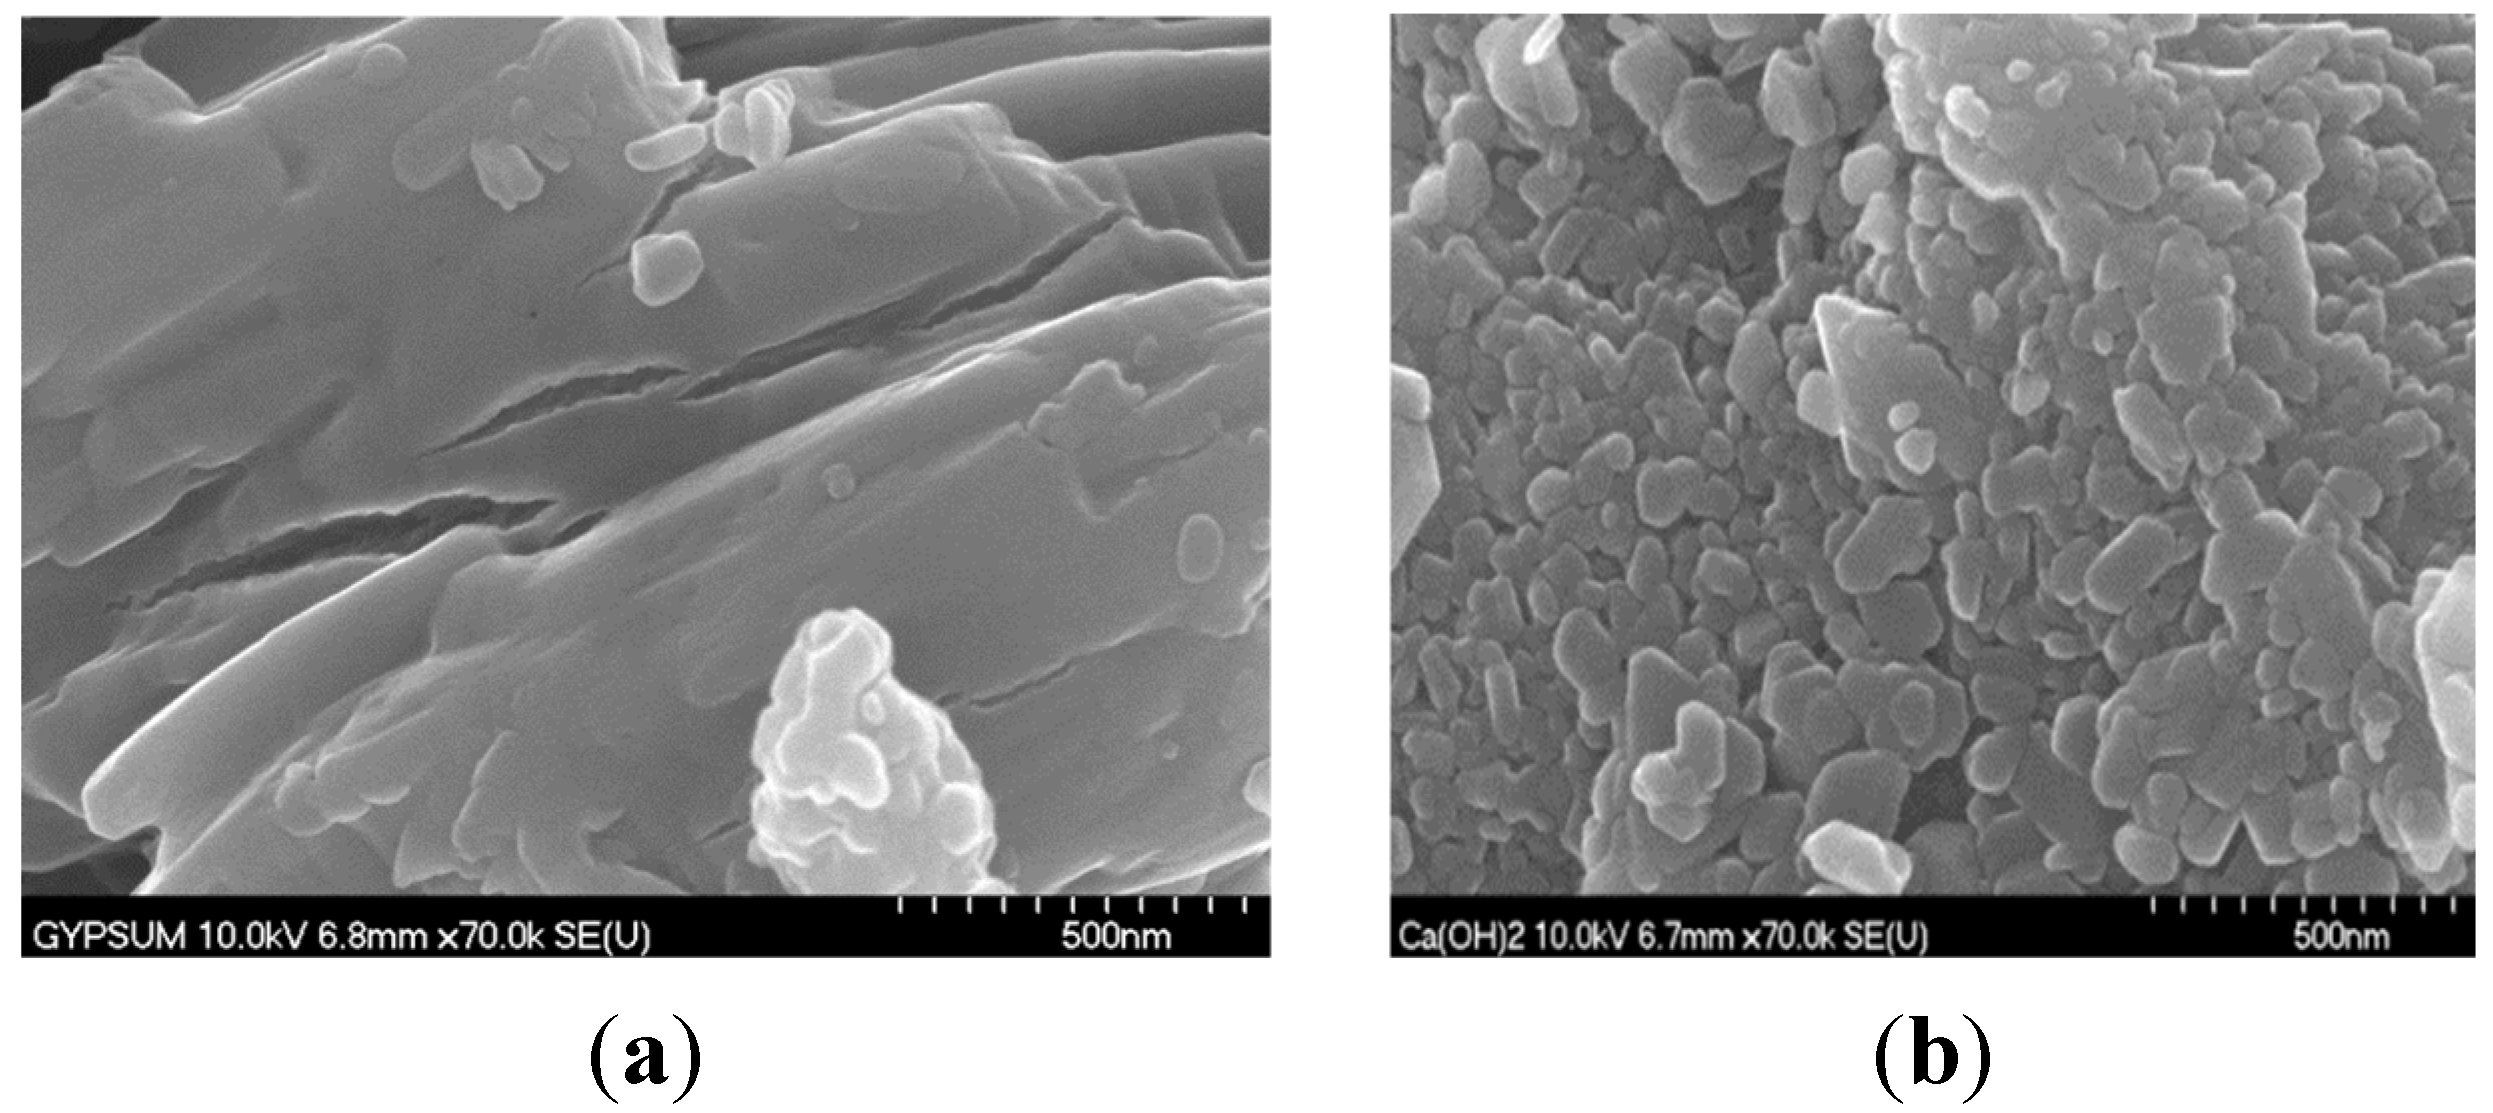
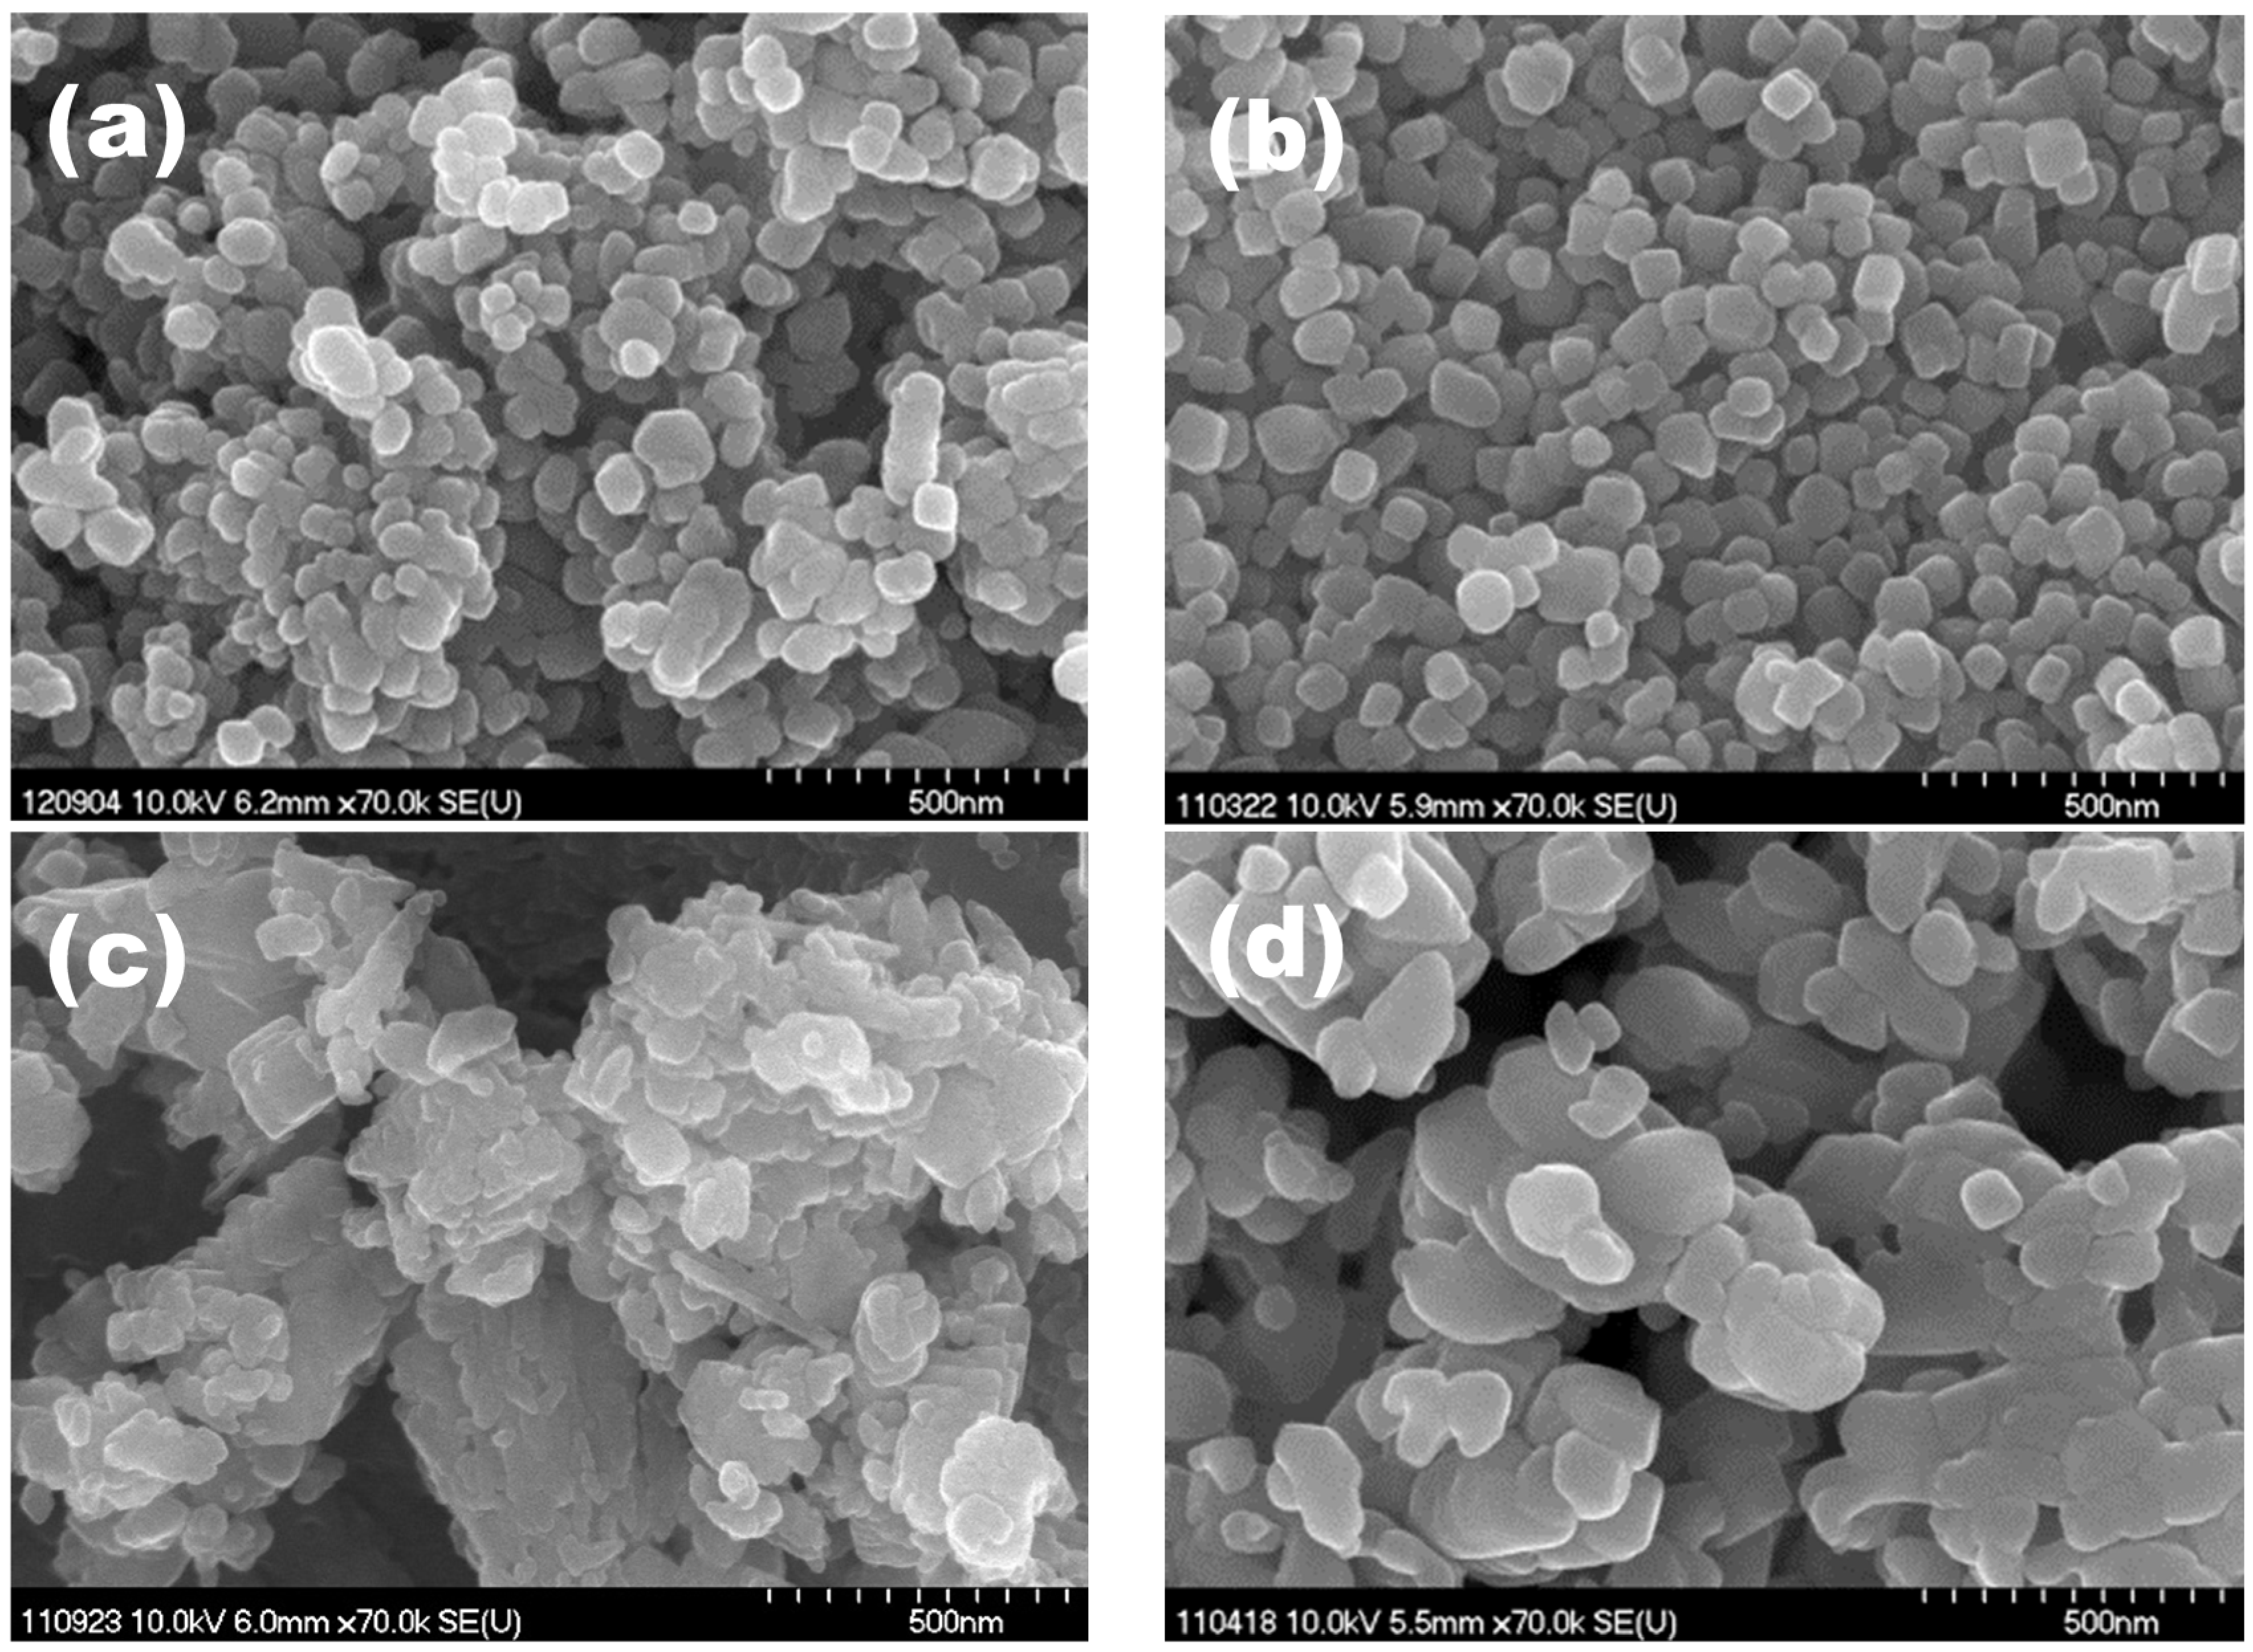
Figure 5 shows SEM images of the CaCO
3 particles obtained from the CM process (gypsum source) and PCC process (Ca(OH)
2 source) using either MBG or AD. The particles prepared using the MBG appear smaller than those prepared using AD, regardless of calcium source. In addition, the particles produced using the MBG had a narrower size distribution (
Figure 5a,b), than those using AD (
Figure 5c,d). This was probably because of comparatively larger clusters in the latter. The SSA is affected by the size of primary particles that are agglomerate to form larger (secondary) particles. The size of primary particles can be calculated by Equation (3) when the particles are granular [
15].
Table 2 shows the results for primary particle size calculated using this equation. These values were in accordance with the SEM images in
Figure 5 when the MBG was used. However, the PS of the primary CaCO
3 particles produced using the AD were not matched with the SEM results in
Figure 5 due to the irregular shapes of the particles and their agglomerates. In this case, the contacted surfaces between the irregular shaped primary particles were larger than the granular particles in order to the SSA would be reduced:
where,
d is primary particle size,
is SSA, and
is density of the particles (in this case 2.71 g/cm
3 for calcite of CaCO
3).
The novelty of this study is that the size of the CaCO3 particles prepared using the MBG were finer and almost identical in size (~2.6 μm and 22 m2/g) regardless of the calcium source, whereas the use of an AD produced coarser CaCO3 particles (~8 μm and less than 17 m2/g). Generally, when such CaCO3 particles are used in paper making, it is said that their finer PS and greater SSA enhance smoothness and printing quality. A rationale for the homogeneities in (primary) PS and SSA may be that the MBG causes changes in the fluid dynamics, such as the surface tension and buoyancy of bubbles in the calcium-source suspension, which are quite different from those obtained with the AD.
Figure 5.
SEM images of CaCO3 produced by AD and MBG using gypsum and Ca(OH)2: (a) gypsum by MBG; (b) Ca(OH)2 by MBG; (c) gypsum by AD and (d) Ca(OH)2 by AD. The particles in this panel were obtained CO2 flow at 0.8 L/min, with AD and MBG.
Figure 5.
SEM images of CaCO3 produced by AD and MBG using gypsum and Ca(OH)2: (a) gypsum by MBG; (b) Ca(OH)2 by MBG; (c) gypsum by AD and (d) Ca(OH)2 by AD. The particles in this panel were obtained CO2 flow at 0.8 L/min, with AD and MBG.
Table 2.
Calculated size of the primary particles based on specific surface area.
Table 2.
Calculated size of the primary particles based on specific surface area.
| CO2 Rate (L/min) | Size of the Primary Particles (nm) |
|---|
| CM by MBG | PCC by MBG | CM by AD | PCC by AD |
|---|
| 0.4 | 94 | 102 | - | - |
| 0.8 | 101 | 100 | 207 | 129 |
| 1.0 | 127 | 99 | - | - |
According to Henry’s law, the degree of solubility of a gas in aqueous media depends on the pressure and temperature. The addition of chemicals such as amines [
16,
17,
18] and ammonia [
19,
20,
21] could enhance the solubility of CO
2 by forming complexes. Moreover, changes in the physical properties of a gas bubble, such as decreasing the bubble size, could also increase their solubility under given conditions of atmospheric pressure and temperature [
3,
10,
22]. The strong surface tension of MBs described in Equation (1) causes these results. This will improve the ability to build rather small, unpressurized CM facilities, to use less and thus reduce the cost of CO
2 sorbent chemicals, and to reduce the loss of whiteness of CaCO
3 particles due to those chemicals. The use of the MBG accelerates the nucleation rate of CaCO
3 due to the enhanced diffusion rate indicated in Equation (2), which decreases the PS. In addition, Gibbs-Thomson and Ostwald ripening effects exert an influence on the PS, with a limit for CaCO
3 near 2 μm [
23]. This appears to agree with our result of PS around 2 μm, regardless of the calcium source, and of the process (CM or PCC), when the MBG was used.


