Article

Determination of Methane and Carbon Dioxide Formation Rate Constants for Semi-Continuously Fed Anaerobic Digesters

1
Tekniska verken i Linköping AB (public), Department of Biogas Research and Development, Box 1500, SE-581 15 Linköping, Sweden
2
Department of Microbiology, BioCenter, Swedish University of Agricultural Sciences, Box 7025, SE-750 07 Uppsala, Sweden
*
Author to whom correspondence should be addressed.
These authors contributed equally to this work.
Present address: Swedish National Laboratory of Forensic Science, SE-581 94 Linköping, Sweden
Energies 2015, 8(1), 645-655; https://doi.org/10.3390/en8010645
Submission received: 3 December 2014 / Accepted: 13 January 2015 / Published: 16 January 2015
(This article belongs to the Special Issue Bioenergy and Biorefining)

Abstract

:
To optimize commercial-scale biogas production, it is important to evaluate the performance of each microbial step in the anaerobic process. Hydrolysis and methanogenesis are usually the rate-limiting steps during digestion of organic waste and by-products. By measuring biogas production and methane concentrations on-line in a semi-continuously fed reactor, gas kinetics can be evaluated. In this study, the rate constants of the fermentative hydrolysis step (kc) and the methanogenesis step (km) were determined and evaluated in a continuously stirred tank laboratory-scale reactor treating food and slaughterhouse waste and glycerin. A process additive containing Fe2+, Co2+ and Ni2+ was supplied until day 89, after which Ni2+ was omitted. The omission resulted in a rapid decline in the methanogenesis rate constant (km) to 70% of the level observed when Ni2+ was present, while kc remained unaffected. This suggests that Ni2+ mainly affects the methanogenic rather than the hydrolytic microorganisms in the system. However, no effect was initially observed when using conventional process monitoring parameters such as biogas yield and volatile fatty acid concentration. Hence, formation rate constants can reveal additional information on process performance and km can be used as a complement to conventional process monitoring tools for semi-continuously fed anaerobic digesters.

1. Introduction

Anaerobic digestion is the microbiological degradation of organic materials in the absence of oxygen, a process which can be exploited in commercial plants to produce biogas consisting of carbon dioxide and energy-rich methane. The anaerobic digestion process has been described in detail elsewhere [1,2], but in brief it can be separated into four different steps: (i) Hydrolysis, whereby particulate organic material is converted to mono- or oligomers by hydrolytic enzymes; (ii) acidogenesis, whereby the products from hydrolysis are converted to volatile fatty acids (VFA), alcohols, hydrogen and carbon dioxide by primary fermentative bacteria, the same microorganisms that excrete hydrolytic enzymes; (iii) acetogenesis, whereby the different products of acidogenesis are degraded by secondary (syntrophic) fermentative bacteria to acetate, carbon dioxide and hydrogen; and (iv) methanogenesis, whereby acetate is converted by acetotrophic methanogens to methane and carbon dioxide, or syntrophically oxidized to carbon dioxide and hydrogen by syntrophic acetate-oxidizing bacteria [3]. The hydrogen and carbon dioxide produced during acetogenesis and syntrophic acetate oxidization are subsequently converted into methane by hydrogenotrophic methanogens.
Bio-methane is a renewable energy source that can be further used for combined heat and power or for vehicle fuel. In the past, bio-methane was generally produced and collected at wastewater treatment plants and landfills. However, there is now an increasing trend for co-digestion of different energy-rich wastes such as slaughterhouse waste, the organic fraction of municipal solid waste (OFMSW) and industrial waste, with the aim of producing methane for commercial use [4]. This trend for more commercial-scale methane production has created a need for optimization of biogas processes, for example by trace element addition. Trace elements are nutrients required for microbial growth, and supplying optimal concentrations of these ensures efficient anaerobic digestion [5]. For anaerobic digestion, iron (Fe), cobalt (Co) and nickel (Ni) are considered most important and the effects of adding these nutrients have been evaluated in several studies [6,7,8,9,10,11]. However, optimization of the anaerobic process and evaluation of the effects of various optimization efforts, for example addition of trace elements, requires accurate methods to determine process stability (i.e., risk of process disruption) and/or process efficiency and to identify process bottlenecks.
Process stability is commonly determined and bottlenecks identified by measuring the accumulation of intermediate products in the anaerobic process, such as VFA [12] and hydrogen [13]. Accumulation of VFA can result in a pH decrease, so both pH and alkalinity can also be used as stability indicators [12]. Overall process efficiency is commonly determined by gas yield per unit volatile solids (VS) or chemical oxygen demand (COD), total gas production or degree of degradation (destruction of organic material, on a VS or COD basis) [14]. However, most of these analyses involve time-consuming laboratory work for determination of VFA, VS or COD, leading to long response times.
An alternative approach would be to study the gas kinetics, i.e., the manner in which the gas is produced after addition of organic material to the digestion reactor. Batch experiments are generally used to determine the bio-methane potential (BMP) of substrates, but the gas production characteristics (typically decelerated exponential growth shape) can also be used to determine hydrolysis rate constants, provided that hydrolysis is the rate-limiting step [15]. Hydrolysis rate constants can be determined by fitting batch experiment data to a first-order equation. In a semi-continuously fed reactor, the accumulated biogas production between feedings also shows a decelerated exponential growth shape [16]. The kinetics information provided by online measurement of biogas production can be utilized to obtain additional information about the process, apart from daily gas production. Astals et al. [16,17] found that daily rate constants can vary due to the proportion of easily biodegradable organic matter in the substrate, leading to clear effects on daily gas production.
The main aim of this study was to evaluate the possibility to determine the carbon dioxide formation rate constants and methane formation rate constant between feedings at laboratory scale to observe process stability when co-digesting OFMSW, slaughterhouse waste and glycerin. To achieve this, we used the methane concentration in the digester headspace and the biogas flow to distinguish between methane and carbon dioxide formation rates. A further aim was to use the rate constants determined to identify bottlenecks in anaerobic digestion of the substrate and to determine the step in which addition of nickel had an effect.

2. Results and Discussion

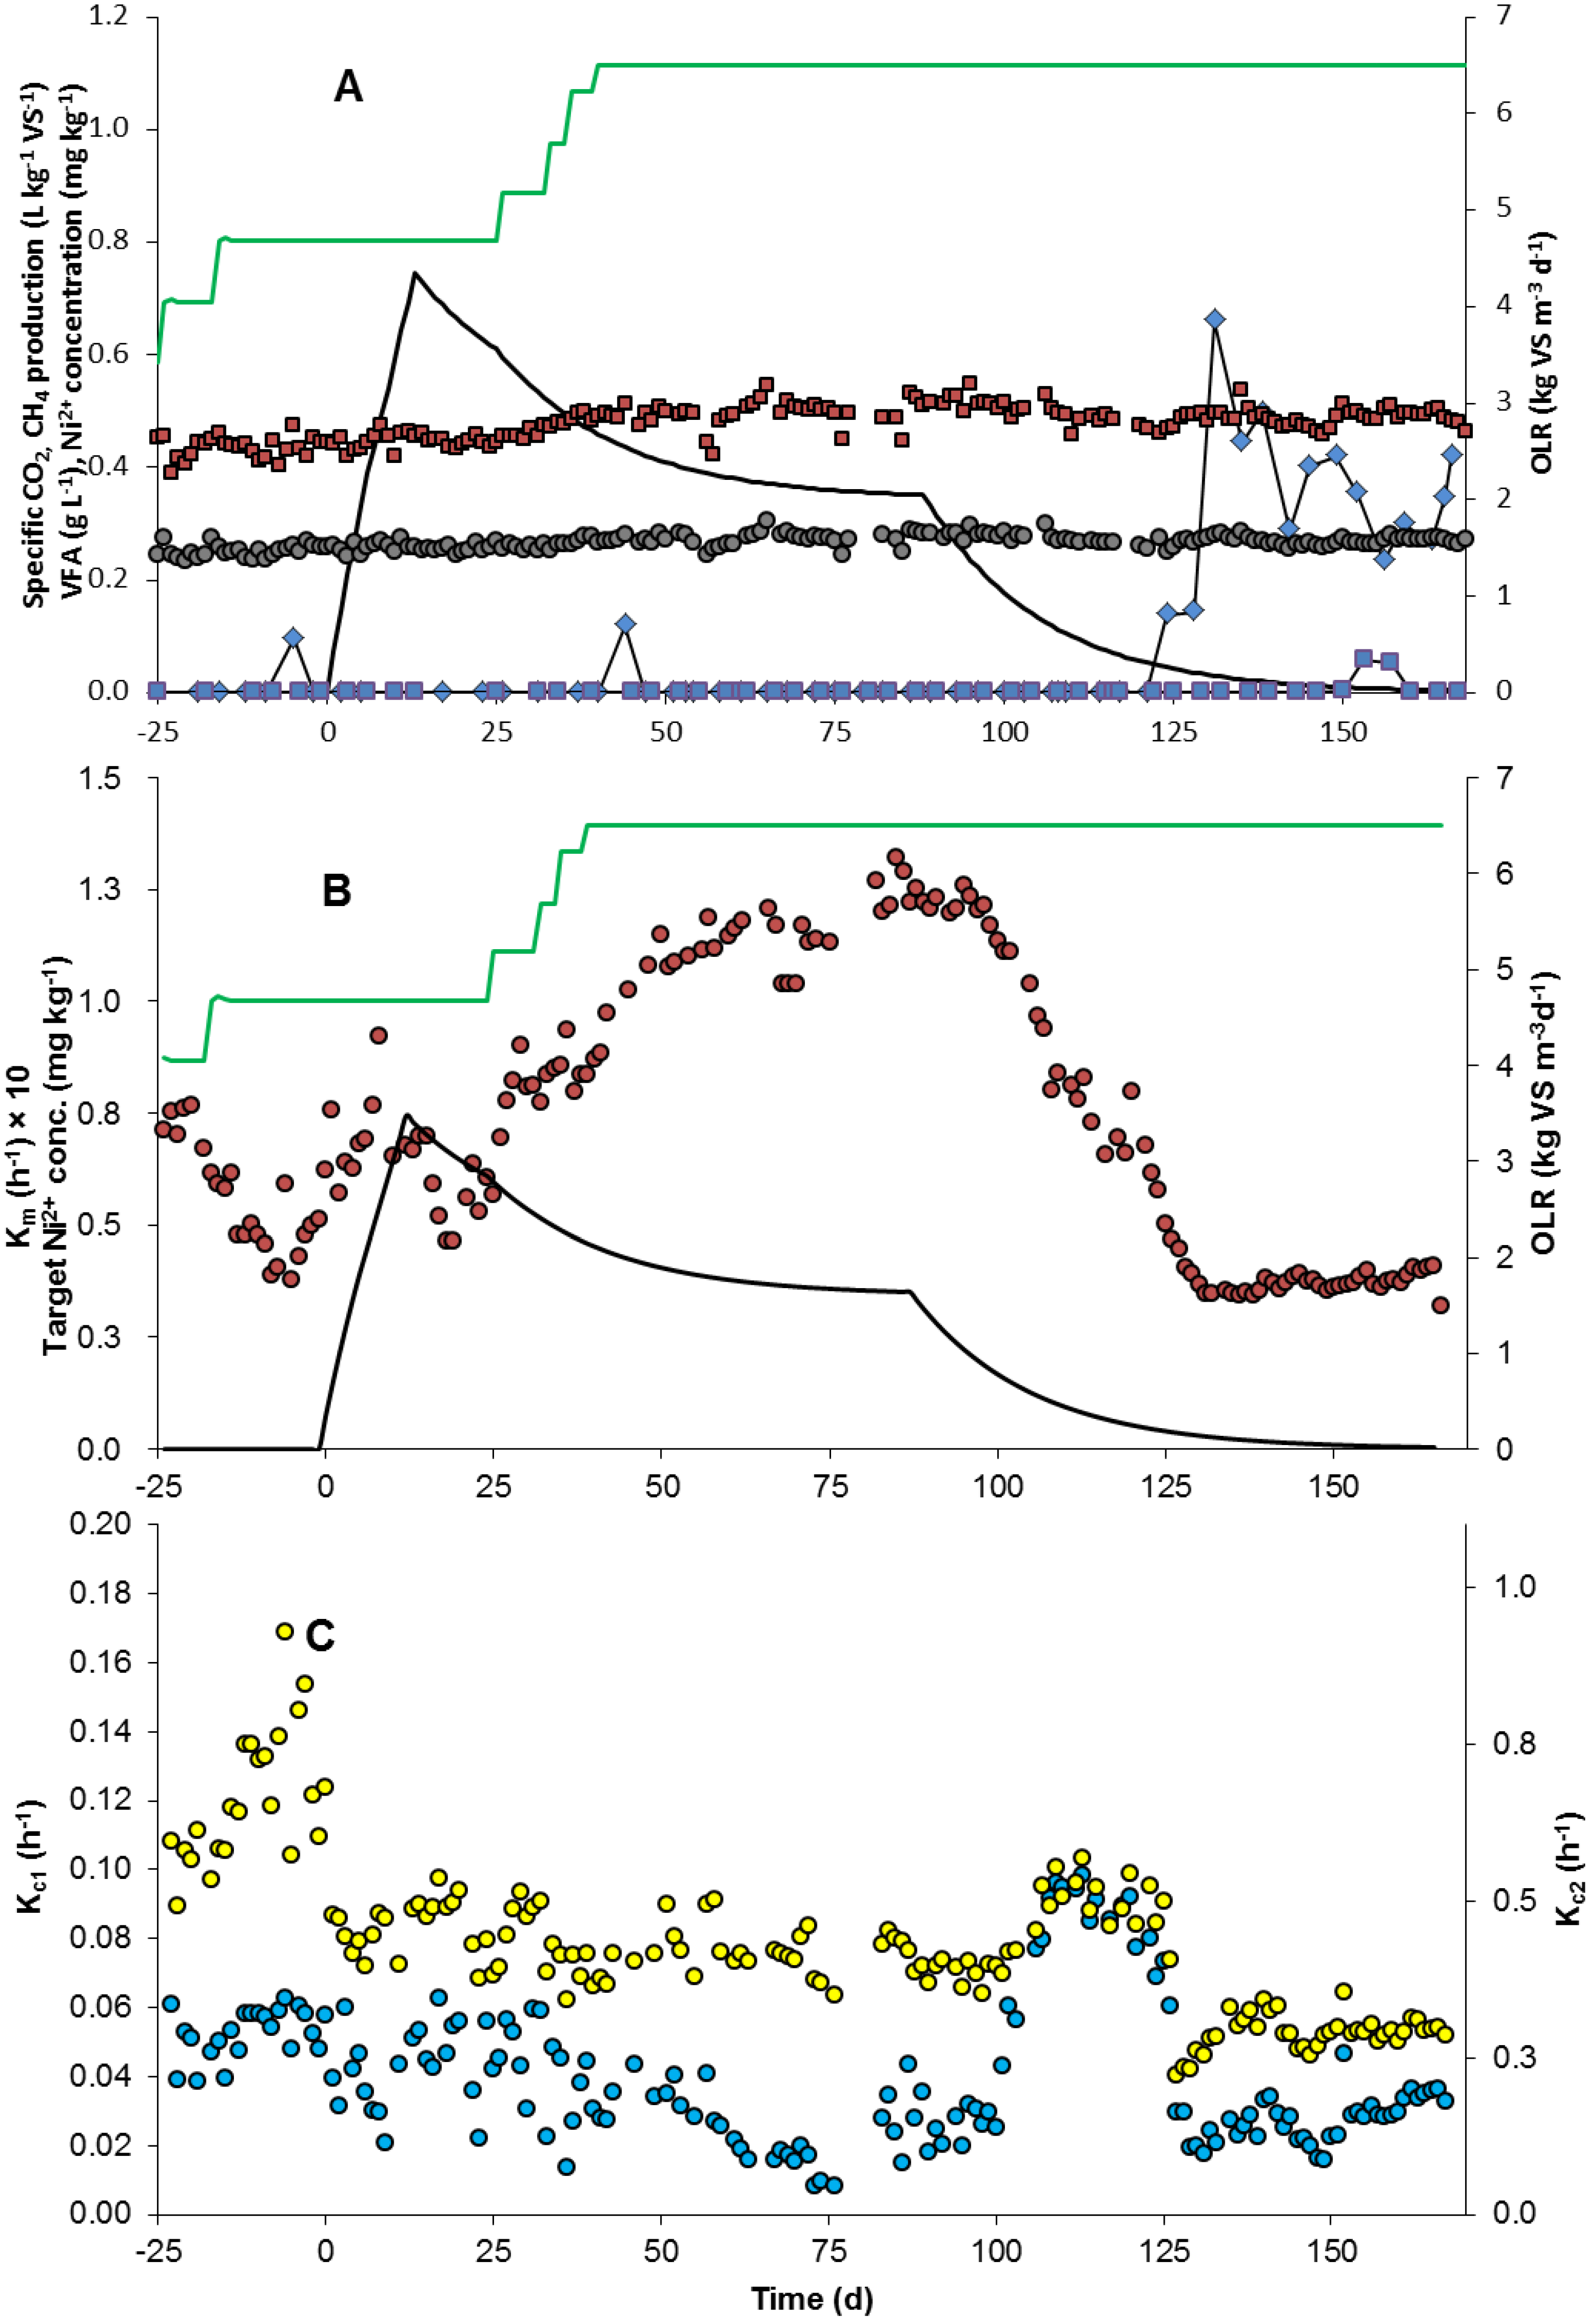
2.1. Reactor Performance

After an initial period of stable operation, the OLR (Organic loading rate) was increased from 3.4 to 4.7 kg·VS·m−3·d−1 in order to stress the process and provoke process disturbances (Figure 1A). However, even though the HRT (hydraulic retention time) was as short as 18 days no process instability was observed, probably due to the continuous addition of the trace element solution including iron, cobalt and nickel. When the OLR was increased further (to 6.5 kg·VS·m−3·d−1), there was still no VFA accumulation or signs of lower specific biogas production (Figure 1A). Previous studies have shown that trace element addition has positive effects, especially on process stability, i.e., reduced VFA accumulation [9,10,18]. However, the effects of nickel and cobalt could not be separated from these experimental data and therefore nickel administration was terminated on day 89. This resulted in a slight increase in VFA 35 days later (on day 124), which corresponded well with the calculated time for total wash-out of nickel from the digester (Figure 1A). This indicates that nickel administration had positive effects on process stability which at higher OLR could not be achieved with cobalt administration alone. However, while a small fraction of VFA started to accumulate, no significant decrease in specific methane production was observed after nickel addition ceased.
Figure 1. Process performance and kinetics for the reactor during the experiment. (A) Organic loading rate (OLR) ( ),specific methane (CH4) production ( ), specific carbon dioxide (CO2) production ( ), calculated added nickel (Ni) concentration in the reactor (▬), acetate concentration ( ) and propionate concentration ( ); (B) Rate constant of methane formation (km, multiplied by a factor of 10 for graphical reasons) ( ), OLR ( ) and nickel concentration in the reactor (▬); (C) Rate constant of slow carbon dioxide formation, kc1 ( ) and rate constant of fast carbon dioxide formation, kc2 ( ).
Energies 08 00645 g001

2.2. Rate Constants

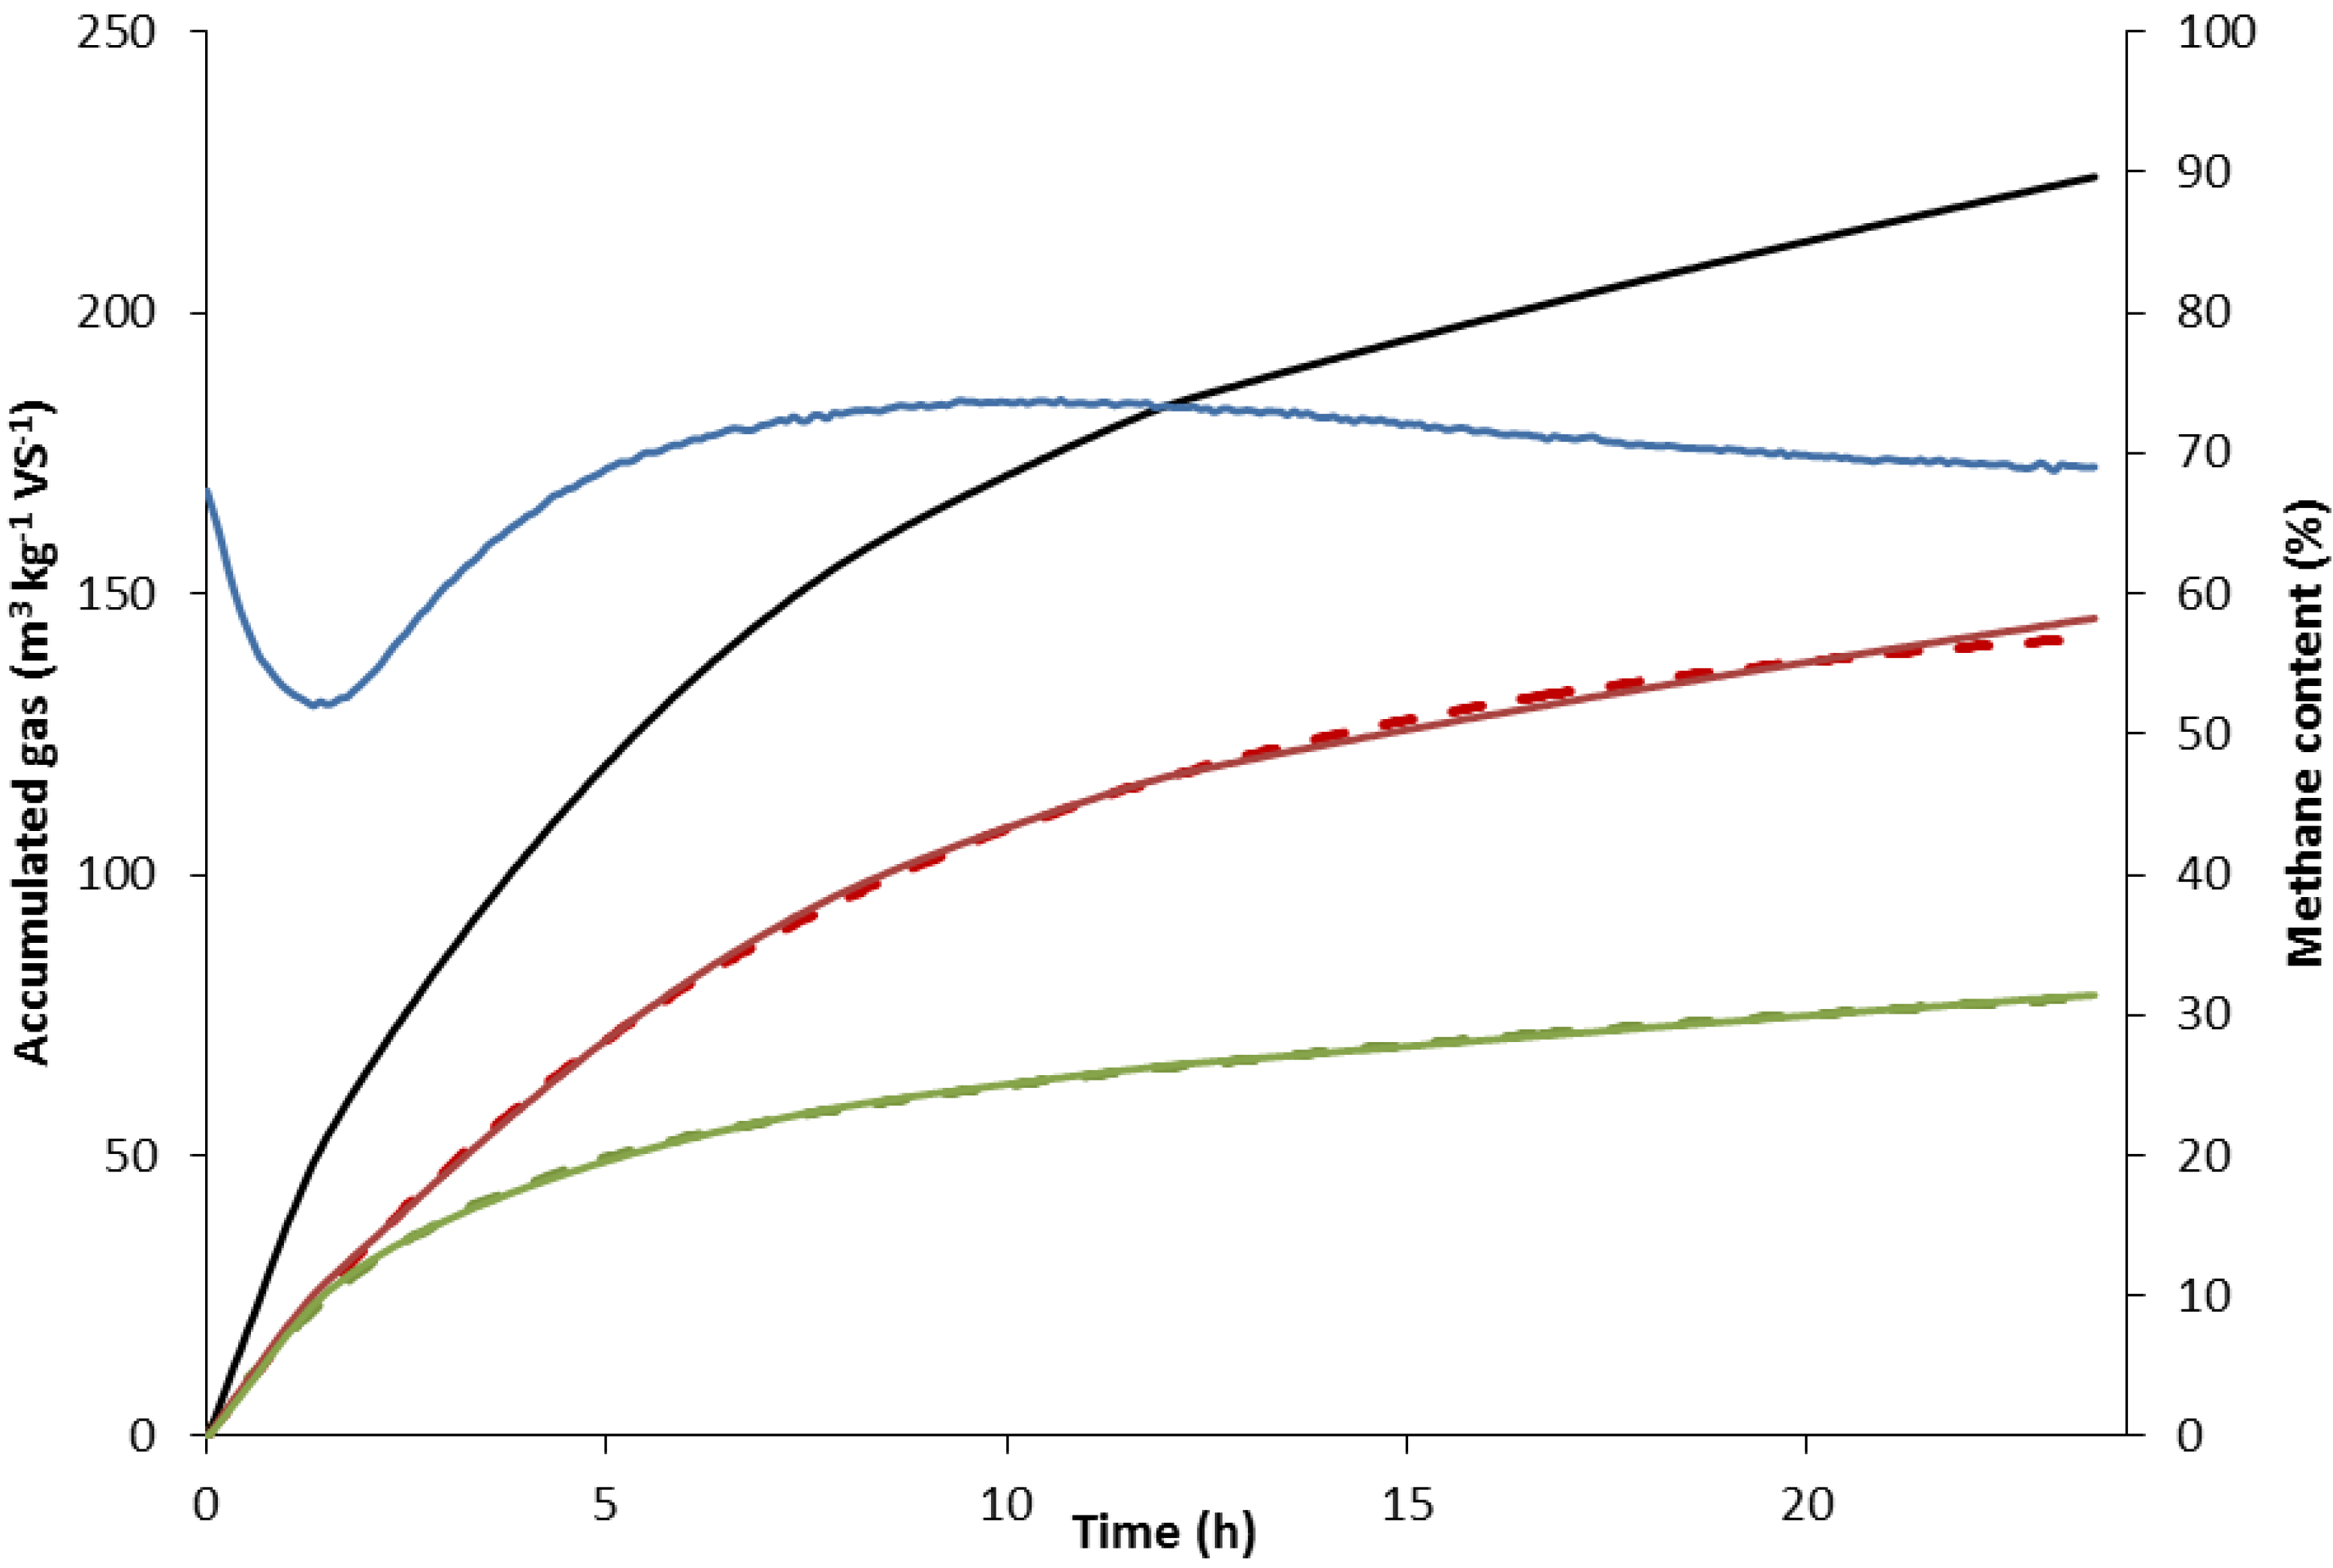
2.2.1. Determination of Kinetic Rate Constants

By on-line measurement of the accumulated biogas production and the methane concentration of the gas every five minutes, the kinetic behavior of the system between daily feedings was analyzed. From the measured formed biogas and the change in headspace methane content, the specific production of methane and residual gas can separately be calculated for each five minute interval. For simplicity, the residual gas was assumed to contain 100% carbon dioxide.
When plotting the accumulated specific biogas, methane and carbon dioxide production over time, the curves displayed a decelerated exponential growth shape between feedings (Figure 2). The specific methane production rate, km (h−1), was calculated by fitting data to a first-order kinetic Equation (1) similarly as common practice for BMP-tests [15].
C H 4 spec ( t ) = C H 4 max ( 1 e k m t )
On examining the curve of carbon dioxide content between feedings (Figure 2), it was obvious that an initial peak of carbon dioxide release directly after feeding was followed by slower formation. Consequently, data was fitted to two lumped first-order (Equation (2)) functions to describe the total process of CO2 formation, generating a slow and fast formation rate constant, kc1 and kc2 (h−1), respectively:
C O 2 spec ( t ) = C O 2 max ( x ( 1 e k c 1 t ) + ( 1 x ) ( e k c 2 t ) )
Figure 2. Total volume of biogas produced (▬), methane formed ( ), carbon dioxide formed ( ) and methane content of the gas ( ) at day 89. The dotted lines represent the curve-fitted data of methane formed ( - - - ) and carbon dioxide formed ( - - - ).
Energies 08 00645 g002

2.2.2. Rate Constant of Methane Formation (km)

The specific methane production per day remained constant throughout the experiment (Figure 1A), but the rate constant of daily methane formation (km) changed considerably over time (Figure 1B). After introducing administration of additional nickel at day 0, an increase in km occurred, coinciding with increasing OLR (from day 26). The apparent relationship between OLR and rate of methane formation can only be explained speculatively. It could be expected that increasing the OLR would positively influence the total volume of gas produced, but not the rate of production. However, in order to convert a larger amount of added VS per day at a higher OLR, the rate of conversion of the products from acetogenesis would need to increase to avoid accumulation of acetate. Thus, it is possible that the difference in methane formation rate between OLR 4.7 and 6.5 kg·VS·m−3·d−1 was a consequence of higher acetogenesis product formation, allowing for a higher methane formation rate, rather than a direct effect of nickel. This is further supported by the fact that the increase in OLR was only as additional glycerin, a trivalent carbon molecule directly degraded during acetogenesis. In this case, methanogenesis was not the rate-limiting step when nickel was present. There was an increase in km (0.060 ± 0.012 h−1 before nickel administration) reaching a plateau at about 0.12 h−1 (Figure 1B). This plateau level could be the result of the OLR being stable (from day 40), the available nickel being limited or a combination of both (Figure 1B). Nevertheless, when nickel administration was terminated at day 89 and the reactor concentration of the trace metal decreased, the plateau km level was only maintained for a short period until the availability of nickel obviously became the limiting factor (day 100). Thereafter, km rapidly decreased with the nickel concentration until a final plateau (0.037 ± 0.002 h−1) was reached (day 132) independently of OLR, which was stable during this period (Figure 1B). At approximately the same time as km reached its lower plateau, VFA started to accumulate, indicating a connection between these two processes. The accumulation of VFA shows that the km at the lower plateau was too low and that methanogenesis became rate-limiting for the process. These data strongly suggest that nickel is an essential metal catalyst for the formation of methane during anaerobic digestion and that without nickel, methanogenesis became the rate-limiting step in the anaerobic digestion process studied here, which was kept at a high OLR and short HRT. These results are in line with previous findings highlighting the effect of nickel, especially on methanogenesis [11,19,20,21]. They also confirm findings that nickel is an important metal in key enzymes for methanogenesis, such as methyl-coenzyme-M cofactor F430, carbon monoxide dehydrogenase and other hydrogenases [22,23].
In summary, it should be noted that the km value changed upon nickel administration/OLR increase and nickel removal long before commonly used process stability indicators such as VFA or specific methane production responded. The km value could therefore potentially be used as an early warning indicator of methanogenesis instability in semi-continuously fed anaerobic digestion processes.

2.2.3. Rate Constants of Carbon Dioxide Formation (kc1 and kc2)

An initial peak in carbon dioxide release directly after feeding was followed by a slower release (Figure 2). The fast, initial release of carbon dioxide is probably partly attributable to a pH decrease due to VFA in the feed [24] and partly to fast hydrolysis and fermentation of dissolved organic matter during acidogenesis and acetogenesis. The slower release of carbon dioxide could be attributable to the slower continuous processes of hydrolysis of less readily degradable organic matter and methanogenesis.
In contrast to km, after introducing nickel at day 0 there was a slight decrease in the slow carbon dioxide formation rate (kc1). kc1 decreased from 0.05 h−1 (day –25 to 0) down to 0.02 h−1 day 76 when the OLR was increased in presence of nickel (Figure 1C). After termination of nickel administration, kc1 rapidly increased from 0.04 h−1 (day 100) to 0.09 h−1 (day 109). This increase in kc1 occurred simultaneously with the start of the decrease in km. In fact, there was a significant negative correlation (p < 0.05) between kc1 and km from the start of OLR increase (day 26) until day 109 (Figure 1C). However, after day 109 the rate constants were positively correlated. Thus, it is likely that according to our hypothesis regarding carbon dioxide emanating from slow hydrolysis and methanogenesis, kc1 is affected by km. One plausible explanation would be that nickel administration stimulates the degradation of lipids, contributing to a higher methane content in the gas produced, and thus lower carbon dioxide formation rate, but higher km. Karlsson et al. [7] showed that nickel administration was clearly correlated with increased process performance and proliferation of Methanosarcinales. Lipid oxidation is highly dependent on low hydrogen pressure [13], and since Methanosarcinaceae can act as a hydrogen-consuming methanogen, lowering the hydrogen pressure [25], this would result in more favourable lipid degradation conditions. One other explanation could be that nickel stimulates hydrogenotrophic methanogens, thus resulting in a high rate of methanogenesis and consumption of carbon dioxide. Consequently, km is affected negatively and kc1 positively when nickel is removed. Assuming that kc1 is dependent on the hydrolysis of less readily degradable organic matter, it might be comparable to the lumped apparent first-order coefficient (usually denoted khyd) obtained from BMP testing. Vavilin, et al. [26] and Li, et al. [27] have determined a number of kinetic coefficients in mesophilic conditions, among which kitchen waste (0.34 and 0.18 d−1), food waste (0.55 d−1) and slaughterhouse waste (0.35 d−1) are relevant to compare with the substrate mix in the current paper (kc1 0.97 ± 0.49 d−1). Furthermore, Elbeshbishy & Nakhla [28] have reported hydrolysis constants for particulate protein (kprot 0.65 d−1) and carbohydrate (khyd 0.78 d−1). These rates are comparable to our results and it is thus possible that the khyd observed in BMP tests is represented by kc1. The reason why kc1 is slightly higher than khyd could be an effect of the (semi)-continuous operation in our study, which may lead to higher microbial activity because of the already active microorganisms and the higher inoculum: Substrate ratio. In addition, Batstone et al. [29] attempted to obtain khyd for full-scale continuous systems but the coefficient varied substantially, by several orders of magnitude, and identifiability of the constant was generally poor. The estimated rate constants, obtained from the gas flow in the full-scale system, were an order of magnitude higher (>5 d−1) than the constants obtained from BMP testing of the substrates.
In contrast to km and kc1, after introducing nickel there was no significant effect on the fast carbon dioxide formation constant (kc2) of increasing OLR (Figure 1C). Interestingly, kc2 also remained constant after termination of nickel administration (apart from a slight increase between days 101 and 109). There was no significant correlation (p > 0.05) between kc2 and km from the start of OLR increase (day 26) until day 109 (Figure 1C). Hence, in contrast to methanogenesis, the hydrolysis-fermentation process was not affected by the presence of nickel in the reactor.

3. Experimental Section

3.1. Reactor Set-Up

One semi-continuous laboratory-scale reactor [30], with an active volume of approximately 9 L, running at 38 °C was used. The reactor was fed semi-continuously at 24-h intervals. The organic loading rate (OLR) varied according to the schedule shown in Table 1. The substrate used was OFMSW (59%–82% of OLR), slaughterhouse waste (13%–18% of OLR) and glycerin (0%–28% of OLR). The OFMSW slurry (TS, Total solids: 14.9% and VS: 13.3%) was collected from the full-scale pre-treatment plant of the city of Linköping, Sweden were the organic fraction of municipal solid waste (source-separated) was pre-treated to form substrate slurry prior to digestion. The slaughterhouse waste (TS: 11.6% and VS: 10.6%) originated from the local slaughterhouse in Linköping (Scan, Sweden) which mainly slaughter cattle and pigs. Both the OFMSW and slaughterhouse waste fraction were pasteurized in lab-scale (1 h, 70 °C); the substrates was then stored at −18 °C. The glycerine (TS: 75.0% and VS: 67.0%) was a residual product from biodiesel production; it was stored in room temperature during the experiment. The hydraulic retention time (HRT) was set to decrease from 21 to 18 days during the start-up period (day −25 to 0) (Table 1). Tap water was used to dilute the substrate mixture, enabling a constant HRT when the OLR was increased further during the experiment (by lowering the fraction of tap water). On day 54, 85 and 116, the OLR was unintentionally 4.7, 6.0 and 4.7 kg·VS·m−3·d−1, respectively.
Table 1. Schedule of changes to organic loading rate (slaughterhouse waste, the organic fraction of municipal solid waste (OFMSW) and glycerin) and hydraulic retention time (HRT) in the semi-continuously fed anaerobic digester during the experimental period.
Period (days)OLR Slaughterhouse Waste (kg·VS·m−3·d−1)OLR OFMSW (kg·VS·m−3·d−1)OLR Glycerin (kg·VS·m−3·d−1)HRT (Days)
−25 to −150.82.8021
−14 to 250.83.9018
26 to 390.83.90.5–1.618
40 to 1680.83.91.818
A process additive with the goal to achieve a steady-state concentration in the reactor of 0.5 mg·L−1 Co2+ (as CoCl2·6H2O) and 300 mg·L−1 Fe2+ (as FeCl2·4H2O) dissolved in water and HCl was used for the whole experiment (day −25 to day 168) [18]. The first 25-day period (day –25 to day 0) was used as a reference period with no nickel addition. From day 1 to 89, a Ni2+ supplement (as NiCl2·6H2O) was added to the substrate mixture. The dosage of nickel was done to reach a steady-state concentration of 0.4–0.5 mg·L−1 additional nickel in the digestate within seven days, and then keep a constant additional nickel concentration of 0.4–0.5 mg·L−1. The substrate mixture contained a background nickel concentration of approximately 0.4 mg·kg−1.

3.2. Experimental Monitoring and Analyses

A MGC-10 milligas counter (Ritter, Bochum, Germany) was used to measure volumetric biogas production and methane gas concentration was determined every five minutes with a gas sensor (Bluesense, Herten, Germany). VFA were analyzed using a gas chromatograph (Clarus 550, PerkinElmer, Waltham, MA, USA) equipped with a 30 m × 0.32 mm × 0.25 μm Elite-FFAP column [31]. Total solids (TS) content was measured by oven-drying at 105 °C for 20 h. Content of VS was subsequently measured gravimetrically by combusting the TS sample for 3 h at 550 °C. The TS content of the substrate was compensated for the loss of VFA in order to perform calculations on OLR and specific biogas production according to Vahlberg et al. [32]. All volumetric gas data presented in this paper have been converted to standard conditions at pressure 1.01325 bars and temperature 273.2 K. The daily OLR was calculated by dividing the VS weight fed into the digester by the reactor volume plus feeding volume of the previous day.

4. Conclusions

This study evaluated the effects of trace elements, particularly nickel, on process stability in a semi-continuously fed anaerobic digester. Use of conventional process parameters such as VFA and daily methane production failed to identify the positive effects of nickel supplementation of the process. However, an alternative method analyzing the process kinetics during one feeding cycle allowed the changes in methane and carbon dioxide formation rates to be determined over the entire experimental period. Using this method, we were able to show that nickel administration had only indirect or no effects on the hydrolysis rate constant (kc), but a great impact on the methanogenesis rate constant (km). At the high organic loading rates applied in the study, km was 98%–220% higher in the presence of nickel than when nickel was omitted, whereas general process monitoring parameters such as gas production and VFA showed only small indications of differences in process stability. This indicates that km can be used as an efficient early warning indicator of instability in semi-continuously fed anaerobic digesters.

Acknowledgments

The authors would like to thank Martin Karlsson (Linköping University) for valuable discussions and Yasna Calderon for laboratory assistance.

Author Contributions

Erik Nordell and Jan Moestedt designed the experiments; Erik Nordell and Jan Moestedt performed the experiments; Erik Nordell, Jonas Malmborg and Jan Moestedt analyzed the data; Erik Nordell, Jonas Malmborg and Jan Moestedt wrote the paper.

Conflicts of Interest

The authors declare no conflict of interest.

References

  1. Zinder, S.H. Microbiology of anaerobic conversion of organic wastes to methane: Recent developments. Am. Soc. Microbiol. News 1984, 50, 294–298. [Google Scholar]
  2. Angelidaki, I.; Karakashev, D.; Batstone, D.J.; Plugge, C.M.; Stams, A.J.M. Biomethanation and its potential. In Methods in Enzymology: Methods in Methane Metabolism; Rosenzweig, A.C., Ragsdale, S.W., Eds.; Elsevier Academic Press: San Diego, CA, USA, 2011; Volume 494, pp. 327–351. [Google Scholar]
  3. Schnürer, A.; Houwen, F.P.; Svensson, B.H. Mesophilic syntrophic acetate oxidation during methane formation by a triculture at high ammonium concentration. Arch Microbiol. 1994, 162, 70–74. [Google Scholar] [CrossRef]
  4. Weiland, P. Biogas production: Current state and perspectives. Appl. Microbiol. Biotechnol. 2010, 85, 849–860. [Google Scholar] [CrossRef] [PubMed]
  5. Zhang, L.; Lee, Y.W.; Jahng, D. Anaerobic co-digestion of food waste and piggery wastewater: Focusing on the role of trace elements. Bioresour. Technol. 2011, 102, 5048–5059. [Google Scholar] [CrossRef] [PubMed]
  6. Florencio, L.; Field, J.A.; Lettinga, G. Importance of cobalt for individual trophic groups in an anaerobic methanol-degrading consortium. Appl. Environ. Microbiol. 1994, 60, 227–234. [Google Scholar] [PubMed]
  7. Karlsson, A.; Einarsson, P.; Schnürer, A.; Sundberg, C.; Ejlertsson, J.; Svensson, B.H. Impact of trace element addition on degradation efficiency of volatile fatty acids, oleic acid and phenyl acetate and on microbial populations in a biogas digester. J. Biosci. Bioeng. 2012, 114, 446–452. [Google Scholar] [CrossRef] [PubMed]
  8. Kida, K.; Shigematsu, T.; Kijima, J.; Numaguchi, M.; Mochinaga, Y.; Abe, N.; Morimura, S. Influence of Ni2+ and Co2+ on methanogenic activity and the amounts of coenzymes involved in methanogenesis. J. Biosci. Bioeng. 2001, 91, 590–595. [Google Scholar] [CrossRef] [PubMed]
  9. Bayr, S.; Pakarinen, O.; Korppoo, A.; Liuksia, S.; Vaisanen, A.; Kaparaju, P.; Rintala, J. Effect of additives on process stability of mesophilic anaerobic monodigestion of pig slaughterhouse waste. Bioresour. Technol. 2012, 120, 106–113. [Google Scholar] [CrossRef] [PubMed]
  10. Jarvis, A.; Nordberg, A.; Jarlsvik, T.; Mathisen, B.; Svensson, B.H. Improvement of a grass-clover silage-fed biogas process by the addition of cobalt. Biomass Bioenergy 1997, 12, 453–460. [Google Scholar] [CrossRef]
  11. Gustavsson, J.; Svensson, B.H.; Karlsson, A. The feasibility of trace element supplementation for stable operation of wheat stillage-fed biogas tank reactors. Water Sci. Technol. 2011, 64, 320–325. [Google Scholar] [CrossRef] [PubMed]
  12. Ahring, B.K.; Sandberg, M.; Angelidaki, I. Volatile fatty-acids as indicators of process imbalance in anaerobic digesters. Appl. Microbiol. Biotechnol. 1995, 43, 559–565. [Google Scholar] [CrossRef]
  13. Worm, P.; Müller, N.; Plugge, C.M.; Stams, A.J.M.; Schink, B. Syntrophy in methanogenic degradation. In (Endo)Symbiotic Methanogenic Archaea; Hackstein, J.H.P., Ed.; Springer: Berlin, Germany, 2010; Volume 19, pp. 149–173. [Google Scholar]
  14. Deublein, D.; Steinhauser, A. Biogas from Waste and Renewable Resources; Wiley-VCH: Mörlenbach, Germany, 2008. [Google Scholar]
  15. Angelidaki, I.; Alves, M.; Bolzonella, D.; Borzacconi, L.; Campos, J.L.; Guwy, A.J.; Kalyuzhnyi, S.; Jenicek, P.; van Lier, J.B. Defining the biomethane potential (bmp) of solid organic wastes and energy crops: A proposed protocol for batch assays. Water Sci. Technol. 2009, 59, 927–934. [Google Scholar] [CrossRef] [PubMed] [Green Version]
  16. Astals, S.; Nolla-Ardèvol, V.; Mata-Alvarez, J. Anaerobic co-digestion of pig manure and crude glycerol at mesophilic conditions: Biogas and digestate. Bioresour. Technol. 2012, 110, 63–70. [Google Scholar] [CrossRef] [PubMed]
  17. Astals, S.; Venegas, C.; Peces, M.; Jofre, J.; Lucena, F.; Mata-Alvarez, J. Balancing hygienization and anaerobic digestion of raw sewage sludge. Water Res. 2012, 46, 6218–6227. [Google Scholar] [CrossRef] [PubMed]
  18. Ejlertsson, J. Method, a Device, and an Additive for Digesting Organic Matter. U.S. Patent 7947484, 16 July 2006. [Google Scholar]
  19. Pobeheim, H.; Munk, B.; Lindorfer, H.; Guebitz, G.M. Impact of nickel and cobalt on biogas production and process stability during semi-continuous anaerobic fermentation of a model substrate for maize silage. Water Res. 2011, 45, 781–787. [Google Scholar] [CrossRef] [PubMed]
  20. Qiang, H.; Lang, D.L.; Li, Y.Y. High-solid mesophilic methane fermentation of food waste with an emphasis on iron, cobalt, and nickel requirements. Bioresour. Technol. 2012, 103, 21–27. [Google Scholar] [CrossRef] [PubMed]
  21. Feng, X.M.; Karlsson, A.; Svensson, B.H.; Bertilsson, S. Impact of trace element addition on biogas production from food industrial waste-linking process to microbial communities. FEMS Microbiol. Ecol. 2010, 74, 226–240. [Google Scholar] [CrossRef] [PubMed]
  22. Vignais, P.M.; Billoud, B. Occurrence, classification, and biological function of hydrogenases: An overview. Chem. Rev. 2007, 107, 4206–4272. [Google Scholar] [CrossRef] [PubMed]
  23. Ferry, J.G. Enzymology of one-carbon metabolism in methanogenic pathways. FEMS Microbiol. Rev. 1999, 23, 13–38. [Google Scholar] [CrossRef] [PubMed]
  24. Buhr, H.O.; Andrews, J.F. The thermophilic anaerobic digestion process. Water Res. 1977, 11, 129–143. [Google Scholar] [CrossRef]
  25. De Vrieze, J.; Hennebel, T.; Boon, N.; Verstraete, W. Methanosarcina: The rediscovered methanogen for heavy duty biomethanation. Bioresour. Technol. 2012, 112, 1–9. [Google Scholar] [CrossRef] [PubMed]
  26. Vavilin, V.A.; Fernandez, B.; Palatsi, J.; Flotats, X. Hydrolysis kinetics in anaerobic degradation of particulate organic material: An overview. Waste Manag. 2008, 28, 939–951. [Google Scholar] [CrossRef] [PubMed]
  27. Li, Y.; Zhang, R.; Liu, G.; Chen, C.; He, Y.; Liu, X. Comparison of methane production potential, biodegradability, and kinetics of different organic substrates. Bioresour. Technol. 2013, 149, 565–569. [Google Scholar] [CrossRef] [PubMed]
  28. Elbeshbishy, E.; Nakhla, G. Batch anaerobic co-digestion of proteins and carbohydrates. Bioresour. Technol. 2012, 116, 170–178. [Google Scholar] [CrossRef] [PubMed]
  29. Batstone, D.J.; Tait, S.; Starrenburg, D. Estimation of hydrolysis parameters in full-scale anaerobic digesters. Biotechnol. Bioeng. 2009, 102, 1513–1520. [Google Scholar] [CrossRef] [PubMed]
  30. Nordell, E.; Moestedt, J.; Karlsson, M. Biogas Producing Laboratory Reactor. SE Patent 1150954-4, 14 October 2011. [Google Scholar]
  31. Jonsson, S.; Borén, H. Analysis of mono- and diesters of o-phthalic acid by solid-phase extractions with polystyrene-divinylbenzene-based polymers. J. Chromatogr. A 2002, 963, 393–400. [Google Scholar] [CrossRef] [PubMed]
  32. Vahlberg, C.; Nordell, E.; Wiberg, L.; Schnürer, A. Method for Correction of VFA Loss in Determination of Dry Matter in Biomass; SGC Rapport 2013:273; Gas Technology Centre: Malmö, Sweden, 2013. [Google Scholar]

