1. Introduction
An organic Rankine cycle (ORC) employs the same general principles as the steam Rankine cycle, but uses organic fluids with a low boiling point as the working fluid, enabling power generation for a low heat source temperature [
1]. The ORC is considered to be one of the most economic and efficient ways to convert low grade thermal energy, such as geothermal energy, solar thermal energy, recovered waste heat, biomass energy, and ocean thermal energy, into electricity [
2]. In recent years, ORCs have been investigated in many contexts, including technical-economic-market surveys [
1,
3], selection of the working fluid [
4,
5,
6], proof of concept demonstrations [
7,
8], models for optimal control strategies [
9], quasi-dynamic models [
10], running tests of prototypes for ORC systems [
11], and system performance analysis at off-design heat source temperatures [
12].
Because an ORC system provides the heat to power a process, the heat exchanger is a very important component of the system. Moreover, the evaporation temperature related to the working fluid flow rate and the specific enthalpy change is a crucial parameter in an ORC system. Li
et al. [
13] explored the effect of the evaporation temperature on the ORC system thermal and exergy efficiencies and net power output. Their results demonstrated that the system exergy efficiency and net power output increase with an increase in the evaporation temperature.
Another important parameter is the pinch point temperature difference of the heat exchanger system, which also significantly influences the performance of an ORC system. Li
et al. [
14] found that for the system conditions they studied, the optimal pinch point temperature difference of the evaporator was about 13 °C, while the pinch point temperature of the condenser was about 17 °C. The maximum net power output per heat transfer area was achieved for different organic working fluids at nearly the same evaporator pinch point temperature. In addition, they also demonstrated that the optimal pinch point temperature difference of the evaporator decreases with a decrease in the pinch point temperature of the condenser.
Although there have been many studies examining the effect of various system parameters on the performance of ORC systems [
2,
5,
9,
13,
14,
15], detailed analyses of the effect of the heat source conditions on the heat transfer characteristics and system performance have rarely been performed. In our previous study, Fu
et al. [
12] conducted an analytical study on the effect of off-design heat source temperature on the heat transfer characteristics and system performance of an ORC system. The analytical results demonstrated that a higher heat source temperature yields better heat transfer performance of the shell-and-tube type preheater and requires a smaller evaporator heat capacity, and that the net power output and system thermal efficiency increase linearly with increasing heat source temperature. Following that earlier study [
12], in this work an analysis of the heat transfer characteristics and system performance of a 250 kW ORC system at off-design heat source flow rates was conducted using the pressure control approach,
i.e., changing the evaporation pressure to meet the particular system requirements when the heat source flow rate varies from the design value. In addition, the evaporation temperature and pinch point temperature difference were studied for the examined ORC system.
2. System Description
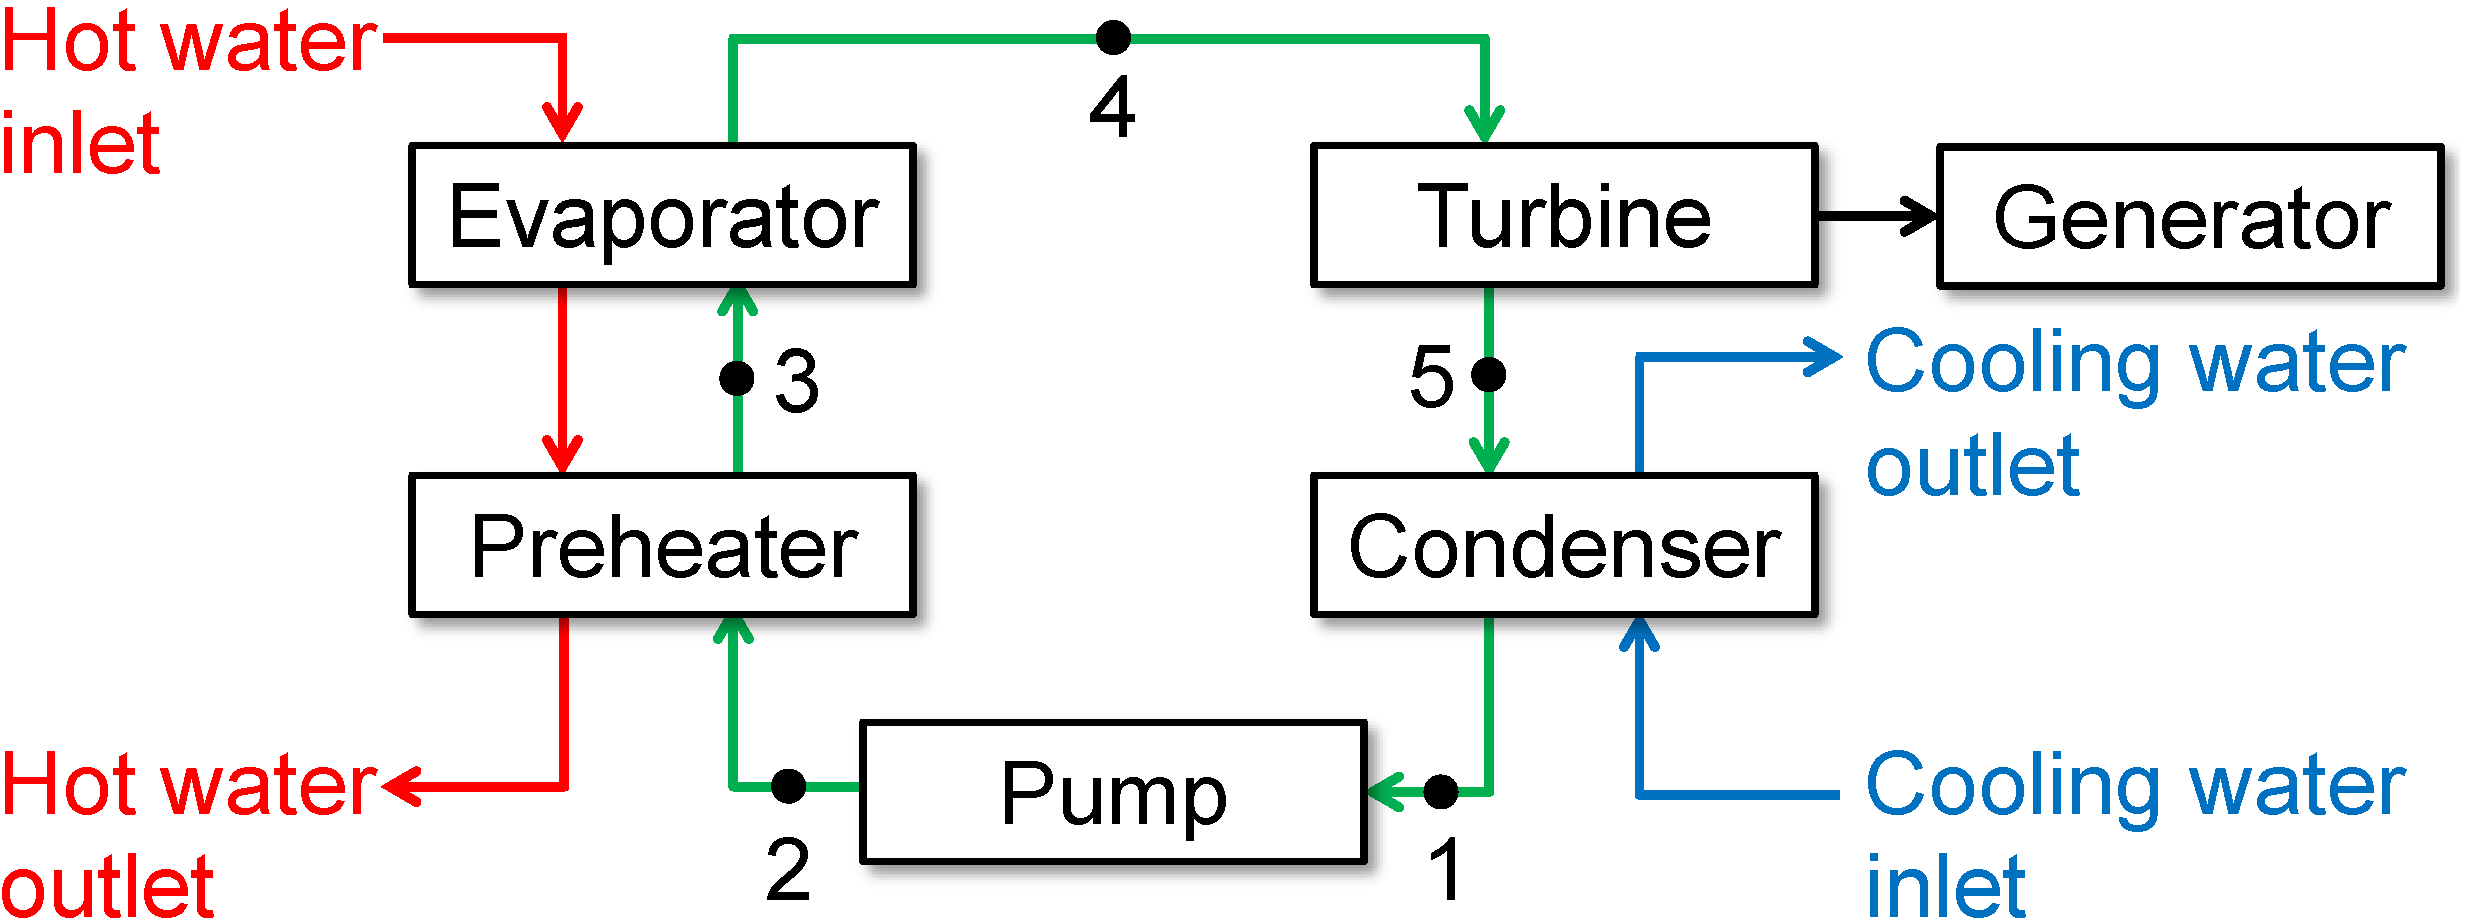
The ORC system studied here is depicted in
Figure 1; it consists of a pump, preheater (shell-and-tube type), evaporator (flooded and shell-and-tube type), turbine, generator, condenser (flooded and shell-and-tube type), and hot water (from a boiler with a maximum capacity of 3788 kW) and cool water (from a cooling tower with a maximum capacity of 1000 RT,
i.e., 3860 kW) circulation systems. The design parameters of the preheater are listed in
Table 1. In this study, enhanced factors of 1.6 and 1.2 were employed when estimating the heat transfer coefficients in the shell side and the tube side, respectively, of the preheater. The refrigerant R245fa was used as the working fluid; this refrigerant is one of the most suitable fluids for low grade waste heat recovery in an ORC system [
16]. The mass flow rate (
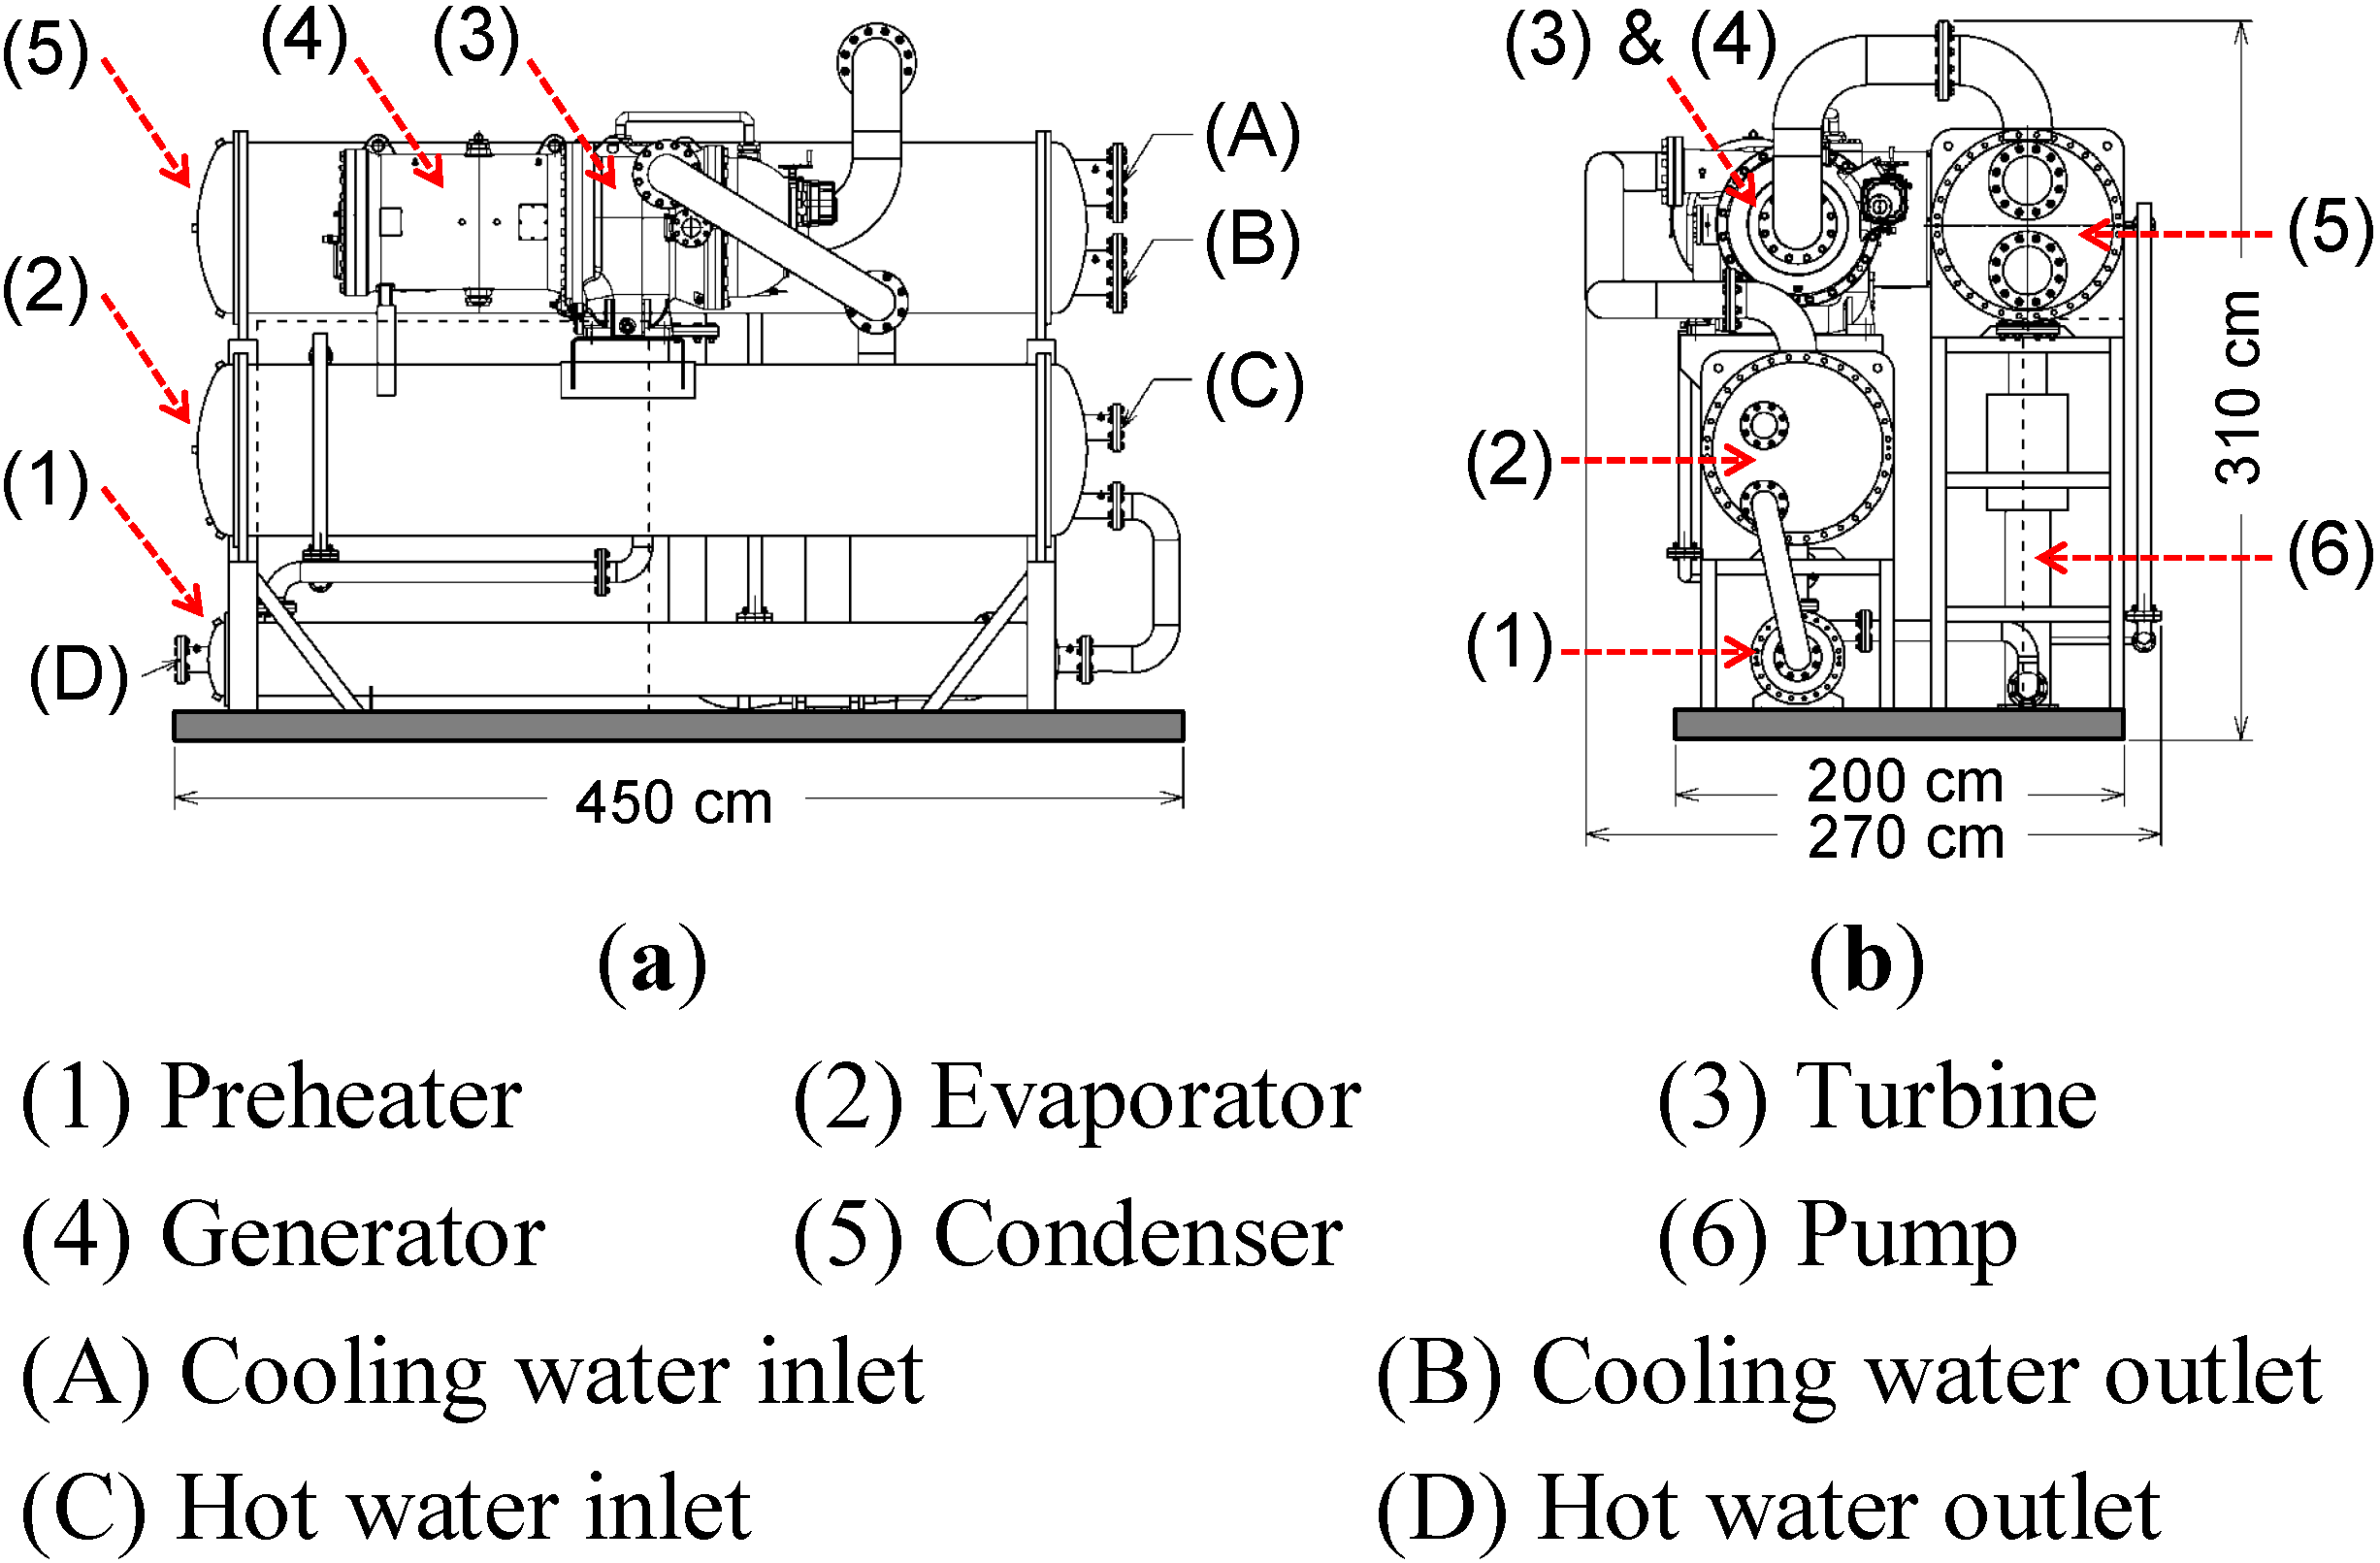
mR) was set to be 11.58 kg/s, which was chosen based on the optimal operating range of the designed turbine. The working fluid R245fa flowed in the shell side of the heat exchangers while hot and cooling water flowed in the tube side. This ORC prototype, the engineering drawing of which is shown in
Figure 2, has recently been under construction at the Industrial Technology Research Institute, Taiwan.
Figure 1.
Schematic diagram of the studied ORC system.
Figure 1.
Schematic diagram of the studied ORC system.
Table 1.
Detailed parameters of the designed preheater.
Table 1.
Detailed parameters of the designed preheater.
| Parameter | Value or type |
|---|
| Tube inner/outer diameter | 1.471/1.587 cm |
| Tube thickness | 0.058 cm |
| Tube number | 200 |
| Tube in window | 83 |
| Tube bundle | 1 pass |
| Tube inner type | Rifled |
| Tube outer type/Fin per inch (FPI) | Low-finned/42 |
| Tube arrangement | Staggered |
| Tube pitch transverse | 1.984 cm |
| Tube pitch longitudinal | 1.718 cm |
| Tube/Shell length | 360 cm |
| Shell inner diameter | 32.45 cm |
| Bundle hole diameter | 1.61 cm |
| Bundle diameter | 31.66 cm |
| Sealing strips number | 0 |
| Nozzle inner diameter | 10 cm |
| Baffle plate diameter | 31.95 cm |
| Baffle thickness | 0.4 cm |
| Baffle spacing | 20 cm |
| Baffle cut | 30% |
| Baffle plate number | 17 |
| Tube side enhanced factor | 1.2 |
| Shell side enhanced factor | 1.6 |
Figure 2.
Engineering drawing of the ORC prototype: (a) front view and (b) right view.
Figure 2.
Engineering drawing of the ORC prototype: (a) front view and (b) right view.
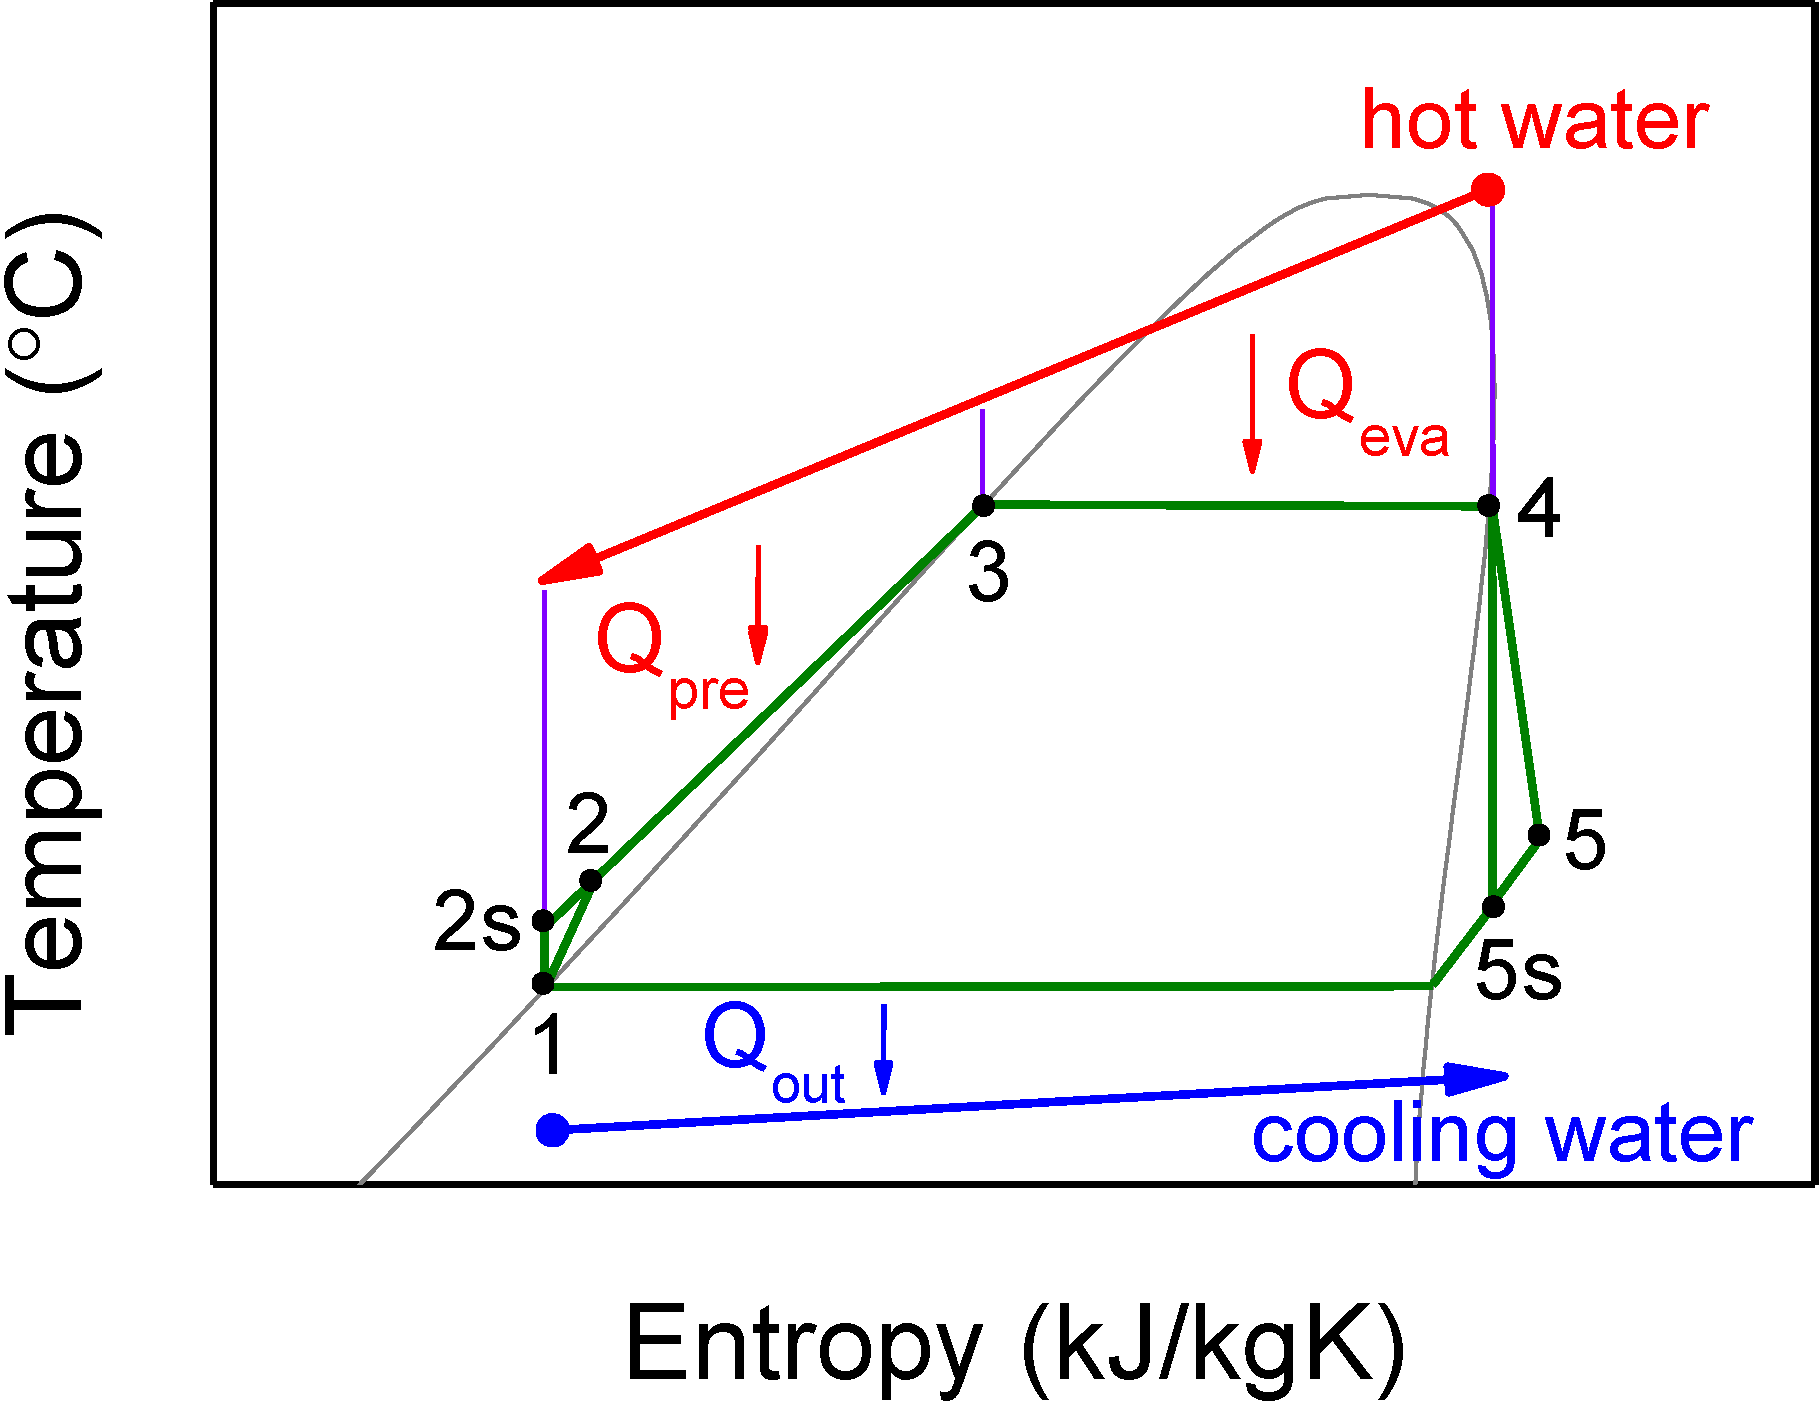
Figure 3 shows the
T-
s diagram of this ORC system. The design operating pressures of the preheater/evaporator and of the condenser are 1.265 MPa (the evaporation/saturation temperature,
TR,eva, is 100 °C) and 0.242 MPa (the condensation temperature is 39 °C), respectively. The designed set point for the heat source (hot water) temperature (
Tw,in) and mass flow rate (
mW) are 133.9 °C and 15.39 kg/s, respectively. Under the design conditions, the net power output is 243 kW and the system thermal efficiency is 9.5%. The analyzed heat source flow rate ranged from 9.39 kg/s to 27.39 kg/s.
Figure 3.
T-s diagram of the ORC system.
Figure 3.
T-s diagram of the ORC system.
3. Analysis Methodology
The following assumptions were made for the present analysis: (1) Each component is in the steady state under both flow and thermal conditions; (2) pressure drops in the heat exchangers (preheater, evaporator, and condenser) can be neglected; (3) the heat loss in each of the components and in the system pipes can be ignored; (4) the pump, turbine, and generator efficiencies are assumed constant of 90%, 80%, and 90%, respectively; (5) for an off-design flow rate of the heat source, a new operating pressure of the preheater/evaporator has to be chosen to meet the following requirements: R245fa reaches the saturation liquid state at the outlet of the preheater (point 3 in
Figure 3) and the saturation vapor state at the outlet of the evaporator (point 4 in
Figure 3),
i.e., zero superheating.
The mathematical models of each component as well as of the system performance are presented below in brief. The system thermal efficiency (
Esys) can be obtained from the following equations:
Here, Wnet is the net power output of the system; Wout is the power output of the generator; Win is the power requirement of the pump; Wtur is the power output of the turbine; hi is the specific enthalpy for i = 1–5, 2s, and 5s; Qtot is the total heat transfer rate of the preheater and evaporator; Qpre is the heat transfer rate of the preheater; Qeva is the heat transfer rate of the evaporator; mR is the mass flow rate of the working fluid, i.e., R245fa; Egen, Etur, and Epump are the efficiencies of the generator, turbine, and pump, respectively; U is the overall heat transfer coefficient; A is the total heat transfer area; ∆Tlm is the logarithmic mean temperature difference (LMTD); hR and hW are the heat transfer coefficients of the shell side (R245fa side) and tube side (water side), respectively, of the heat exchanger; do and di are the outer and the inner diameters, respectively, of the tube; and k is the thermal conductivity of the tube.
Moreover, in this study the heat transfer functioning of the preheater was calculated by the classical effectiveness–NTU method [
17]; and the Bell–Delaware method [
18] (Equation (12)) and the Gnielinski correlation [
19] (Equation (13)) were employed to calculate the heat transfer coefficients of the shell and tube sides, respectively, of the designed shell-and-tube preheater:
where
h0 is the heat transfer coefficient for an ideal tube bundle;
Jc,
Jl,
Jb,
Js, and
Jr are the correction factors for the baffle cut, baffle leakage effects, bundle bypass flow, laminar flow, and unequal baffle spacing, respectively, in the inlet and outlet sections;
f is the friction factor;
Re is the Reynolds number; and
Pr is the Prandtl number.
4. Results and Discussion
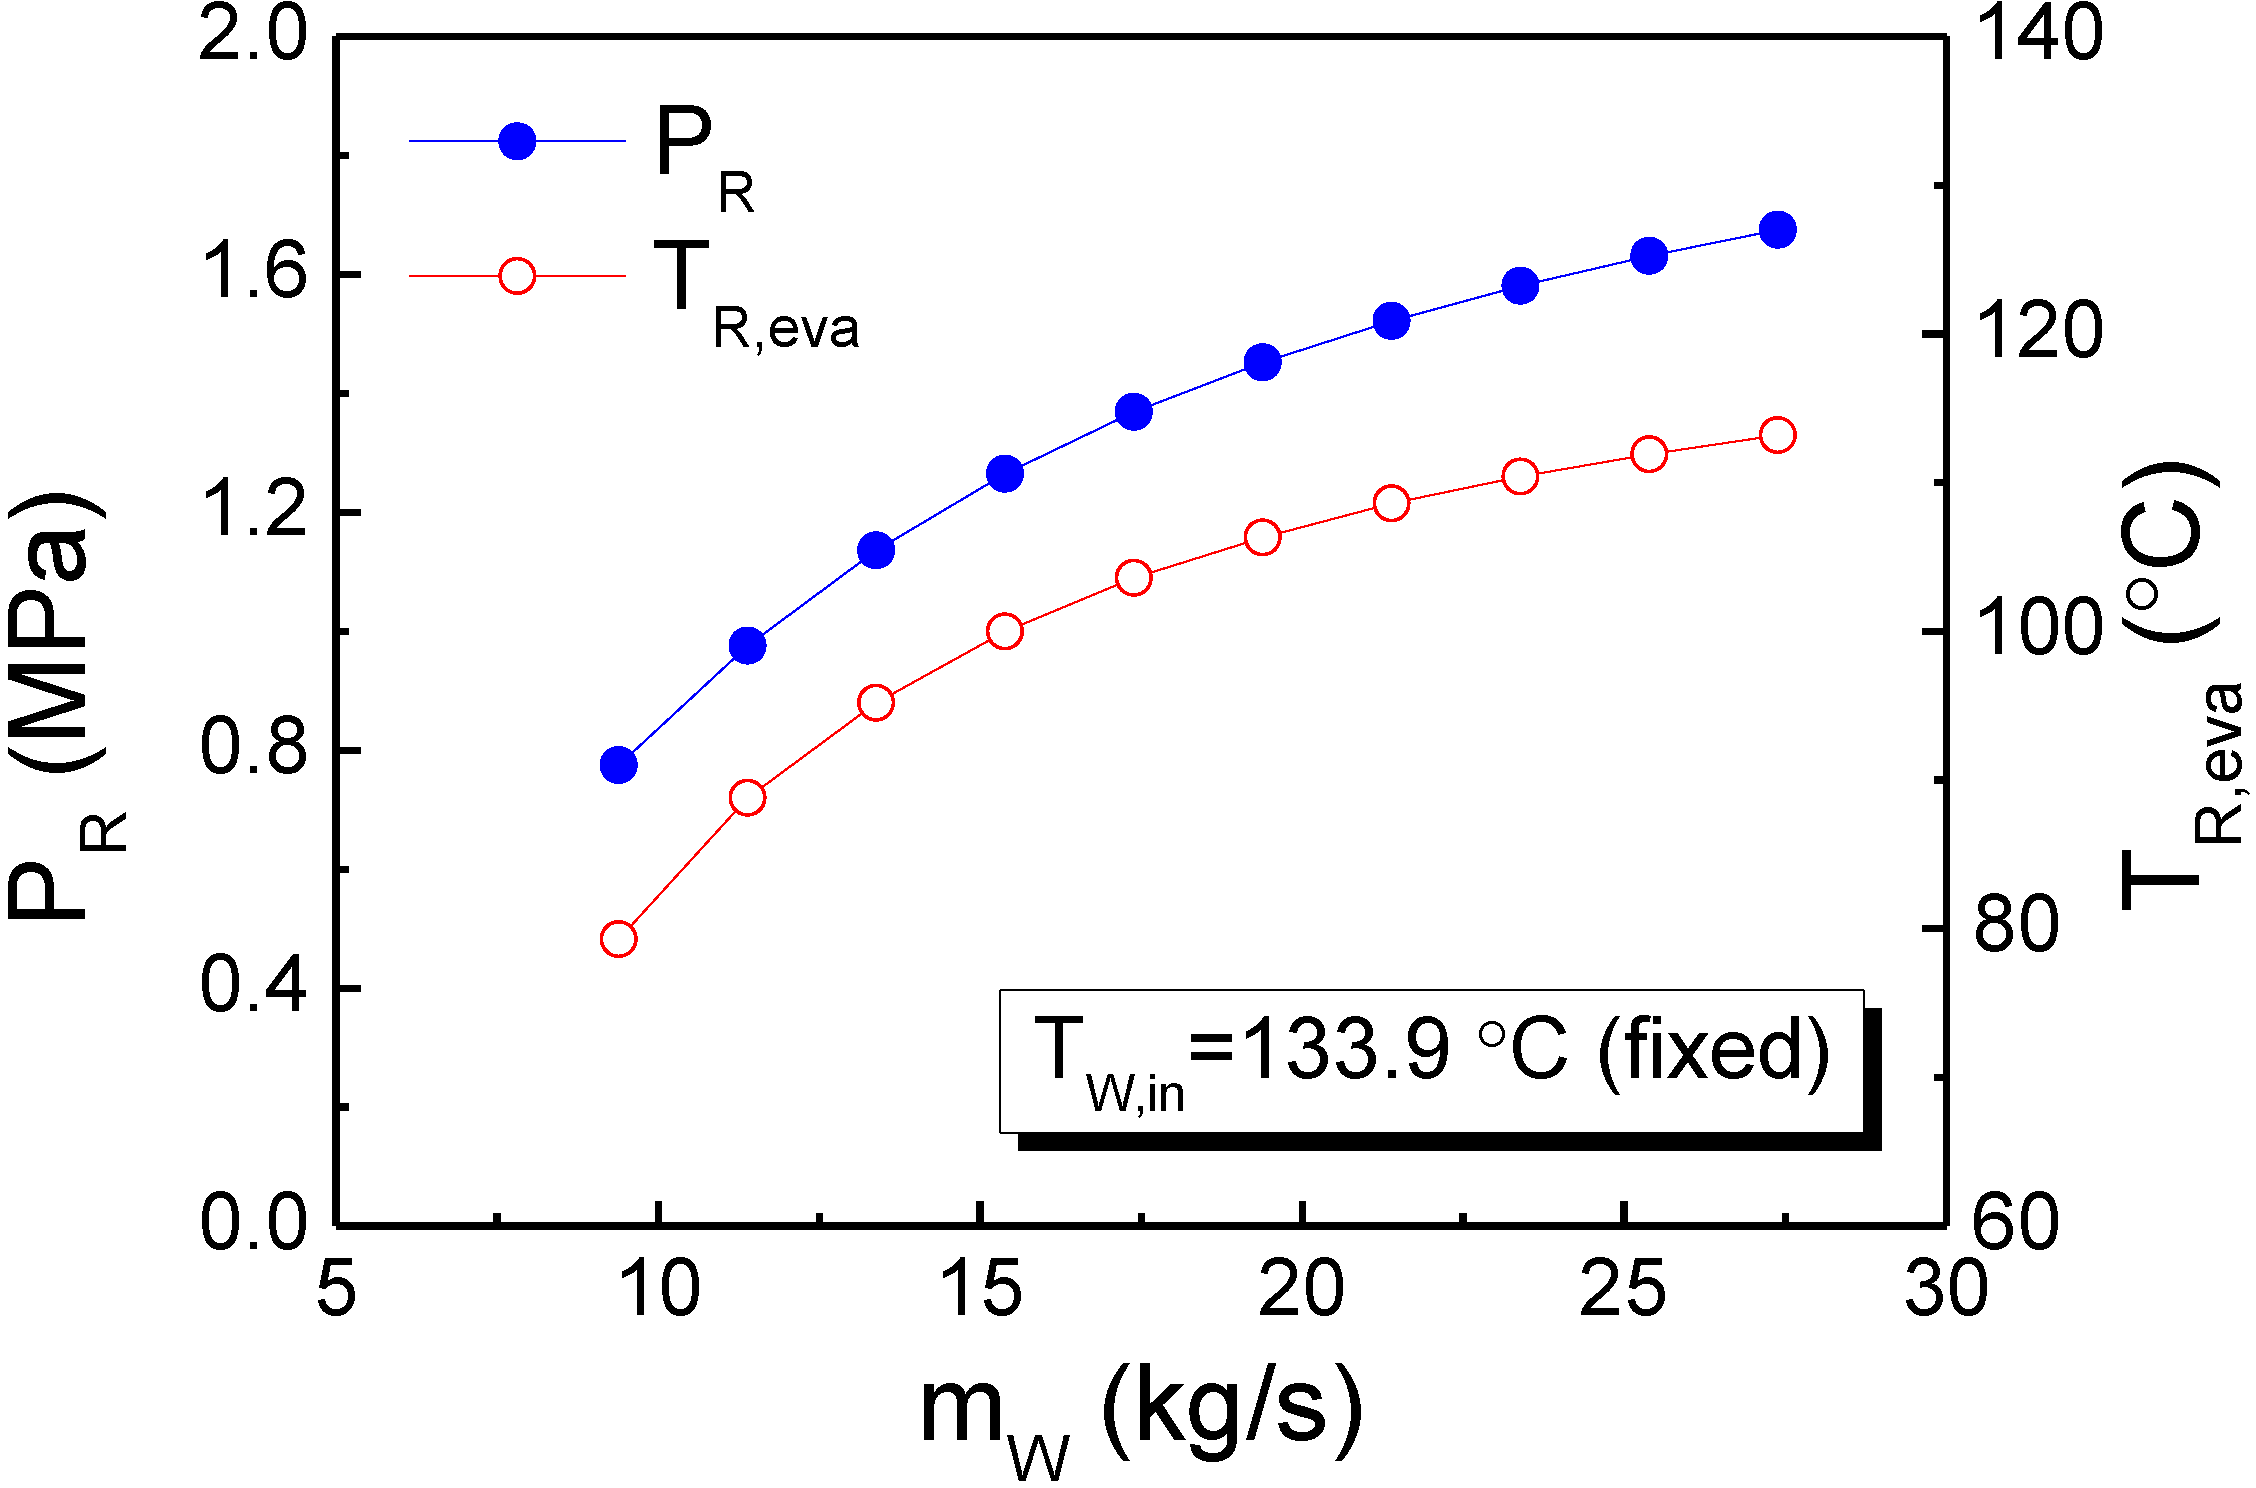
Figure 4 shows the analytical results for the operating pressure (
PR), and evaporation/saturation temperature (
TR,eva) as a function of the heat source flow rate (
mW). As shown in
Figure 4, the operating pressure and evaporation temperature increased from 0.775 MPa to 1.675 MPa and from 79.3 °C to 113.2 °C, respectively, as the heat source flow rate increased from 9.39 kg/s to 27.39 kg/s. Both
PR and
TR,eva increased rapidly for
mW < 17.39 kg/s and gradually for
mW ≥ 17.39 kg/s. This result is mainly due to the fact that the heat source temperature is set to be 133.9 °C. Therefore, for
mW ≥ 17.39 kg/s, the evaporation/saturation temperature increases slowly until it approaches the plateau value, which may be approximately 120 °C. Thus these results can be used as guidelines for this system when choosing the operating pressure and evaporation temperature for off-design heat source flow rates.
Figure 4.
Operating pressure and evaporation temperature as a function of the heat source flow rate.
Figure 4.
Operating pressure and evaporation temperature as a function of the heat source flow rate.
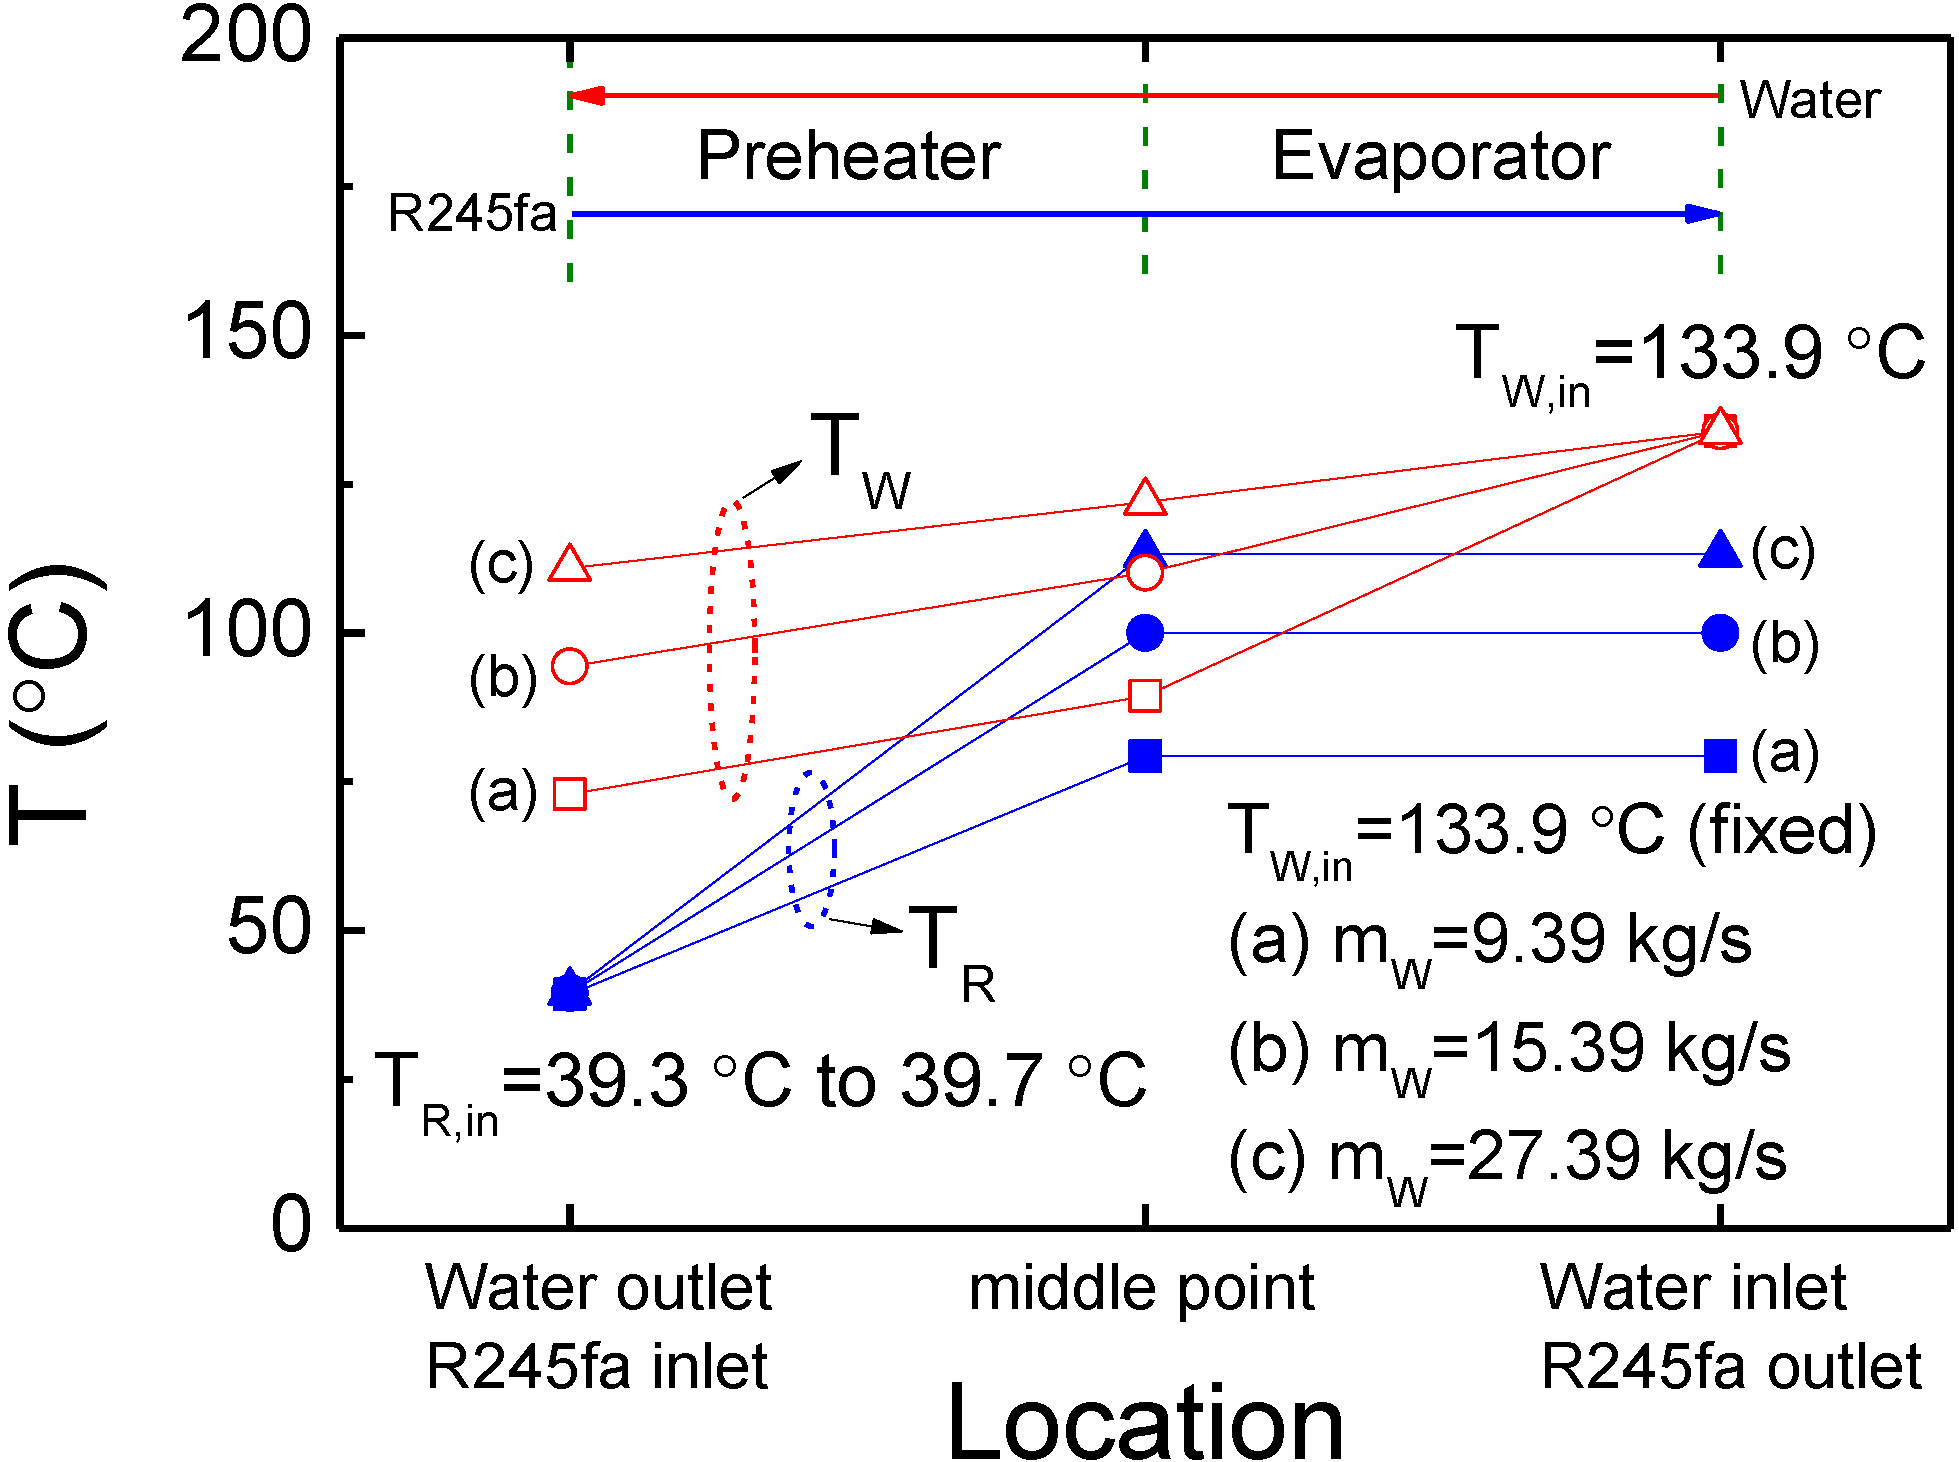
Figure 5 shows the temperature distribution of hot water and R245fa for three different heat source flow rates. Case (b) in
Figure 5 is the design condition of this study. As
mW increased, the inlet temperature of the compressed fluid state R245fa (point 2 in
Figure 3) increased slightly from 39.3 °C to 39.7 °C (due to the different operating pressures in the preheater and evaporator), and the outlet temperature of the hot water increased from 72.9 °C to 110.9 °C. In addition, this figure also illustrates that the minimum temperature difference between the hot and cold streams occurred at the midpoint between the preheater and evaporator; this particular location is considered to be the pinch point of the heat exchanger system. The pinch point temperature differences for cases (a), (b), and (c) are 10.1 °C, 10.1 °C, and 8.8 °C, respectively. These results indicate that for this system the pinch point temperature difference was not significantly affected by
mW. In previous work by Wang
et al. [
16], the optimal recommended pinch point temperature difference at the evaporator was ≤15 °C when the heat source temperature in the ORC system was between 100 °C and 220 °C. Their results also demonstrated that a higher pinch point temperature difference leads to a decrease of the total net power output of an ORC system. Moreover, for engineering applications, the acceptable range of the pinch point temperature difference was 6 °C to 20 °C [
2]. Therefore, when considering ORC system performance, the pinch point temperature differences of the heat exchanger system presented here may be suitable for such applications.
Figure 5.
Temperature distribution of water and R245fa for different heat source flow rates.
Figure 5.
Temperature distribution of water and R245fa for different heat source flow rates.
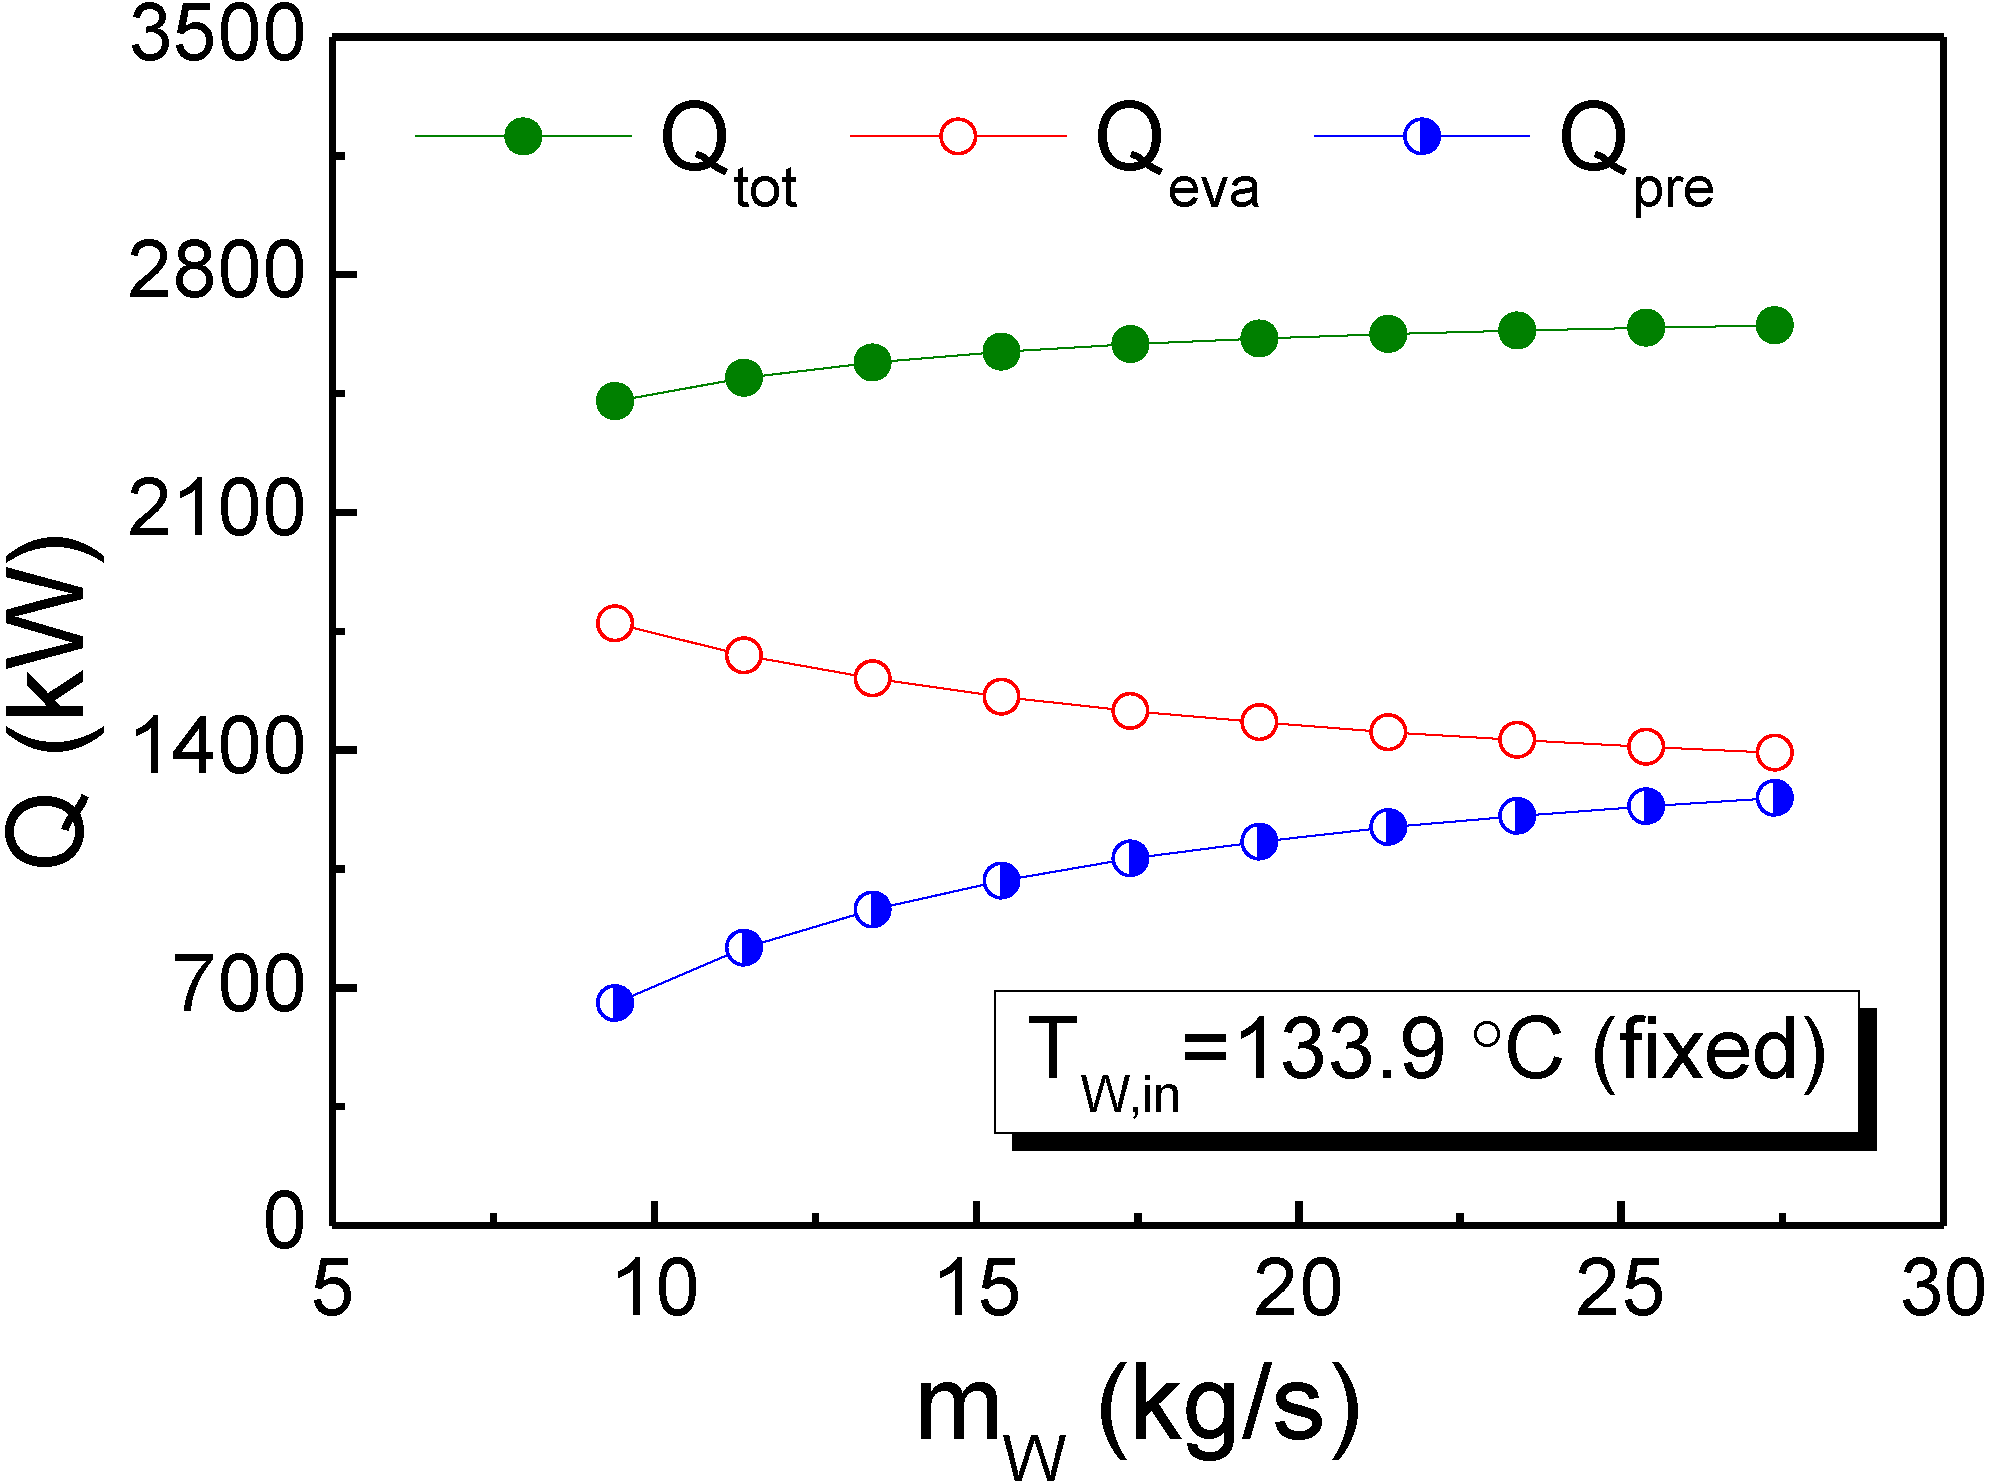
Figure 6 shows the heat transfer rate of the preheater (
Qpre) and the evaporator (
Qeva) as a function of the heat source flow rate. In this figure, the total heat transfer rate (
Qtot) is the sum of
Qpre and
Qeva. It is clearly shown that with an increase in
mW,
Qpre increased from 654 kW to 1258 kW but
Qeva decreased from 1773 kW to 1392 kW. This figure also demonstrates that the increase of
Qpre was larger than that of
Qeva. As a result, the total heat transfer rate increased from 2427 kW to 2650 kW with an increase in
mW. In addition, the change rates of
Qpre,
Qeva, and
Qtot for
mW < 17.39 kg/s were significantly higher than that for
mW ≥ 17.39 kg/s. In summary,
Figure 6 indicates that a higher heat source flow rate resulted in a better heat transfer performance of the designed preheater and required a smaller evaporator heat capacity.
Figure 6.
Heat transfer rate as a function of the heat source flow rate.
Figure 6.
Heat transfer rate as a function of the heat source flow rate.
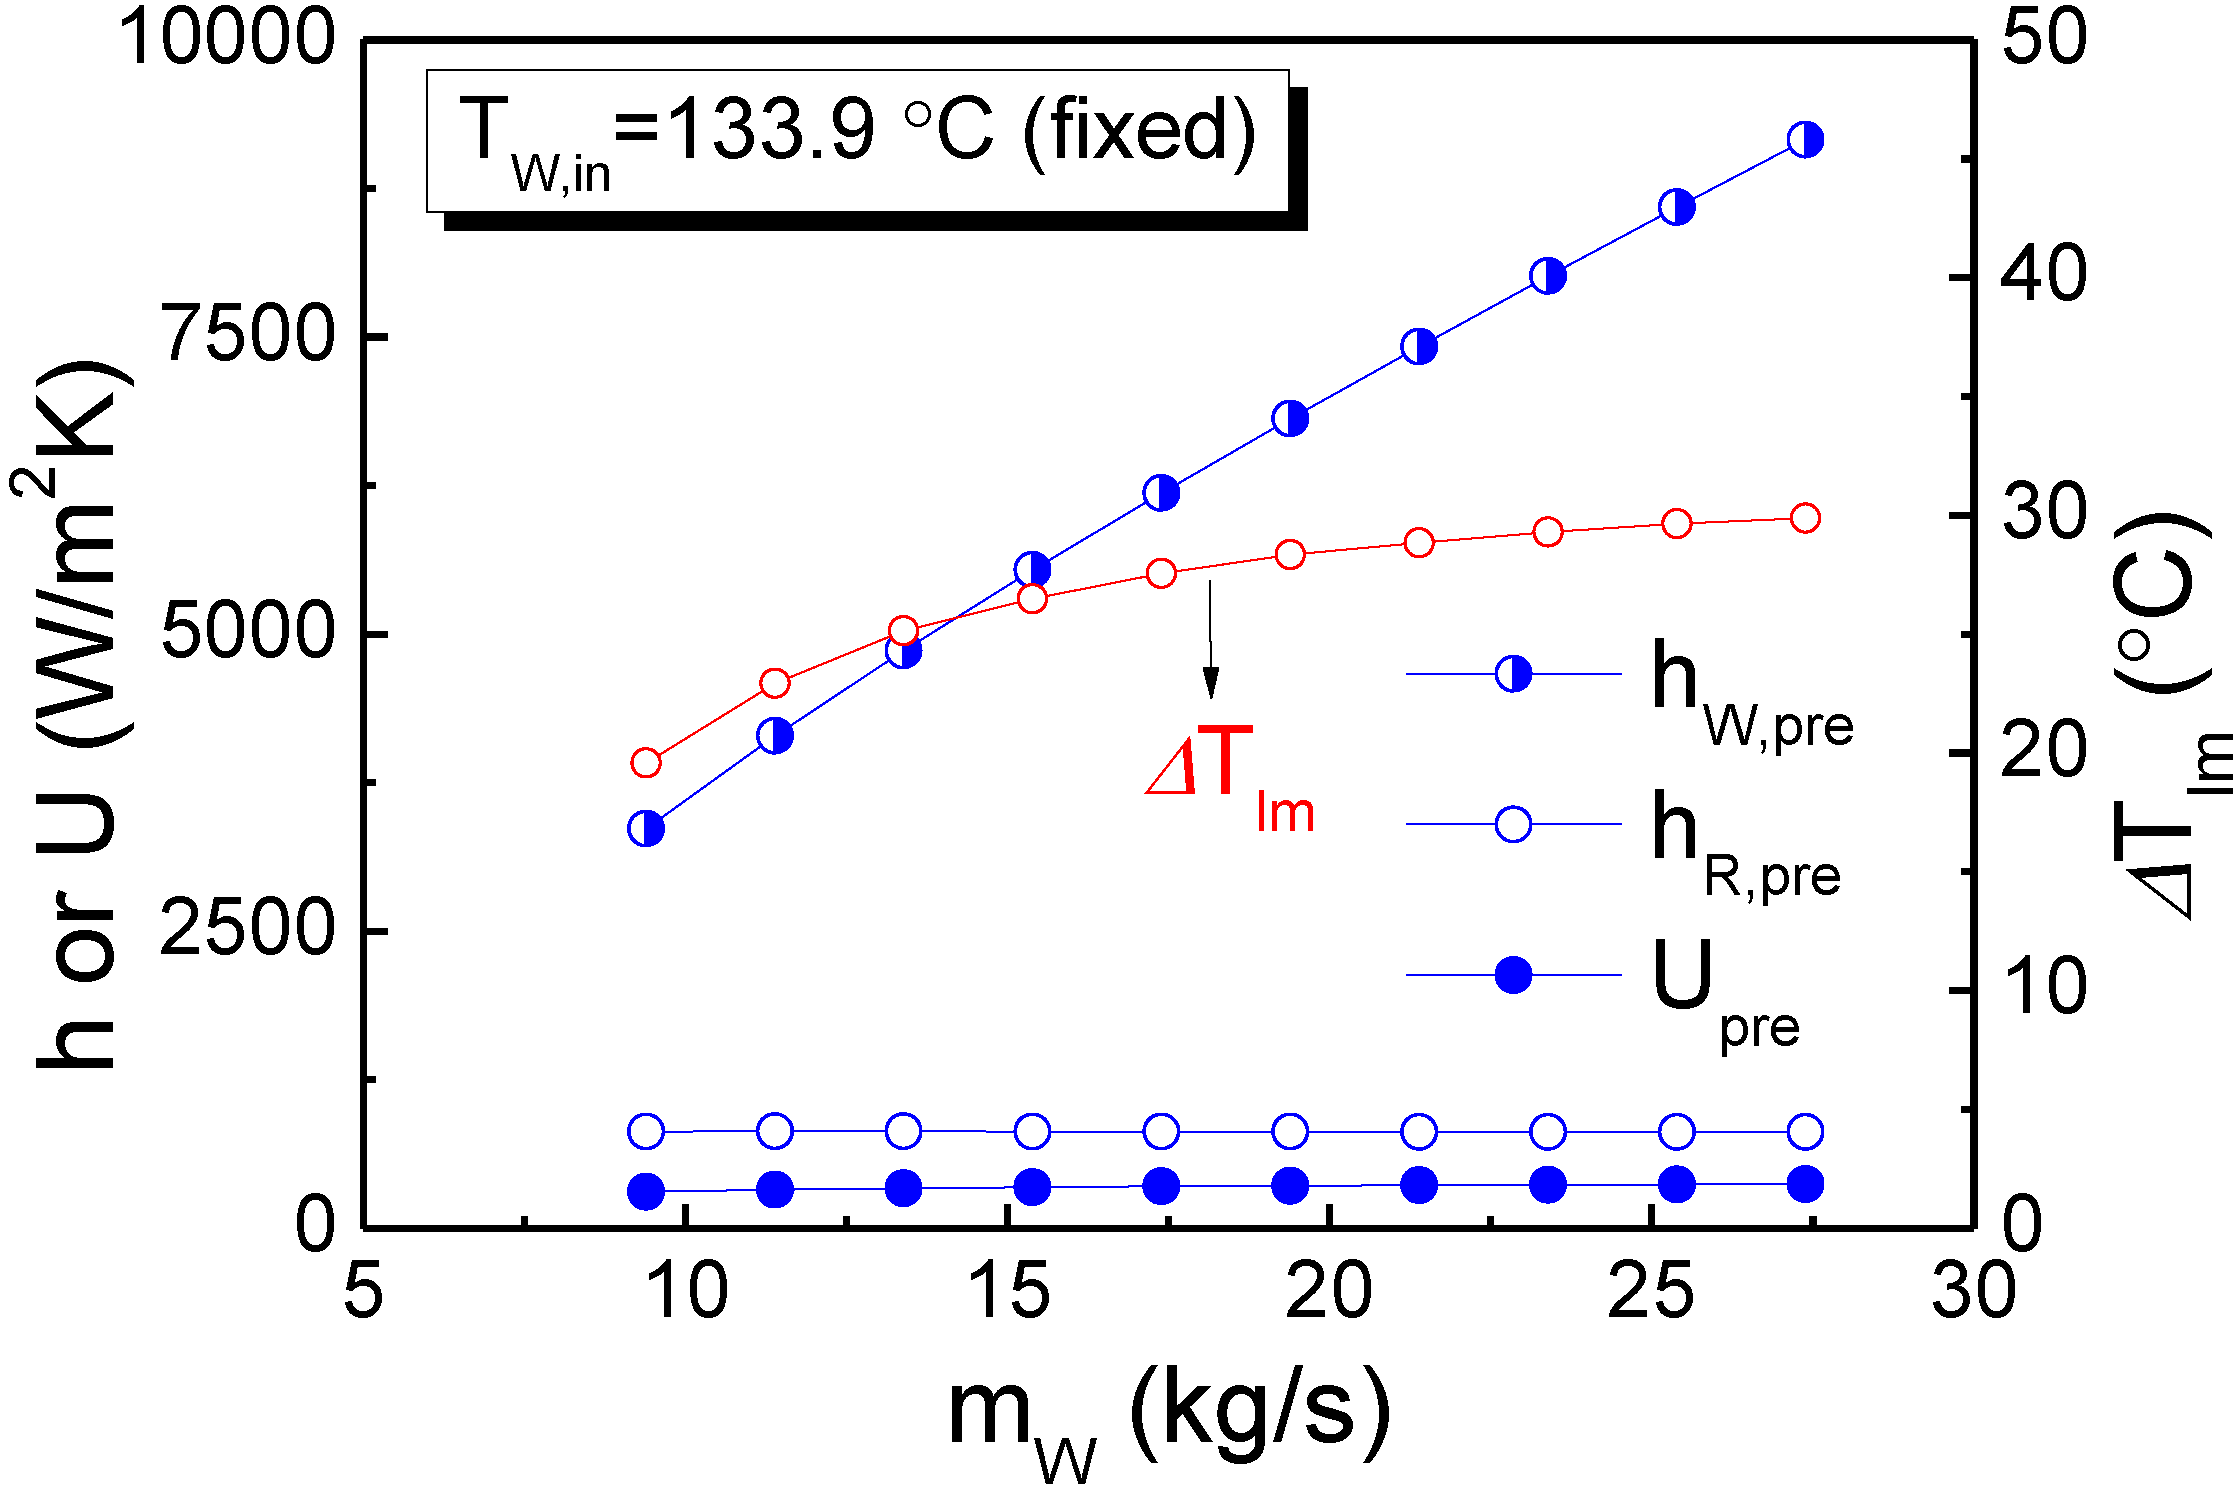
Figure 7 shows the heat transfer coefficient (
h or
U) of the preheater as a function of the heat source flow rate. This figure illustrates that as
mW increased, the heat transfer coefficient of the tube side (
hW,pre) increased rapidly from 3362 W/m
2K to 9162 W/m
2K,
i.e., increasing by 272.5%, at an almost constant increase rate. In contrast, the heat transfer coefficient of the shell side (
hR,pre) remained nearly constant at about 815 W/m
2K. In addition, because the heat transfer coefficient of the shell side was much smaller than that of the tube side, the overall heat transfer coefficient (
Upre) increased gradually from 308 W/m
2K to 373 W/m
2K,
i.e., increasing by only 21.1%. The increase of
Qpre, shown in
Figure 6, resulted from the increase of the overall heat transfer coefficient and the logarithmic mean temperature difference (∆
Tlm), shown in
Figure 7. ∆
Tlm increased from 19.6 °C to 29.9 °C,
i.e., increasing by 52.6%, for the investigated range of
mW values.
Figure 7.
Preheater heat transfer coefficient as a function of the heat source flow rate.
Figure 7.
Preheater heat transfer coefficient as a function of the heat source flow rate.
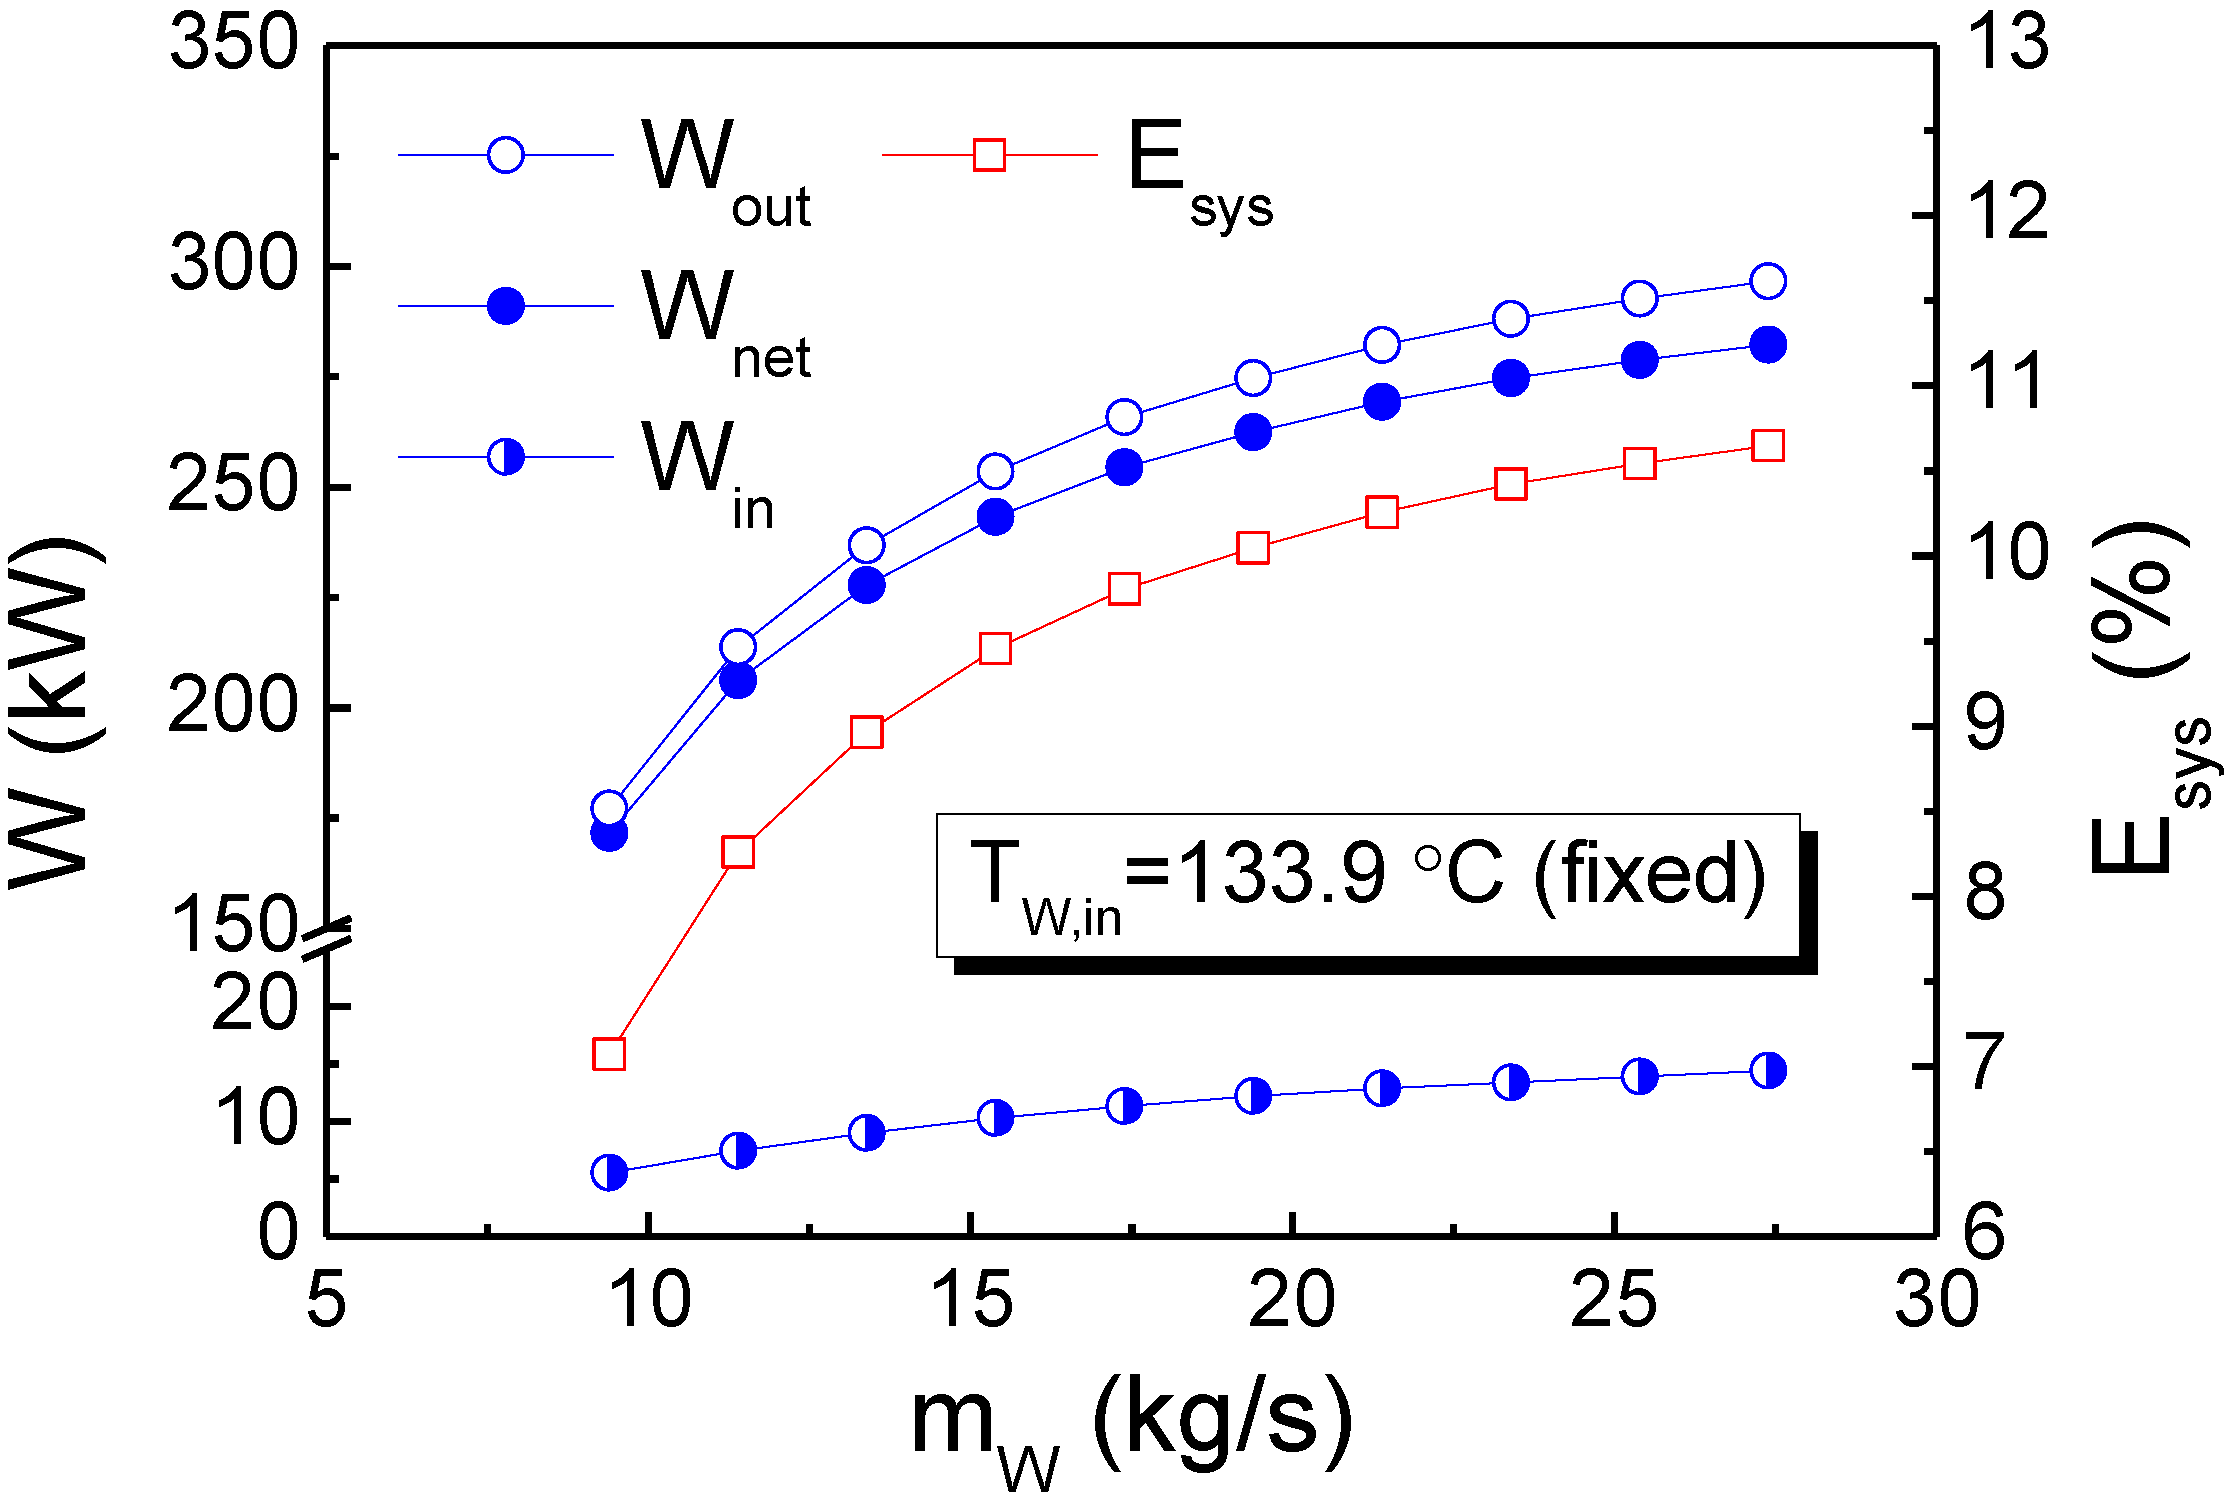
Most importantly, these results further demonstrate that with an increase in
mW, the net power output (
Wnet) and system thermal efficiency (
Esys) increased from 172 kW to 282 kW and from 7.1% to 10.7%, respectively, as shown in
Figure 8. The result also illustrates that the power requirement for the pump (
Win) is 5.5 kW to 14.4 kW, which is only about 3.1% to 4.9% of the power output of the generator (
Wout). Moreover, it is worth mentioning that for the studied range of
mW values, the net power output increased by 64.0% (from 172 kW to 282 kW) while the total heat transfer rate (
Qtot) increased by only 9.2% (from 2427 kW to 2650 kW). This result indicates that the system performance was significantly enhanced by increasing
mW. It is also interesting to note that
Wnet,
Wout,
Win, and
Esys increased rapidly for
mW < 17.39 kg/s but gradually for
mW ≥ 17.39 kg/s, which is similar to the characteristics of
PR and
TR,eva, as shown in
Figure 4. The trend demonstrated by these results can be used as a reference for predicting the operational performance of this system when using off-design heat source flow rates. Finally, it is shown that for off-design operations, a pressure control approach where the heat source flow rate varied between –39.0% to +78.0% with respect to the designed parameters resulted in –29.2% to +16.0% and –25.3% to +12.6% variations in the net power output and system thermal efficiency, respectively.
Figure 8.
Net power output and system efficiency as a function of the heat source flow rate.
Figure 8.
Net power output and system efficiency as a function of the heat source flow rate.
5. Summary and Conclusions
In this paper, an analysis of the effect of the heat source flow rate on the heat transfer characteristics of a preheater and the system performance of a 250 kW organic Rankine cycle (ORC) system was conducted. The refrigerant R245fa was used as the working fluid, with a constant flow rate of 11.58 kg/s. The design conditions for the operating pressures of the preheater/evaporator and the condenser are 1.265 MPa (i.e., evaporation temperature of 100 °C) and 0.242 MPa (i.e., condensation temperature of 39 °C), respectively. The analyzed heat source flow rate (mW) ranged from 9.39 kg/s to 27.39 kg/s with a constant inlet temperature of 133.9 °C. The efficiencies of the pump, turbine, and generator were assumed to be 90%, 80%, and 90%, respectively. For the design conditions, the net power output is 243 kW and the system thermal efficiency is 9.5%.
For an off-design heat source flow rate, a new operating pressure of the preheater/evaporator was chosen to meet the following limitation: R245fa reaches the liquid saturation state at the outlet of the preheater and the vapor saturation state at the outlet of the evaporator,
i.e., zero superheat. The analytical results demonstrated that: (1) the operating pressure of the preheater/evaporator increased from 0.775 MPa to 1.675 MPa (
i.e., the evaporation temperature increased from 79.3 °C to 113.2 °C) with an increase in
mW; (2) a higher
mW yielded better heat transfer performance of the preheater and required a smaller heat capacity of the evaporator; (3) the pinch point temperature differences (8.8 °C to 10.4 °C) of this ORC system were appropriate from a system performance point of view [
2,
16]; and (4) the net power output and system thermal efficiency increased with an increase in
mW, especially for
mW < 17.39 kg/s. Most importantly, these results illustrated that the net power output increased by 64.0% while the total heat transfer rate increased only by 9.2% for the investigated range of
mW values. This result indicates that the performance of this system was significantly improved by increasing
mW. In conclusion, an off-design operation of this ORC system is studied using a pressure control approach for a heat source flow rate which varied by –39.0% to +78.0% from the designed rate, resulting in –29.2% to +16.0% and –25.3% to +12.6% variations in the net power output and system thermal efficiency, respectively.


