Article

Comparative Analysis of Power Plant Options for Enhanced Geothermal Systems (EGS)

Department of Mechanical Engineering and Applied Mechanics, University of Pennsylvania, Philadelphia, PA 19104-6315, USA
*
Author to whom correspondence should be addressed.
Energies 2014, 7(12), 8427-8445; https://doi.org/10.3390/en7128427
Submission received: 31 October 2014 / Revised: 2 December 2014 / Accepted: 10 December 2014 / Published: 17 December 2014

Abstract

:
Enhanced geothermal systems (EGS) extract heat from underground hot dry rock (HDR) by first fracturing the HDR and then circulating a geofluid (typically water) into it and bringing the heated geofluid to a power plant to generate electricity. This study focuses on analysis, examination, and comparison of leading geothermal power plant configurations with a geofluid temperature from 200 to 800 °C, and also analyzes the embodied energy of EGS surface power plants. The power generation analysis is focused on flash type cycles for using subcritical geofluid (<374 °C) and expansion type cycles for using supercritical geofluid (>374 °C). Key findings of this study include: (i) double-flash plants have 24.3%–29.0% higher geofluid effectiveness than single-flash ones, and 3%–10% lower specific embodied energy; (ii) the expansion type plants have geofluid effectiveness > 750 kJ/kg, significantly higher than flash type plants (geofluid effectiveness < 300 kJ/kg) and the specific embodied energy is lower; (iii) to increase the turbine outlet vapor fraction from 0.75 to 0.90, we include superheating by geofluid but that reduces the geofluid effectiveness by 28.3%; (iv) for geofluid temperatures above 650 °C, double-expansion plants have a 2% higher geofluid effectiveness and 5%–8% lower specific embodied energy than single-expansion ones.

1. Introduction and Objectives

Geothermal energy is abundant, with a long term potential estimated to be more than 200,000-fold the current world energy demand [1] if hot dry rock resources at a depth of 10 km or more would become economically accessible. It is usually available at a steady supply rate and is thus much more usable than the intermittent and unsteady wind and solar [2]. Up to the year 2010, the total installed capacity of geothermal power plants worldwide was 10,898 MW, corresponding to about 67.25 TWh of electricity with an average plant capacity factor of 70.4% [3]. The forecast for 2015 is 140 TWh/year and the expected minimum by 2050 will be 1200 TWh/year [3].
Geothermal resources exist mainly in two categories: convection dominant and conduction dominant. A convection dominant resource, also called natural hydrothermal system, contains sufficient natural hot fluid that can be brought directly to the surface for electricity generation. A conduction dominant resource does not have natural fluid and the heat is contained in hot dry rock (HDR), with the systems designed to use HDR resources are called engineered or enhanced geothermal systems (EGS). A typical EGS contains three parts, injection and production wells, engineered reservoir and a surface power plant. EGS system requires circulating water (geofluid) between the surface-located power plant and the underground engineered reservoir, where the geofluid is heated in the reservoir by its passage through the surrounding hot rocks and brought back to the surface power plant to generate electricity.
All current commercial geothermal power plants are from hydrothermal resources, while plants based on essentially dry hot rock reservoirs are expected to be commercial in the future. The growth rates of geothermal energy usage over many regions have been over 10% per year [3] and the geothermal exploitation techniques and understandings of the geothermal reservoirs are developing rapidly over the past decade or two.
The geothermal gradient (temperature rise with depth) of HDR resource typically ranges between 10 and 100 °C/km [4]. In the continental US within the depth of 10 km, more than 99% of the geothermal energy is contained in hot rocks [1]. Aiming at HDR resource to the depths of 10 km, the geofluid temperatures are 100–800 °C, thus having a very high power generation potential that increases with depth. In EGS it is generally recommended that the geofluid be kept and sent to the power plant in liquid or supercritical phase, rather than in the vapor phase [1,2,5]. Consequently, EGS power plants in this temperature range are configured to use liquid/supercritical geofluid.
A brief review of most common designs for EGS power system is presented below. More in-depth discussion of the design, unit processes, usage and optimizations of these systems can be found in [1,2,6,7,8,9,10,11,12] and some other sources. There are generally three basic configurations of power plants could be used in EGS power generation:
  • Flash-type, including single-flash, double-flash and multiple-flash. In flash type plants, the liquid phase geofluid is flash-evaporated to a lower pressure to generate vapor for power generation. Flash-type is often applied when the geofluid exceeds 150 °C [2]. The higher the temperature of the geofluid, the more flash steps could be applied to improve the power plant’s overall thermodynamic efficiencies. However, the system and its operation and maintenance complexity increase with the number of flash stages, so, double-flash is commonly used for high temperature resources (>250 °C) [2].
  • Binary-type, which are widely used in extracting thermal energy from low and moderate grades geothermal resource (usually below 150 °C), when direct flashing the geofluid is undesired. The limit could rise to 200 °C by selecting proper secondary fluid [4,13]. The basic idea of binary cycles is to use a different fluid as the cycle working fluid, heated up to evaporate by the geothermal fluid in evaporator, and produce work by its flow through a turbine. The steam exhaust from the turbine is then condensed by a condenser and returned to the evaporator in a closed loop. The secondary fluid is chosen to be compatible in many ways with the geofluid temperature so as to yield optimized system thermodynamic and economic performance. Secondary fluids include hydrocarbons, chlorofluorocarbons and ammonia. The criteria for working fluid choice include heat transfer and thermodynamic performance, flammability (hydrocarbons are highly flammable), impact on the environment (chlorofluorocarbons deplete ozone and have strong global warming potential), and turbine erosion potential due to expansion into the mixed liquid-vapor phase region [12,14,15,16,17,18,19,20].
  • Expansion-type, including triple, double, or single expansion. Such cycles are used to convert the thermal energy from supercritical geofluid to power [1]. The supercritical geofluid expands in a super pressure turbine (SPT) to generate electricity. Exhausted geofluid from SPT are separated into vapor and liquid, where vapor could generate electricity in a lower pressure turbine and liquid could flash to generate electricity as in flash-type plant.
The main objective of this work is to compare leading geothermal power plant configurations and to propose most suitable plant configurations for mid-high grade [21,22] deep HDR resources where the geofluid temperature ranges from 200 to 800 °C. Single-flash and double-flash cycles are studied for electricity generation using subcritical geofluid (<374 °C) and triple-expansion, double-expansion and single-expansion cycles are chosen for using supercritical geofluid (>374 °C).

2. Methodology

The analysis is by simulation, using ASPEN PLUS software [23]. The results are aimed at sensitivity analysis of main criteria of system performance to power plant configuration and operating conditions (such as the geofluid temperature), with an ultimate objective to select best plant configurations for particular operating conditions.
Air-cooled condensers are used in the analyzed systems, and water-cooled condensers using an evaporative cooling tower are simulated for comparison as described in Section 3.4. In our simulation, air-cooled condensers are modeled with the ASPEN PLUS build-in block “Heat Exchanger”.
Water injected into an EGS reservoir often picks up various minerals and gases. A thorough analysis should include their effects on evaporation, condensation and scale formation. The associated complexity that is associated with their consideration in system analysis, accompanied by insufficient experimental information on their amount in various EGS systems, and the fact that typically their content in the geofluid is much lower in EGS than in hydrothermal geothermal fluids, led most of the past published studies that present calculations of EGS power output to assume that the geofluid is pure [1,7,9,10,11,24], and we have similarly assumed in this study that the EGS geofluid is pure water devoid of gases and minerals.

2.1. The System Performance Criteria

To evaluate the overall performance of geothermal power cycles, we define the plant “utilization efficiency” ηU, which measures the extent to which the available exergy of the geofluid is put to practical use [25], as:
η U = W ˙ net E ˙ gf_in = W ˙ turbine η g W ˙ parasitic m ˙ gf_in e gf_in
where:
  • net—Network produced by the plant, kW;
  • E ˙ g f _ i n —Total exergy of geofluid input to the power plant, kW;
  • turbine—Total work produced by turbines, kW;
  • ηg—Electric generator efficiency;
  • parasitic—Total parasitic power consumption, including the power consumption of fans in air-cooled condensers (fan_cond) and all other geofluid pumps (∑gp,i) power consumptions. For air-cooled cycles, parasitic = ∑gp,i + fan_cond, kW;
  • gf_in—geofluid mass flow rate fed to the power plants, kg/s.
  • egf_in—Specific exergy of the geofluid fed to the power plant, kJ/kg.
In addition to the plant utilization efficiency ηU, the energy efficiency (ηI) and exergy efficiency (ηII) of the plants are also calculated [25]:
η I = W ˙ net Δ H ˙ hf = W ˙ turbine η g W ˙ parasitic m ˙ gf_in Δ h gf
η ΙΙ = W ˙ net Δ E ˙ gf = W ˙ turbine η g W ˙ parasitic m ˙ gf_in Δ e gf
where:
  • Δhf—the total enthalpy difference between the geofluid fed to and leaving the plant, kW;
  • Δhgf—the specific enthalpy difference between the geofluid fed to and leaving the plant, kJ/kg;
  • Δ E ˙ g f —the total exergy difference between the geofluid fed to and leaving the plant, kW;
  • Δegf—the specific exergy difference between the geofluid fed to and leaving the plant, kJ/kg.
We also define a specific net power output as geofluid effectiveness GFe:
G F e = W ˙ net m ˙ gf_in = η U e gf_in
which has units of kJ/kg and is a measure of the specific net work of the geofluid. For given feed geofluid temperature and pressure (given egf_in), GFe is determined by ηU. GFe and ηU are thus thermodynamically equivalent. We used GFe as the thermodynamic criterion to compare power plants, just as many authors did, because it is proportional to the total power output of the plants. Other efficiencies are computed for reference.

2.2. Model Design Specifications and Parameters

To validate our simulation inputs, our modeling is on the same basis with the binary cycle modeling from [13], which also used ASPEN PLUS for their simulation. Furthermore, the results from [13], obtained there in the low geofluid temperature range of 100–200 °C, could thus supplement those from our study that was for temperatures > 200 °C. Inputs and constraints used in model developments are listed in Table 1.
Table 1. Inputs and constraints of thermodynamic analysis.
ParameterSymbolValue or Constraint
Cooling fluid into condenser, and the Dead State
TemperatureTcf_in, T020 °C
PressurePcf_in, P00.1 MPa
Absolute humidity of airdin6.33 g water vapor per kg of dry air
Condenser
Pinch point temperature differenceΔTpp10 °C
Pressure dropΔPcond0
Condensing temperatureTcond50 °C
Condensing pressurePcond0.0123 MPa
Efficiencies
Turbine isentropic efficiencyηII,tb0.85
Pump isentropic efficiencyηII,pump0.80
Generator energy efficiencyηg0.98
Others
Flashing pressurePFL≥0.1 MPa
Geofluid injection temperatureTgf_out≥60 °C
Geofluid injection pressurePgf_outPgf_in
Specific parasite power consumption of cooling systemfan/air0.25 kJ/(kg air) [13]
Mass flow rate of geofluid into the cyclegf_in100 kg/s
Subcritical feed geofluid pressurePgf_inPgf_in = Psat (Tgf-in)
Pressure difference of two mixing streamsΔPmix0
In EGS application, mineral precipitation in injection wells should be avoided to reduce clogging of the geofluid flow paths in the hot rocks and thus preserve the heating of the geofluid. The geofluid re-injection temperature should therefore have a low bound limit to prevent mineral precipitation in the injection wells and the underground reservoir. This temperature is dependent on the type and concentration of minerals, which is site dependent, and past studies showed that this temperature to be around 60–80 °C [1,8,10]. We choose 60 °C in this study.
For air-cooled cycles, the parasitic power fan_cond is estimated as the fan electricity consumption recommended in [13] of 0.25 kJ/(kg air). The power consumption of geofluid pumps ∑gp,i is calculated by the simulation programs, depending on the pressure increase requirement of the pumps.
Other assumptions are:
  • The flashing process is isenthalpic [2].
  • Only streams of the same pressure are allowed to mix, and mixing process is isobaric [2]. Streams are brought to the same pressure either by pumps or valves before mixing.
  • The fluid properties are calculated in ASPEN PLUS [24] using the International Association for Properties of Steam (Steam_IAPWS).

2.3. Power Plant Configurations
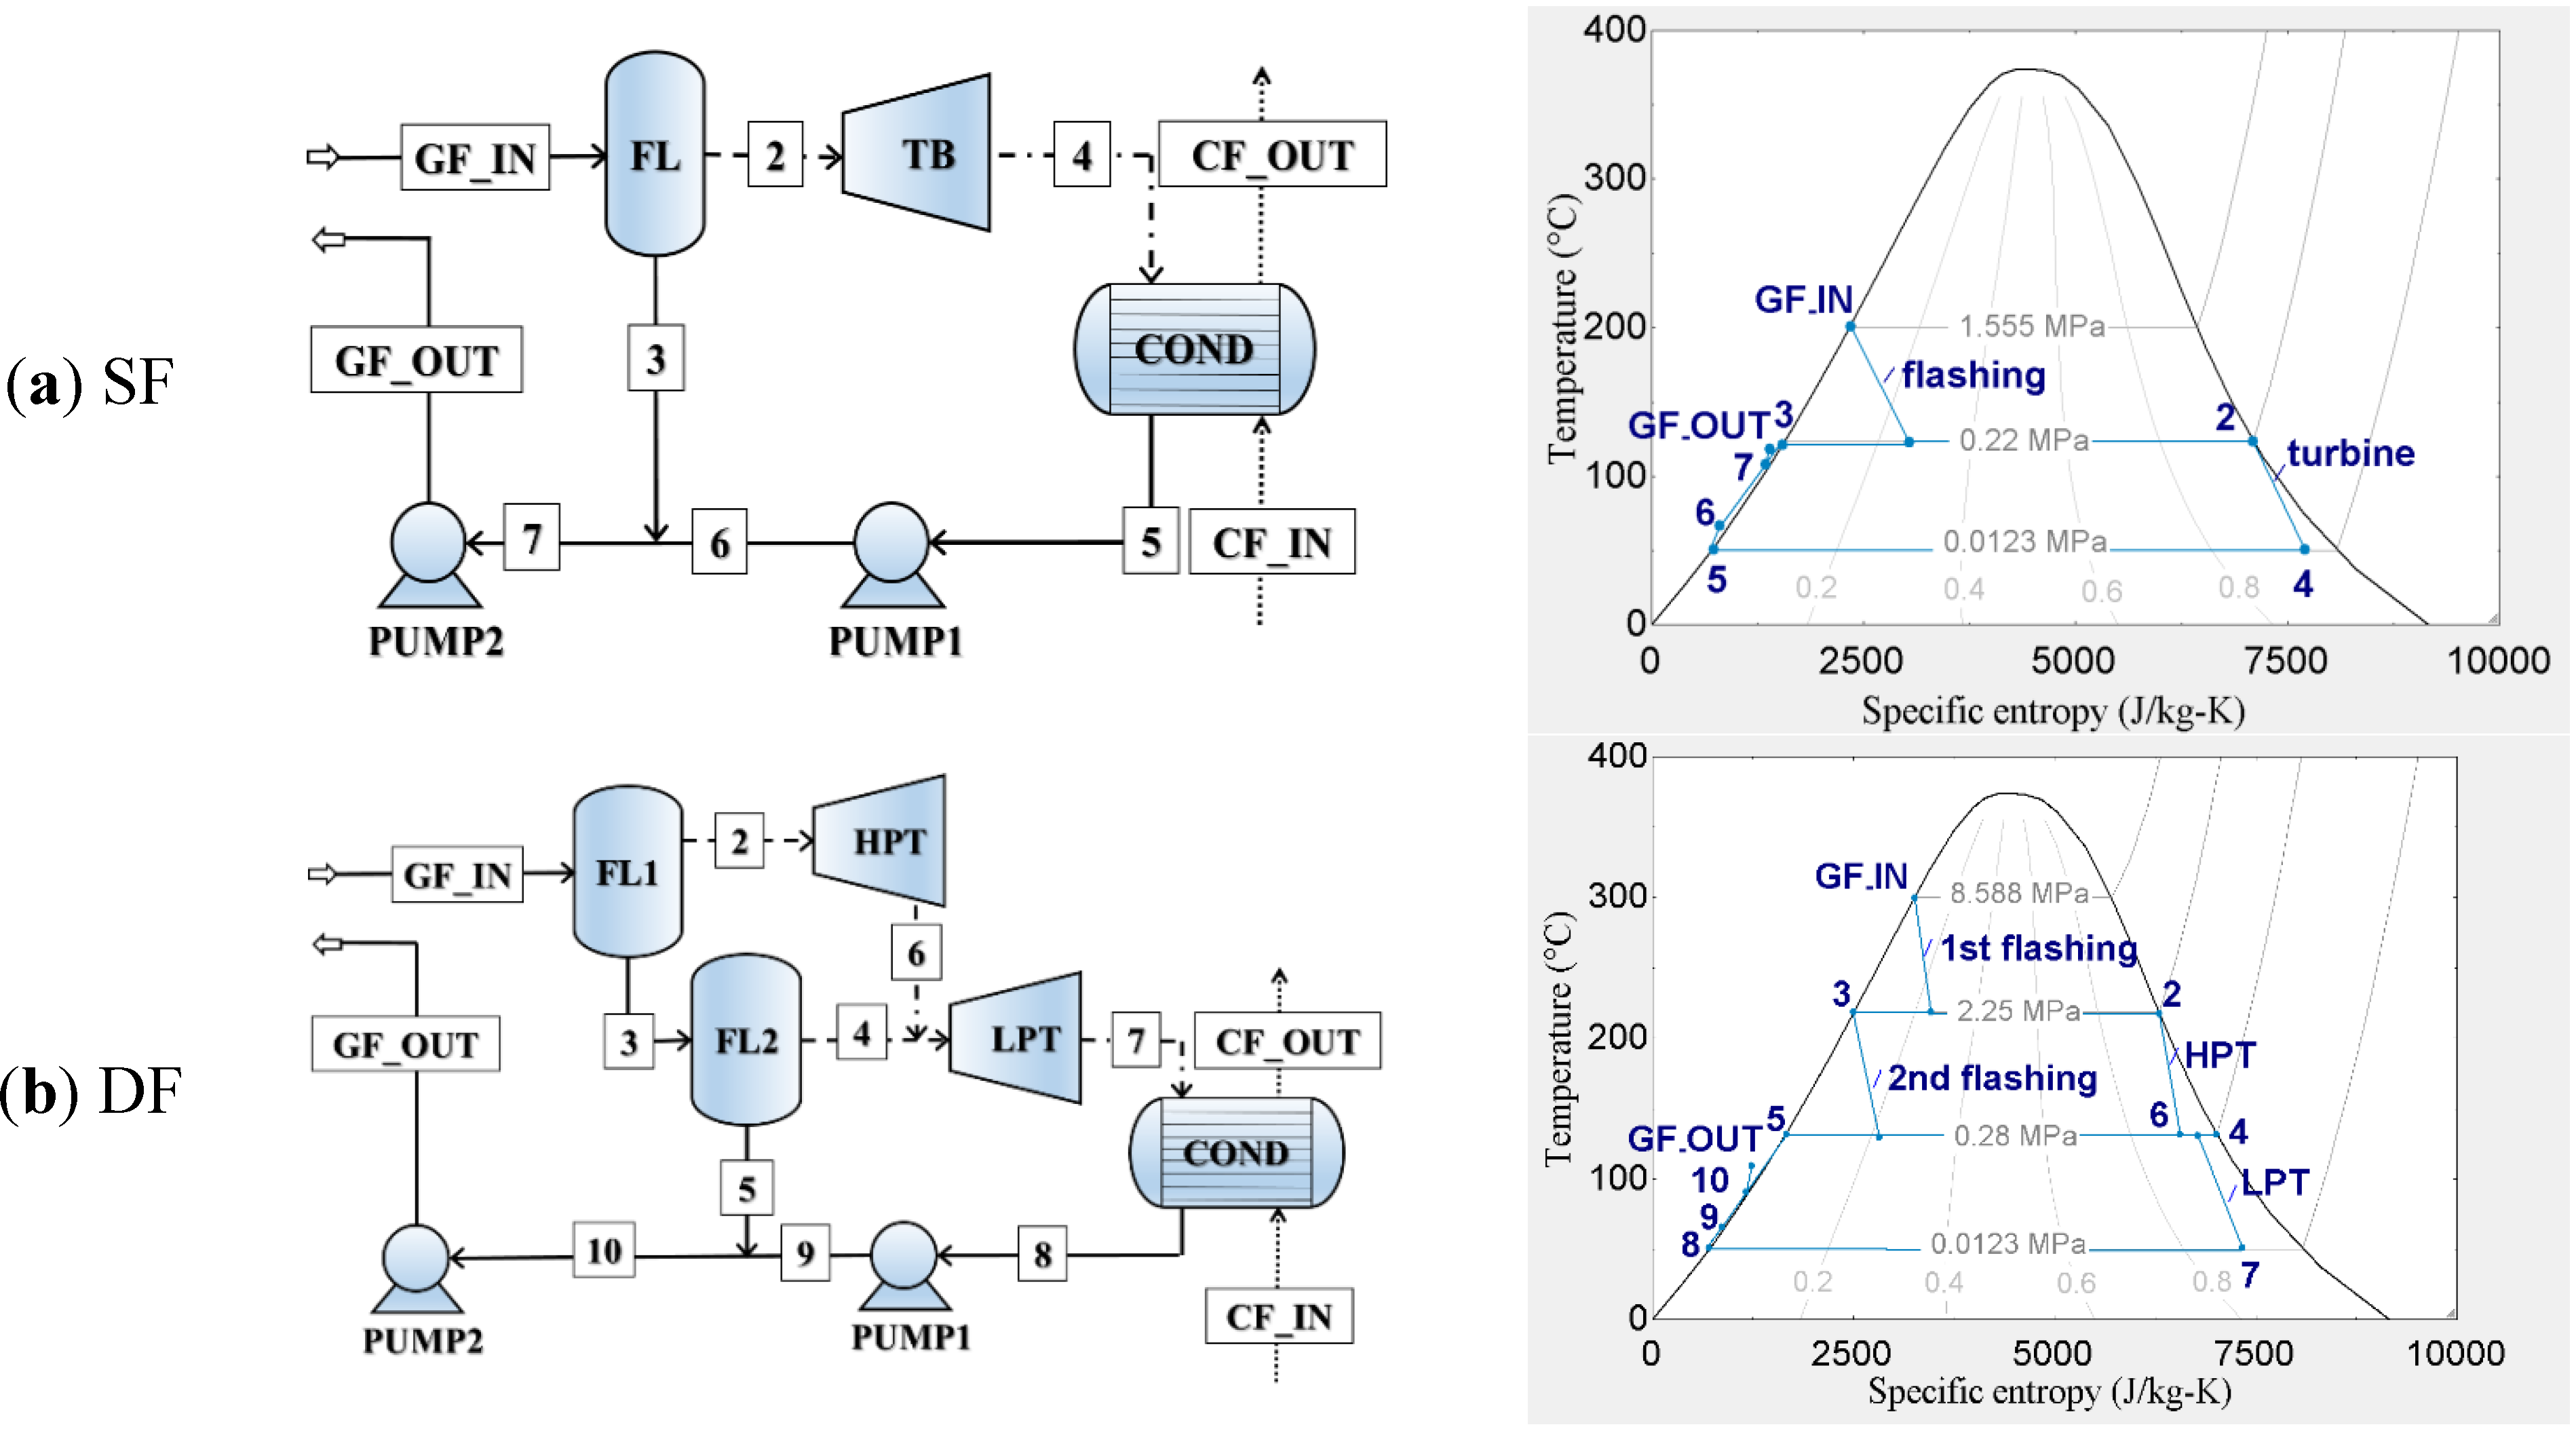
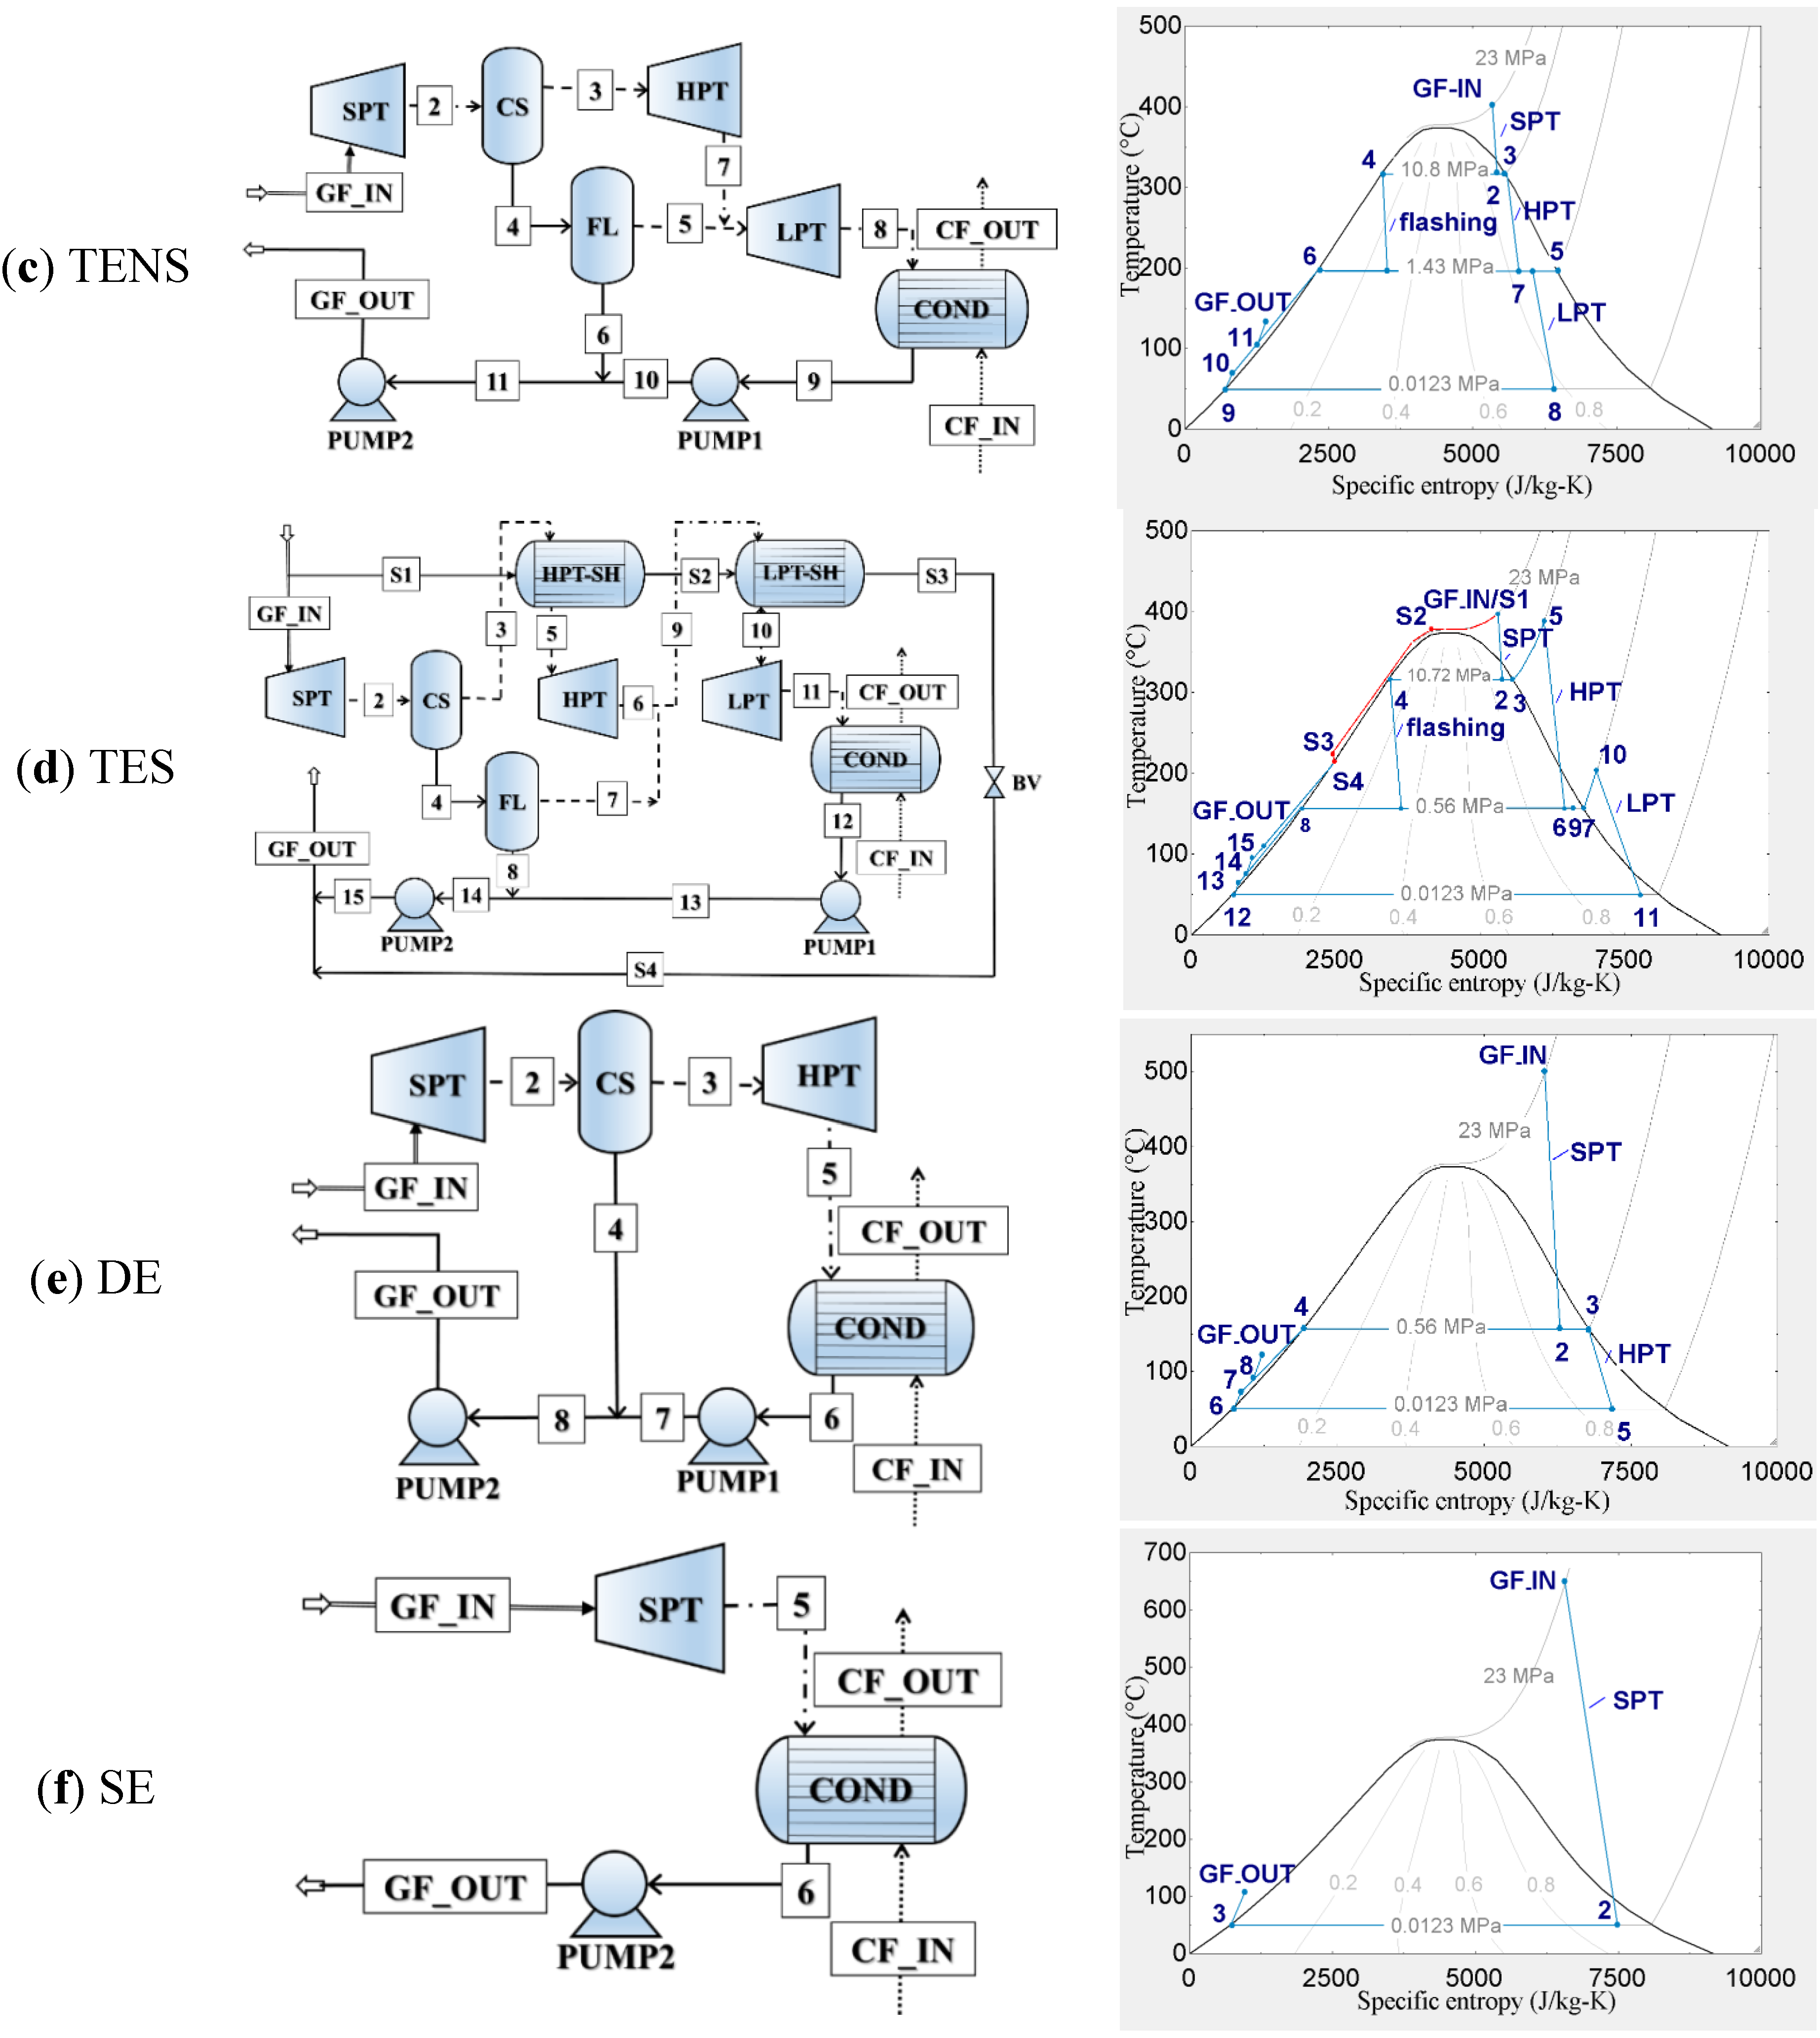
Having considered the plant configuration options most suitable for EGS geofluid feed temperature (Tgf_in) ranges from 200 to 800 °C, the power plants studied in this work are single-flash plant (SF), double-flash plant (DF), triple-expansion plant (TENS), double-expansion plant (DE) and single-expansion plant (SE). To increase the vapor fraction at turbine outlets to 90%, a triple-expansion cycle with superheating (TES) was also studied. The basic flow sheets of the cycles and sample temperature-entropy (T–s) diagrams of the above six cycles are shown in Figure 1.
Figure 1. Conceptual flow sheets and T–s diagrams of (a) single-flash plant when Tgf_in = 200 °C; (b) double-flash plant, when Tgf_in = 300 °C; (c) triple-expansion plant when Tgf_in = 400 °C and Pgf_in = 23 MPa; (d) triple-expansion plant with superheating when Tgf_in = 400 °C and Pgf_in = 23 MPa; (e) double-expansion plant when Tgf_in = 500 °C and Pgf_in = 23 MPa; and (f) single-expansion plant when Tgf_in = 650°C and Pgf_in = 23 MPa. COND: condenser; CS: cyclone separator; FL: flasher; HPT: high pressure turbine; HPT-SH: super heater before HPT; LPT: low pressure turbine; LPT-SH: super heater before LPT; PUMP1: geofluid pump; PUMP2: geofluid re-injection pump; SPT: super pressure turbine; numbers and “GF_IN”, “GF_OUT”: geofluid streams (liquid phase geofluid “−”; vapor phase “—”; liquid-vapor mixture “−∙−”; supercritical geofluid “=”); “CF_IN” and “CF_OUT”: cooling fluid stream “∙∙”.
Energies 07 08427 g001aEnergies 07 08427 g001b
A single-flash plant (Figure 1a) flashes liquid phase geofluid at a pressure lower than the geofluid feed pressure (in FL), to generate a vapor and liquid mixture. The vapor is then separated from the mixture to serve as the feed to the steam turbine to generate work. Exhausted steam from turbine (TB) is condensed in the condenser (COND) to saturated liquid. PUMP1 is used to increase the pressure of saturated liquid 5 to super-cooled liquid 6, which has the same pressure as saturated liquid 3 before re-injected into the geothermal reservoir. It is assumed that no geofluid is lost in this cycle. The single-flash plant is the most conventional of all power plant designs and is widely used for geofluid temperatures over 150 °C [2].
A double-flash plant (Figure 1b) is similar to a single-flash plant except that the saturated liquid from FL1 is flashed one more time in a secondary flasher (FL2) to generate more vapor [2] and can thus generate more electricity. Such plants are naturally more complex and expensive, and require some more maintenance.
A triple-expansion plant (Figure 1c) uses supercritical geofluid [1]. It is a variant of the double-flash plant, with the additional topping super-pressure turbine (SPT) where the SPT is designed to handle pressures exceeding the critical pressure of water (22.06 MPa) [1]. The supercritical geofluid expands in the SPT to a vapor-liquid mixture phase, state 2. Then the mixture is separated isobarically in the CS to vapor 3 and liquid 4. Vapor 3 is then fed to the HPT, and the liquid 4 from CS is flashed again in FL, same as double-flash plant. The mixture of exhaust 7 from the HPT and the vapor 5 from the FL are then fed to the LPT. The condensed geofluid 9 is pressurized to the same pressure as liquid 6 from the FL, and then re-injected to the underground reservoir. Power is generated in all three turbines.
Figure 1c shows that the vapor fractions at the HPT and LPT outlets (VF7 and VF8) are lower than 0.90 for Tgf_in = 400 °C, which should be avoided to protect turbine blades from liquid erosion. This problem can be solved by superheating the SPT outlet stream and the HPT outlet stream (Figure 1d). The heat source to superheat the streams is still the geofluid from the underground reservoir, and its mass flow rate is included in the analysis. The vapor 3 from the CS is superheated to state 5 before feeding to the HPT. The exhaust 6 from the HPT mixes with the vapor 7 from the FL, and then the mixture is superheated to state 10 before fed to the LPT. The condensed geofluid 12 mixes with liquid 8 from the FL and then further mixes with exhausted superheating geofluid S4 before re-injection to the underground reservoir.
Increasing the geofluid inlet temperature to the power plant may reach a temperature at which the SPT could expand the geofluid to a state where CS temperature is lower than 150 °C. Flashing below 150 °C is usually unnecessary [2]. Then the FL is eliminated and the triple-expansion plant is reduced to a double-expansion plant (Figure 1e) where the LPT is eliminated too. The vapor 3 from the CS is fed to HPT. The exhaust 5 from HPT is then condensed to stream 6, and then compressed to mix with the liquid 4 from the CS. The mixture is pressurized to injection pressure before re-injecting to the reservoir. Different from the triple-expansion plant, there is no flashing of the geofluid.
Further increase of the geofluid inlet temperature will lower the CS temperature to near the condensing temperature, then the CS and HPT could also be eliminated and the double-expansion plant becomes a single-expansion one (Figure 1f). The geofluid is expanded in SPT, condensed and re-injected to the geothermal reservoir.

2.4. Embodied Energy of Surface Plants

In this study, we focus on selection of power plant types, so only the embodied energy of surface power plants is calculated and compared. Therefore, other important energy consumptions in an EGS project such as drilling the injection/production wells and reservoir fracturing are beyond the scope of this paper. The embodied energy of power plants, i.e., the energy consumed for building the plants and maintaining their operation, is an important factor in determining their energy return on investment (EROI). This is especially important when the energy sources are of low density, such as with any renewable sources and waste heat, and thus require much equipment or area, or when the energy conversion plants are made more complex to increase their efficiency relative to the direct energy input. In pursuit of higher efficiency we considered increasingly complex geothermal power plants and it was of interest to examine, at least approximately, how it affects their specific embodied energy (similar to EROI).
The embodied energy of power plants considered in this work is simplified to the embodied energy of the installed equipment, where the embodied energy of labor, components assembly, site preparation, plant maintenance and such details are not considered for simplicity. Since embodied energy was not considered in past studies of geothermal systems at all, this analysis still serves as a modest contribution to knowledge. The installation equipment weights MEQ (in kg stainless steel, including all the connection pipes) used in the analyzed power plants are extracted from ASPEN PLUS “US-IP” economic analysis [23], which is a built-in module to estimate the equipment weight for flow sheets. For example, the weight of a heat exchanger is a function of its heat load, pressure, type of exchangers and such. The embodied energy of surface plants is thus simplified as:
E B PP = e b EQ M EQ
where the specific embodied energy of all the equipment is taken to be ebEQ = 56.7 MJ/kg (we assume for simplicity that all the equipment is made of stainless steel) [26]. The specific embodied energy of the whole power plants is defined to be:
e b PP = E B PP W ˙ net
where the denominator is the net power output capacity of power plants.

3. Results and Discussion

3.1. Approach to Optimization

Optimization of the single-flash and double-flash plants (described in Section 2.3) is approached by varying the flashing pressures to achieve maximal geofluid effectiveness GFe. Geofluid inflow temperatures in the range 200–350 °C are assumed. There is an optimal flash pressure because increasing the flash pressures results in higher specific enthalpy vapor but at the same time lower vapor mass flow rate, and vice versa. Since the geofluid effectiveness GFe is proportional to vapor specific enthalpy times vapor mass flow rate, there is a tradeoff between vapor specific enthalpy and vapor mass flow rate. In the analysis, the vapor fraction leaving the turbines is set to be greater than 0.80 for flash type plants, to protect the turbines.
When the geofluid from underground reservoir is supercritical, an SPT is used, and the supercritical geofluid expands to a liquid and vapor mixture phase. The optimum of triple expansion plants is sought by varying the CS and FL pressures, under the constraint of SPT outlet vapor fraction kept in the range 0.90–1 and Tgf_out ≥ 60 °C. As implied above, higher CS pressure results in higher geofluid flow rate feed to the flasher, resulting in more work produced by HPT and LPT, but less work produced by SPT. Keeping Tgf_in = 400 °C, the performances for Pgf_in = 23 MPa, 25 MPa and 27 MPa are shown in Table 2. For supercritical geofluid, lowering the geofluid inflow pressure Pgf_in causes both GFe and ebPP to improve, in the studied range GFe becomes 17% higher and ebPP 11% lower. We thus conclude that Pgf_in should be kept as low as possible to maintain the supercritical condition of the geofluid. The lowest Pgf_in to use could equal the critical pressure of the geofluid (22.06 MPa for water). Practically, however, fluids working near their critical points should be avoided if possible, because there they undergo sharp thermodynamic and transport properties transitions [1], so in this work, we consider Pgf_in = 23 MPa for the supercritical geofluid to calculate maximum power production from geofluid of given temperature. This pressure is determined by the underground pressure field of the EGS system (in wells and engineered reservoir), and the power plants can utilize geofluid at any pressure. The triple-expansion plant simulations are performed for Tgf_in values of 400 °C, 450 °C and 500 °C and all at Pgf_in = 23 MPa.
Table 2. Optimal efficiencies of the air-cooled triple-expansion plant as a function of Pgf_in at Tgf_in = 400 °C.
Pgf_in, MPa232527
GFe, kJ/kg781.36733.04666.66
ebPP, TJ/MWe4.664.905.25
The vapor fractions (VF) at turbine outlets are very low (<80% from the T–s graph in Figure 1c) which is undesirable because liquid droplets could erode the turbine [1,2]. Typically, the design of power plants requires the VF at turbine outlets to be greater than 90% [2]. One way to increase the VF is by superheating the turbine inlet streams, as shown in Figure 1d. For Tgf-in = 400 °C and Pgf_in = 23 MPa, the degree of superheat of HPT-SH, LPT-SH and the mass flow rate ratio s1/gf_in (ratio of mass flow rate of superheating stream to mass flow rate of geofluid fed to cycle to generate electricity) are sought and chosen to achieve maximal geofluid effectiveness GFe for VF greater than 90% at the SPT, HPT and LPT outlets. The maximal geofluid effectiveness was obtained when the superheating degree of HPT-SH and LPT-SH are 70 °C and 50 °C, respectively, and the mass flow rate ratio s1/gf_in = 0.3. The simulation results of triple-expansion plant with superheating (TES) compared to triple-expansion plant without superheating (TENS) are shown in Table 3. In the superheating case, for 100 kg/s geofluid fed to the power plant 77 kg/s is used to generate electricity while 23 kg/s is used as superheating heat source, therefore the GFe is 28.3% lower than the non-superheating one. The TES also has 145.9% higher ebPP than non-superheating ones, indicating the extent of the net power output and embodied energy input sacrifice needed to increase the vapor fraction at turbine outlets. An alternative to such superheating is of course to use droplet separators at the turbine inlet, which would however, raise cost and also create a pressure drop that reduces efficiency, or to use more erosion resistant materials in the turbine.
For geofluid temperatures Tgf_in > 500 °C, there is no solution of CS and FL pressures for TES plant that could satisfy all the constraints of 0.90 ≤ VF2 < 1.0, PFL > 0.1 MPa (flash above surrounding pressure) and Tgf_out ≥ 60 °C. Therefore, a double-expansion plant will be used instead of the triple-expansion one.
For geofluid temperatures Tgf_in of 500–700 °C, the CS pressure is optimized to achieve maximum geofluid effectiveness (GFe). However, for Tgf_in ≥ 550 °C, there is no CS pressure that can satisfy both VF2 ≤ 1.0 and Tgf_out ≥ 60 °C. Increasing the condensing temperature to 60 °C will satisfy Tgf_out ≥ 60 °C. Higher condensing temperatures will, however, reduce the geofluid effectiveness. Comparisons of double-expansion plant with a condensing temperature of 50 °C and 60 °C when Tgf_in = 700 °C and Pgf_in = 23 MPa are listed in Table 4. GFe decreases by 3.5% (46 kJ/kg, corresponding to net power output decrease of 0.46 MW/°C) as the condensing temperature is increased from 50 to 60 °C. ebPP is slightly lower when condensing at 60 °C.
Table 3. Comparison of the air-cooled triple-expansion plants without (TENS) and with (TES) superheating for Tgf_in = 400 °C and Pgf_in = 23 MPa.
CasesTENSTES
s1/gf_in00.3
Δ T S P T S H S H ,°C070
Δ T S P T L H S H ,°C050
VF after SPT0.900.90
VF after HPT0.810.90
VF after LPT0.720.90
GFe, kJ/kg781.36560.45
ebPP, TJ/MWe4.6611.46
Table 4. The effect of the condensing temperature Tcond of the air-cooled double-expansion plant for Tgf_in = 700 °C and Pgf_in = 23 MPa.
Tcond, °C5060
GFe, kJ/kg1330.591284.74
Tgf_out, °C50.6160.66
ebPP, TJ/MWe3.693.55
For geofluid temperatures Tgf_in ≥ 650 °C, the vapor fraction at the SPT outlet of the double-expansion plant is as high as 0.99 for the optimal thermodynamic performance case, and thus a simpler, single-expansion plant could be used. The geofluid outlet temperature will roughly equal the condensing temperature for this plant. For comparison with other plants, the condensing temperature is still set to 50 °C.
An important conclusion is that superheating the turbines’ inlet streams could increase the vapor fraction at turbine outlets, and raising the condensation temperature could increase the geofluid re-injection temperature Tgf_out, but both methods reduce the plants’ net power output by 28% and 3.9%.

3.2. Results Validation

To validate our ASPEN PLUS simulation method, we compared our results of three types of power plants with the results from Chapter 7 of [1]. We adopted all the assumptions of [1] in our simulation to generate results when the ASPEN PLUS model is converged (mass and heat balance are satisfied with absolute residual of 10−6). The comparisons are shown in Table 5. The assumption in [1] is based on “Baumann rule”, that 1% moisture in the turbine outlet downgrades the isentropic efficiency of turbine by 1% [27]. In our calculation, we used an average turbine isentropic efficiency, which causes the <1.5% difference of our results with the ones from [1]. Since the relative error is smaller than 1.5%, our simulation models are considered to produce very acceptable results.
Table 5. Power plant simulation results validation of this work.
Tgf_in, °CPlant TypeGFe Calculated in [1] kJ/kgGFe Calculated in This Work kJ/kgRelative Difference
200SF53.954.481.08%
250DF123.5125.241.41%
400 (Pgf_in = 25 MPa)TE727.3733.040.79%

3.3. Results for Air-Cooled Cycles

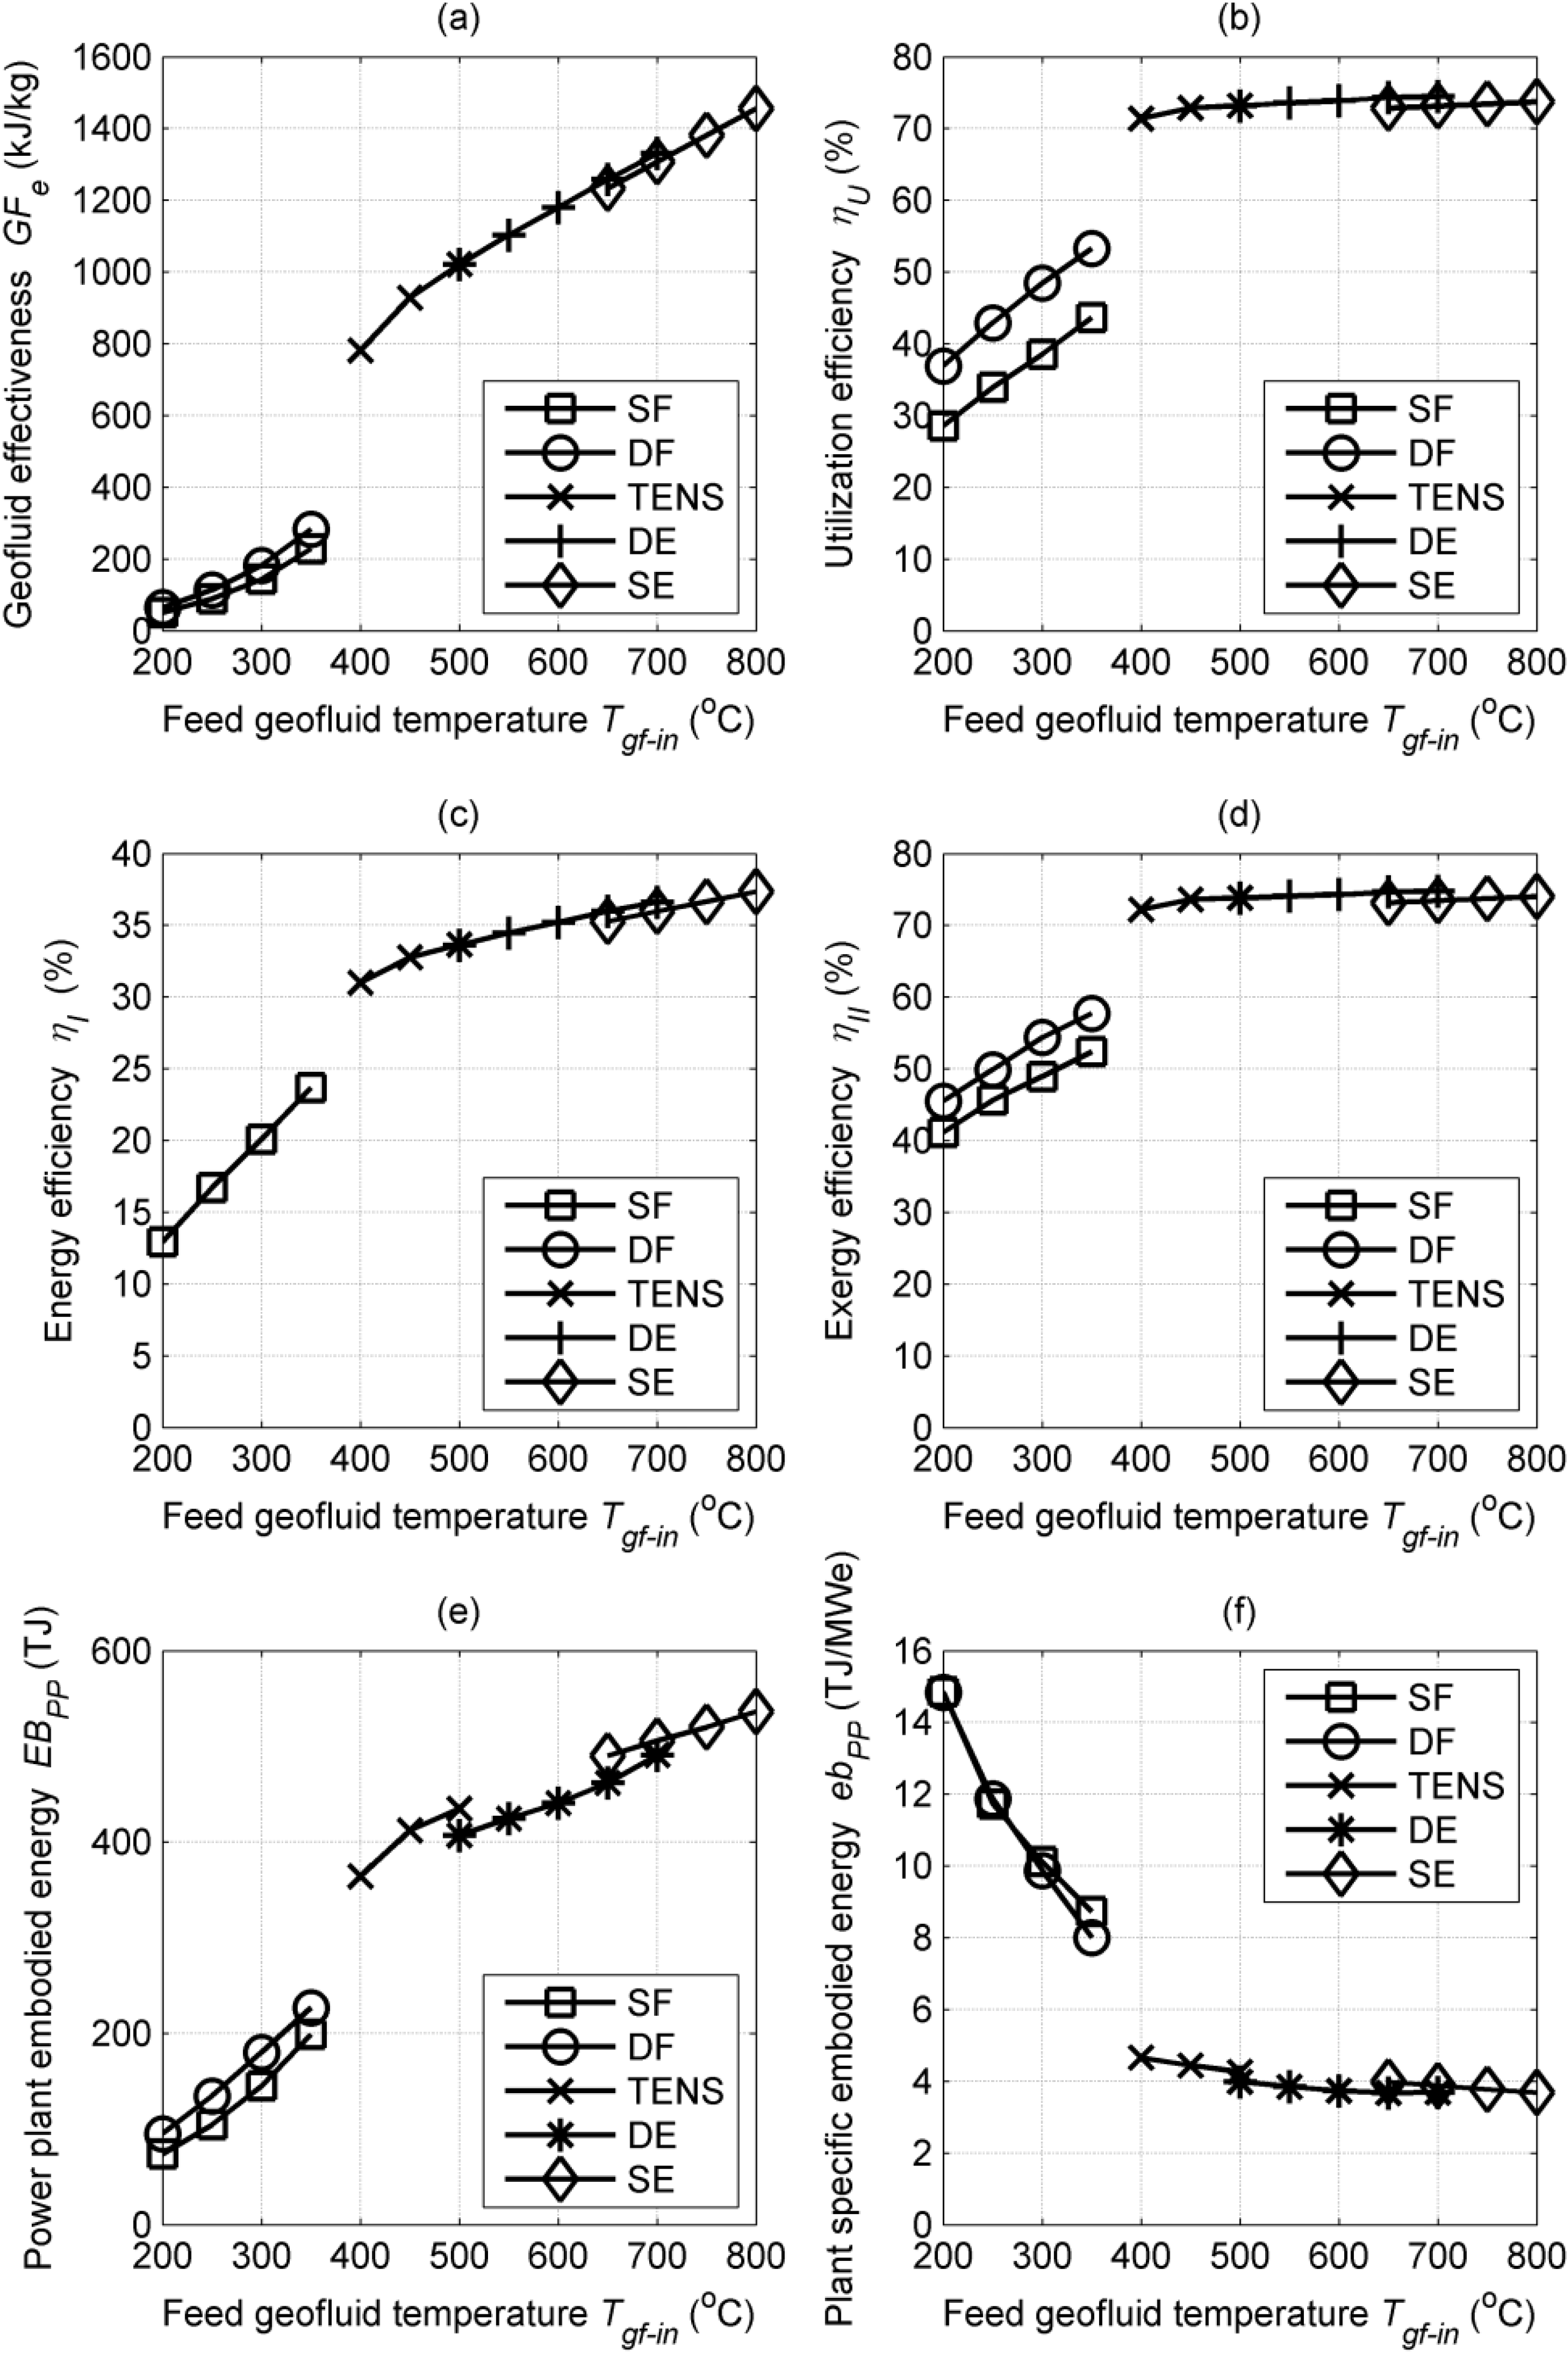
The simulation results for all five power plant configurations (excluding TES, for which there is one performance point given in Table 3) with air-cooled condensers, showing the sensitivity of the thermodynamic performance parameters to the geofluid inlet temperature Tgf_in are shown in Figure 2.
It can be seen that the geofluid effectiveness GFe:
Generally increases with Tgf_in.
Is significantly higher for supercritical geofluid (GFe > 750 kJ/kg) than for subcritical geofluid (GFe < 300 kJ/kg), showing an upward jumps in the range of 350 °C < Tgf_in < 400 °C. When the geofluid reaches supercritical condition, it can expand in a turbine (SPT) to generate work, thus significantly raises the cycle’s net power output.
For subcritical geofluid, double-flash plants have 24.3%–29.0% higher geofluid effectiveness GFe than single flash plant.
When Tgf_in = 500 °C, the triple-expansion plant and double-expansion plant have same GFe.
When Tgf_in = 650–700 °C, the double-expansion plant has a GFe around 2% higher than the single-expansion plant.
Table 6. Itemized equipment weights of selected power plants.
Plant TypeSFDFTENSTESDESF
Tgf-in, °C250250250250400400700700
Cooling mediumairwaterairwaterairairairair
Total equipment weights, ton1838.96657.332371.97492.802293.334041.383092.273187.33
COND93.4%18.7%92.6%18.1%90.8%82.7%85.2%87.1%
CS0.7%0.4%0.5%
CTOWER60.5%58.6%
FL12.8%8.0%2.1%6.7%0.4%0.2%
FL21.3%2.9%
HPT2.8%10.3%1.3%4.4%2.4%5.2%2.7%
HPT-SH3.1%
LPT2.0%7.2%4.3%5.6%
LPT-SH1.4%
PUMP10.3%0.4%0.2%0.5%0.2%0.1%0.1%0.2%
PUMP20.8%2.0%0.6%1.6%0.1%0.1%0.2%
SPT1.1%1.2%11.3%12.7%
Figure 2. Geofluid effectiveness (a) and power plant utilization efficiency (b), plant energy efficiency (c) and exergy efficiency (d), power plant embodied energy (e) and power plant specific embodied energy (f) with respect to Tgf_in for different plant configurations with air-cooled condensers. SF: single flash; DF: double flash; TENS: triple expansion without superheating; DE: double expansion; SE: single expansion. The result for TES is in Table 3.
Energies 07 08427 g002
Figure 2b–d show the utilization, energy and exergy efficiency of plants also increase monotonically with geofluid feed temperature Tgf_in. Figure 2e shows that the total embodied energy of surface power plants increases with Tgf_in, because the power output and condenser heat load increase too, and they are especially high for supercritical power plants. Table 6 shows the itemized equipment weights of selected power plants. The weight of the air-cooled condensers accounts for over 80% of the total weight of the power plants and thus dominates the embodied energy amount.
To take into account the influence of power plant capacity on its embodied energy, Figure 2f shows the specific embodied energy of power plants (in TJ/MWe). Supercritical power plants are seen to have a smaller specific embodied energy than subcritical plants because their larger power outputs compensate for the overall larger embodied energy.

3.4. Comparison of Water-Cooled and Air-Cooled Cycles

Water-cooled cycles yield higher net power output [2] because they offer lower condensation temperature than air-cooled ones [28]. Water-cooled condensers are modeled with ASPEN PLUS built-in block “Heat Exchanger”. Cooling towers are modeled as a two stage absorber with ASPEN PLUS block “Radfrac”. Study [29] found that a two stage absorber works similar to a cooling tower and the Murphree efficiency for each stage is found to be 0.927 and 0.763 on average.
For water-cooled cycles, the parasitic power consumption is calculated as parasitic =∑gp,i + cwp + fan_ctower, kW, where fan_ctower is the water-cooled cooling towers power consumption and cwp is the cooling water pumps power consumption. Since the cooling water pump power consumption cwp is small relative to that of the air fans in cooling tower fan_ctower, the parasitic power cwp + fan_ctower could be roughly estimated to be just the fan electricity consumption recommended in [13] and listed in Table 1. There is water loss in the evaporative cooling tower in a water-cooled cycle, where a fraction of externally supplied cooling water is lost by evaporation in the cooling tower.
To compare operation with an air-cooled condenser to that with a water-cooled condenser, Table 7 lists the geofluid effectiveness GFe and power plant specific embodied energy ebPP of these two cooling methods. As expected, the geofluid effectiveness GFe is lower for the air-cooled system for fixed condensing temperature, because air-cooled fans consume more energy than cooling tower ones due to much larger air flow rate in the air-cooled condenser. In practice, when the ambient air temperature rises above the design air temperature (15 °C in this work), the designed air flow rate cannot take all the discharged heat from condenser, thus causing the condensation temperature to rise. GFe will thus decrease with increased ambient air temperature. The power plant specific embodied energy ebPP is much larger for air-cooled systems because air-cooled condensers are much larger than water cooled ones due to lower heat transfer coefficients in the former. The air-cooled and water-cooled condenser weights are also listed in Table 6, showing that water-cooled condensers have a much smaller weight than air-cooled condensers.
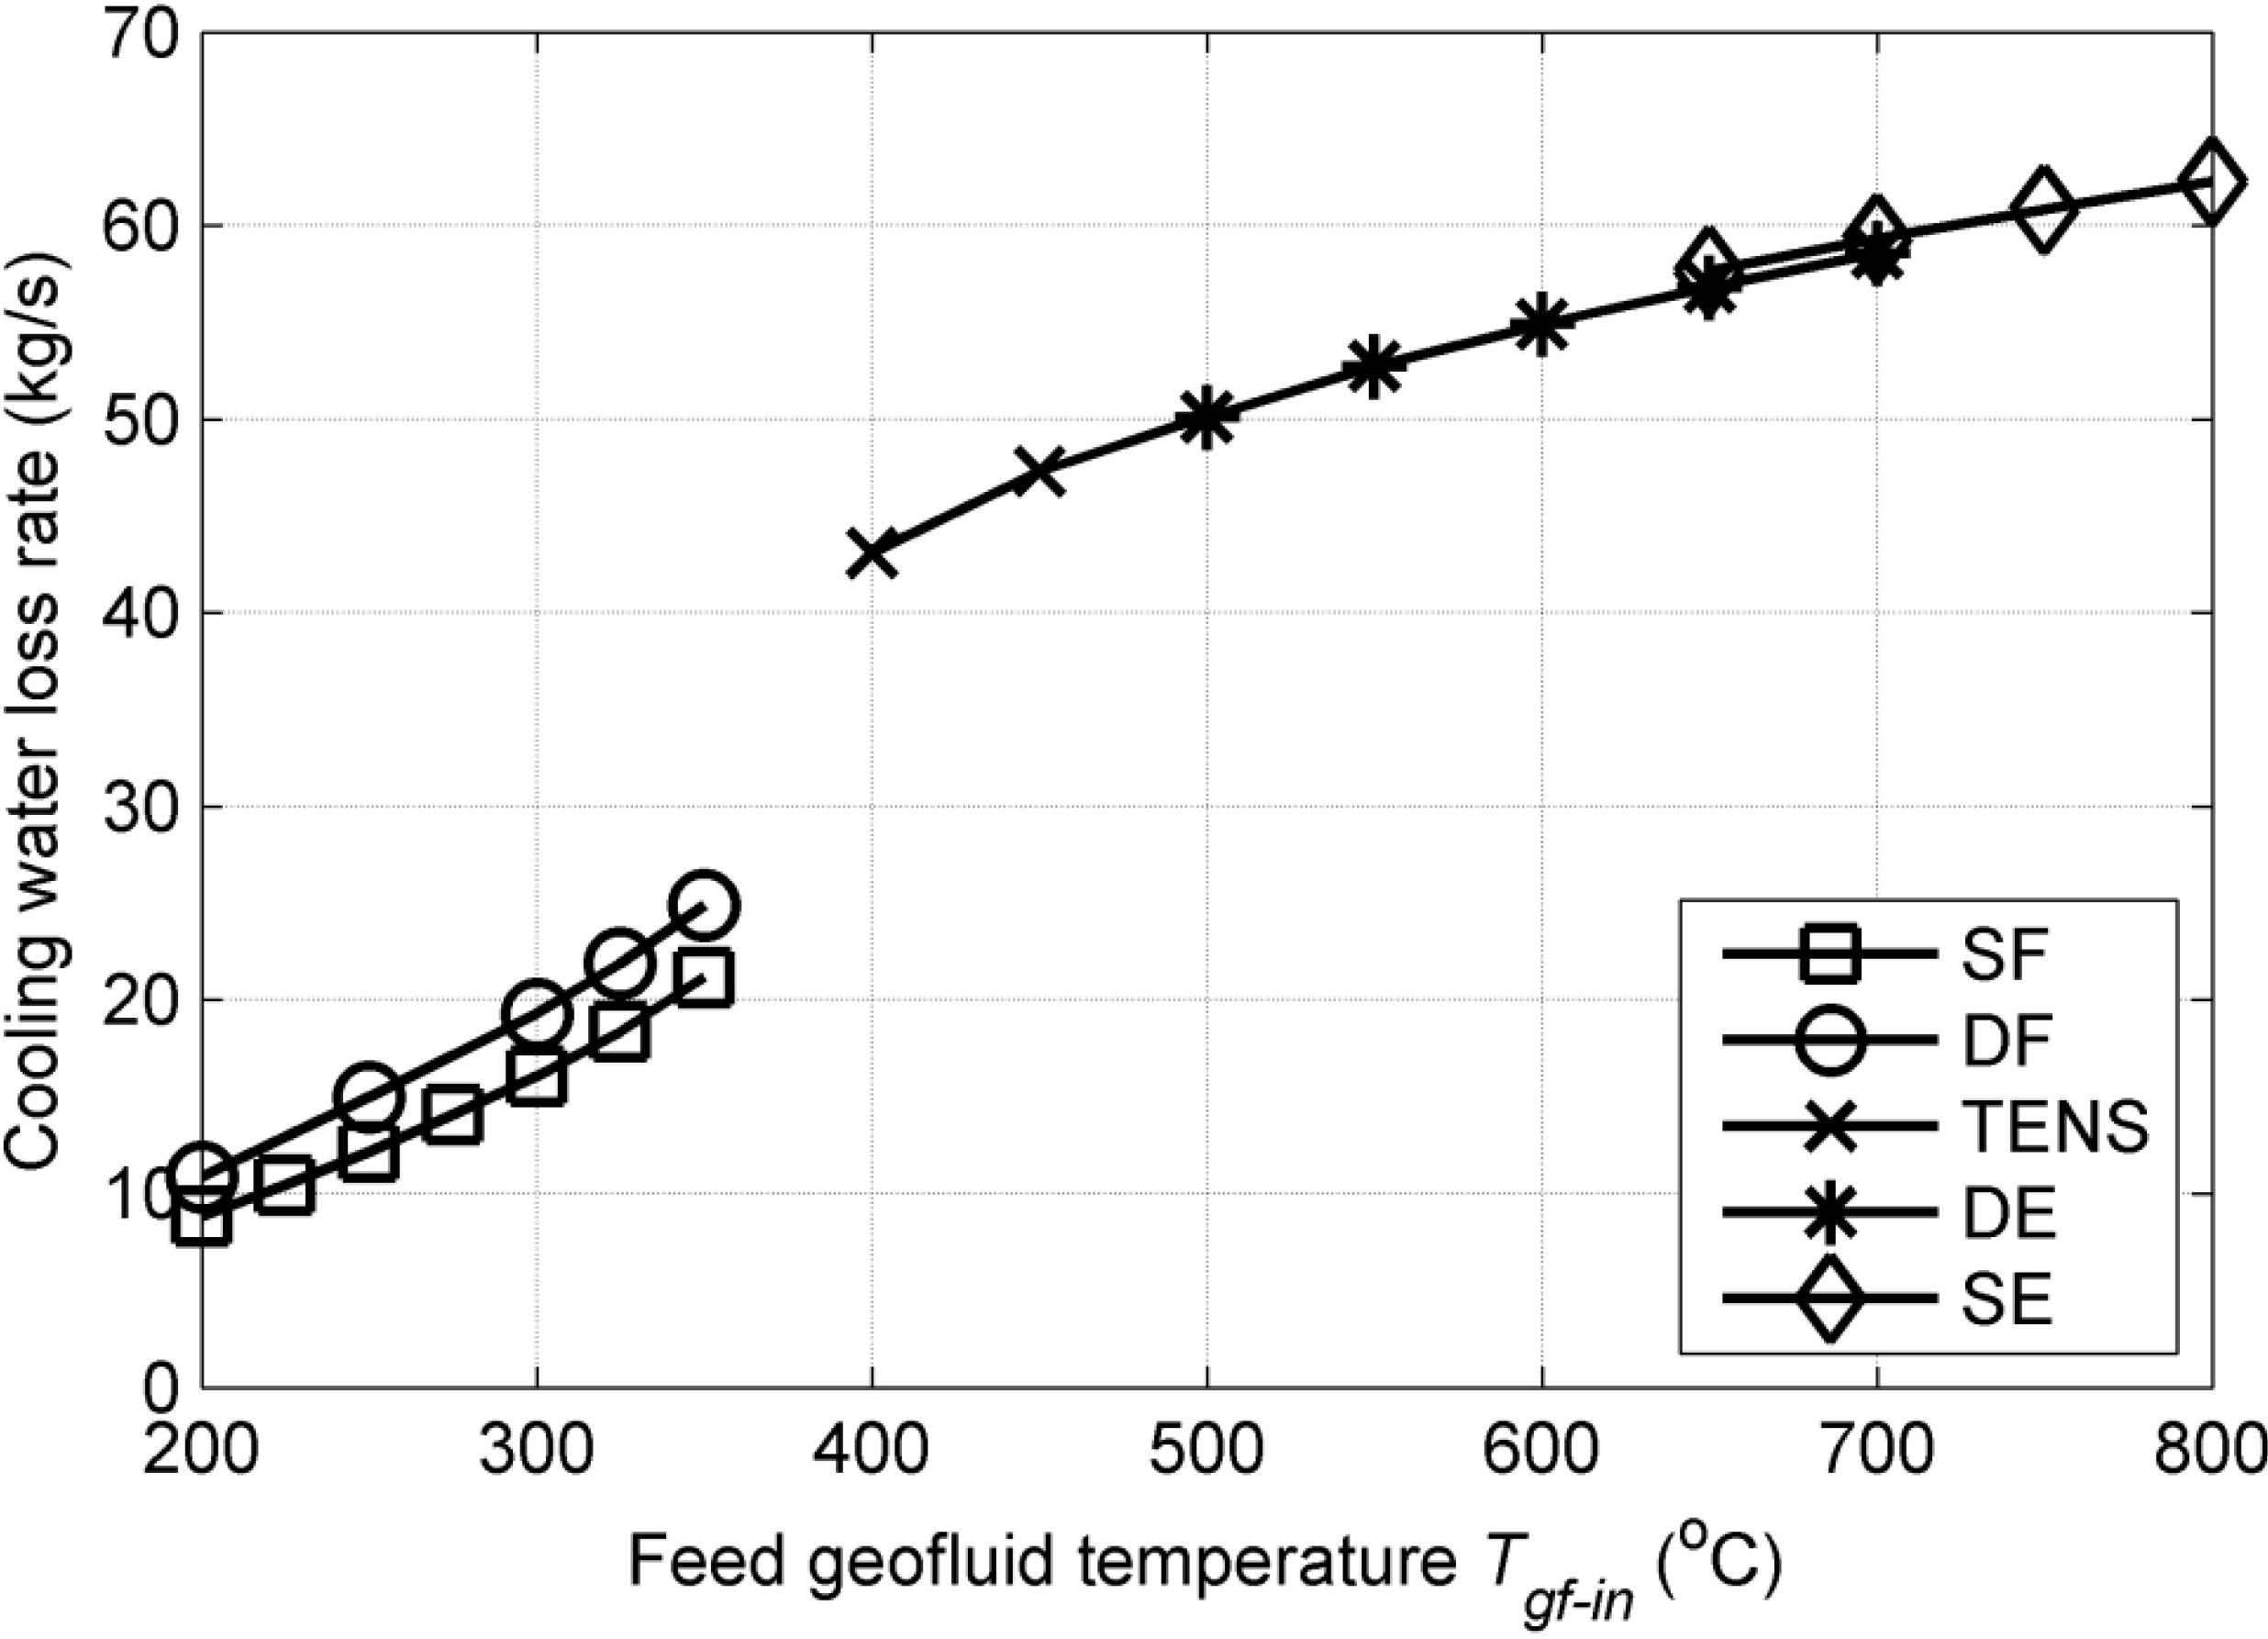
Wet cooling towers accomplish part of their cooling load by evaporating a part of the water supplied to them. Figure 3 expresses the fact that the water loss rate is proportional to the heat load on water-cooled condensers. Supercritical cycles have a higher cooling load than subcritical ones, because supercritical cycles produce more vapor to generate electricity and thus create higher heat load on condensers. Although water-cooled cycles yield a 1.32%–5.43% higher geofluid effectiveness and 62.10%–70.26% lower specific embodied energy consumption, in regions where water is scarce, the use of water-cooled cycles is still unacceptable.
Table 7. Comparison of the air-cooled and water-cooled power plants.
Tgf-in, °CPower Plant TypeGeofluid Effectiveness GFe, kJ/kgPower Plant Specific Embodied Energy ebPP, TJ/MWe
Air-cooledWater-cooledIncrease, %Air-cooledWater-cooledDecrease, %
200SF49.6452.345.4314.865.6362.10
200DF64.0167.365.2414.845.3164.20
300SF143.04147.963.4410.123.1468.94
300DF182.31188.253.269.872.9470.26
400TENS781.36794.631.704.661.5866.02
500TENS1021.101036.531.514.261.4665.70
600DE1180.241197.151.433.731.2965.56
700DE1330.591348.641.363.691.2765.44
800SE1455.731474.911.323.681.2865.37
Figure 3. Water-cooled plant cooling water loss rate with respect to Tgf_in for different plant configurations. SF: single flash; DF: double flash; TENS: triple expansion without superheating; DE: double expansion; SE: single expansion.
Energies 07 08427 g003

4. Conclusions

This paper presents a brief review of flash and expansion type of geothermal power plants and proposes, analyzes, examines, and compares leading geothermal power plant configurations focused on mid-high grade deep HDR resources where the geofluid temperature ranges from 200 to 800 °C. Single-flash and double-flash cycles are studied for electricity generation using subcritical geofluid (<374 °C) and triple-expansion, double-expansion and single-expansion cycles are chosen for using supercritical geofluid (>374 °C). The simulation method is validated by comparison to published studies.
The results include the geofluid effectiveness, plant utilization efficiency, plant energy and exergy efficient, plant’ embodied energy and specific embodied energy, all as a function of the fed geofluid temperature Tgf_in in the range of 200–800 °C. Flash type power plants have utilization efficiency ranging from 30% to 60% for geofluid temperature between 200 and 350 °C while expansion plants could achieve a utilization efficiency higher than 70% when fed with supercritical geofluid. The utilization efficiencies are around 70% for all supercritical fed geofluid temperatures. The energy efficiency of flash type plants ranges from 13% to 23% while ranges from 30% to 37% for expansion type plants. The exergy efficiency of flash type and expansion type plants are 40% to 55% and 70% to 75% respectively.
For supercritical feed geofluid, the analysis shows that lower geofluid feed pressure results in higher GFe, so the geofluid pressure should be kept as low as possible as long as it is in supercritical state. To avoid steam expansion into the wet regime, and thus to protect the turbine blades, we investigated a configuration in which the steam is superheated by using the geofluid from the reservoir prior to its feed into the turbine. It was found that this reduces the GFe and net power output by around 28.3%. Liquid reinjection temperature should be maintained to be larger than 60 °C to avoid mineral scaling in the injection wells. However, we found that single and double-expansion plants cannot satisfy this when the condensing temperature is 50 °C for geofluid fed temperature > 500 °C. Raising the geofluid reinjection temperature reduces, however, the geofluid effectiveness GFe, for example by 3.5% when the condensing temperature is raised to 60 °C.
Comparison of air-cooled system with water-cooled system indicates that water-cooled systems could increase geofluid effectiveness GFe by 1.32%–5.43% and decrease the specific embodied energy by 62.10%–70.26%.
Use of supercritical geofluid results in significant higher geofluid effectiveness GFe than use of subcritical geofluid, and the extent of this effect was evaluated. The specific power plant embodied energy is lower for supercritical plants. This supports the conclusion that EGS resource exploitation should aim at producing supercritical geofluid for the surface power plant.

Author Contributions

Guidance by Noam Lior, computations by Mengying Li, joint analysis.

Nomenclature

din
Absolute humidity of air feed to cooling tower, g/kg dry air
EBPP
Embodied energy of power plants, TJ
ebPP
Specific embodied energy of power plants, TJ/MWe
E ˙ g f _ i n
Total exergy flux to the power plant, kW
egf_in
Specific exergy of the geofluid fed to the power plant, kJ/kg
GFe
Geofluid effectiveness, kJ/kg
MEQ
Equipment weight of power plant, kg
gf_in
Geofluid mass flow rate fed to the power plants, kg/s
s1
Superheating geofluid flow rate, kg/s
P0
Dead state pressure, Pa
Pcf_in
Cooling fluid pressure feed to condenser, Pa
Pcond
Condensing pressure,Pa
PFL
Flashing pressure, Pa
Pgf_in
Feed geofluid pressure, Pa
Pgf_out
Geofluid pressure leave the power plant, Pa
T0
Dead state temperature, K
Tcf_in
Cooling fluid temperature fed to the condenser, K
Tcond
Condensing temperature, K
Tgf_in
Geofluid temperature fed to power plants, K
Tgf_out
Geofluid temperature at power plants outlet (reinjection to reservoir), K
cwp
Cooling water pump energy consumption, kW
fan,cond
Air-cooled condenser fans energy consumption, kW
fan,ctower
Cooling tower fans energy consumption, kW
gp,i
Geofluid pump energy consumption, kW
net
Net work produced by the plant, kW
parasitic
Total parasitic energy consumption, kW
turbine
Total work produced by turbines, kW
Δ E ˙ gf
Total exergy difference between the geofluid fed to and leaving the plant, kW
Δegf
Specific exergy difference between the geofluid fed to and leaving the plant, kJ/kg
Δhf
Total enthalpy difference between the geofluid fed to and leaving the plant, kW
Δhgf
Specific enthalpy difference between the geofluid fed to and leaving the plant, kJ/kg
ΔPcond
Pressure drop in condenser, Pa
ΔPmix
Pressure difference of two mixing streams, Pa
ΔTpp
Pinch point temperature difference in heat exchangers, K
ηg
Generator efficiency
ηI
Energy efficiency of power plants, %
ηII
Exergy efficiency of power plants, %
ηII,pump
Pump Isentropic efficiency, %
ηII,tb
Turbine Isentropic efficiency, %
ηU
Utilization efficiency of power plants, %

Abbreviations

COND
Condenser
CS
Cyclone separator
DE
Double-expansion plant
DF
Double-flash plant
EGS
Enhanced/Engineered geothermal system
EROI
Energy return on investment
FL
Flasher
HDR
Hot dry rocks
HPT
High pressure turbine
HPT-SH
Super-heater before HPT
LPT
Low pressure turbine
LPT-SH
Super-heater before LPT
SE
Single-expansion plant
SF
Single-flash plant
SPT
Super pressure turbine
TB
Turbine
TENS
Triple-expansion plant without superheating
TES
Triple-expansion plant with superheating
Ts
Temperature–entropy graph
VF
Vapor fraction

Conflicts of Interest

The authors declare no conflict of interest.

References

  1. The Future of Geothermal Energy: Impact of Enhanced Geothermal Systems (EGS) on the United States in the 21st Century: An Assessment by an MIT-led Interdisciplinary Panel; Massachusetts Institute of Technology (MIT): Cambridge, MA, USA, 2006.
  2. DiPippo, R. Geothermal Power Plants: Principles, Applications and Case Studies; Elsevier: Amsterdam, The Netherlands, 2005. [Google Scholar]
  3. Bertani, R. Geothermal power generation in the world 2005–2010 update report. Geothermics 2012, 41, 1–29. [Google Scholar]
  4. Thorsteinsson, H.; Augustine, C.; Anderson, B.; Moore, M.; von Rohr, P.; Rothenfluh, T.; Tester, J. Sustainable Energy Opportunities Within the Geothermal Continuum; Clean Technology 2008; CSI Events: Danville, CA, USA, 2008; pp. 152–155. [Google Scholar]
  5. Kruger, P.; Otte, C. Geothermal Energy, Resources, Production, Stimulation; Stanford University Press: Stanford, CA, USA, 1973. [Google Scholar]
  6. Elliott, T.C.; Chen, K.; Swanekamp, R.C. Standard Handbook of Powerplant Engineering; McGraw Hill: New York, NY, USA, 1998. [Google Scholar]
  7. Coskun, C.; Oktay, Z.; Dincer, I. Performance evaluations of a geothermal power plant. Appl. Therm. Eng. 2011, 31, 4074–4082. [Google Scholar]
  8. Gerber, L.; Maréchal, F. Defining optimal configurations of geothermal systems using process design and process integration techniques. Appl. Therm. Eng. 2012, 43, 29–41. [Google Scholar] [CrossRef]
  9. Kanoglu, M.; Bolatturk, A. Performance and parametric investigation of a binary geothermal power plant by exergy. Renew. Energy 2008, 33, 2366–2374. [Google Scholar] [CrossRef]
  10. Yildirim, D.; Ozgener, L. Thermodynamics and exergoeconomic analysis of geothermal power plants. Renew. Sustain. Energy Rev. 2012, 16, 6438–6454. [Google Scholar]
  11. Zhang, F.; Jiang, P. Thermodynamic analysis of a binary power cycle for different EGS geofluid temperatures. Appl. Therm. Eng. 2012, 48, 476–485. [Google Scholar] [CrossRef]
  12. Walraven, D.; Laenen, B.; D’Haeseleer, W. Comparison of thermodynamic cycles for power production from low-temperature geothermal heat sources. Energy Convers. Manag. 2013, 66, 2–14. [Google Scholar] [CrossRef]
  13. Augustine, C.R. Hydrothermal Spallation Drilling and Advanced Energy Conversion Technologies for Engineered Geothermal Systems. Ph.D. Thesis, Massachusetts Institute of Technology, Cambridge, MA, USA, June 2009. [Google Scholar]
  14. Dai, Y.; Wang, J.; Gao, L. Parametric optimization and comparative study of organic Rankine cycle (ORC) for low grade waste heat recovery. Energy Convers. Manag. 2009, 50, 576–582. [Google Scholar] [CrossRef]
  15. Franco, A.; Villani, M. Optimal design of binary cycle power plants for water-dominated, medium-temperature geothermal fields. Geothermics 2009, 38, 379–391. [Google Scholar] [CrossRef]
  16. Nguyen, T.Q.; Slawnwhite, J.D.; Boulama, K.G. Power generation from residual industrial heat. Energy Convers. Manag. 2010, 51, 2220–2229. [Google Scholar] [CrossRef]
  17. Yari, M. Exergetic analysis of various types of geothermal power plants. Renew. Energy 2010, 35, 112–121. [Google Scholar] [CrossRef]
  18. Borsukiewicz-Gozdur, A.; Nowak, W. Maximising the working fluid flow as a way of increasing power output of geothermal power plant. Appl. Therm. Eng. 2007, 27, 2074–2078. [Google Scholar] [CrossRef]
  19. DiPippo, R. Ideal thermal efficiency for geothermal binary plants. Geothermics 2007, 36, 276–285. [Google Scholar]
  20. DiPippo, R. Second law assessment of binary plants generating power from low-temperature geothermal fluids. Geothermics 2004, 33, 565–586. [Google Scholar] [CrossRef]
  21. Lee, K.C. Classification of geothermal resources by exergy. Geothermics 2001, 30, 431–442. [Google Scholar] [CrossRef]
  22. Barbacki, A. Classification of geothermal resources in Poland by exergy analysis—Comparative study. Renew. Sustain. Energy Rev. 2012, 16, 123–128. [Google Scholar] [CrossRef]
  23. Aspen Plus V7.3. Aspen Technology Inc. Available online: http://www.aspentech.com/products/aspen-plus.aspx (accessed on 6 January 2012).
  24. El-Emam, R.S.; Dincer, I. Exergy and exergoeconomic analyses and optimization of geothermal organic Rankine cycle. Appl. Therm. Eng. 2013, 59, 435–444. [Google Scholar] [CrossRef]
  25. Çengel, Y.A.; Boles, M.A. Thermodynamics: An Engineering Approach; McGraw-Hill series in mechanical engineering; McGraw-Hill Higher Education: Boston, MA, USA, 2006. [Google Scholar]
  26. Hammond, G.; Jones, C. Inventory of Carbon & Energy: ICE; Sustainable Energy Research Team, Department of Mechanical Engineering, University of Bath: Bath, UK, 2008. [Google Scholar]
  27. Baumann, K. Some recent developments in large steam turbine practice. J. Inst. Electr. Eng. 1921, 59, 565–623. [Google Scholar]
  28. Michaelides, E.E.; Ryder, J.K. The influence of seasonal and daily temperature fluctuations on the work produced by geothermal power plants. Int. J. Energy Syst. 1992, 12, 68–72. [Google Scholar]
  29. Queiroz, J.A.; Rodrigues, V.; Matos, H.A.; Martins, F. Modeling of existing cooling towers in ASPEN PLUS using an equilibrium stage method. Energy Convers. Manag. 2012, 64, 473–481. [Google Scholar] [CrossRef]