3.1. Effects of Heat Flux and Pressure on the Heat Transfer
The effects of the heat flux and pressure on the supercritical convective heat transfer of
n-decane are studied in this section. The mass flux is 1200 kg/(m
2·s), the heat flux ranges from 200 to 700 kW/m
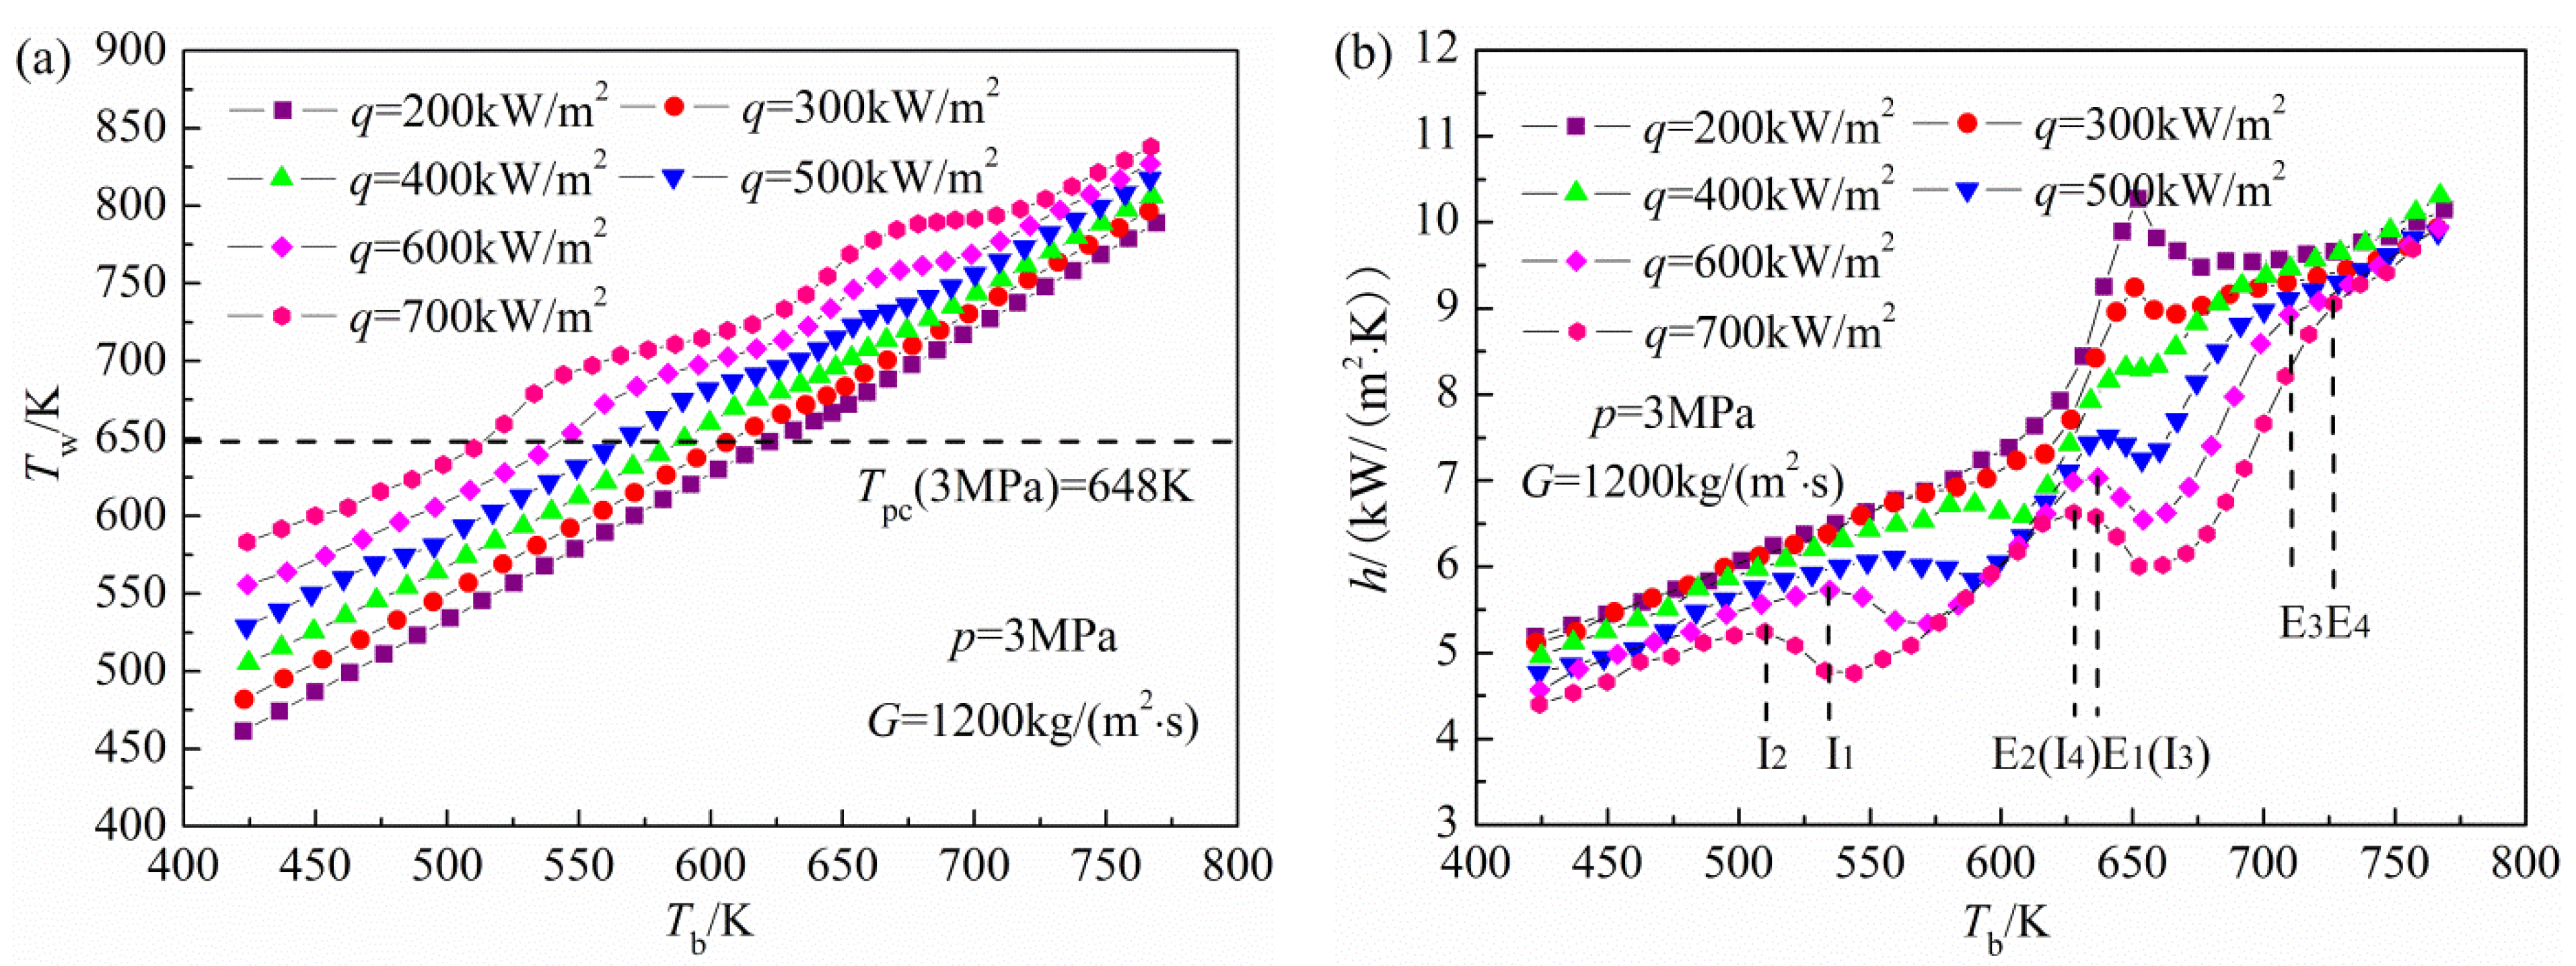
2, while the outlet pressures are 3 and 5 MPa, respectively. Variations of the wall temperature and HTC with bulk fluid temperature at a pressure of 3 MPa are presented in
Figure 4.
Figure 4.
Variations of the wall temperature and HTC with bulk fluid temperature at a pressure of 3 MPa: (a) wall temperature; and (b) HTC.
Figure 4.
Variations of the wall temperature and HTC with bulk fluid temperature at a pressure of 3 MPa: (a) wall temperature; and (b) HTC.
As shown in
Figure 4a, under low heat fluxes,
i.e., 200 and 300 kW/m
2, the wall temperature increases linearly with the increase of bulk fluid temperature. Under moderate heat fluxes of 400 and 500 kW/m
2, an interesting phenomenon is discovered in that a slight oscillation in the wall temperature occurs once it exceeds the corresponding pseudo-critical temperature. As the heat flux further increases further,
i.e., 600 and 700 kW/m
2, the wall temperature oscillation becomes more intense and two obvious peaks appear, indicating complex flow and heat transfer phenomena, which can be further explained by variation in the HTC.
As shown in
Figure 4b, under low heat fluxes of 200 and 300 kW/m
2, the total heat transfer process can be divided into three typical regions, and this is closely related to the variations of bulk fluid thermo-physical properties: (1)
Tb ≤ 614 K. The specific heat capacity rises with the increasing bulk fluid temperature, indicating that the fluid can carry away more heat from the tube wall. On the other hand, the axial velocity increases quickly owning to a continuous decrease in the density and dynamic viscosity, both of which lead to a linear increase of the HTC along the flow direction; (2) 614 K ≤
Tb ≤ 686 K. When the bulk fluid temperature approaches to its pseudo-critical temperature, the thermo-physical properties begin to change greatly, as a consequence, comprehensive effects of the specific heat capacity, density and dynamic viscosity lead to a significantly enhanced heat transfer. Then, the bulk fluid temperature exceeds the pseudo-critical temperature, and a rapid decrease of the specific heat capacity causes a slight deterioration in heat transfer; (3)
Tb ≤ 686 K. The density, specific heat capacity and dynamic viscosity change slightly, and merely the variation of the thermal conductivity is beneficial to enhance the heat transfer, so the HTC gradually increases as the bulk fluid temperature increases. Under these operational conditions, the HTC and bulk fluid specific heat capacity have similar variation tendencies. Obviously, the specific heat capacity is the most important factor influencing the heat transfer performance, and a HTC peak appears due to the bulk fluid temperature in the large specific heat capacity region. As the heat flux increases, because of the wall temperature oscillation, the variation of the HTC along the flow direction becomes more complicated, the HTD occurs in both the low and high bulk temperature regions. The same phenomenon has also been observed in an experimental study of the convective heat transfer of
n-decane under supercritical pressures [
21], as mentioned above. The degree of deteriorated heat transfer deepens gradually with increasing heat flux, featuring a larger corresponding bulk fluid temperature range. Mechanisms of the HTD will be discussed in detail in the following sections, taking
q = 200, 600, 700 kW/m
2 in
Figure 4 as examples.
Figure 5 presents variations of the wall temperature and HTC along the tube axial direction at a high pressure of 5 MPa. As clearly depicted in
Figure 5a, the wall temperature increases linearly with the increasing bulk fluid temperature for every heat flux, and no wall temperature oscillation occurs, indicating a good heat transfer performance at higher pressures. This fact is further validated by the variation of HTC, as illustrated in
Figure 5b.
Figure 5.
Variations of the wall temperature and HTC with bulk fluid temperature at a pressure of 5 MPa: (a) wall temperature; (b) HTC.
Figure 5.
Variations of the wall temperature and HTC with bulk fluid temperature at a pressure of 5 MPa: (a) wall temperature; (b) HTC.
Furthermore, the HTC and bulk fluid specific heat capacity show a consistent variation trend along the flow direction, similar to those two low heat flux operational conditions when p = 3 MPa, as mentioned above. It can be concluded that the HTD of supercritical n-decane is closely related to the operational pressure, and only appears in a relatively smaller near-critical pressure range. It can be expected that the critical heat flux of HTD will also increase accordingly with increasing pressure. The critical conditions for the onset of HTD will be analyzed below.
Since the HTD becomes more serious with the increase in heat flux, it is necessary to define a boundary so as to determine when the deterioration is safe, and when the deterioration is unsafe. For this purpose, Shiralkar
et al. [
22] stated that the HTD will do damage to the system safety operation, when the following conditions are satisfied:
where
NuD−B obtained from the Dittus–Boelter correlation, which is given as follows:
where
NuD−B obtained from the Dittus–Boelter correlation, which is given as follows:
where
Reb and
Prb are the Reynolds number and PrandtI number, respectively, based on properties at the bulk fluid temperature.
The Nusselt number is defined as:
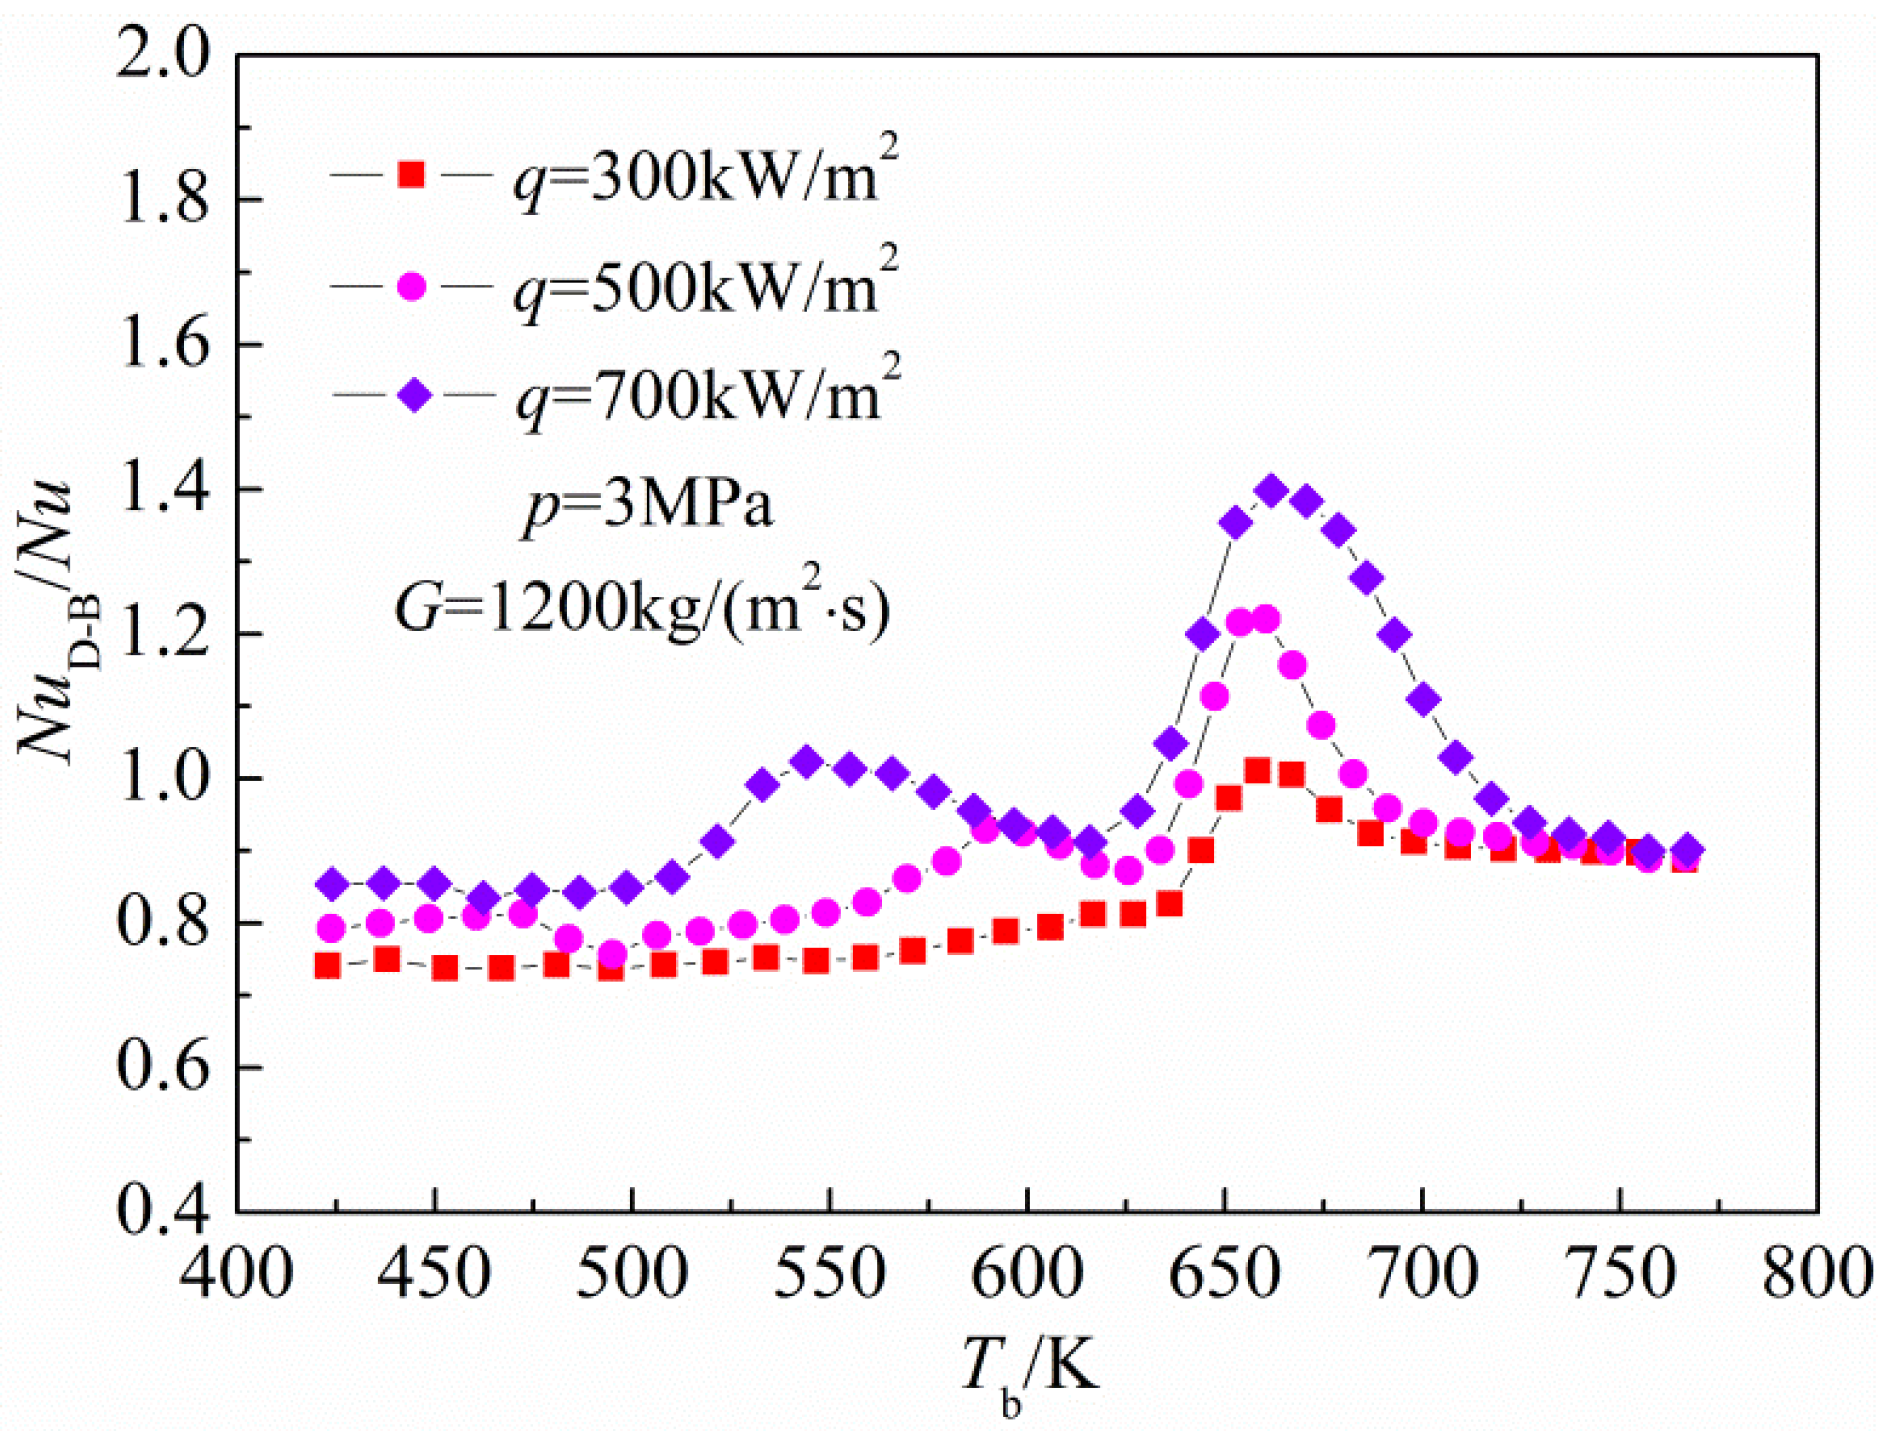
Figure 6 presents variations of
NuD−B /
Nu with bulk fluid temperature at a pressure of 3 MPa. As shown in
Figure 6,
NuD−B /
Nu increases with the increase of heat flux, and in general, the maximum value of
NuD−B /
Nu corresponds to the same position of the minimum HTC point. When the heat flux is 700 kW/m
2, the maximum value of
NuD−B /
Nu is about 1.4, lower than the critical value proposed by Shiralkar
et al. [
22]. As the heat flux further increases, significant thermal cracking will occur in the large specific heat capacity region because the wall temperature generally exceeds 870 K. The thermal cracking is an endothermic reaction, can absorb heat through the chemical heat sink, and as a result enhance the heat transfer [
23]. Therefore, it can be concluded that the HTD will not cause serious harm to the cooling system under these operational conditions. In addition,
Figure 6 also indicates that the Dittus–Boelter expression is no longer applicable for the heat transfer predictions.
Figure 6.
Variations of NuD−B / Nu with bulk fluid temperature at a pressure of 3 MPa.
Figure 6.
Variations of NuD−B / Nu with bulk fluid temperature at a pressure of 3 MPa.
In order to better predict the convective heat transfer of
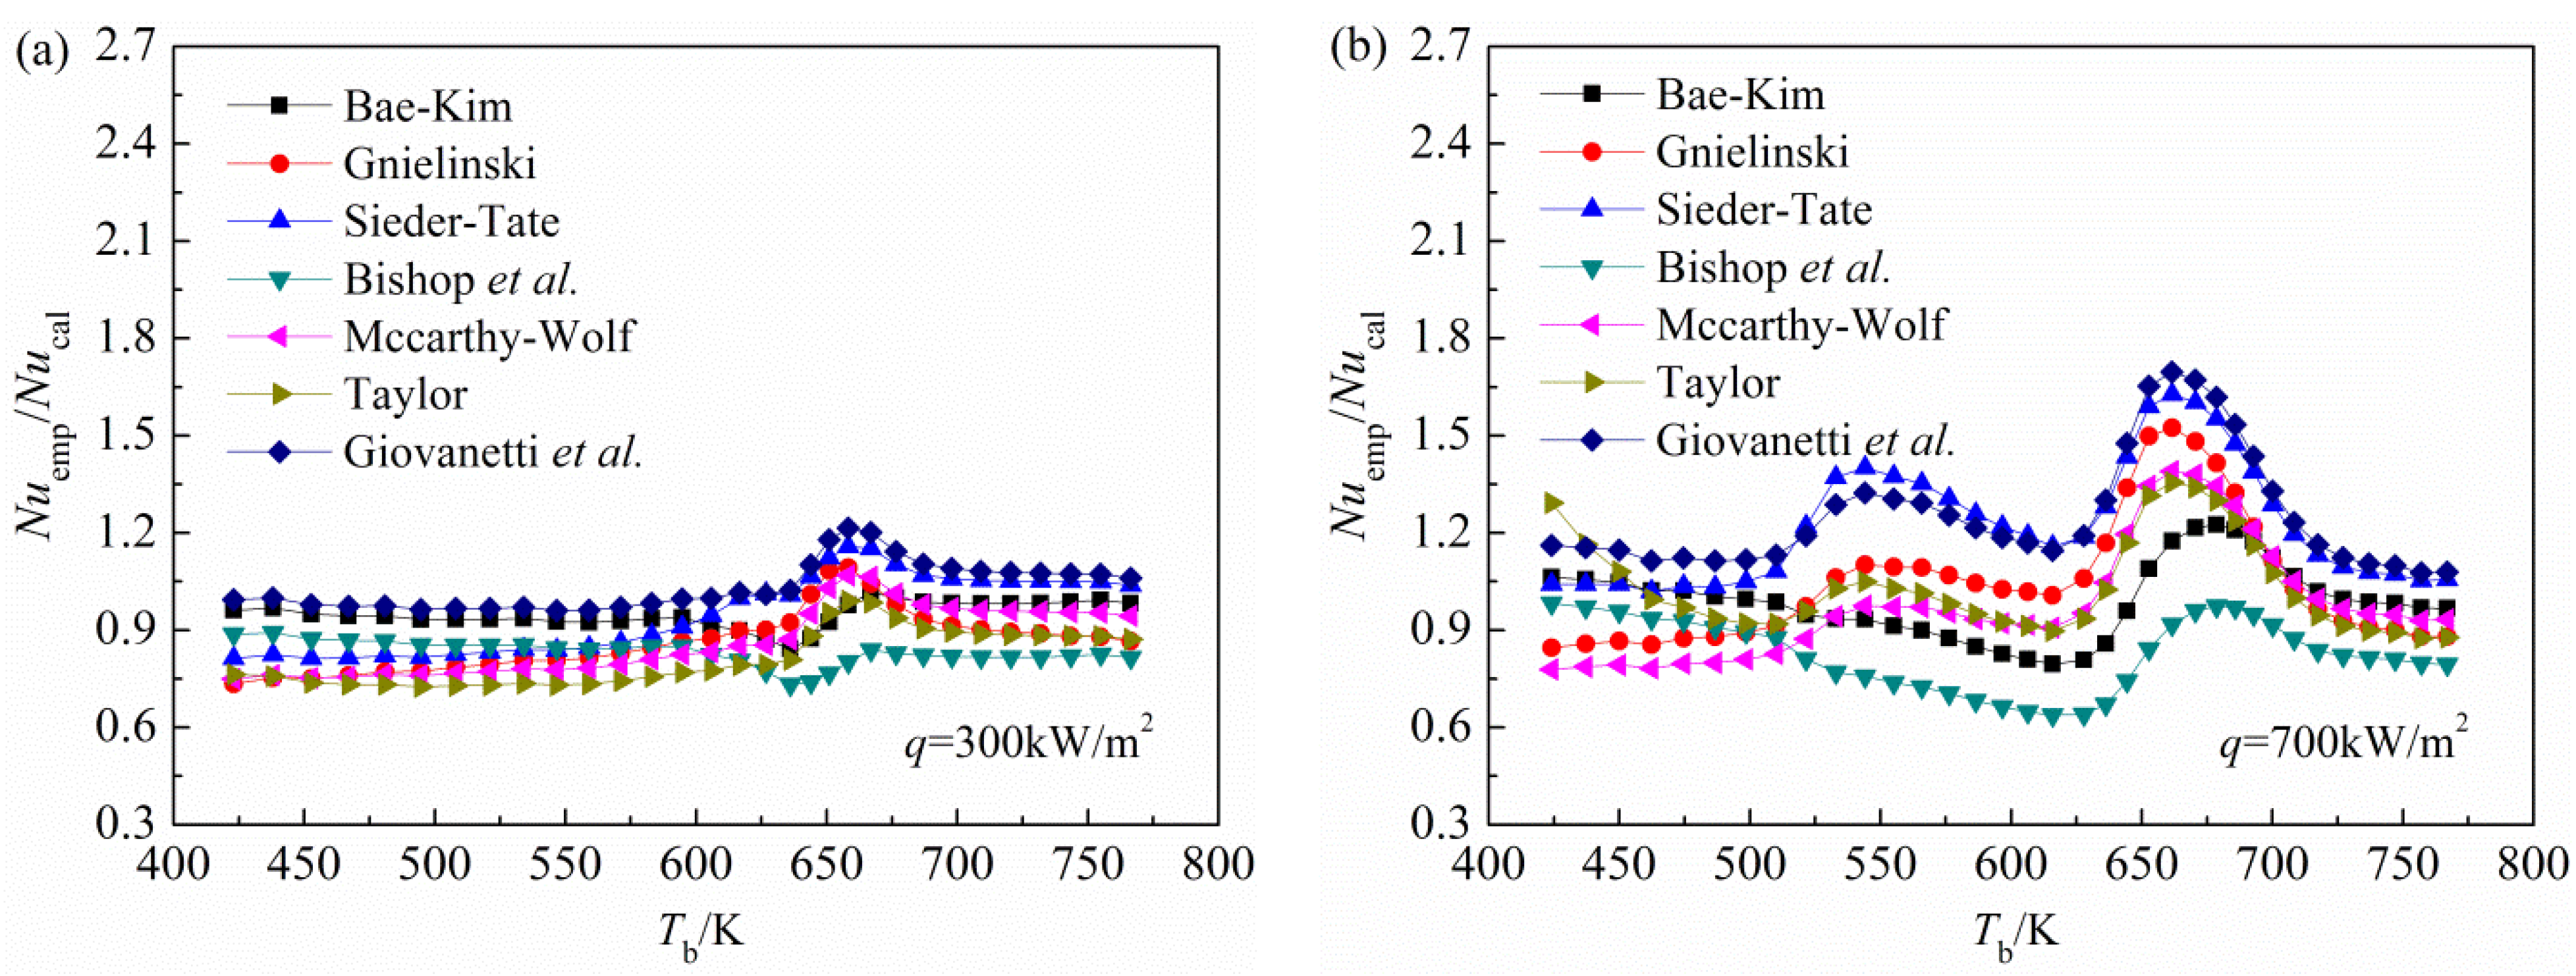
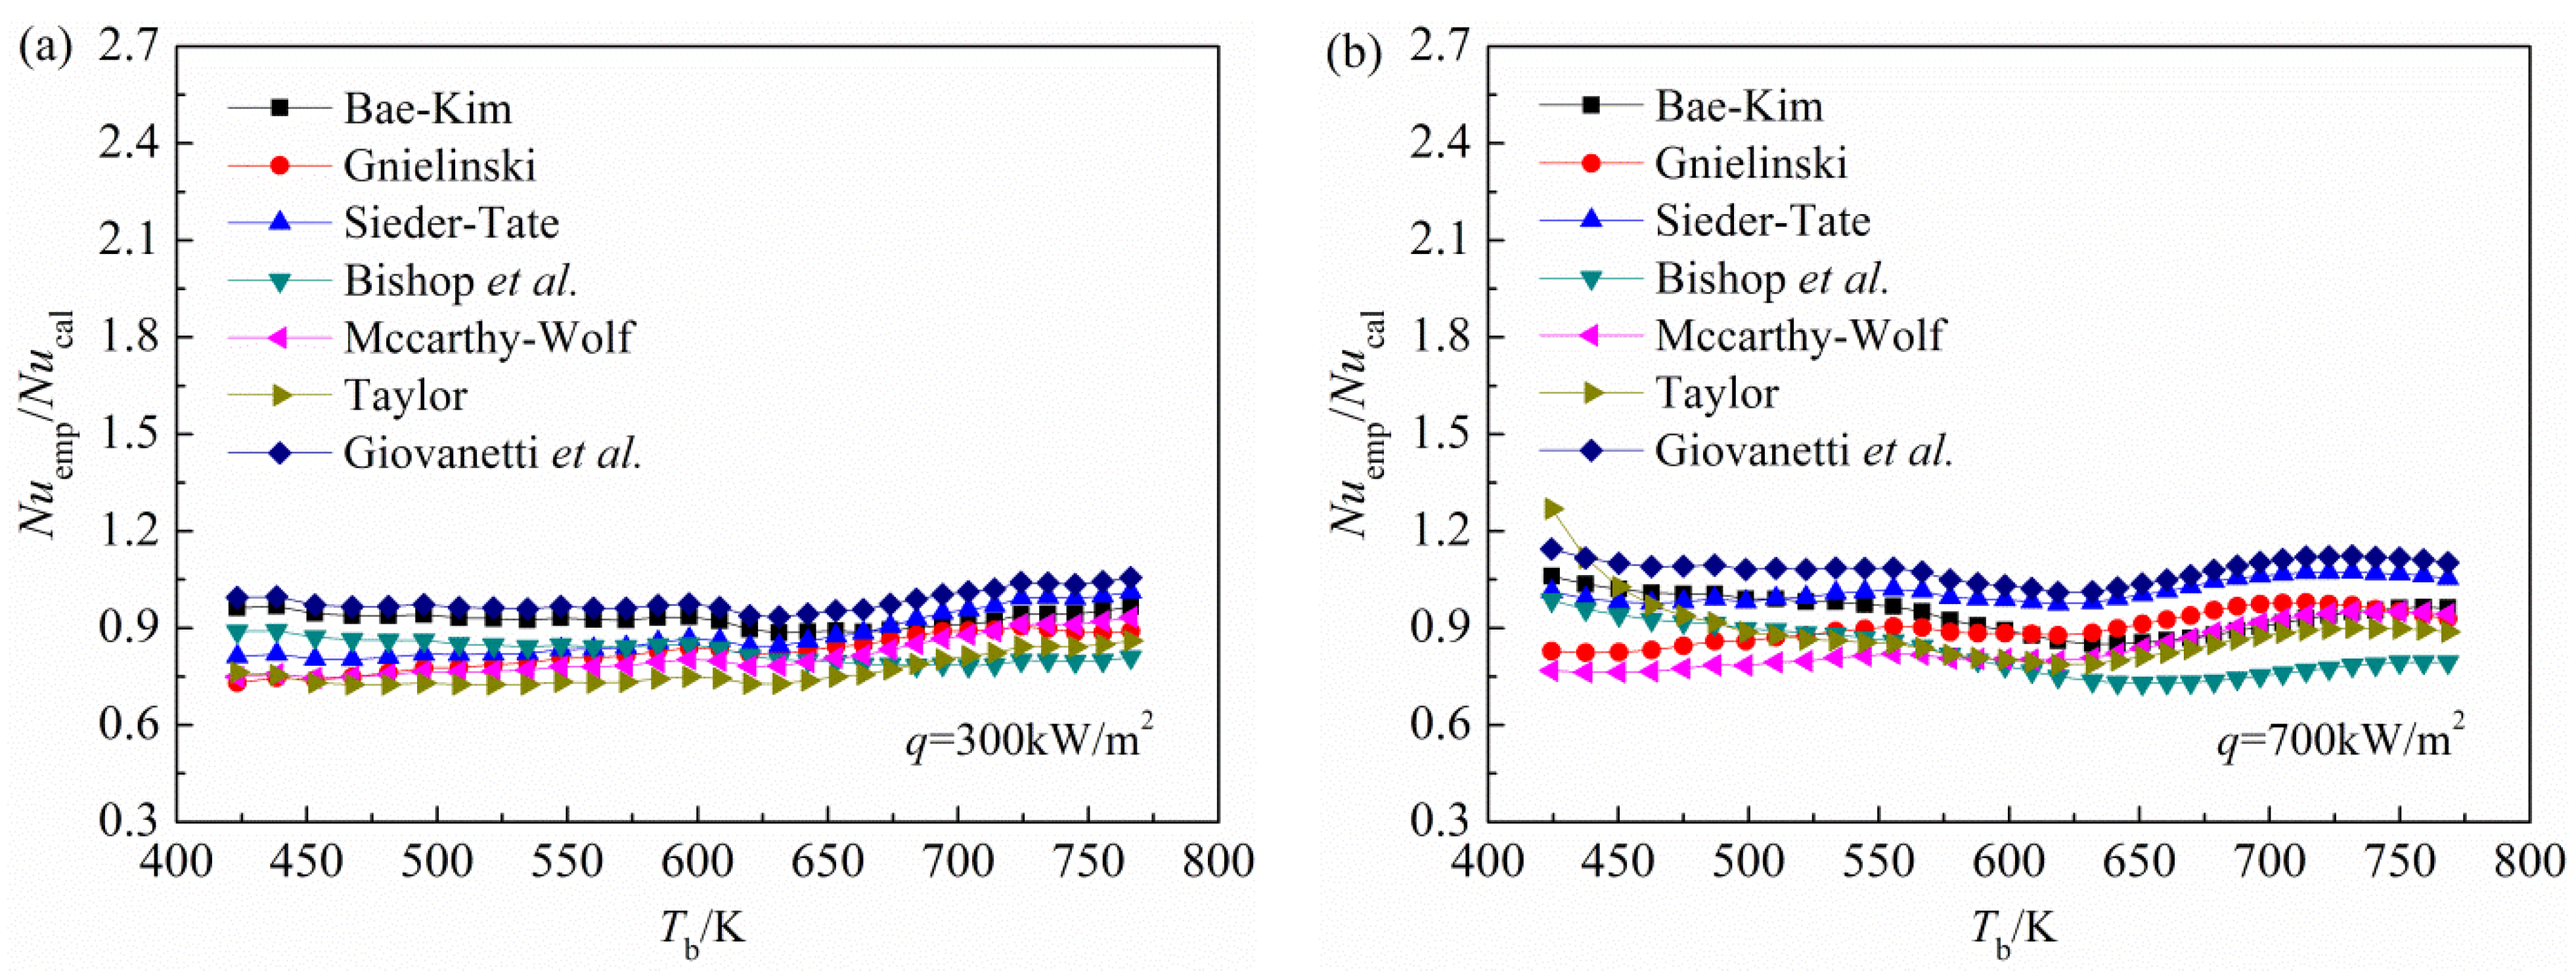
n-decane under supercritical pressures, particularly the HTD phenomena, the applicability of several conventional empirical correlations are verified. Comparisons of the Nusselt number from both the present numerical calculations and the empirical expressions proposed by Bae-Kim [
24], Gnielinski [
11], Sieder-Tate [
25], Bishop
et al. [
26], Mccarthy-Wolf [
27], Taylor [
27], Giovanetti
et al. [
28], are shown in
Figure 7 and
Figure 8. The details of these correlations are in
Table 1.
The Nusselt number from both the present numerical calculations (
Nucal) and the empirical expressions (
Nuemp) at a pressure of 3 MPa are compared in
Figure 7. As shown in
Figure 7, at a low heat flux of 300 kW/m
2, the Nusselt number obtained from these seven expressions are in very good agreement with our present numerical results, all of the relative errors are generally within 25%. When the heat flux is at a high level,
i.e., 700 kW/m
2, the Bae-Kim expression still has higher precision, and the relative error is less than 20%, meeting the accuracy requirements for engineering calculations. By contrast, the other expressions incur relatively large prediction deviations from the present numerical results, because they cannot predict the HTD phenomena. The maximum relative errors generally reaches around 40%, indicating that these expressions are invalid for heat transfer predictions of supercritical
n-decane under high heat fluxes.
Figure 8 compares the Nusselt number from the numerical calculations and the seven empirical expressions at a pressure of 5 MPa. As shown in
Figure 8, under a higher pressure, the HTD phenomena disappear due to the gentle thermal properties variations. Consequently, all these expressions have good applicability, the relative errors at two different heat fluxes are generally within 25%. Especially the Bae-Kim expression, the relative errors with the numerical results are less than 10%, indicating the best prediction performance.
Figure 7.
Comparisons of the Nusselt number from the present numerical calculations and the empirical expressions under a pressure of 3 MPa: (a) q = 300 kW/m2; and (b) q = 700 kW/m2.
Figure 7.
Comparisons of the Nusselt number from the present numerical calculations and the empirical expressions under a pressure of 3 MPa: (a) q = 300 kW/m2; and (b) q = 700 kW/m2.
Figure 8.
Comparisons of the Nusselt number from the present numerical calculations and the empirical expressions under a pressure of 5 MPa: (a) q = 300 kW/m2; and (b) q = 700 kW/m2.
Figure 8.
Comparisons of the Nusselt number from the present numerical calculations and the empirical expressions under a pressure of 5 MPa: (a) q = 300 kW/m2; and (b) q = 700 kW/m2.
Table 1.
Conventional convective heat transfer empirical correlations of supercritical fluids.
In summary, the Bae-Kim expression, which has higher prediction accuracy when the HTD occurs, can be better used for supercritical heat transfer predictions of n-decane.
3.2. Mechanisms of the HTD
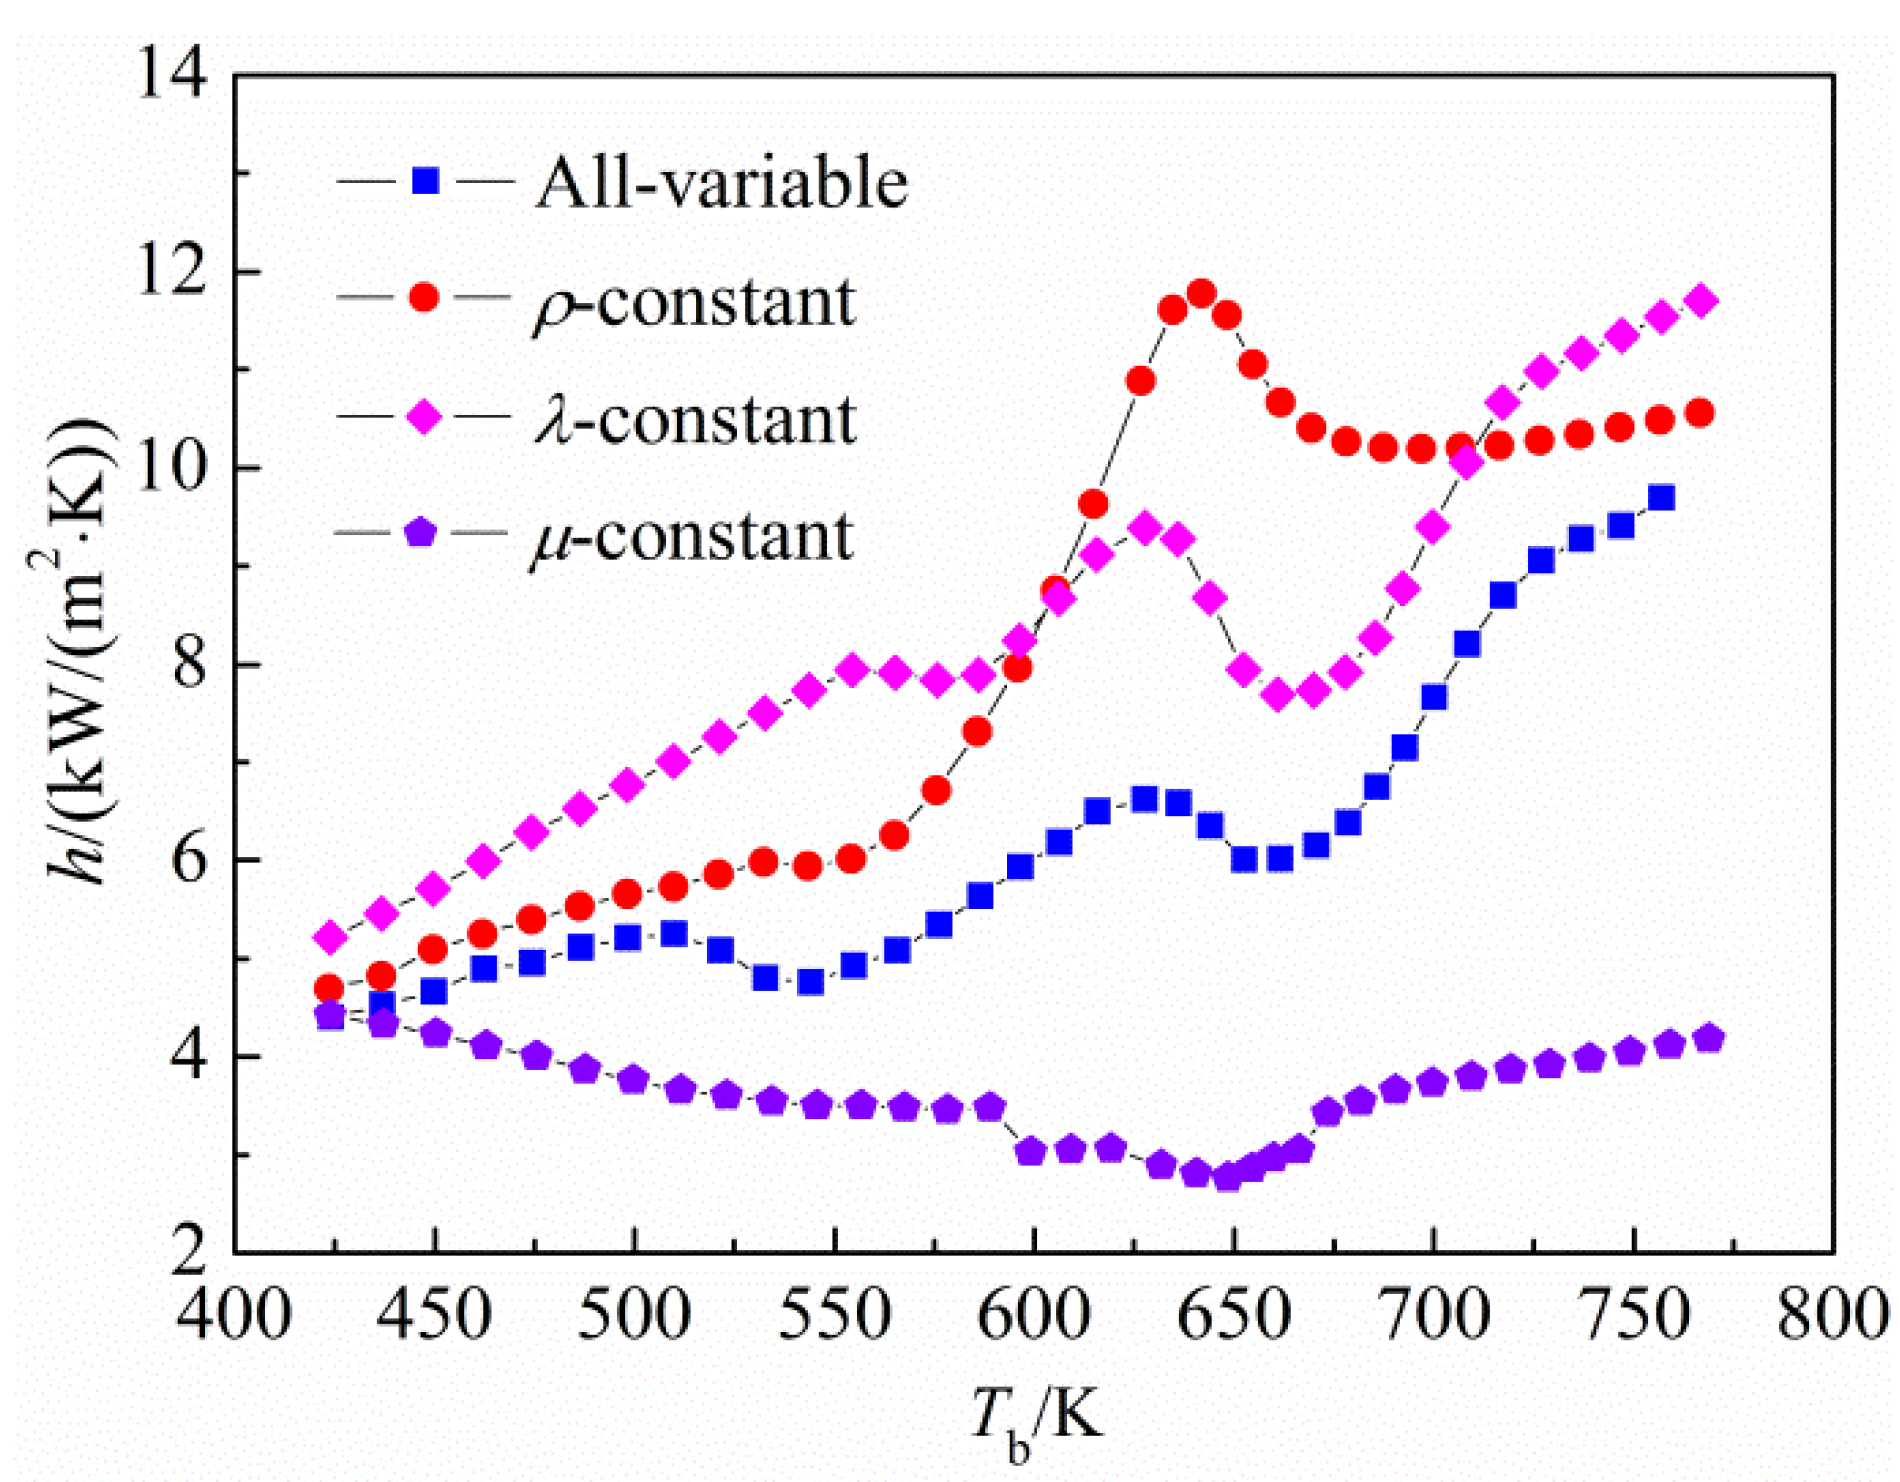
As described above, the specific heat capacity plays a dominant role in the heat transfer process of non-HTD operational conditions, indicating that it almost makes no contribution to the HTD phenomena. The influence of other fluid properties,
i.e., density, thermal conductivity and dynamic viscosity, on HTD are also investigated by setting one of these parameters as a constant (equal to the value corresponding to 425 K), while the others are still as a function of temperature in each calculation. The results are shown in
Figure 9. As depicted in
Figure 9, keeping the density constant, the HTD phenomena basically disappear; while keeping the thermal conductivity or dynamic viscosity constant, two types of HTD phenomena still exist. Consequently, it can be concluded that the occurrence of HTD closely relates to the dramatic changes of density with temperature. However, constant treatment is taken on the thermal conductivity or dynamic viscosity, the HTC shows a significantly increasing or decreasing tendency, which manifests that the variations of thermal conductivity and dynamic viscosity can worsen and enhance the heat transfer, respectively.
Figure 9.
Effects of the thermo-physical properties on HTD under heat flux of 700 kW/m2.
Figure 9.
Effects of the thermo-physical properties on HTD under heat flux of 700 kW/m2.
The previous studies on convective heat transfer of supercritical fluids in vertical circular tubes indicated that the HTD phenomena were closely related to the abnormal variations of turbulent kinetic energy near the wall [
6,
7,
8,
9,
10]. To illustrate the relationship between the two,
Figure 10 presents the distributions of near-wall (
r/
R = 0.95) turbulent kinetic energy (
k) along the tube axial direction at three different heat fluxes. Where
Ii,
Ei (
i = 1–4) are the corresponding tube cross-sections of the initial point of deteriorated heat transfer and the ending point of heat transfer recovered, respectively, as clearly depicted in
Figure 4b. As shown in
Figure 10, under a low heat flux of 200 kW/m
2, there is no abnormal distribution of the turbulent kinetic energy near the wall, and which increases monotonically along the flow direction. Under high heat fluxes of 600 and 700 kW/m
2, the near-wall turbulent kinetic energy first decreases and then increases along the tube axial direction, corresponding to the deteriorated heat transfer and heat transfer recovered in the low bulk fluid temperature region. This phenomenon indicates that the flow in the near-wall region has already transited from turbulent-like to laminar-like. The flow laminarization near the wall was generally caused by the strong buoyancy force in upward flow or thermal acceleration in downward flow [
6,
7,
8,
9,
10], but for horizontal channels, so far, it has not yet been a consistent conclusion. During the related heat transfer process,
i.e.,
Ii–
Ei (
i = 1,2), it can be found from
Figure 4a that the wall temperature is slightly higher than the pseudo-critical temperature, thus the fluid temperature in the near-wall region is close to the pseudo-critical temperature. Therefore, it can be considered that the near-wall fluid is subjected to a fluid acceleration effect due to large drops of the density with temperature, and thus the turbulent heat transfer near the wall is significantly suppressed [
29], which resulting in the occurrence of HTD.
Figure 11 further presents variations of the wall shear stress (τ
w) with bulk fluid temperature. As shown in
Figure 11, the wall shear stress and near-wall turbulent kinetic energy show a similar variation trend corresponding to the deteriorated heat transfer and heat transfer recovered in the low bulk fluid temperature region. This means that the frictional resistance has been subjected to a certain extent to weakening during the related heat transfer process. Clearly, this phenomenon is caused by the flow acceleration near the wall. As the wall temperature increases, the pseudo-critical point gradually moves away from the wall, the near-wall turbulent kinetic energy starts to slowly recover due to weakening of the flow acceleration, and thus the heat transfer is improved.
Figure 10.
Variations of the near-wall turbulent kinetic energy with bulk fluid temperature under different heat fluxes.
Figure 10.
Variations of the near-wall turbulent kinetic energy with bulk fluid temperature under different heat fluxes.
Figure 11.
Variations of the wall shear stress with bulk fluid temperature under different heat fluxes.
Figure 11.
Variations of the wall shear stress with bulk fluid temperature under different heat fluxes.
In addition,
Figure 10 and
Figure 11 also show that the mechanism of HTD in the high bulk fluid temperature region is very different from that of the low bulk fluid temperature region. It can be seen from
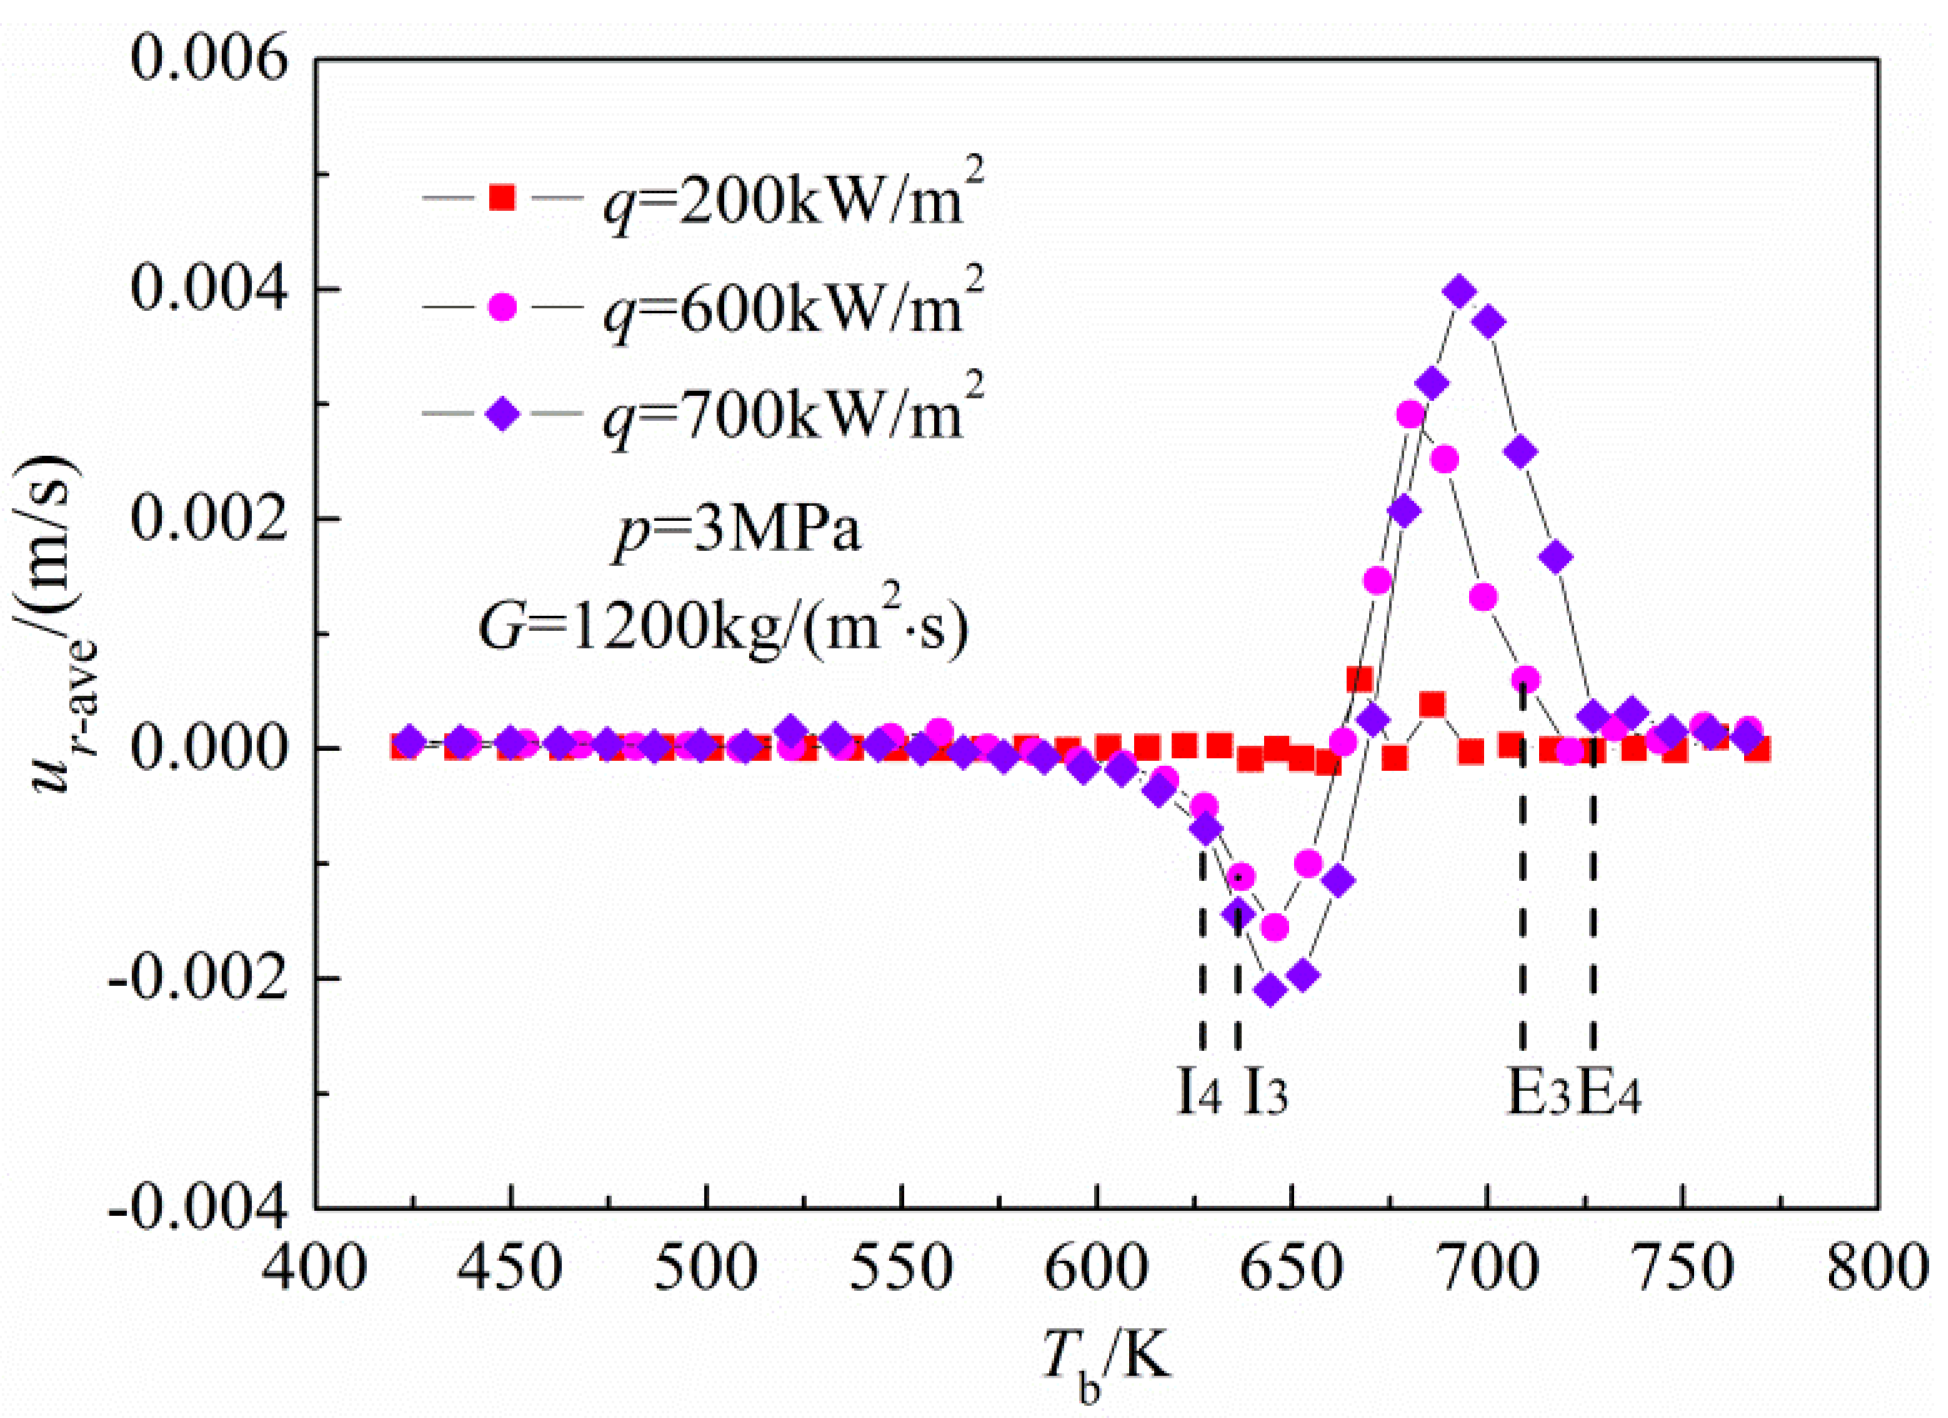
Figure 4b that this type of HTD occurs when the bulk fluid temperature is in the vicinity of the pseudo-critical temperature. For this type of HTD, there has not yet been a clear mechanism analysis. For further explanation of this phenomenon,
Figure 12 presents variations of the averaged radial velocity (
ur-ave, positive toward the wall) with bulk fluid temperature at three different heat fluxes, as mentioned above. As shown in
Figure 12, under a low heat flux of 200 kW/m
2, the HTD does not appear and the averaged radial velocity is close to zero during the entire heat transfer process. As the heat flux increases,
i.e., 600 and 700 kW/m
2, the averaged radial velocity shows a larger variation, and two obvious waveforms, first negative and then positive, are observed corresponding to the deteriorated heat transfer and heat transfer recovered in the high bulk fluid temperature region. This phenomenon indicates that this HTD is necessarily linked with the abnormal distribution of radial velocity. Meng
et al. [
11,
12] considered that the radial velocity oscillation had a negative impact on the heat transfer, and would lead to HTD and a slight oscillation of HTC, but its action mechanism on HTD has not yet received a detailed explanation.
Figure 12.
Variations of the averaged radial velocity with bulk fluid temperature under different heat fluxes.
Figure 12.
Variations of the averaged radial velocity with bulk fluid temperature under different heat fluxes.
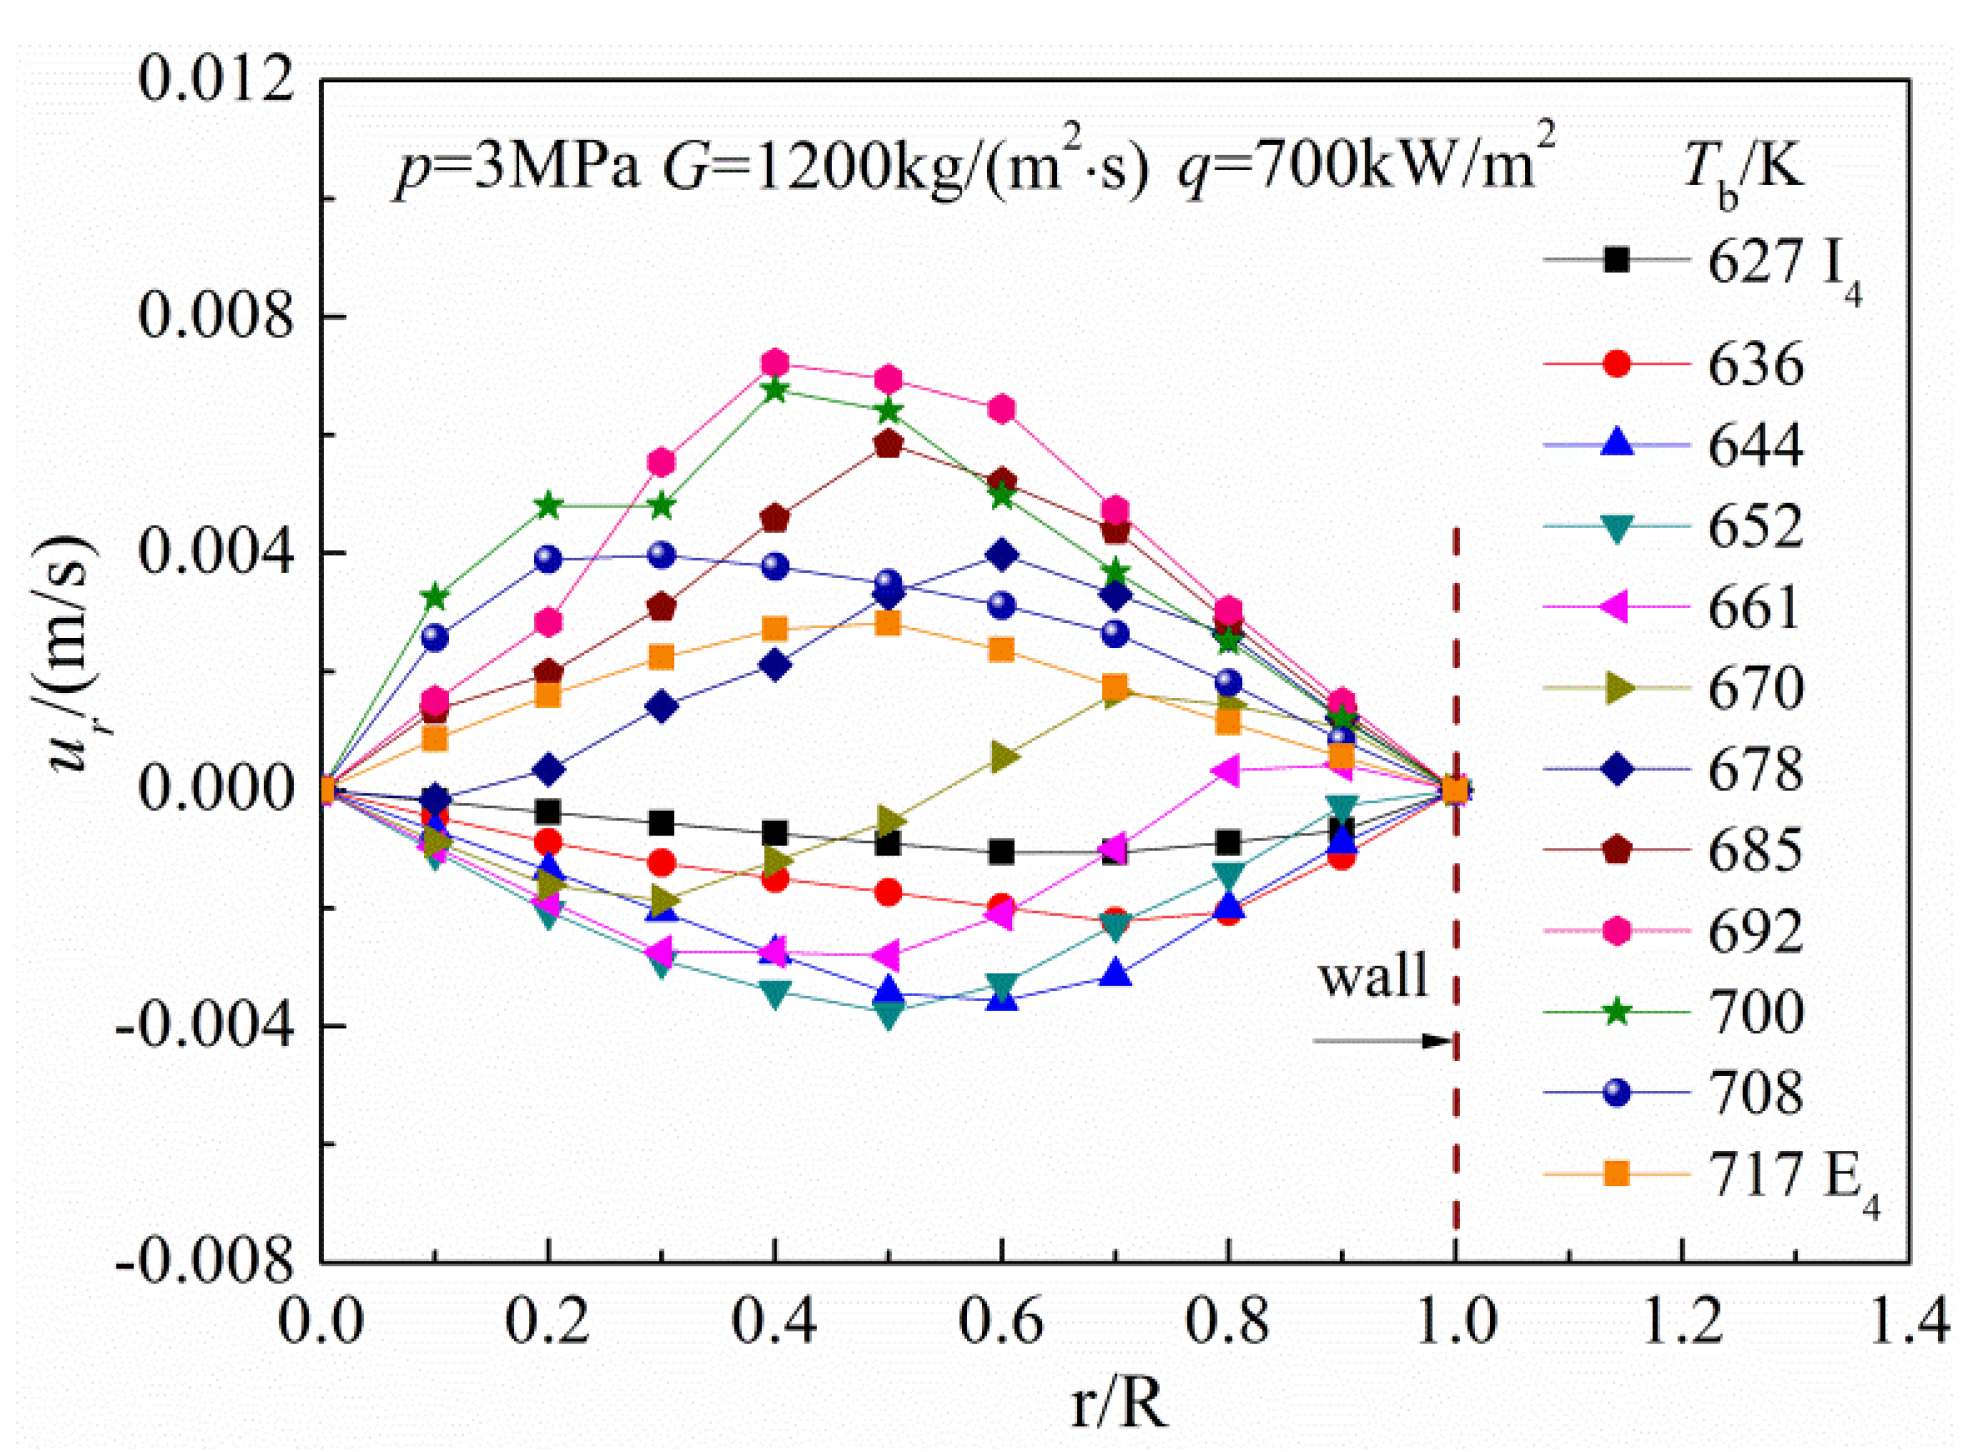
Figure 13 shows the radial velocity distributions in the tube cross-sections corresponding to the deteriorated heat transfer and heat transfer recovered in the high bulk fluid temperature region when the heat flux is 700 kW/m
2, and the following explanation can be offered for effect mechanism of the radial velocity on heat transfer: firstly, the radial velocity is pointing to the center of tube cross-section, which means that the fluid of cross-section has a trend to flow toward the tube center. Thus, the mixing of hot and cold fluids near the wall is weakened, and the wall cannot be effectively cooled, which resulting in a rapid deterioration of heat transfer along the tube axial direction. Then, the radial velocity begins to change direction to the wall, from the near-wall region gradually extending to the entire radial extent. That is to say, the fluid of the cross-section has a trend to flow toward the wall. As a consequence, the mixing of near-wall fluids is enhanced, and the heat transfer is gradually improved along the flow direction. The demarcation point between the two processes is essentially when the bulk fluid temperature is about the pseudo-critical temperature, but the deterioration and oscillation of turbulent heat transfer in supercritical hydrocarbon fuels, e.g., methane and
n-heptane, and the radial velocity direction were not necessarily linked in Hua’s study [
11,
12].
Figure 13.
Radial velocity distributions corresponds to the deteriorated heat transfer and heat transfer recovered processes in the high bulk fluid temperature region under a heat flux of 700 kW/m2.
Figure 13.
Radial velocity distributions corresponds to the deteriorated heat transfer and heat transfer recovered processes in the high bulk fluid temperature region under a heat flux of 700 kW/m2.
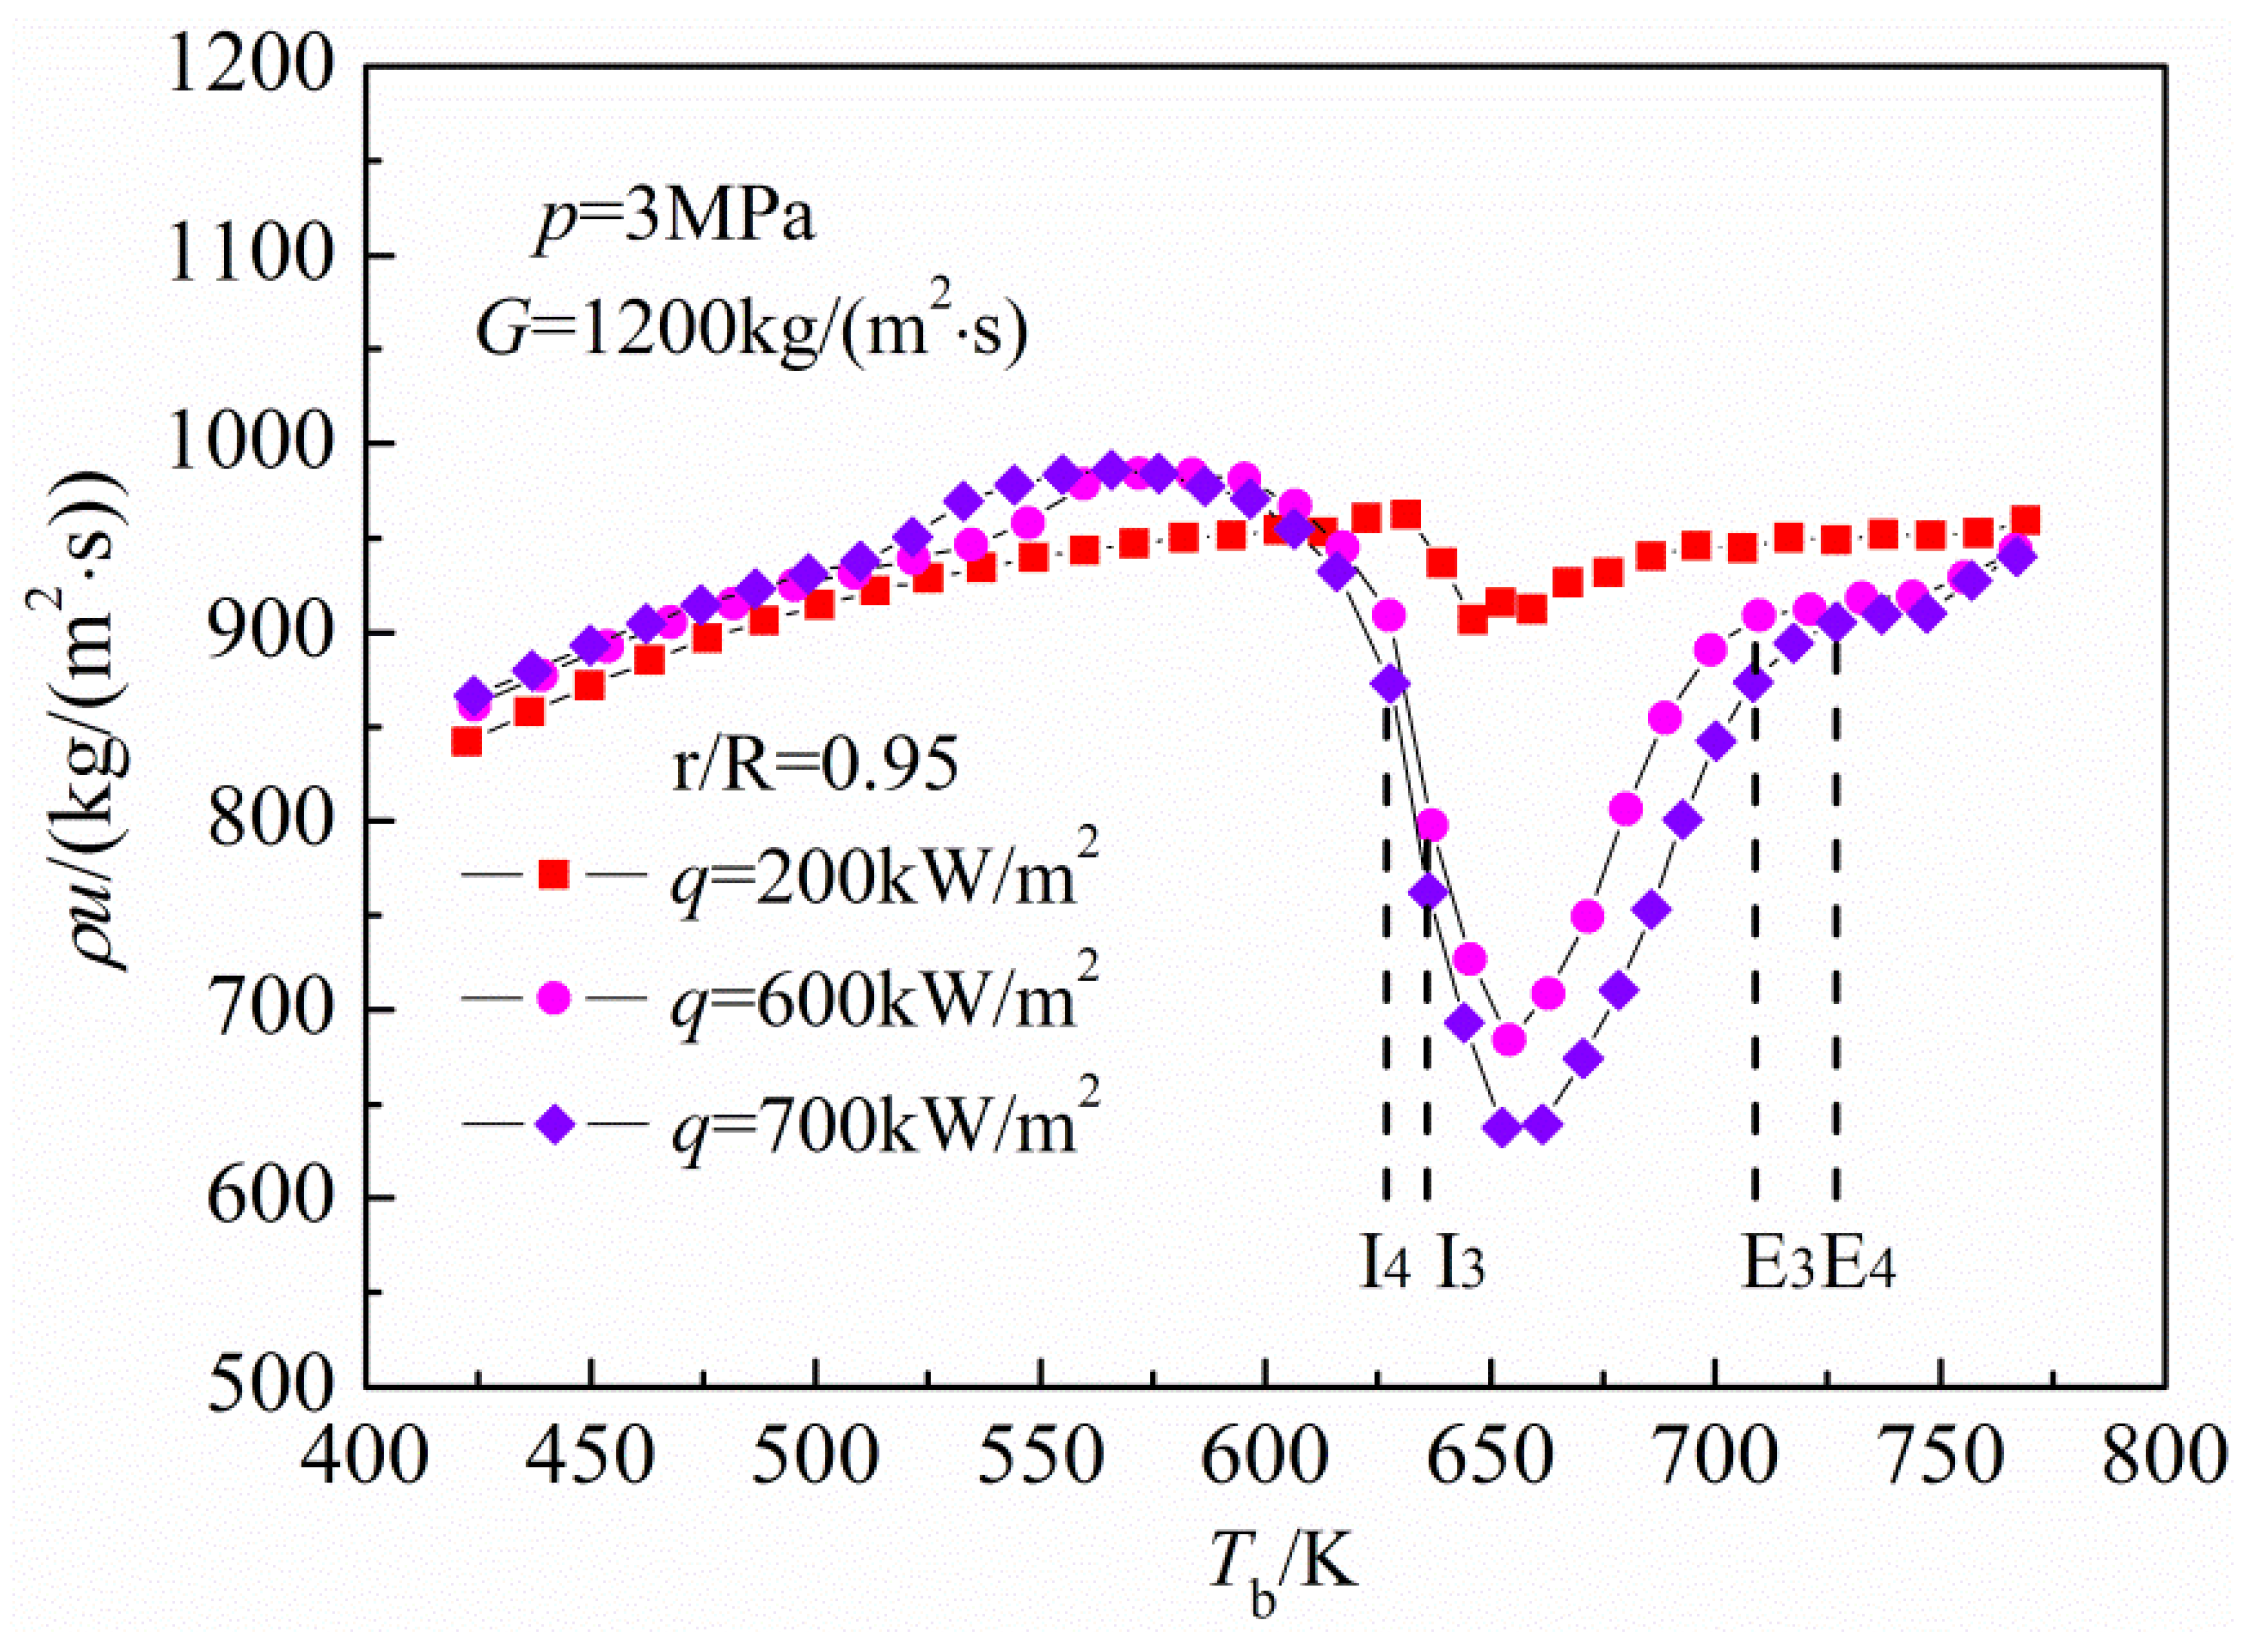
Figure 14 presents the near-wall (
r/
R = 0.95) mass flux variations with bulk fluid temperature under the three heat fluxes. As shown in
Figure 14, compared to the operational condition without HTD at low heat flux, the mass flux near the wall shows a significant variation along the tube axial direction, first decreases and then increases corresponding to the deteriorated heat transfer and heat transfer recovered under high heat fluxes. This indicates that abnormal distribution of mass flux appears in the tube cross-sections, the near-wall fluid is brought together to the tube center and leads to an increase of mass flux in the bulk fluid region, while the mass flux in the near-wall region drastically decreases. Obviously, this phenomenon is closely related to the radial velocity oscillation. During the related heat transfer process,
i.e.,
Ii–
Ei (
i = 3,4), as the bulk fluid temperature approaches to the pseudo-critical temperature, the tube cross-section with a larger drastic density variation in its radial direction. Especially in the near-wall region, a large volume of low-density fluid (gas-like) accumulates due to the relatively high fluid temperature.
Figure 14.
Variations of the near-wall mass flux with bulk fluid temperature under different heat fluxes.
Figure 14.
Variations of the near-wall mass flux with bulk fluid temperature under different heat fluxes.
As a result, the volume and the local pressure of fluid near the wall increases much more than that of the fluid in the bulk fluid region. The pressure imbalance will force the fluid near the wall to the bulk fluid region, so that the wall surface is filmed with a layer of illiquid hot fluid, thus preventing the heat from the wall to the bulk fluid region. This is in fact similar to the film boiling heat transfer under subcritical pressure, and can be considered as a pseudo-film boiling deteriorated heat transfer phenomenon. And then, as the bulk fluid temperature moves away from the pseudo-critical temperature, the pressure imbalance weakens for the reason that the radial fluid density gradient decreases. Therefore, the mass flux near the wall increases owing to the modified radial flow field gradually recovers, and thus the heat transfer is improved along the tube axial direction.
3.3. Critical Condition for the Onset of HTD
The critical condition for the onset of HTD, which is applicable to the n-decane at supercritical pressures, is investigated in this section. The pressure range is 3–5 MPa, while the mass flux varies from 400 to 2000 kg/(m2·s).
The previous studies of deterioration phenomena in heat transfer to supercritical fluids indicated that: at a certain inlet temperature, the onset of HTD depends on the combined effects of pressure, mass flux and heat flux [
9,
15,
16,
30,
31]. For supercritical inorganic substances, such as water and carbon dioxide, Yamagata
et al. [
30], Styrikovich
et al. [
31], Kim
et al. [
9] developed respectively a series of corrections for critical heat flux of HTD, and concluded that it was only related to the mass flux. However, the related studies for organic substances, including the methane [
15] and pentane [
16], have also been conducted by Urbano
et al. [
15] and Zhou
et al. [
16], both of which further considered the effect of pressure. The details of these empirical expressions are in
Table 2.
Table 2.
Selected empirical correlations for critical heat flux of HTD of supercritical fluids.
Table 2.
Selected empirical correlations for critical heat flux of HTD of supercritical fluids.
| Author | Correlation | Fluid |
|---|
| Yamagata et al. [30] | qcr = 0.2 G1.2 | H2O |
| Styrikovich et al. [31] | qcr = 0.58 G | H2O |
| Kim et al. [9] | qcr = 0.0002 G2 | CO2 |
| Urbano et al. [15] | qcr = (0.0432p + 0.0314)G | CH4 |
| Zhou et al. [16] | qcr = 0.0000855 G2 + 0.1368 Gp + 4.1 p2 − 0.162 G + 37p − 42.6 | C5H12 |
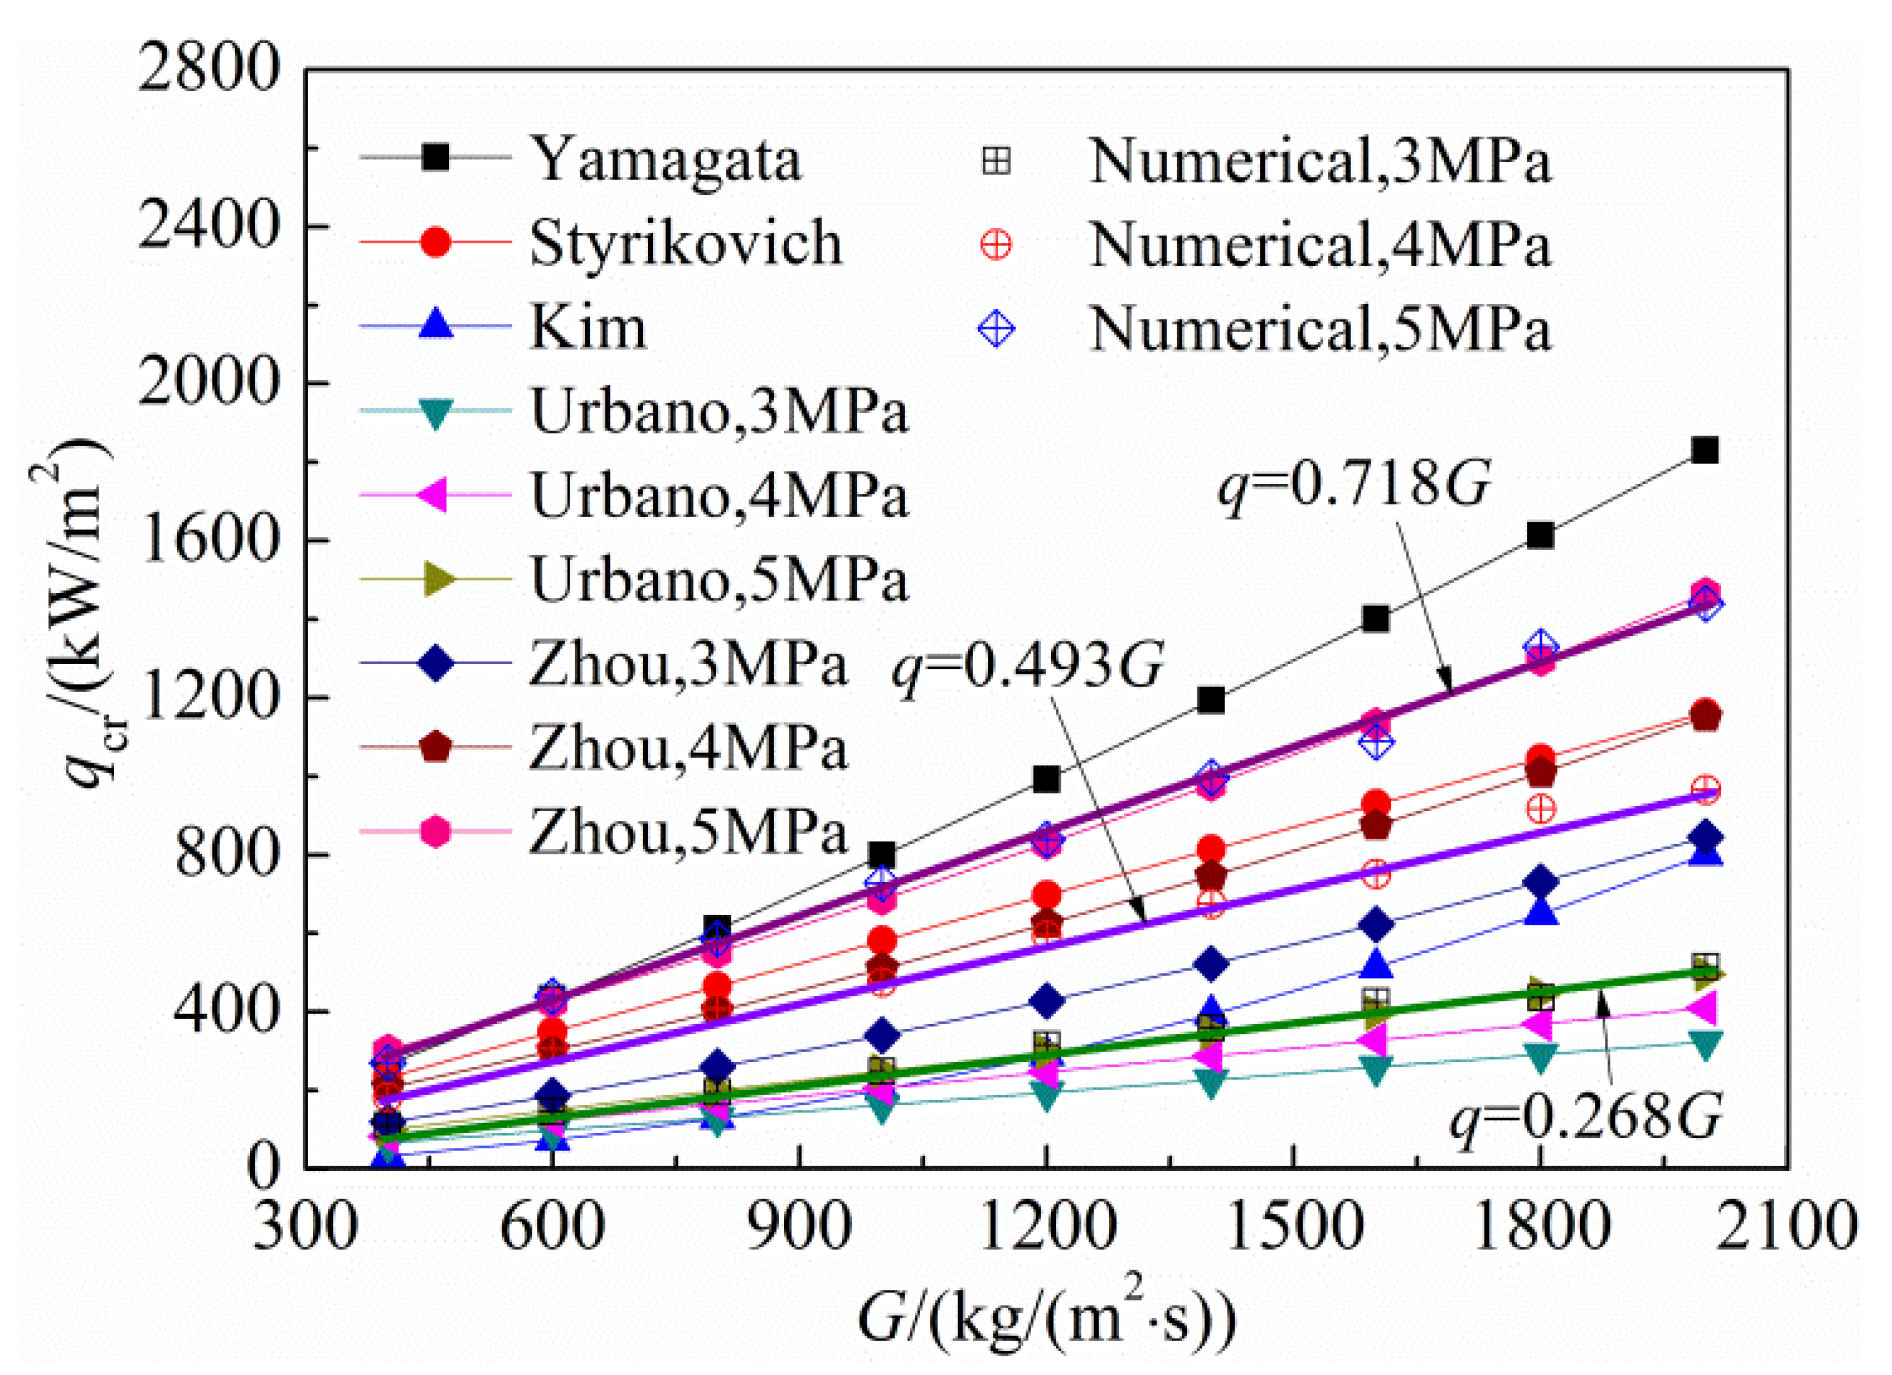
Figure 15 shows a comparison of the critical heat flux of HTD from the numerical calculations and the empirical expressions at the three different pressures. As shown in
Figure 15, none of these empirical expressions are longer valid for the critical heat flux predictions of
n-decane at supercritical pressures, which may be caused by the differences in fluid properties and operational parameters. It should be noted that the HTD onset is not clearly defined in the literatures [
9,
16,
30,
31]. Urbano
et al. [
15] established the following criterion: (
q/
G)
cr appears when min (d
Tw/d
x) = 0 is satisfied, which is used in the present study. Meanwhile, under the same pressure, a linear relation is found between the critical heat flux and mass flux. When the pressure is 3 MPa, a corresponding critical condition for the onset of HTD is (
q/
G)
cr = 0.268 kJ/kg. The heat transfer will be improved with the increasing pressure, hence, under the pressures of 4 and 5 MPa, the corresponding critical conditions for the onset of HTD are increased to (
q/
G)
cr = 0.493 kJ/kg and (
q/
G)
cr = 0.718 kJ/kg, respectively.
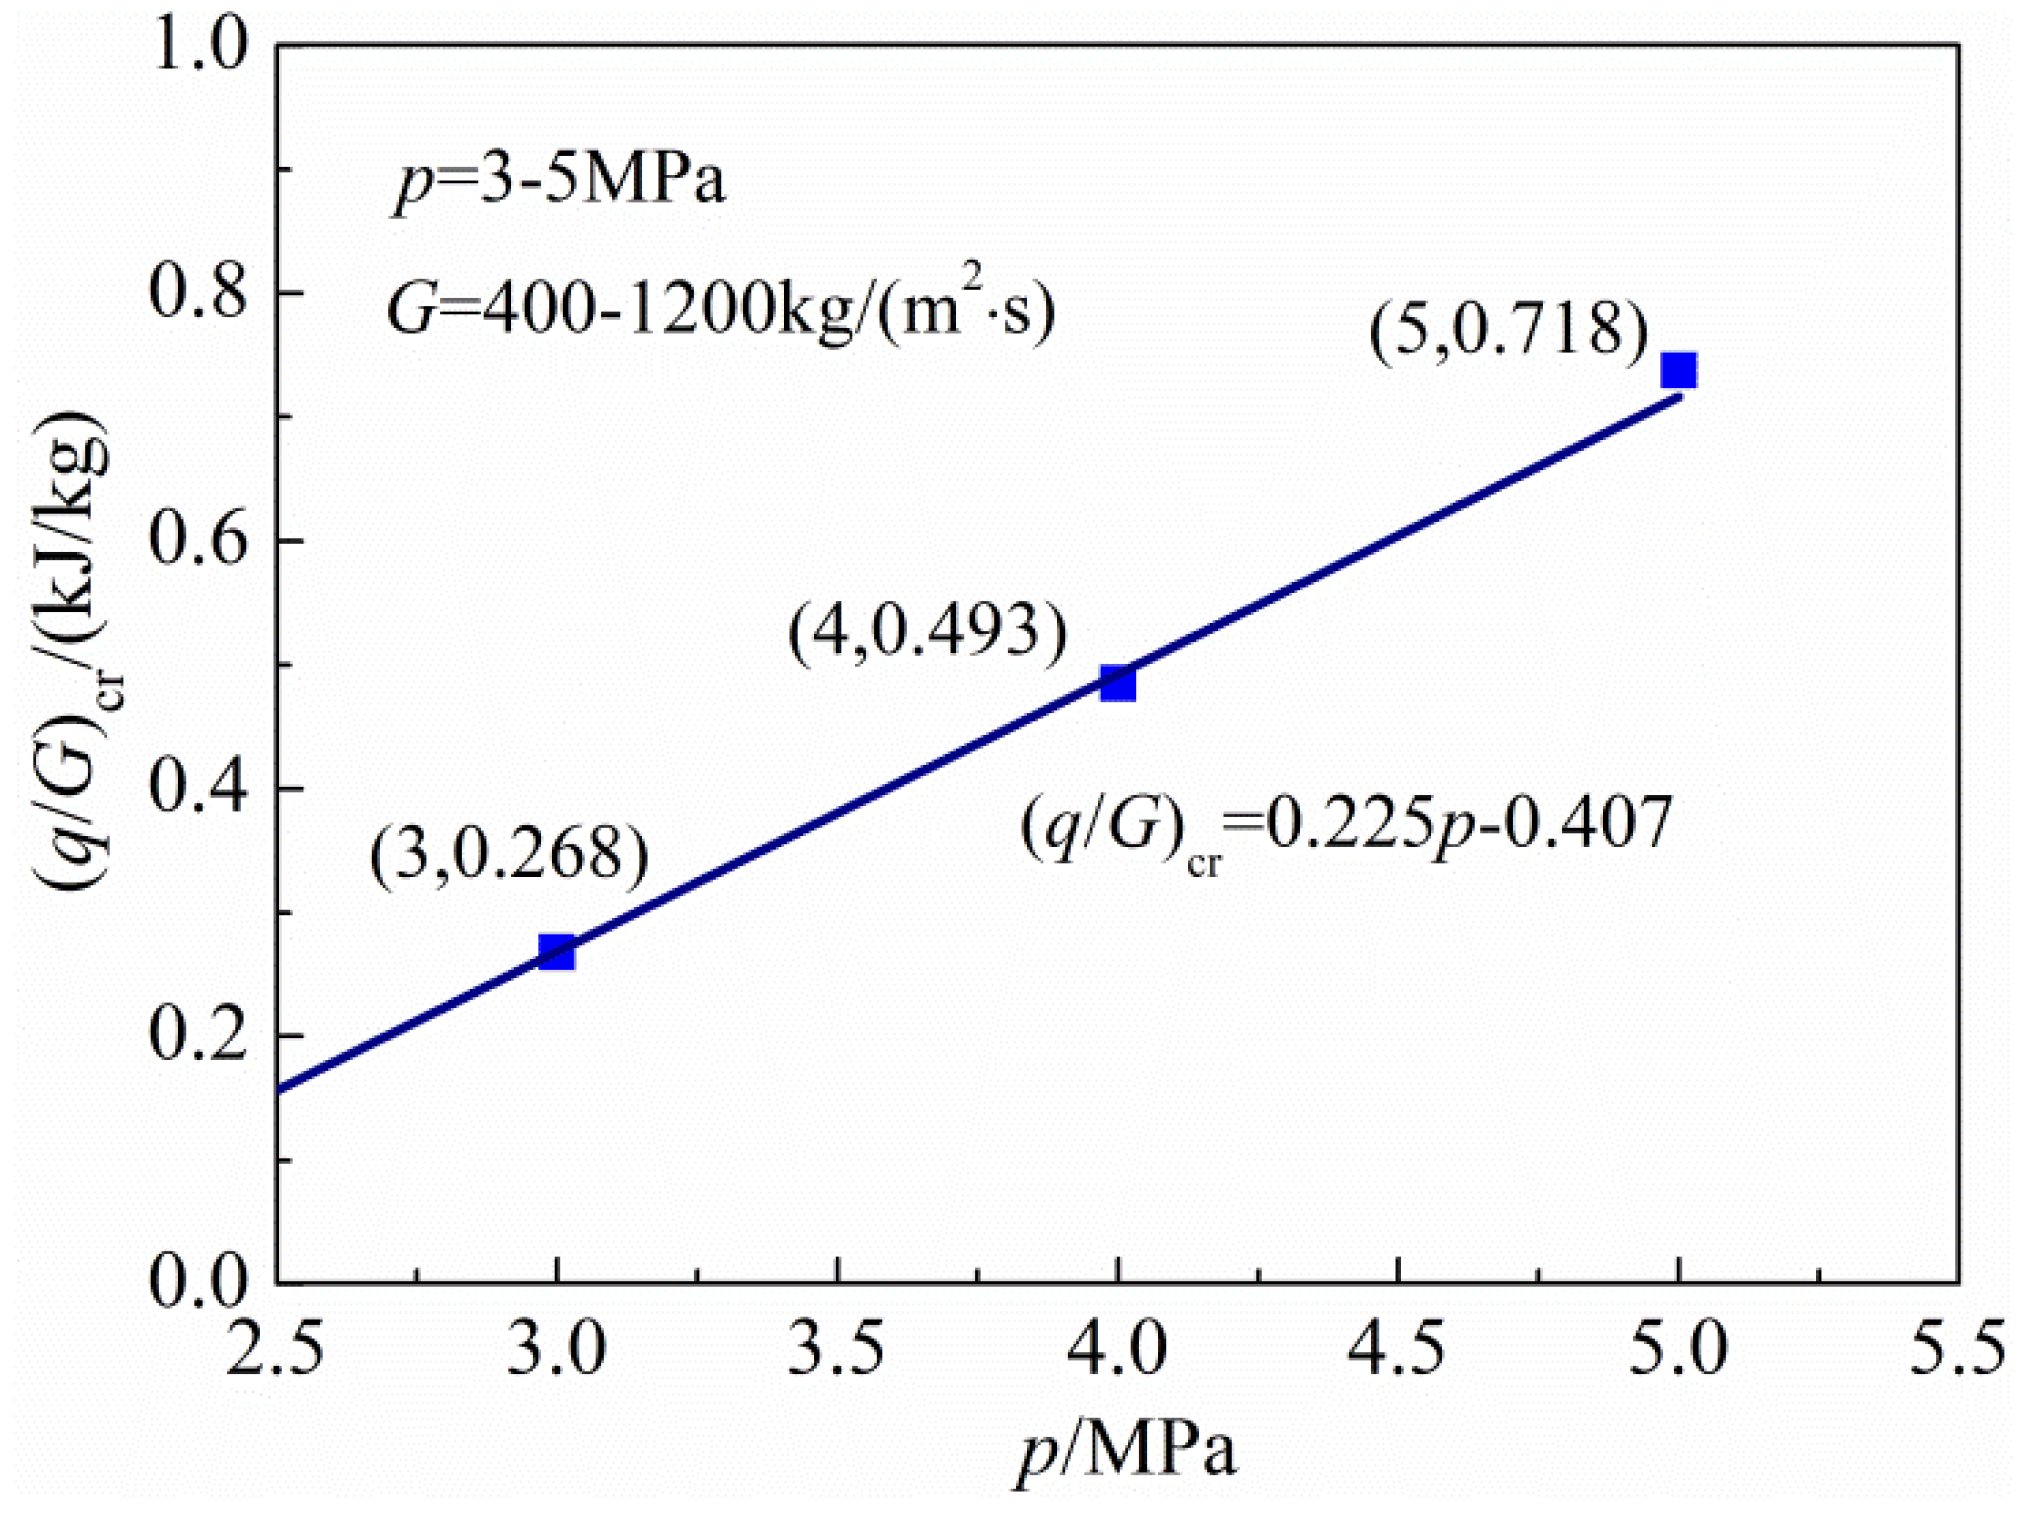
Figure 16 further presents variation of (
q/
G)
cr with the pressure. Note that (
q/
G)
cr is also a linear function of the pressure,
i.e., (
q/
G)
cr = 0.225
p − 0.407.
Figure 15.
Comparisons of the critical heat flux from the present numerical calculations and the empirical expressions.
Figure 15.
Comparisons of the critical heat flux from the present numerical calculations and the empirical expressions.
Figure 16.
Critical value as a function of the pressure.
Figure 16.
Critical value as a function of the pressure.
Based on the analysis above, a correction for critical heat flux of HTD of
n-decane at supercritical pressures is developed as follows:
The application range of this expression is that: 1 ≤ p/pc ≤ 2.369, 400 kg/(m2·s) ≤ G ≤ 2000 kg/(m2·s). Within this range, the relative error between the calculated values and numerical results is within 4.12%. For a given pressure and mass flux, the HTD will occur when the heat flux is higher than the critical heat flux obtained from this expression.






 ,
,


