Naturally-Forced Slug Flow Expander for Application in a Waste-Heat Recovery Cycle

Abstract
: This paper investigates a slug-flow expander (SFE) for conversion of high-pressure gas/vapor into kinetic energy of liquid slugs. The energy transfer from high-pressure to kinetic energy is quantified using thrust plate measurements. Non-dimensional thrust data is used to quantify performance by normalizing measured thrust by thrust for the same water flow rate at zero air flow rate. A total of 13 expander configurations are investigated and geometries with the shortest cavity length and the smallest exit diameter are found to result in the largest non-dimensional thrust increase. Results show that thrust augmentation increases with the initiation of slug flow in the SFE. The analysis performed on the normalized thrust readings suggested that as the water and air flow were increased to critical conditions, the liquid slugs produced by the SFE augmented the thrust measurements. The final performance evaluation was based on linear regression of the normalized thrust measurements where slug flow was generated for each SFE architecture. Greater magnitudes of the slope from the linear regression indicated the propensity of the SFE to augment thrust. This analysis confirmed that for the SFE configurations over the range of values investigated, the SFE increased thrust up to three times its original value at no air flow. Given the inherent multiphase nature of the slug-flow expander, application to systems involving expansion of wetting fluids (water as part of a waste-heat recovery system) or air with water droplet formation (as part of a compressed-air energy storage system) could be considered.1. Introduction
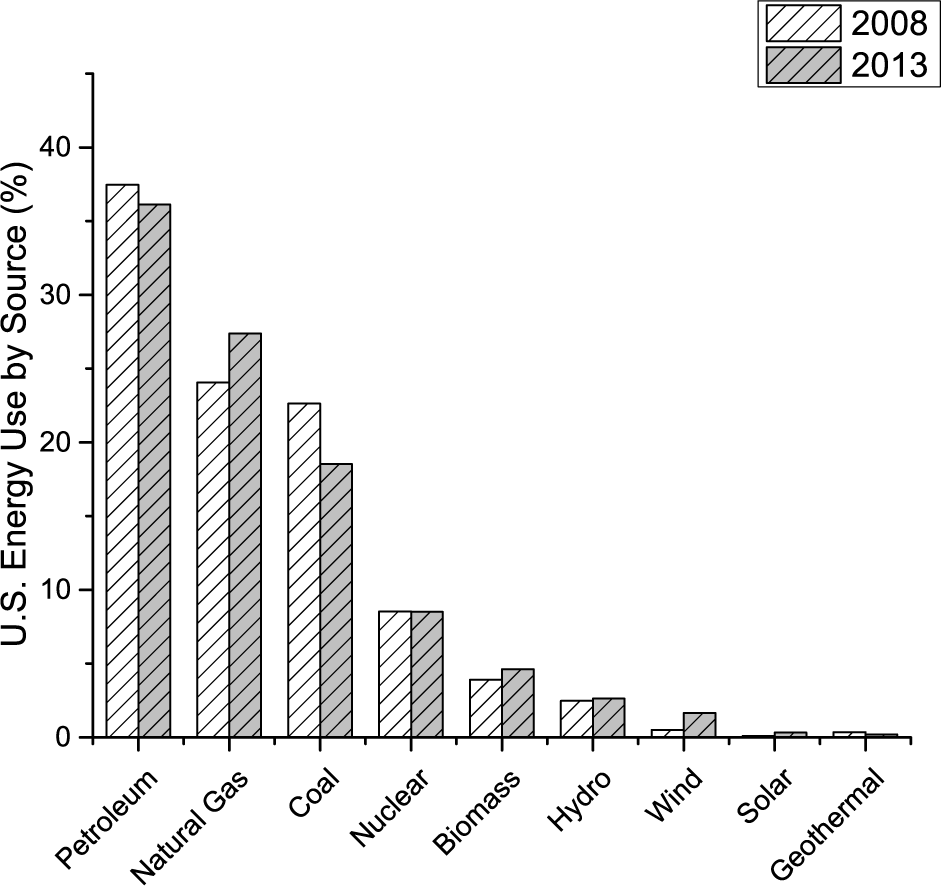
In recent years there has been increasing emphasis placed on energy use by society and the sources from which the energy that is used is derived. The motivations for this are multi-fold and include: growing concern for the environment and a desire to reduce quantities of Green House Gases (GHG) emitted during both energy production and consumption; economic with a desire to minimize energy consumption for industries that operate in regions with high energy prices so as to remain competitive; or even political as nations or regions look to become independent of other nations by altering the nature of their energy reliance. Examining U.S. energy flow diagrams produced by Lawrence Livermore National Laboratory using data from the U.S. Energy Information Administration [1] between 2008 and 2013, rit is possible to observe how U.S. energy use has changed over a relatively short period of time.
As shown in Figure 1, increased fuel economy within the transportation sector, the conversion of commercial transport fleets to Compressed Natural Gas, and the greater use of Ethanol has resulted in a slight reduction in the consumption of Petroleum (37.5% to 36.1%). The conversion of coal-burning power plants to Natural-Gas-fueled combined-cycle power plants has increased consumption of Natural Gas and reduced the use of Coal (22.6% to 18.5%), the traditional source for electricity production in power plants. Non-fossil-fuel based sources including Biomass, Wind and Solar have all seen modest gains, although increased adoption of these sources is still slow due to the intermittent nature of Wind and Solar and the need for practical energy storage technology [2–4].
Over the five year period from 2008 to 2013 total U.S. energy consumption has actually decreased from 99.2 Quads to 97.4 Quads. Although this reduction is noteworthy, significant improvements remain to be realized by further harnessing energy rejected in the form of waste heat [5,6]. Considering the U.S. in 2013, for example, of the 97.4 Quads consumed a total of 59.0 Quads are rejected to the surrounding environment in the form of waste heat. A recent German report on energy efficiency found that industrial energy demand in that country could be reduced by 12% if waste heat sources over 140 °C were to be recovered [7]. The report continues to say that while adoption of easy-to-implement technology, such as high-efficiency lighting, has been quick, the adoption of waste-heat recovery systems by industry has been relatively slow.
The research reported here is a novel form of expander technology that could be used as part of either a waste-heat recovery system or a compressed-air energy storage system. The nature of the technology (relatively simple, low cost) makes it more appropriate for small-scale distributed energy systems (<5 kW). Expansion devices in this low power output range commonly involve positive-displacement expanders operating at low rotational speed, whereas high power output applications commonly feature turbine expanders of either single stage or multistage design that operate at high rotational speed [8].
Of the positive-displacement expanders, common designs include rotary-vane expanders with reported isentropic efficiencies that range from 25% to 35% [9], helical screw expanders with reported isentropic efficiencies that range from 30% to 85% [9,10], and scroll expanders with reported isentropic efficiencies that range from 30% to 70% [11]. The research performed in this investigation pertains to quantitatively understanding the performance of a novel form of expander. Given that the investigation focuses on understanding device operation and behaviour, no attempt is made to quantify the isentropic efficiency of the expander. The expander performance is investigated under what are referred to as natural or unforced conditions.
2. Background
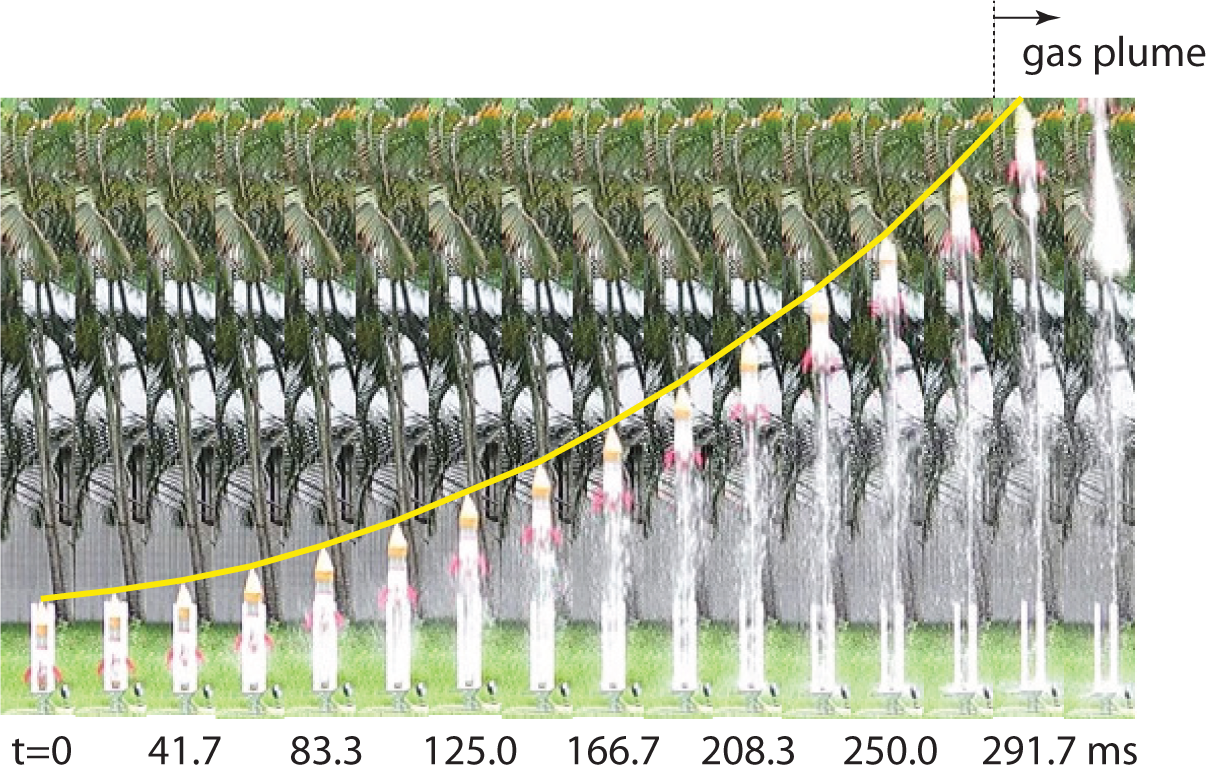
In certain respects, the expander technology that is investigated in this paper has similarities to the compressed-air water rockets that are often played with by children. The water rocket involves a container (a plastic soda bottle, for example) that is partially filled with water. When oriented vertically and pressurized using an air pump, a compressed air cap forms at the top of the container and water at the bottom. When a valve at the base of the pressurized container is opened, the compressed gas expands, forcing the water to leave the pressurized container at high velocity. The work associated with the gas expansion imparts kinetic energy to the water which in turn imparts a reaction force on the container. This then enables the water rocket to move upward in the vertical direction. This process is shown in a series of high-speed video frames in Figure 2.
Of note in Figure 2 is the second-to-last frame where the emergence of a gas plume is observed at the bottom of the water rocket. The plume becomes more pronounced in the final image when the rocket is no longer visible in the frame. The emergence of the plume corresponds to the moment when all of the water has been expended from the rocket. Without a water plug to retain the compressed gas, rapid expansion proceeds and entrains residual liquid from the walls of the container, producing the fine mist visible in the last two frames. With this the pressure in the container quickly drops and the compressed gas is no longer able to perform work.
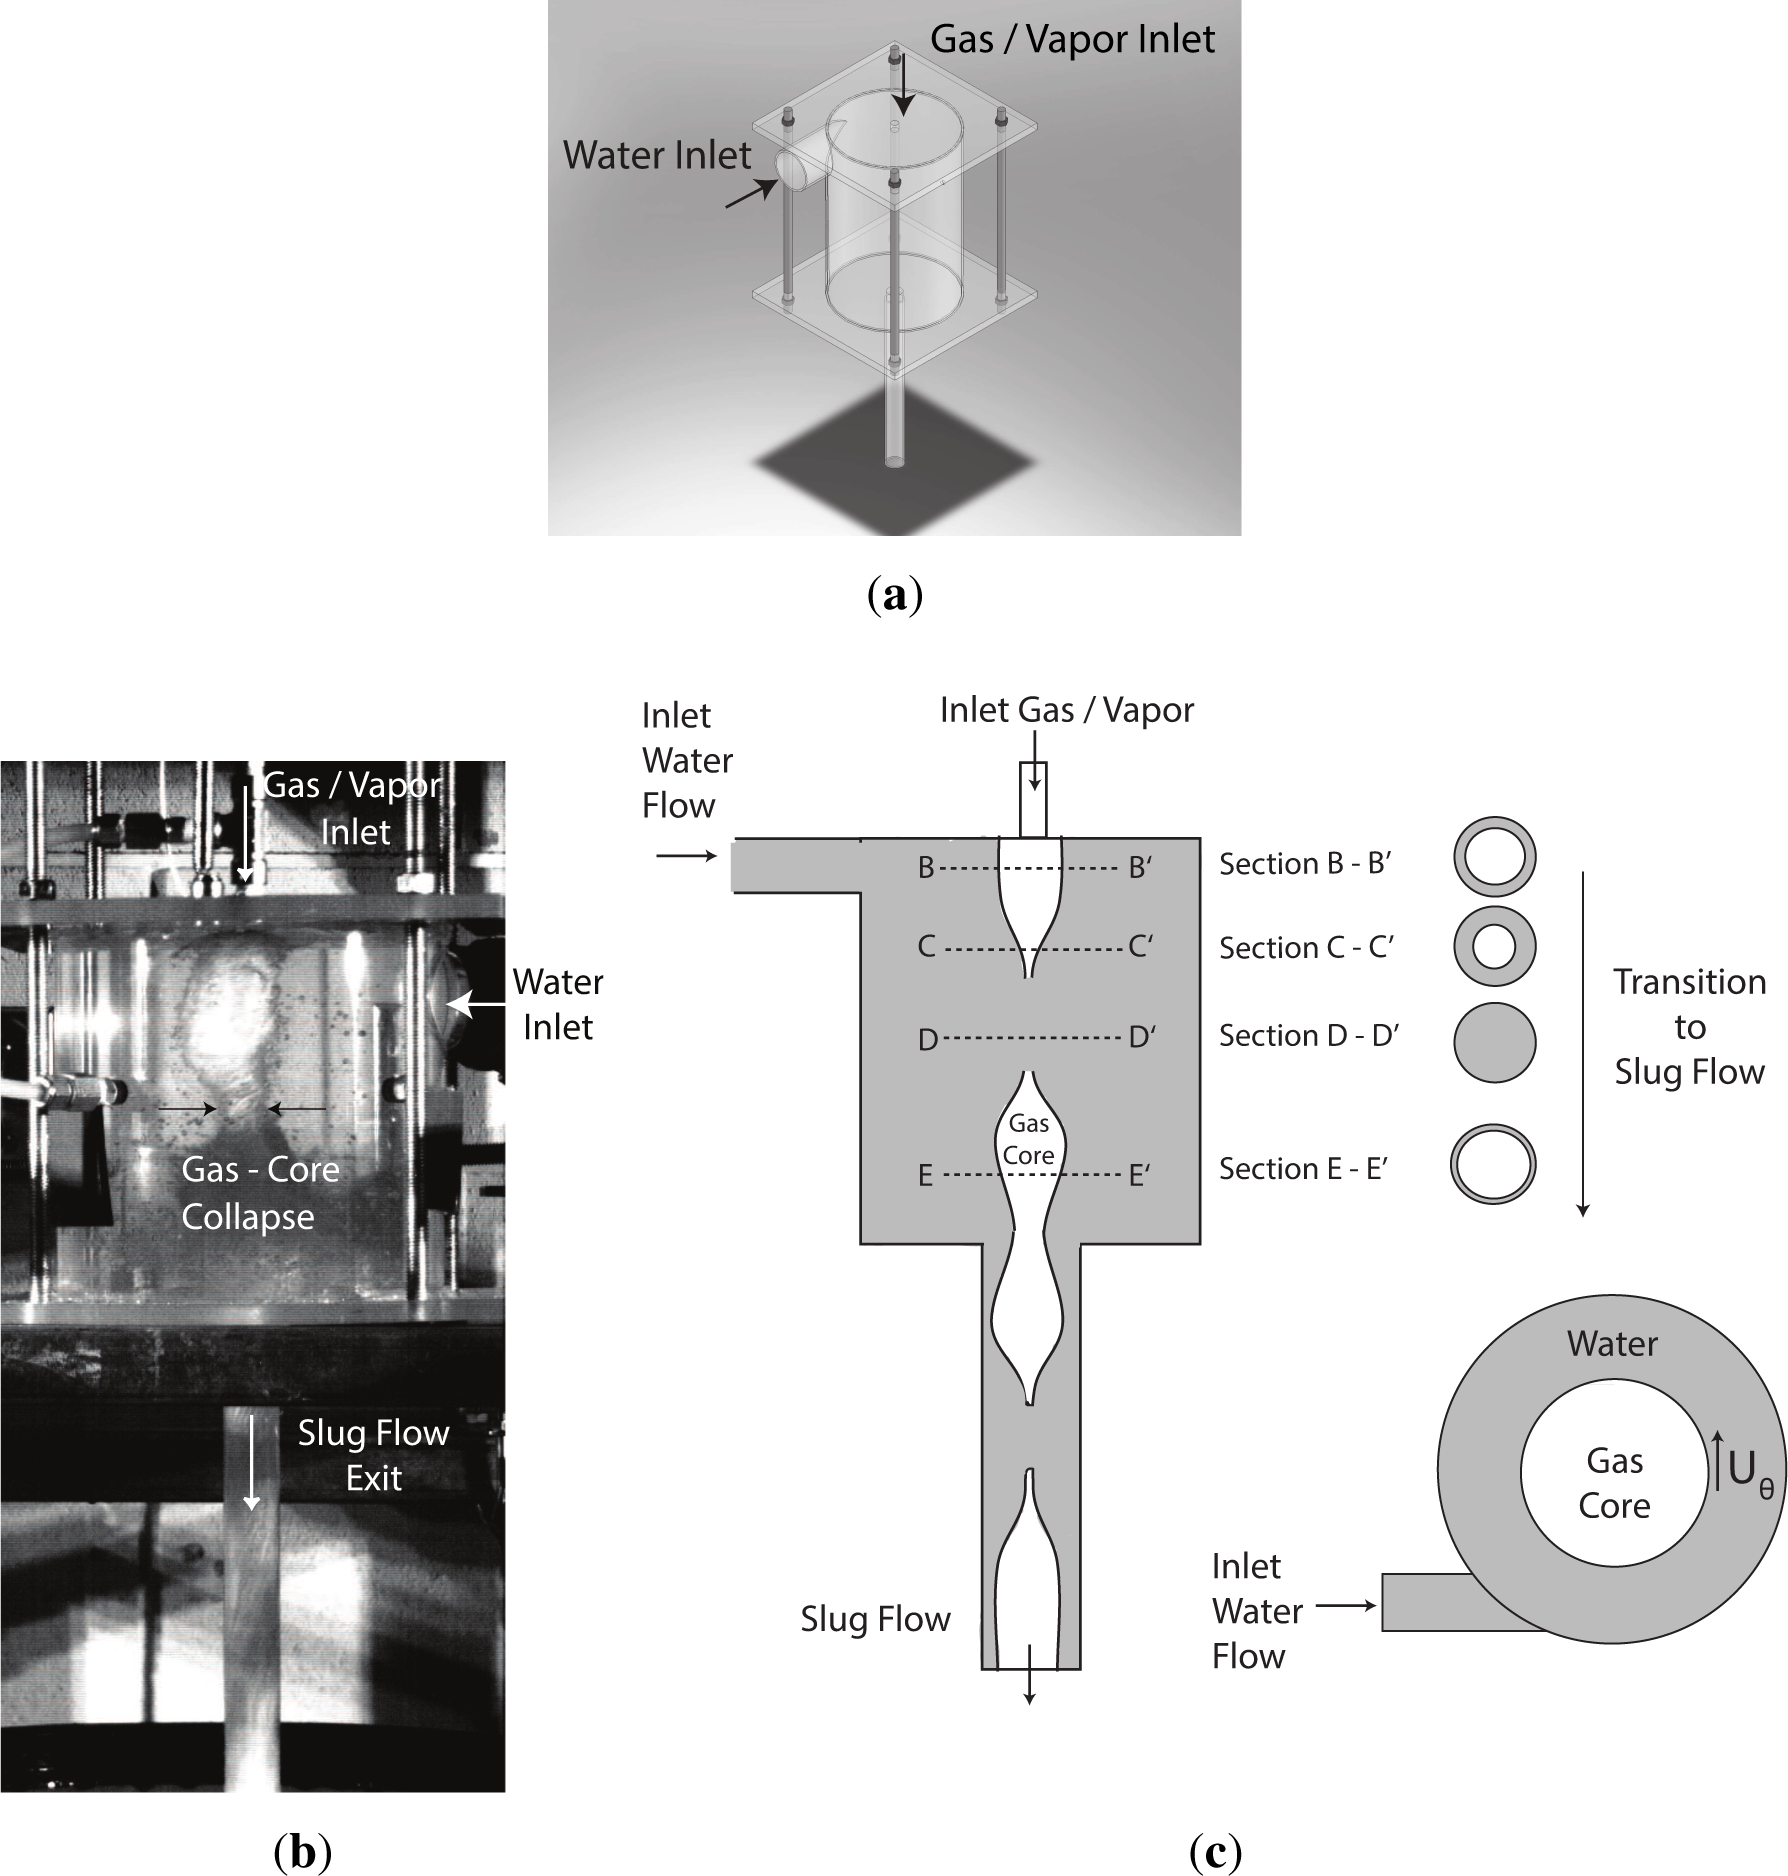
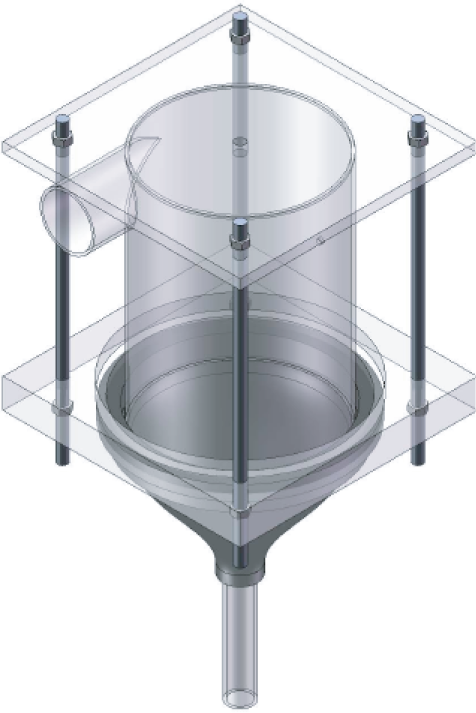
The water rocket features a process where a compressed gas expands, and this expansion work is then converted into the kinetic energy of the water. This paper investigates an expander system that operates in a manner similar to the water rocket, with the exception that the expander investigated is able to operate in a continuous manner. The architecture of the expander investigated, referred to as the Slug Flow Expander (SFE), is shown in Figure 3a and involves water and compressed gas/vapor.
The original motive for this investigation came from an earlier multiphase flow metering investigation by Veer [12] using a geometry similar to that shown in Figure 3a, with the exception that in the earlier investigation the air-water multiphase flow entered through the Water Inlet and the Gas/Vapor Inlet did not exist. In this earlier investigation it was noted that under certain flow conditions the entire experimental apparatus would shake violently. It was speculated that the cause of this vibration was due to slug formation. Further testing confirmed this speculation and also indicated that the propensity for slug flow to develop was increased by injecting air vertically into the SFE, in a separate inlet stream, along the cavity’s central axis as shown in Figure 3b,c. The ability to form repeatable liquid slugs represented an extension to the water rocket concept, only now with the ability to operate in a continuous manner given that both water and gas/vapor are constantly replenished.
The SFE fosters a novel mechanism to initiate and amplify slug flow. This expansion mechanism resembles a continuous water flow piston, illustrated in Figure 3b,c. First, liquid is tangentially introduced into a cylindrical cavity, causing a swirl flow to develop [13]. Injection of gas/vapor along the cavity’s central axis then results in a radially-stratified multiphase flow, with gas/vapor forming the central core surrounded by a liquid coaxial shell. When the liquid and gas/vapor flow is increased to a critical value, the diameter of the gas/vapor core decreases, resulting in the amplification of liquid-gas instability waves that eventually grow to subtend the entire cavity. In effect, the size of the gas/vapor core decreases and eventually collapses. This phenomena was referred to as “wave occlusion” [14], and is shown in Figure 3b,c. Liquid contact and collapse of the central gas/vapor core initiates slug flow in the vertical cavity. This involves high-pressure gas/vapor expansion, and in the process liquid slug acceleration in the downward direction, resulting in a conversion of gas/vapor pressure into liquid slug kinetic energy.
Coupling the Slug Flow Expander with an impulse turbine enables the conversion of the kinetic energy of the liquid slugs into rotary motion and torque (i.e., work). The multiphase nature of this process decreases sensitivity to liquid droplet formation in the expanding gas/vapor stream. This enables the expander to be used as part of a waste-heat recovery system with water as the working fluid where expansion can often enter the two-phase region, or as part of a compressed-air energy storage system where water droplets can form if the expanding air is not preheated [15].
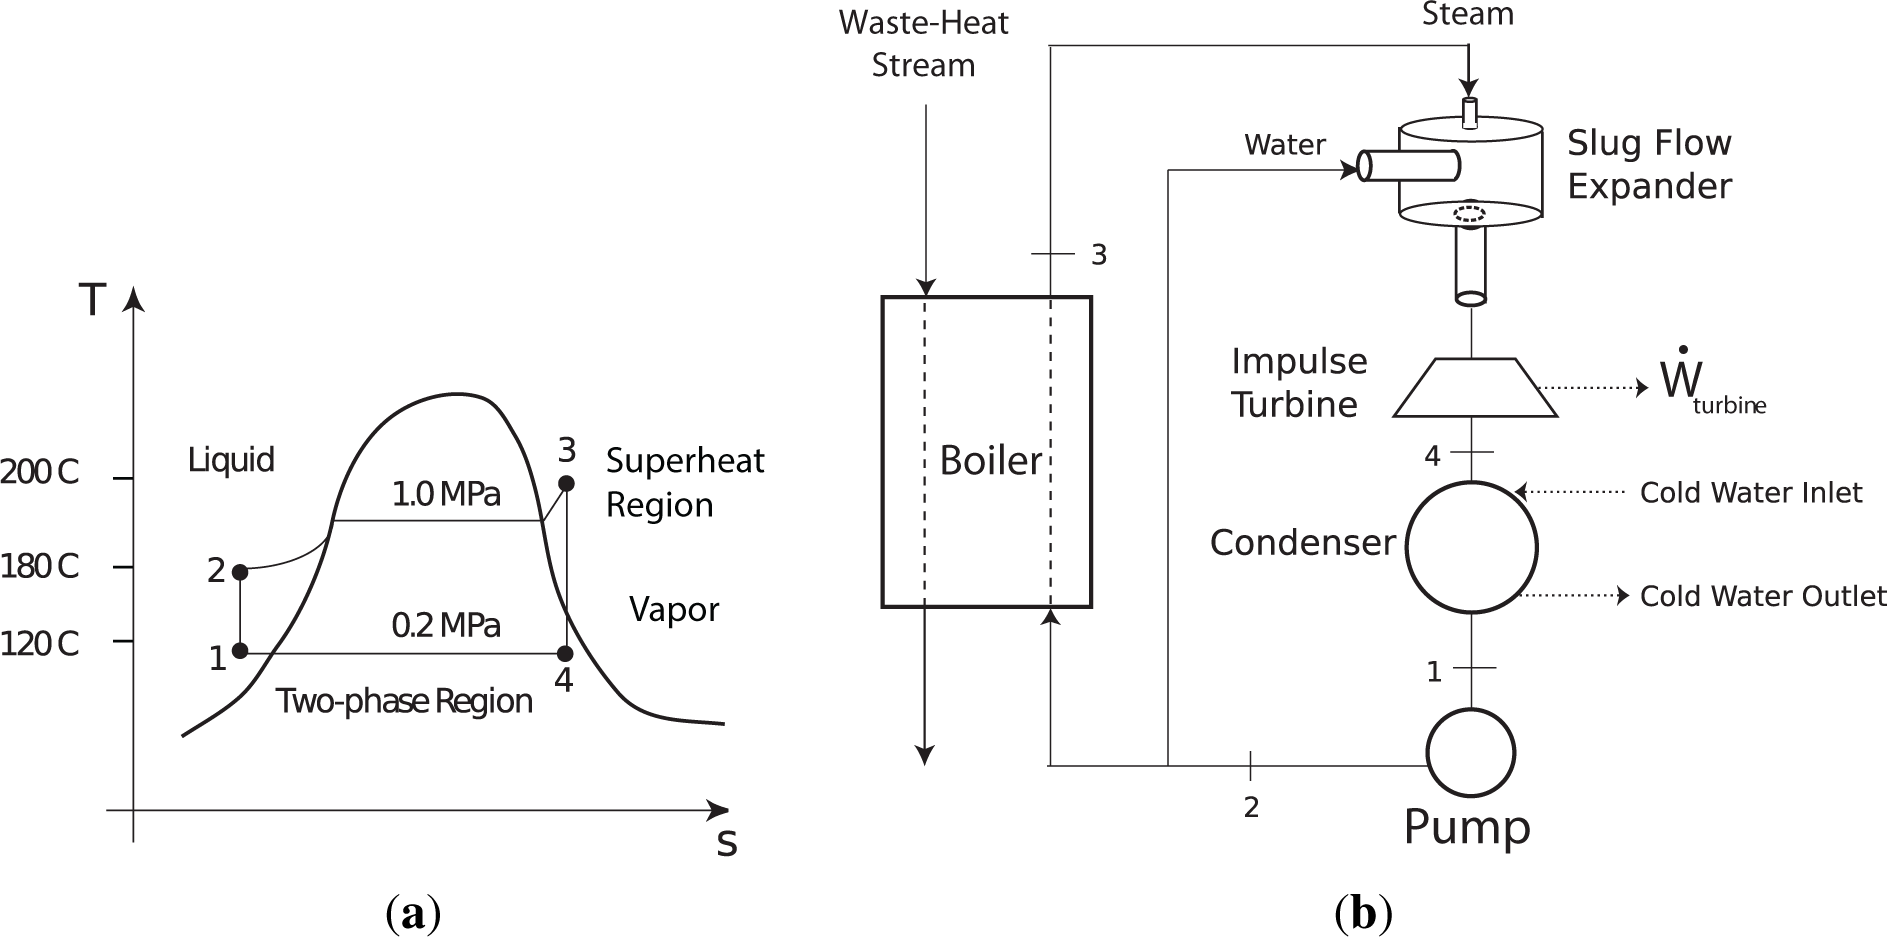
Considering the waste-heat recovery application in further detail, conventional Rankine vapor power cycles using water as the working fluid are not effective while operating from low-temperature heat sources [16]. The reason for this is that operation from a low temperature heat source often results in expansion into the two-phase flow region. The efficiency of a cycle’s reaction turbine degrades while operating in the two-phase region due to liquid droplet impingement on turbine blades. This could be solved by replacing the reaction turbine with the Slug Flow Expander coupled with an impulse turbine, as illustrated in Figure 4. In the proposed process, liquid slugs are accelerated by the expansion of high pressure vapor. The high-momentum liquid slugs are then directed into an impulse turbine, producing work.
This paper will investigate the thrust generated by the Slug Flow Expander, and indirectly its ability to convert high-pressure gas/vapor into work. The experiments were performed using water and compressed air. The use of compressed air extends directly to compressed-air energy storage systems, and for waste-heat recovery applications the compressed air simulates the vapor phase of steam. Compressed air at 4 atmospheres (59 psig) and room temperature has a specific volume of 0.2 m3/kg, closely matching the specific volume of superheated steam at State 3 in Figure 4 (200 °C, 1 MPa, 0.206 m3/kg). While the specific volume of air at Calgary standard (20 °C, 89 kPa, 0.945 m3/kg) closely approximates the specific volume of saturated vapor at State 4 in Figure 4 (120 °C, 0.2 MPa, 0.886 m3/kg). The use of compressed air for waste-heat recovery investigations also helped simplify the experimental apparatus.
3. Experimental Section
This section describes the Slug Flow Expander and the apparatus used to study the thrust performance of the Slug Flow Expander.
3.1. Slug Flow Expander Technical Specifications
Figure 3a depicts the design of the Slug Flow Expander (SFE). It was similar to models used in previous investigations studying the breakdown of an in-line pipe vortex [12,17–19] and that of other researchers [13,20,21]. The SFE included a tangential inlet tube, cylindrical cavity, end caps, and a downstream tube. The inlet tube was constructed of cast acrylic tubing, with an inner diameter of 57 mm. This section introduced water tangentially into the cylindrical cavity, inducing a swirl component. The cylindrical cavity was constructed of cast acrylic tubing. The inner diameter of the cylindrical cavity was kept constant at 203 mm (8 inches). Transparent 13 mm thick plexiglass sheets were used for both the top and bottom end caps of the cylindrical cavity. The clear acrylic end caps enabled visual inspection of the two-phase flow entering the cylindrical cavity. The top end cap had one inch NPT (National Pipe Thread Taper) tapped at the center to allow air to flow into the cylindrical cavity. The downstream tube was constructed out of cast acrylic tube, 305 mm in length. The backpressure of the SFE was controlled by constricting the inner diameter of the downstream tube.
In the course of this investigation, 13 SFE configurations were tested. The intent of varying the SFE geometry was to investigate the influence of geometry on slug flow formation and the ability to generate thrust. Three SFE geometry parameters were varied and included: (1) the length of the large cylindrical cavity (SFE LxDy DSTz for an x inch long cavity where x was 4 inches, 8 inches, or 12 inches); (2) the inner diameter of the downstream tube (SFE LxDy DSTz for a z inch diameter downstream tube where z was 1 inch, 1.5 inches, or 2 inches); and (3) the backpressure of the SFE controlled by constricting the exit diameter of the downstream acrylic tube (SFE LxDy DSTzbp15 where bp was binary, either on or off). This resulted in a test matrix of twelve SFE configurations.
A 13th SFE was developed with a contoured exit geometry cross-section defined by Equation (1). The inner diameter of the contour inlet section was 203.2 mm, and the inner diameter of the contour exit section was 25.4 mm, resulting in a contraction ratio of 8:1. By setting the total nozzle length (L*) to 6 inches, the following contour profile was obtained:
Figure 5 illustrates the final assembly of the Contoured SFE. The cylindrical cavity length was 12 inches (305 mm), the cylindrical cavity diameter was 8 inches (203 mm), and the inner diameter of the downstream tube was 1 inch (25.4 mm). The contour was custom-built with P400-ABS material, and constructed using a Fused Deposition Modeling (FDM)-Titan™ Rapid Protoyping machine from Stratasys Inc. (Dual headquarters in Eden Prairie, USA and Rehovot, Israel). A three-dimensional CAD model of the contour prototype was programmed into the FDM-Titan and grown layer-by-layer over a period of approximately 36 hours.
Flow Facility Description
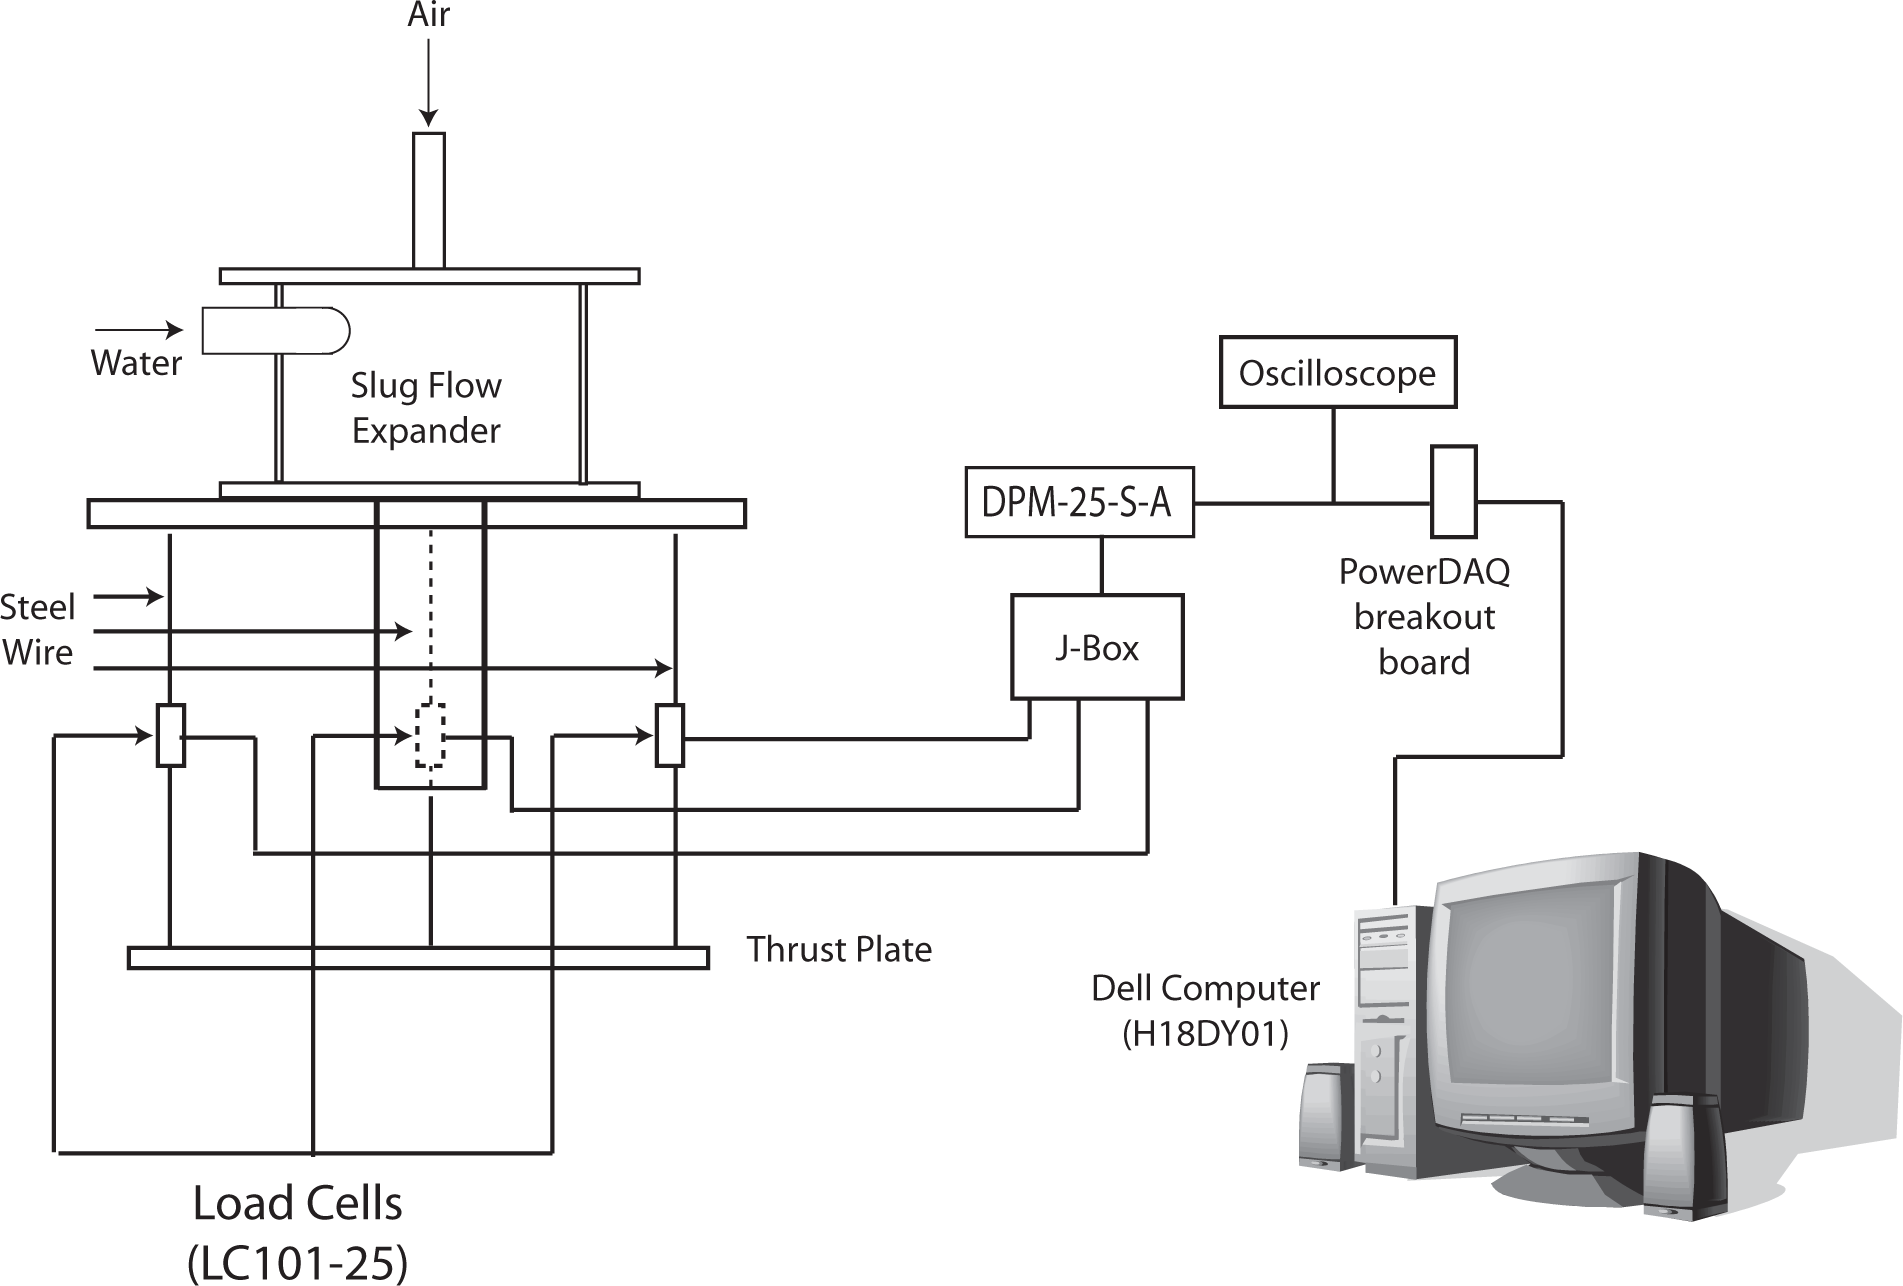
A two-phase flow facility designed and built in previous studies [12,17–19] was modified for the experiments in the current investigation. The two-phase flow facility consisted of two main flow loops: a water flow loop and an air flow loop. Each loop was able to operate separately or concurrently. Figure 6 gives an illustration of the system used to monitor thrust produced by each SFE geometry.
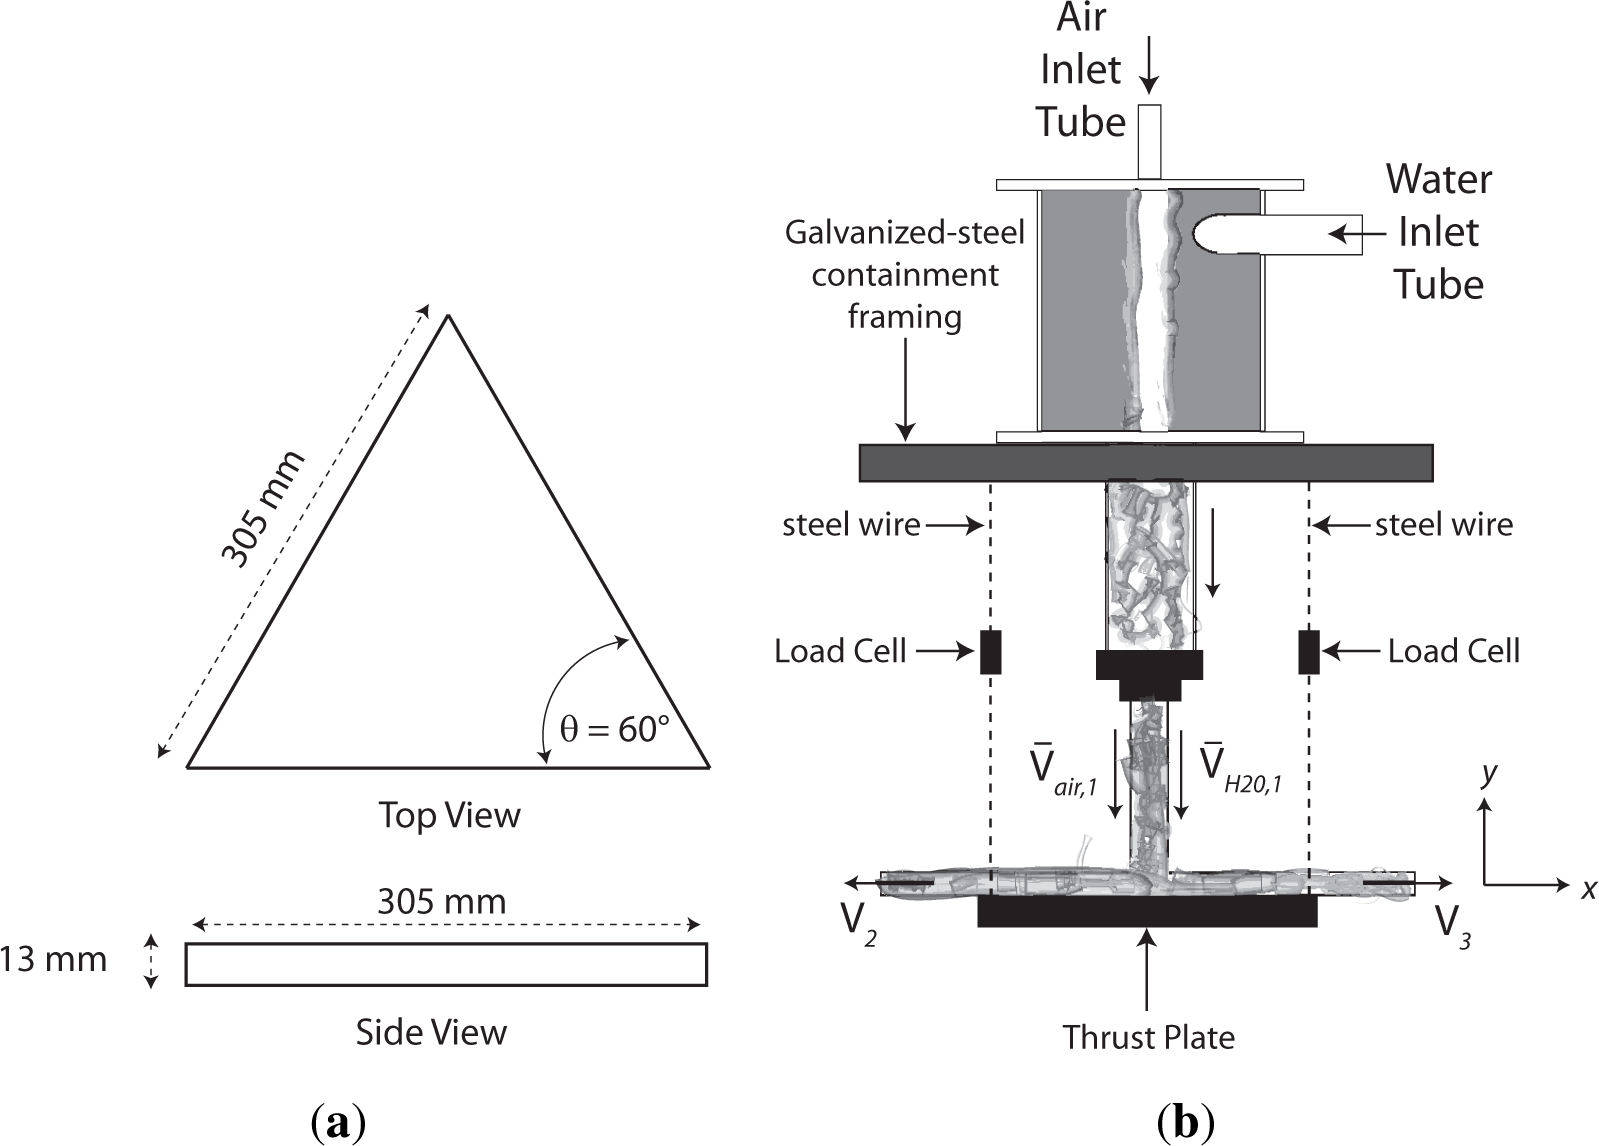
Thrust was measured by conducting experiments where the flow exiting the SFE impinged normal to a triangular aluminum plate, aptly named the “thrust-plate.” A schematic of the thrust-plate is displayed in Figure 7a. The triangular thrust-plate was kept stationary by connecting steel wire at the vertices with the galvanized-steel framing containing the SFE, as shown in Figure 7b. Load cells were also coupled with the steel wire, resulting in the thrust-plate being located 127 mm downstream from the SFE exit. The load cells measured the force, hence momentum, generated by different SFE configurations at varying flow conditions. For each component flow rate of air and water 60 s of thrust data (sampled at 1 kHz) was collected. The mean thrust for each data set was computed and signified the average thrust exerted on the thrust-plate for each component flow rate.
3.2. Thrust Plate Distance
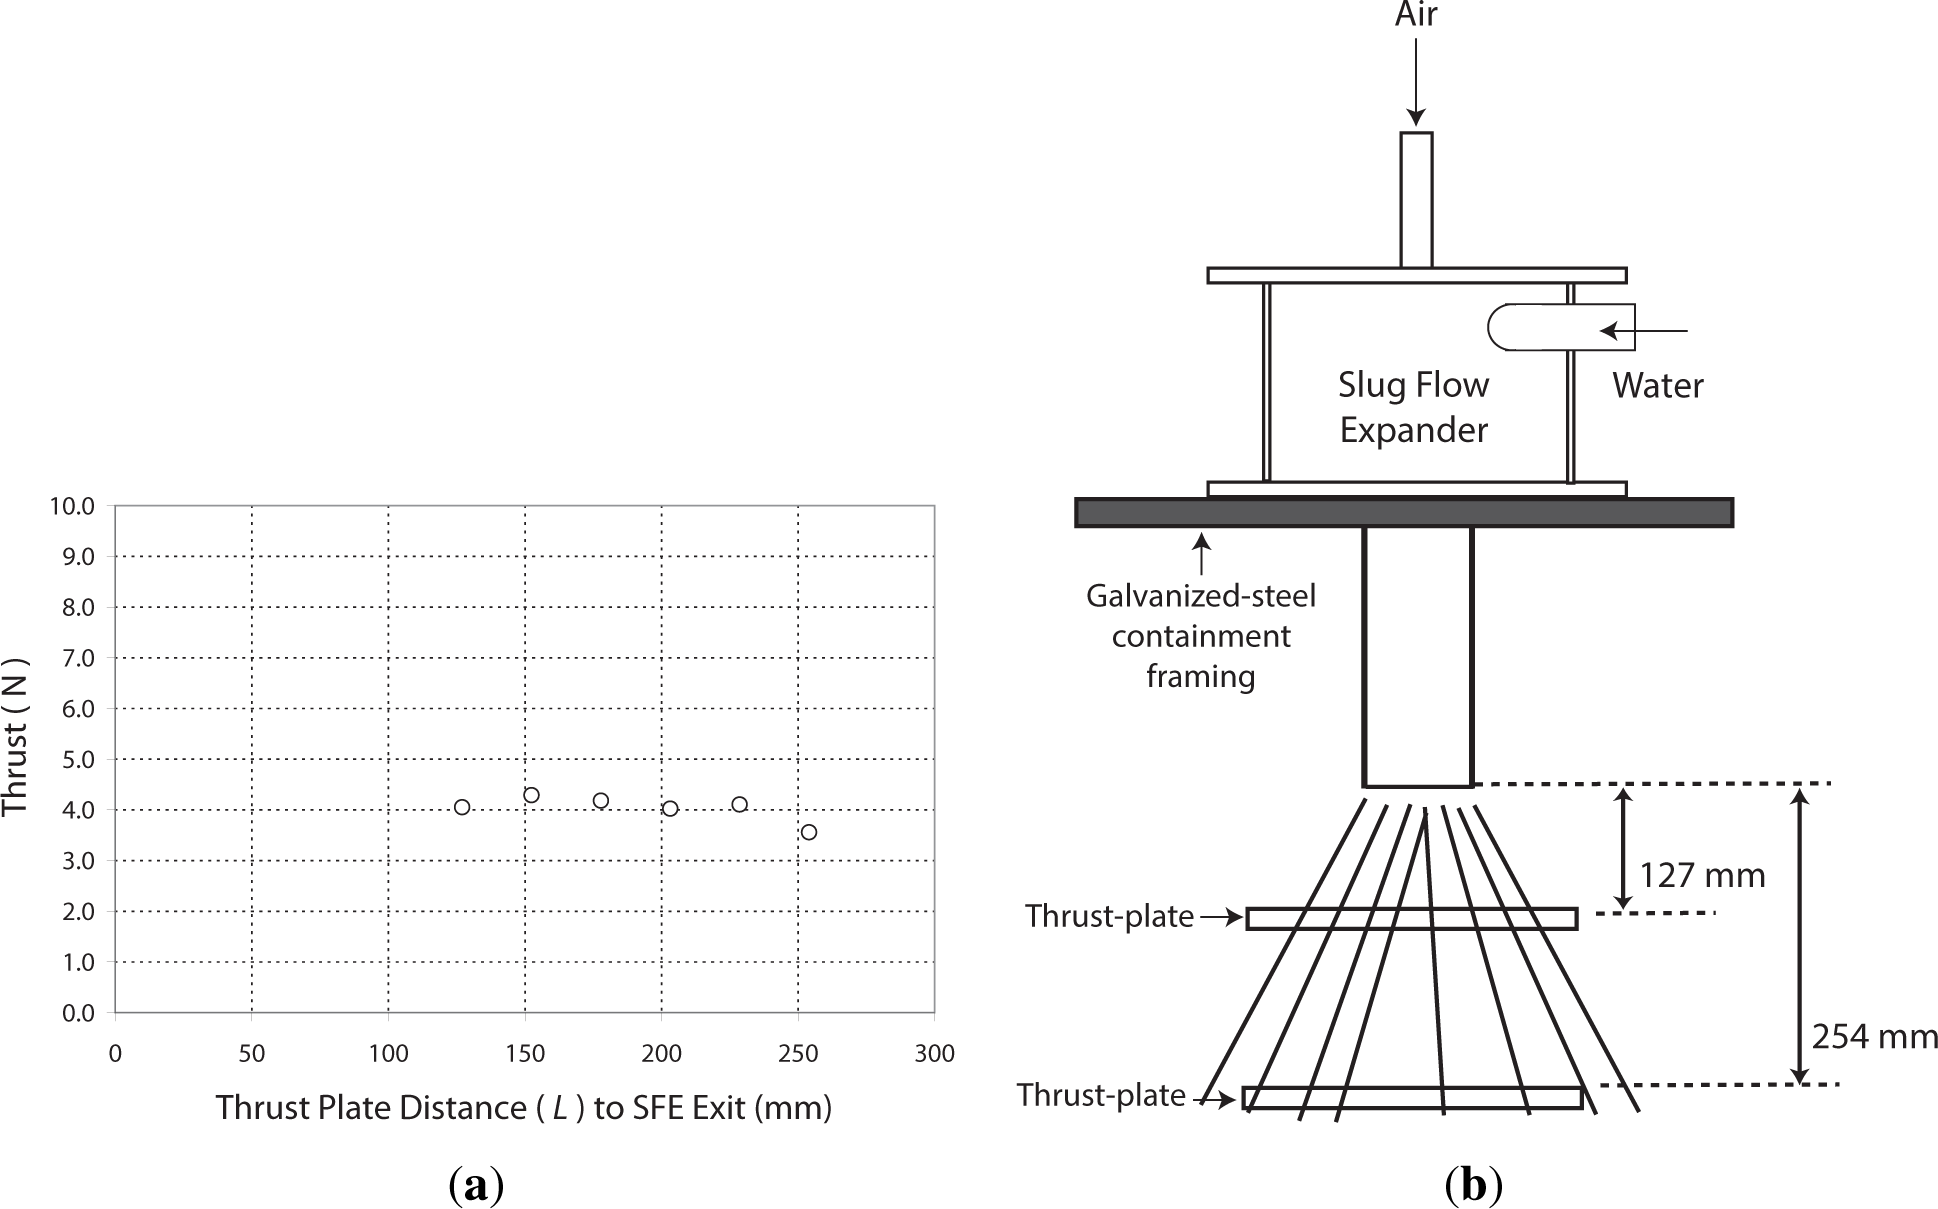
Preliminary tests of the thrust-plate measurement system were performed on a SFE geometry with a cylindrical cavity 203 mm in length, and a downstream tube diameter of 38 mm (SFE L8D8 DST1.5). The water inlet Reynolds number (c.f. Appendix 1 for details) was ReW = 2.2 × 10⁴, corresponding to 1.0 L/s of water injected into the SFE. Thrust measurements were performed for varying distances of the thrust-plate to the exit of the SFE downstream tube. The lengths were varied in increments of 25 mm from 127 mm to 254 mm, as shown in Figure 8a. The thrust measurements were found to be invariant to increased distances from 127 mm to 229 mm, where the mean thrust was approximately 4.0 N (forces will be non-dimensionalized later in the paper). However, when the thrust-plate was located at a distance of 254 mm, the thrust measurement were found to drop slightly to 3.5 N. This was because the thrust-plate was no longer able to capture all the water exiting the SFE, as shown in Figure 8b. The swirl induced by the SFE caused the water to “cone” outward upon exiting the downstream tube. With these results it was concluded to keep the thrust-plate a distance of 127 mm from the downstream tube exit for all experiments.
Thrust data was collected at various combinations of water and air flow rates for all 13 SFE geometries. These experiments were conducted by fixing the water flow rate and increasing the air flow rate. Due to facility limitations and safety considerations, it was not possible to conduct experiments over the entire operating range of both the water pump and air compressor.
4. Results
This section discusses thrust measurements obtained for each of the 13 SFE configurations. The first subsection describes how the thrust data was scaled. The second subsection reviews the data for all 13 SFE configurations, and general trends are extracted. The third through sixth subsections discuss how thrust data varies with expander geometry.
4.1. Scaling of Results
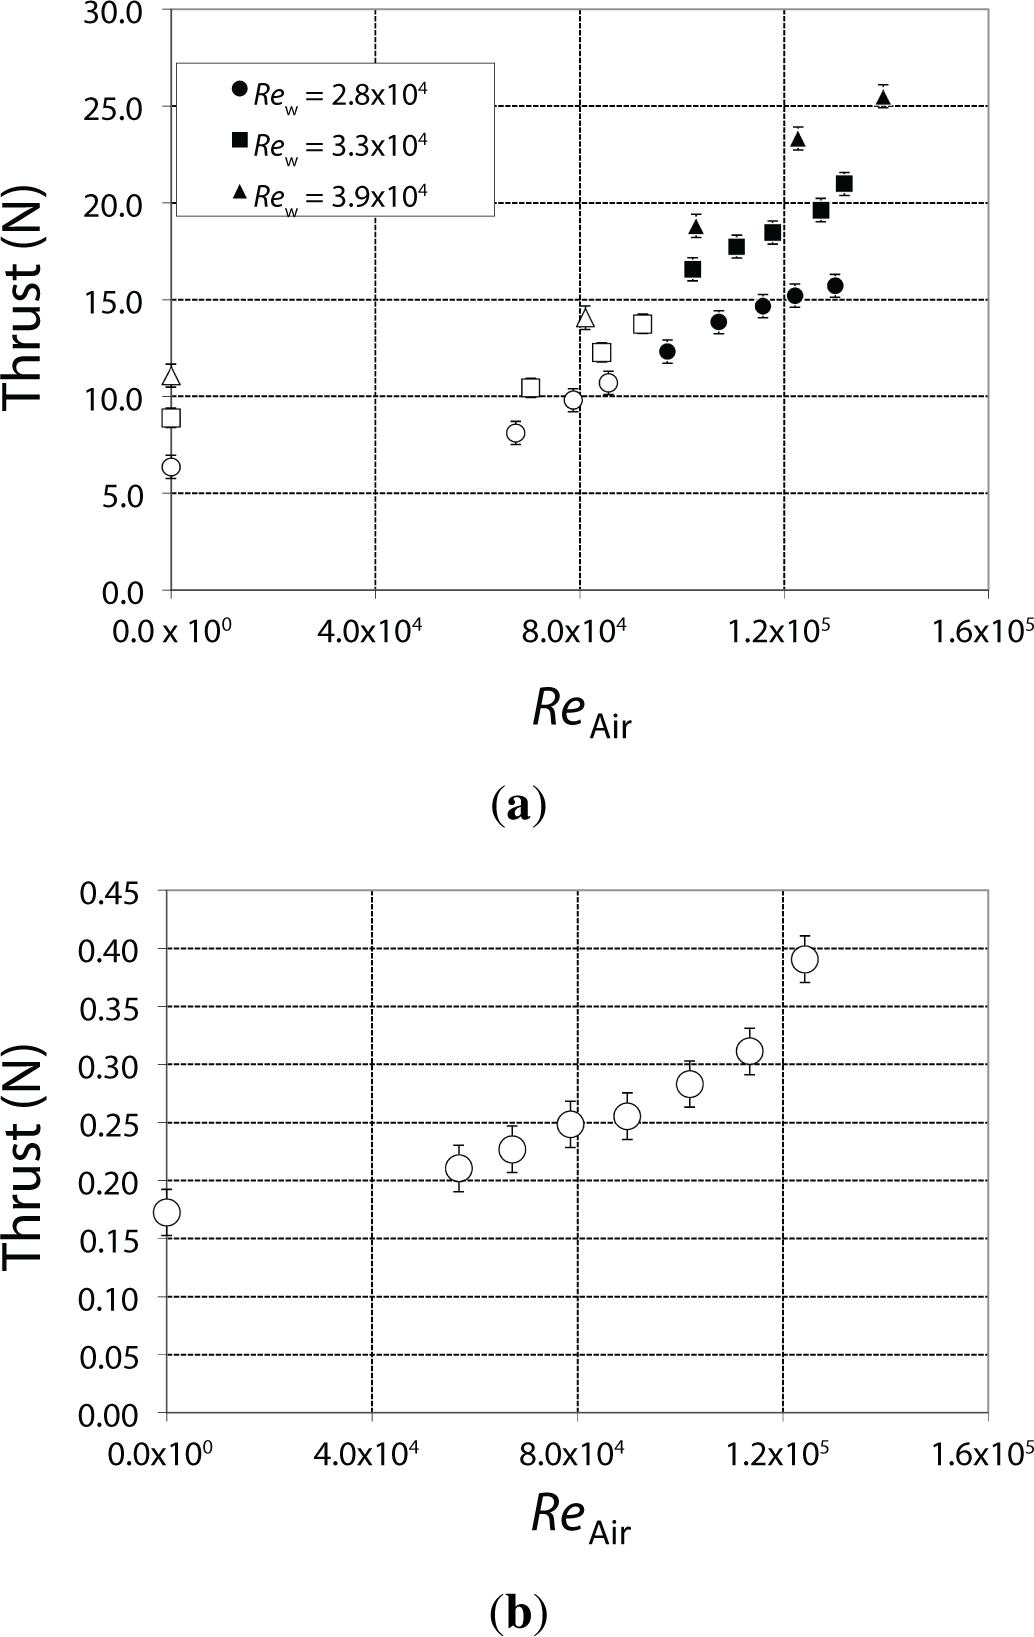
Only the thrust data for the Contoured SFE architecture is presented in this subsection. Figure 9a displays the mean thrust measurements from the 60 s of data collected for different component flow rates injected into the Contoured SFE geometry. Mean Thrust data is plotted as a function of the air inlet Reynolds number, ReA (c.f. Appendix 1 for details). The volumetric air flow rate was converted to a base condition of 20 °C and 101.325 kPa using the ideal gas law. The data in Figure 9a is also grouped according to the water inlet Reynolds number, ReW. At an air flow rate of 0 L/s (ReA = 0), the mean thrust was shown to increase with respect to increased water flow rate. This observation was explained by the fact that more water injected into the SFE resulted in more water exiting the SFE, which caused an increase in the linear momentum. Thus, the force exerted on the thrust-plate increased. When water and air were injected into the Contoured SFE, the mean thrust significantly increased with respect to increased air flow rate. Higher water flow rates (increased ReW) produced higher mean thrust readings, and the highest mean thrust reading, 25.5 N, was noted at a water flow rate of 1.75 L/s (ReW = 3.9×10⁴) and an air flow rate of 8 L/s (ReA = 1.4×10⁵). The change in flow regime to slug flow was found to cause an increase in the linear momentum of the fluid exiting the SFE. Solid symbols in Figure 9a indicate that slug flow was observed at those component flow rates, and the highest mean thrust measurements were noted for the flow conditions that produced slug flow.
Figure 9b illustrates mean thrust measurements experienced solely by injecting air into the Contoured SFE. The thrust exerted by the air on the plate was quite minimal, but shown to increase as a function of air flow rate from 0.21 N at an air flow rate of 1 L/s (ReA ≈ 6.0×10⁴) to 0.40 N at 8 L/s (ReA ≈ 1.3×10⁵). These low mean thrust measurements of the air component confirmed two details: (1) the force exerted solely by the liquid component was much greater than that solely by the air component; and (2) the injection of air and water into the SFE caused a significant increase in the measured thrust due to slug flow.
The mean thrust measurements in Figure 9a are absolute readings. In order to study the effect of changing SFE geometry on thrust generated, data was normalized with respect to the thrust measurement collected for that water flow rate, but with no air flow (ReA = 0):
It is informative to plot the normalized thrust as a function of the air volumetric flux quality. Brennen [22] defines volumetric flux quality as the ratio of the volumetric flux of air to the total (air-water) volumetric flux:
The air volumetric flux and total volumetric flux are computed based on the respective measured volumetric flow rates and respective inlet areas for air and water, and βAir becomes:
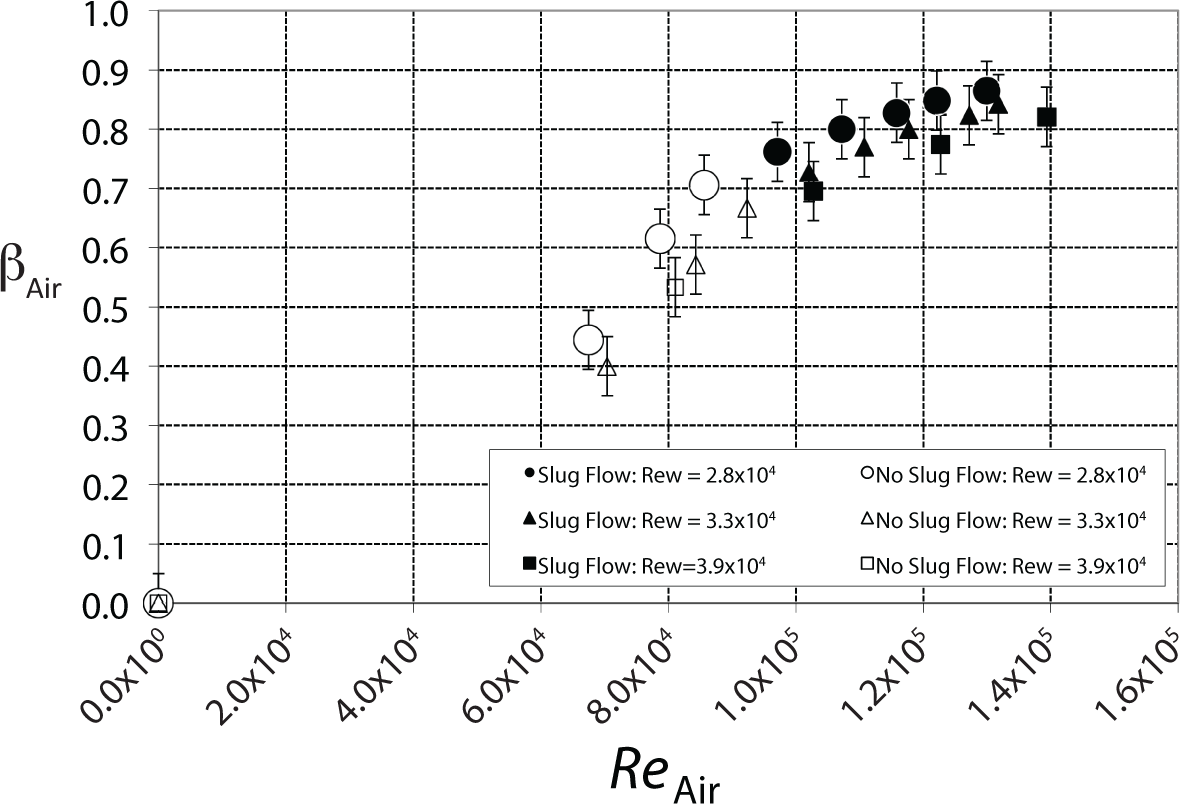
Figure 10 illustrates βAir as a function of air inlet Reynolds number, ReA, for three water flow rates injected into the Contoured SFE. Figure 10 shows that when βAir = 0, this corresponds to the injection of only water into the SFE (ReA = 0). When βAir > 0, this corresponds to both water and air being injected into the SFE. Indeed, βAir is shown to increase for increased ReA, hence increased air flow injected into the SFE. Normalized thrust was plotted as a function of βAir given that increased air flow is what causes a single-phase water vortex to transition to slug flow.
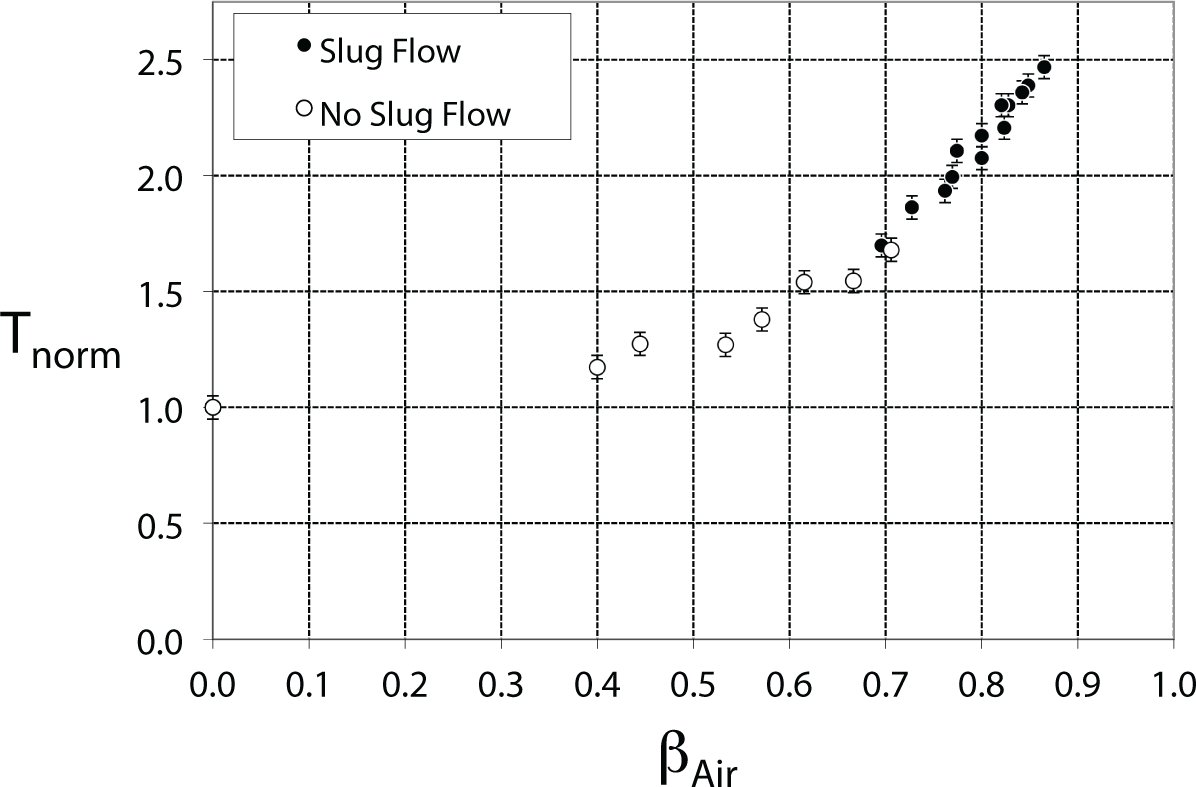
Figure 11 illustrates normalized mean thrust data as a function of air volumetric flux quality, βAir, for the Contoured SFE configuration. Filled symbols in Figure 11 indicate that slug flow was observed for that particular component flow rate of water and air. Figure 11 reveals normalized thrust data to coalesce to a single curve. For the range of values considered in this investigation, normalized thrust was found to increase linearly with respect to βAir with the onset of slug flow. For βAir ≈ 0.87 the normalized thrust was shown to be augmented approximately 2.5 times. It is hypothesized that the slug flow regime generated by the SFE would be the most effective flow regime to increase thrust output. Additionally, Figure 11 shows the normalized thrust to increase substantially beyond βAir > 0.7. It is conjectured that this trend was in some way related to the frequency of the liquid slugs being generated by the SFE.
4.2. Description of General Thrust Trends
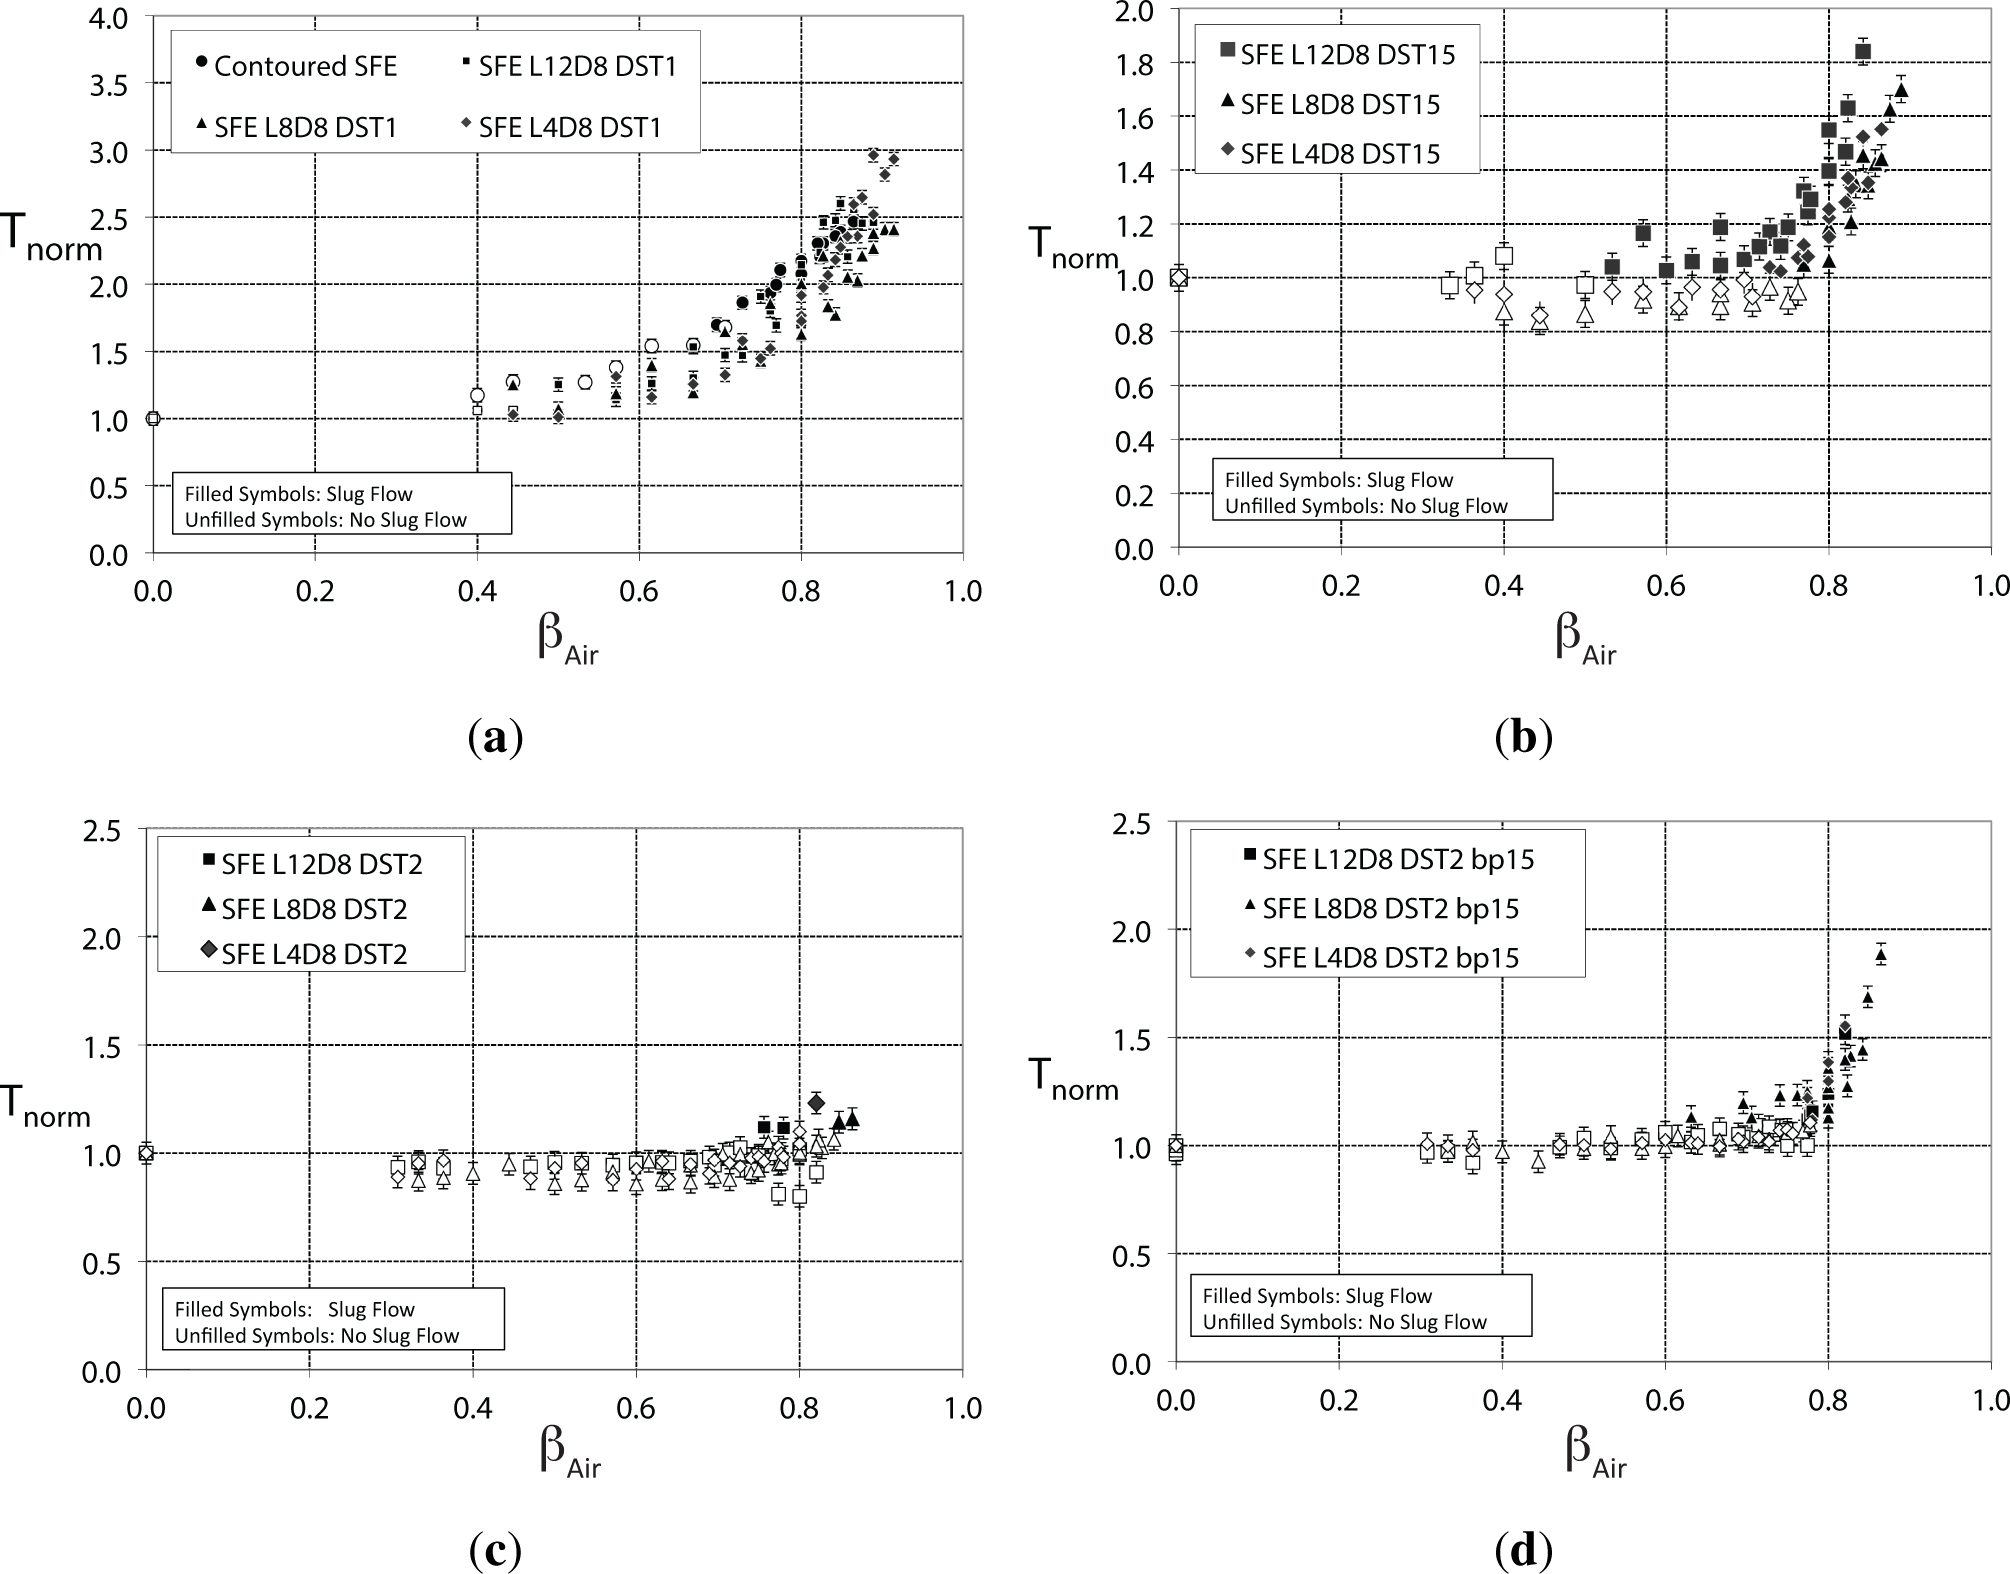
This subsection consolidates the trends observed for all 13 SFE configurations. Geometry effects on thrust data are discussed. The findings from this section are summarized in Figure 12, which illustrates the normalized thrust generated by each SFE geometry plotted with the volumetric flux quality, βAir.
4.3. SFE Downstream Tube Diameter
The inner diameter of the downstream acrylic tube was a parameter shown to have significant effect on mean thrust data and the flow regime produced in each SFE. The effects of three different diameters on thrust and resulting flow regimes were studied: 25 mm, 38 mm, and 51 mm. General observations made with respect to the downstream tube diameter are listed below:
SFE configurations with downstream tube diameters of 25 mm generated more thrust than the 38 mm or 51 mm downstream tubes. This was evidenced by the greater normalized thrust measurements shown in Figure 12. When examining Figure 12, it was noted that normalized thrust increased linearly for βAir > 0.7. In general, the thrust was shown to be augmented 2.5–3.0 times its original value at no air flow.
Thrust augmentation was minimal for SFE configurations incorporating downstream tube diameters of 38 mm and 51 mm. For 38 mm ID downstream tubes, shown in Figure 12b, the normalized thrust augmentation was not as significant as for 25 mm downstream tubes. Thrust was also observed to drop when air was initially injected. However, when the flow regime in the SFE transitioned to slug flow, the thrust was observed to suddenly increase. This indicated that the level of thrust generation was coupled with the flow regime inside the SFE. In addition, normalized thrust increased linearly for βAir > 0.75.
For 51 mm downstream tubes, shown in Figure 12c, the thrust increase was shown to be the least significant. The pattern was generally flat at lower βAir. However at higher βAir the thrust levels were found to increase slightly. This was in keeping with the theory that slug flow improved thrust generation.
4.4. SFE Cavity Length
Three cavity lengths were investigated: 102 mm, 203 mm, and 305 mm. SFE cavity lengths of 305 mm (SFEL12 geometries and Contoured SFE) delivered 22 N to 27 N of thrust at maximum operating conditions, which was significantly higher than for shorter cavity lengths. The shorter cavity lengths of 102 mm and 203 mm delivered approximately 13 N to 18 N of thrust at maximum operating conditions. However, when the thrust data was normalized, a cavity length of 102 mm was shown to outperform the other cavity lengths tested in terms of normalized thrust. The thrust was augmented three times with the 102 mm cavity length at maximum operating conditions, whereas the other cavity lengths experienced thrust augmentations approximately two and one-half times at maximum operating conditions. This trend relates to the fact that the system was unforced, and given that the mechanism for slug flow generation was found to relate to cavity length (improving with shorter cylindrical cavity length), the process is most likely caused by some form of cavity mode excitation. In this process, exiting slugs cause a pressure surge that influence the formation of new slugs at the air/vapor inlet. The frequency of slug formation would then depend on the speed at which a slug convects the vertical length of the cavity divided by the length of the cavity itself. Through this process, it is logical to conclude that some cavity lengths would perform better than others, a trend that is observed.
4.5. Constriction on Downstream Tube Diameter
The normalized thrust performance of SFE configurations using the 51 mm ID downstream tube was the poorest of all SFE configurations tested. For SFE cavity lengths of 102 mm, 203 mm, and 305 mm the 51 mm ID downstream tube increased thrust by a factor of only 1.2. A tube constriction was attached to the downstream tube that reduced the exit diameter to 38 mm. The effectiveness of thrust produced by this SFE geometry was improved when utilizing this downstream constriction, as illustrated by Figure 12d. This plot shows that the normalized thrust was augmented by a factor of ~2, and increased linearly for βAir > 0.8.
4.6. Contoured SFE Geometry
The Contoured SFE was designed a more gradual exit geometry. Thrust experiments were conducted on this configuration to ascertain whether this contoured exit geometry improved thrust generation. The Contoured SFE geometry yielded the greatest absolute thrust reading, 25.8 N, at maximum operating conditions. This was a significant improvement; the SFE L12 D8 DST1 geometry yielded 21.3 N at maximum operating conditions. The contoured shape seemed to improve the thrust generated. However, when the thrust data was normalized, it was shown to perform slightly below the capacity of the SFE L12 D8 DST1 configuration. The Contoured SFE augmented thrust by a factor of 2.5, whereas the SFE L12 D8 DST1 configuration augmented thrust by a factor of 2.7.
5. Discussion
In this section an explanation for one unanticipated event will be discussed; the effectiveness of each SFE geometry will be quantified; and a final assessment will be made on the best SFE geometry that was investigated in terms of the thrust generated.
5.1. Thrust Decrease upon Initial Injection of Air
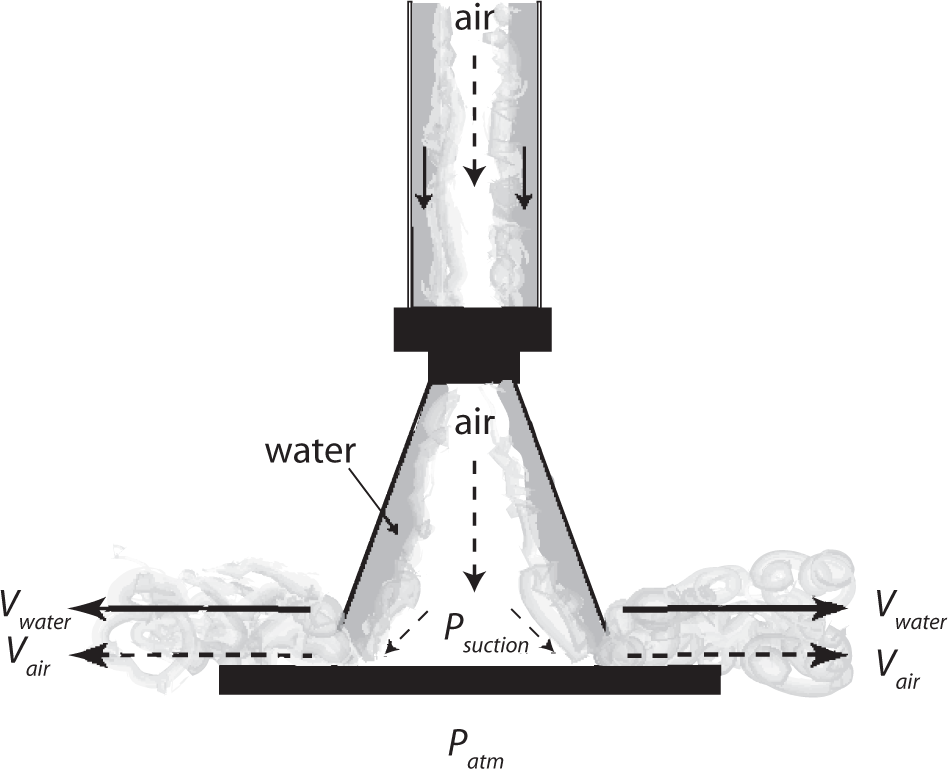
One unexpected result when examining the data collection was that thrust decreased slightly when air was initially injected. As the air flow was increased, this effect disappeared when the flow regime transitioned to slug flow. Thrust decrease was observed for all SFE configurations, with the exception of those that utilized a 25 mm downstream tube. This phenomenon can be explained with the help of the illustration in Figure 13. This figure displays pictorially the effect of water and air flow turning when impinging on the thrust-plate. At lower air flow rates, i.e., 1 L/s ~ 4 L/s (ReA = 1.2×10⁴ ~ 4.9×10⁴), it must exit and turn through the water cone curtain, and a turbulent mixing region develops. In effect, the velocity of the air must increase through the water-thrust-plate boundary. By Bernoulli’s principle this would result in a low pressure zone, where Psuction < Patm, in the turbulent mixing region shown in Figure 13. The pressure below the thrust-plate is atmospheric; therefore, this would cause an upward force on the thrust-plate at lower air flow rates. Further study would be required to fully substantiate this theory. One experiment that could be conducted is to tap a pressure line in the center of the thrust-plate to measure Psuction. If the pressure drops below atmospheric, then this would indicate that the air exiting at lower air flow rates causes this suction effect. A second contributing factor could be due to a change in the momentum balance of the water such that with the injection of air, more momentum is in the horizontal direction, thereby reducing the vertical component of momentum.
5.2. Thrust Generation
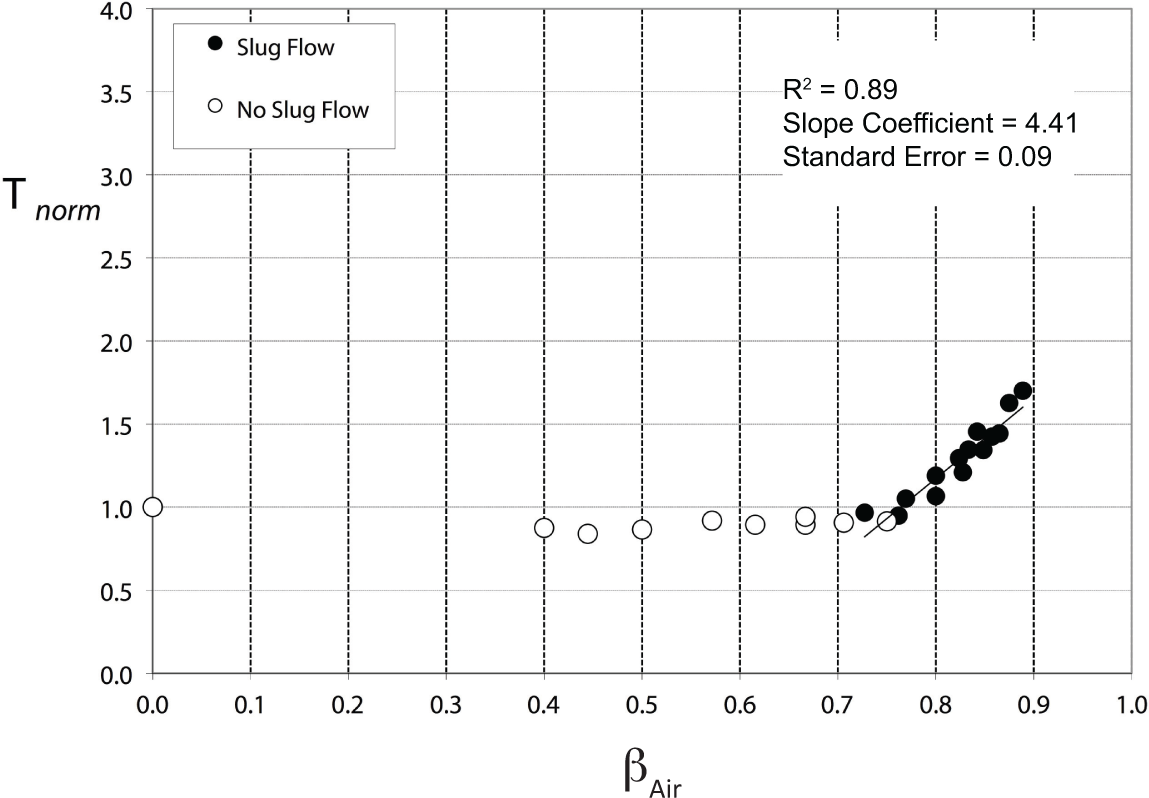
Examining the normalized thrust data is the only valid way of comparing the effectiveness of each SFE geometry. Depending on the SFE geometry, normalized thrust was shown to increase significantly and in an approximately linear manner when slug flow was generated by the SFE. Regression analysis was performed on the normalized thrust data as a function of βAir. Figure 14 displays the line-of-best-fit from the linear regression analysis performed on the normalized thrust data for the SFE L8D8 DST15 configuration. Only normalized thrust data for βAir > 0.75 was considered when performing this linear regression. The magnitude of the slope from the linear regression indicates the propensity of the SFE configuration to augment thrust.
Table 1 displays the linear regression analysis for each SFE configuration. The slope from linear regression analysis is shown in the third column in Table 1. This table confirms that the SFE L4D8 DST1 geometry demonstrated a greater propensity to augment thrust than the other SFE geometries. Based on the normalized thrust measurements, it is revealed that the SFE L4D8 DST1 was the optimum SFE geometry investigated. This is due to the fact that the downstream tube diameter is smaller than other SFE configurations, and this has an impact on the effectiveness and frequency of the liquid slug generation process.
It has been observed that SFE geometries incorporating 25 mm ID downstream tubes in the design produced greater normalized thrust than SFE geometries with 38 mm and 51 mm ID downstream tubes. In addition, SFE geometries with shorter cylindrical cavity lengths (102 mm) produced greater normalized thrust than SFE geometries utilizing longer cavity lengths (203 mm and 305 mm). Figure 12 shows normalized thrust to increase alongside βAir, and that the SFE L4D8 DST1 geometry augmented thrust to a greater degree than the other SFE geometries. Reviewing literature for pulsed water jets, Foldyna et al. [23] showed that through an analysis of the impact of a water jet on a target, it can be shown that the impact pressure generated by a slug of liquid is considerably higher than the corresponding stagnation pressure generated by a continuous jet. Foldyna et al. [23] showed that the impact pressure of a pulsed jet will be at least four times higher at the same velocity for a continuous jet. The data presented in Figure 12 illustrates the thrust to increase with respect to slug flow being observed. Slug generation was induced by increasing the air flow, hence air-core pressure. This provides insight into the physical process of slug generation, and explains why the SFE L4D8 DST1 geometry outperformed the other SFE geometries.
6. Conclusions
This paper quantified the thrust performance of a Slug Flow Expander. In order to quantify the performance of each SFE geometry, thrust measurements were made at various component flow rates of water and air. In effect, this quantified the momentum generated by the SFE. For the simultaneous injection of water and air into the SFE, mean thrust readings steadily increased as the air flow rate increased. Mean thrust measurements were normalized with respect to the thrust measurement at no air flow (0 L/s) for a more accurate comparison of different SFE architectures. The analysis performed on the normalized thrust readings suggested that as the water and air flow were increased to critical conditions, the liquid slug pistons produced by the SFE augmented the thrust measurements.
The geometry specifications of the SFE had a significant effect on the normalized thrust measurements, and the following conclusions were made.
Varying the downstream tube diameter had the most effect on the thrust produced. SFE configurations with downstream tube diameter of 25 mm generated greater normalized thrust than the 38 mm or 51 mm downstream tube counterparts.
SFE geometries with a shorter cavity length of 102 mm were shown to outperform SFE geometries with longer cavity lengths of 203 mm and 305 mm, at maximum operating conditions.
The performance of the SFE was only slightly improved when utilizing a downstream tube constriction (backpressure boot).
The Contoured SFE geometry yielded the greatest absolute thrust readings. However, when these measurements were normalized, they were shown to perform below the capacity of other configurations.
The final performance evaluation was based on linear regression of the normalized thrust measurements where slug flow was generated for each SFE architecture. Greater magnitudes of the slope from the linear regression indicated the propensity of the SFE to augment thrust. This analysis confirmed that the SFE L4D8 DST1 architecture was the optimum design to generate thrust.
This paper has demonstrated that the SFE provides a mechanism by which either high-pressure gas or vapor can impart kinetic energy to liquid slugs. The multiphase nature of the SFE enables wetting fluids to be used, be it wet steam or compressed air with water-droplet formation. The results obtained also indicate that thrust augmentation will continue to increase with increased operating pressure.
Acknowledgments
Funds for the support of this research have been in part through the National Sciences and Engineering Research Council of Canada (NSERC) Strategic Grant No. 73-2064, the Department of Mechanical & Manufacturing Engineering Teaching Assistantships and Fellowships, the Alberta Research Council Karl A. Clark Memorial Scholarship, the Talisman Energy Graduate Scholarship in Energy and Related Studies, and the University of Calgary Queen Elizabeth II Doctoral Scholarship.
Appendix 1
The water inlet Reynolds number was computed based on the following formulation:

| Parameter | Value |
|---|---|
| Density | 1.00×10³ kg/m3 |
| Viscosity | 1.003×10⁻³ kg/ms |
| Inlet Pipe Diameter | 5.72×10⁻² m |
| Inlet Pipe Area | 2.57×10⁻³ m2 |
| Volumetric Flow Rate | 1.75×10⁻³ m3/s |
| Average Water Velocity | 6.82×10⁻¹ m/s |
| ReW | 3.89×10⁴ |
| Parameter | Value |
|---|---|
| Density | 1.203 kg/m3 |
| Viscosity | 1.98×10⁻⁵ kg/ms |
| Inlet Pipe Diameter | 6.35×10⁻³ m |
| Inlet Pipe Area | 3.17×10⁻⁵ m2 |
| Volumetric Flow Rate | 4.0×10⁻³ m3/s |
| Measured Air Pressure Pcore | 50 kPa (gage) |
| 1.49 | |
| Mach Number | 0.77 |
| Speed of Sound | 3.43×10² m/s |
| Average Air Velocity | 2.67×10² m/s |
| ReW | 1.03×10⁵ |
Author Contributions
This research was performed as part of the doctoral studies of the first author, with the second author academic supervisor and principal investigator of the NSERC Strategic Grant that supported the research.
Conflicts of Interest
The authors declare no conflict of interest.
References
- Fichman, B. Monthly Energy Review; Technical Report for U.S Energy Information Administration: Washington, DC, USA, 2014. [Google Scholar]
- Van der Linden, S. Bulk energy storage potential in the USA, current developments and future prospects. Energy 2006, 31, 3446–3457. [Google Scholar]
- Cavallo, A. Controllable and affordable utility-scale electricity from intermittent wind resources and compressed air energy storage (CAES). Energy 2007, 32, 120–127. [Google Scholar]
- Robb, D. Could CAES answer wind reliability concerns? Power 2010, 154, 58–61. [Google Scholar]
- Angelino, G.; Paliano, P.D. Multicomponent working fluids for organic rankine cycles (ORCs). Energy 1998, 23, 449–463. [Google Scholar]
- Curran, H. Use of organic working fluids in rankine engines. J. Energy 1981, 5, 218–223. [Google Scholar]
- Eberl, U. Pictures of the Future; Technical Report for Siemens AG: Berlin, Germany, 2014. [Google Scholar]
- Badr, O.; O’Callaghan, P.; Probert, S. Rankine-cycle systems for harnessing power from low-grade energy sources. Appl. Energy 1990, 36, 263–292. [Google Scholar]
- Badr, O.; Naik, S.; O’Callaghan, P.; Probert, S. Expansion machine for a low power-output stem rankine-cycle engine. Appl. Energy 1991, 39, 93–116. [Google Scholar]
- Ng, K.; Bong, T.; Lim, T. A thermodynamic model for the analysis of screw expander performance. Heat Recovery Syst. CHP 1990, 10, 119–133. [Google Scholar]
- Declaye, S.; Quoilin, S.; Guillaume, L.; Lemort, V. Experimental study on an open-drive scroll expander integrated into an ORC (Organic Rankine Cycle) system with R245fa as working fluid. Energy 2013, 55, 173–183. [Google Scholar]
- Veer, C. An Experimental Investigation of the Vortex Breakdown Process in a Multiphase Pipe Flow. Master’s Thesis, University of Calgary, Calgary, AL, Canada, 2004. [Google Scholar]
- Vonnegut, B. A vortex whistle. J. Acoust. Soc. Am. 1954, 26, 18–20. [Google Scholar]
- Dao, E.; Balakotaiah, V. Experimental Study of wave occlusion on falling films in a vertical pipe. AIChE J. 2000, 46, 1300–1306. [Google Scholar]
- Grazzini, G.; Milazzo, A. Thermodynamic analysis of CAES/TES systems for renewable energy plants. Renew. Energy 2008, 39, 1998–2006. [Google Scholar]
- Bannister, R.; Silvestri, G. The evolution of central station steam turbines. Mech. Eng. 1989, 111, 70–78. [Google Scholar]
- Hugo, R.; Veer, C. An Experimental Investigation of Vortex Breakdown in Multiphase Pipe Flow, Proceedings of the 33rd AIAA Fluid Dynamics Conference and Exhibit, Orlando, FL, USA, 23–26 June 2003. AIAA-2003-3602.
- Zhang, Z. Particle Image Velocimetry (PIV) Measurements of an Inline Pipe Vortex. Master’s Thesis, University of Calgary, Calgary, AL, Canada, 2004. [Google Scholar]
- Zhang, Z.; Hugo, R.J. Stereo particle image velocimetry applied to a vortex pipe flow. Exp. Fluids 2006, 40, 333–346. [Google Scholar]
- Chanaud, R. Observations of oscillatory motion in certain swirling flows. J. Fluid Mech. 1965, 21, 111–127. [Google Scholar]
- Sato, H.; Watanabe, K. Experimental Study on the use of a Vortex whistle as a flowmeter. IEEE Trans. Instrum. Meas. 2000, 49, 200–205. [Google Scholar]
- Brennen, C. Fundamentals of Multiphase Flow; Cambridge University Press: Cambridge, UK, 2005. [Google Scholar]
- Foldyna, J.; Sitek, L.; Svehla, B.; Svehla, S. Utilization of ultrasound to enhance high-speed water jet effects. Ultrason. Sonochem. 2004, 11, 131–137. [Google Scholar]


| SFE configuration | Max. normalized thrust | Slope coefficient | Standard error | R2 |
|---|---|---|---|---|
| SFE L4D8 DST1 | 3.00 | 8.14 | 0.15 | 0.92 |
| SFE L12D8 DST1 | 2.70 | 5.62 | 0.16 | 0.83 |
| SFE L8D8 DST1 | 2.40 | 5.26 | 0.13 | 0.87 |
| Contoured SFE | 2.50 | 4.64 | 0.05 | 0.97 |
| SFE L12D8 DST15 | 1.80 | 4.56 | 0.09 | 0.89 |
| SFE L8D8 DST15 | 1.70 | 4.41 | 0.09 | 0.89 |
| SFE L4D8 DST15 | 1.60 | 4.58 | 0.06 | 0.88 |
| SFE L8D8 DST2bp15 | 1.90 | 4.54 | 0.13 | 0.67 |
| SFE L4D8 DST2bp15 | 1.60 | 4.54 | 0.09 | 0.85 |
| SFE L12D8 DST2bp15 | 1.50 | 3.37 | 0.08 | 0.69 |
| SFE L4D8 DST2 | 1.20 | N/A | N/A | N/A |
| SFE L8D8 DST2 | 1.20 | N/A | N/A | N/A |
| SFE L12D8 DST2 | 1.10 | N/A | N/A | N/A |
© 2014 by the authors; licensee MDPI, Basel, Switzerland This article is an open access article distributed under the terms and conditions of the Creative Commons Attribution license (http://creativecommons.org/licenses/by/4.0/).
Share and Cite
De Witt, B.; Hugo, R. Naturally-Forced Slug Flow Expander for Application in a Waste-Heat Recovery Cycle. Energies 2014, 7, 7223-7244. https://doi.org/10.3390/en7117223
De Witt B, Hugo R. Naturally-Forced Slug Flow Expander for Application in a Waste-Heat Recovery Cycle. Energies. 2014; 7(11):7223-7244. https://doi.org/10.3390/en7117223
Chicago/Turabian StyleDe Witt, Ben, and Ron Hugo. 2014. "Naturally-Forced Slug Flow Expander for Application in a Waste-Heat Recovery Cycle" Energies 7, no. 11: 7223-7244. https://doi.org/10.3390/en7117223
APA StyleDe Witt, B., & Hugo, R. (2014). Naturally-Forced Slug Flow Expander for Application in a Waste-Heat Recovery Cycle. Energies, 7(11), 7223-7244. https://doi.org/10.3390/en7117223