Comparison and Analysis of Macro Energy Scenarios in China and a Decomposition-Based Approach to Quantifying the Impacts of Economic and Social Development


Abstract
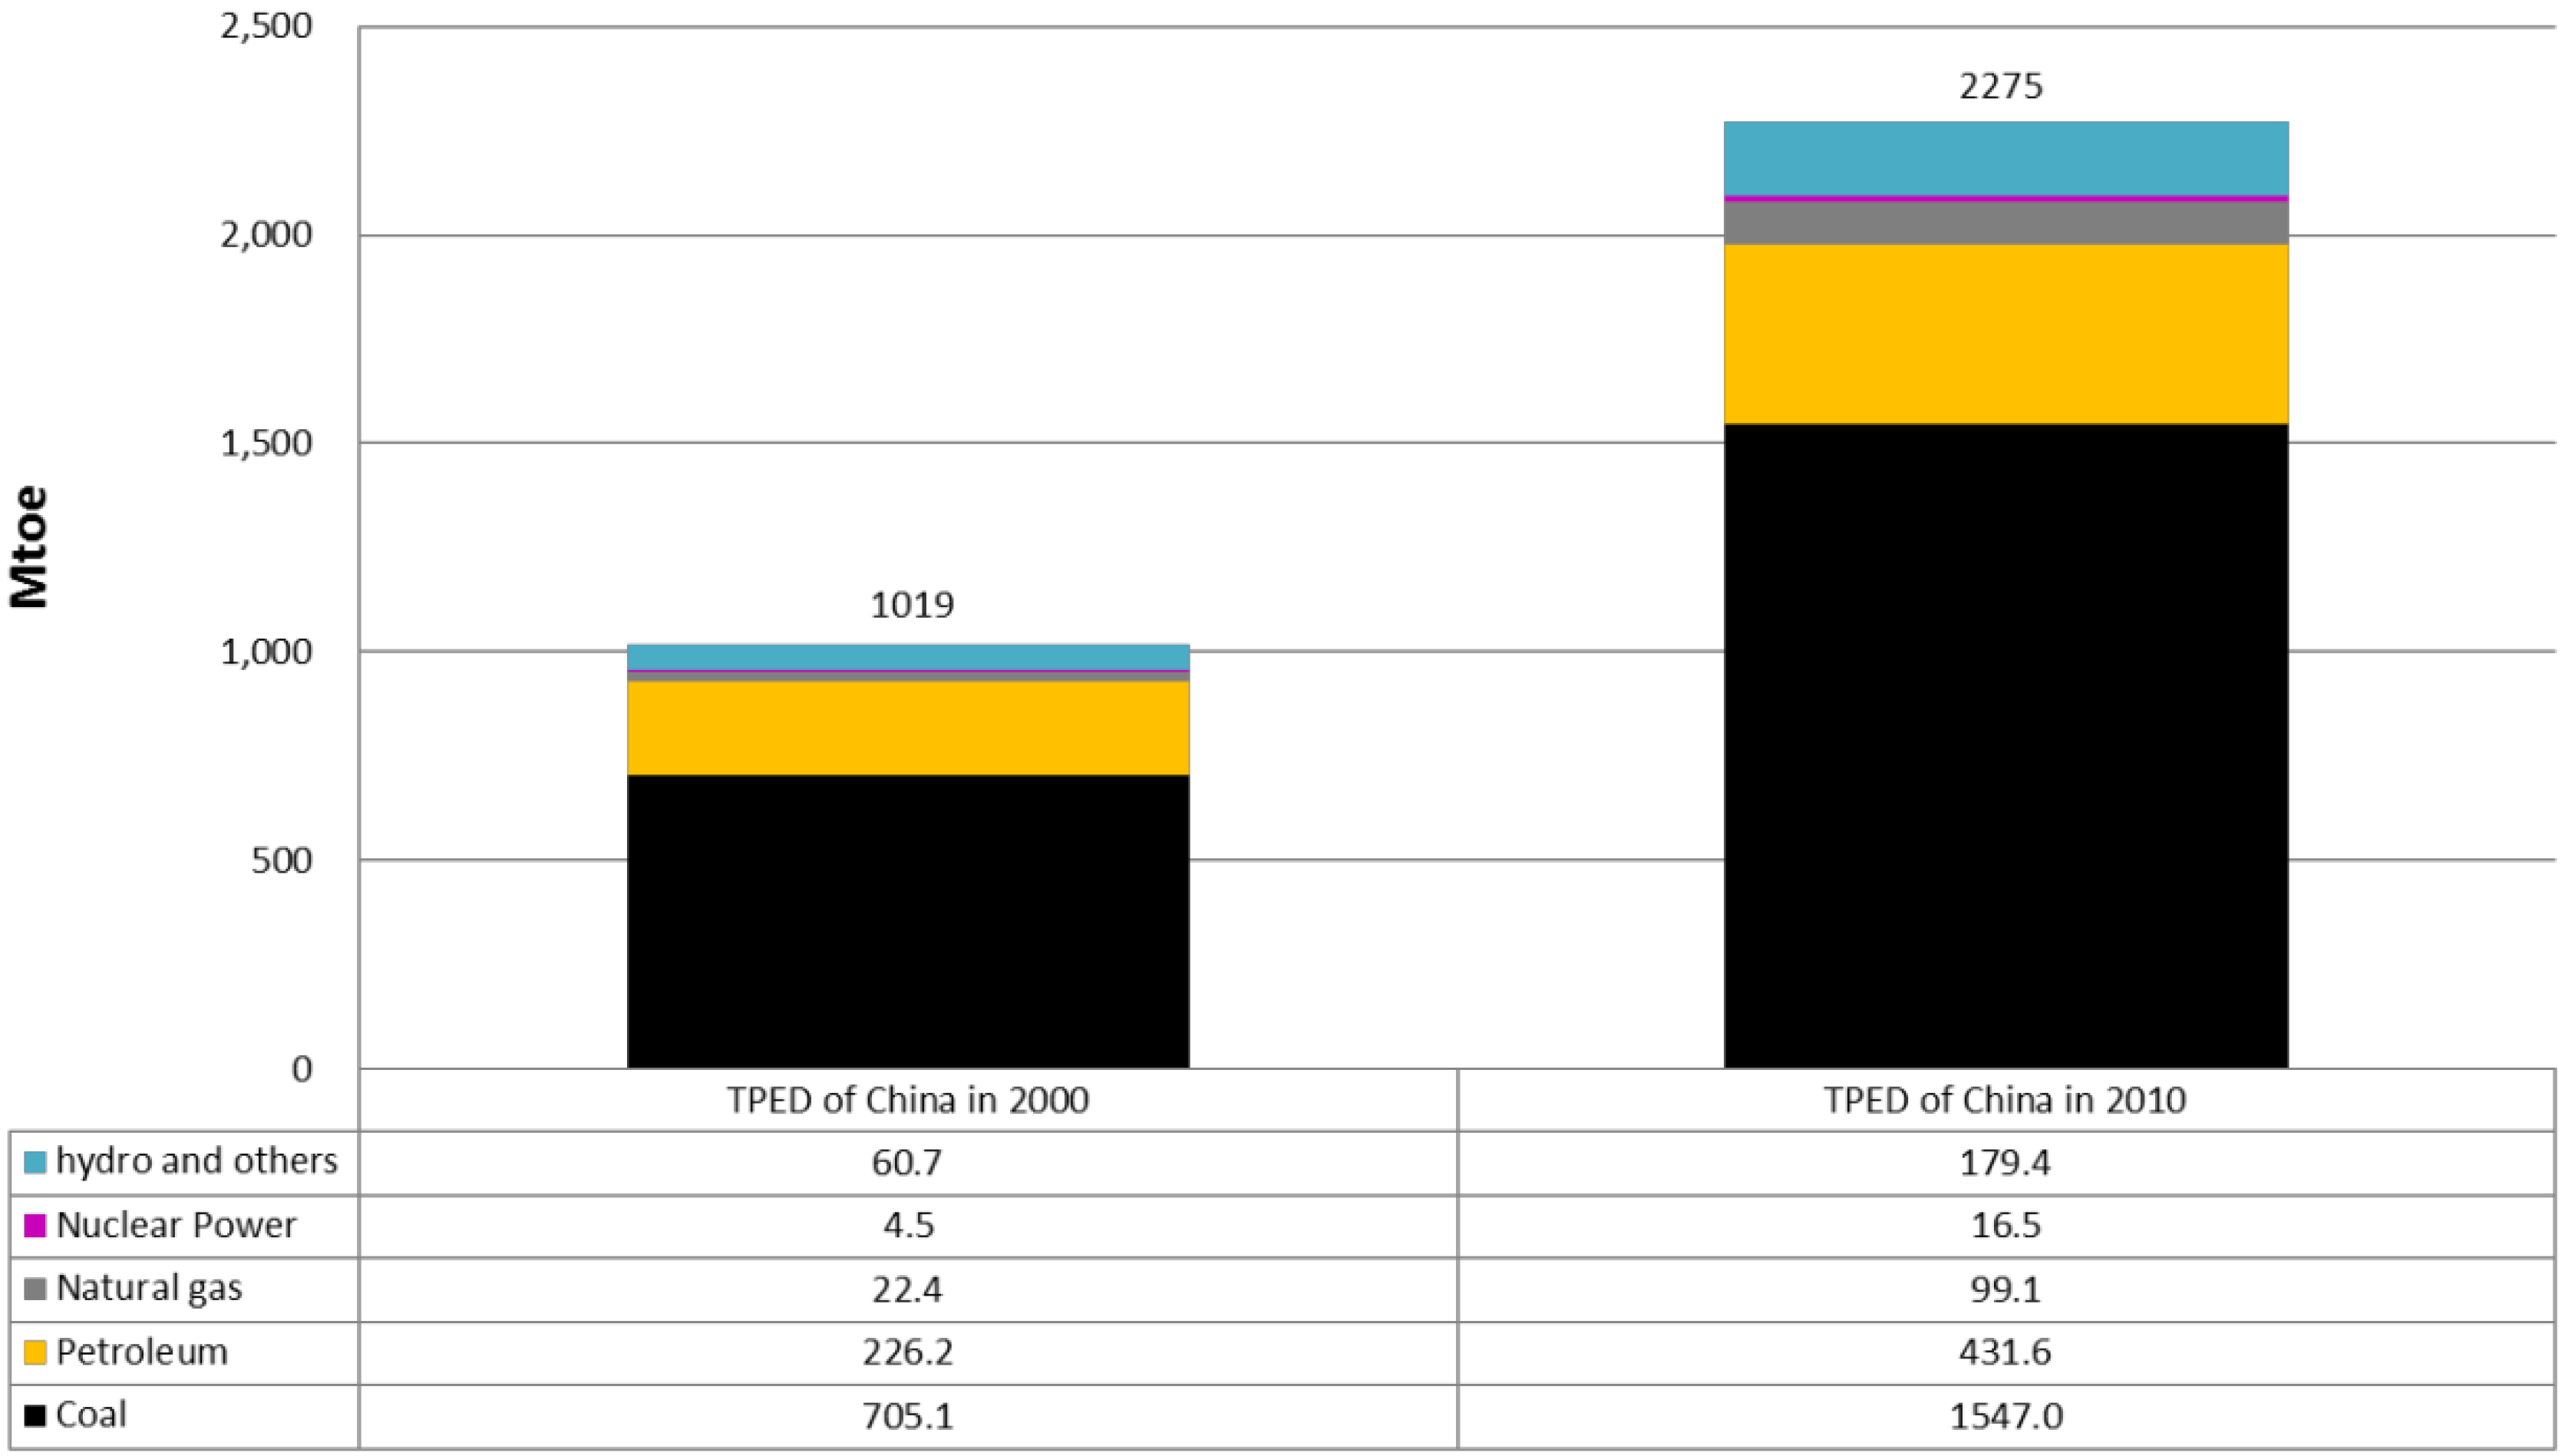
:1. Introduction—Macro Energy Scenarios of China in Published Reports

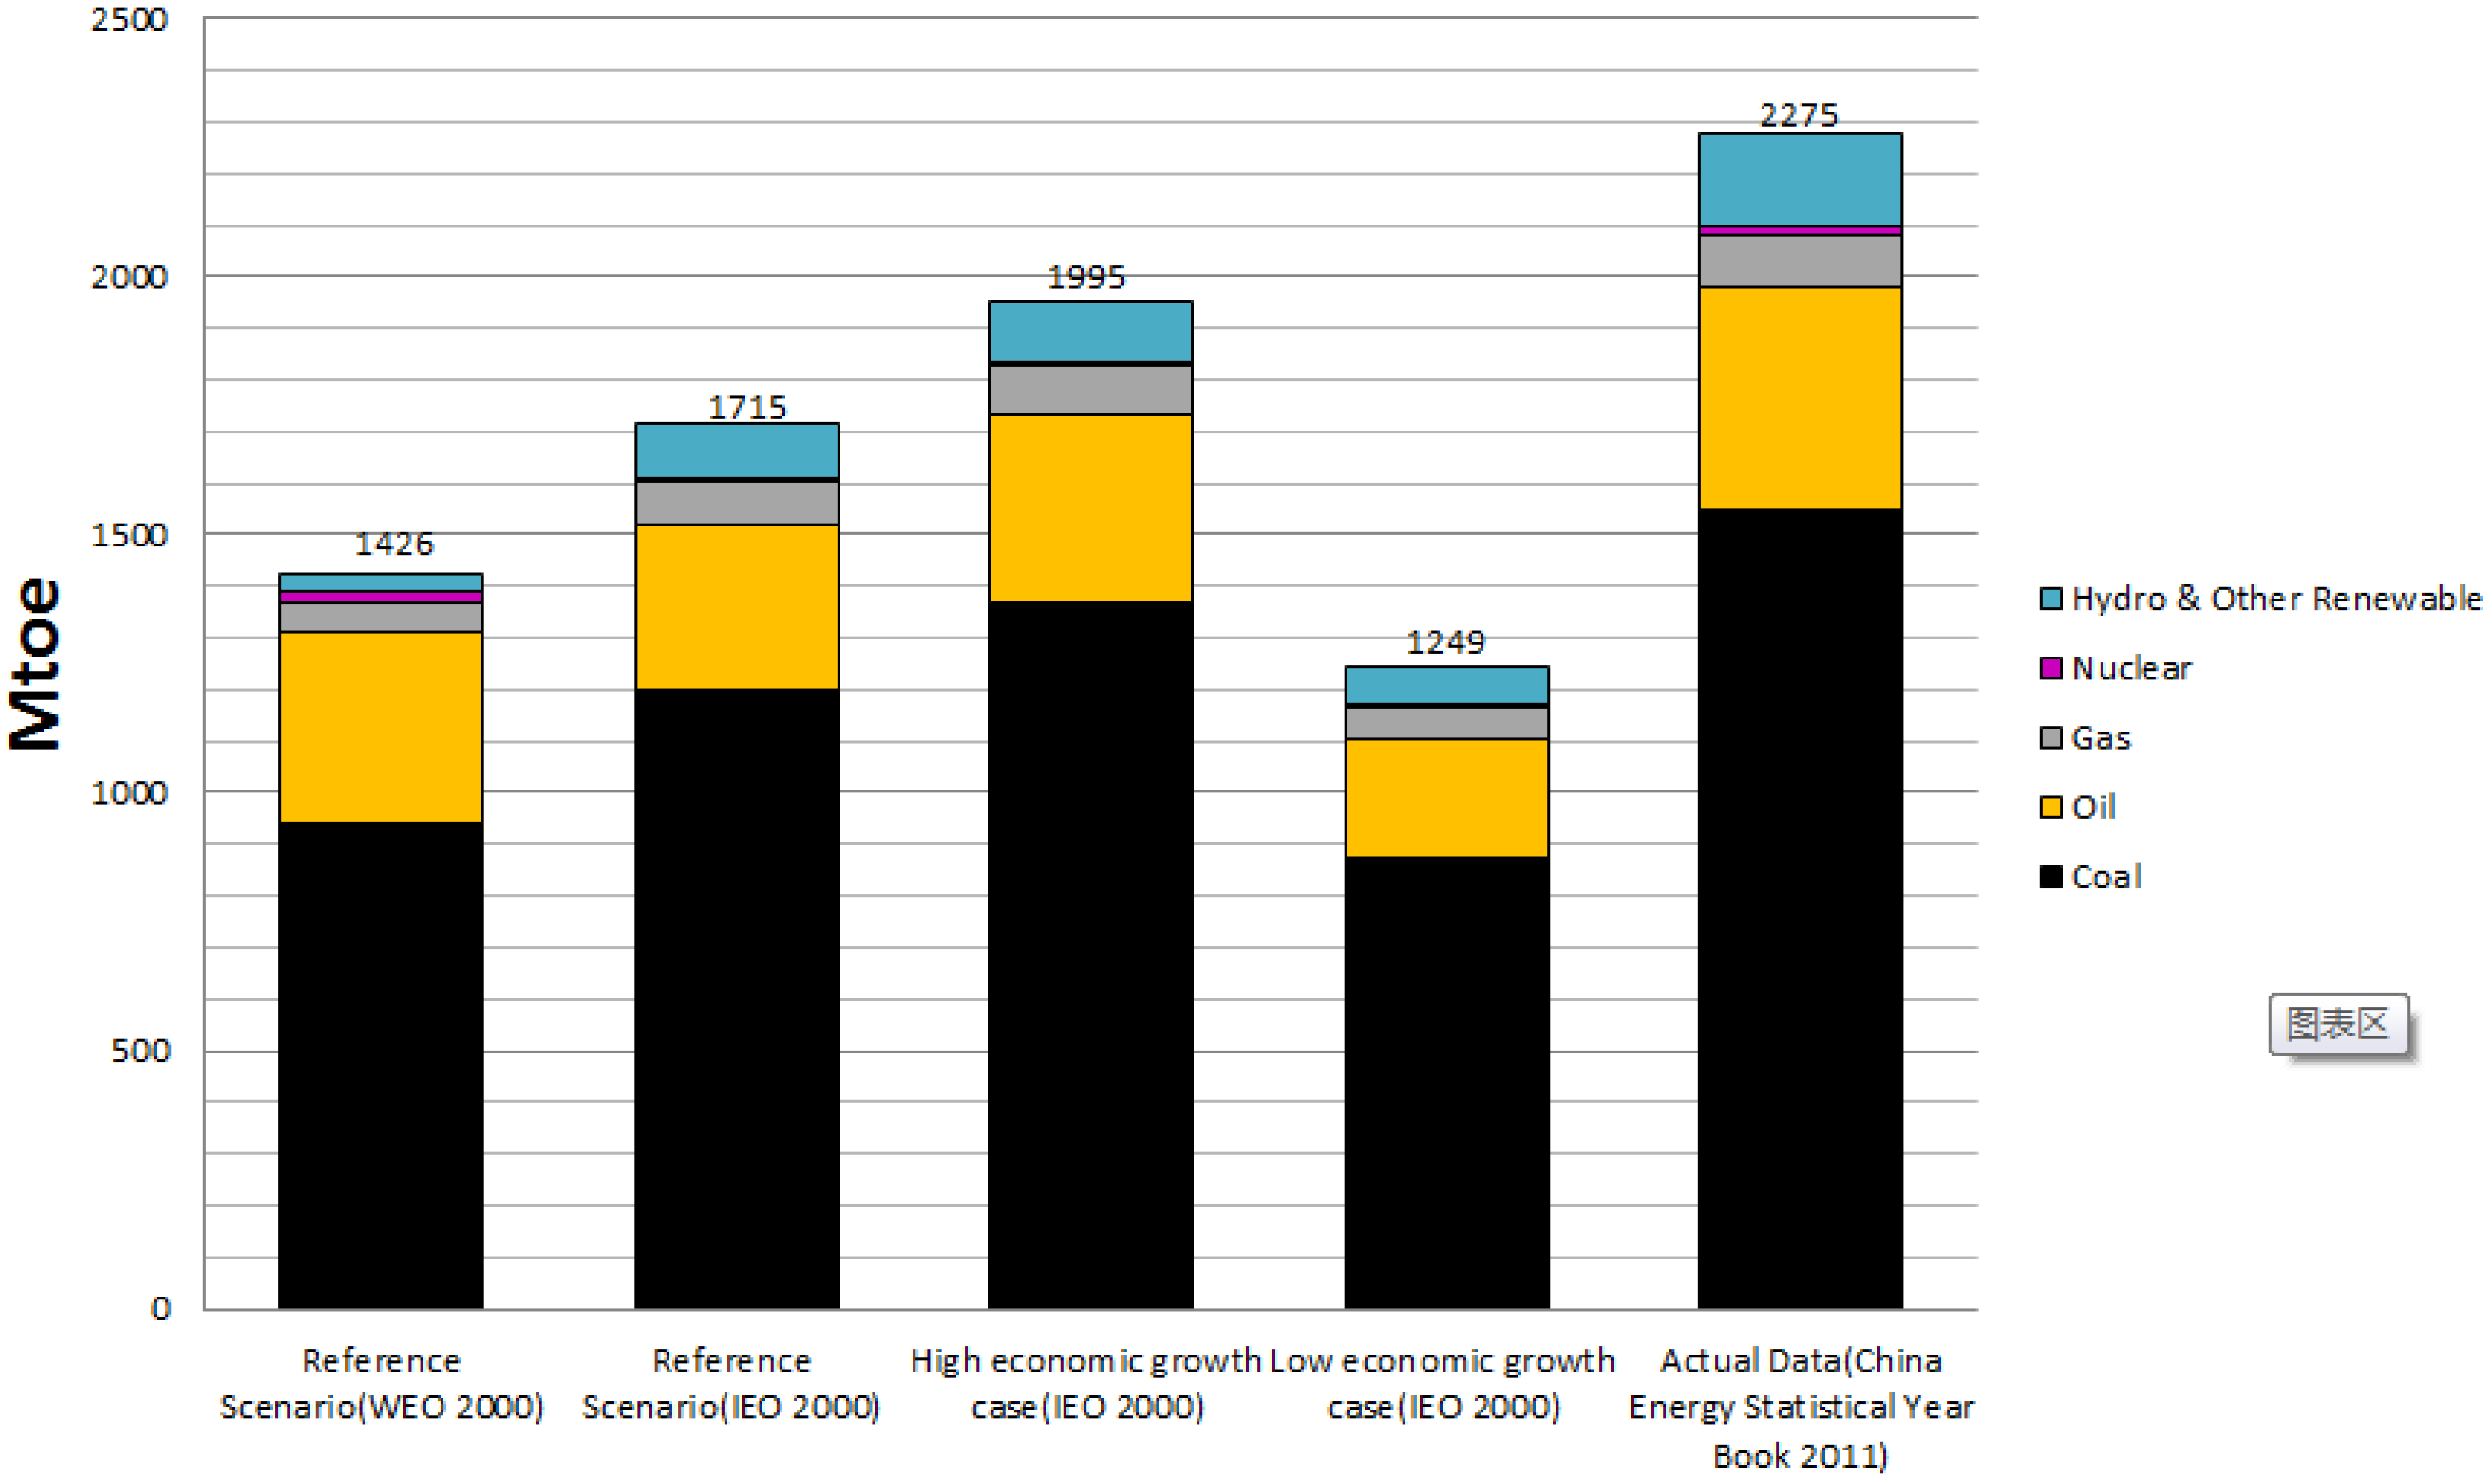

2. Methodology Descriptions
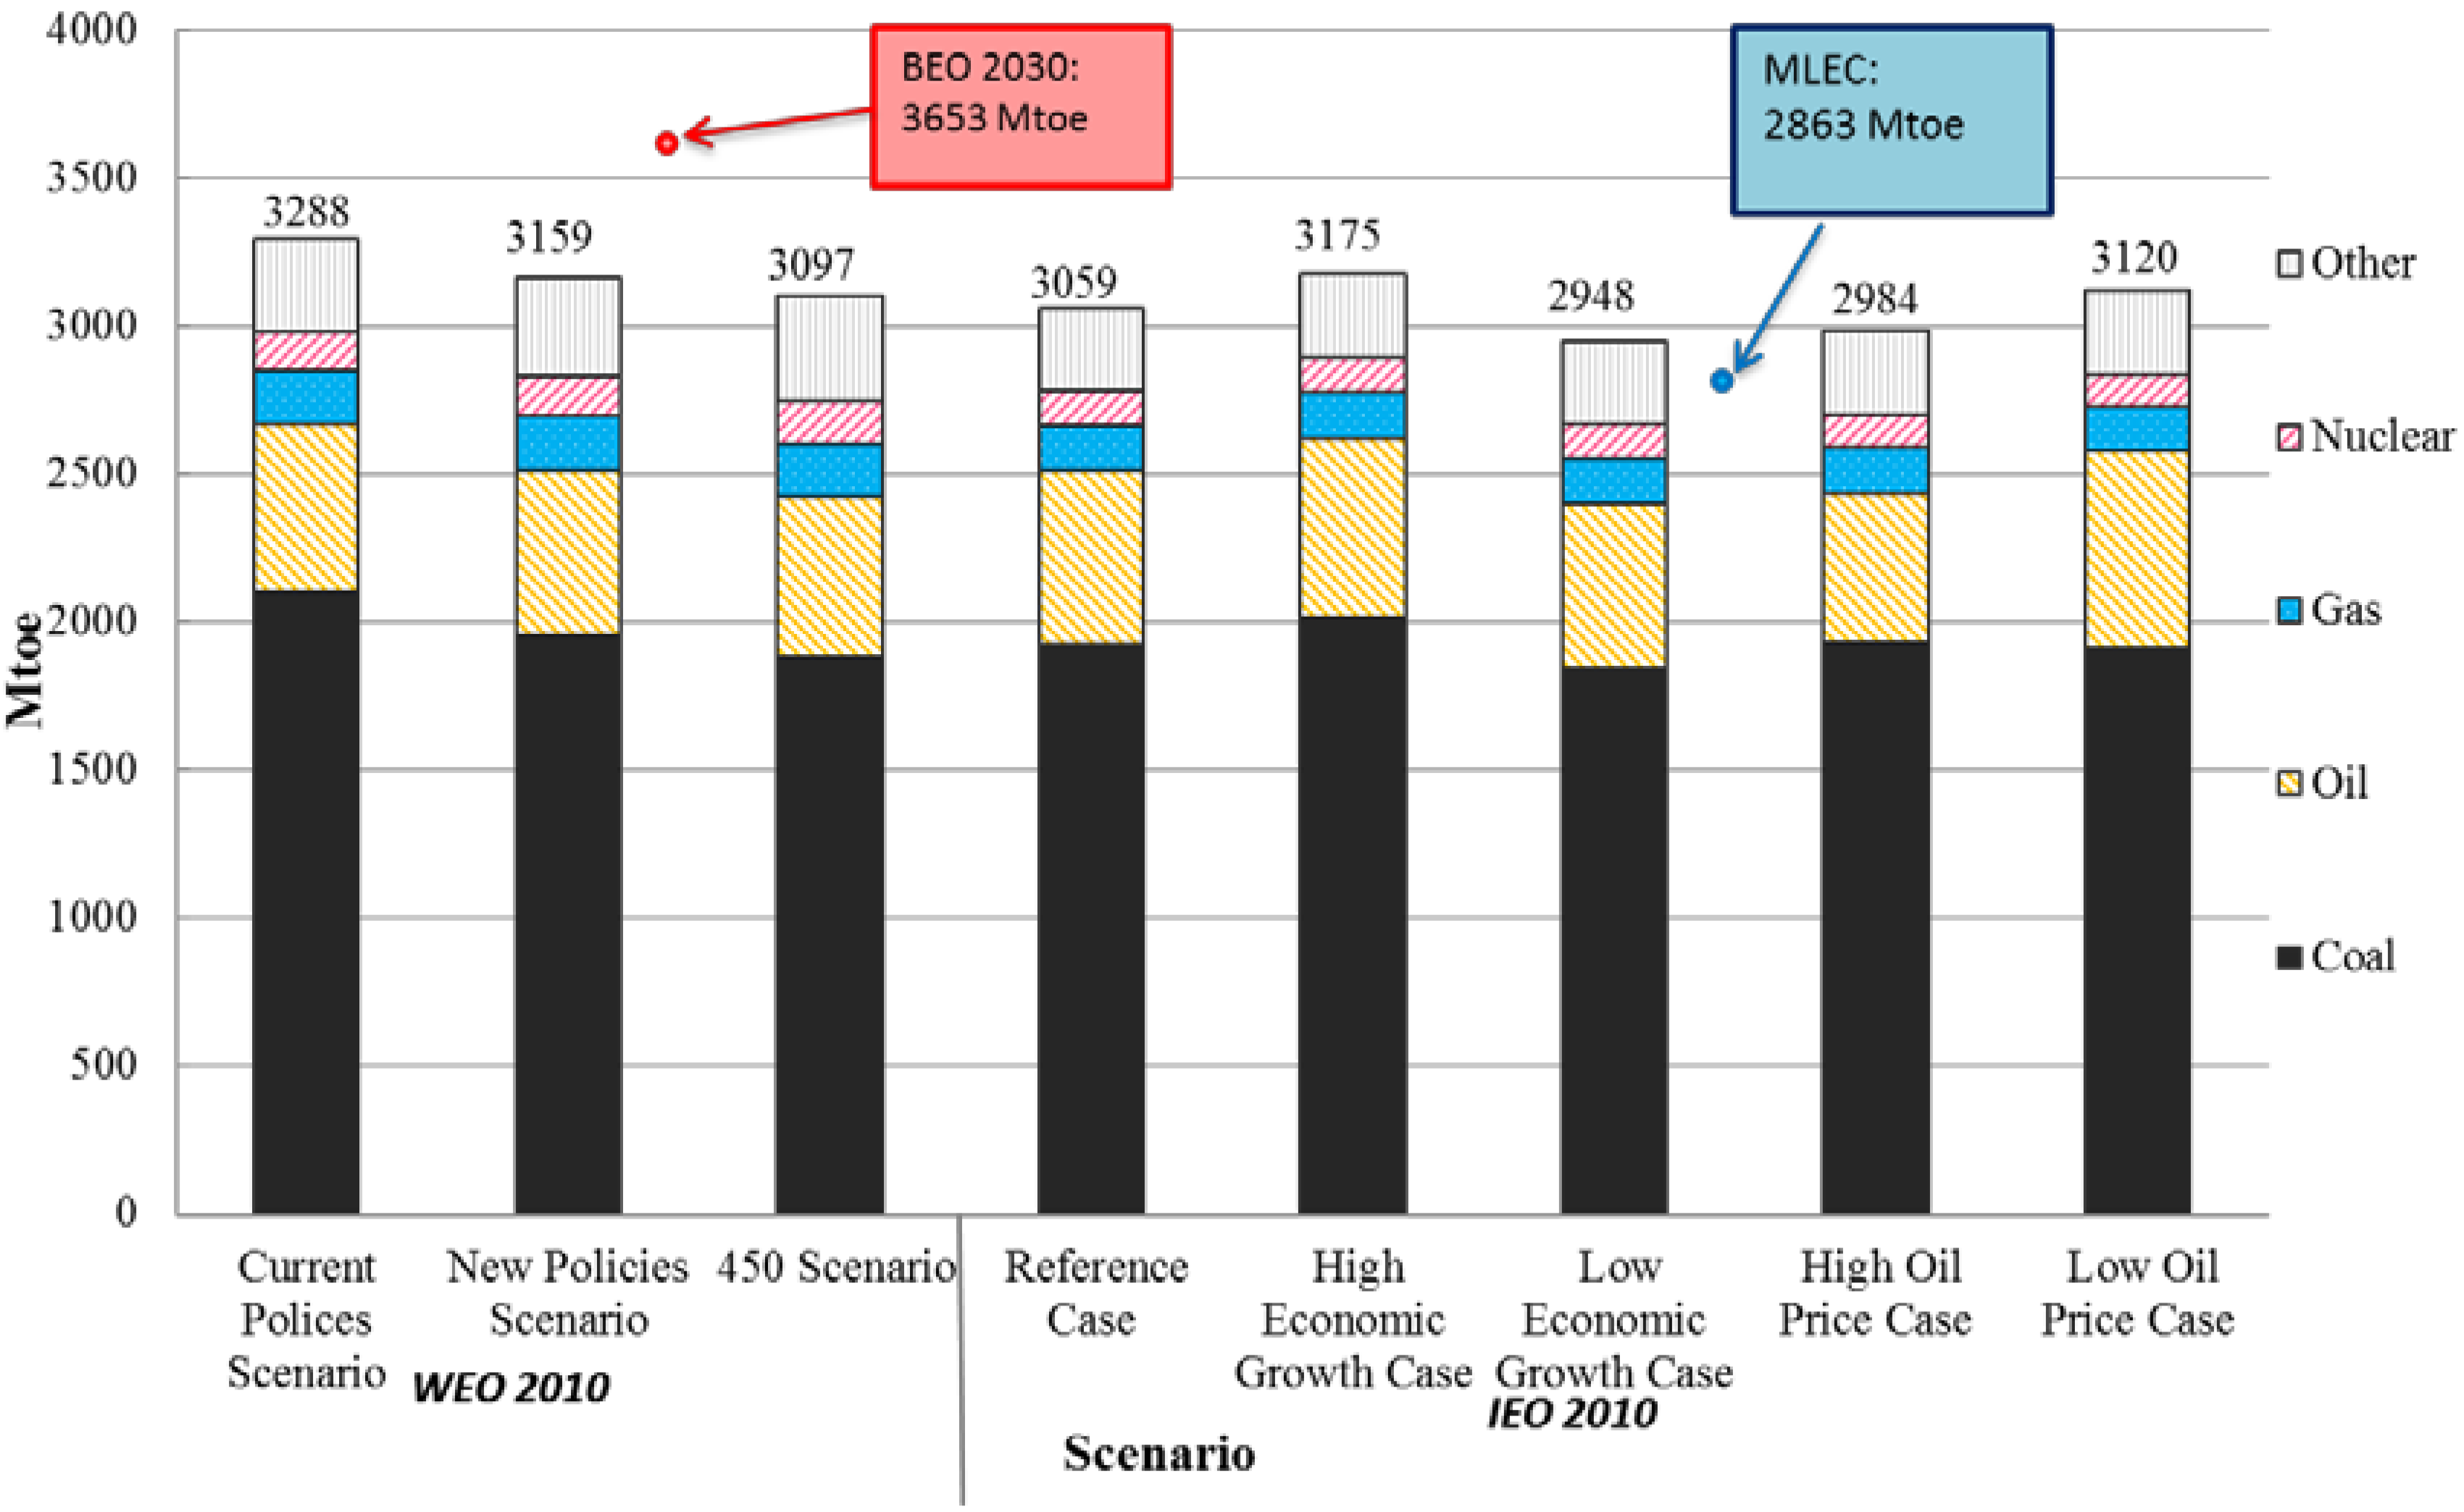
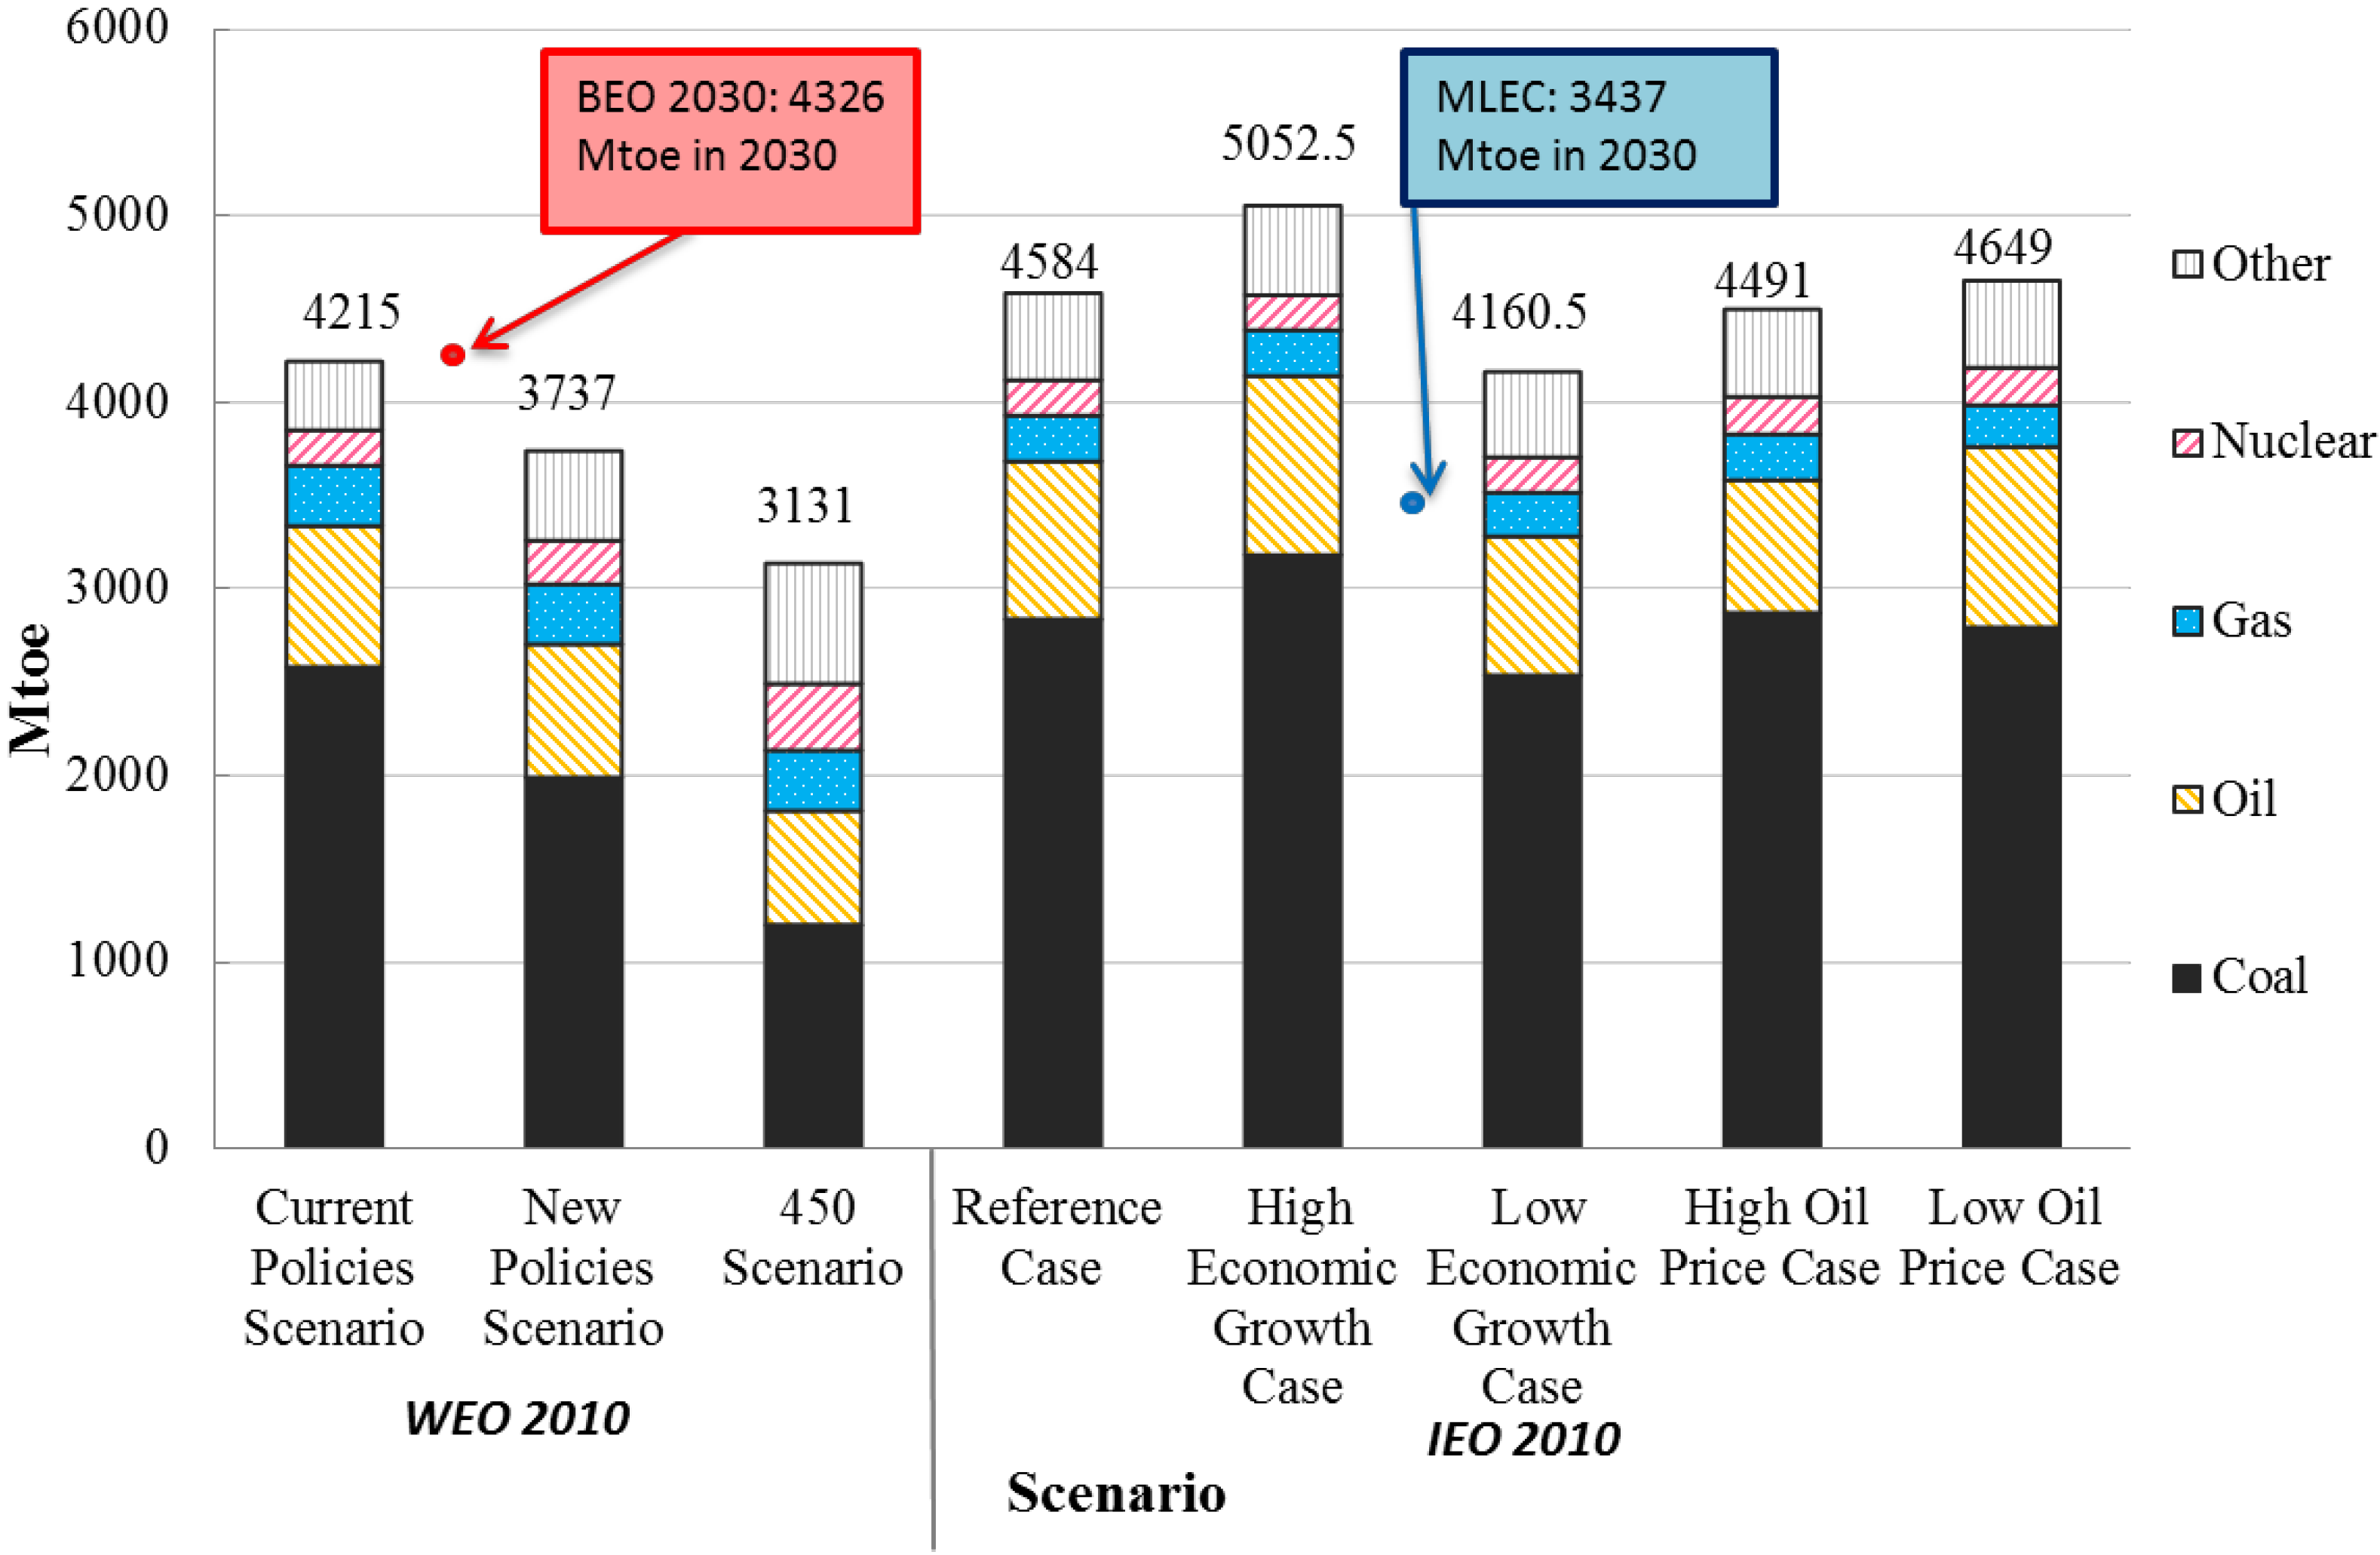
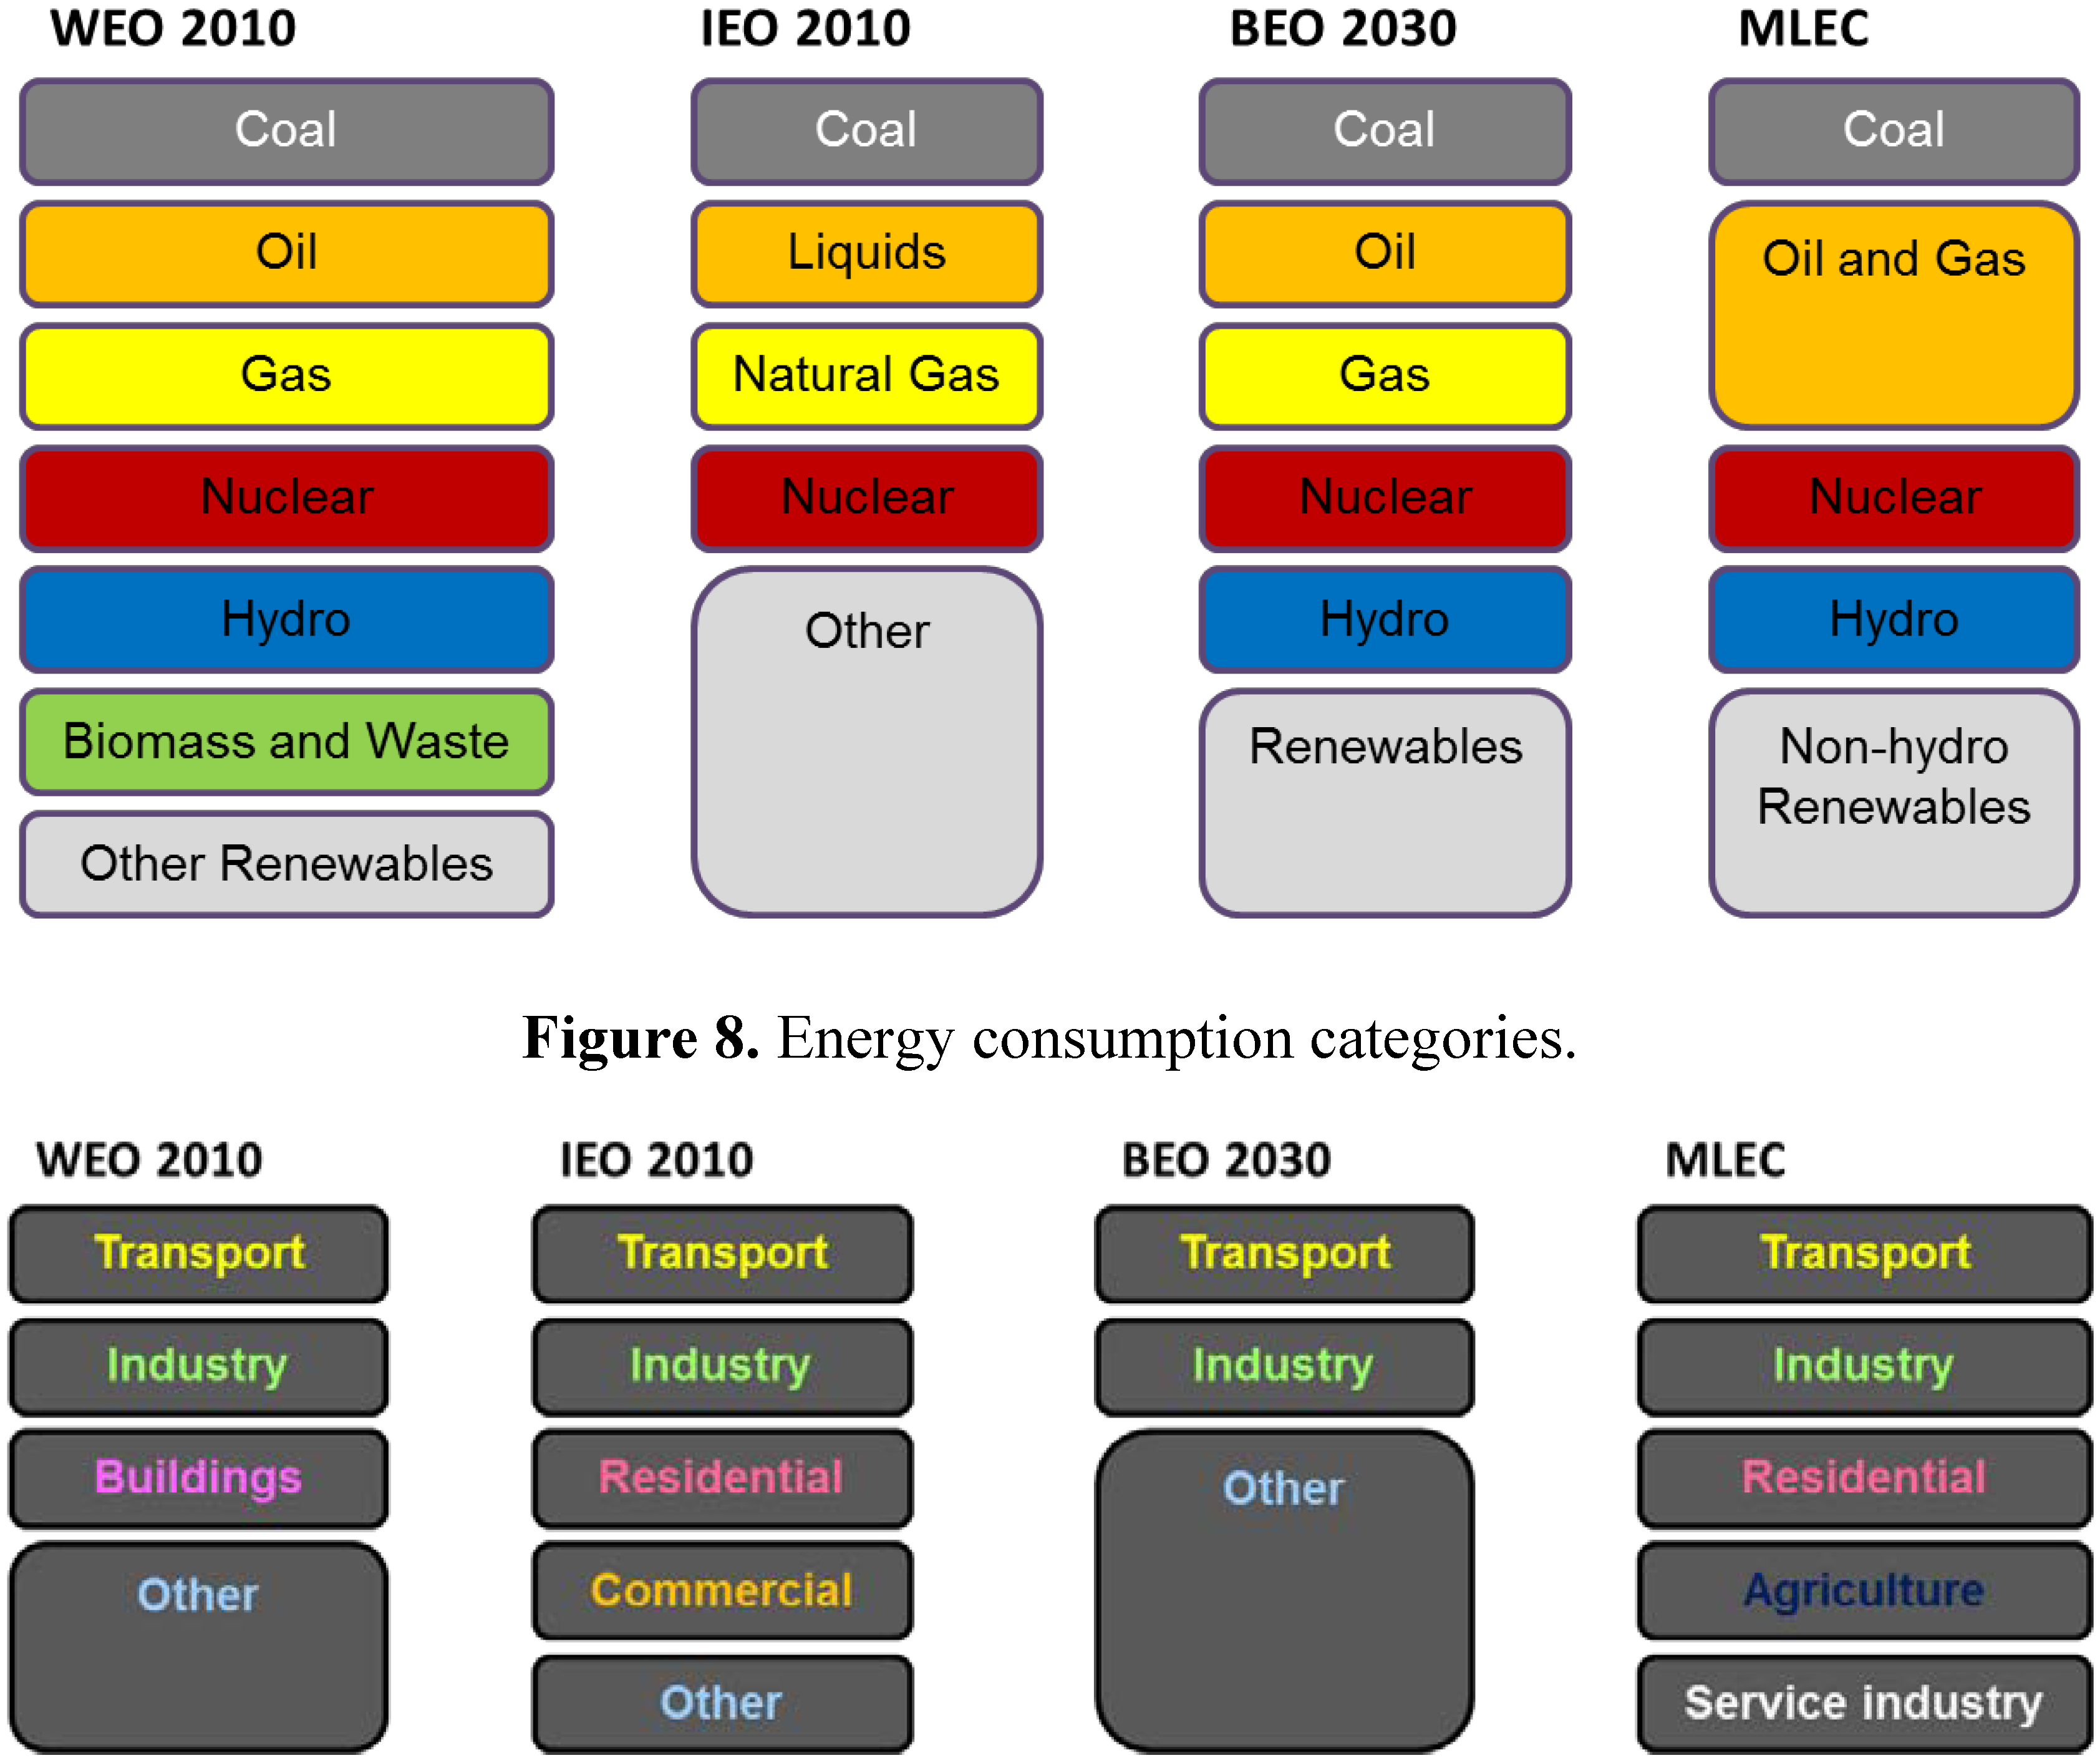
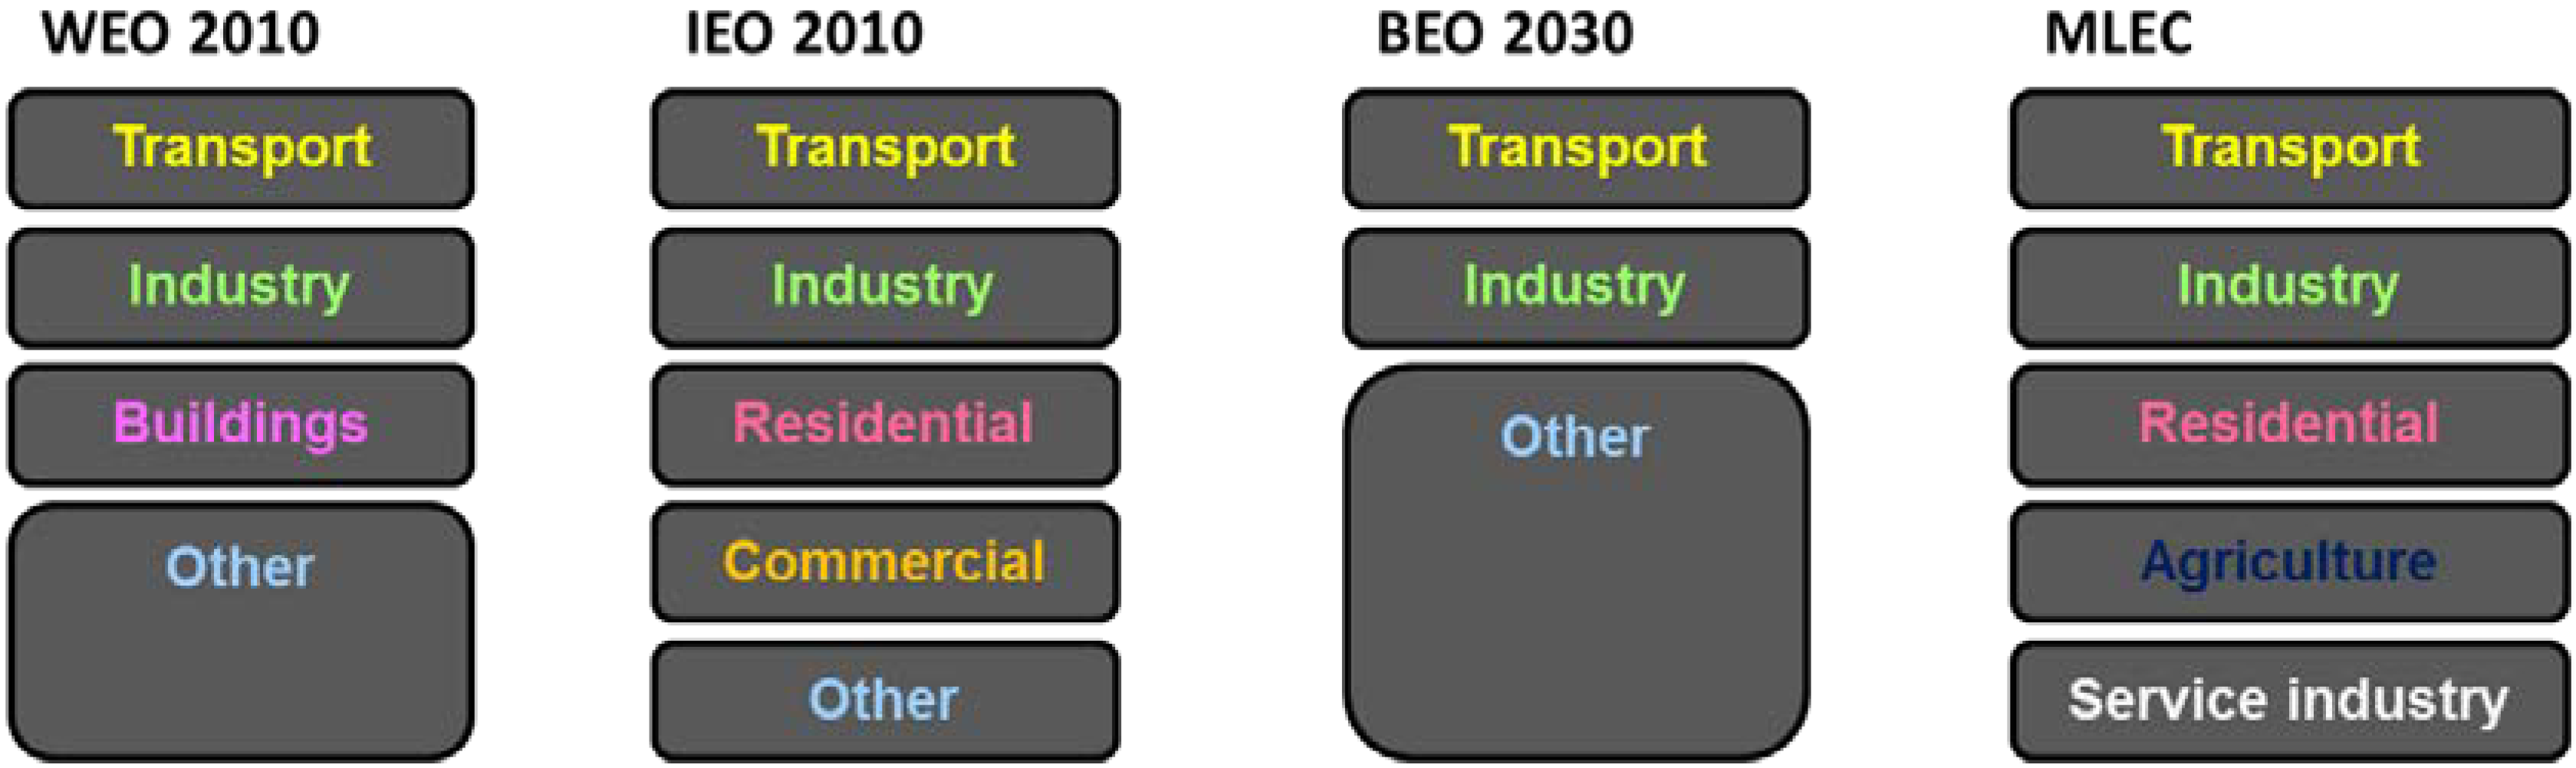
2.1. World Energy Outlook 2010
- (1)
- Global energy prospects: including trends of demand, supply availability and constraints, international trade and energy balances by sector and by fuel type to 2035;
- (2)
- Environmental impacts of energy use: CO2 emissions are derived from detailed projections of energy consumption;
- (3)
- Effects of policy and technology improvement on both the supply and demand sides;
- (4)
- Investment in the energy sector: evaluating investment required for the entire energy supply, conversion, and consumption chain to meet the energy demand up to 2035.
2.2. International Energy Outlook 2010
2.3. BP Energy Outlook 2030
2.4. The Mid-Term and Long-Term Energy Development Strategy of China (2030, 2050)
3. Policy Assumptions

| Report | Scenario | Policy Assumptions |
|---|---|---|
| WEO 2010 (IEA) [7] | Current Policies Scenario | Serve as a baseline against which the impact of new policies can be assessed. |
| No change in policies is assumed: | ||
| Takes into account those measures that governments had formally adopted by the middle of 2010 in response to and in pursuit of energy and environmental policies. | ||
| Takes no account of any future changes in government policies. | ||
| Does not include measures to meet any energy or climate policy targets or commitments that have not yet been adopted or fully implemented. | ||
| New Policies Scenario | Overall targets and policies: | |
| 40% reduction in CO2 intensity by 2020 compared with 2005 (2009). | ||
| Rebalancing of the economy from industry towards services (2009). | ||
| Further implementation of the directives of the Renewable Energy Law (2005). | ||
| Detailed sector policies of power, transport, industry and building sectors. | ||
| IEO 2010 (EIA) [8] | 450 Scenario | Overall targets and policies: |
| 45% reduction in CO2 intensity by 2020 compared with 2005. | ||
| 15% share of non-fossil energy in primary energy consumption by 2020. | ||
| Detailed sector policies of power, transport, industry and building sectors. | ||
| Based to the extent possible on U.S. and foreign laws, regulations, and standards in effect at the start of 2010. | ||
| The potential impacts of pending or proposed legislation, regulations, and standards are not reflected in the projections, nor are the impacts of legislation for which the implementing mechanisms have not yet been announced. | ||
| Mechanisms whose implementation cannot be modeled given current capabilities or whose impacts on the energy sector are unclear are not included. | ||
| IEO2010 [8] focuses exclusively on marketed energy. | ||
| Non-marketed energy sources, which continue to play an important role in some developing countries, are not included in the estimates. | ||
| BP Energy Outlook 2030 (BP) [9] | “To the best of knowledge” | Assumptions on changes in policy, technology and the economy are based on extensive internal and external consultations. |
| The Mid-term and Long-term Energy Development Strategy of China (“MLEC” for short) (CAE) [10] | Save energy and control the total energy consumption. | |
| Utilize coal in a scientific, clean and high-efficient way. | ||
| Assure the strategic positions of oil and natural gas, consider natural gas as one of the key resources to adjust the energy structure. | ||
| Accelerate the development of hydro power and other renewable energy. | ||
| Take great efforts to develop nuclear power. | ||
| Develop smart-grid systems. | ||
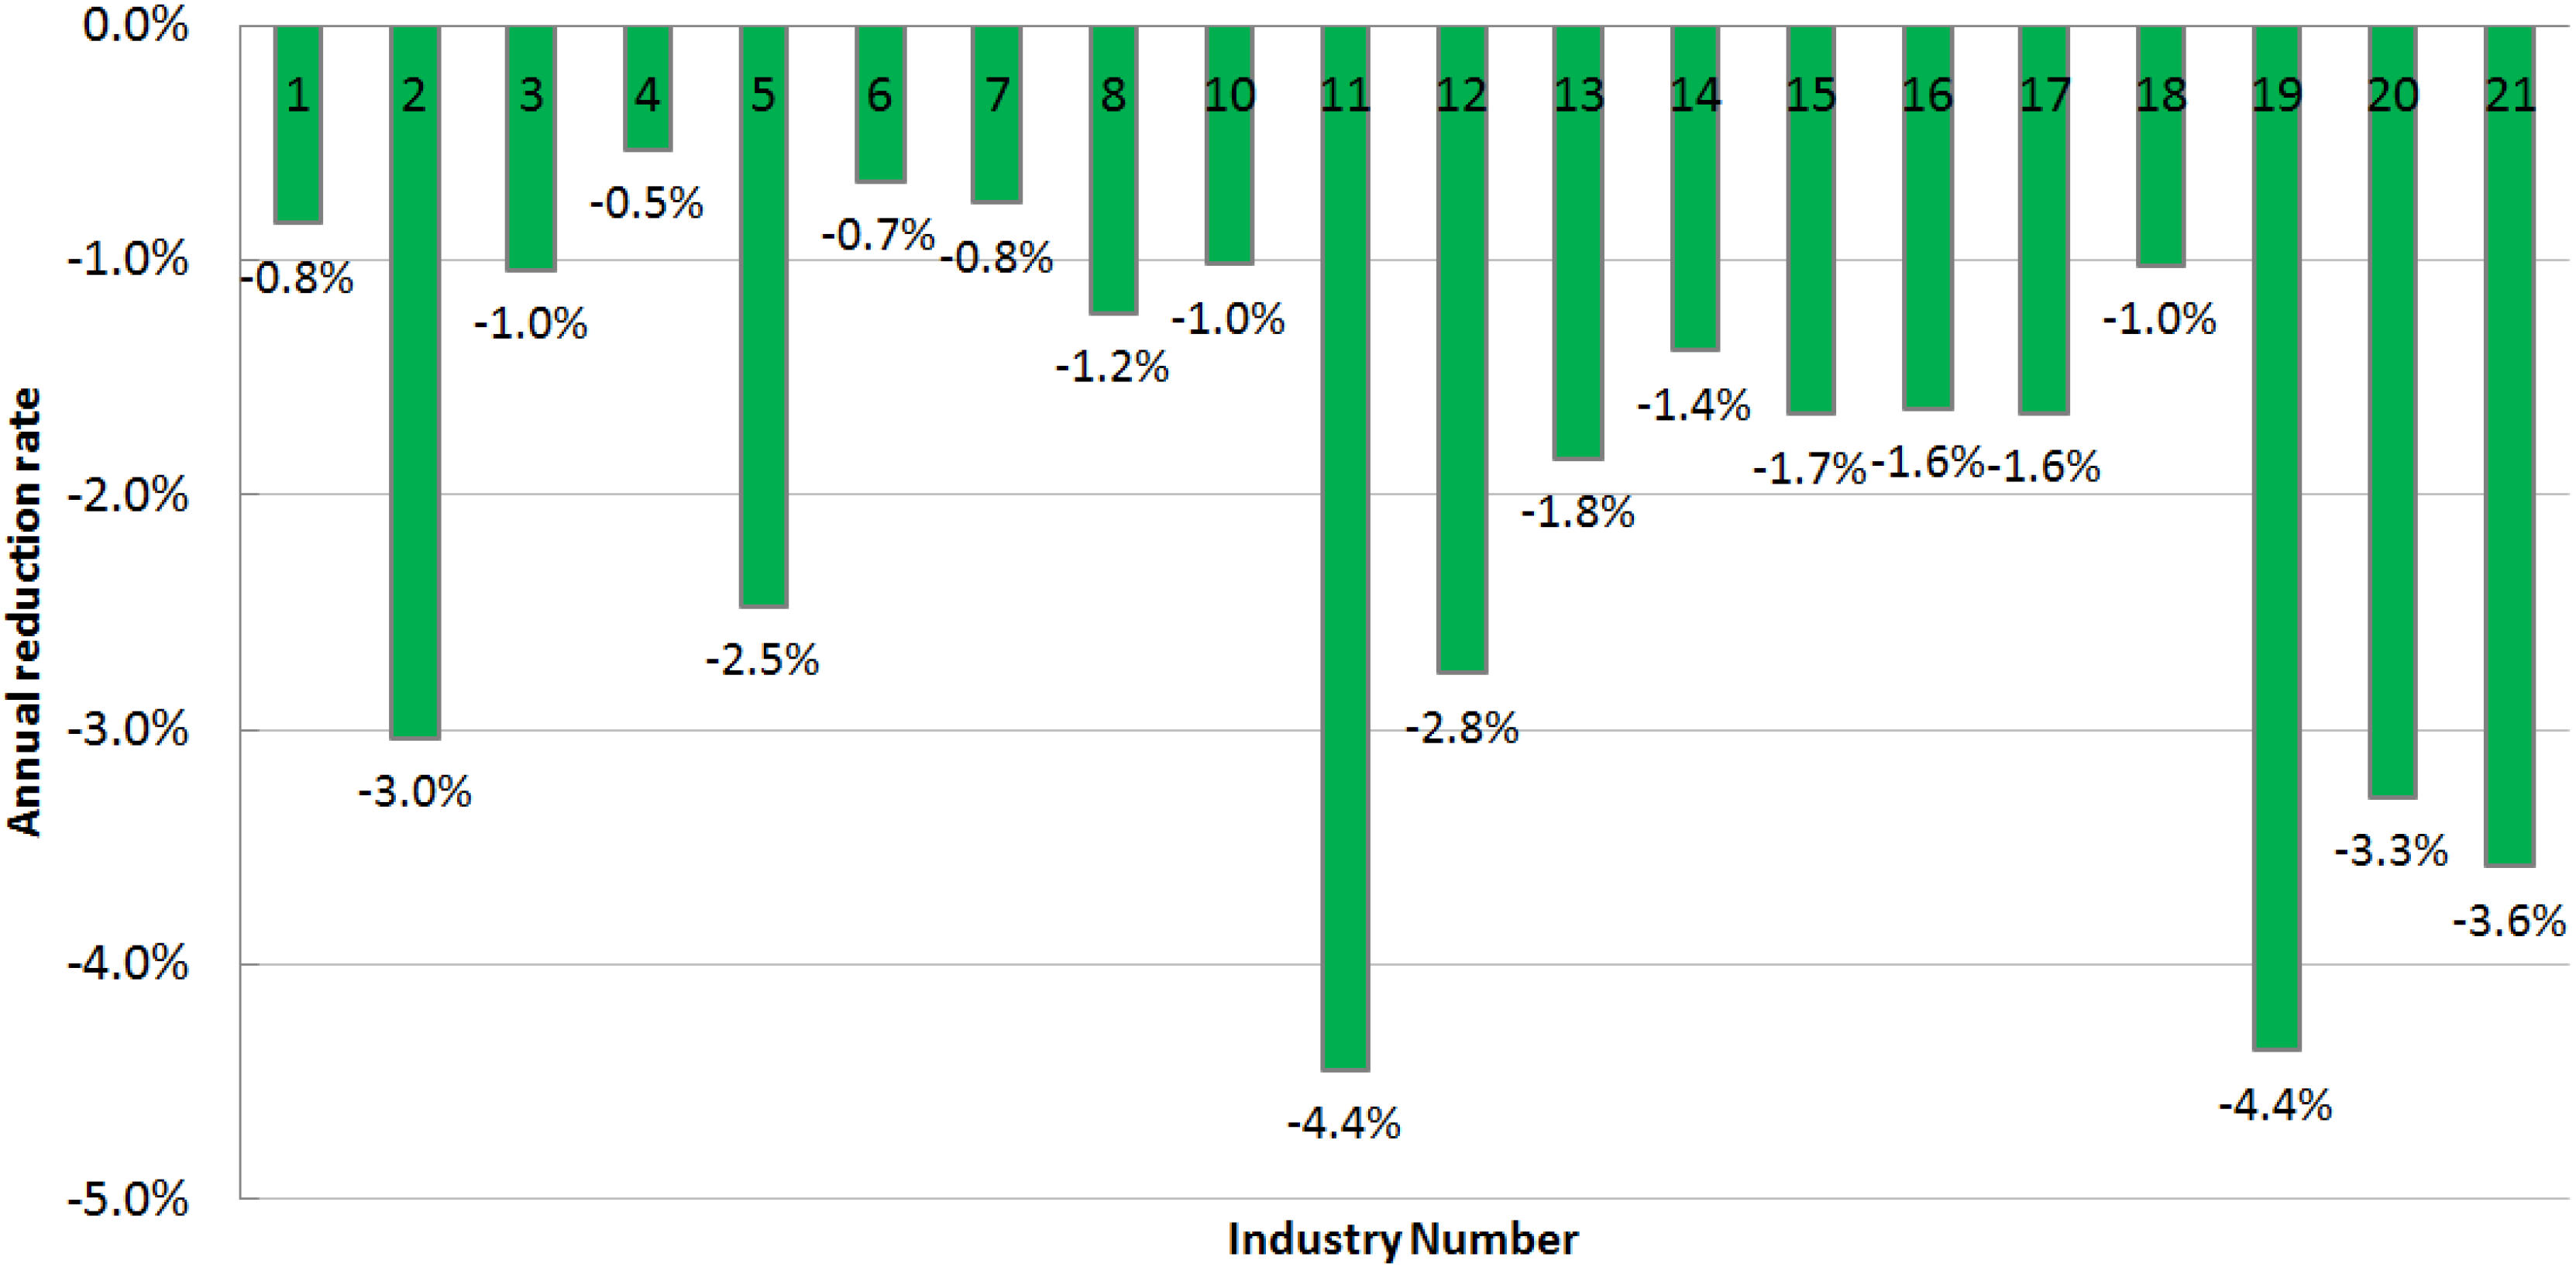
| No. | Industry | Unit | 2010 | 2015 |
|---|---|---|---|---|
| 1 | Steel production | kgce/t | 605 | 580 |
| 2 | Copper metallurgy | kgce/t | 350 | 300 |
| 3 | Aluminum metallurgy | kWh/t | 14,013 | 13,300 |
| 4 | Cement production | kgce/t | 115 | 112 |
| 5 | Flat glass production | kgce/loaded van | 17 | 15 |
| 6 | Ethylene production | kgce/t | 886 | 857 |
| 7 | Synthetic ammonia production | kgce/t | 1,402 | 1,350 |
| 8 | Sodium hydroxide production (Membrane process, 30%) | kgce/t | 351 | 330 |
| 9 | Sodium carbonate production | kgce/t | 320 | |
| 10 | Calcium carbide production | kgce/t | 1,105 | 1,050 |
| 11 | Paper industry | kgce/t | 1,130 | 900 |
| 12 | Household glass production | kgce/t | 437 | 380 |
| 13 | Fermented product | kgce/t | 900 | 820 |
| 14 | Domestic ceramic production | kgce/t | 1,190 | 1,110 |
| 15 | Dyeing cloth | kgce/104 m | 2,298 | 2,114 |
| 16 | Yarn production | kgce/t | 368 | 339 |
| 17 | Cloth production | Kgce/104 m | 1,817 | 1,672 |
| 18 | Viscose fiber production (filament) | kgce/t | 4,713 | 4,477 |
| 19 | Casting production | kgce/t qualified castings | 600 | 480 |
| 20 | Polycrystalline silicon production (high-temperature hydrogenation) | kgce/t | 39,000 | 33,000 |
| 21 | Polycrystalline silicon production (low-temperature hydrogenation) | kgce/t | 36,000 | 30,000 |


4. Technical Accuracy


5. Scenario Settings
5.1. General Scenario Settings in Different Scenarios
| Criteria | Year | WEO 2010 (IEA) [7] | IEO 2010 (EIA) [8] | BP Energy Outlook 2030 (BP) [9] | MLEC (CAE) [10] | ||||
|---|---|---|---|---|---|---|---|---|---|
| Reference Case | High Economic Growth Scenario | Low Economic Growth Scenario | High Oil Price Scenario | Low Oil Price Scenario | |||||
| Prediction horizon | - | 2008–2035 | 2007–2035 | 2010–2030 | 2010–2050 | ||||
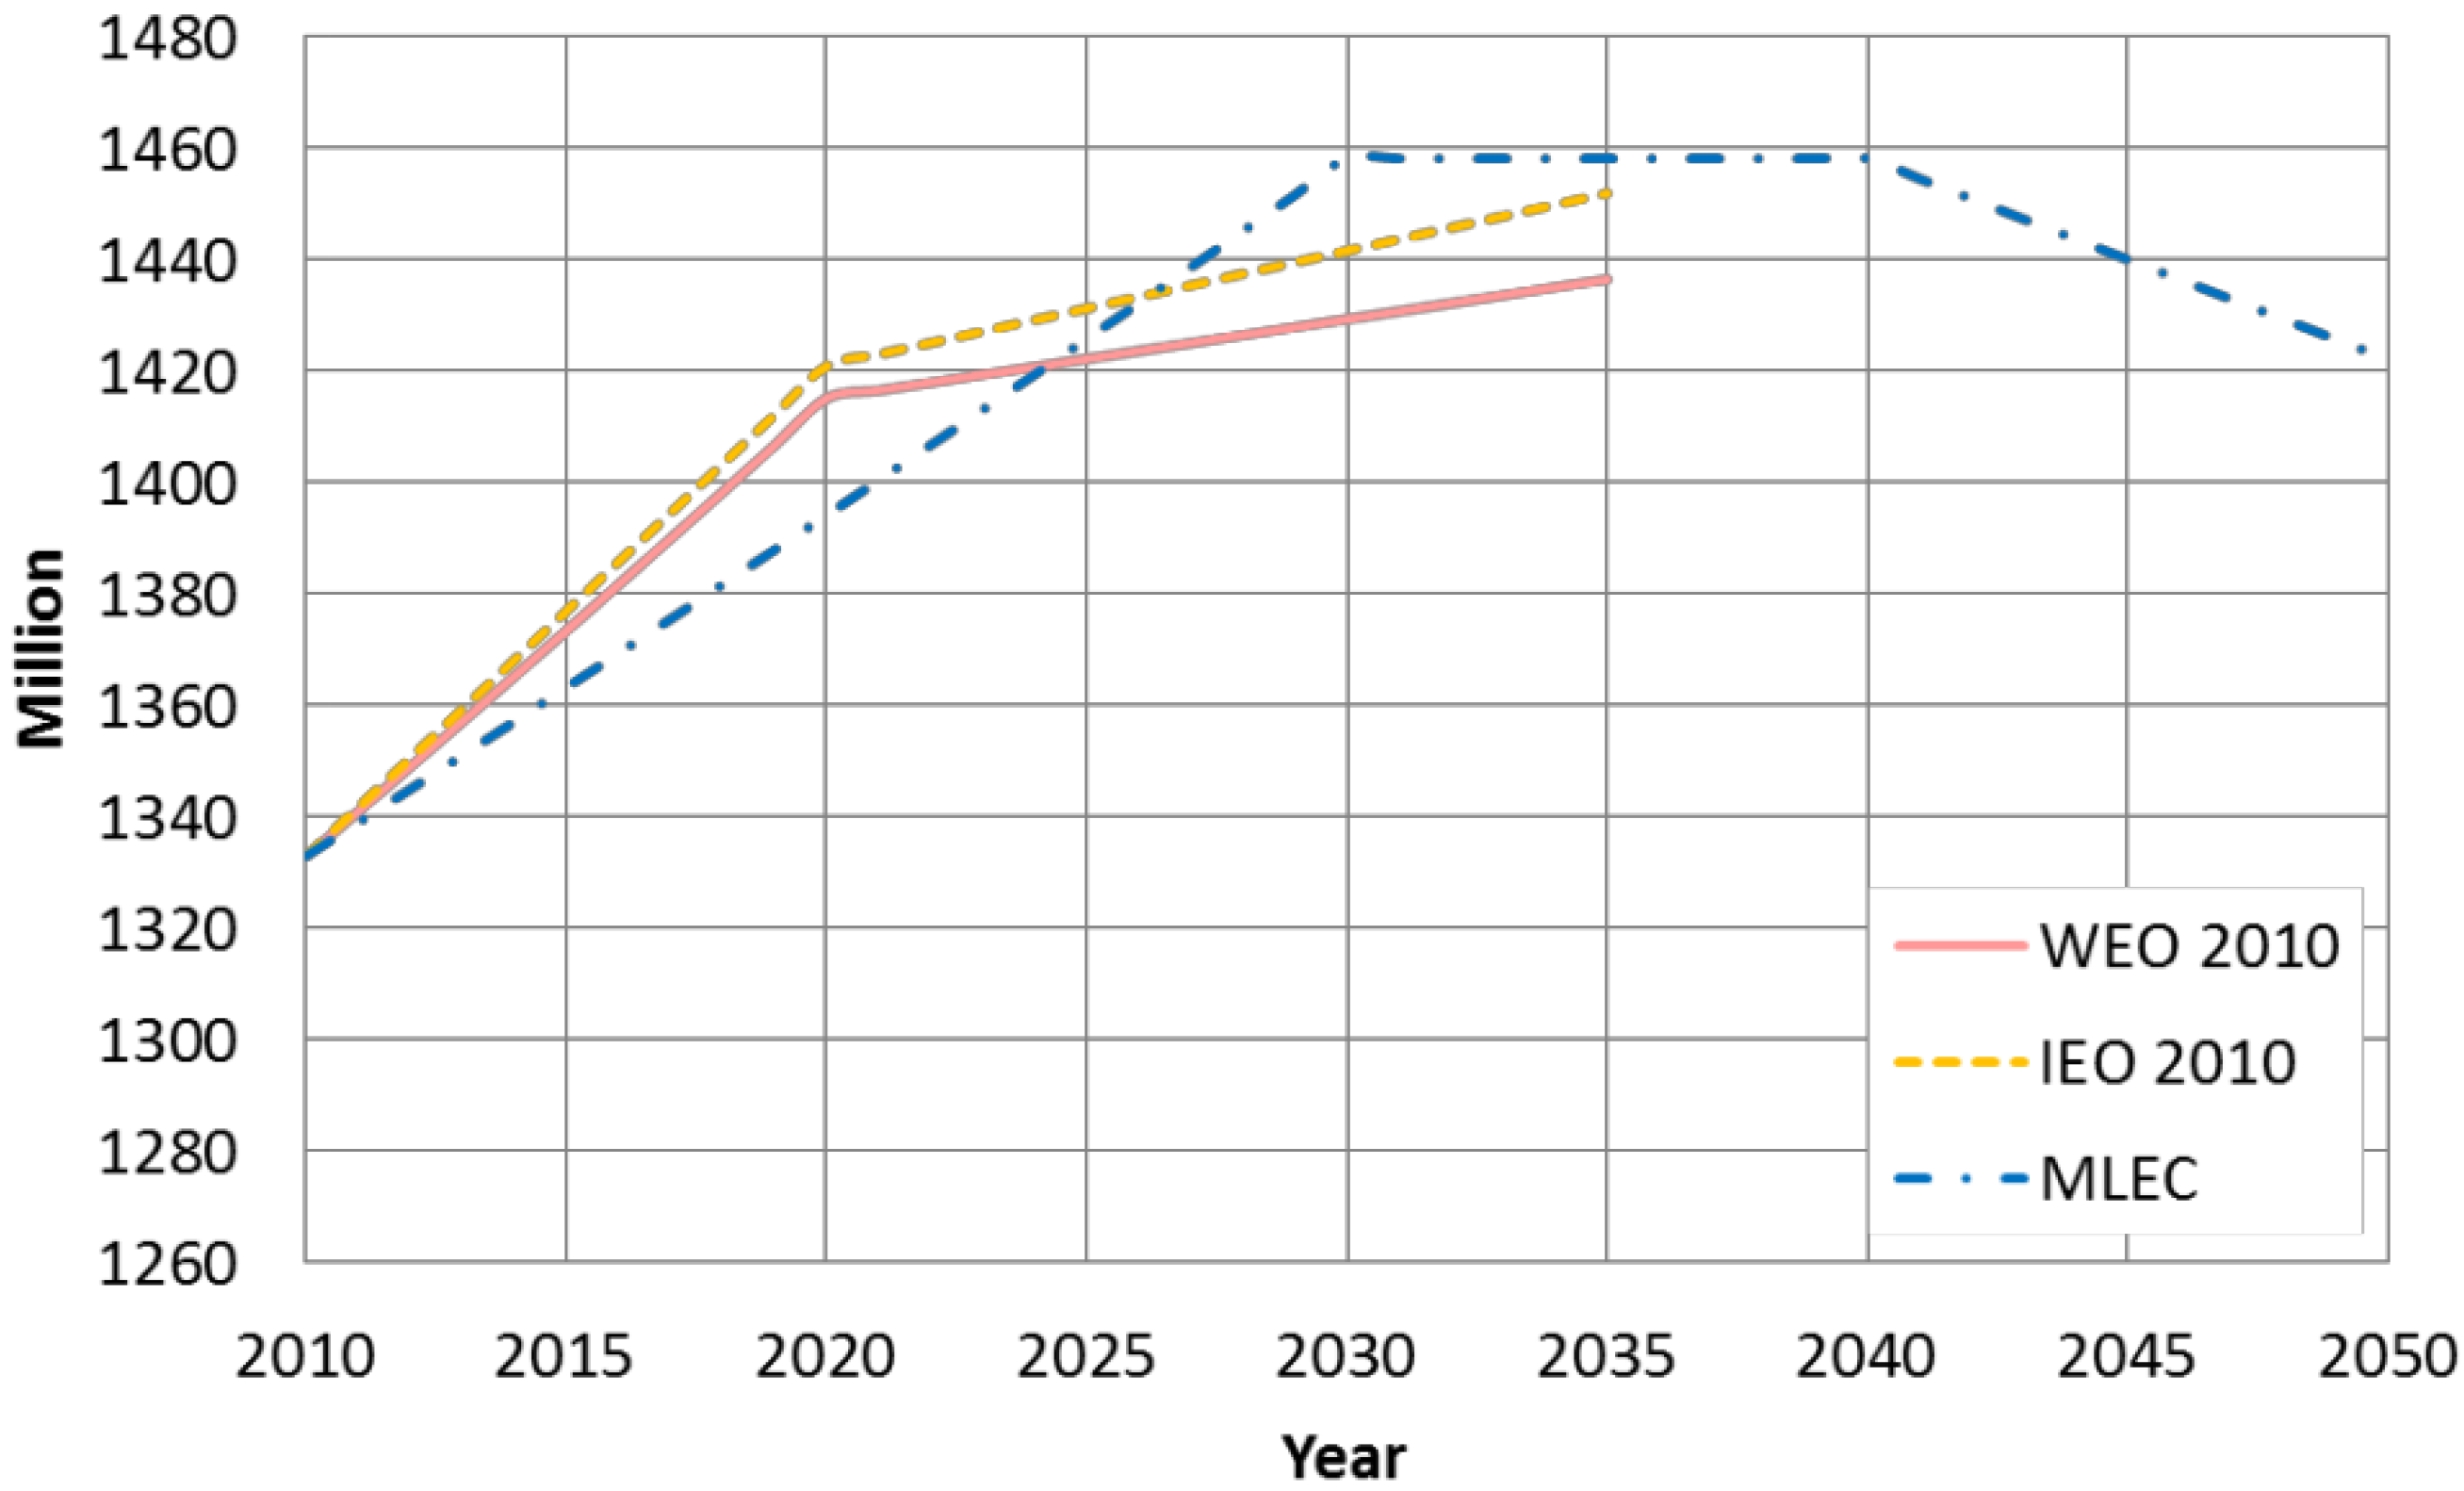
| Population (millions) | 2020 | 1,421 | 1,415 | - | 1,394 | ||||
| 2030 | 1,442 | 1,429 | - | 1,458 | |||||
| 2035 | 1,452 | 1,437 | - | 1,458 | |||||
| 2050 | - | - | 1,422 | ||||||
| Annual growth rate (%) | - | 2010–2035: 0.34 | 2010–2035: 0.30 | - | 2010–2030: 0.45 | ||||
| 2030–2040: 0 | |||||||||
| 2040–2050: −0.25 | |||||||||
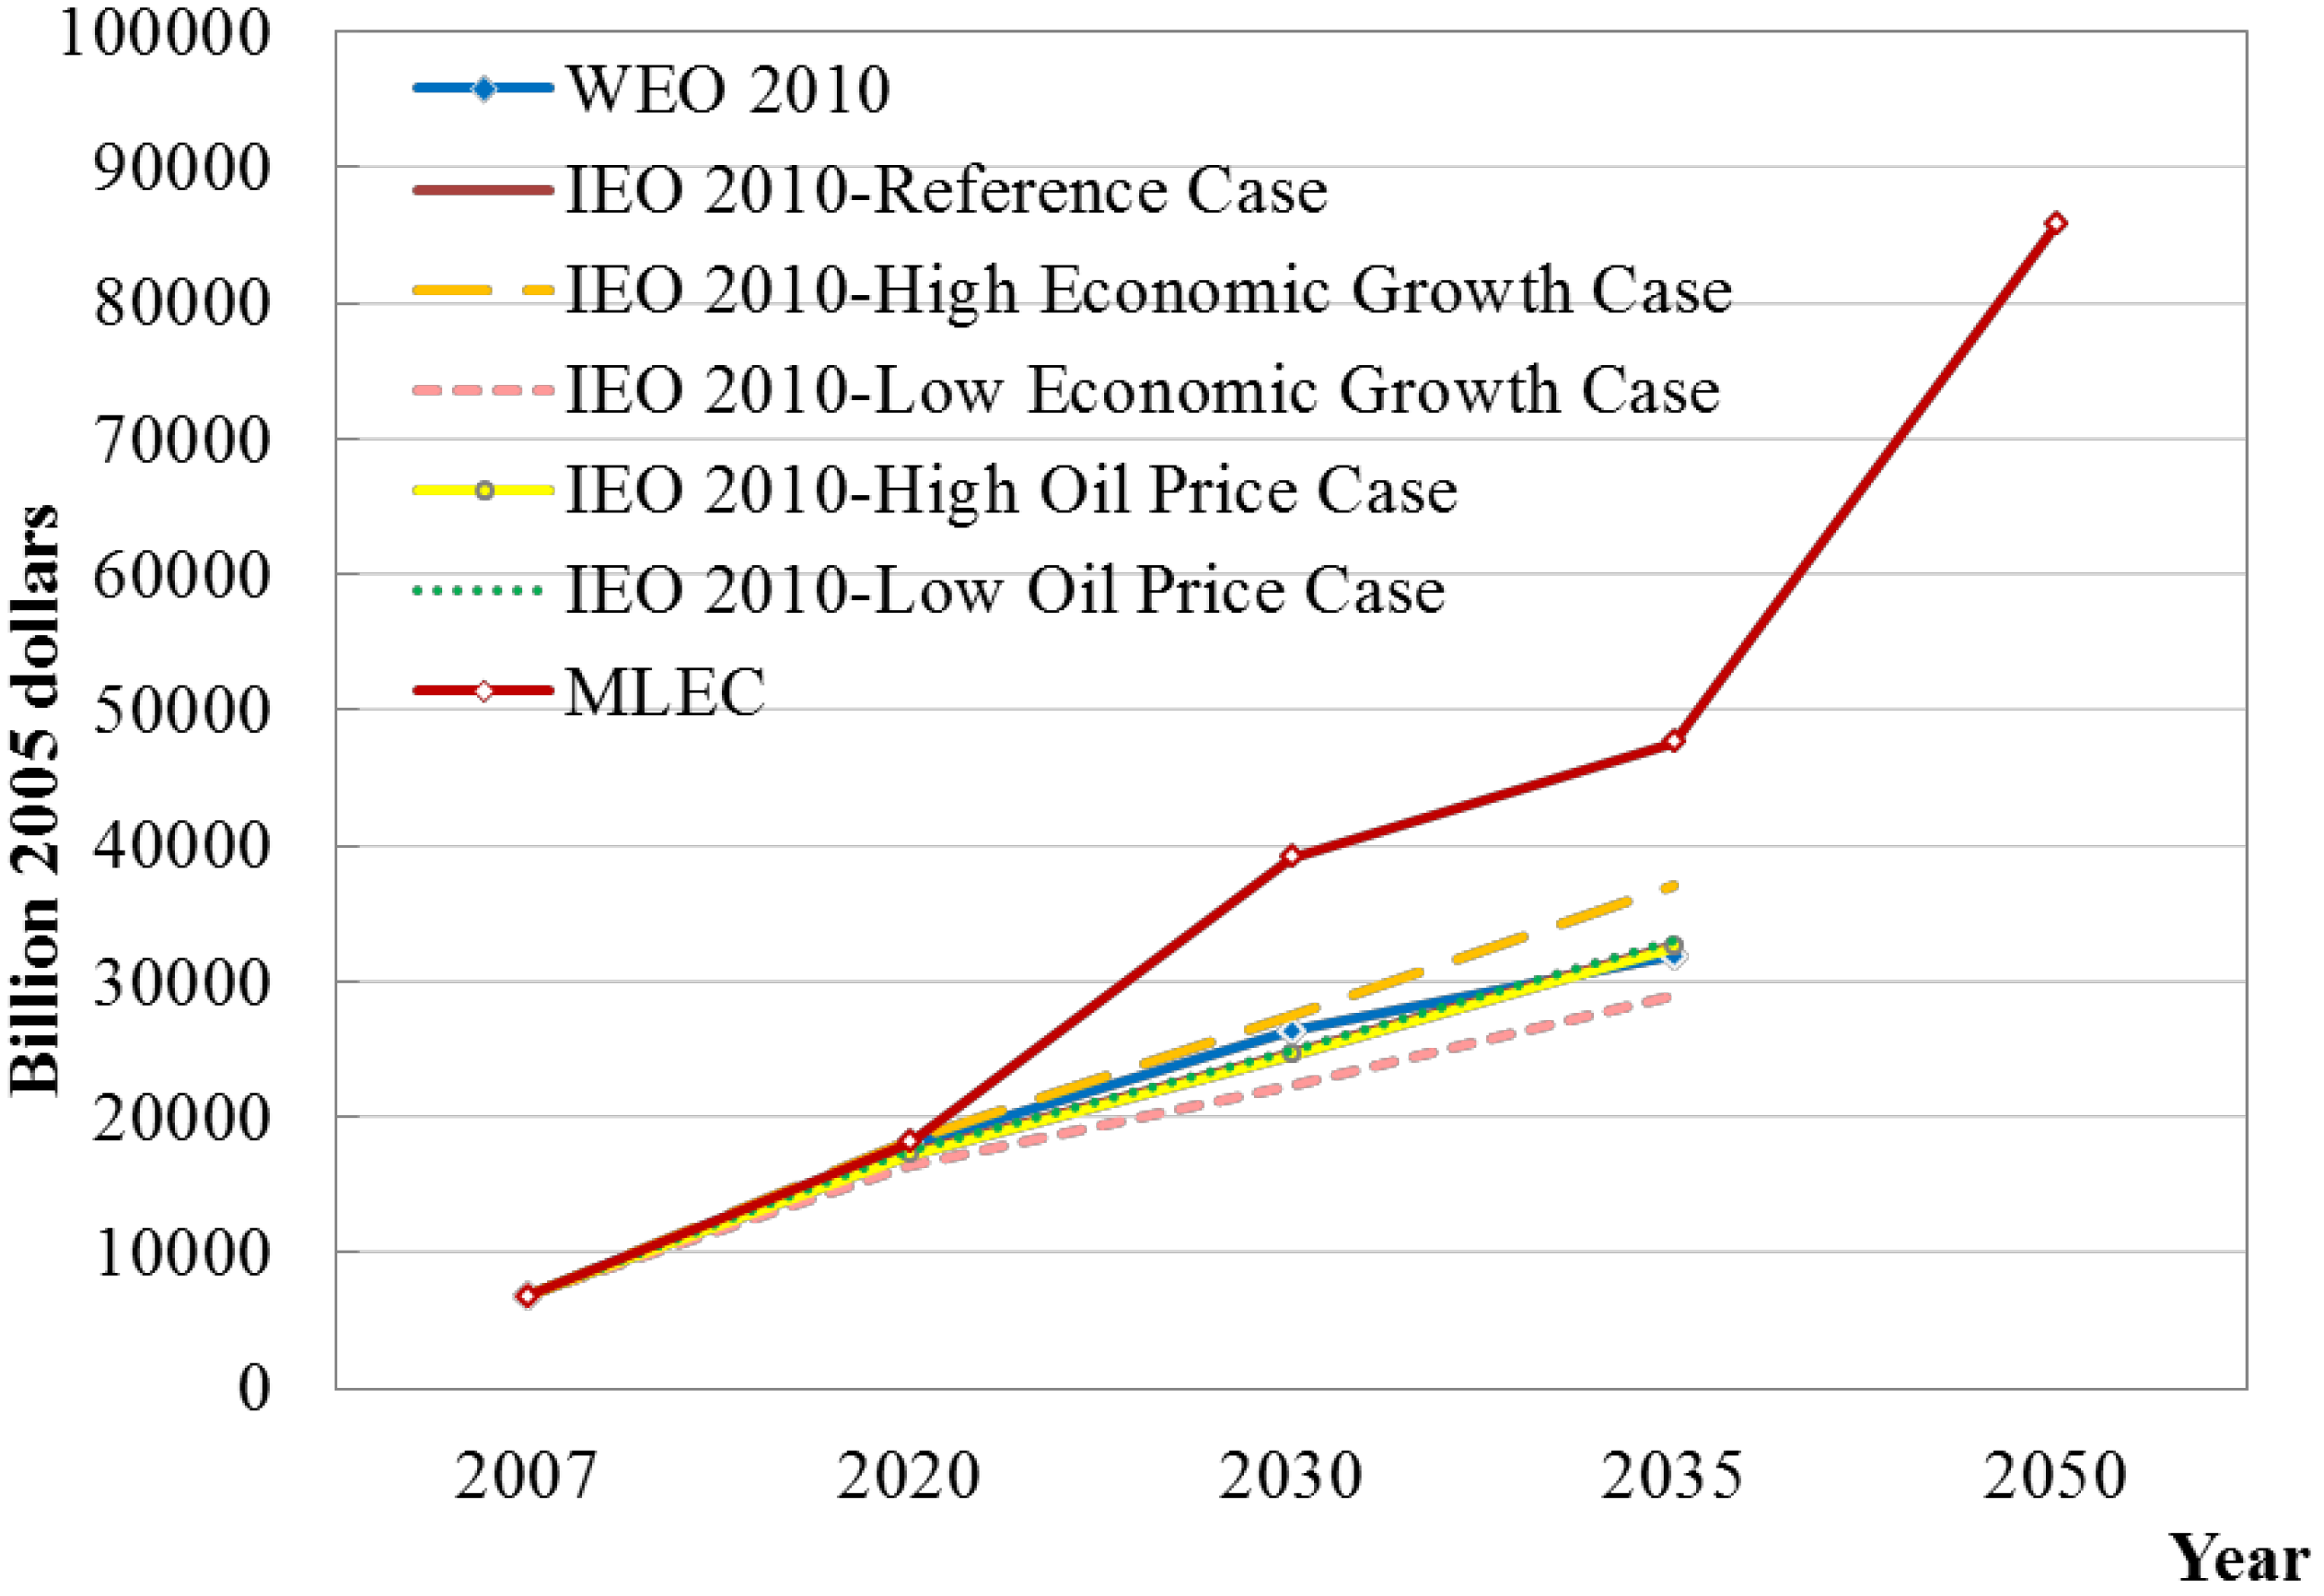
| GDP (Billion 2005 dollars) | 2020 | 17,969 | 17,353 | 18,264 | 16,483 | 17,204 | 17,499 | - | 18,136 |
| 2030 | 26,344 | 24,709 | 27,418 | 22,362 | 24,627 | 24,936 | - | 39,155 | |
| 2035 | 31,898 | 32,755 | 37,039 | 28,950 | 32,493 | 33,056 | - | 47,638 | |
| 2050 | - | - | - | - | - | - | - | 85,793 | |
| Annual growth rate (%) | - | 2010–2035: 5.7 | 2010–2035: 5.8 | 2010–2035: 6.2 | 2010–2035: 5.3 | 2010–2035: 5.7 | 2010–2035: 5.8 | - | 2010–2030: 8 |
| 2030–2050: 4 | |||||||||


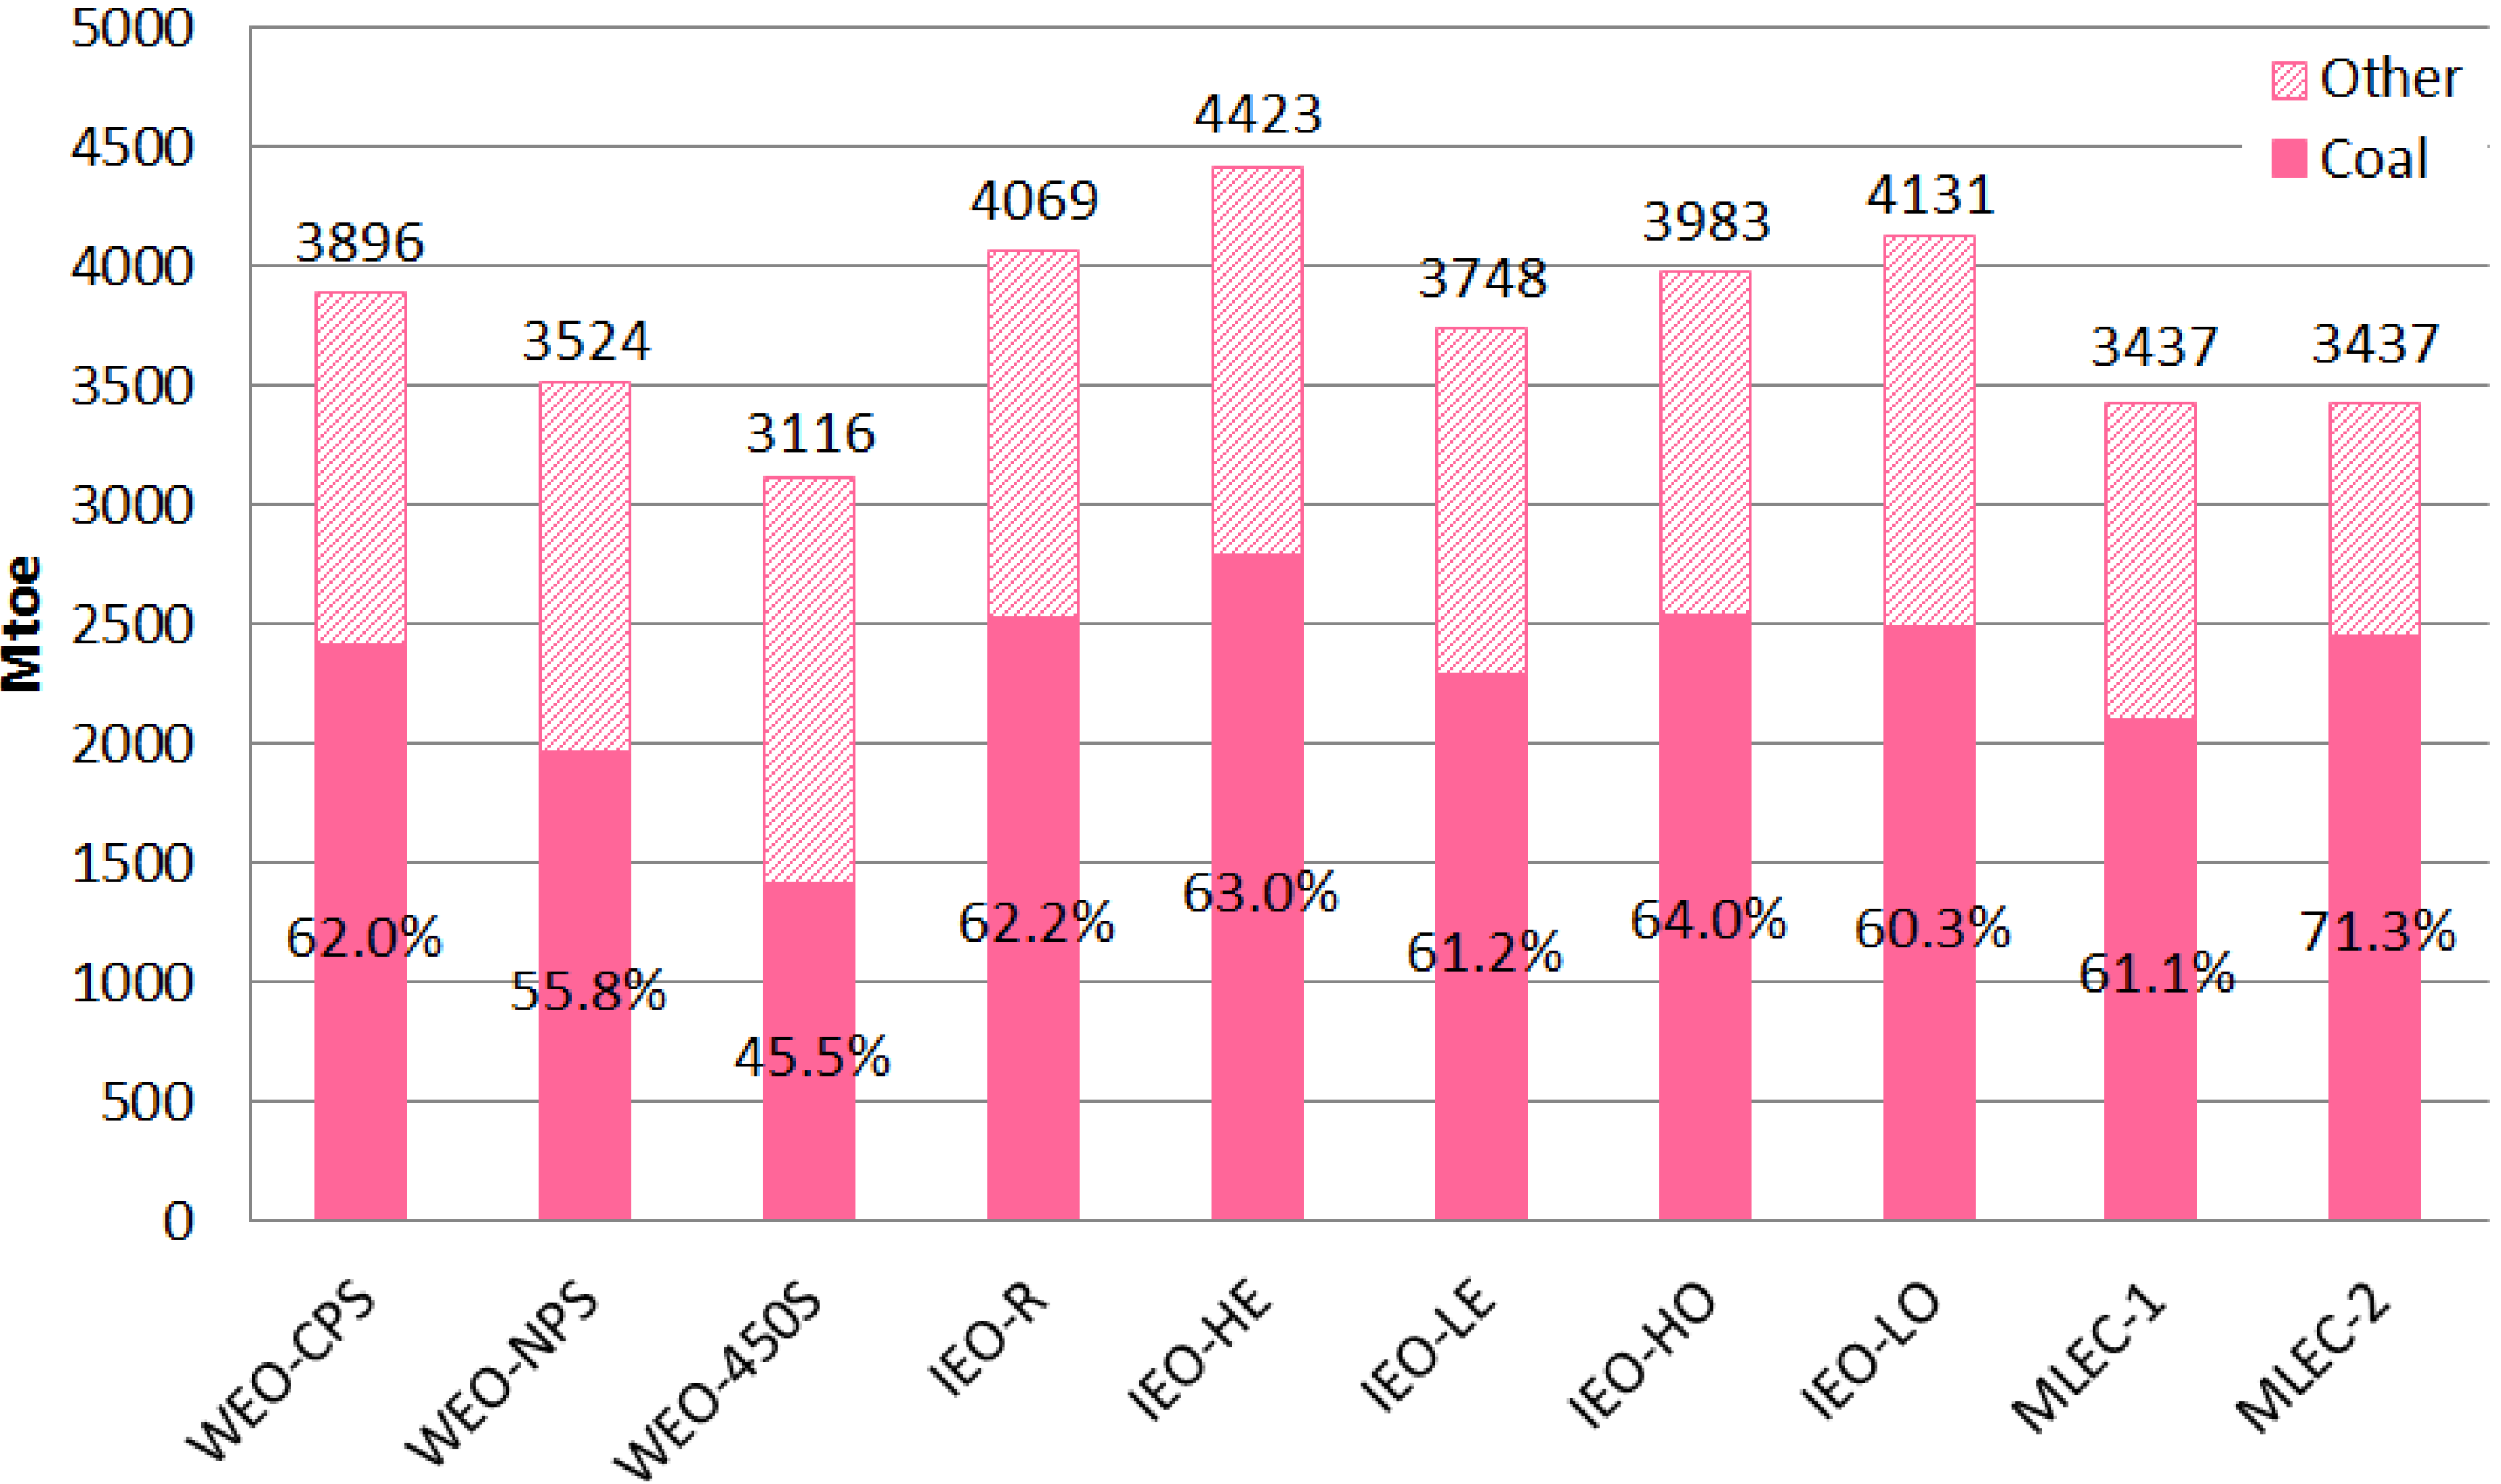
| Scenario | Region | 2009 | 2020 | 2030 | 2035 |
|---|---|---|---|---|---|
| New Policies Scenario | European Union | 22 | 38 | 46 | 50 |
| Japan | n.a. | 20 | 40 | 50 | |
| Other OECD | n.a. | - | 40 | 50 | |
| Current Policies Scenario | European Union | 22 | 30 | 37 | 42 |
| 450 Scenario | OECD+ | n.a. | 45 | 105 | 120 |
| Other Major Economies | n.a. | - | 63 | 90 |
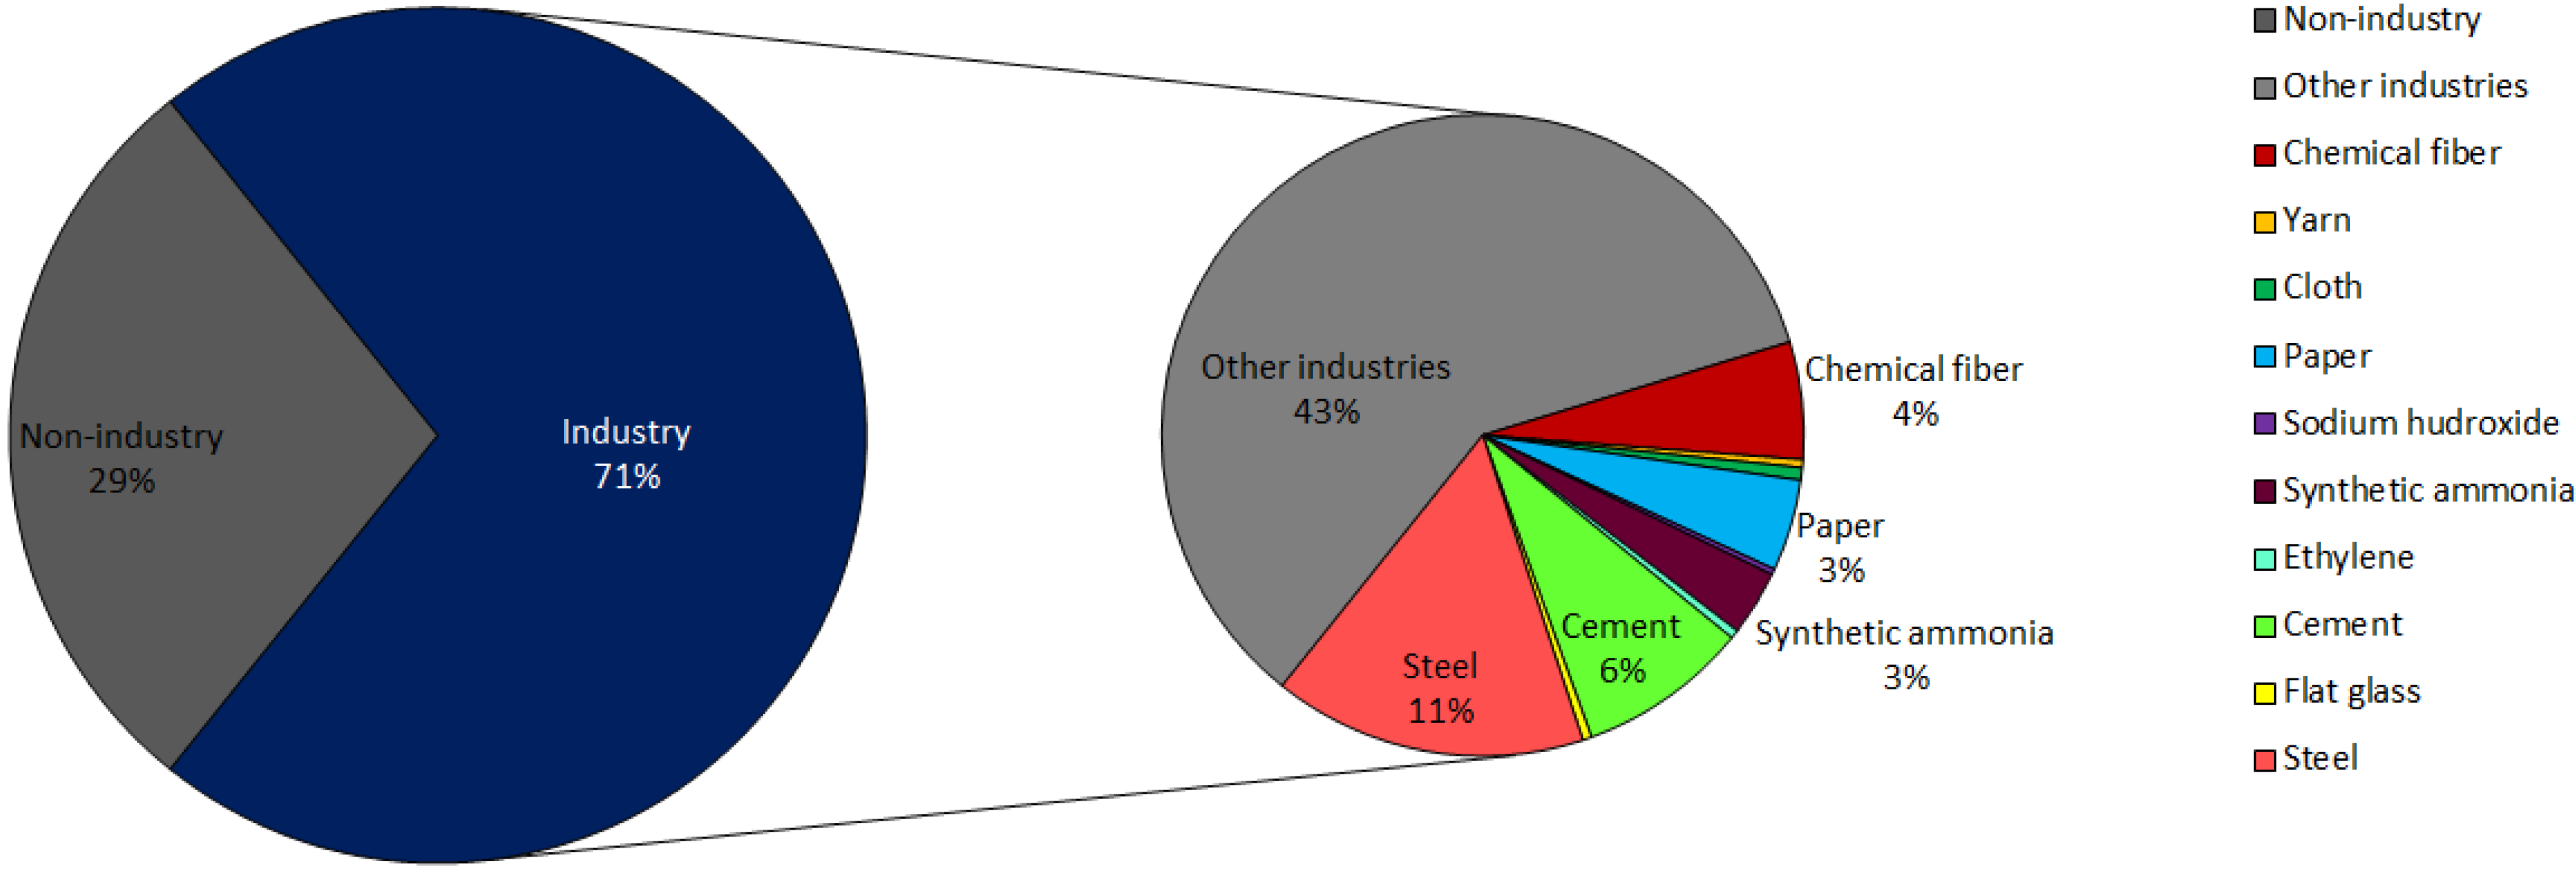
5.2. Specific Scenario Settings of the Chinese Academy of Engineering


6. Index Decomposition Analysis
6.1. Index Decomposition Methodology
- Et = Total industrial energy consumption;
- Ei,t = Energy consumption in industrial sector i;
- Yt = Total industrial production;
- Yi,t = Production of industrial sector i;
- Si,t = Production share of sector i (= Yi,t/Yt);
- It = Aggregate energy intensity (= Et/Yt);
- Ii,t = Energy intensity of sector i (= Ei,t/Yi,t);
6.2. Index Decomposition Method of National Energy Consumption and CO2 Emission
- It: Energy intensity of year t = Energy demand of year t/GDP of year t;
- P1t: per capita GDP of year t = GDP of year t/population of year t;
- P2t: per capita energy demand of year t = energy demand of year t/population of year t;
- a0, a1 and a2: regression coefficients.
6.3. Index Decomposition Results
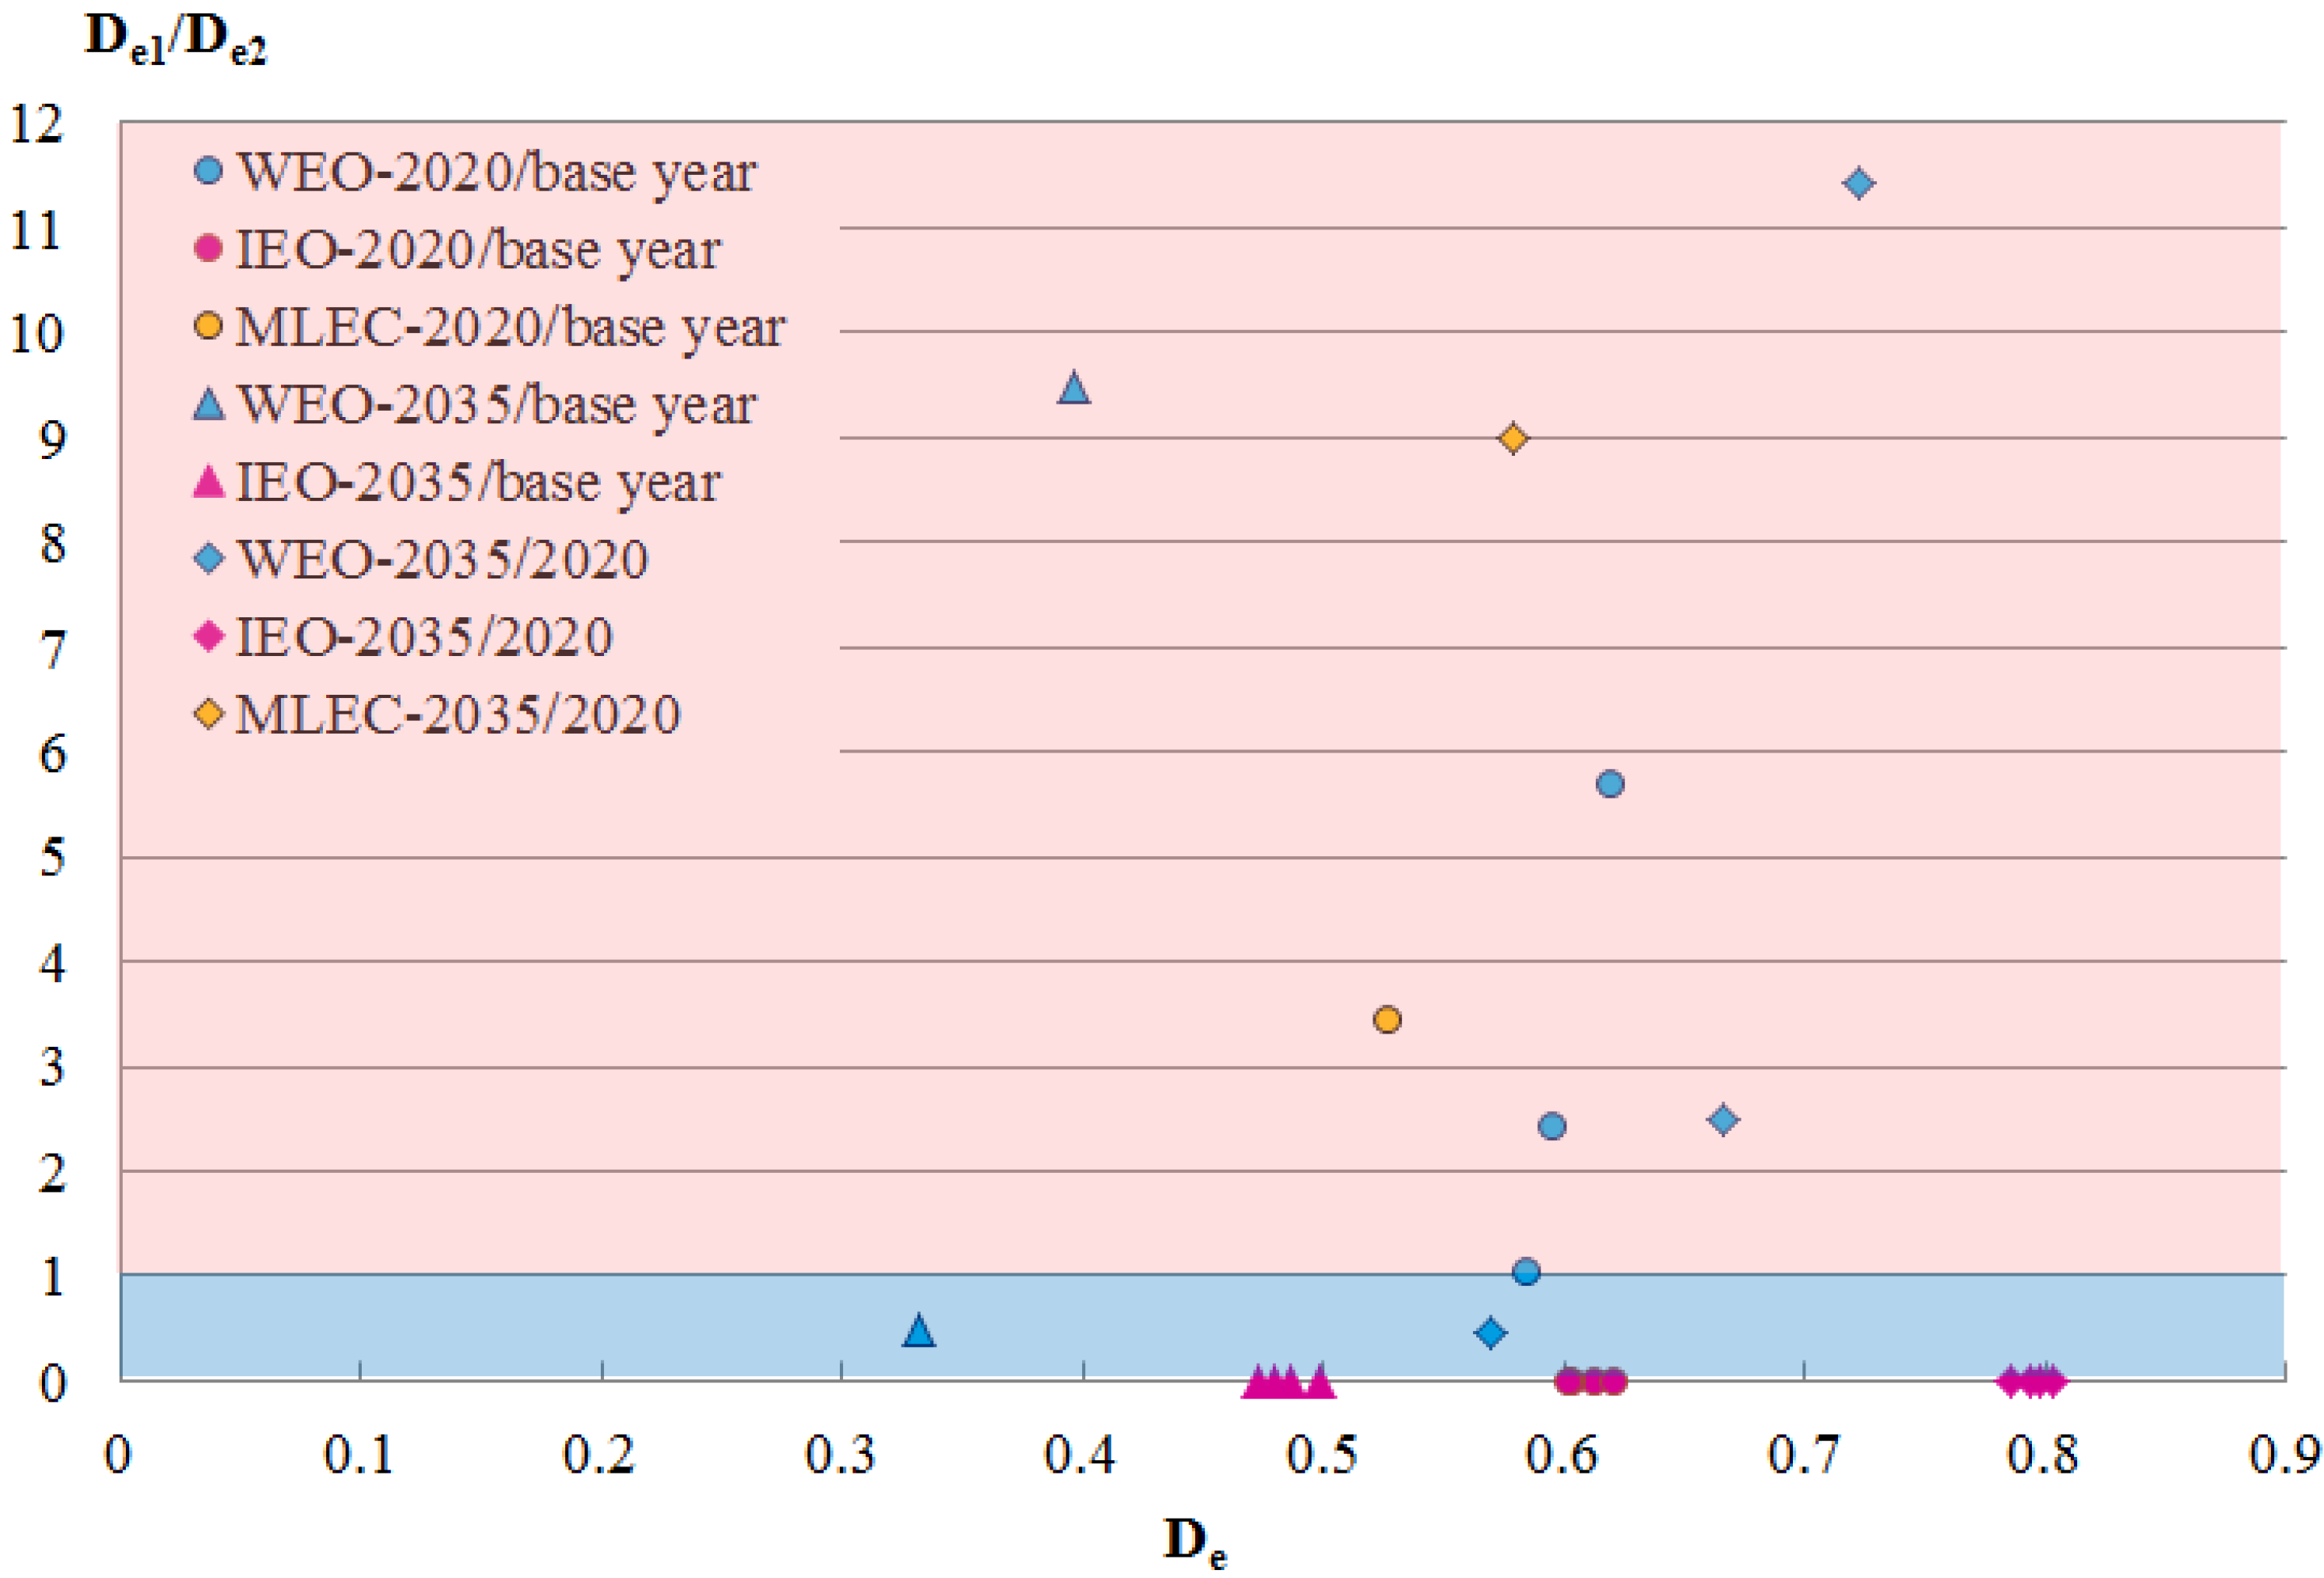
| Index Decomposition of Energy Intensity | 2020/base year | 2035/base year | 2035/2020 | ||||
|---|---|---|---|---|---|---|---|
| De | De1/De2 | De | De1/De2 | De | De1/De2 | ||
| WEO 2010 | CPS | 0.620 | 5.689 | 0.447 | 126.801 | 0.722 | 11.419 |
| NPS | 0.595 | 2.433 | 0.397 | 9.476 | 0.666 | 2.495 | |
| 450S | 0.584 | 1.052 | 0.332 | 0.503 | 0.570 | 0.460 | |
| IEO 2010 | RC | 0.612 | 5.31 × 10⁻¹⁶ | 0.486 | 1.31 × 10−48 | 0.794 | 2.29 × 10⁻²⁹ |
| HEGC | 0.603 | 6.77 × 10⁻³⁵ | 0.473 | 2.04 × 10−116 | 0.785 | 7.18 × 10−73 | |
| LEGC | 0.621 | 4.54 × 10⁻¹¹ | 0.499 | 1.35 × 10⁻³⁰ | 0.803 | 1.01 × 10⁻¹⁷ | |
| HOPC | 0.602 | 1.08 × 10−05 | 0.480 | 1.34 × 10⁻¹⁶ | 0.797 | 2.29 × 10⁻¹⁰ | |
| LOPC | 0.619 | 1.63 × 10¹⁵ | 0.488 | 1.20 × 1047 | 0.789 | 6.27 × 1027 | |
| MLEC | 0.526 | 3.452 | 0.305 | 76.375 | 0.579 | 8.980 | |
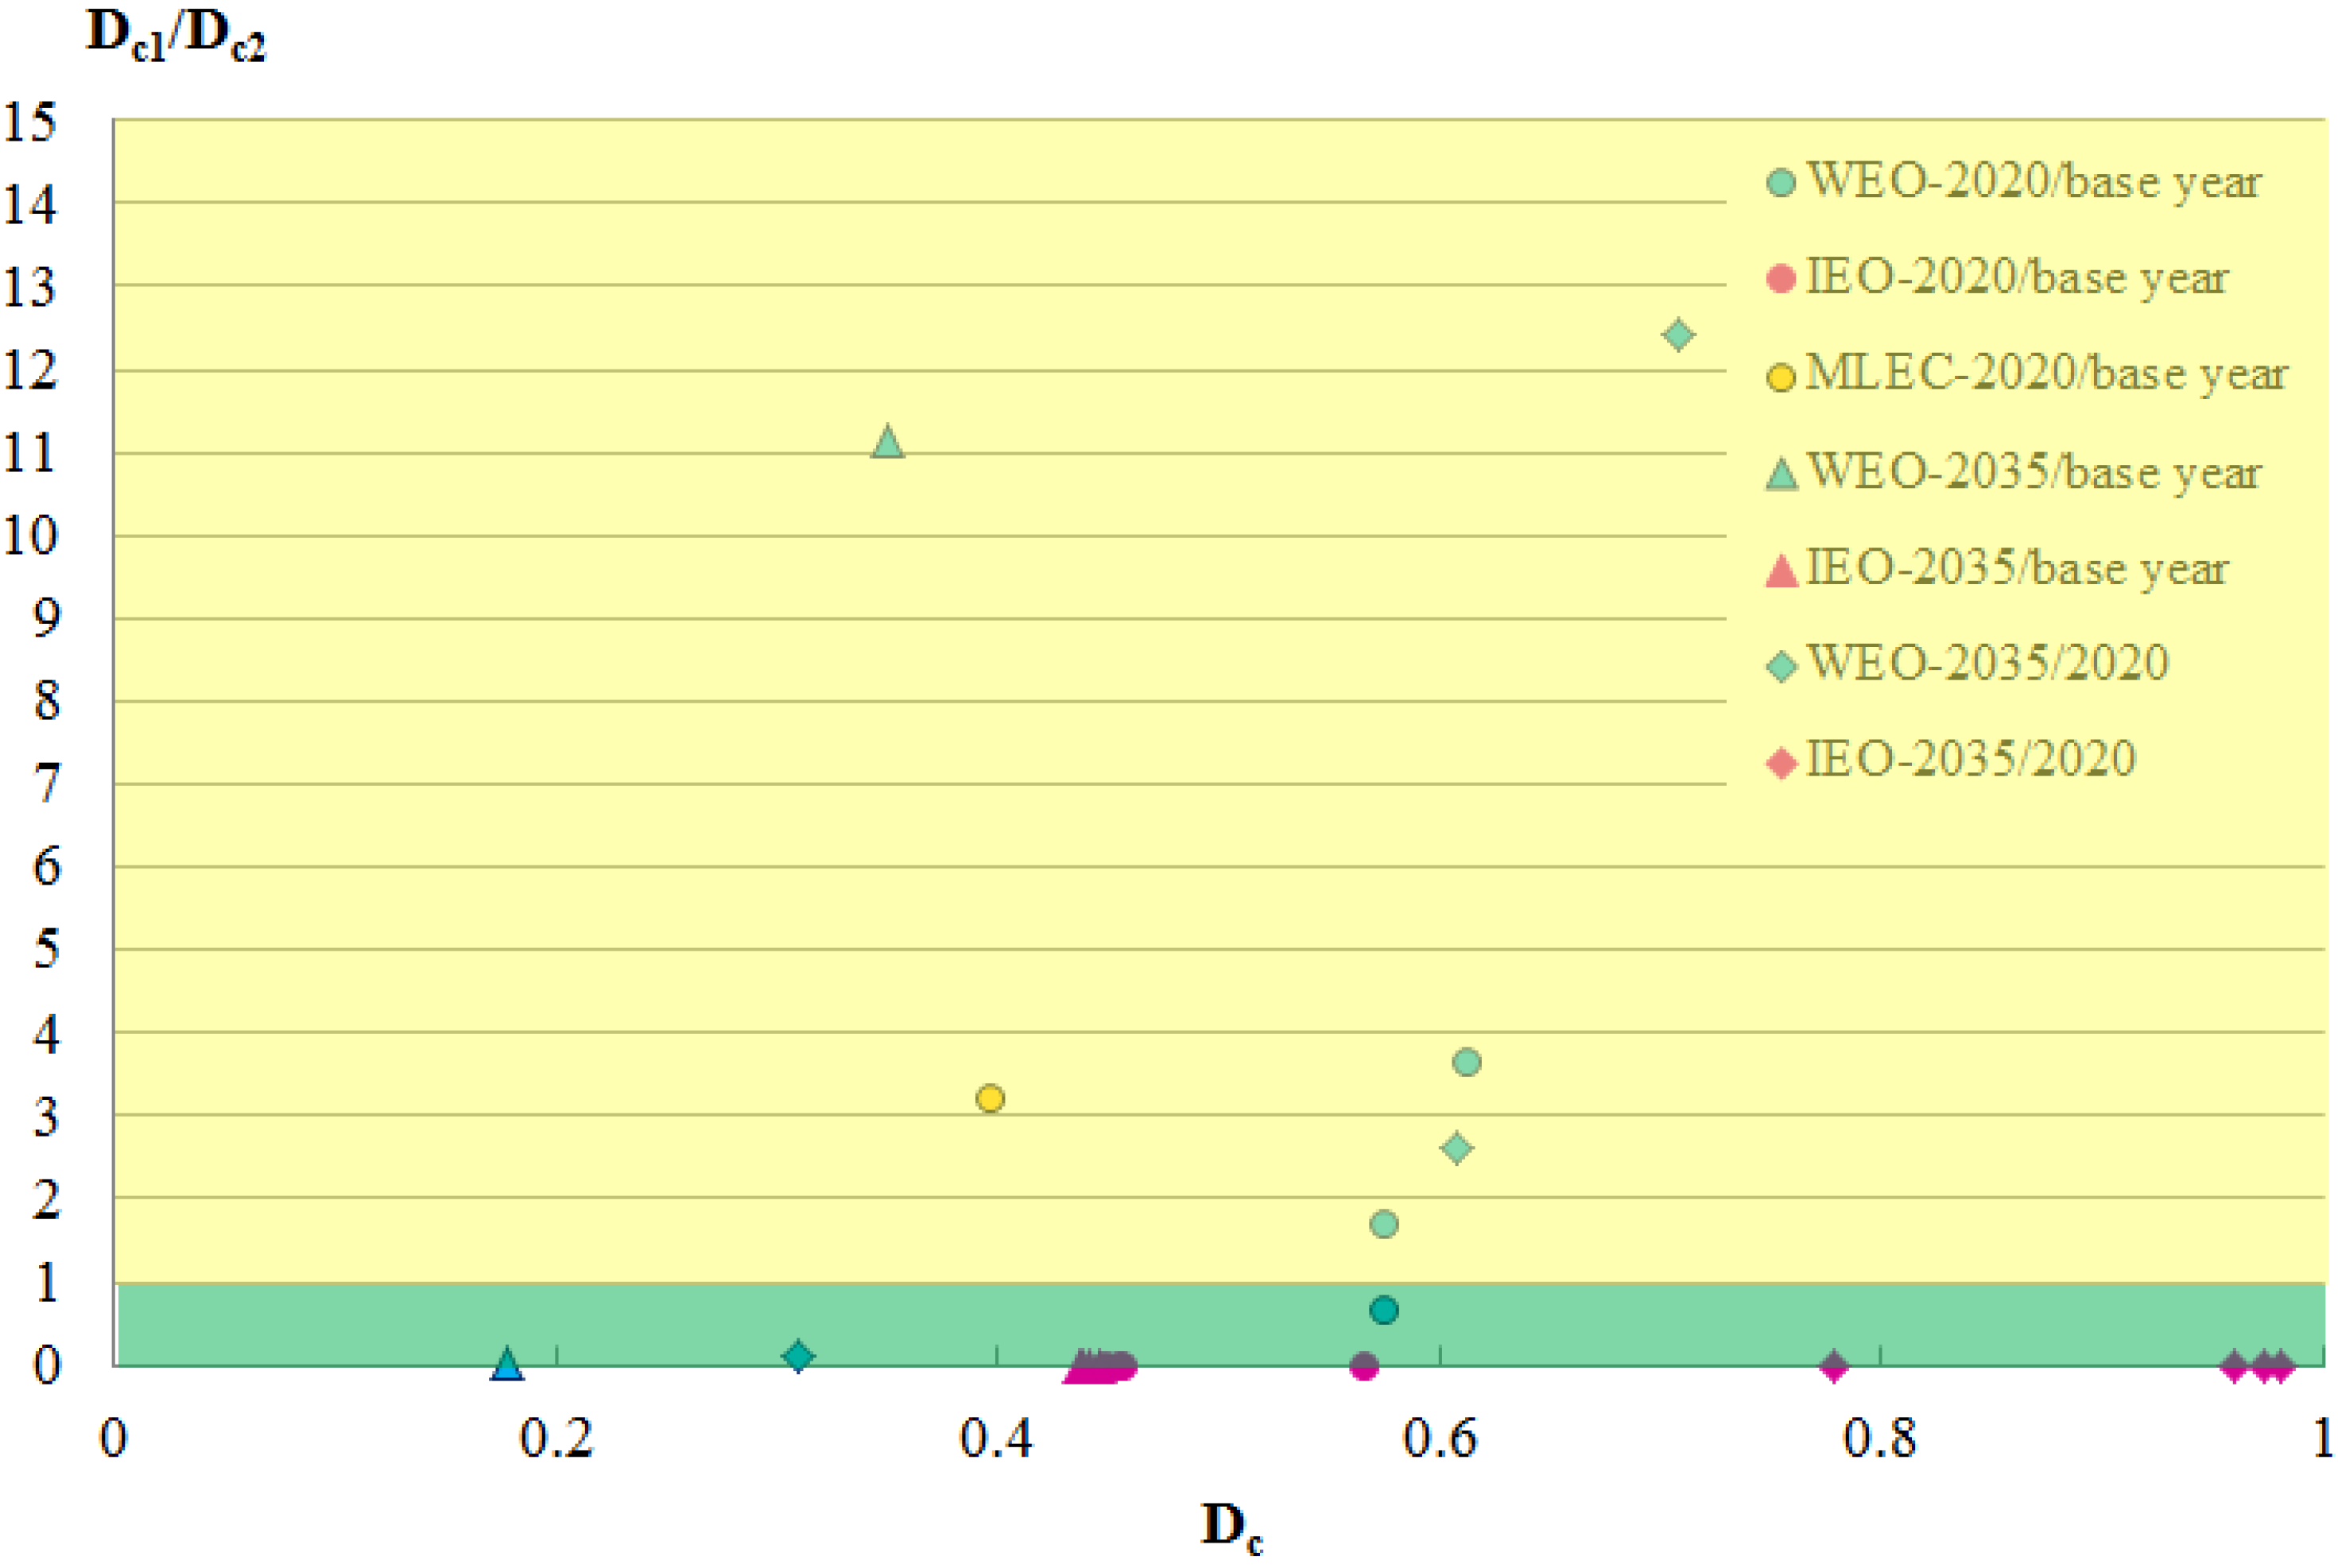
| WEO 2010 | CPS | 0.613 | 3.671 | 0.434 | 149.933 | 0.708 | 12.405 |
| NPS | 0.575 | 1.713 | 0.349 | 11.139 | 0.608 | 2.606 | |
| 450S | 0.575 | 0.667 | 0.178 | 0.038 | 0.310 | 0.106 | |
| IEO 2010 | RC | 0.566 | 1.12 × 10⁻¹⁵ | 0.442 | 2.24 × 10−61 | 0.779 | 5.29 × 10−37 |
| HEGC | 0.449 | 1.02 × 10−57 | 0.437 | 6.32 × 10−215 | 0.973 | 2.67 × 10−134 | |
| LEGC | 0.455 | 3.81 × 10⁻²⁰ | 0.446 | 2.24 × 10−63 | 0.982 | 2.23 × 10−36 | |
| HOPC | 0.456 | 8.28 × 10−09 | 0.438 | 1.18 × 10⁻²⁹ | 0.960 | 0.000 | |
| LOPC | 0.445 | 7.41 × 1028 | 0.441 | 8.36 × 1098 | 0.991 | 2.56 × 1058 | |
| MLEC | 0.397 | 3.220 | 0.195 | 20,273.999 | 0.491 | 175.799 | |
7. Conclusions
Acknowledgments
Conflict of Interest
References
- NBSC (National Bureau of Statistics of China). China Statistical Yearbook 2010; [in Chinese]; China Statistics Press: Beijing, China, 2010.
- EIA (U.S. Energy Information Administration). International Energy Outlook 2011; EIA: Washington, DC, USA, 2011.
- IEA (International Energy Agency). World Energy Outlook 2000; IEA: Paris, France, 2000. [Google Scholar]
- EIA (U.S. Energy Information Administration). International Energy Outlook 2000; EIA: Washington, DC, USA, 2000.
- NBSC (National Bureau of Statistics of China). China Statistical Yearbook 2011; [in Chinese]; China Statistics Press: Beijing, China, 2011.
- IEA (International Energy Agency). World Energy Outlook 2009; IEA: Paris, France, 2009. [Google Scholar]
- IEA (International Energy Agency). World Energy Outlook 2010; IEA: Paris, France, 2010. [Google Scholar]
- EIA (U.S. Energy Information Administration). International Energy Outlook 2010; EIA: Washington, DC, USA, 2010.
- BP. BP Energy Outlook 2030; BP: London, UK, 2011. [Google Scholar]
- CAE (Chinese Academy of Engineering). The Mid-Term and Long-Term Energy Development Strategy of China (2030,2050); [in Chinese]; Science Press (China): Beijing, China, 2010. [Google Scholar]
- IEA (International Energy Agency). World Energy Model—Methdology and Assumptions; IEA: Paris, France, 2010. [Google Scholar]
- EIA (U.S. Energy Information Administration). The National Energy Modeling System: An Over View 2009; EIA: Washington, DC, USA, 2009.
- UNPD (United Nations Population Division). World Population Prospects; the 2009 Revision; UNPD: New York, NY, USA, 2009. [Google Scholar]
- Ang, B.W.; Zhang, F.Q. A survey of index decomposition analysis in energy and environmental studies. Energy 2000, 25, 1149–1176. [Google Scholar] [CrossRef]
- Wood, R.; Lenzen, M. Structural path decomposition. Energy Econ. 2009, 31, 335–341. [Google Scholar] [CrossRef]
- Su, B.; Ang, B.W. Structural decomposition analysis applied to energy and emissions: Some methodological developments. Energy Econ. 2012, 34, 177–188. [Google Scholar] [CrossRef]
© 2013 by the authors; licensee MDPI, Basel, Switzerland. This article is an open access article distributed under the terms and conditions of the Creative Commons Attribution license (http://creativecommons.org/licenses/by/3.0/).
Share and Cite
Pan, L.; Guo, Z.; Liu, P.; Ma, L.; Li, Z. Comparison and Analysis of Macro Energy Scenarios in China and a Decomposition-Based Approach to Quantifying the Impacts of Economic and Social Development. Energies 2013, 6, 3444-3465. https://doi.org/10.3390/en6073444
Pan L, Guo Z, Liu P, Ma L, Li Z. Comparison and Analysis of Macro Energy Scenarios in China and a Decomposition-Based Approach to Quantifying the Impacts of Economic and Social Development. Energies. 2013; 6(7):3444-3465. https://doi.org/10.3390/en6073444
Chicago/Turabian StylePan, Lingying, Zheng Guo, Pei Liu, Linwei Ma, and Zheng Li. 2013. "Comparison and Analysis of Macro Energy Scenarios in China and a Decomposition-Based Approach to Quantifying the Impacts of Economic and Social Development" Energies 6, no. 7: 3444-3465. https://doi.org/10.3390/en6073444
APA StylePan, L., Guo, Z., Liu, P., Ma, L., & Li, Z. (2013). Comparison and Analysis of Macro Energy Scenarios in China and a Decomposition-Based Approach to Quantifying the Impacts of Economic and Social Development. Energies, 6(7), 3444-3465. https://doi.org/10.3390/en6073444