1. Introduction
Independent systems such as the Taiwan power system and the Italian power system do not receive support from other interconnected systems, so their system frequency is particularly sensitive to load changes. Consequently, an adequate and appropriate spinning reserve which is one of primary ancillary services to maintain system reliability when contingency occurs in power system must be developed to prepare for generating unit failure [
1,
2,
3]. The power system in Taiwan is isolated, and minor load fluctuations can cause a certain degree of frequency offsetting. To prevent excessive frequency offsetting from causing system collapse, sufficient frequency-regulating reserve (FRR) and reasonable frequency-based reserve constraint (FBRC) that respond to the unexpected generator outages and power shortages caused by offset detection must be established. Underfrequency load-shedding has been adopted as a dispatch strategy in numerous countries. However, before the power industry in Taiwan is liberalized, Taiwan Power Company (Taipower) expects to continue using FRR plans as a basis until underfrequency relay load-shedding is unavoidable. Regarding the overall power system in Taiwan, three primary power sources are available for regulating system frequency and controlling power generation. The first power source is provided by operating generators under a governor-free (GF) control mode; the second is provided by operating hydropower generators under automatic generation control (AGC); and the third source is provided by underfrequency relay load-shedding, which is generated by pumped storage units during a water-pumping mode. Of these power sources, pumped storage units can operate under the generator mode during peak time to regulate the system frequency and reduce generation costs, and operate under the pumping mode during off-peak time to provide emergency spinning reserves and deplete power surpluses. Thus, the use of pumped storage units is extremely important in Taiwan. Should the largest generator in a power system fail during off-peak time, the pumped storage units can be immediately deactivated with the highest priority. Because this unit has an extremely rapid response, effective power can be appropriately adjusted without delays, to retain the generation-consumption balance between the generator output and the system and maintain the system frequency within the rated frequency range. Therefore, the dispatching of FRR will be more flexible to minimize operating costs and enhance system reliability [
3,
4,
5,
6,
7,
8].
Traditionally, the entire spinning reserve is considered that the maximum capability of the on-line units minus the outputs or dispatched units. However, this method does not guarantee the occurrence of under-frequency load shedding [
9,
10,
11,
12,
13]. Also, the largest power generator unit in Taiwan, Longmen Nuclear Power Plant, will begin commercial operations in the near future. The Longmen Power Plant is Taipower’s fourth nuclear power plant and is located in Northern Taiwan. The rated output of a single generator unit at the Longmen Power Plant is 1350 MW, which replaces the original single-unit rated output of 980 MW at Nuclear Power Plant 2 as the largest generator, showing a 1.4-times capacity increase per single unit. This increases the proportion of the overall system output occupied by the largest generator, but reduces the frequency stability of the power system. If the power system continuously operates under excessively low frequency conditions, this not only increases the chances of underfrequency load-shedding, but also damages the equipment [
14], particularly during winter when loads are at an annual minimum. During a major incident, regardless of whether sufficient spinning reserves that enable the power system to recover to a safe frequency range within 50 s are allocated, the reserves are constrained by the frequency response of the generator unit and are unable to respond instantaneously. Considering hydropower generators, which have the most rapid response time in the system, the time required to recover to a full load is approximately 30 to 60 s. However, a decline in system frequency caused by a loss of generating capacity is instantaneous, and requires only approximately 5 s to reach a load-shedding frequency. Therefore, the amount of spinning reserves does not affect the power system’s minimum frequency when the generators malfunction or trip; instead, the response times of these reserves influence the frequency recovery rate following generator failure or outage. A power system that does not account for the influences that immediate conditions have on system frequency following generator failure, as well as the response capability of the spinning reserves, cannot guarantee the prevention of low-frequency relays following the operational failure or outage of the largest generator. Thus, when a power system experiences an excessive loss of generating capacity while operating under low loads, this loss causes the system’s frequency to shed its underfrequency loads in an extremely short period of time [
15]. Regarding FRR, which significantly influence the allocation of spinning reserves, the plans and dispatch methods previously used for the 985 MW generators at Nuclear Power Plant 2 have become obsolete following the addition of the Longmen Power Plant. New FRR and dispatch methods must be developed to instantly reduce loads when the power system has sustained a substantial loss of generating capacity and to prevent the occurrence of underfrequency load-shedding, thereby mitigating the impact of a doubled generator capacity.
This study initially determined the load-frequency sensitivity factor (LFSF) based on the historical data provided by Taipower. Then, targeting the winter off-peak period (holidays), which presents the lowest annual load conditions, the power system’s minimum frequencies at various periods were estimated regarding the occurrence of nuclear generator failure or outages at Longmen Power Plant in 2014. Subsequently, by identifying the power system’s use of pumped storage units, this study analyzed the safety of the power system and the adequacy of the allocated FRR, and further proposed a dispatch strategy for pumped storage units. This strategy can be used to ensure the prevention of underfrequency load-shedding, even when the power system is operated under low load conditions, and to simultaneously decrease switchings for pumped storage units, further reducing unit failures and re-dispatch costs. Considering the transmittance constraints of transmission lines [
1,
16], the power of generators need to be committed and dispatched appropriately in order to avoid overloading in transmission lines. To ensure the reliability and stability of utility, mixed integer linear programming (MILP) algorithms have good performance at optimal commitment and economic dispatch for large scale power systems [
17]. However, this study used the Power System Simulator for Engineering (PSS
®E, Siemens) which is a well-known and professional power analysis software to conduct power flow analysis of the power systems in Northern, Central, and Southern Taiwan. The objective of this analysis was to evaluate whether the proposed strategy could recover the system frequency to an acceptable range and prevent underfrequency load-shedding following a failure or outage at Longmen Power Plant, to thereby avoid transmission line overload.
Section 2 provides classifications and definitions of Spinning Reserves for Taiwan Power System. The proposed control strategy for pumped storage units is detailed in
Section 3. The experimental results, obtained from a real power system, containing a lowest-frequency, a recovery-frequency, a FRR value and a power flow distribution, are discussed in
Section 4. Conclusions are discussed in
Section 5.
3. Scheme of the Proposed Control Strategy for Taiwan Power System
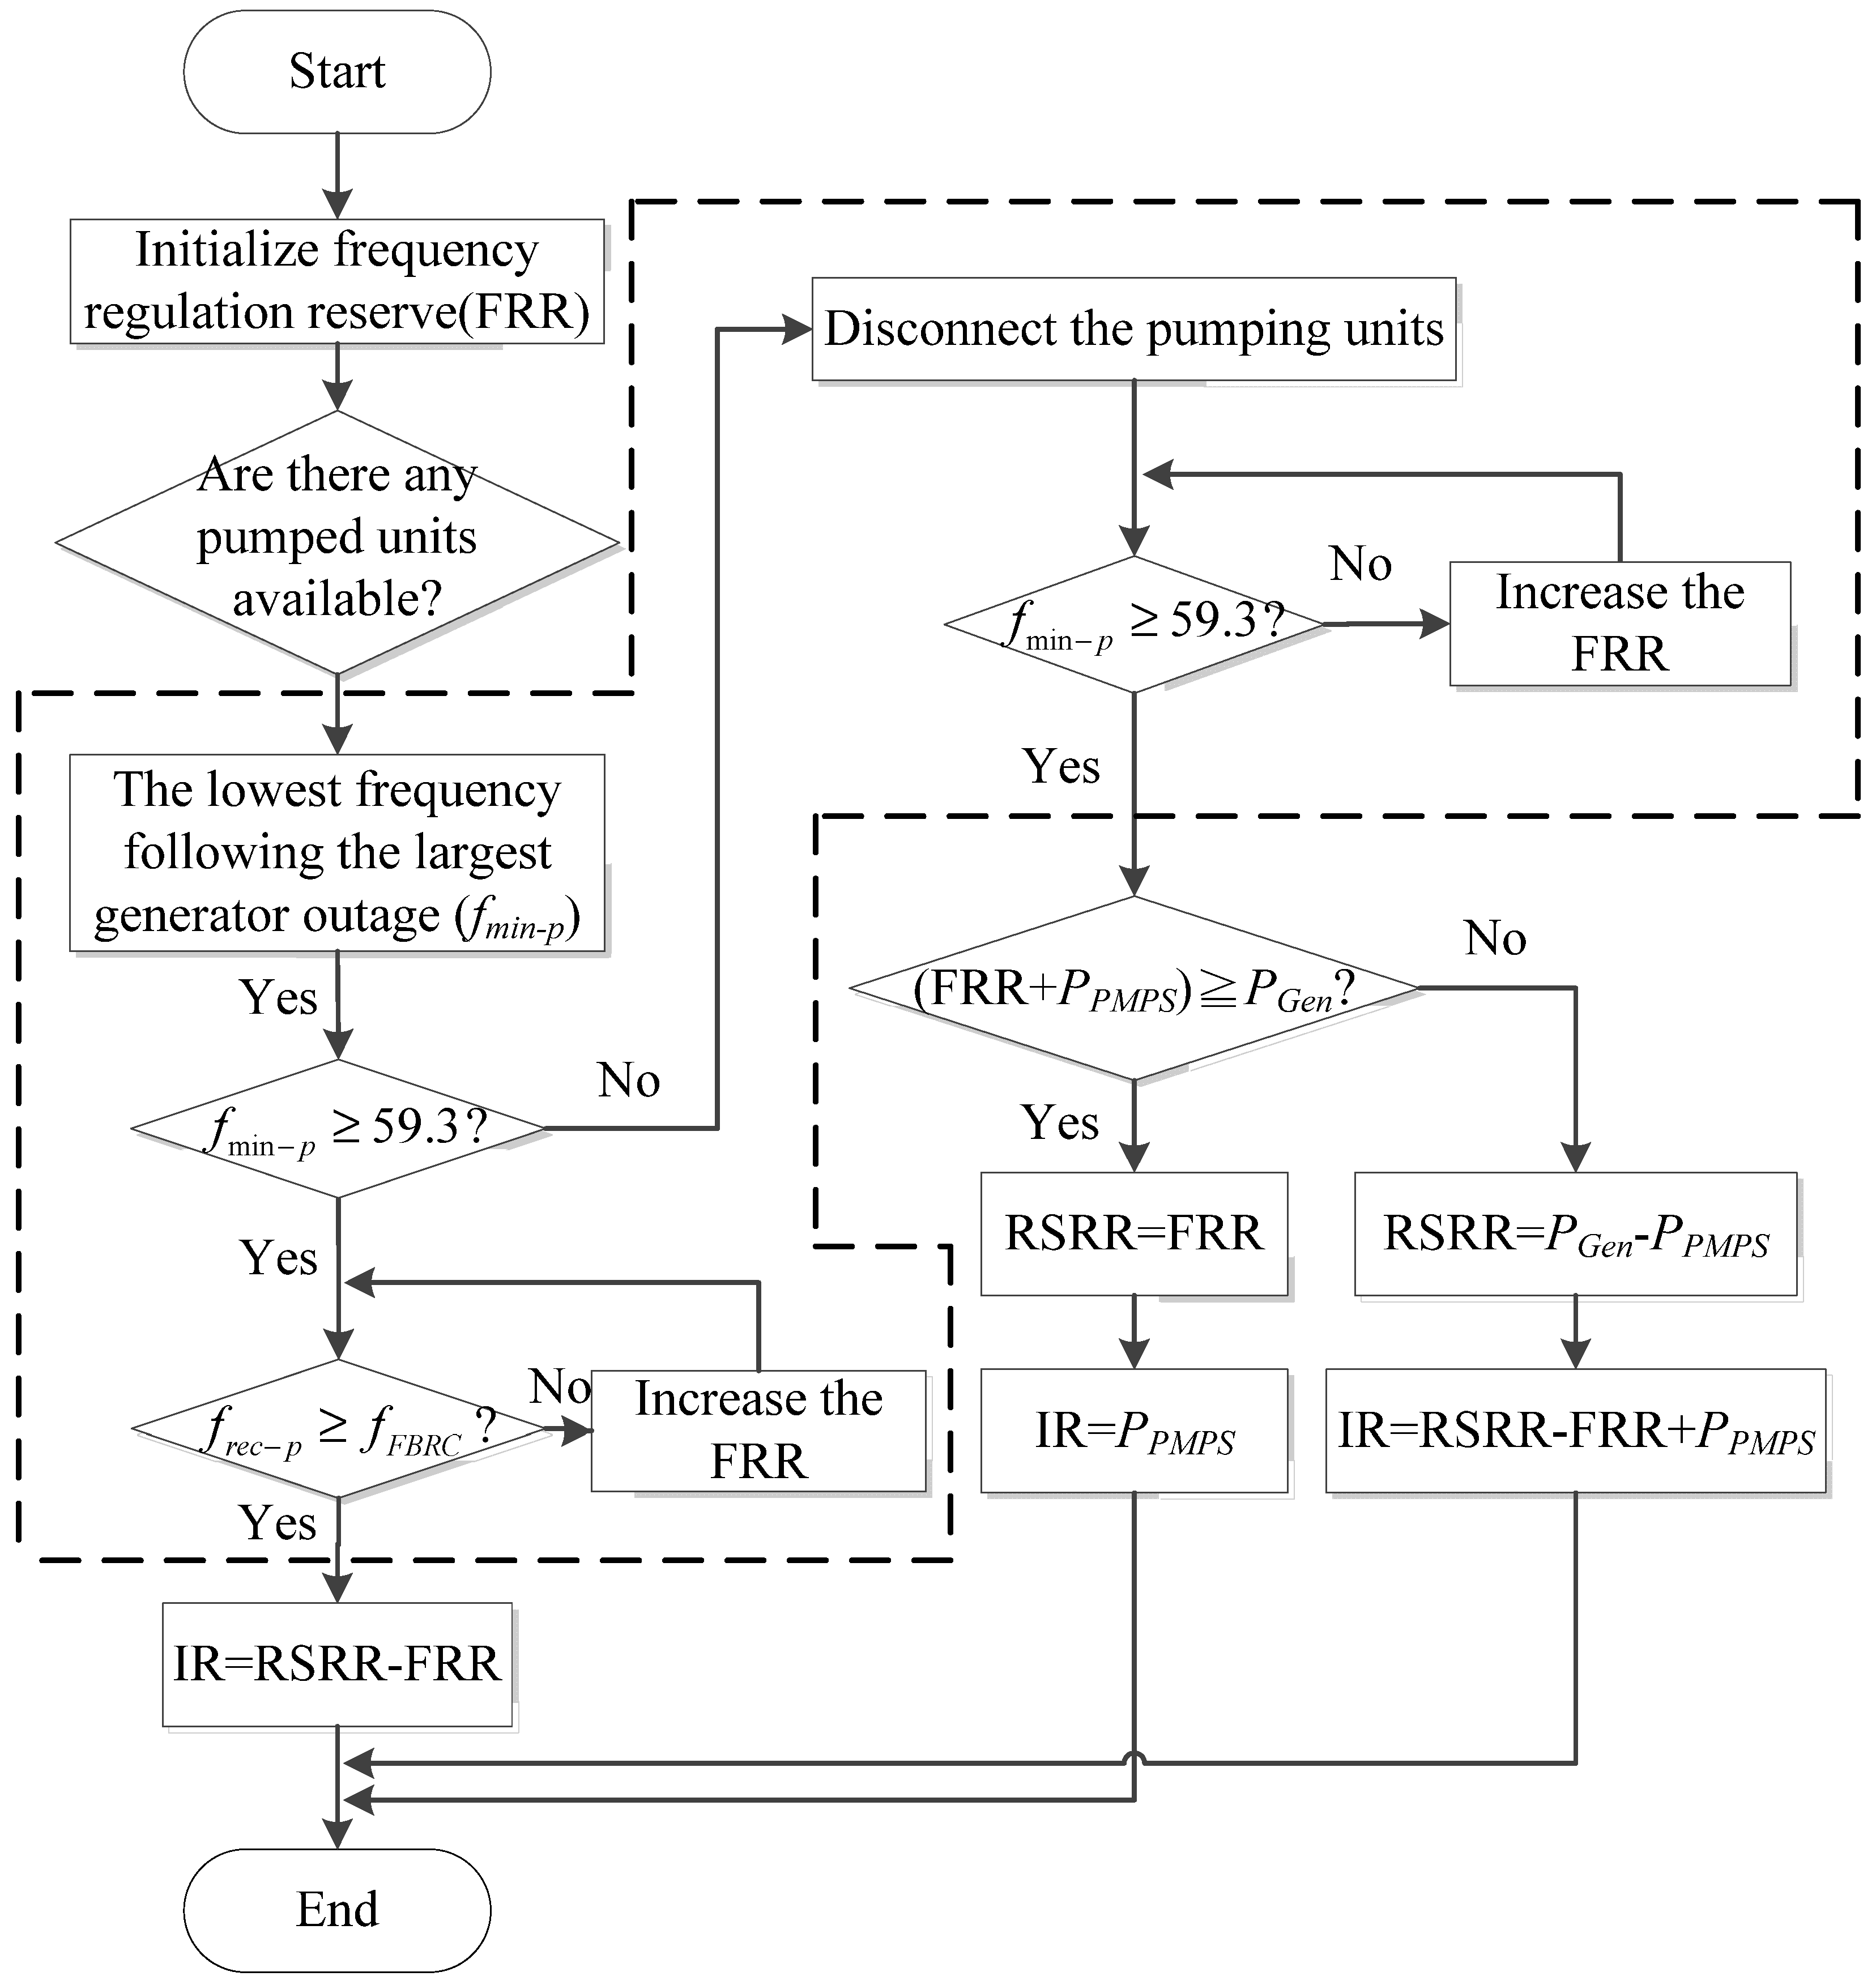
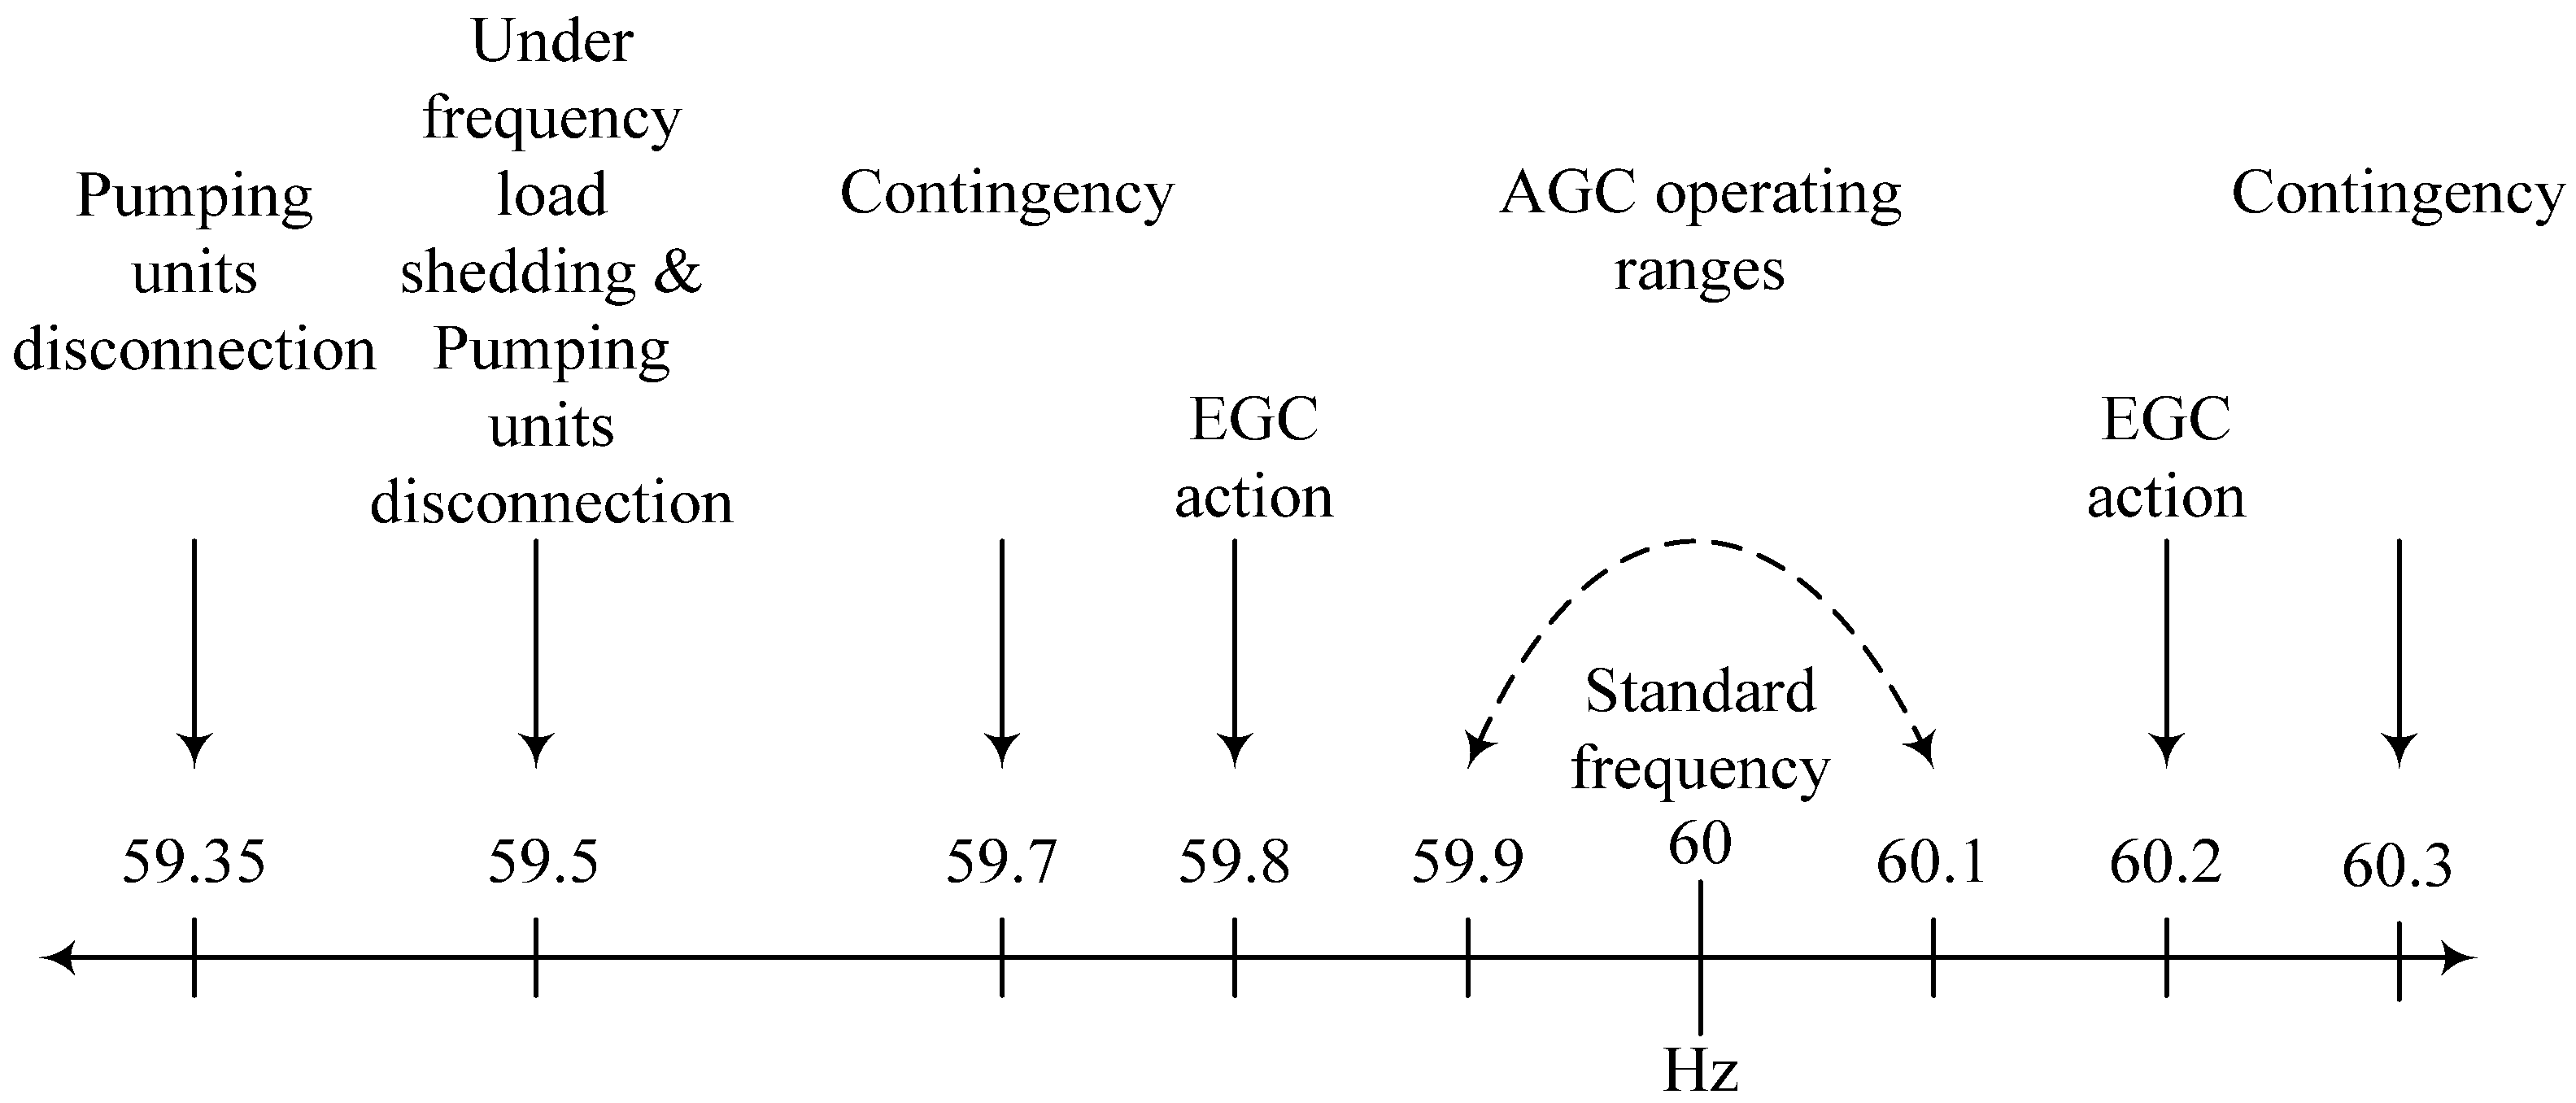
When the Longmen Power Plant joins Taiwan’s power system, the excessively high amount of power generated will cause the system frequency to fall below 59.5 Hz if outages occur at the plant during off-peak time. This will trigger pumped storage units to disconnect. However, the Taipower current dispatch method does not account for system frequency after the pumped storage load has been disconnected. Thus, system frequency nadirs, the 1-min recovery frequency, and the frequency regulating reserve must be recalculated to determine a reasonable pumped storage dispatch policy. Furthermore, the rated frequency of Taipower is between 59.9 Hz to 60.1 Hz. This study assumes that the 1-min recovery frequencies need not back to 60 Hz taking economic factors into account. Only use the FRR to improve the system frequency up to 59.7 Hz. After that, the system frequency can be compensated to 60 Hz by supplement control such as emergency generation control (EGC). The dotted box of the
Figure 2 that proposed in this study with considerations of pumped storage loads is included into the original Taipower’s calculation method. Besides, the key point is to determine the best FRR value to save the total cost in Taipower. Detailed descriptions of each section of the flow chart in the dotted box are given below.
Figure 2.
The flow chart of the dotted box for calculation of FRR including considerations of pumped storage loads.
Figure 2.
The flow chart of the dotted box for calculation of FRR including considerations of pumped storage loads.
3.1. Determining the Load-Frequency Sensitivity Factor (LFSF)
The load-frequency sensitivity factor (LFSF) is not constant, and its value is closely related to system load size, characteristics, pumped-storage units and load variations. The system frequency is more susceptible to load changes when a system is under a light load. The system frequency is less affected by load changes when a system is under a heavy load [
23,
24,
25,
26,
27,
28]. Because power system load implies a certain level of inherent uncertainty, errors or distortions in the load forecasting are common. To increase the ease of calculation, load forecast errors or distortions are considered normal distributions. The most commonly adopted model for determining LFSF is the Seven-Step distribution model [
29].
In this study, the selection of LFSF for the various periods was primarily based on data provided by Taipower (2007 to 2012). These data were then categorized into four seasons and three time periods, specifically, spring (March to May), summer (June to August), autumn (September to November), and winter (December to February), and peak time (10:00–12:00 and 13:00–17:00), mid-peak time (07:30–10:00, 12:00–13:00, and 17:00–22:30), and off-peak time (00:00–07:30 and 22:30–24:00). The LFSF was obtained through data analysis and calculation, and included the system frequency variation curve during generator outages, system generating capacity, cause of failure, and outage capacity:
where Δ
P: the amount of generation loss (MW);
Psystem: system load (MW); Δ
f: the drop in frequency following the loss of a generator (Hz).
3.2. FRR Capacity Planning with Considerations of Pumped Storage
The primary task of FRR is to accommodate frequency deviations from load changes and forecast errors. It possesses an extremely rapid response time and can provide power generating capacity within a short period to correct frequency deviations caused by system load changes. Consequently, FRR is chiefly provided by pumped storage units or hydraulic generators operated through AGC mode that can rapidly change from no capacity to full capacity. The equation for FRR, Equation (2), is as follows [
23]:
where
Psystem: system load (MW); LFSF: the load-frequency sensitivity factor of the system (%/Hz);
f2: the frequency meant to provide some margin to the frequency at which load shedding initiated (Hz).
Currently, the FRR plans developed by Taipower for power systems ensure that the system frequency will be recovered to the initial frequency of 59.5 Hz for eleventh-priority frequency shedding following a generator outage (
Table 1). However, the FRR response speed must be sufficiently rapid to provide a large amount of power within 60 s to address sudden contingencies and to restore the system frequency to a safe range. This response speed is mainly provided by operational pumped storage units because of their rapid response time and ability to increase from low to maximum loads within one minute. Therefore, the
f2 is 59.7 Hz, which must be determined by adding a normal frequency deviation of 0.2 Hz to the frequency at which the eleventh-priority load shedding begins.
3.3. Calculation of System Frequency Nadirs after Generator Unit Outages Occur
Unscheduled generator outages in a system lead to decreased system frequency. However, the level at which decreases occur is affected by factors such as the size of system load at the time of the outage, loss of system power generating capacity, changing trends in the system, system frequency, and whether pumped storage units are available to regulate the load size. Therefore, it is difficult to accurately predict the frequency nadir after a unit outage. However, according to the latest information provided by Taipower on LFSF, system frequency nadirs following outage events can be accurately predicted. The system frequency nadir
fmin after a generator outage is shown in Equation (3):
where
PGen: the output of the maximum generation unit, which is 1350 MW in the Taiwan power system.
This equation can be used to estimate the system frequency nadir after an unscheduled outage occurs in a medium- or large-capacity generating unit in the system. Based on the calculated system frequency nadir, the risk of excessively low frequency in the system can be evaluated, and policies for preventing serious incidents can be established.
However, as shown in Taipower’s load shedding relay table (refer to
Table 1) [
14], a system disconnects approximately one or two pumping units if these units are operating in a pumping mode when the system frequency falls below 59.5 Hz. Consequently, Equation (3) must be modified and the pumped storage units removed to account for their load shedding, as shown in Equation (4):
where
PPMPS: pumped-storage load of under-frequency load shedding (MW).
3.4. Pumped Storage Unit Dispatch Policy under System Safety Constraints
When the Longmen Power Plant is commercially operational, the capacity of the largest power generating unit in Taiwan’s system will increase by nearly 40%, increasing the probability of load shedding following contingencies. Although the influence of an outage at the Longmen Power Plant on the system frequency is small during peak time, the low system load during off-peak time indicates that system frequency may fall below 59.2 Hz when an outage occurs during off-peak time, resulting in the most serious load shedding.
Furthermore, based on Taipower’s load shedding schedule table, two pumped storage units will be instantaneously disconnected following an outage at the Longmen Power Plant and if the system frequency falls below 59.35 Hz, removing a load of 510 MW from the system and preventing load shedding. Thus, based on the authors' experiences and discussion with Taipower's engineers, we propose that pumped storage units be operational if the estimated frequency after an outage is lower than 59.2 Hz to prevent the instantaneous shedding of 4.636% of the load from the system. Therefore, accounting for errors in the LFSF calculations, the system safety frequency was determined as 59.3 Hz, as shown in Equation (5):
Consequently, if the
fmin-p calculated from Equation (5) is lower than 59.3 Hz, at least two pumped storage units must be pumping at that time. In a given year, the lowest loads occur during winter. If an outage occurs at the Longmen Power Plant during this season, the system will have the highest likelihood of load shedding. In
Section 4, changes in the system frequency, FRR, and the pumped storage unit dispatch policy after an outage at the Longmen Power Plant for winter weekends are analyzed.
3.5. Calculation of System Recovery Frequency after Generator Unit Outage
If sufficient FRR is assigned in the system to restore the frequency to within a reasonable safety range after extended contingencies in the system, and if it is assumed that the system load remained the same in the one minute following the generator outage, the 1-min recovery frequency
frec can be calculated using Equation (6) [
23]:
where
fs: system rated frequency.
However, when the loss of generating capacity in the system is excessively large and the load is small, the high percentage of lost power generation causes the system frequency to decrease in an extremely short period, resulting in instantaneous initiation of load shedding. Therefore, accounting for the load shedding of the pumped storage units are surely initiated, the 1-min recovery frequency must be recalculated as shown in Equation (7):
Equation (7) is based on a condition in which the load remains the same for one minute following a generator outage. Based on the uncertainty of changing trends in power system demand, the power generation gap is too large if the load increases rapidly during the one minute after an outage, In this case, the 1-min recovery frequency will be lower than the predicted value
frec-p. Thus, the predicted value of the 1-min recovery frequency
frec-p after the shutdown of the largest unit in the system must be equal to or larger than the lowest frequency at which the system can operate safely
fFBRC, as shown in Equation (8):
Equation (8) is the frequency-based reserve constraint (FBRC). Because load changes cannot be accurately predicted within one minute of a unit outage (this affects the 1-min recovery frequency to a certain degree), changing trends in system loads and the initiation frequency for eleventh-priority frequency (i.e., 59.5 Hz) shedding must be considered when the lowest safe system operation frequency fFBRC is determined. However, in order to account for errors in LFSF calculation and load changes, a frequency deviation of 0.2 Hz was added. Therefore, the fFBRC value for the Taipower system is 59.7 Hz. This value ensures that load shedding does not occur, even if the largest generating unit that is on-line shuts down. If frec-p is smaller than fFBRC when the calculations are completed, more FRR must be added to the system until the calculated frec-p is equal to or greater than fFBRC.
Based on the results from Equations (1) to (8), the FRR required for a system can be calculated. This calculation method avoids unnecessary costs from the use of excessive FRR during off-peak winter time.
4. Simulation Results
The lowest system load per year is observed during winter. Thus, the occurrence of underfrequency load-shedding at Longmen Power Plant following a generator outage has the highest probability during this season. Based on holiday time periods, this study analyzed the lowest frequency, FRR values, 1-min recovery frequency, and power flow distribution of the power system at Longmen Power Plant following a generator outage.
Ten pumped storage units are currently in service in Taiwan’s power system. Based on Taipower’s experience, they have adopted a policy in which one generator pumping and one generator generating power for the instantaneous reserve of a system. With this policy, just six pumped storage units can be employed as for instantaneous reserves when they are pumping. If an outage occurs at the Longmen Power Plant during winter weekend, the system frequency will drop below 59.2 Hz, triggering first- and second-priority load shedding and disconnecting four pumped storage units simultaneously (shown in
Table 1). This leaves only two pumping storage units in the system acting as the instantaneous reserve. The limits at the storage pond show that operating with four pumped storage units generating power and two pumping greatly reduces the water reserves at the higher pond. From the standpoint of economics and security, the original Taipower policy not only wastes spinning reserves, but fails to address second potential contingency events.
Table 1.
Schemes of the Pumped-Storage Units Under-Frequency Load Shedding.
Table 1.
Schemes of the Pumped-Storage Units Under-Frequency Load Shedding.
| Strategy | Stage | Frequency setting | Response time | Shedding amount |
|---|
| Taipower strategy (current) | First | 59.50 Hz | Instant | Ming-Hu 1st hydro-plant 250 MW | Ming-Tan 1st hydro-plant 260 MW |
| Second | 59.35 Hz | Instant | Ming-Hu 2nd hydro-plant 250 MW | Ming-Tan 2nd hydro-plant 260 MW |
| Fifth | 59.2 Hz | Instant | 4.636% system load |
| Eleventh | 59.5 Hz | 50 s | 2.505% system load |
| The proposed strategy | Second | 59.3 Hz | Instant | Ming-Tan 2nd hydro-plant 260 MW |
Consequently, this study proposes that, during winter weekend, the load shedding policy for pumped storage units under system safety constraints should be modified as follows: when the system frequency falls below 59.3 Hz, the system should instantaneously disconnect the second pumped storage unit at the Ming-Tan Power Plant, which has a capacity of 260 MW.
4.1. FRR Planning and Frequency Change after an Outage at the Longmen Power Plant on a Winter Weekend
4.1.1. FRR Planning on a Winter Weekend
Table 2 shows a comparison between the FRR calculated using Taiwan Power Company manual dispatch (TPC-MD) and the proposed method. The results in
Table 2 indicate that during most of the daytime hours, the FRR were maintained at 800 MW and above, reaching the highest capacity of 897 MW (9:00 a.m.), and only a few specific peak time exhibited a capacity lower than 800 MW. Subsequently, by modifying the FRR based on the proposed strategy, the FRR declined to below 600 MW during most of the daytime hours, reaching the highest capacity of only 769 MW. Furthermore, a capacity of below 500 MW was exhibited during the evening and early morning hours. Thus, after modification, the FRR can be significantly decreased, substantially reducing power generation costs. Using the proposed dispatch strategy, an average of 6,467,606 (kWh) can be saved.
Table 2.
Comparison of FRR in winter weekend between the proposed method and TPC-MD.
Table 2.
Comparison of FRR in winter weekend between the proposed method and TPC-MD.
| Time (Hour) | 2014/01/10 (System load demand) | LFSF (%/0.1 Hz) | FRR (MW) (TPC-MD) | FRR (MW) (The proposed method) | Generation-saving (kWh) |
|---|
| 0 | 21,436.8 | 0.72 | 885.70 | 464.30 | 421,408 |
| 1 | 20,592.5 | 0.87 | 810.74 | 539.26 | 271,488 |
| 2 | 19,905.8 | 0.87 | 828.73 | 521.27 | 307,453 |
| 3 | 19,395.8 | 0.87 | 842.08 | 507.92 | 334,164 |
| 4 | 19,059.1 | 0.87 | 850.90 | 582.42 | 268,479 |
| 5 | 19,182.3 | 0.87 | 847.67 | 586.19 | 261,485 |
| 6 | 19,242.1 | 0.87 | 846.11 | 588.02 | 258,092 |
| 7 | 19,300.4 | 0.87 | 844.58 | 589.80 | 254,786 |
| 8 | 20,053.1 | 0.87 | 824.87 | 612.80 | 212,070 |
| 9 | 20,929.7 | 0.72 | 896.69 | 526.08 | 370,608 |
| 10 | 21,752.6 | 0.72 | 878.86 | 546.76 | 332,100 |
| 11 | 22,060.3 | 0.72 | 872.20 | 477.80 | 394,403 |
| 12 | 21,842.0 | 0.72 | 876.93 | 549.01 | 327,918 |
| 13 | 21,920.9 | 0.72 | 875.22 | 474.78 | 400,438 |
| 14 | 21,879.8 | 0.72 | 876.11 | 473.89 | 402,219 |
| 15 | 21,874.4 | 0.72 | 876.23 | 549.83 | 326,401 |
| 16 | 22,352.9 | 0.72 | 865.86 | 561.85 | 304,009 |
| 17 | 24,020.2 | 0.78 | 785.52 | 661.51 | 124,011 |
| 18 | 24,957.8 | 0.78 | 763.49 | 763.49 | 0 |
| 19 | 24,755.0 | 0.78 | 768.26 | 768.26 | 0 |
| 20 | 24,764.6 | 0.78 | 768.03 | 768.03 | 0 |
| 21 | 24,166.1 | 0.78 | 782.10 | 567.90 | 214,191 |
| 22 | 23,053.9 | 0.78 | 808.23 | 541.77 | 266,464 |
| 23 | 21,575.1 | 0.72 | 882.71 | 467.29 | 415,419 |
| Total | 6,467,606 |
4.1.2. The Lowest Frequency Following the Longmen Power Plant Outage on Weekend
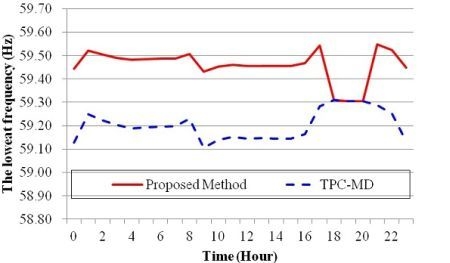
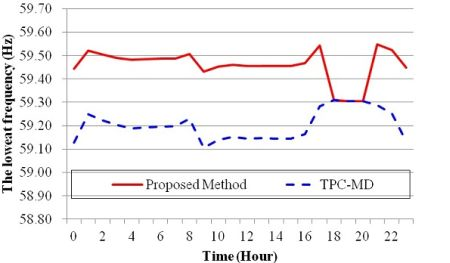
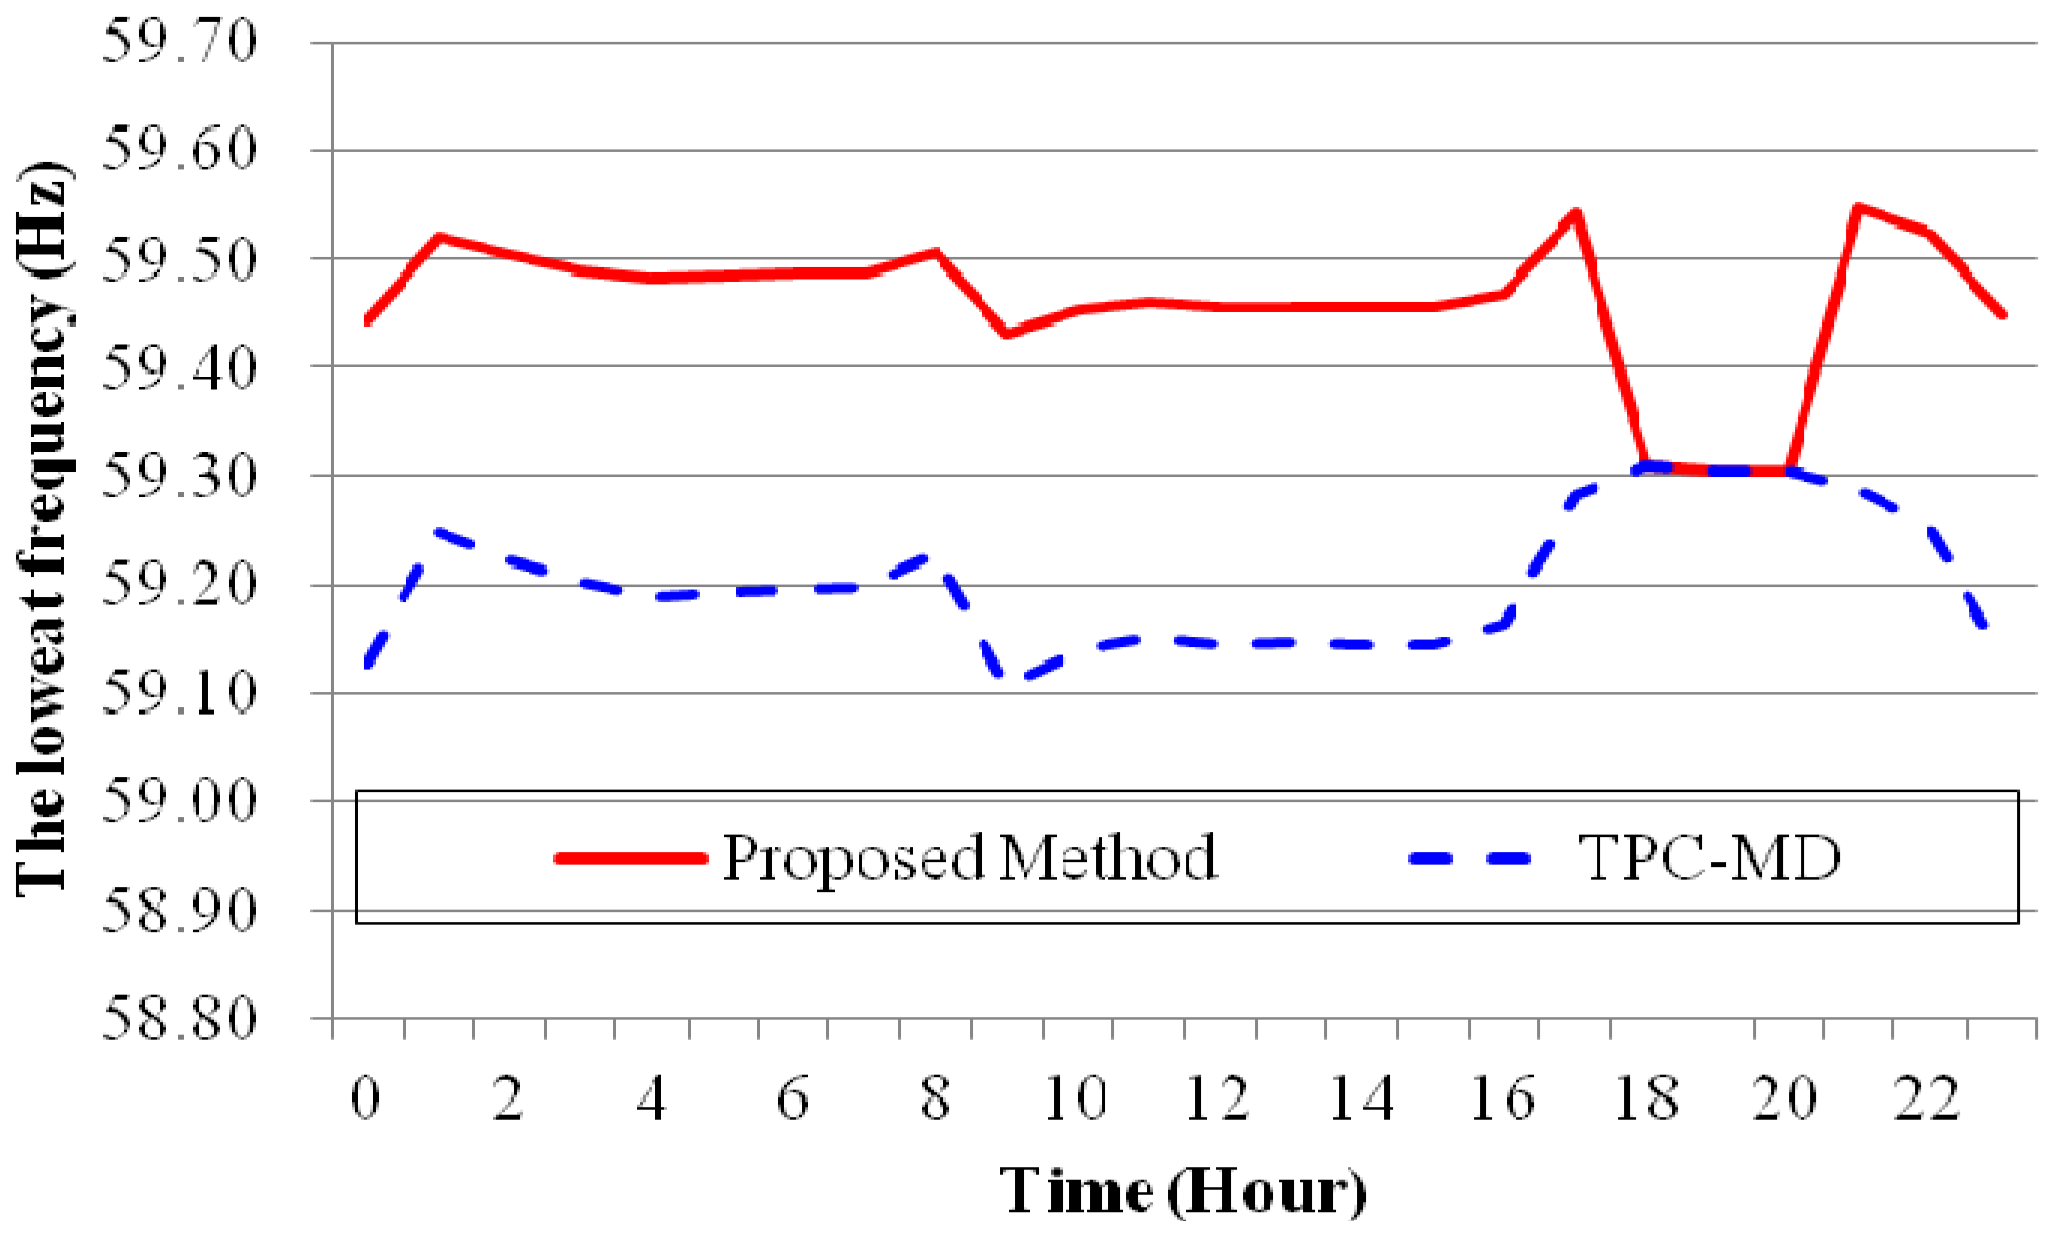
Figure 3 shows a comparison of system frequency nadirs with and without pumped storage load after an outage at the Longmen Power Plant. The figure shows that before the pumped storage unit load was added as the instantaneous reserve (dotted line), the frequency nadirs conformed to the safety limits only between 6:00 and 9:00 p.m. when higher loads were demonstrated. During all other periods, the system frequency nadir after a generator outage was below 59.3 Hz. Therefore, load shedding was highly probable if an outage occurred at the plant during those hours. After the pumped storage units were included (solid line), the system frequency nadir in the event of an outage at the Longmen Power Plant was higher than 59.3 Hz throughout the entire day. Thus, the pumped storage units allow the system to reach the safety limit frequency, guaranteeing that fifth-priority load shedding does not occur after an outage at the plant.
Figure 3.
The lowest frequency following the largest on-line generator outage on weekend comparison between the proposed method and TPC-MD.
Figure 3.
The lowest frequency following the largest on-line generator outage on weekend comparison between the proposed method and TPC-MD.
4.1.3. The One-Minute Recovery Frequency Following the Longmen Power Plant Outage on Weekend
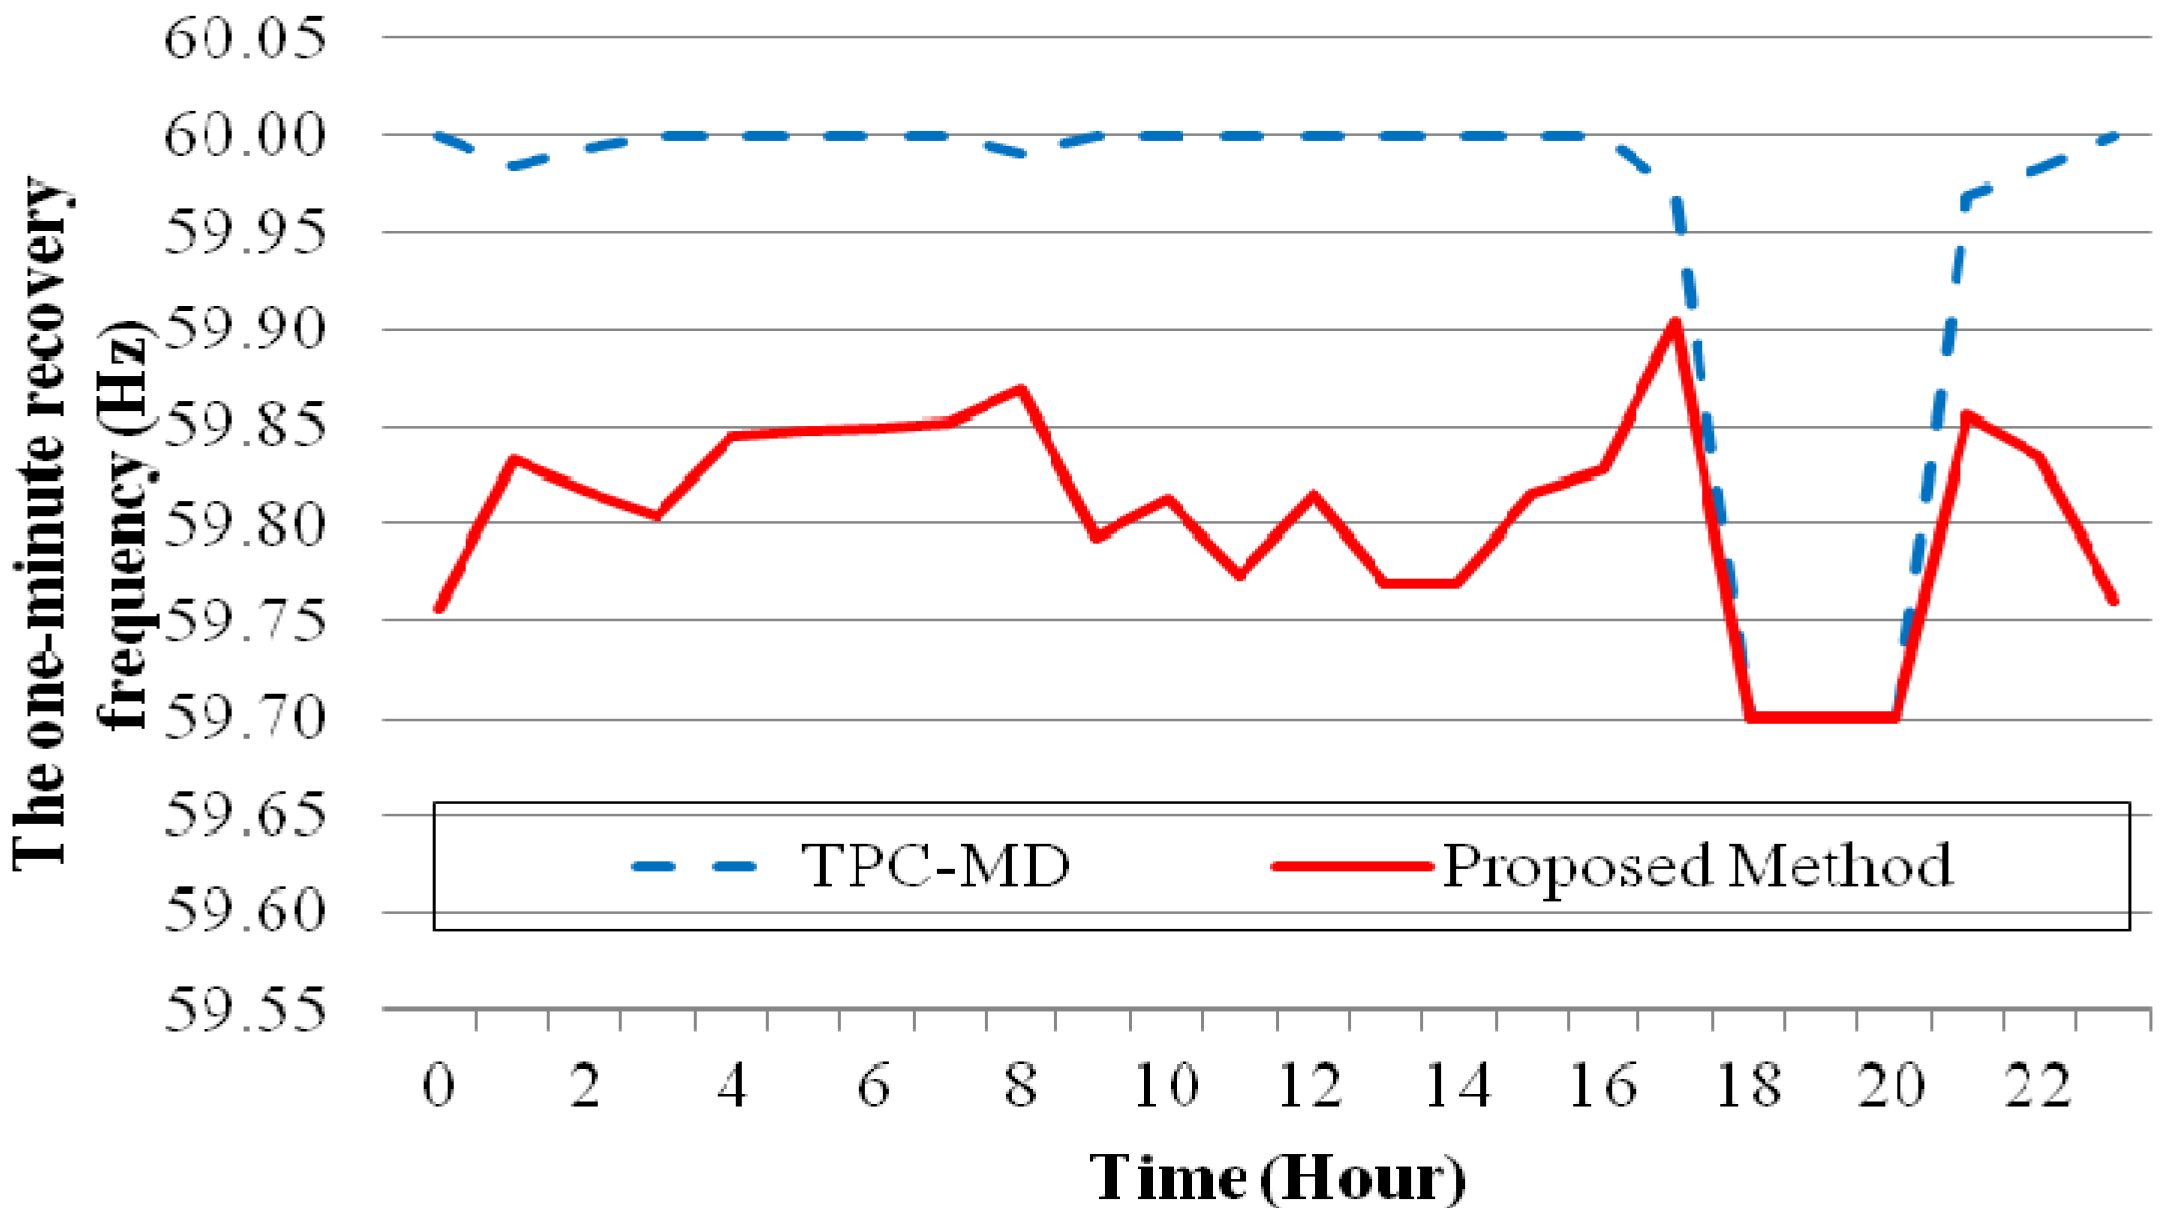
Figure 4 shows a comparison diagram of the 1-min recovery frequency of the system at Longmen Power Plant after the FRR capacity was modified using the proposed strategy. Regarding the FRR calculated by TPC-MD, the 1-min recovery frequency at the Longmen Power Plant achieved nearly 60 Hz when the pumped storage units were allocated to pumping water, and the frequency was slightly higher than 59.7 Hz when the pumped storage units were not allocated. This implies that the FRR in the system were excessively allocated. By contrast, using the FRR calculated with the proposed method, the 1-min recovery frequency of Longmen Power Plant decreased considerably following a generator outage when the pumped storage units were allocated to pumping water; however, a frequency higher than the system safety constraints was maintained. Thus, modifying the FRR with the proposed method can effectively conserve power while complying with system safety criteria.
Figure 4.
The one-minute recovery frequency following the largest on-line generator outage on weekend comparison between the proposed method and TPC-MD.
Figure 4.
The one-minute recovery frequency following the largest on-line generator outage on weekend comparison between the proposed method and TPC-MD.
4.2. The Power Flow Simulation after the Longman Plant Integrated into Taipower System
The inclusion of the Longmen Power Plant in Taiwan’s power system has generated changes in the country’s overall power flow. According to the statistics provided by Taipower, power consumption in Northern Taiwan is greater than that in both Central and Southern Taiwan. However, the combined generation capacity of Central and Southern Taiwan exceeds that of Northern Taiwan. Thus, power generated in Southern Taiwan must be transported to Central Taiwan and then to Northern Taiwan. Considering the stability of the power system, overloading must be prevented in the central to northern transmission lines. The reason for only considering the central to northern transmission is because when a generator failure occurs at Longmen Power Plant, which is located in Northern Taiwan, the auxiliary power allocated from Southern Taiwan to Northern Taiwan is transported via Central Taiwan. Therefore, the central to northern power flow is crucial for identifying transmission line overloading. In addition, based on previous experience, large amounts of power are transported from Central and Southern Taiwan to Northern Taiwan during weekdays (especially during peak time), specifically, from Central Taiwan to Northern Taiwan.
Because Longmen Power Plant is a nuclear power plant that has relatively low generation costs, it is considered a base-load generator. Thus, besides annual generator maintenance, inspection, and failure, the Longmen power plant is operational throughout the year. In addition, the power system’s largest generator was upgraded from 985 MW (Generator 1 at Nuclear Power Plant 2) to 1350 MW (Generator 1 at Longmen Power Plant), with a 40% capacity increase. This facilitated a considerable decline in south to north power flow and increased the power system stability. However, demand for off-peak power allocation from Northern Taiwan to Southern Taiwan may increase during winter. Furthermore, outages are prone to occur at Longmen Power Plant during the winter holiday period. When an outage occurs, FRR must be generated from Central and Southern Taiwan to support the loss of generation capacity in the north. This significantly increases the allocation of power from Southern Taiwan to Northern Taiwan, which reduces the power system stability.
This study used power analysis software PSS®E supplemented with the Newton-Raphson algorithm to conduct steady-state power flow analysis of the power system in Taiwan during the winter holiday period (peak, mid-peak, and off-peak time), and to test the feasibility of the proposed strategy.
4.2.1. The Distribution of Generation and Load in Taiwan Power System
As shown in
Table 3, Taipower provided data regarding the generation and load capacities for Northern, Central, and Southern Taiwan from 2012 to 2014. The 2012 load data were obtained before the Longmen Power Plant was incorporated into the power system; whereas the 2013 and 2014 load data were obtained following the incorporation of Generators 1 and 2 at Longmen Power Plant in the power system. These data were primarily categorized and explained in the following three time periods:
- (1)
Peak time: The highest load capacity was in Northern Taiwan, followed by Southern Taiwan and then Central Taiwan. The generating capacity of Northern Taiwan was insufficient for the load demand.
- (2)
Mid-peak time: Besides Central Taiwan exhibiting a lower generating capacity than load capacity in 2014, the demand, supply, and distribution of the load and generating capacities were identical to those of the peak time.
- (3)
Off-peak time: Fluctuations in the supply, demand, and distribution of the generating and load capacities were apparent in 2013. Besides Central Taiwan, the generating capacities of Northern and Southern Taiwan were higher than the load capacities.
Table 3.
The distribution of generation and load from 2012 to 2014 in Taiwan power system.
Table 3.
The distribution of generation and load from 2012 to 2014 in Taiwan power system.
| | North | Central | South | Total (MW) |
|---|
| (MW) | % | (MW) | % | (MW) | % |
|---|
| 2012 Year | Peak time | Generation | 11,023.1 | 33.60 | 10,999.3 | 33.53 | 10,745.9 | 32.75 | 32,768.3 |
| Load | 13,391.7 | 41.43 | 9,296.0 | 28.76 | 9,330.2 | 28.86 | 32,017.9 |
| Mid-peak time | Generation | 8,869.3 | 32.86 | 8,338.8 | 30.89 | 9,742.9 | 36.10 | 26,951.0 |
| Load | 11,525.8 | 42.65 | 7,571.6 | 28.01 | 7,664.7 | 28.36 | 26,762.1 |
| Off-peak time | Generation | 5,308.1 | 33.60 | 4,234.3 | 26.81 | 6,233.8 | 39.46 | 15,776.2 |
| Load | 5,856.8 | 37.48 | 3,987.2 | 25.52 | 5,585.1 | 35.75 | 15,429.1 |
| 2013 Year | Peak time | Generation | 11,977.5 | 34.13 | 11,280.8 | 32.14 | 11,786.0 | 33.58 | 35,044.3 |
| Load | 14,320.3 | 41.41 | 9,378.4 | 27.12 | 10,452.1 | 30.23 | 34,150.8 |
| Mid-peak time | Generation | 11,569.3 | 39.13 | 8,990.4 | 30.41 | 8,986.8 | 30.40 | 29,546.5 |
| Load | 12,502.5 | 42.84 | 7,592.1 | 26.01 | 8,722.3 | 29.88 | 28,816.9 |
| Off-peak time | Generation | 6,246.3 | 40.42 | 3,265.6 | 21.13 | 5,920.2 | 38.31 | 15,432.1 |
| Load | 5,941.4 | 38.48 | 3,957.4 | 25.63 | 5,361.4 | 34.72 | 15,260.2 |
| 2014 Year | Peak time | Generation | 13,676.7 | 38.97 | 10,098.6 | 28.78 | 10,025.8 | 28.57 | 33,801.1 |
| Load | 14,864.1 | 42.98 | 9,310.4 | 26.92 | 10,327.0 | 29.86 | 34,501.5 |
| Mid-peak time | Generation | 12,667.7 | 42.84 | 7,700.1 | 26.04 | 9,537.7 | 32.26 | 29,905.5 |
| Load | 12,931.8 | 44.31 | 8,100.1 | 27.75 | 8,984.5 | 30.78 | 30,016.4 |
| Off-peak time | Generation | 8,737.8 | 56.55 | 3,000.3 | 19.42 | 6,974.6 | 45.14 | 18,712.7 |
| Load | 7,878.0 | 51.02 | 4,934.5 | 31.96 | 5,473.3 | 35.45 | 18,285.8 |
According to the data, the load capacity of Northern Taiwan accounted for the largest proportion of the overall load capacity in previous years, and that for Central and Southern Taiwan occupied less. In the three years, the generating capacity of Northern Taiwan gradually improved. This was primarily because Longmen Power Plant was incorporated into Taiwan’s power system.
The PSS
®E analysis results showed that power in Northern Taiwan was primarily supplemented by power from Central and Southern Taiwan before the Longmen Power Plant was incorporated in 2012 (
Table 4). The central to northern peak and mid-peak transmission capacities exceeded 2400 MW; whereas Northern Taiwan exhibited a higher off-peak generating capacity than load capacity because of the power generated by the nuclear generators of Nuclear Power Plants 1 and 2 in the north, reducing the central to northern off-peak transmission capacity to 628 MW. Subsequently, the central to northern peak transmission capacity after Longmen Power Plant’s Generator 1 was incorporated into Taiwan’s power system in 2013 was similar to that for 2012 because of increased demand; however, with the addition of Nuclear Generator 1 (1350 MW) in the north, the central to northern mid-peak and off-peak transmission capacities drastically declined, even exhibiting inverse northern to central off-peak power transmission.
Table 4.
The central to northern power flow capacity in the three periods during the winter from 2012 to 2014.
Table 4.
The central to northern power flow capacity in the three periods during the winter from 2012 to 2014.
| Year duration | 2012 | 2013 | 2014 |
|---|
| Peak time | 2426.4 (MW) | 2440.9 (MW) | 1086.7 (MW) |
| Mid-peak time | 2566.6 (MW) | 1011.1 (MW) | 322.5 (MW) |
| Off-peak time | 628.6 (MW) | −349.7 (MW) | −742.7 (MW) |
In 2014, both Generators 1 and 2 at Longmen Power Plant will be operational; thus, a total generators from a total of three power plants will be operational in Northern Taiwan (Longmen Power Plant and Nuclear Power Plants 1 and 2). The central to northern peak transmission capacity will decline to 1000 MW, and the northern to central off-peak transmission capacity is set to reach 743 MW. These results indicate that after the inclusion of Longmen Power Plant in Taiwan’s power system, the flow of power throughout Taiwan will change. In the following section, based on the three time periods during the winter of 2014, this study investigated whether the proposed strategy can maintain an acceptable transmission capacity for the system’s power flow distribution in the event of a failure (n−1) with one of Longmen Power Plant’s generators.
4.2.2. Power Lower during Peak Time from Central to North
Currently, the backbone of Taiwan’s transmission network uses six 345 kV extra-high voltage transmission lines running south to north. Based on the lines transporting power to the north, including Tian Lun to Northern Long Tan, Wu Feng branch to Northern Long Tan, E Mei to Southern Long Tan, and Zhu Yuan to Southern Long Tan, this study conducted power flow analysis of pre-failure, 1-min post failure, and 30-min post failure during peak, mid-peak, and off-peak time.
The system’s power flow is tabulated in
Table 5. If one of the generators at Longmen Power Plant fails, the loss in generating capacity is 1350 MW. Subsequently, most of the pumped storage units used for FRR are distributed in Southern Taiwan and commence operations within 1 min. Thus, central to northern transmission capacity increases to 1992 MW, which is 910 MW higher than that before failure. However, this capacity is lower than the central to northern flow constraint. The power shortage was replenished by the northern thermal generators assigned as spinning reserves within 30 min post failure. Consequently, power transported from Central Taiwan to Northern Taiwan achieved stability.
Table 5.
Comparison between the central to northern power flow capacities post failure for peak time in 2014.
Table 5.
Comparison between the central to northern power flow capacities post failure for peak time in 2014.
| 2014 Peak time | Pre-breakdown | 1-min | 30-min |
|---|
| Tien-Lun ~ Lung-Tan North | 455.6 | 794.2 | 796.9 |
| Wu-Feng Branch ~ Lung-Tan North | 752.8 | 904.5 | 910.7 |
| E-Mei ~ Lung-Tan South | 83.5 | 242.1 | 192.3 |
| Chu-Yuan ~ Lung-Tan South | −205.2 | 52.0 | −29.4 |
| Total (MW) | 1086.7 | 1992.8 | 1870.5 |
4.2.3. Power Lower during Mid-Peak Time from Central to North
The system’s power flow results are tabulated in
Table 6. If one of the generators at Longmen Power Plant fails, the loss in generating capacity reaches 1350 MW. Subsequently, the majority of the pumped storage units used for FRR are distributed in Southern Taiwan and commence operations within 1 min. Thus, the transmission capacity to the north drastically increases to 1458 MW following the ascension and inclusion of the pumped storage units. This is a significant 1100 MW increase compared to that before failure. However, this capacity is lower than the central to northern flow constraint. The power shortage was replenished by the northern thermal generators assigned as spinning reserves within 30 min post failure. Consequently, the power transported from Central Taiwan to Northern Taiwan achieved stability at 641 MW.
Table 6.
Comparison between the central to northern power flow capacities post failure for mid-peak time in 2014.
Table 6.
Comparison between the central to northern power flow capacities post failure for mid-peak time in 2014.
| 2014 Mid-peak time | Pre-breakdown | 1-min | 30-min |
|---|
| Tien-Lun ~ Lung-Tan North | 240.0 | 648.0 | 429.6 |
| Wu-Feng Branch ~ Lung-Tan North | 517.8 | 698.0 | 661.0 |
| E-Mei ~ Lung-Tan South | −53.7 | 155.4 | −59.1 |
| Chu-Yuan ~ Lung-Tan South | −381.6 | −43.0 | −390.4 |
| Total (MW) | 322.5 | 1458.4 | 641.1 |
4.2.4. Power Lower during Off-Peak Time from Central to North
The system’s power flow is tabulated in
Table 7. If one of the generators at Longmen Power Plant fails, the loss in generating capacity reaches 1350 MW. Subsequently, most of the pumped storage units used for FRR are distributed in Southern Taiwan and commence operations within 1 min. Following the ascension and inclusion of pumped storage units, the original north to center transmission was changed to a central to northern transmission, and the central to northern transmission capacity reached 460 MW, which is 1200 MW higher than that before failure. The power shortage was replenished by the northern thermal generators assigned as spinning reserves within 30 min post failure. Finally, the power flow was returned to the original north to center transmission and achieved stability.
Table 7.
Comparison between the central to northern power flow capacities post failure for off-peak time in 2014.
Table 7.
Comparison between the central to northern power flow capacities post failure for off-peak time in 2014.
| 2014 Off-peak time | Pre-breakdown | 1-min | 30-min |
|---|
| Tien-Lun ~ Lung-Tan North | 65.6 | 485.6 | 223.8 |
| Wu-Feng Branch ~ Lung-Tan North | −11.9 | 205.3 | 117.8 |
| E-Mei ~ Lung-Tan South | −224.0 | −20.7 | −281.9 |
| Chu-Yuan ~ Lung-Tan South | −572.4 | −211.0 | −633.8 |
| Total (MW) | −742.7 | 459.2 | −574.1 |
5. Conclusions
Based on results derived from the pumped storage unit dispatch policy proposed in this study and actual test cases, we discovered that the original methods for calculating the FRR led to the use of excessive amounts of planned FRR to achieve better safety rated frequency. However, despite the arrangement of sufficient spinning reserves, if a proper pumped storage dispatch policy is not followed, spinning reserve can fail to attain expected safety goals and can cause load shedding. Besides, excessive planning for pumping loads during winter weekend leaves systems without sufficient spinning reserves to address the next incident that occurs after a major contingency. The limits used in pumped storage unit dispatching ensure that the number of pumped storage units dispatched when a contingency occurs is reduced. Adopting the pumped storage dispatch policy proposed in this study increases safety during certain periods and reduces the number of dispatches required after a contingency event occurs and maintains sufficient spinning reserve to handle the next emergency. This policy reduces the number of times pumped storage units are disconnected and connected, lowering the costs incurred from machinery failures and repetitive dispatches. In addition, the PSS®E simulation and analysis results indicated that following a failure at Longmen Power Plant, large amounts of power are transmitted from Central Taiwan to Northern Taiwan, generating transmission safety risks. By incorporating the proposed strategy, the results showed that the power flow distribution was within the safety constraints of the transmission lines.
Finally, based on the discussions and tests conducted with personnel from the Taipower dispatch office, we confirmed that the policy recommended in this study can serve as a reference for power system dispatchers. It not only ensures power quality and increases the reliability of power systems, but it reduces system operating costs.


