Analysis and Assessments of Combined Cooling, Heating and Power Systems in Various Operation Modes for a Building in China, Dalian


Abstract
:1. Introduction
2. Descriptions of HVAC System and CCHP System
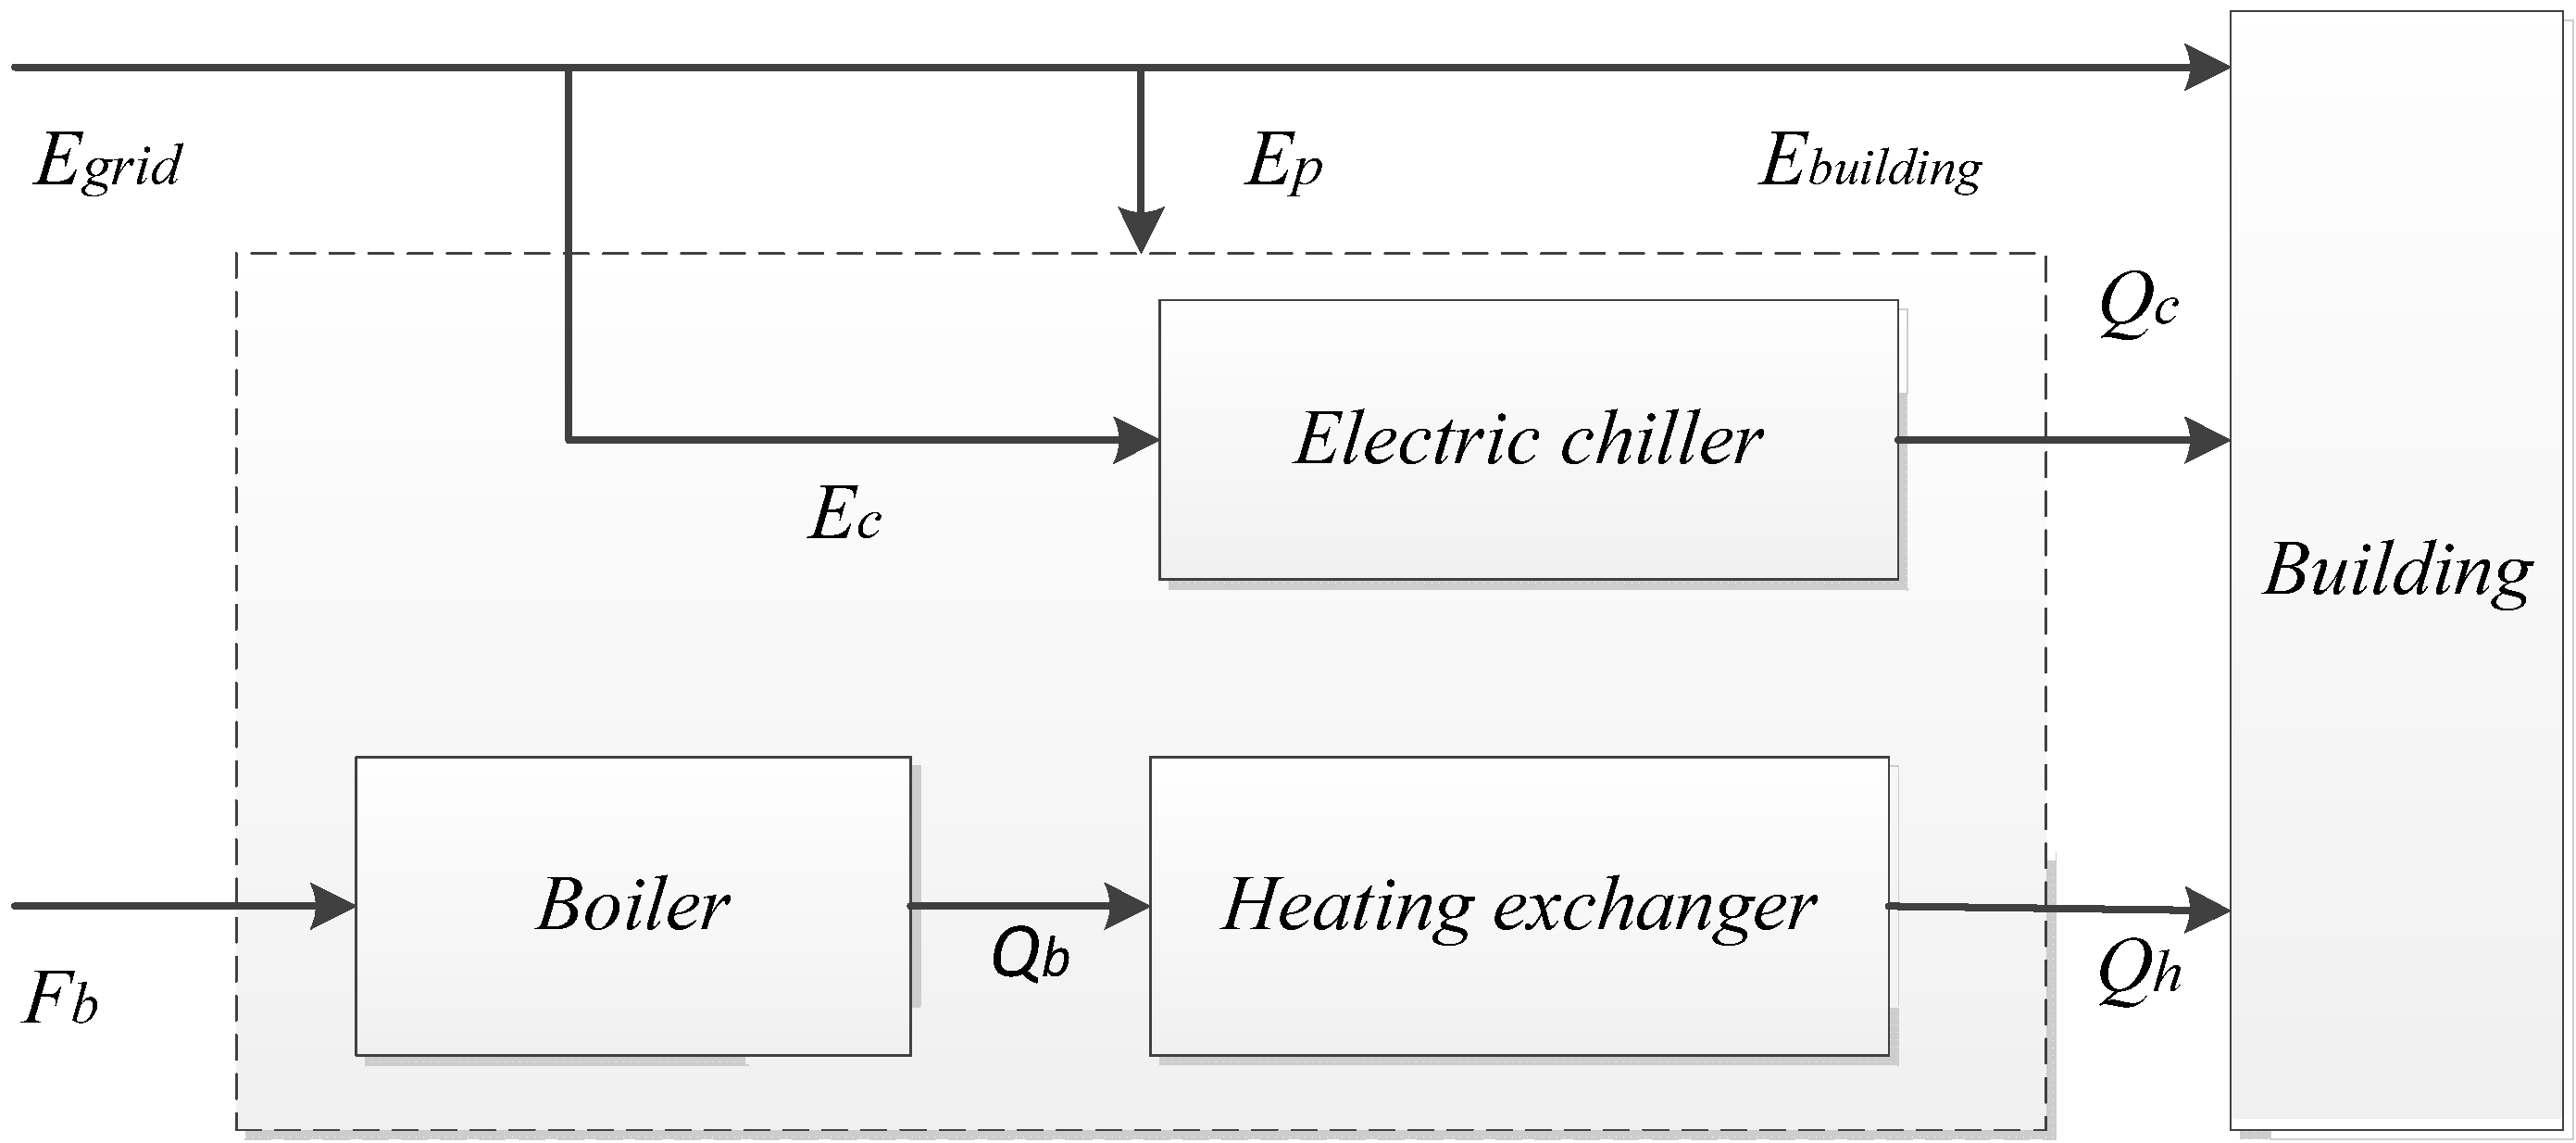
2.1. HVAC System
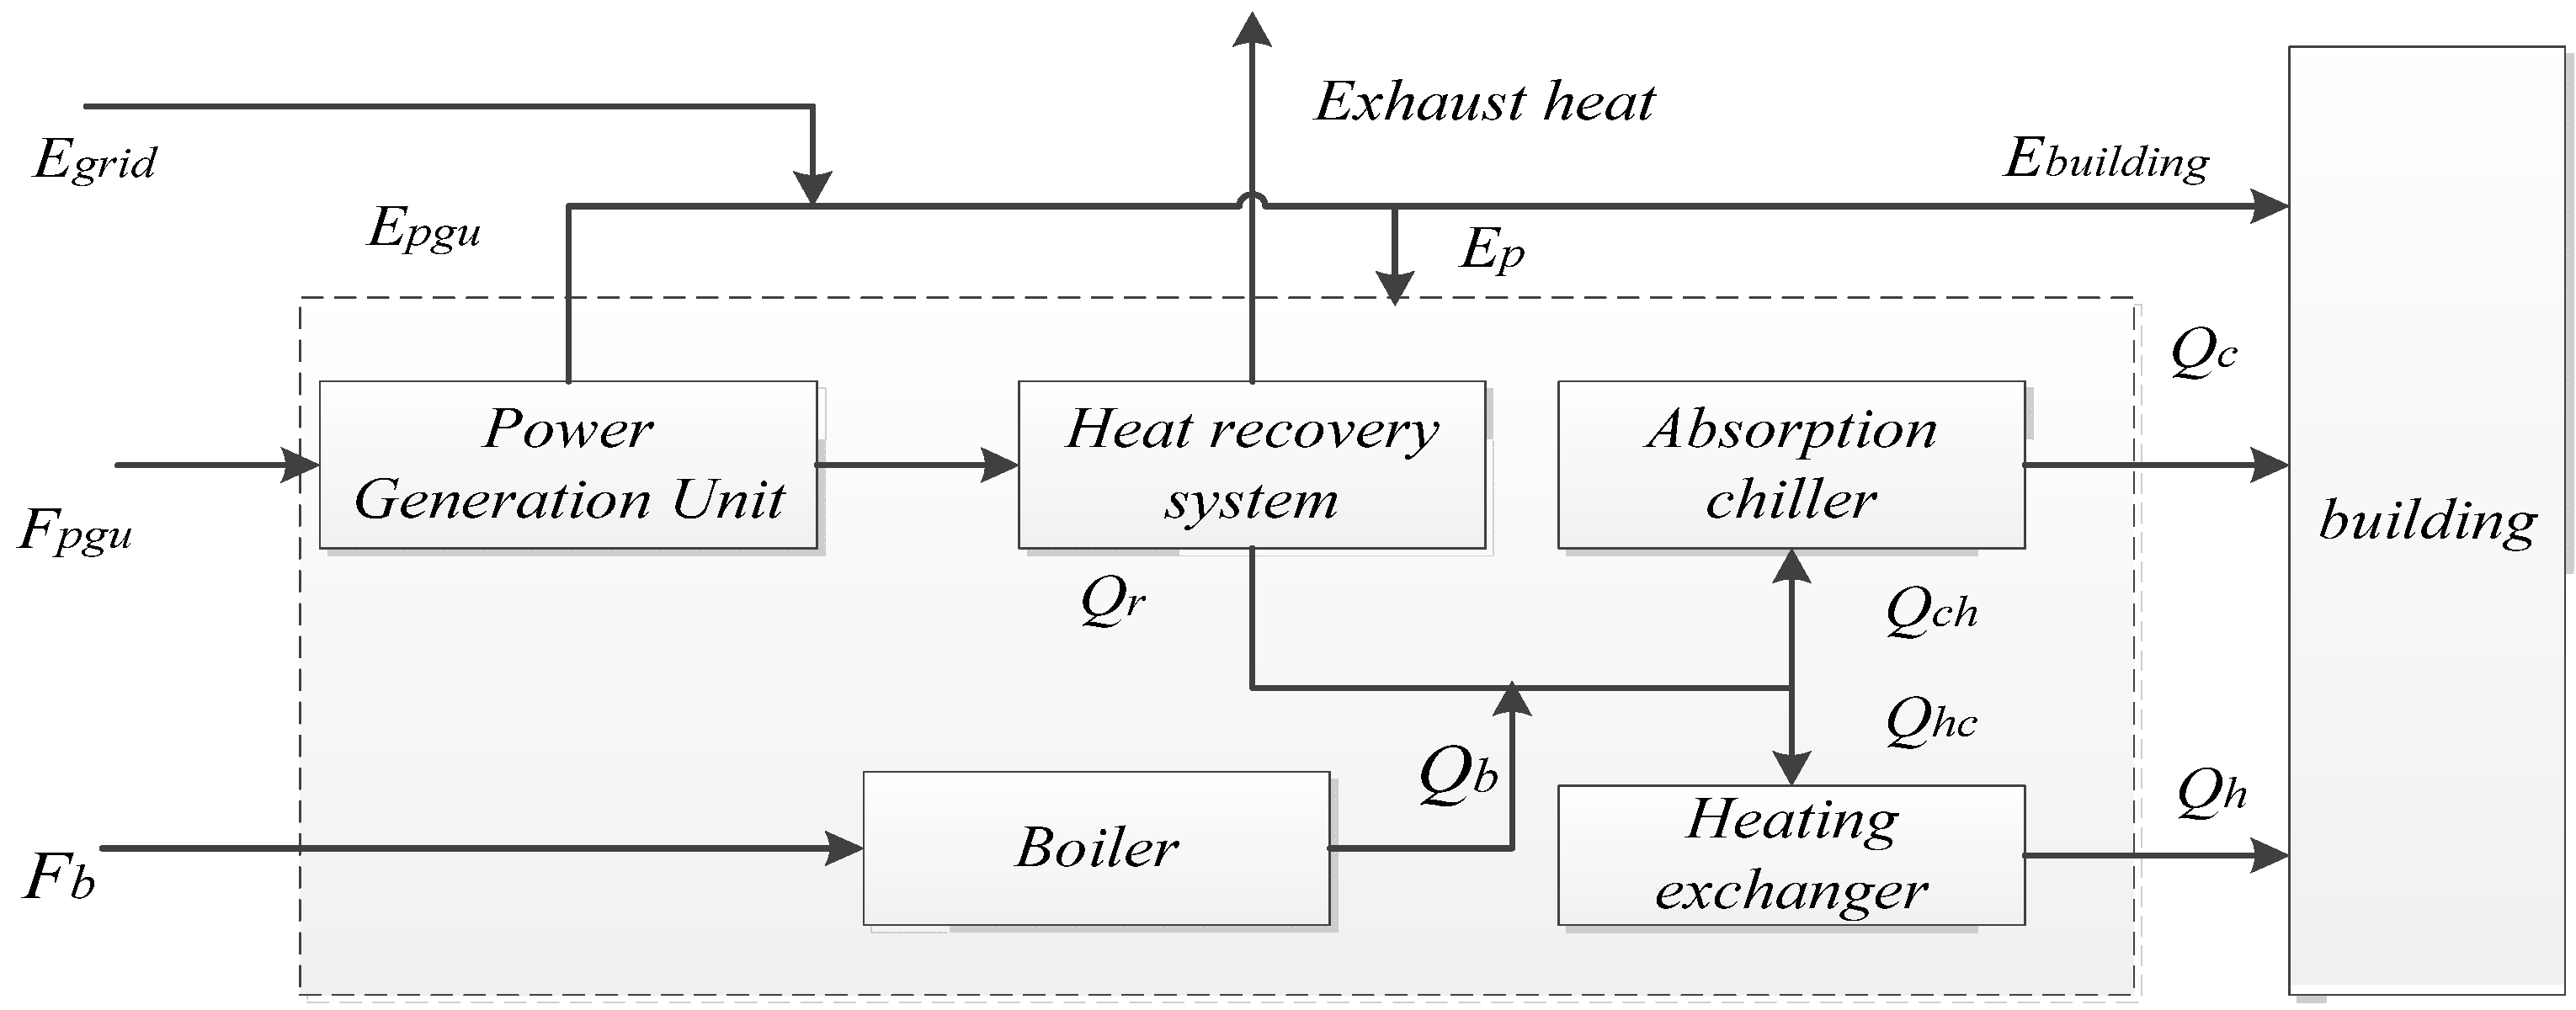
2.2. CCHP Model

- (1)
- The CCHP equipment can operate anywhere between 0% and 100% of its rated capacity, and ramping rate for load adjustment is not included;
- (2)
- The CCHP system is assumed to be 100% reliable;
- (3)
- The efficiency drops of CCHP equipments at part load operation are neglected to simplify the analysis and calculations.
3. Optimization Criteria
3.1. Primary Energy Saving
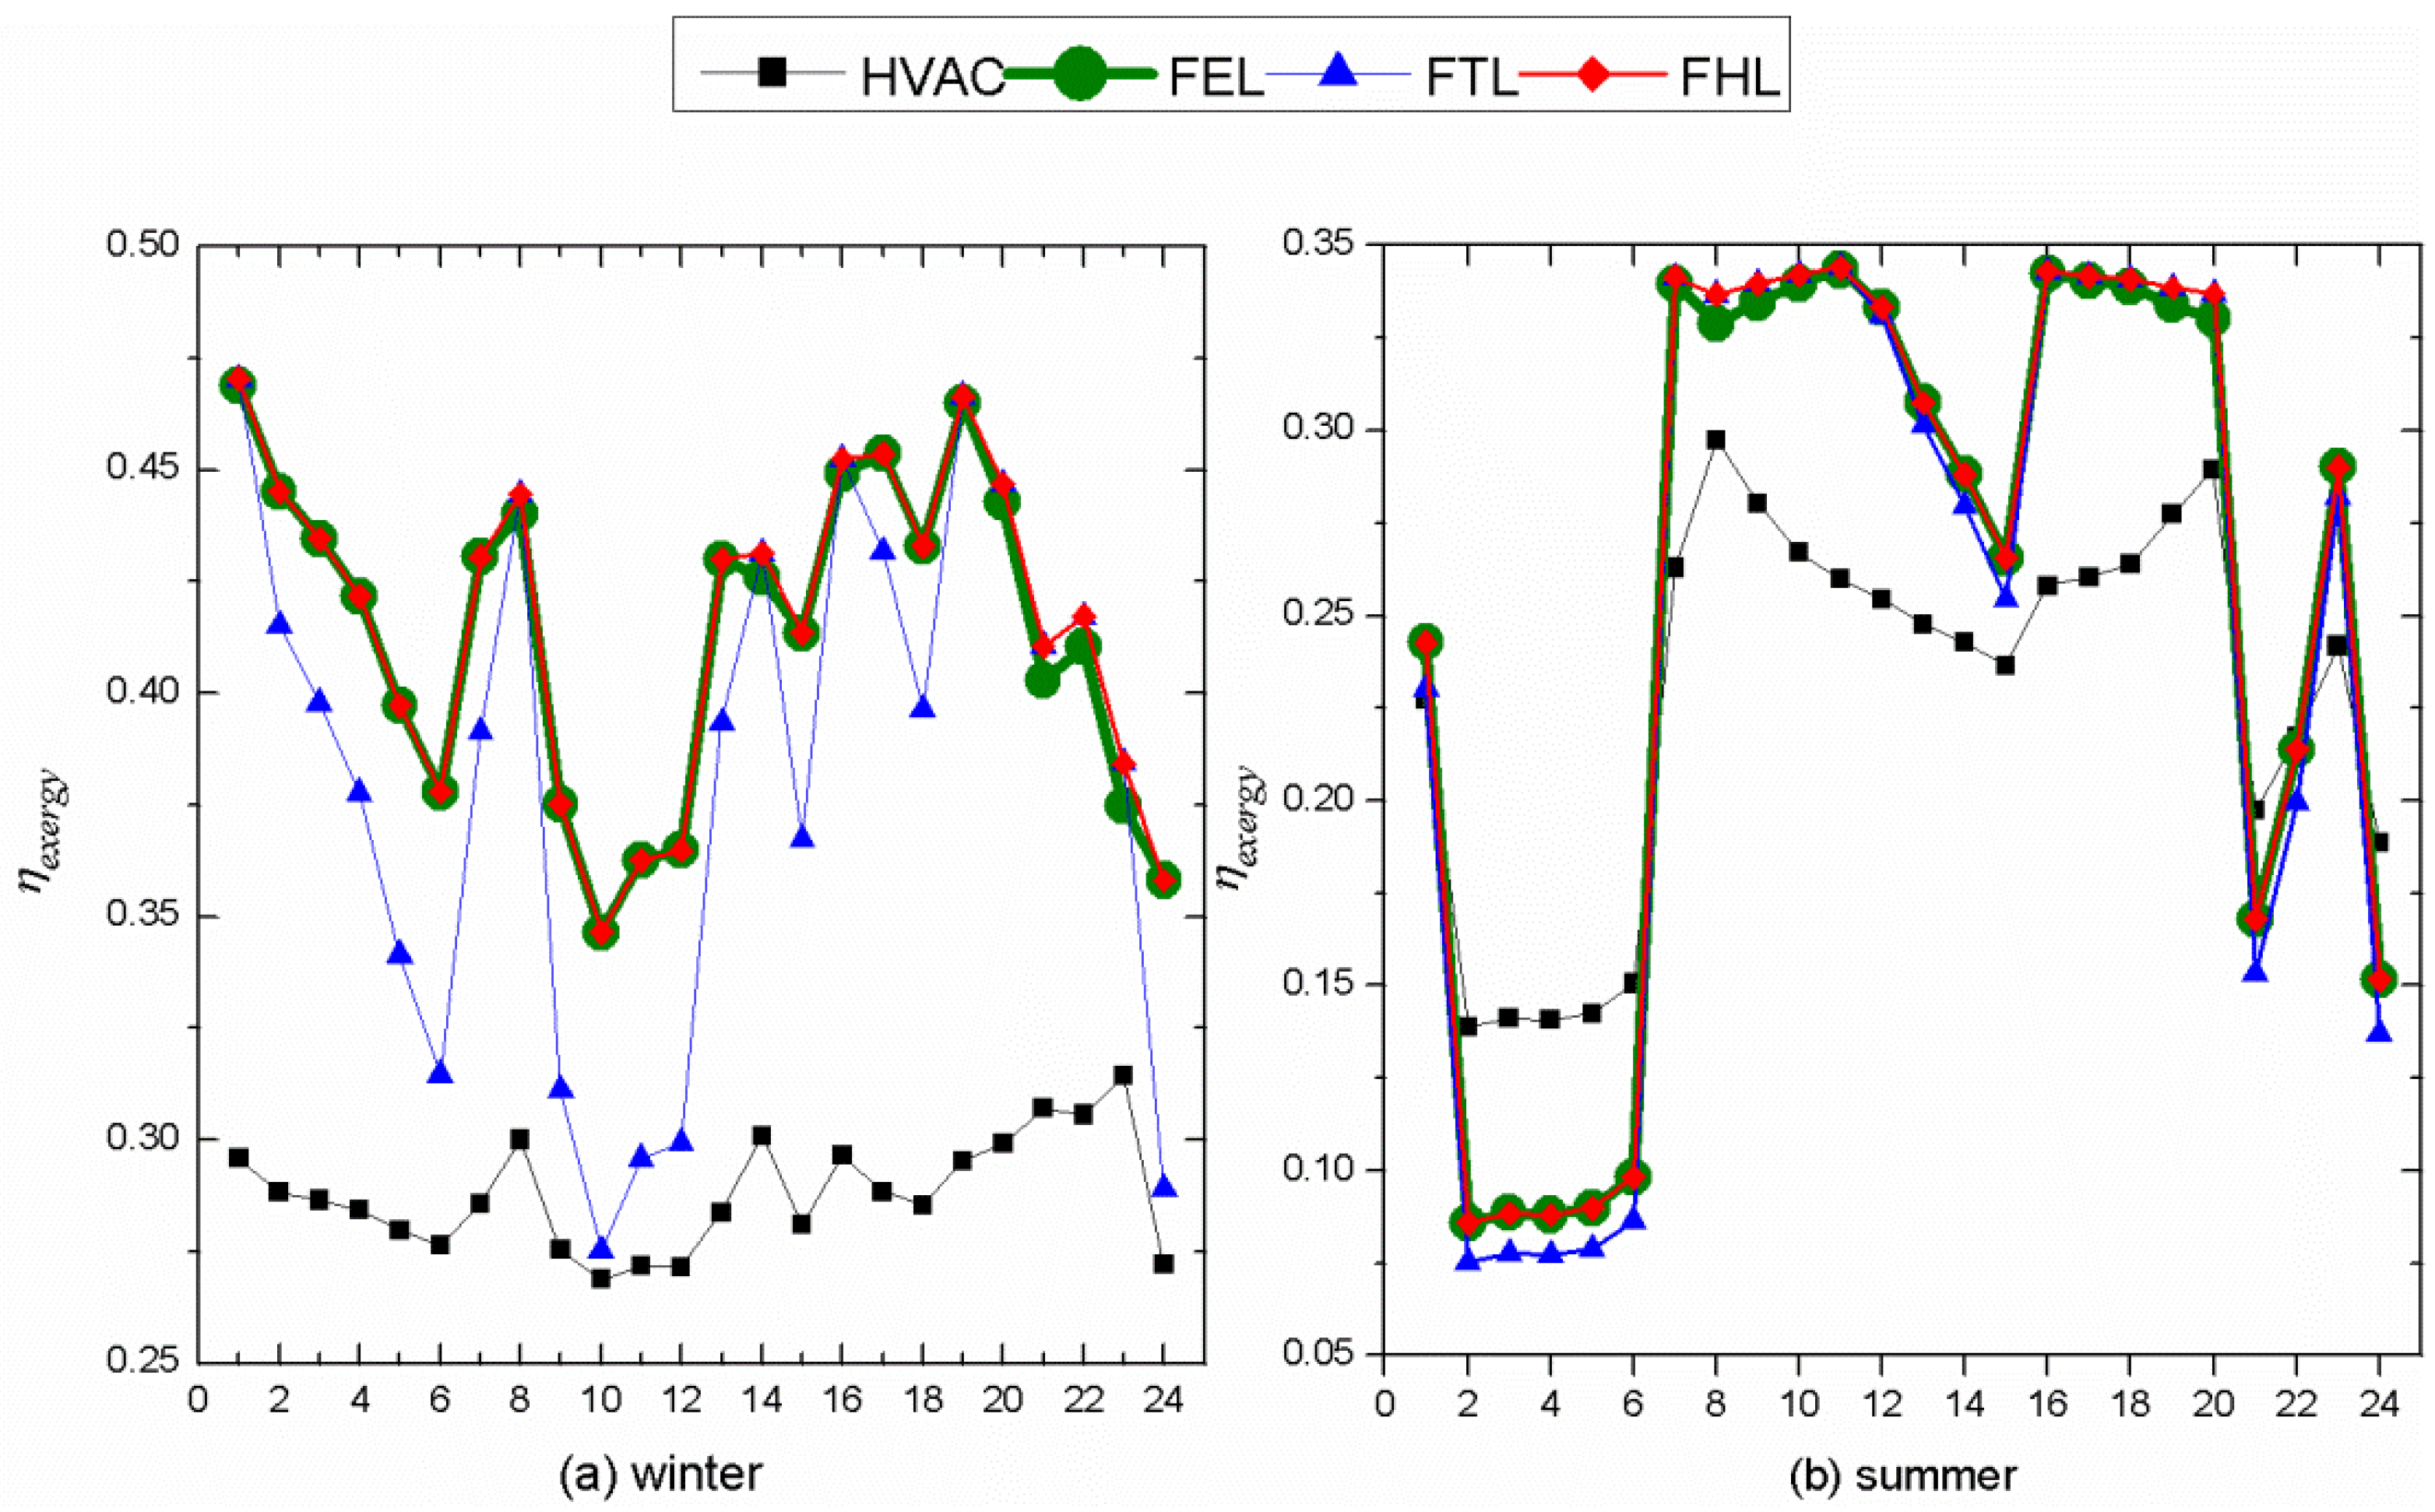
3.2. Exergy Efficiency
3.3. CO2 Emission Reduction
4. Analysis and Discussion
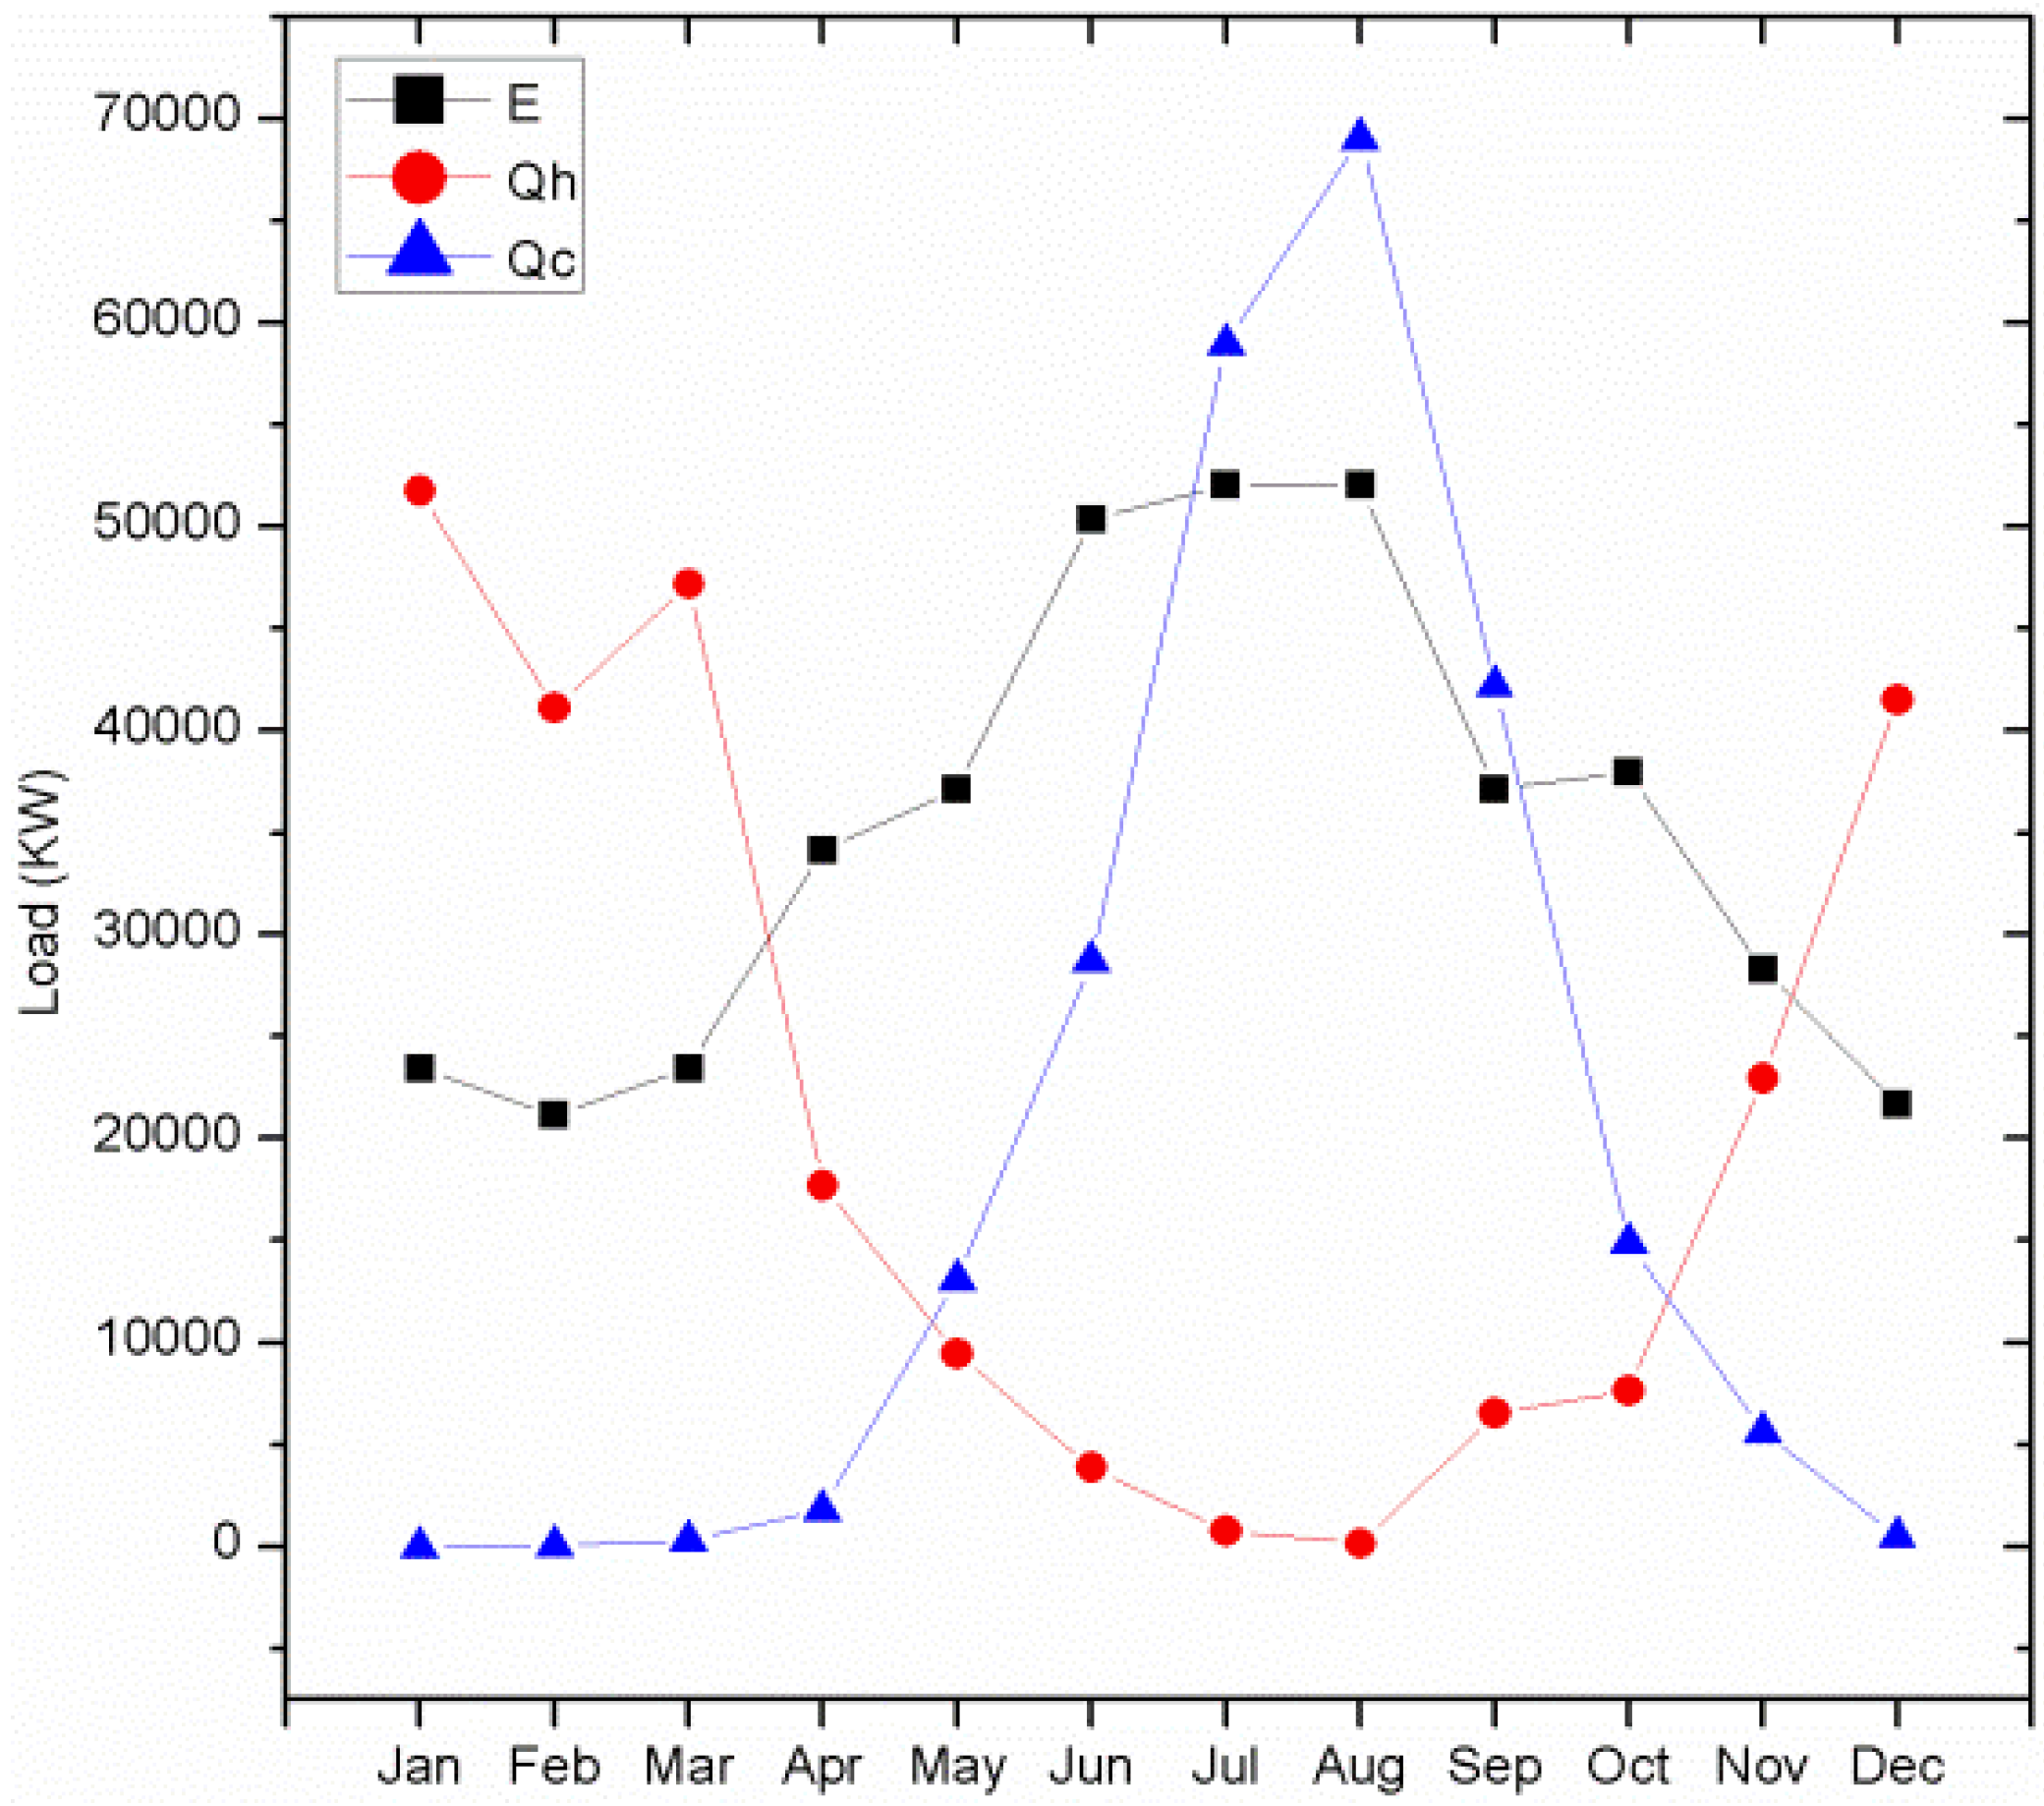
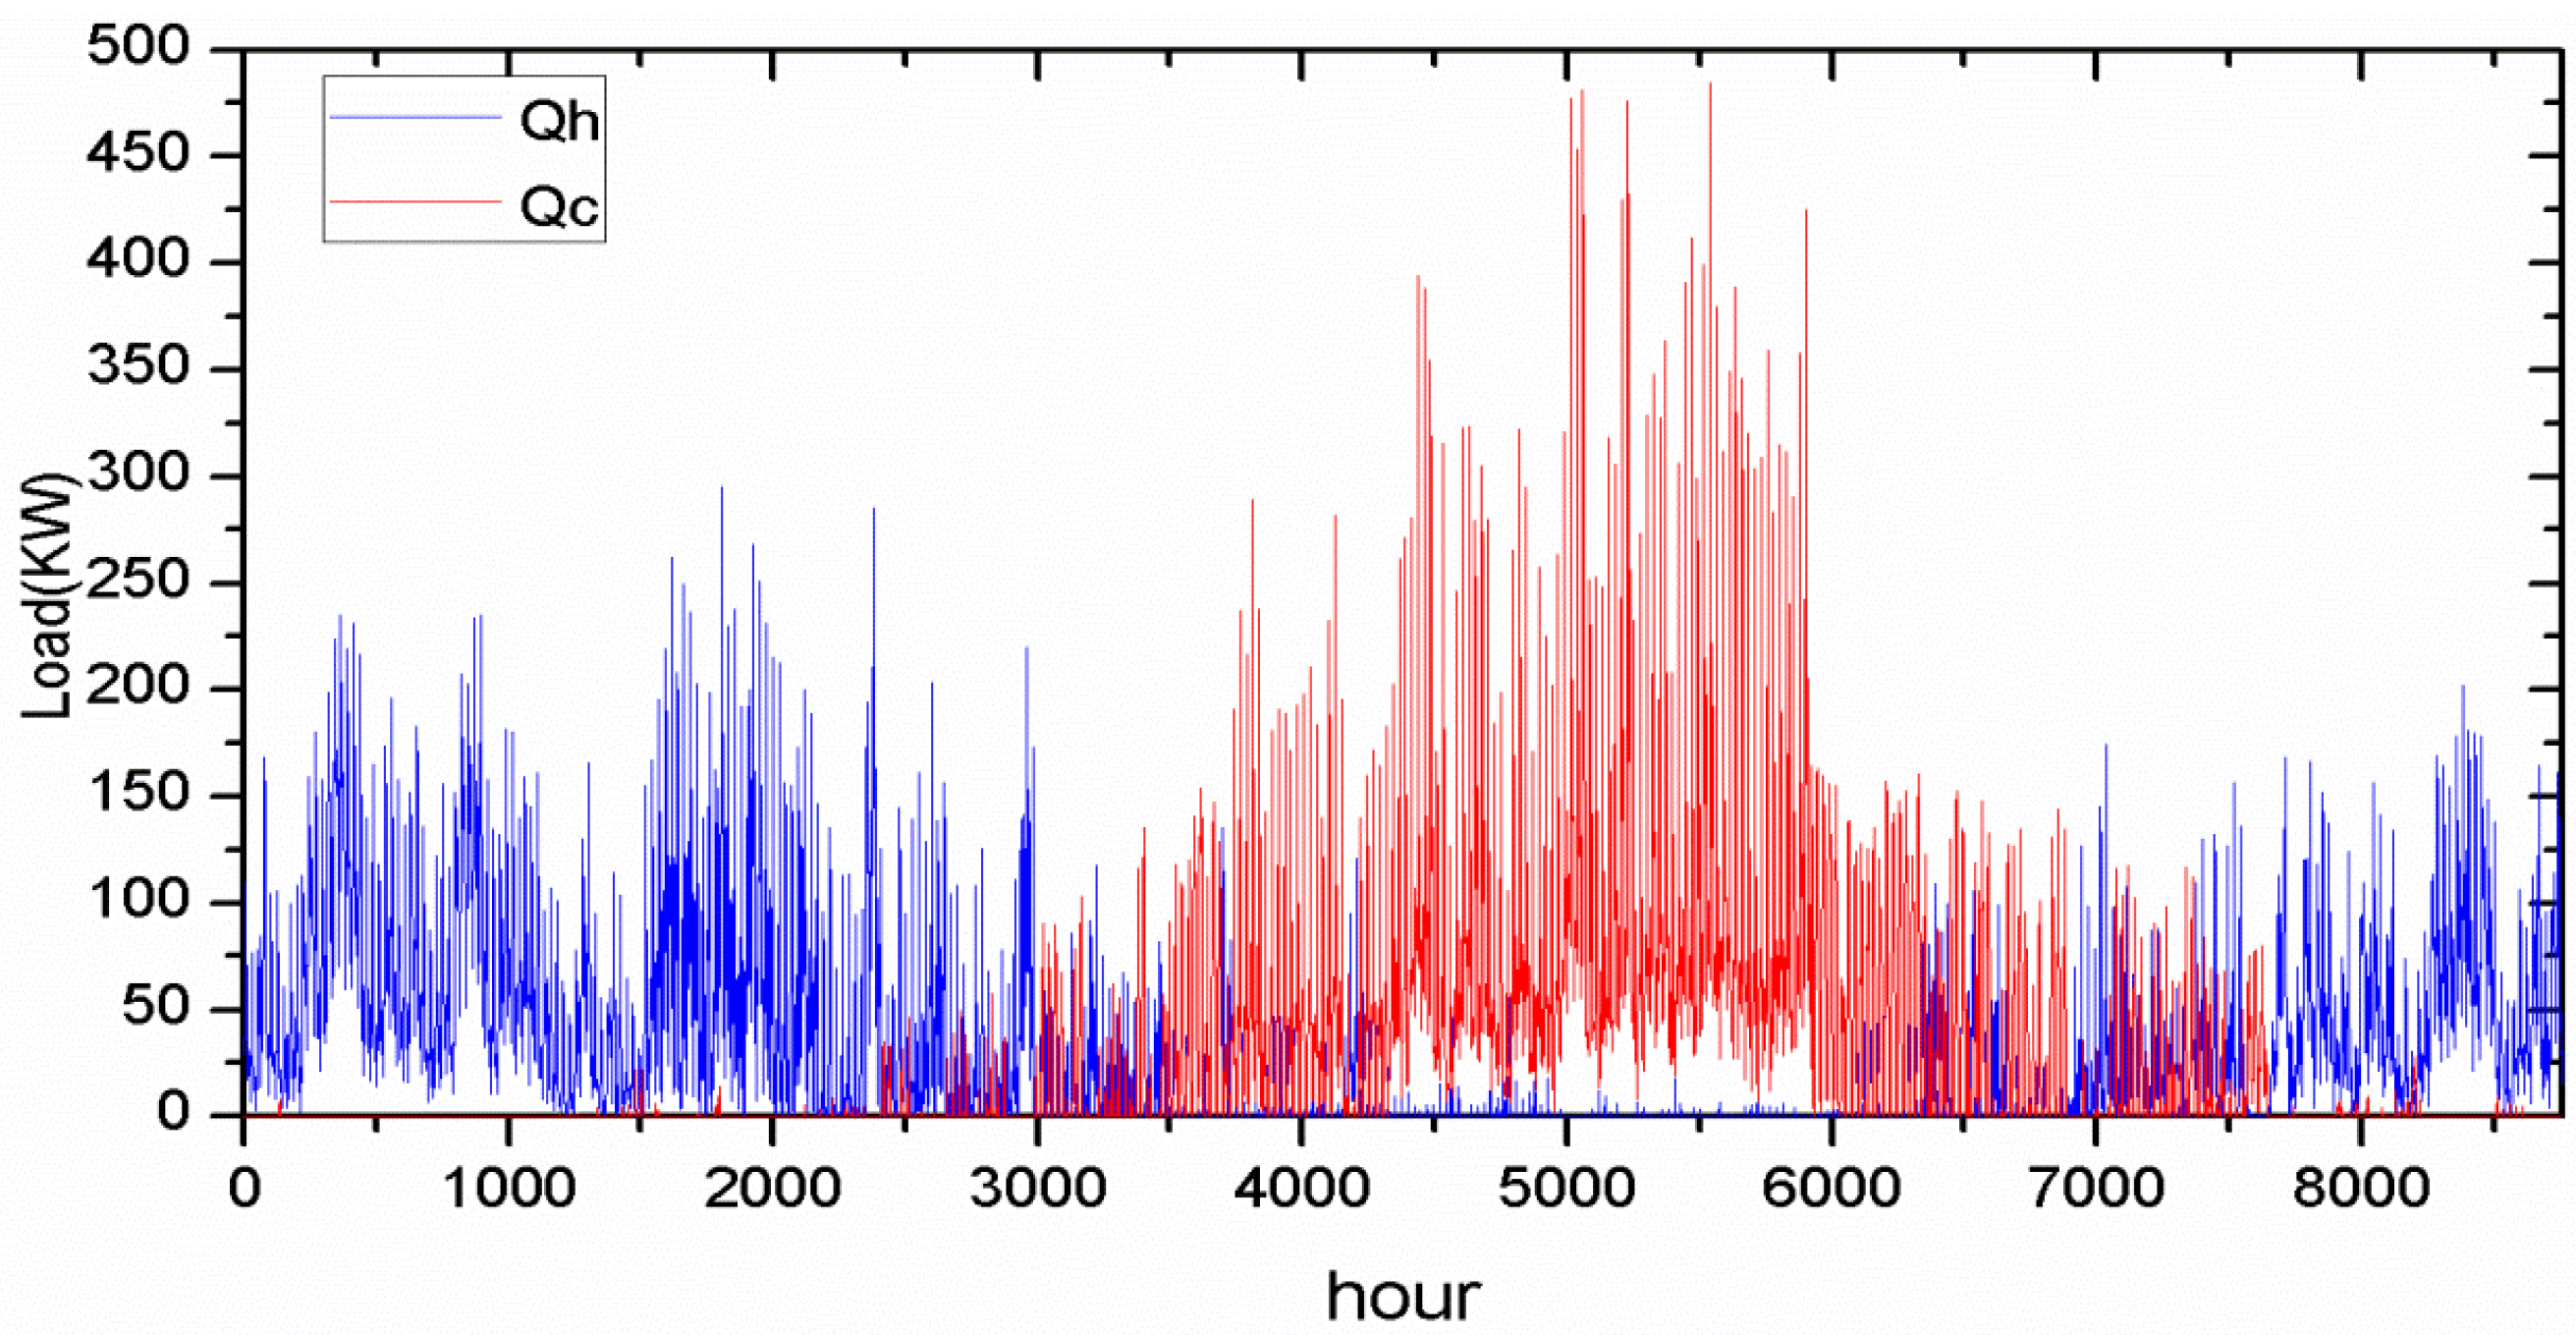
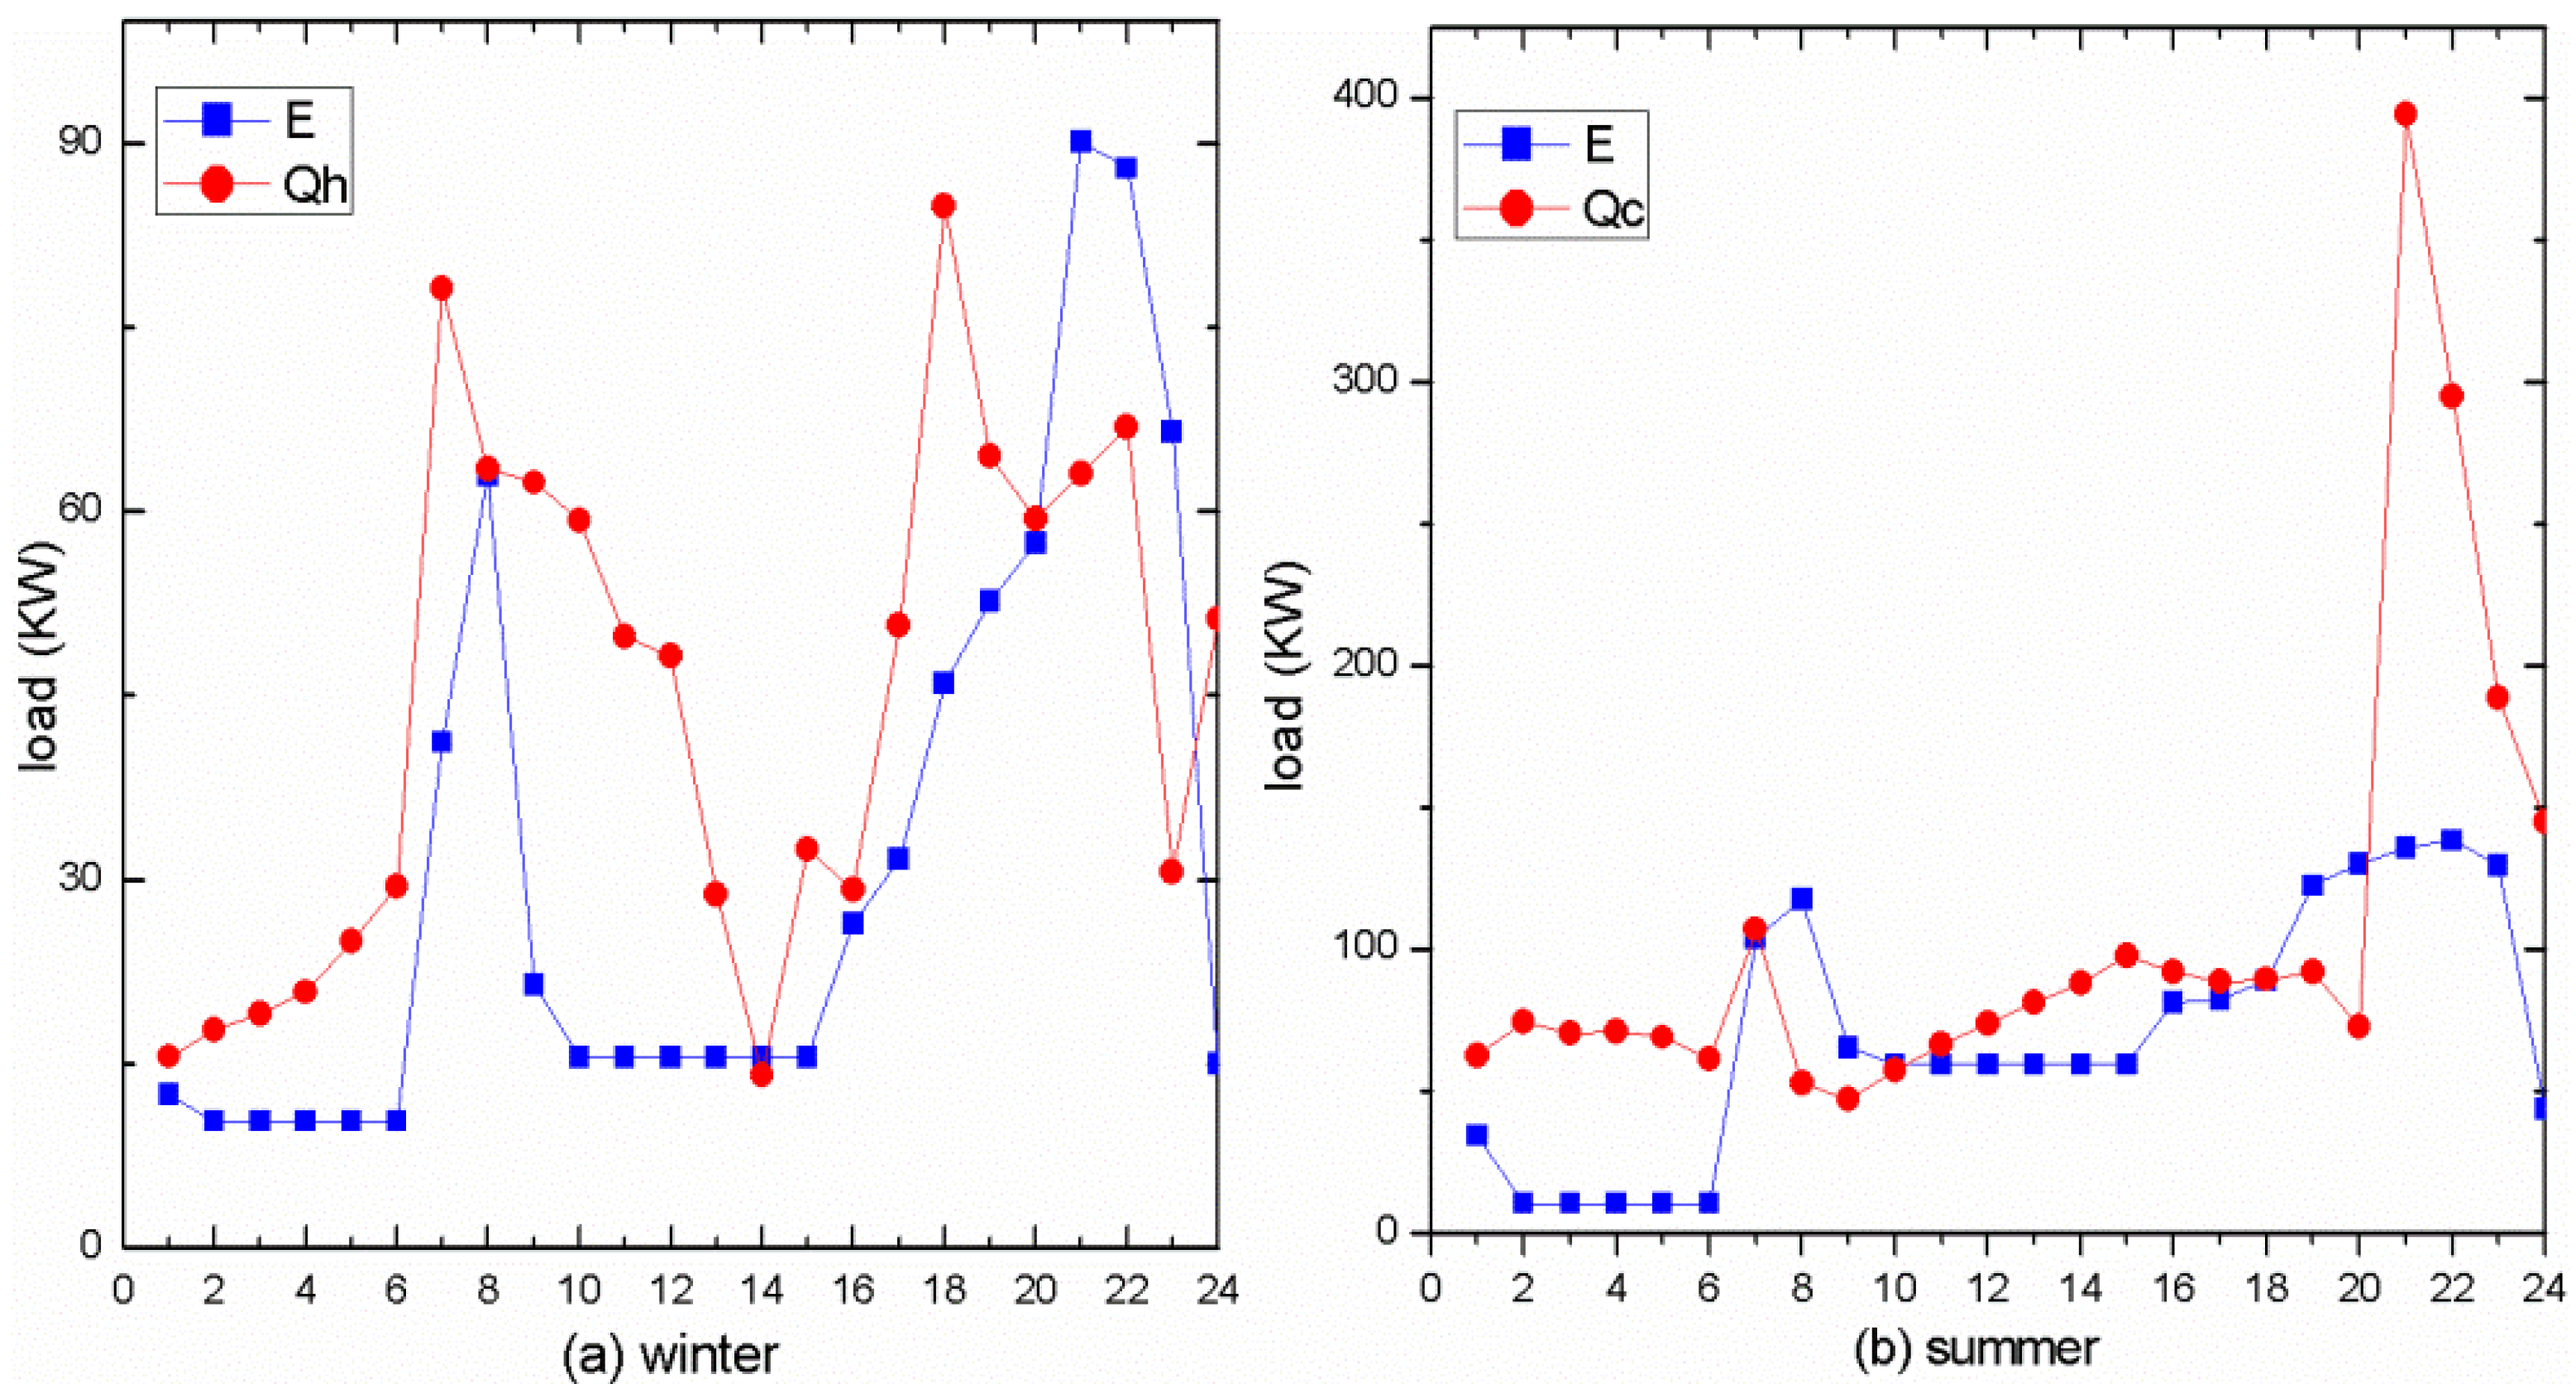
4.1. Building Description and Energy Demand

| Location | Dalian China | |
|---|---|---|
| Building type | Hotel | |
| Total area | 3467 m2 | |
| People | 2 for everyday | |
| Room | Occupancy schedule | Until a (fraction) b: 7(1), 9(0.5), 11(0.3), 12(0.1), 14(0.5), 16(0.3), 18(0.1), 21(0.3), 23(1) |
| Electric equipment | 20 W/m2 | |
| Equipment schedule | Until a (fraction) b: 6(0.1), 8(0.3), 11(0), 13(0.3), 17(0), 22(1), 23(0.3) | |
| Lights | 15 W/m2 | |
| Lights schedule | Until a (fraction) b: 5(0), 6(0.2), 15(0.1), 17(0.3), 21(1), 22(0.7), 23(0.5) | |
| Thermostat set point | Winter c:18–22 °C ; Summer d: 24–26 °C; Spring and autumn e: 21–24 °C | |
| System | Variable | Symbol | Value |
|---|---|---|---|
| CCHP system | PGU efficiency | ηe | 32% |
| Heat recovery system efficiency | ηrec | 80% | |
| Heating coil efficiency | ηh | 80% | |
| Absorption chiller coefficient of performance | COPch | 0.7 | |
| Boiler efficiency | ηb | 80% | |
| HVAC system | PGU efficiency | 25% | |
| Heating coil efficiency | 80% | ||
| Vapor compression coefficient of performance | COPe | 3 | |
| Boiler efficiency | 80% | ||
| Grid transmission efficiency | ηgrid | 95% | |
| CO2 emission conversion factor (g/KWh) | Electricity from the grid | αe | 923 |
| Gas | αf | 220 |
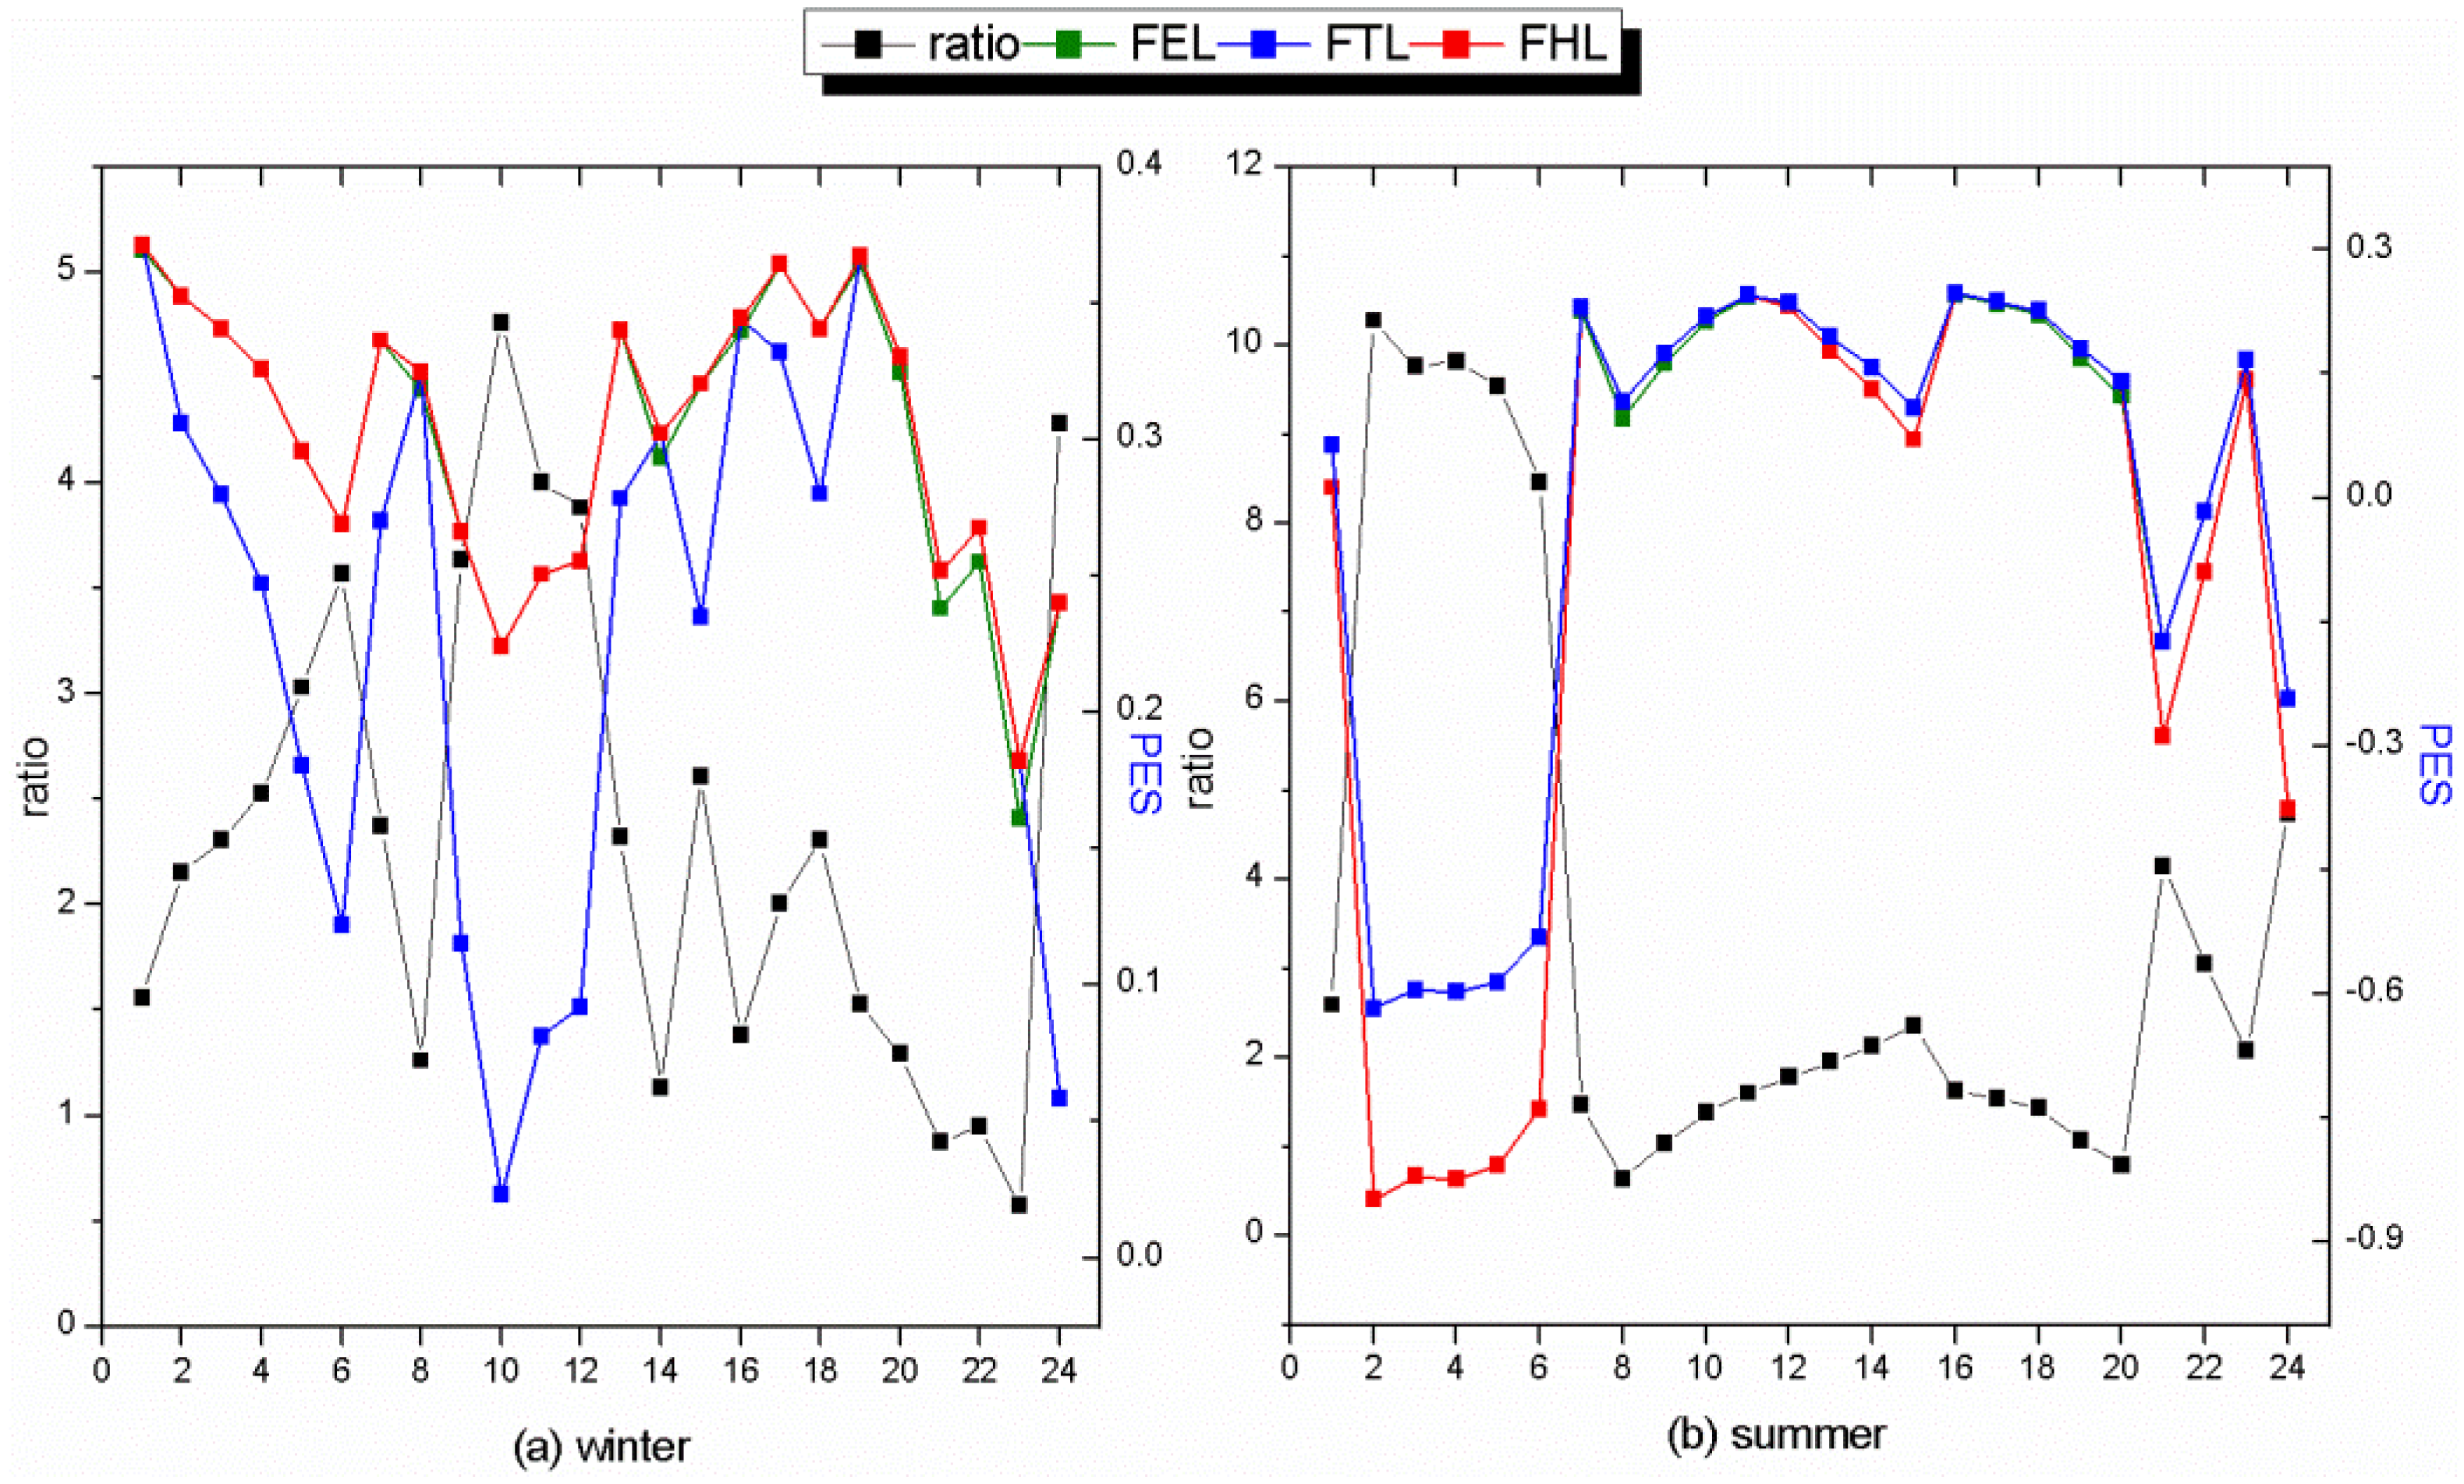
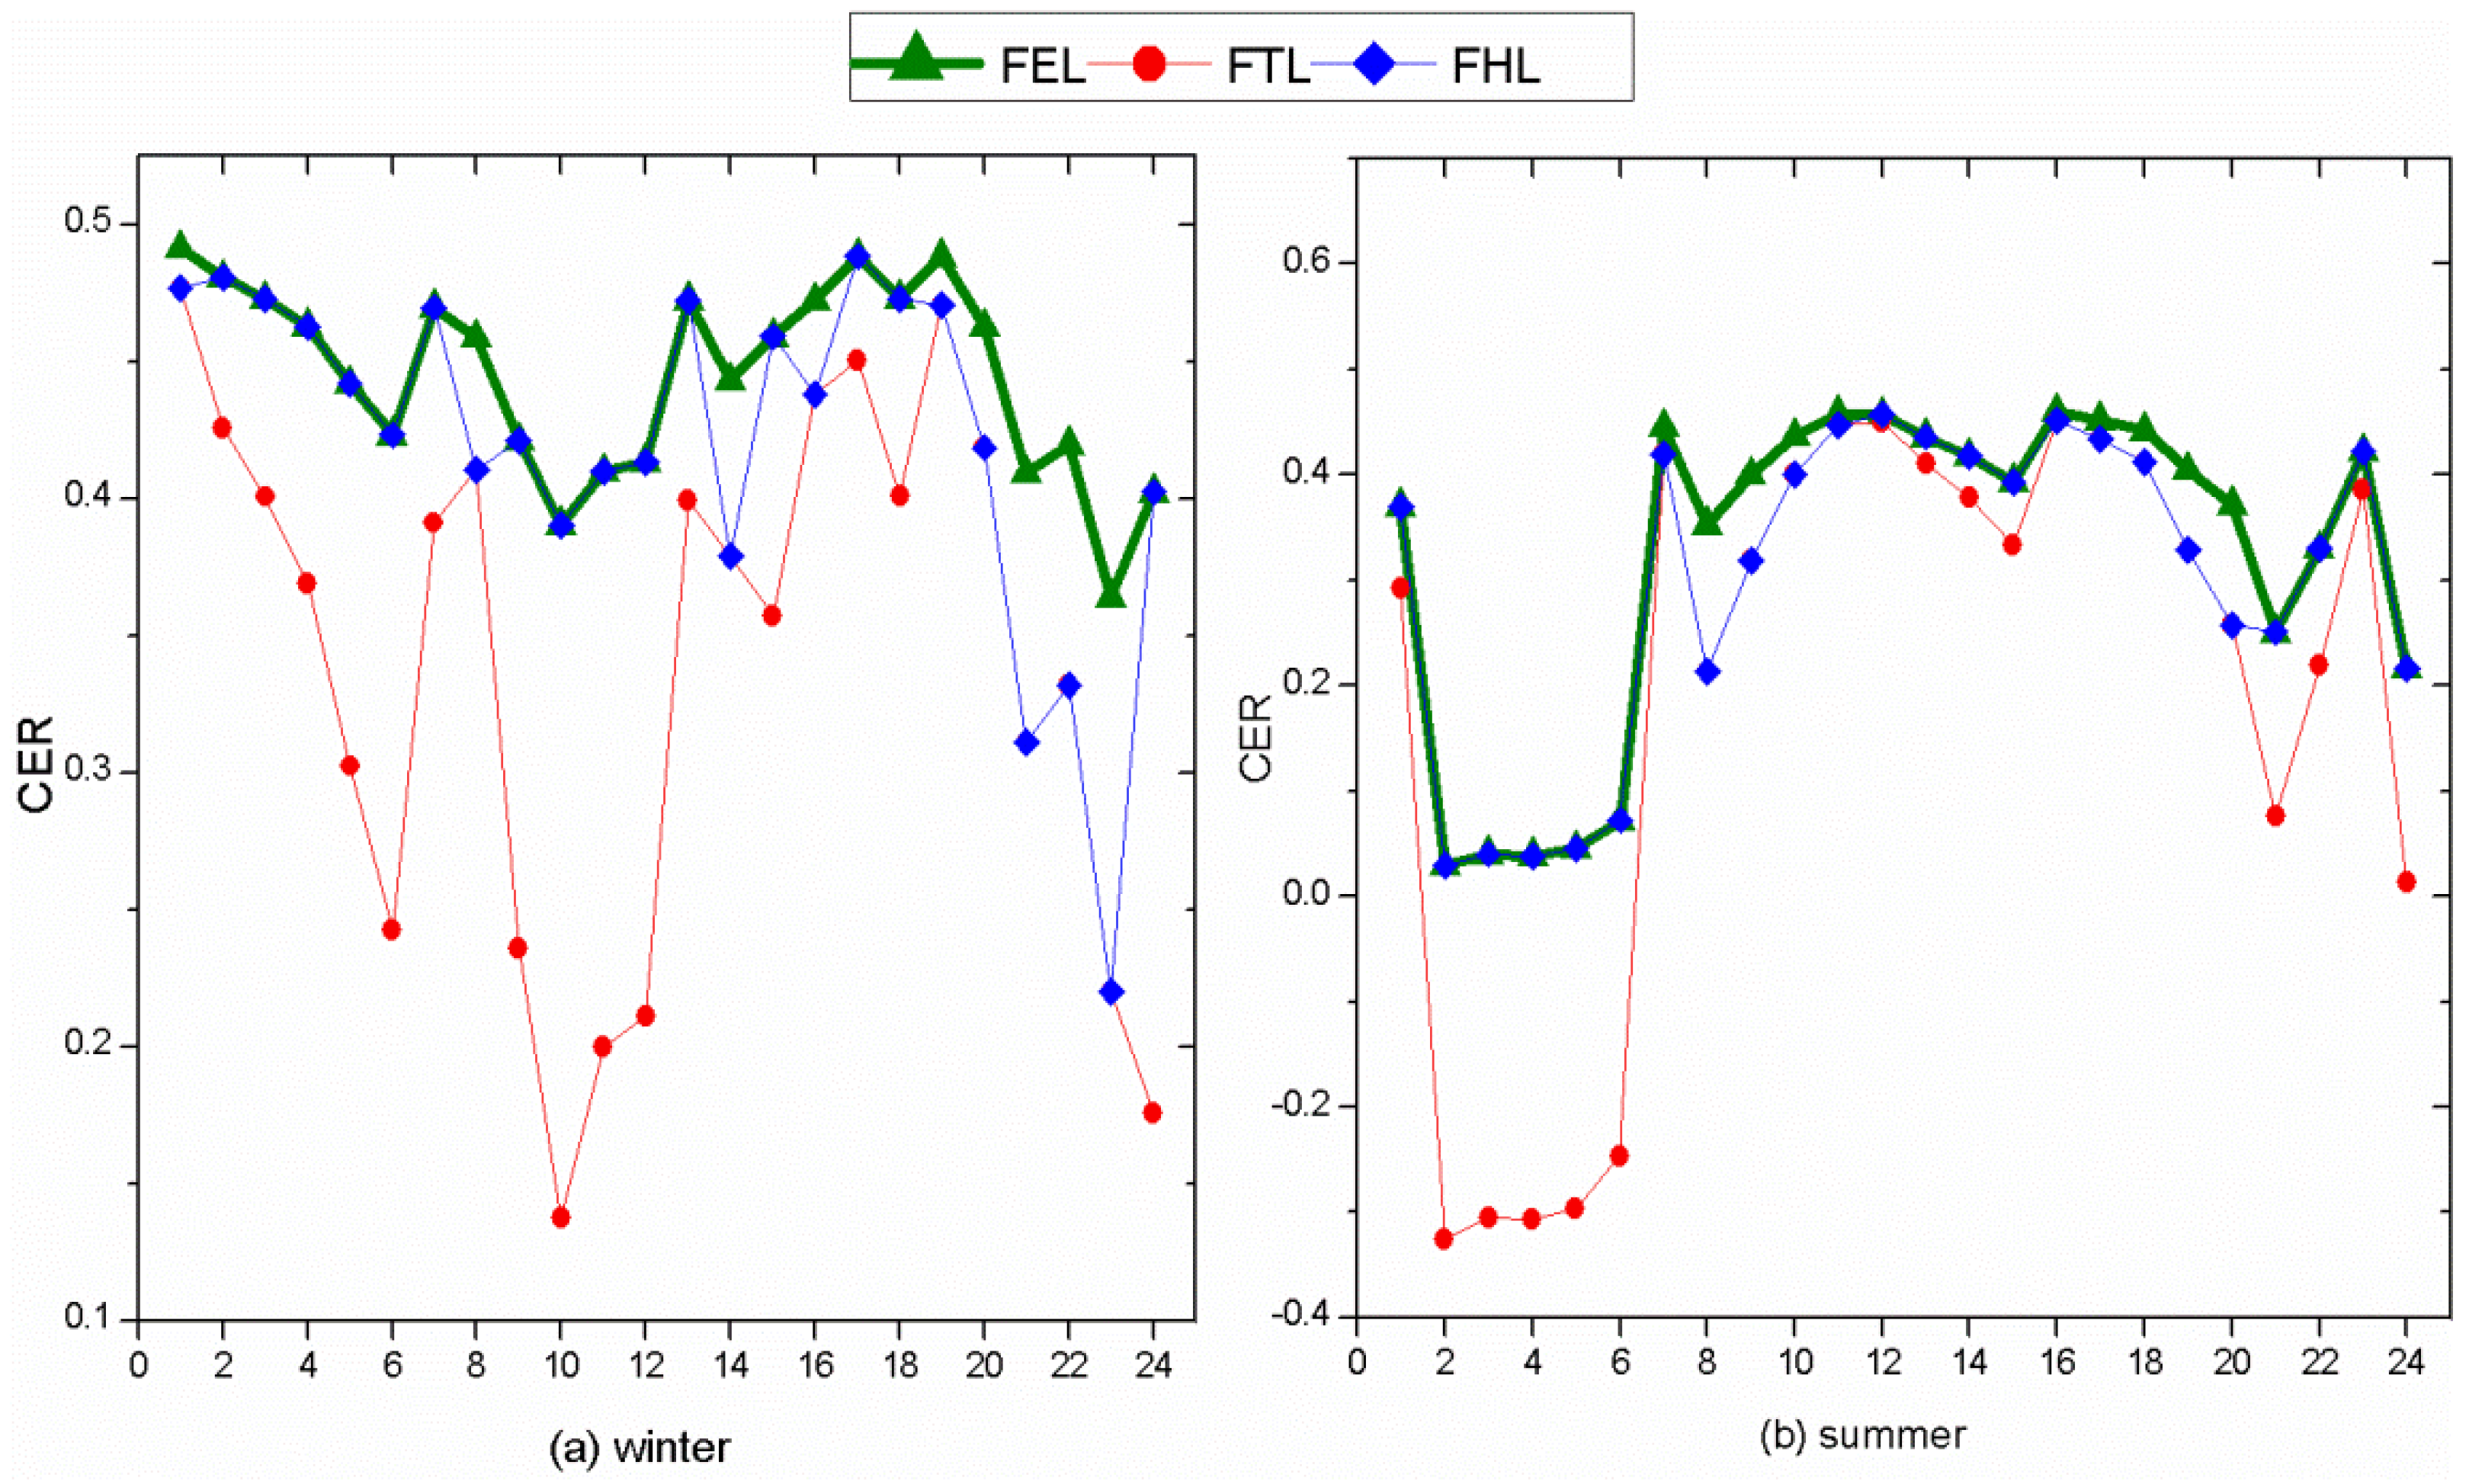
4.2. Instantaneous Performance Analysis

| Operation mode | Needing supplemental heat | Heat enough | Needing additional electricity | Electricity enough | |
|---|---|---|---|---|---|
| Winter | FEL | 2–7, 9–13, 15, 17–18, 24 | 1, 8, 14, 16, 19–23 | - | - |
| FTL | - | - | 1, 8, 14, 16, 19–23 | 2–7, 9–13, 15, 17–18, 24 | |
| Summer | FEL | 1–6, 12–15, 21–24 | 7–11, 16–20 | - | - |
| FTL | - | - | 7–11, 16–20 | 1–6, 12–15, 21–24 | |


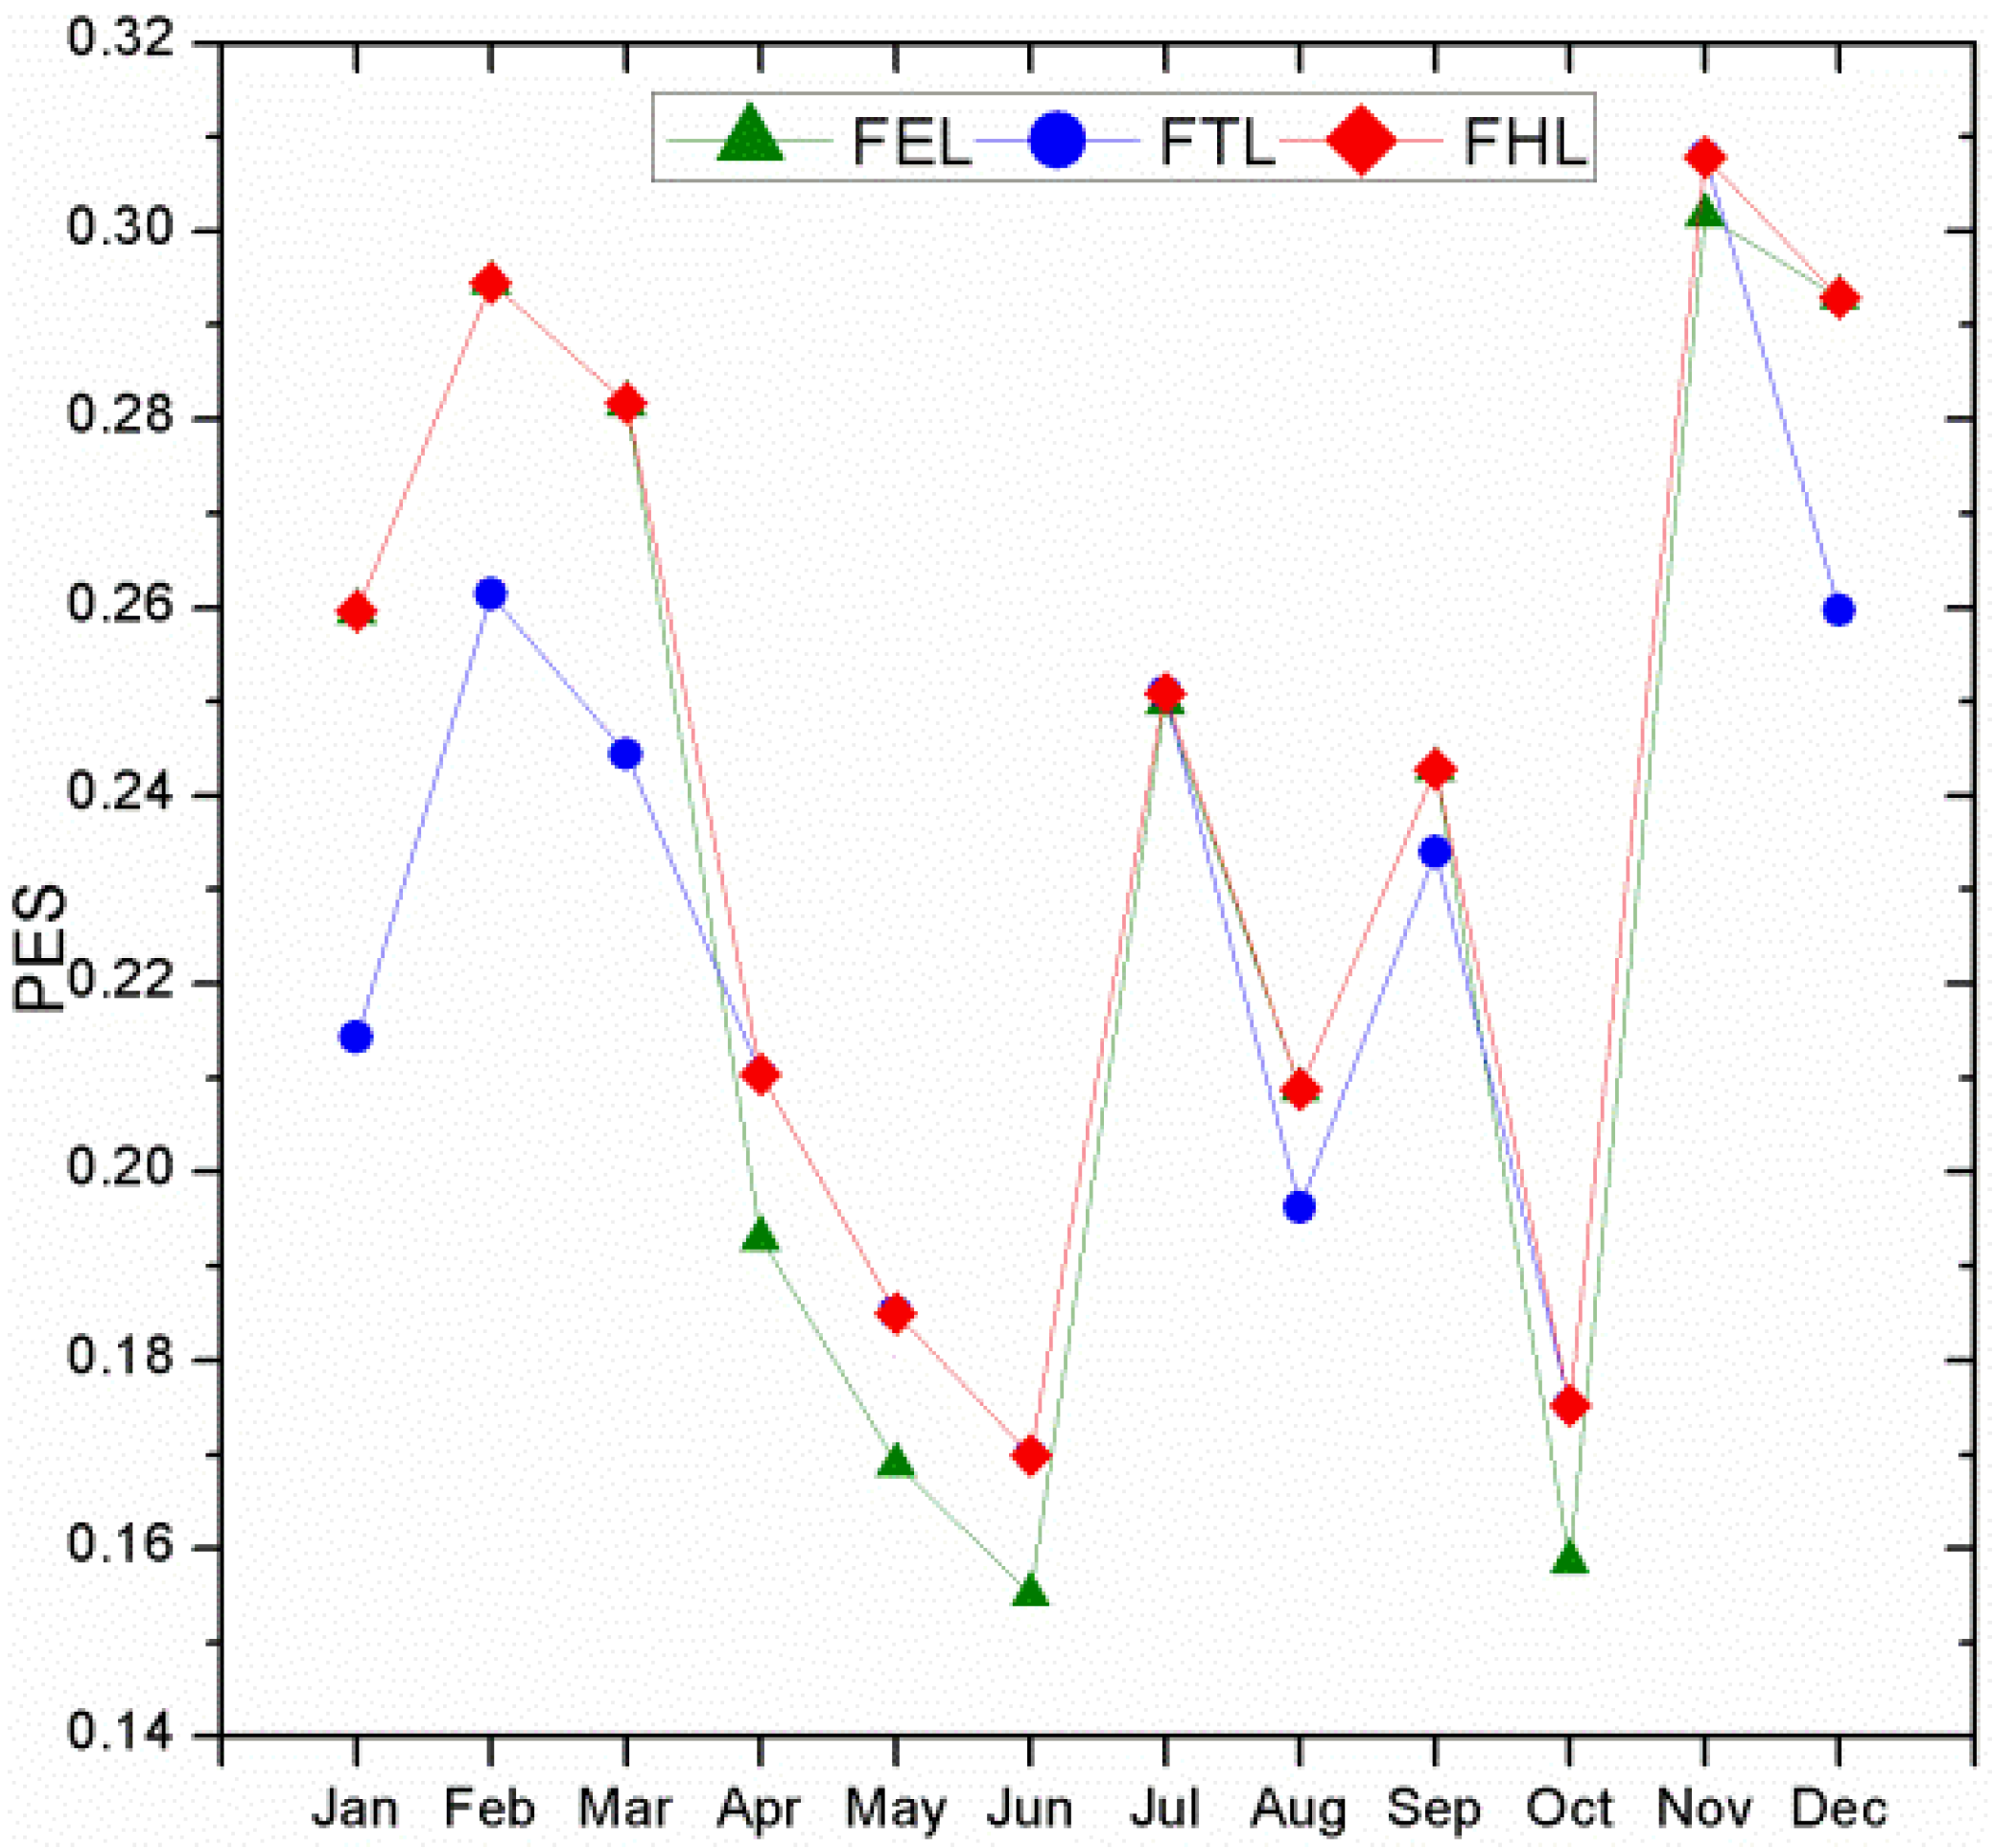
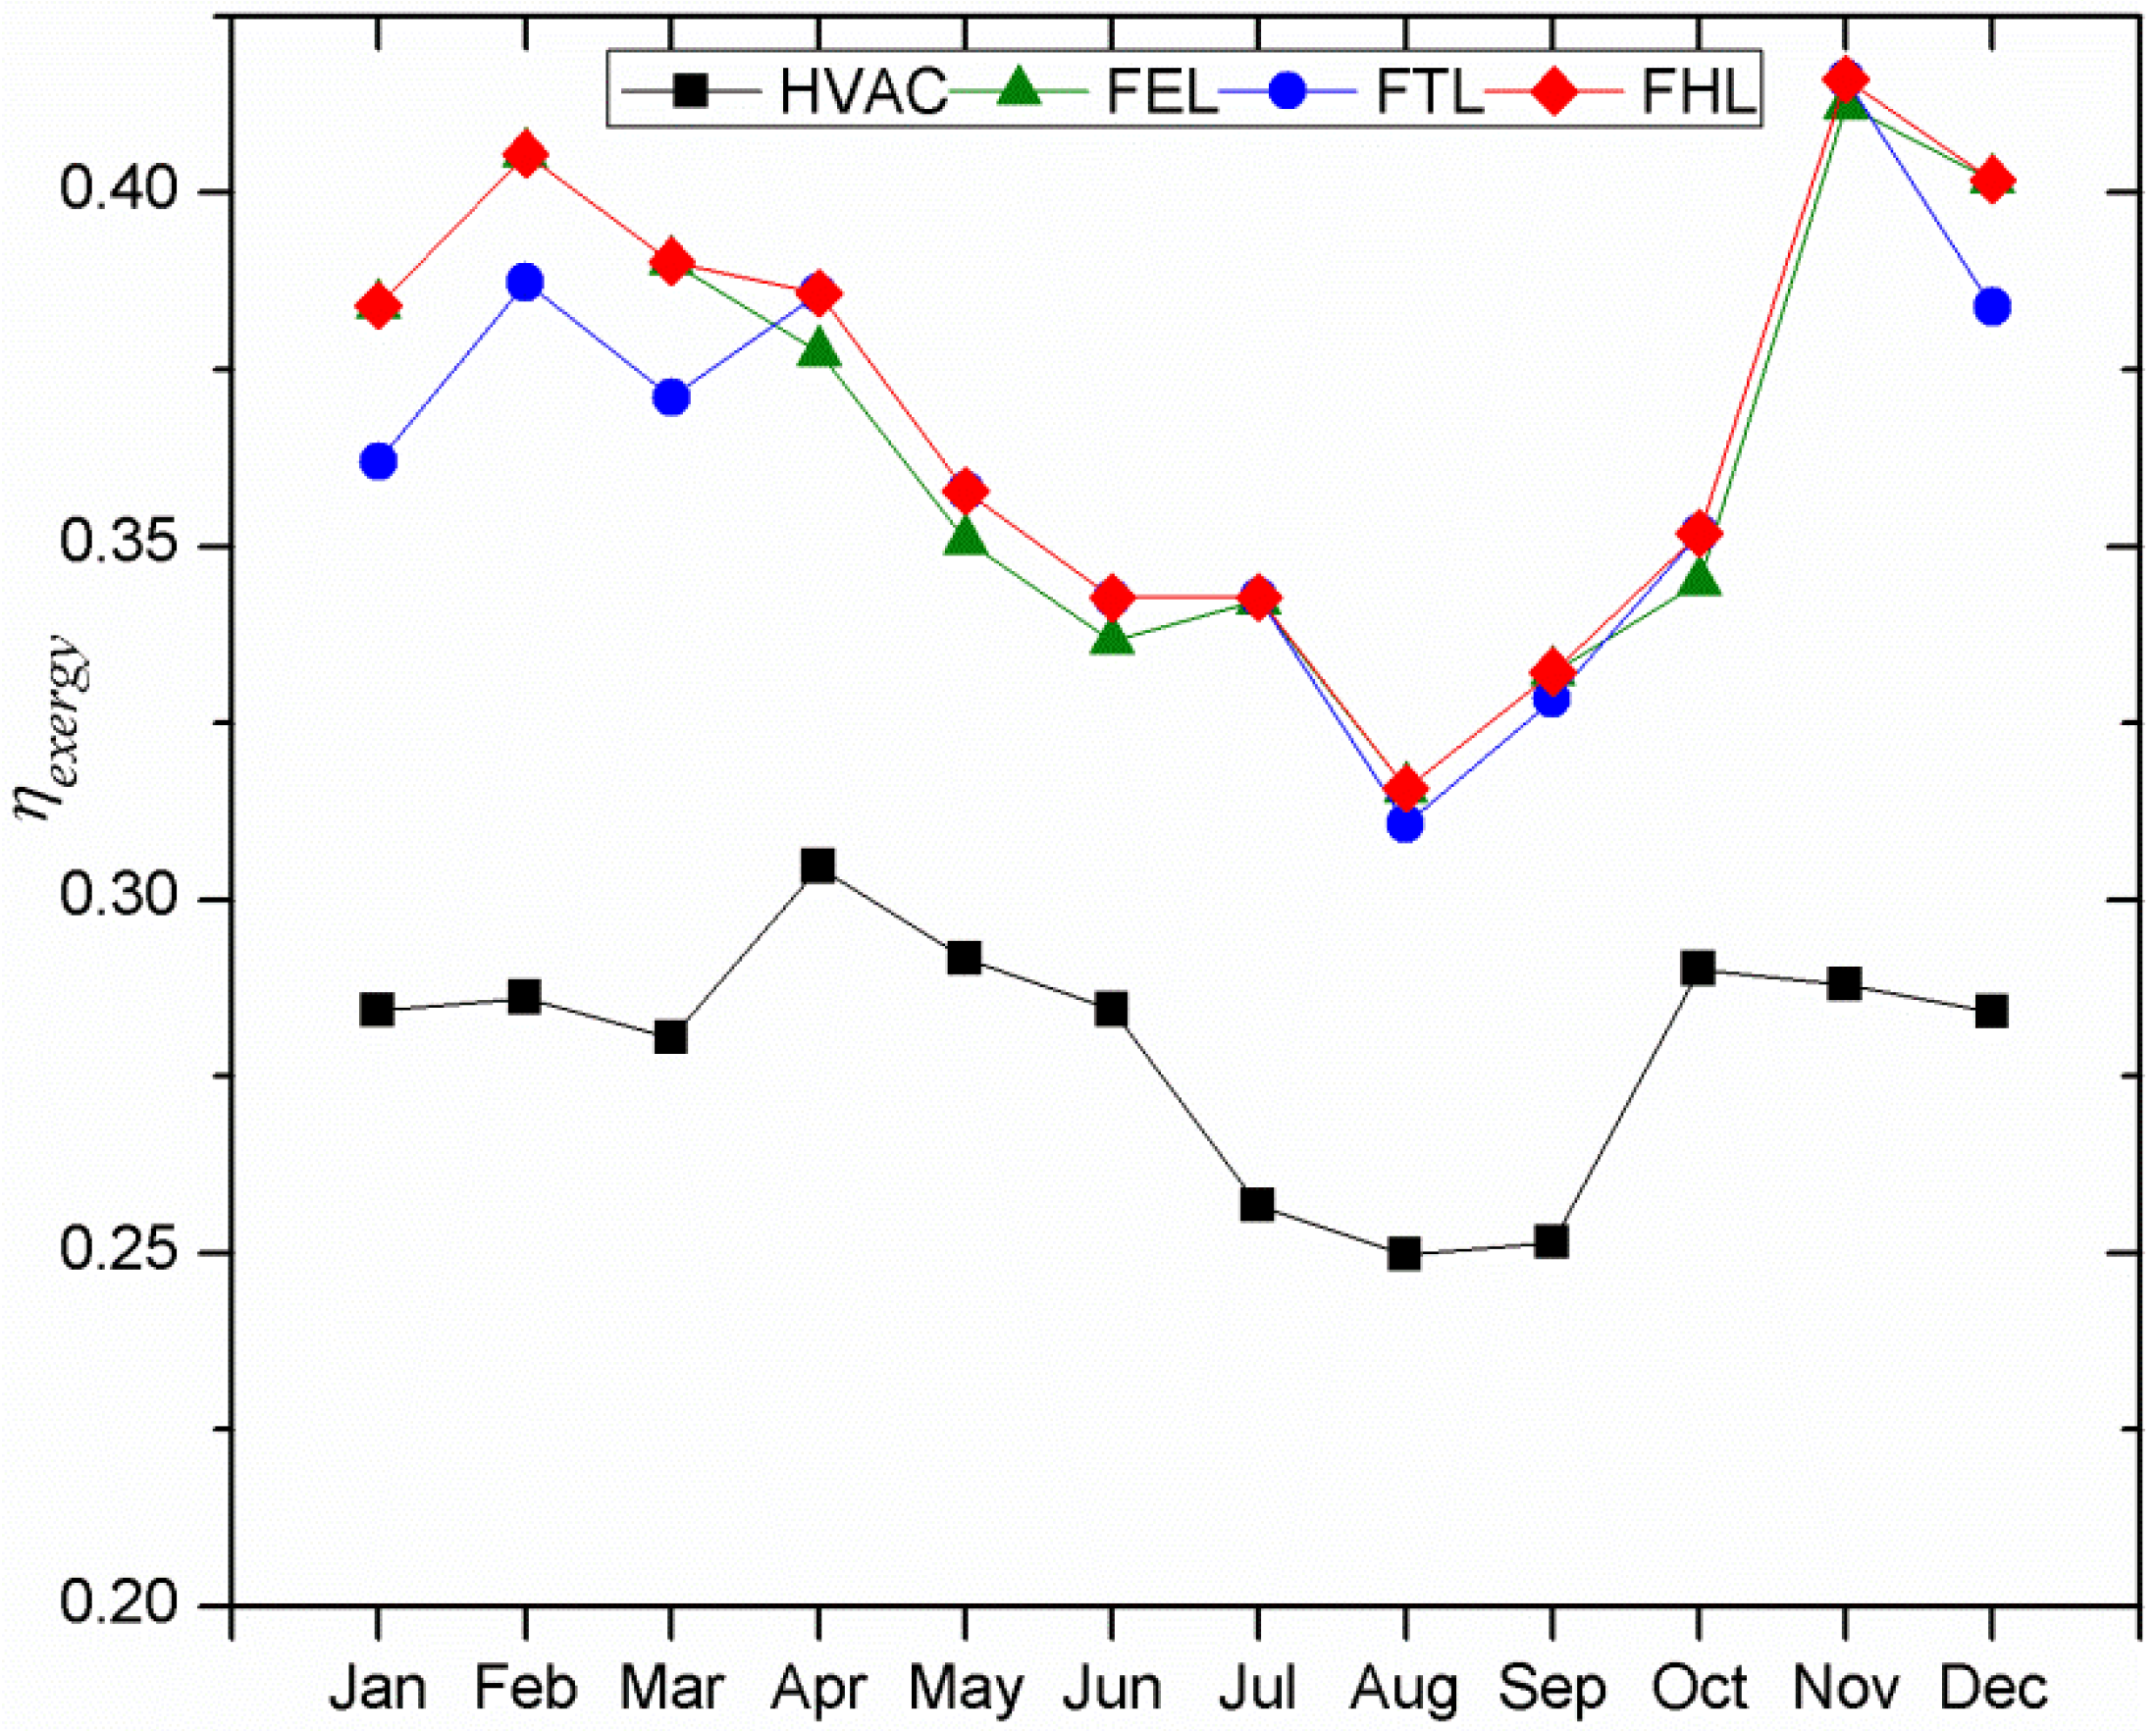
4.3. Monthly and Annually Performance Analysis


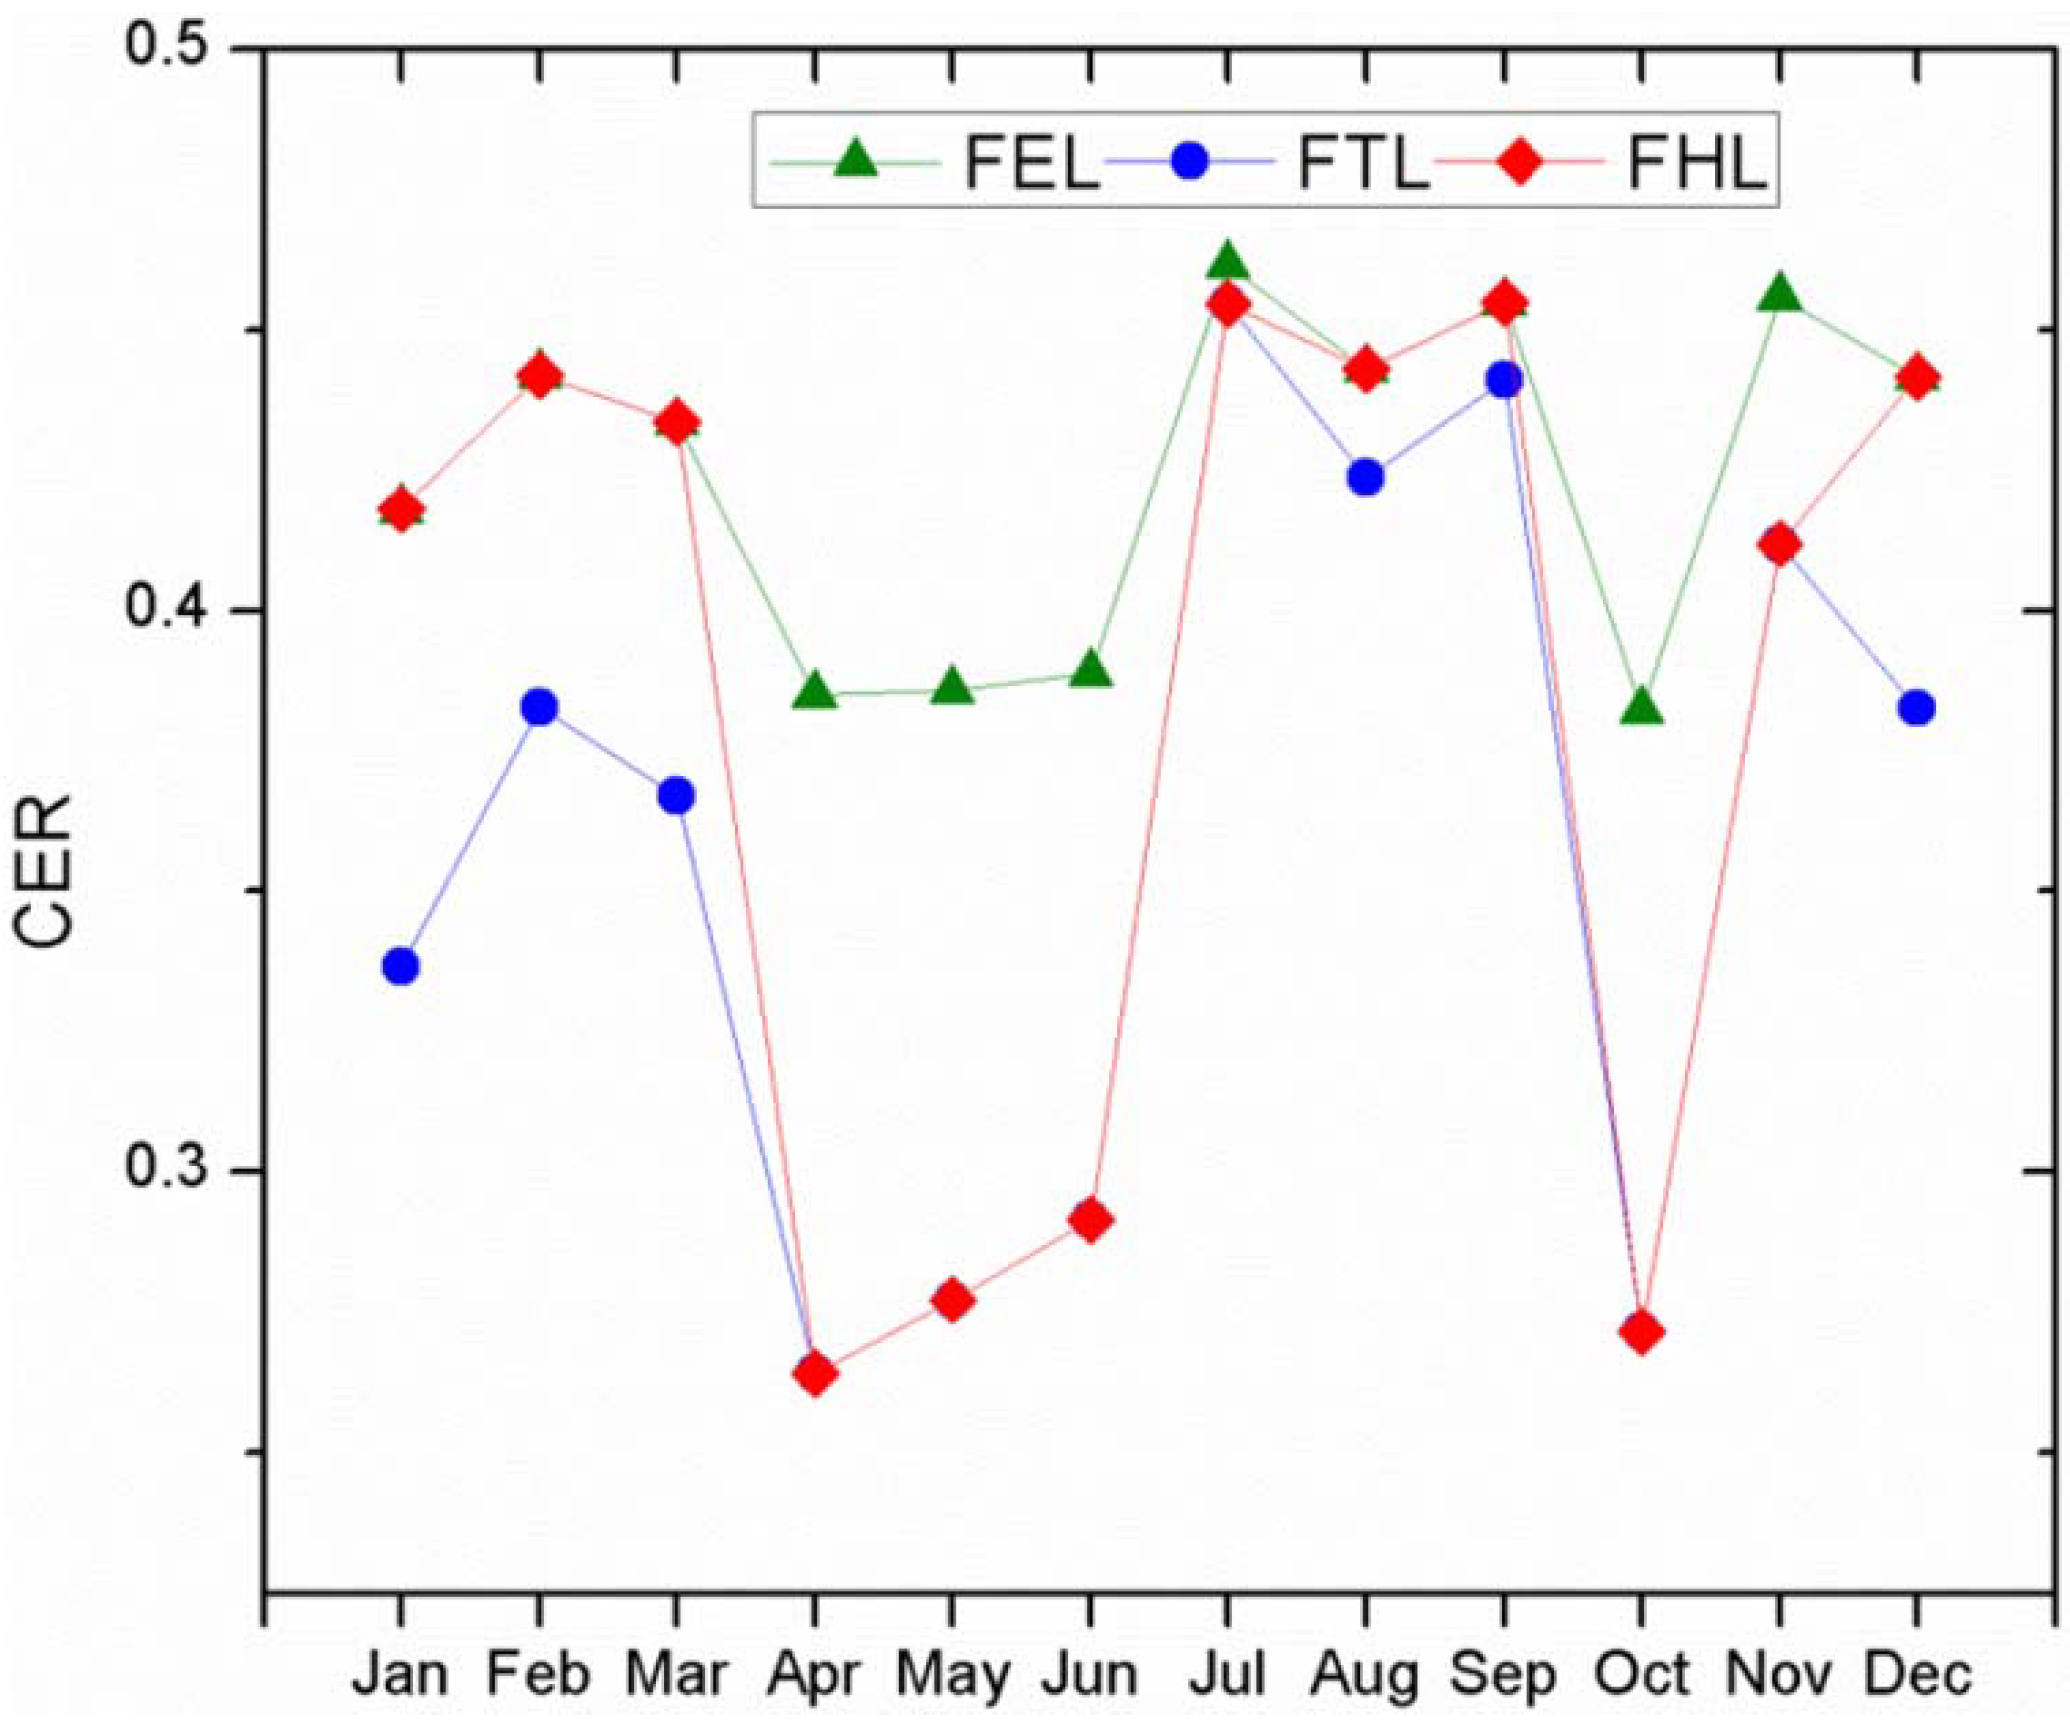
| Operation mode | PES | ηexergy | CER |
|---|---|---|---|
| FEL | 23.1 | 38.65 | 42.6 |
| FTL | 22.3 | 38.27 | 36.5 |
| FHL | 23.7 | 38.94 | 38.7 |
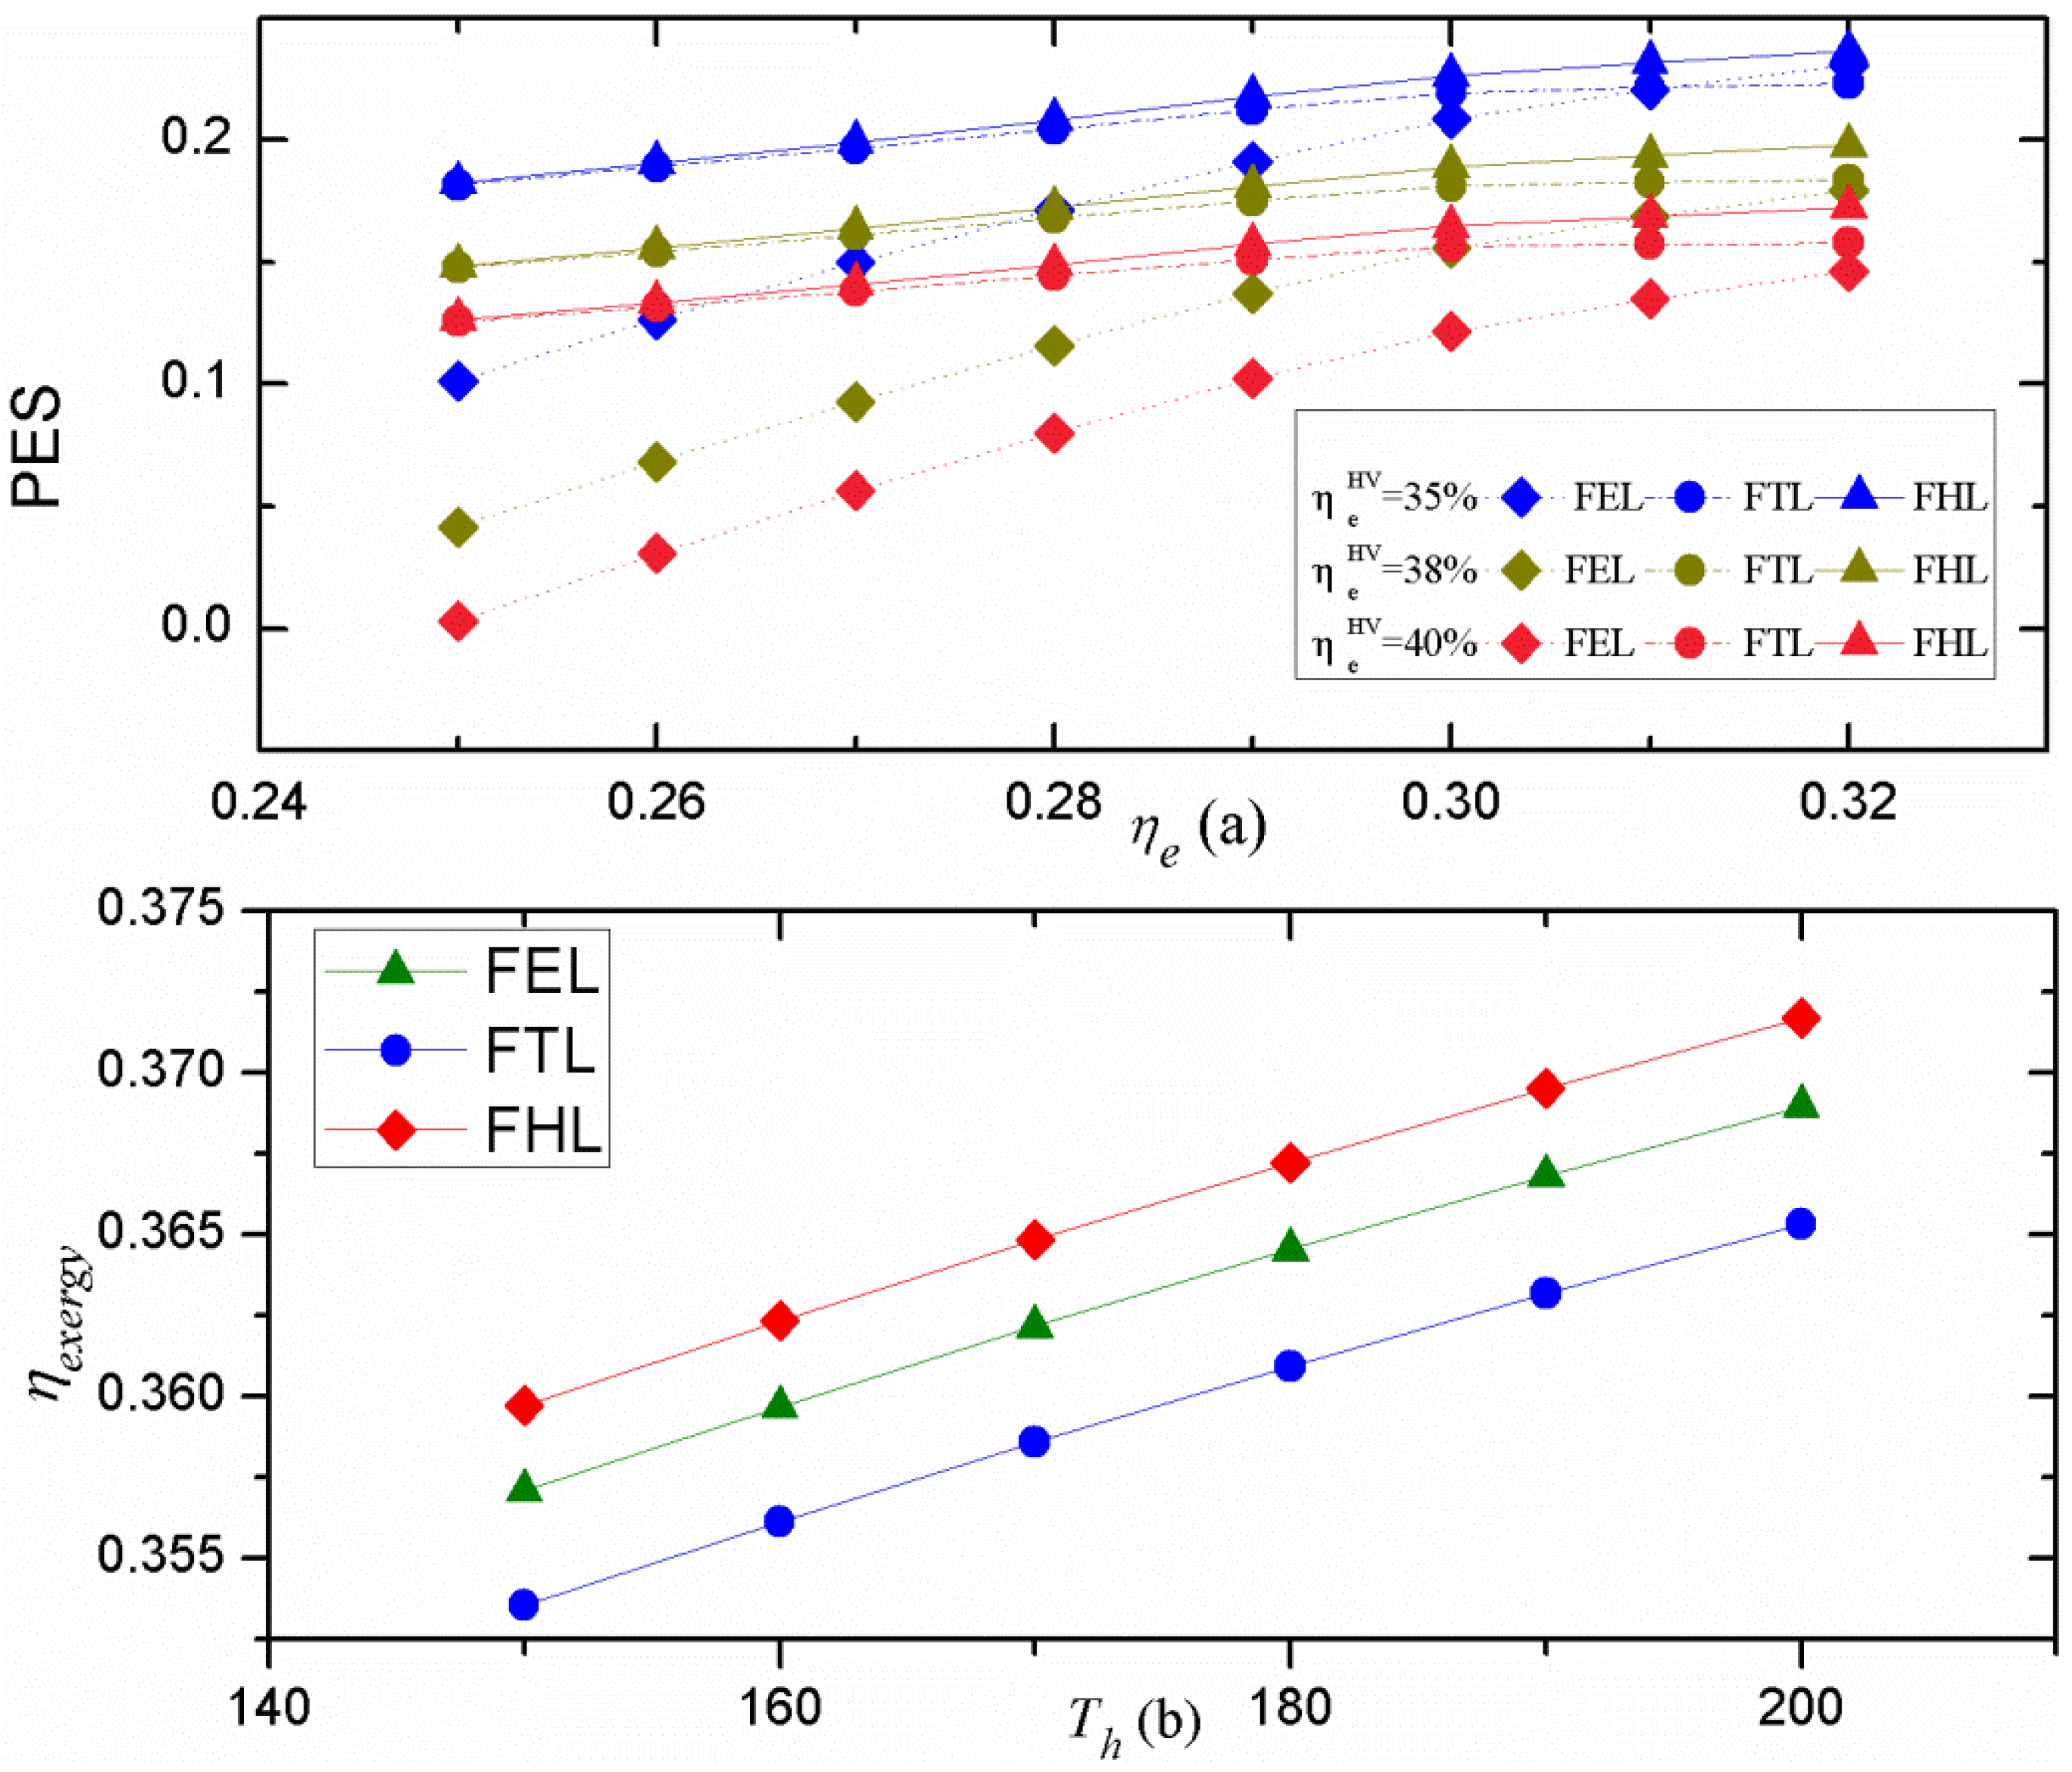
4.4. Sensitivity Analysis
5. Conclusions
Acknowledgments
Nomenclature
| CCHP | Combined cooling heating and power |
| HVAC | Heating, ventilating, and air conditioning |
| PGU | Power generation unit |
| PEC | Primary energy consumption |
| PES | Primary energy saving |
| FESR | primary energy saving ratio |
| CE | CO2 emissions |
| CER | CO2 emissions reduction ratio |
| FEL | Following electric load |
| FTL | Following thermal load |
| FHL | Following hybrid electric-thermal load |
Symbols
| E | Electricity consumption |
| EX | Exergy |
| F | Fuel |
| Q | Heat consumption |
| T | Temperature |
| A | exergy coefficient |
| η | efficiency |
| α | Conversion factor |
| γ | the coefficient of the supplementary fuel |
| δ | the coefficient of the additional electricity |
| ρ | Electricity-heat constant |
Subscripts
| e | Electricity |
| grid | Electricity grid |
| pgu | Power generation unit |
| building | Reference building |
| grid | Electricity grid |
| p | pump |
| b | Boiler |
| c | Cool |
| h | heat |
| ch | Absorption chiller |
| hc | Heating coil |
| rec | Waste heat recovery system |
| r | Recovery heat |
| req | require |
| exergy | The exergy of each type energy |
| f | fuel |
References
- Cho, H.; Mago, P.J.; Luck, R.; Chamra, L.M. Evaluation of CCHP systems performance based on operational cost, primary energy consumption, and carbon dioxide emission by utilizing an optimal operation scheme. Appl. Energy 2009, 86, 2540–2549. [Google Scholar] [CrossRef]
- Fumo, N.; Mago, P.J.; Chamra, L.M. Analysis of cooling, heating, and power systems based on site energy consumption. Appl. Energy 2009, 86, 928–932. [Google Scholar] [CrossRef]
- Wang, J.J.; Jing, Y.Y.; Zhang, C.F.; Zhai, Z.Q. Performance comparison of combined cooling heating and power system in different operation modes. Appl. Energy 2011, 88, 4621–4631. [Google Scholar] [CrossRef]
- Mago, P.J.; Chamra, L.M. Analysis and optimization of CCHP systems based on energy, economical, and environmental considerations. Energy Build. 2009, 41, 1099–1106. [Google Scholar] [CrossRef]
- Cardona, E.; Piacentino, A. A methodology for sizing a trigeneration plant in mediterranean areas. Appl. Therm. Eng. 2003, 23, 1665–1680. [Google Scholar] [CrossRef]
- Wang, J.J.; Zhang, C.F.; Jing, Y.Y. Multi-criteria analysis of combined cooling, heating and power systems in different climate zones in China. Appl. Energy 2010, 87, 1247–1259. [Google Scholar] [CrossRef]
- Mago, P.J.; Chamra, L.M.; Ramsay, J. Micro-combined cooling, heating and power systems hybrid electric-thermal load following operation. Appl. Therm. Eng. 2010, 30, 800–806. [Google Scholar] [CrossRef]
- Cardona, E.; Piacentino, A.; Cardona, F. Energy saving in airports by trigeneration. Part I: Assessing economic and technical potential. Appl. Therm. Eng. 2006, 26, 1427–1436. [Google Scholar] [CrossRef]
- Ziher, D.; Poredos, A. Economics of a trigeneration system in a hospital. Appl. Therm. Eng. 2006, 26, 680–687. [Google Scholar] [CrossRef]
- Siler-Evans, K.; Morgan, M.G.; Lima Azevedo, I. Distributed cogeneration for commercial buildings: Can we make the economics work? Energy Policy 2012, 42, 580–590. [Google Scholar] [CrossRef]
- Temir, G.; Bilge, D. Thermoeconomic analysis of a trigeneration system. Appl. Therm. Eng. 2004, 24, 2689–2699. [Google Scholar] [CrossRef]
- Deng, J.; Wang, R.Z.; Wu, J.Y.; Han, G.Y.; Wua, D.W.; Li, S. Exergy cost analysis of a micro-trigeneration system based on the structural theory of thermoeconomics. Energy 2008, 33, 1417–1426. [Google Scholar] [CrossRef]
- Chicco, G.; Mancarella, P. Trigeneration primary energy saving evaluation for energy planning and policy development. Energy Policy 2007, 35, 6132–6144. [Google Scholar] [CrossRef]
- Li, H.; Lin, F.; Kecheng, G.; Yi, J. Energy utilization evaluation of CCHP systems. Energy Build. 2006, 38, 253–257. [Google Scholar] [CrossRef]
- Fumo, N.; Mago, P.J.; Chamra, L.M. Energy and economic evaluation of cooling, heating, and power systems based on primary energy. Appl. Therm. Eng. 2009, 29, 2665–2671. [Google Scholar] [CrossRef]
- Alanne, K.; Saari, A. Sustainable small-scale CHP technologies for buildings: The basis for multi-perspective decision-making. Renew. Sustain. Energy Rev. 2004, 8, 401–431. [Google Scholar] [CrossRef]
- Fumo, N.; Mago, P.J.; Chamra, L.M. Emission operational strategy for combined cooling, heating, and power systems. Appl. Energy 2009, 86, 2344–2350. [Google Scholar] [CrossRef]
- Chicco, G.; Mancarella, P. Assessment of the greenhouse gas emissions from cogeneration and trigeneration systems. Part I: Models and indicators. Energy 2008, 33, 410–417. [Google Scholar] [CrossRef]
- Carvalho, M.; Lozano, M.A.; Serra, L.M. Multicriteria synthesis of trigeneration systems considering economic and environmental aspects. Appl. Energy 2012, 91, 245–254. [Google Scholar] [CrossRef]
- Lund, H.; Siupsinskas, G.; Martinaitis, V. Implementation strategy for small CHP-plants in a competitive market: the case of Lithuania. Appl. Energy 2005, 82, 214–227. [Google Scholar] [CrossRef]
- Minciuc, E.; Le Corre, O.; Athanasovici, V.; Tazerout, M. Fuel savings and CO2 emissions for tri-generation systems. Appl. Therm. Eng. 2003, 23, 1333–1346. [Google Scholar] [CrossRef]
- Mancarella, P.; Chicco, G. Global and local emission impact assessment of distributed cogeneration systems with partial-load models. Appl. Energy 2009, 86, 2096–2106. [Google Scholar] [CrossRef]
- Strachan, N.; Farrell, A. Emissions from distributed vs. centralized generation: The importance of system performance. Energy Policy 2006, 34, 2677–2689. [Google Scholar] [CrossRef]
- Hondenman, H. Electrical compression cooling versus absorption cooling—A comparison. IEA Heat Pump Cent. Newsl. 2000, 18, 23–25. [Google Scholar]
- Poredos, A.; Kitanovski, A. District Heating and Cooling for Efficient Energy Supply. In Proceedings of the 2011 International Conference on Electrical and Control Engineering (ICECE 2011), Yichang, China, 16–18 September 2011; pp. 5238–5241.
- Elsa, F.; Louise, T.; Erik, O.A. Assessment of absorption cooling as a district heating system strategy—A case study. Energy Convers. Manag. 2012, 60, 115–124. [Google Scholar] [CrossRef]
- Piacentino, A.; Cardona, F. An original multi-objective criterion for the design of small-scale polygeneration systems based on realistic operating conditions. Appl. Therm. Eng. 2008, 28, 2391–2404. [Google Scholar] [CrossRef]
- Lozano, M.A.; Carvalho, M.; Serra, L.M. Operational strategy and marginal costs in simple trigeneration systems. Energy 2009, 34, 2001–2008. [Google Scholar] [CrossRef]
- Wang, J.J.; Jing, Y.Y.; Zhang, C.F. Optimization of capacity and operation for CCHP system by genetic algorithm. Appl. Energy 2010, 87, 1325–1335. [Google Scholar] [CrossRef]
- Wang, J.J.; Zhai, Z.Q.; Jing, Y.Y.; Zhang, X.T.; Zhang, C.F. Sensitivity analysis of optimal model on building cooling heating and power system. Appl. Energy 2011, 88, 5143–5152. [Google Scholar] [CrossRef]
- Wang, J.J.; Zhai, Z.Q.; Jing, Y.Y.; Zhang, X.T.; Zhang, C.F. Influence analysis of building types and climate zones on energetic, economic and environmental performances of BCHP systems. Appl. Energy 2011, 88, 3097–3112. [Google Scholar] [CrossRef]
- Piacentino, A.; Cardona, F. EABOT—Energetic analysis as a basis for robust optimization of trigeneration systems by linear programming. Energy Convers. Manag. 2008, 49, 3006–3016. [Google Scholar] [CrossRef]
- Mancarella, P.; Chicco, G. Assessment of the greenhouse gas emissions from cogeneration and trigeneration systems. Part II: Analysis techniques and application cases. Energy 2008, 33, 418–430. [Google Scholar] [CrossRef]
- Espirito Santo, D.B. Energy and exergy efficiency of a building internal combustion engine trigeneration system under two different operational strategies. Energy Build. 2012, 53, 28–38. [Google Scholar] [CrossRef]
- Liora, N.; Zhang, N. Energy, exergy, and second law performance criteria. Energy 2007, 32, 281–296. [Google Scholar] [CrossRef]
© 2013 by the authors; licensee MDPI, Basel, Switzerland. This article is an open access article distributed under the terms and conditions of the Creative Commons Attribution license (http://creativecommons.org/licenses/by/3.0/).
Share and Cite
Li, M.; Mu, H.; Li, H. Analysis and Assessments of Combined Cooling, Heating and Power Systems in Various Operation Modes for a Building in China, Dalian. Energies 2013, 6, 2446-2467. https://doi.org/10.3390/en6052446
Li M, Mu H, Li H. Analysis and Assessments of Combined Cooling, Heating and Power Systems in Various Operation Modes for a Building in China, Dalian. Energies. 2013; 6(5):2446-2467. https://doi.org/10.3390/en6052446
Chicago/Turabian StyleLi, Miao, Hailin Mu, and Huanan Li. 2013. "Analysis and Assessments of Combined Cooling, Heating and Power Systems in Various Operation Modes for a Building in China, Dalian" Energies 6, no. 5: 2446-2467. https://doi.org/10.3390/en6052446
APA StyleLi, M., Mu, H., & Li, H. (2013). Analysis and Assessments of Combined Cooling, Heating and Power Systems in Various Operation Modes for a Building in China, Dalian. Energies, 6(5), 2446-2467. https://doi.org/10.3390/en6052446