Decomposition Analysis of Energy-Related Industrial CO2 Emissions in China
Abstract
:1. Introduction
2. Data Set and Estimation
| Energy Type | IPCC coefficients (kgC/GJ) | Adopted coefficients (tC/tce) |
|---|---|---|
| Coal | 25.8 | 0.7552 |
| Coke | 29.2 | 0.8547 |
| Crude Oil | 20.0 | 0.5854 |
| Gasoline | 18.9 | 0.5913 |
| Kerosene | 19.6 | 0.5737 |
| Diesel Oil | 20.2 | 0.5913 |
| Fuel Oil | 21.1 | 0.6176 |
| Natural Gas | 15.3 | 0.4479 |
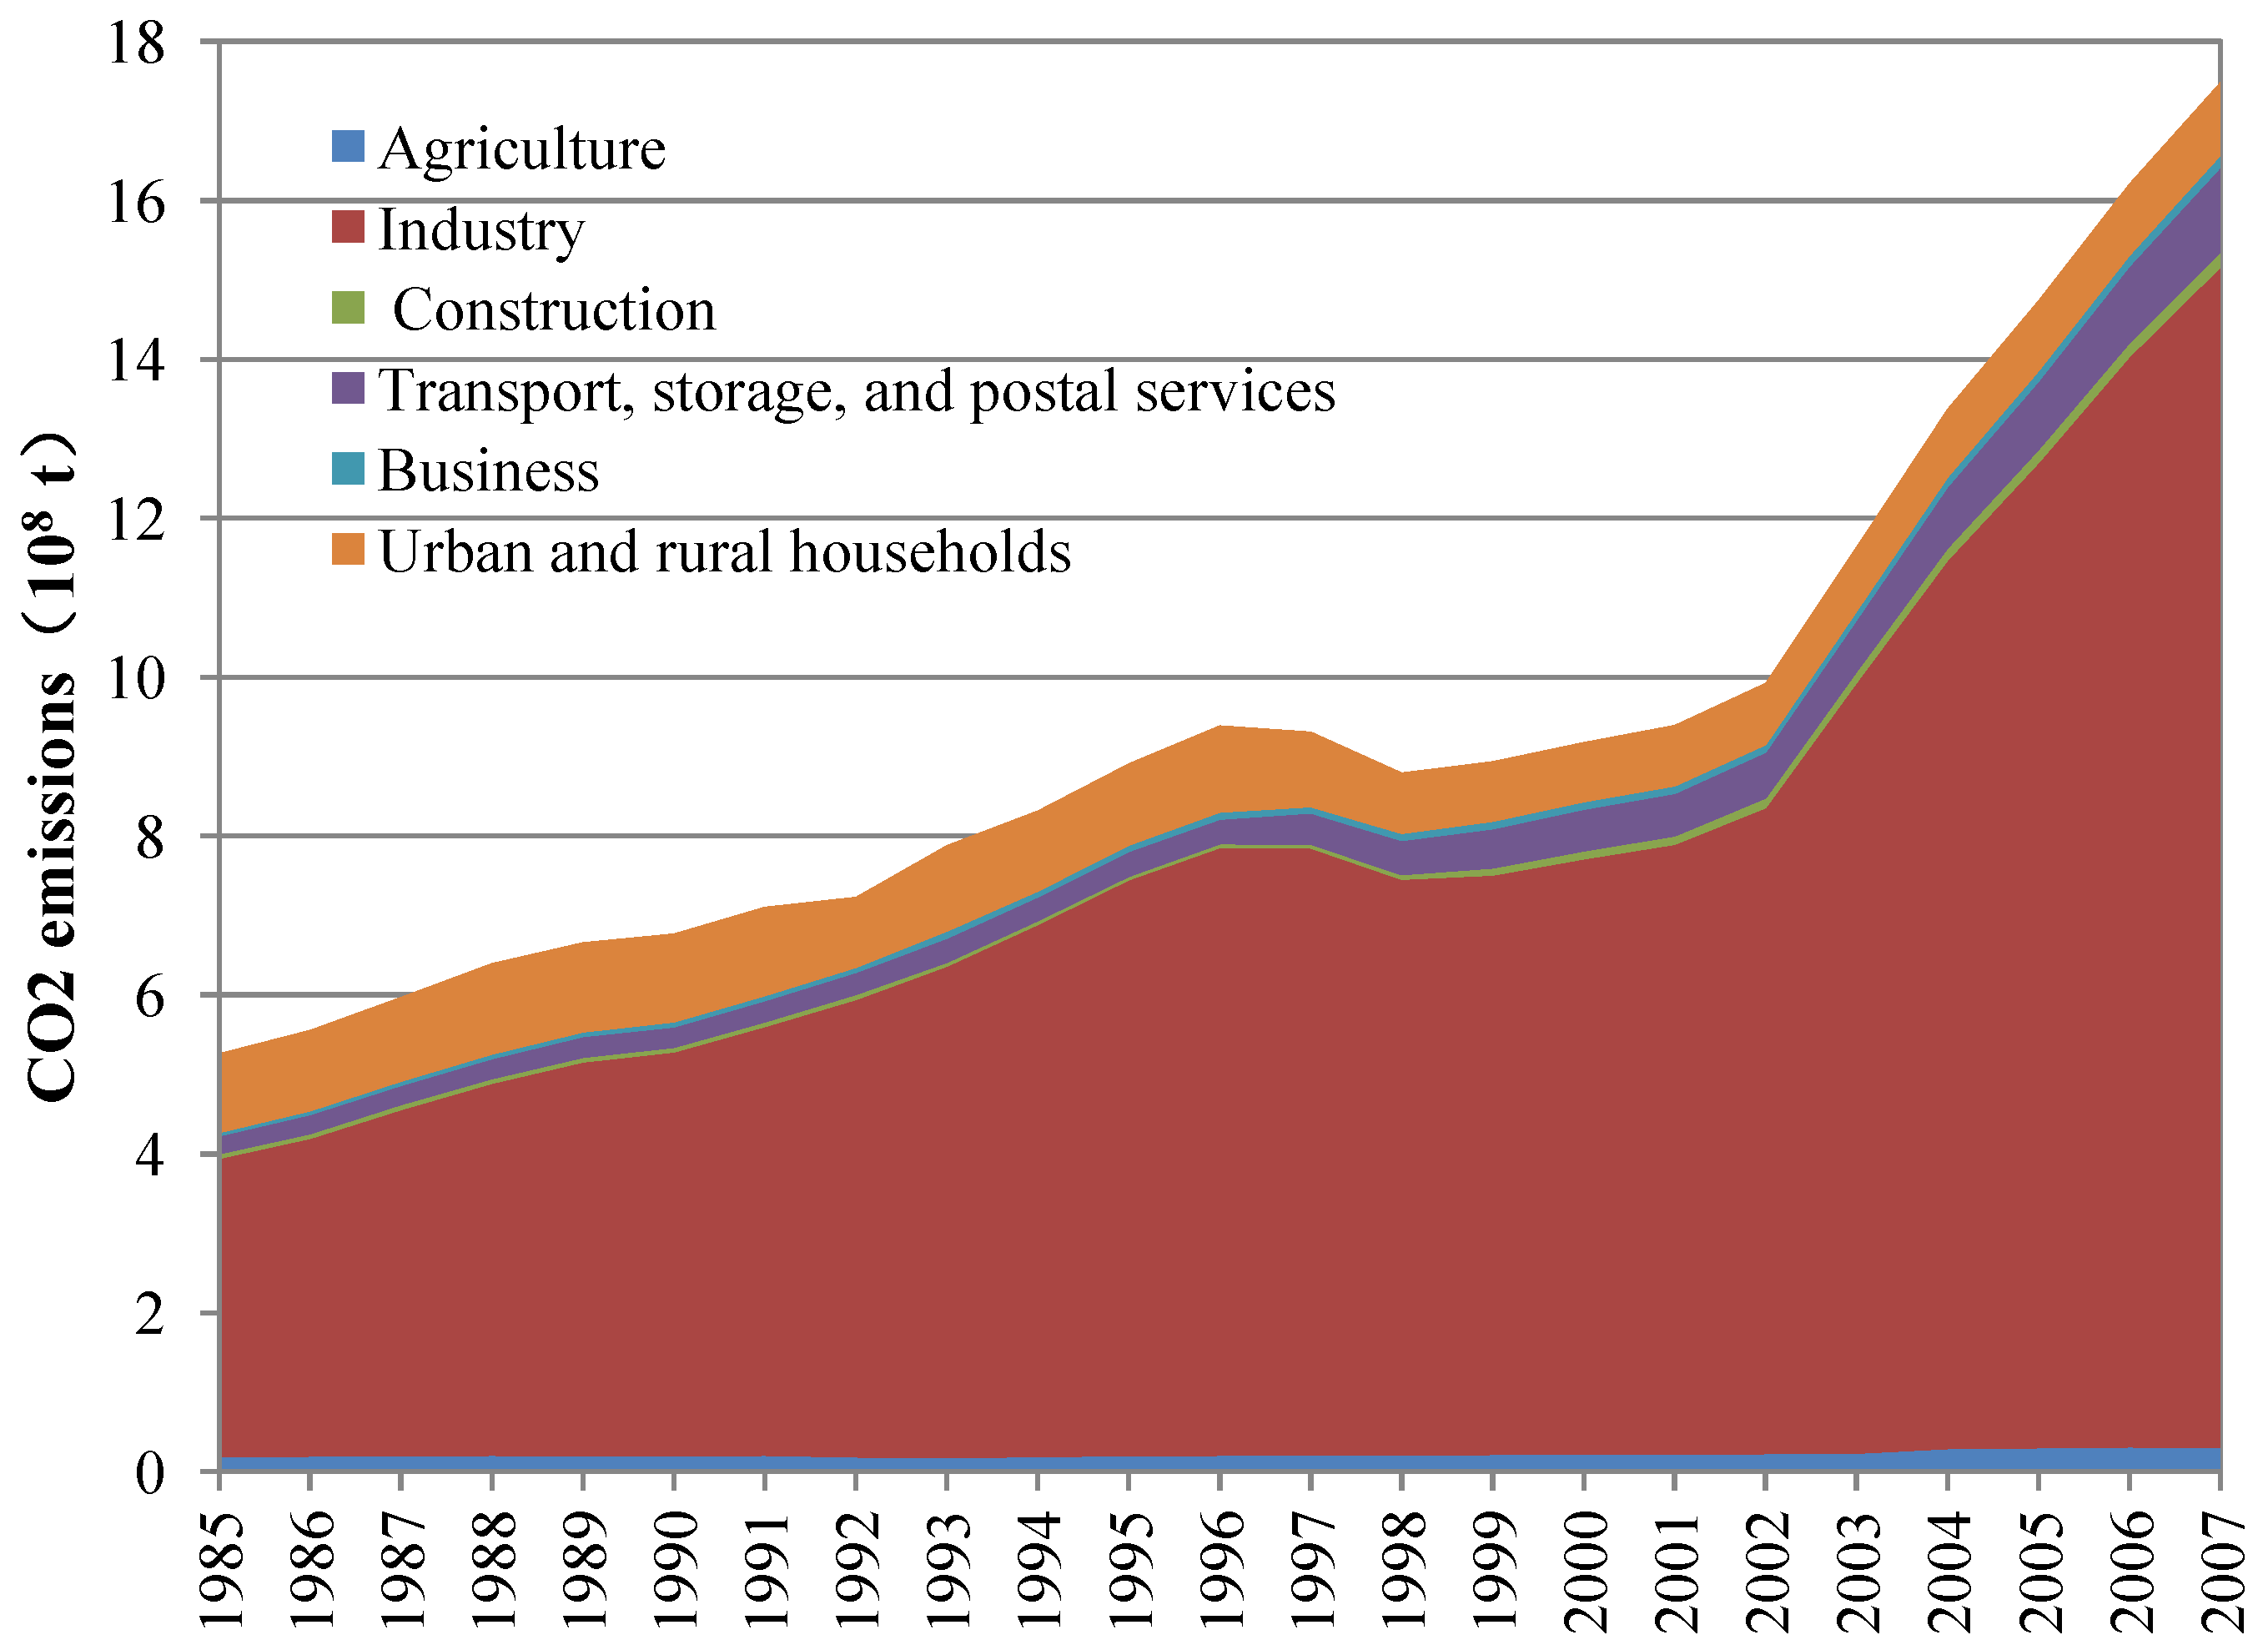
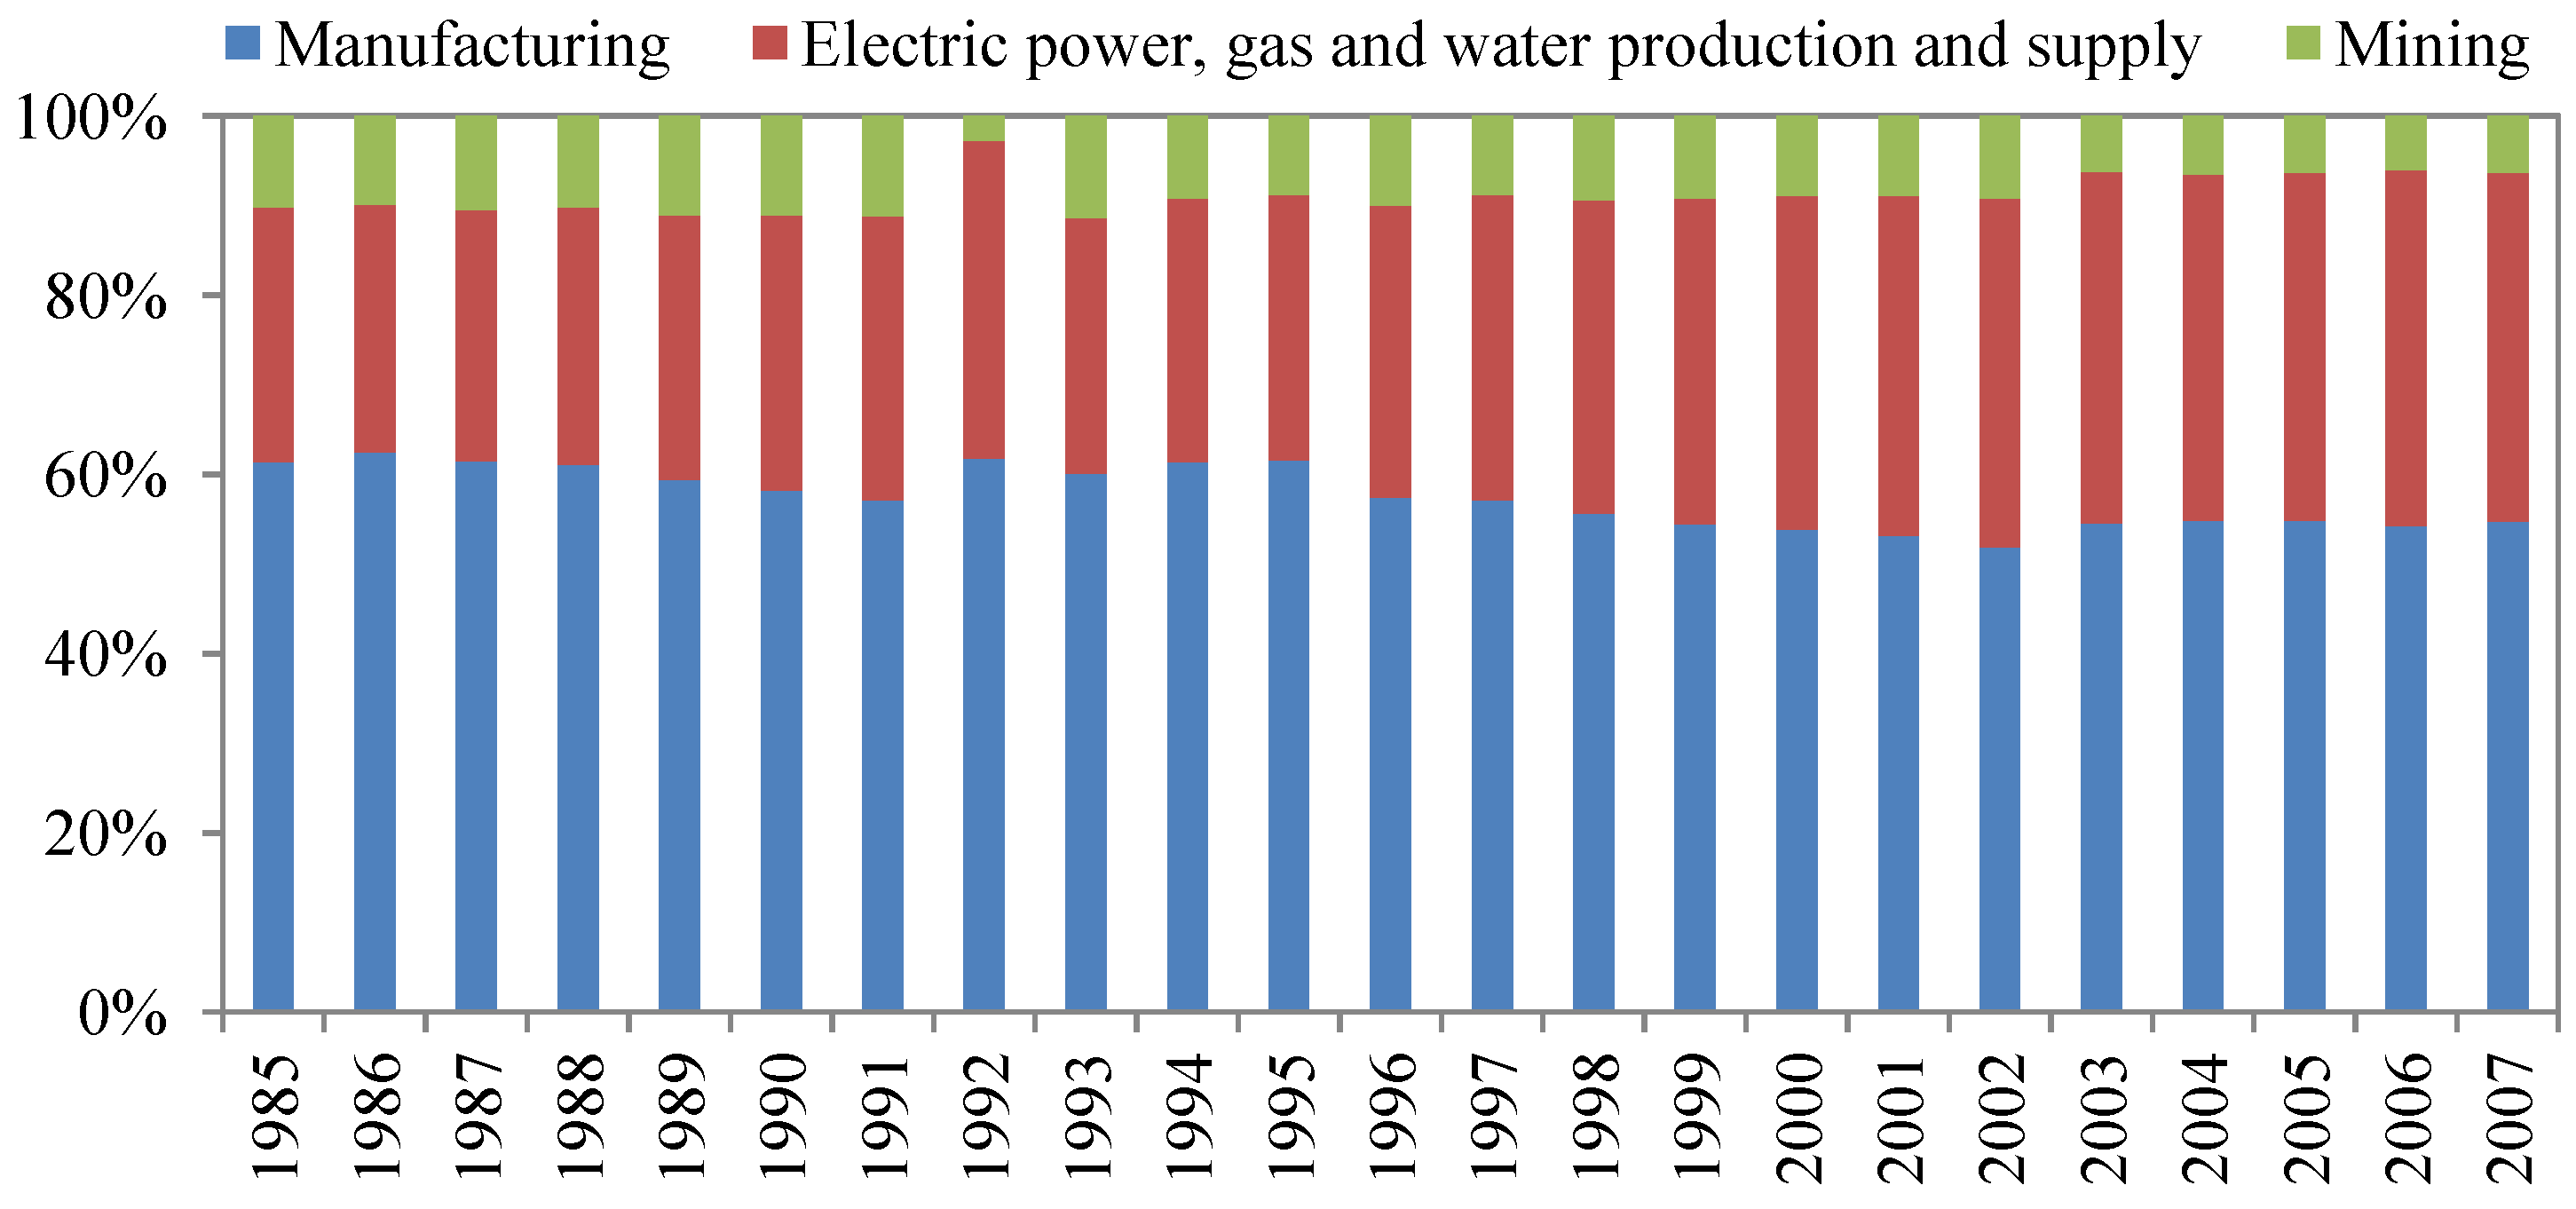
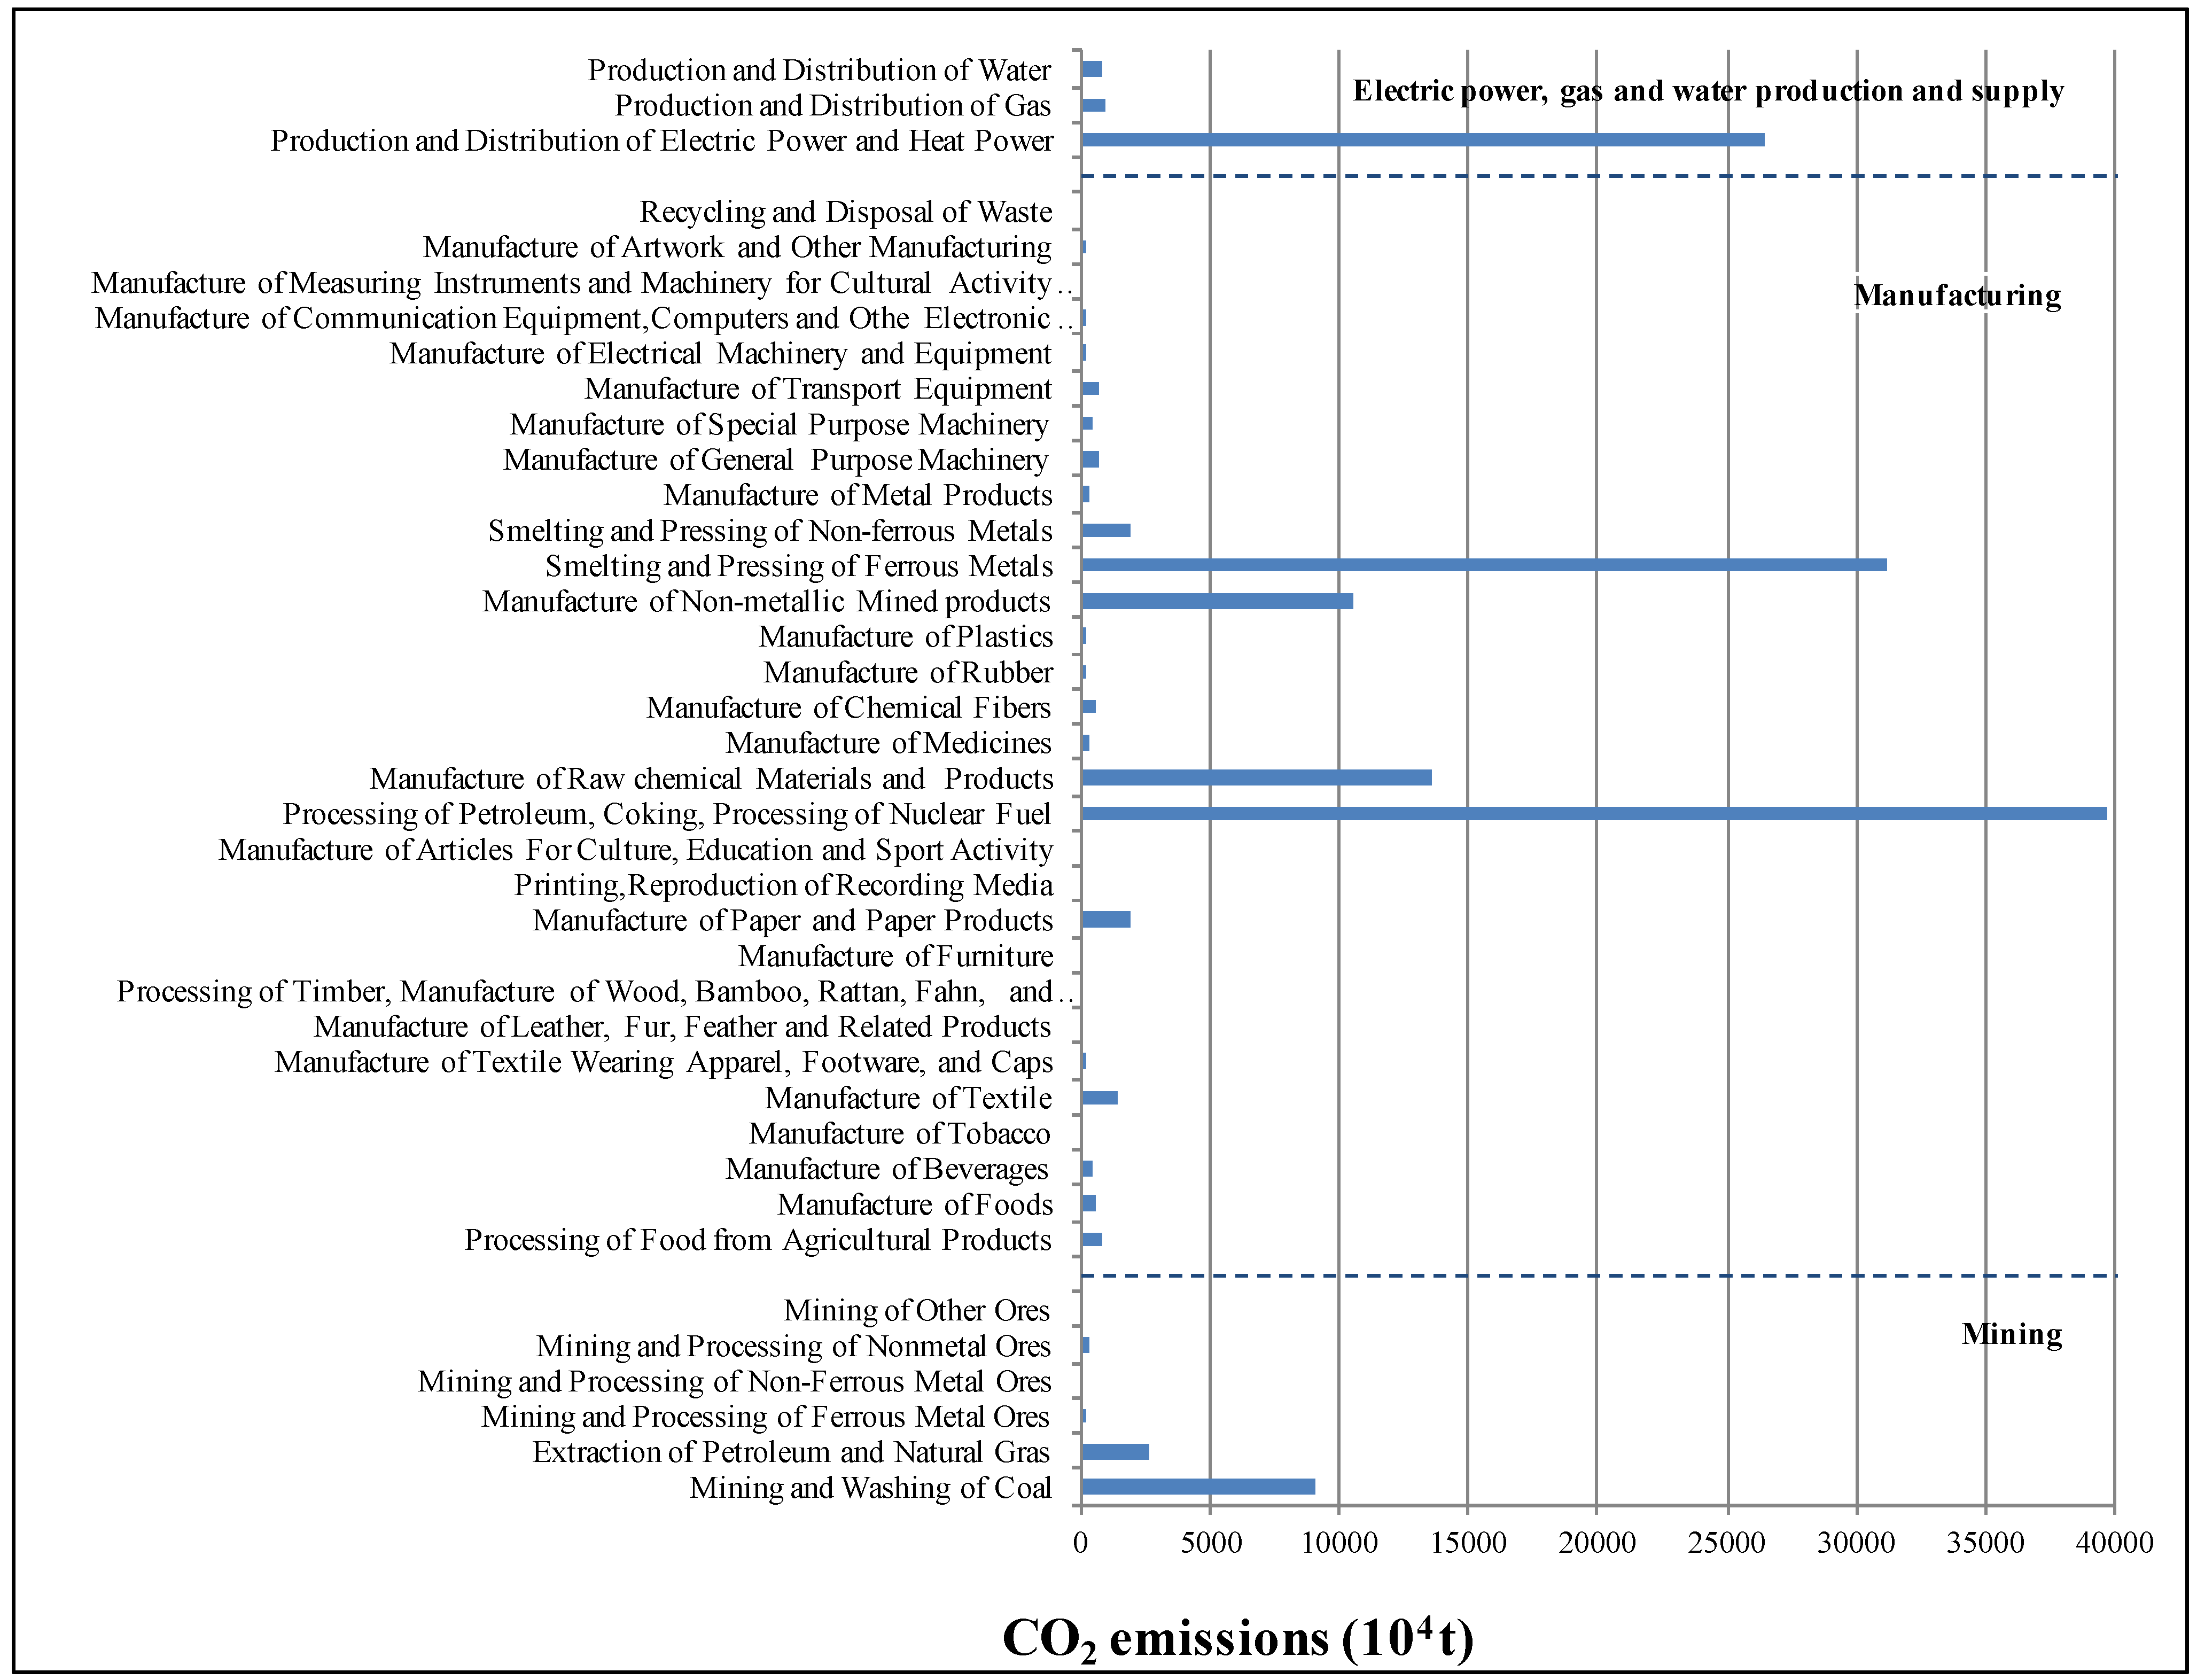
3. Methodology
3.1. Decomposition Model for CO2 Emissions in Industrial Internal Sectors

| Variable | Implication | Variable | Implication |
|---|---|---|---|
| C | Total amount of CO2 emissions | P | Total population |
| Cij | The amount of CO2 emitted by fossil fuel j consumed in sector i | CIij | CIij = Cij/Eij, carbon emissions coefficient for fossil fuels j in sector i |
| Ei | Total amount of fossil fuel consumed in sector i | ESij | ESij = Eij/Ei, ratio of fossil fuel j to total fossil fuels in sector i |
| Eij | The amount of fossil fuel j consumed in sector i | EIi | EIi = Ei/Yi, energy intensity of sector i |
| Y | Total industrial output | YSi | YSi = Yi/Y, share of economic output in sector i in total industrial output |
| Yi | Economic output of sector i | PCG | Per capita GDP |

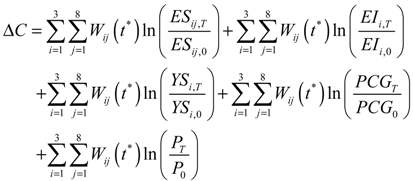

3.2. Decomposition Model for CO2 Emissions in Different Sectors

4. Results and Discussion
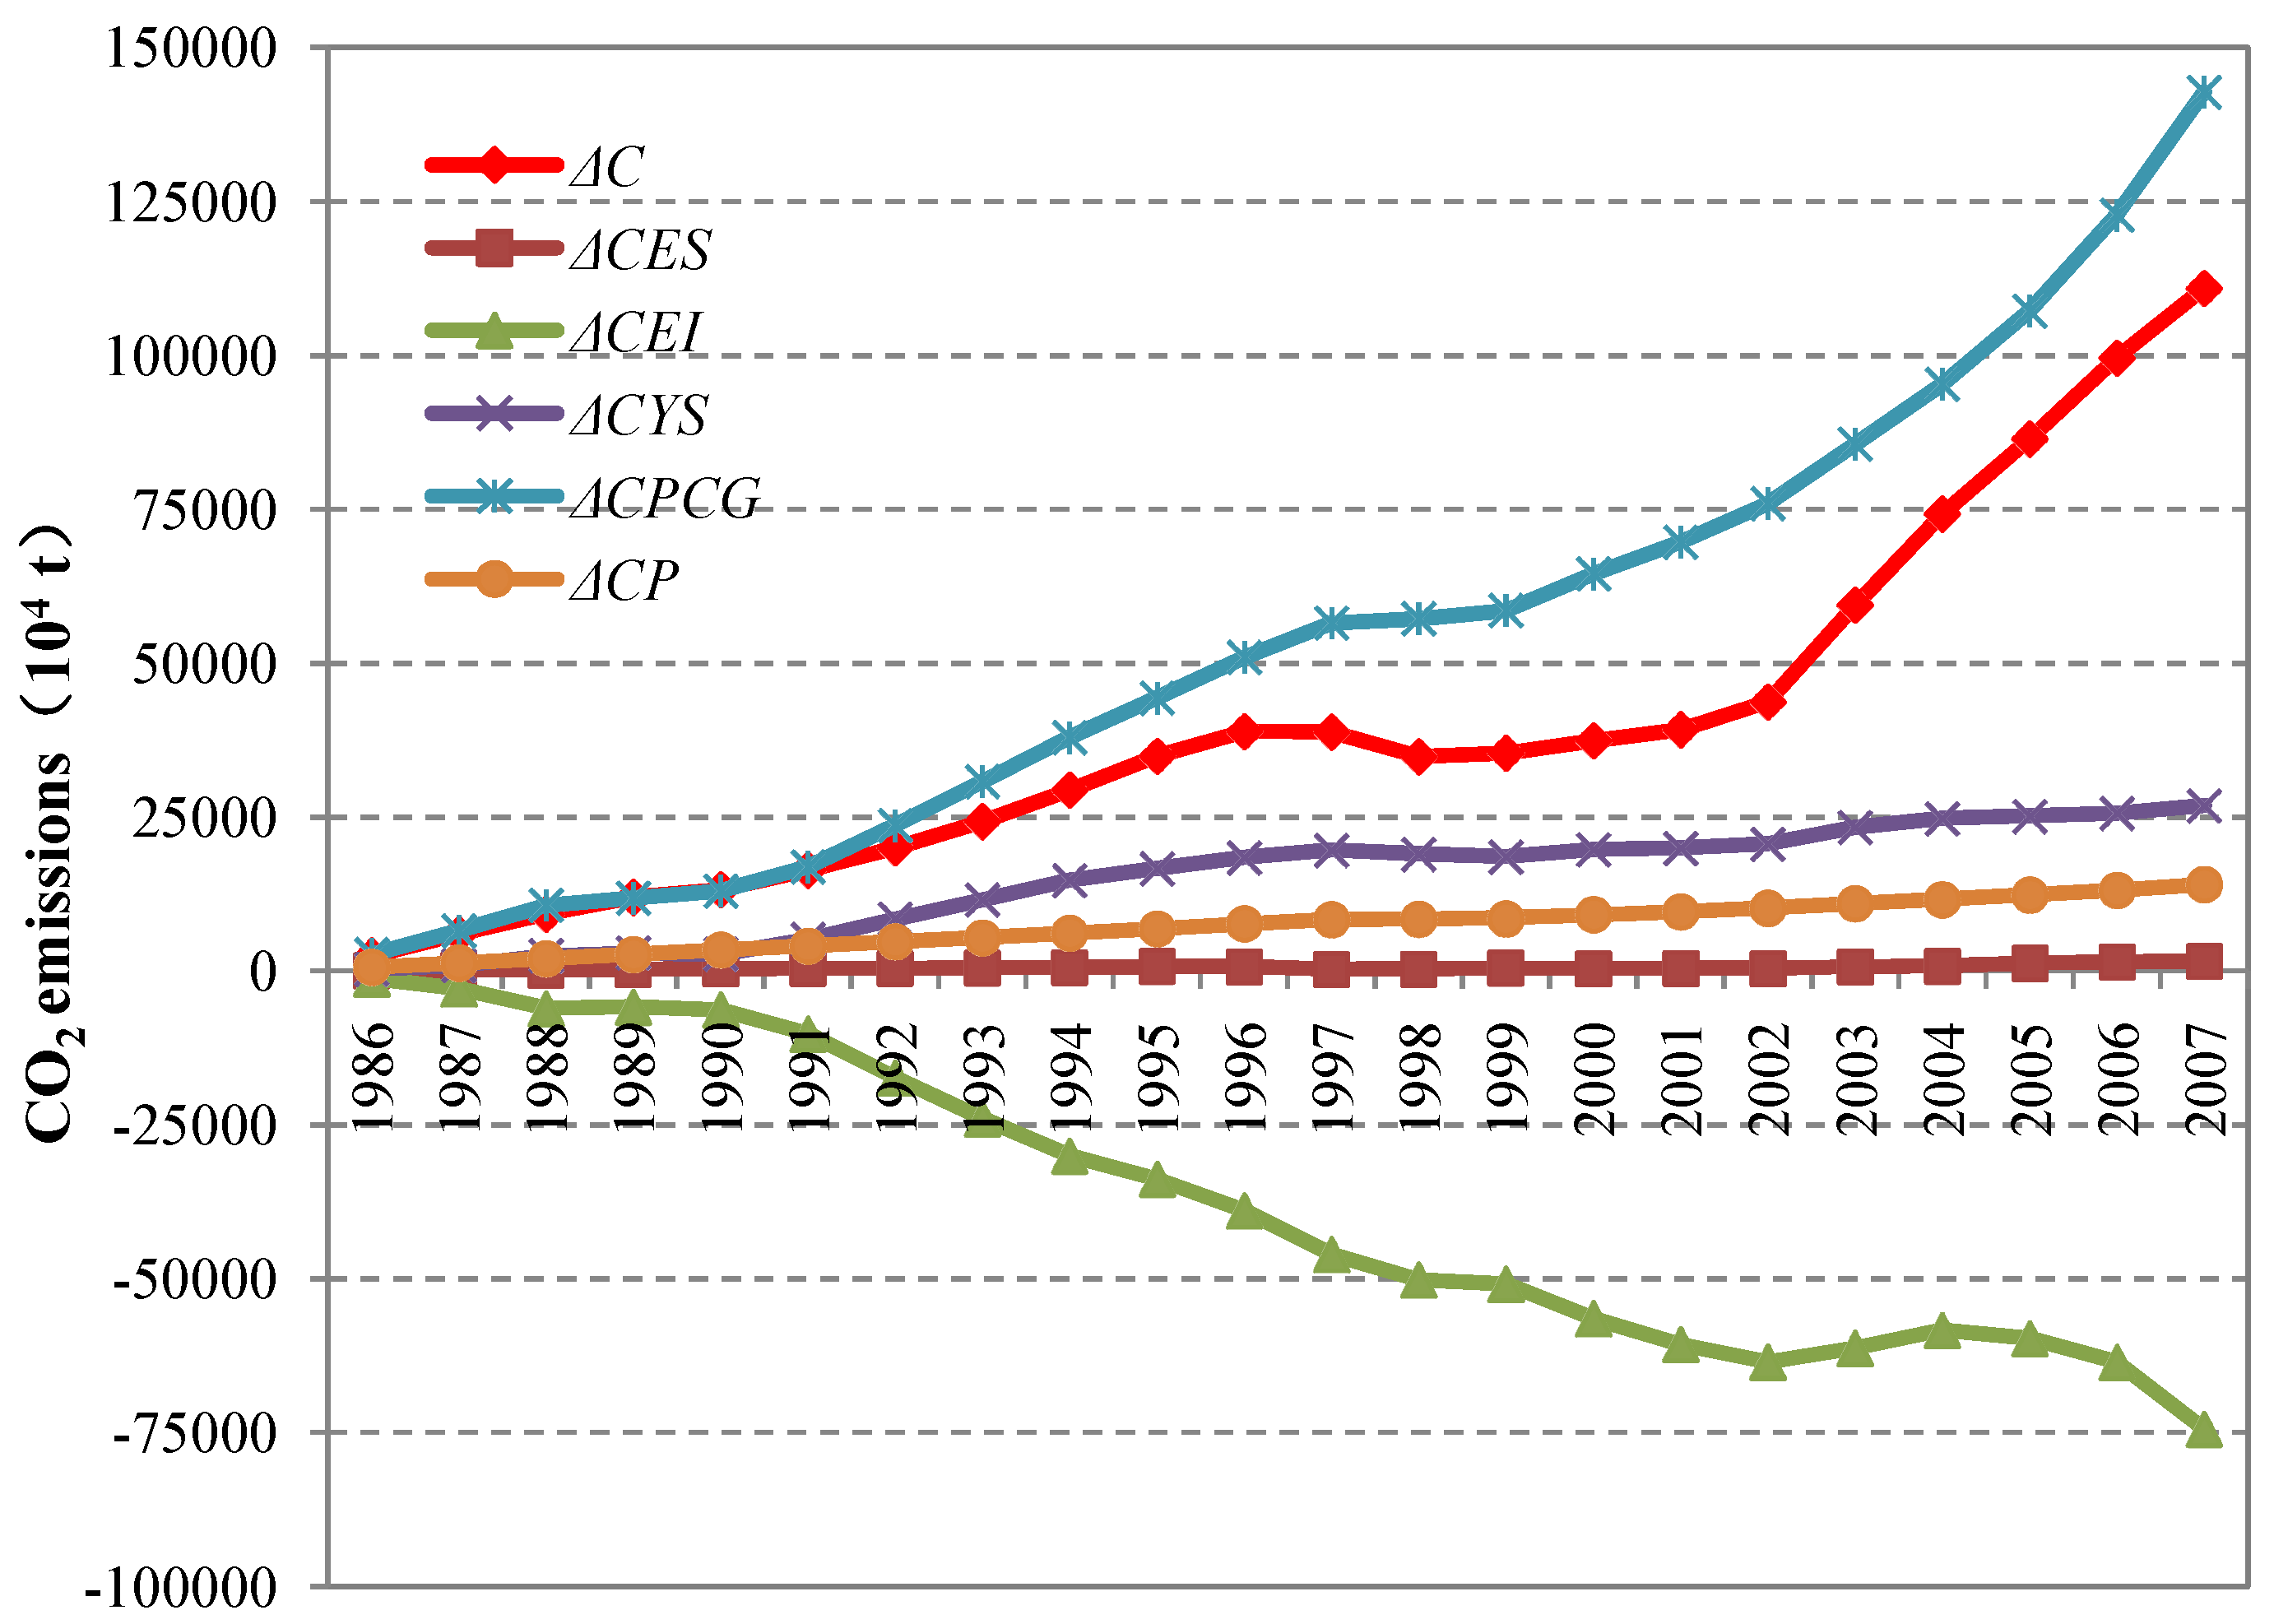
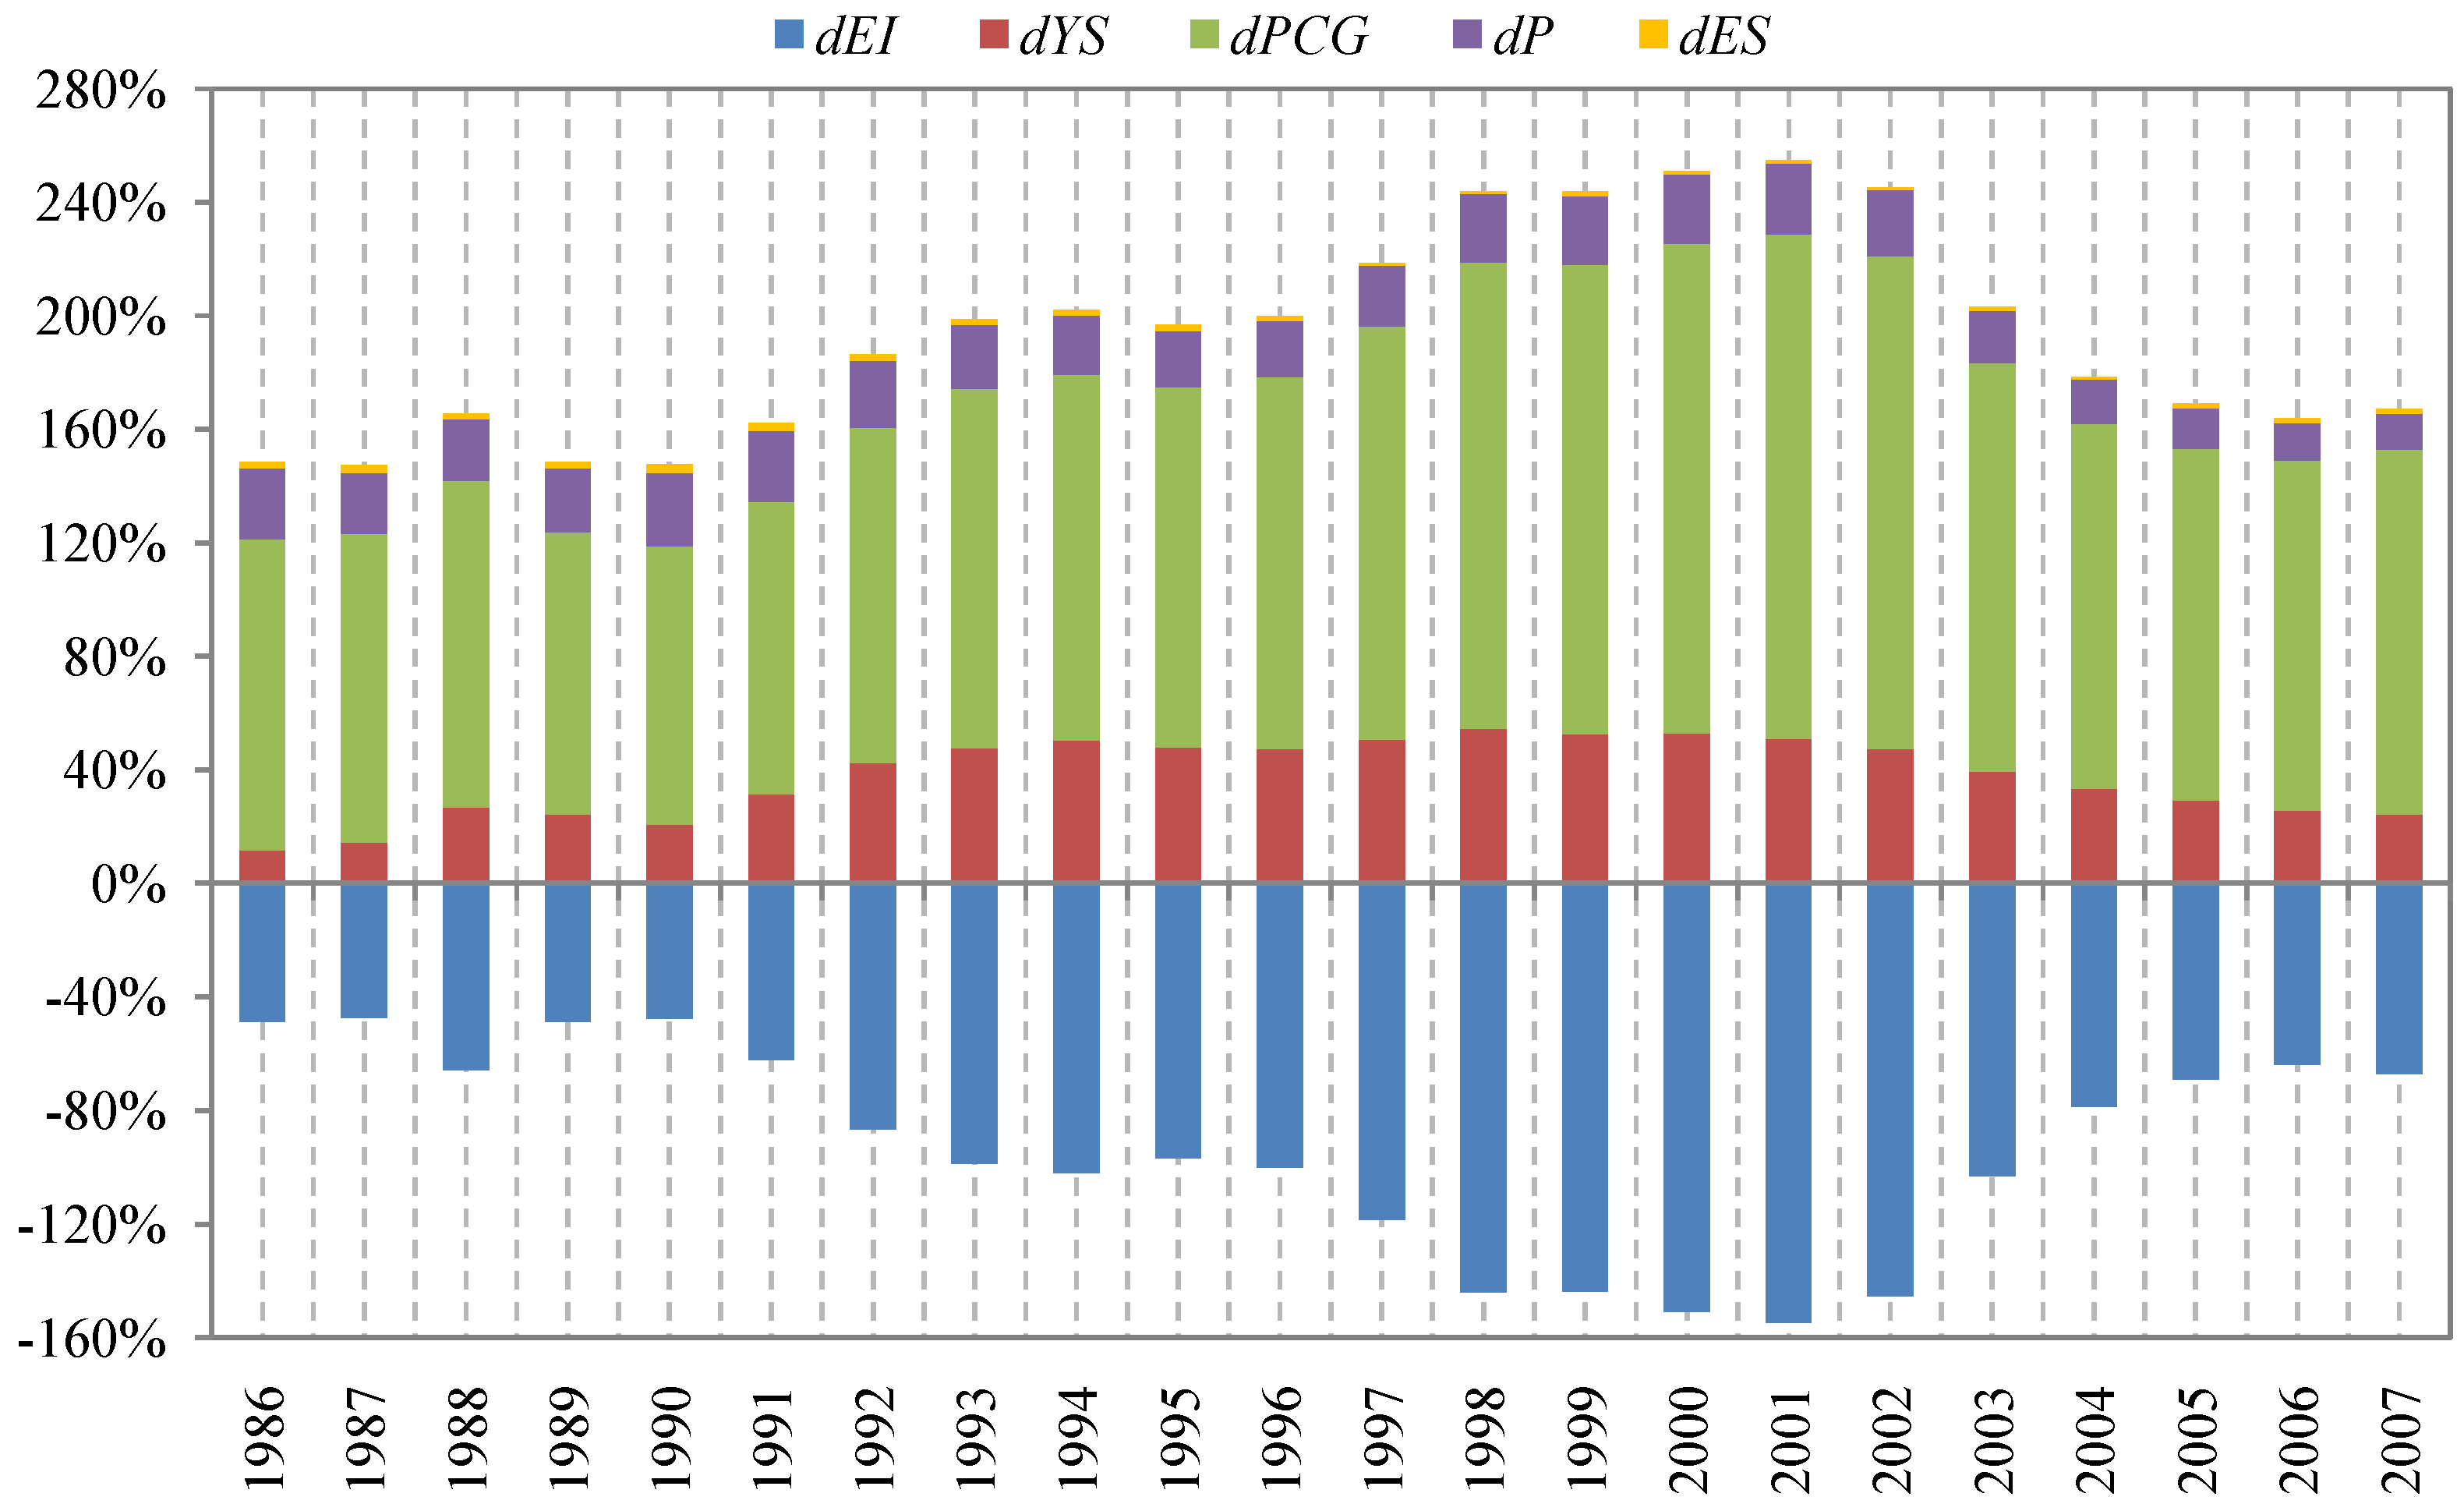
4.1. Decomposition Analysis of Energy-Related Industrial CO2 Emissions
| Year | Total | Energy structure | Energy intensity | Economic structure | Economic activity | Population | ||||||
|---|---|---|---|---|---|---|---|---|---|---|---|---|
| ΔC | dtotal | ΔCES | dES | ΔCEI | dEI | ΔCYS | dYS | ΔCPCG | dPCG | ΔCP | dP | |
| 1986 | 2,416.20 | 100% | 57.01 | 2.36% | −1,174.05 | −48.59% | 282.38 | 11.69% | 2,652.51 | 109.78% | 598.34 | 24.76% |
| 1987 | 5,995.85 | 100% | 168.94 | 2.82% | −2,847.62 | −47.49% | 872.78 | 14.56% | 6,517.65 | 108.70% | 1,284.10 | 21.42% |
| 1988 | 9,236.44 | 100% | 189.69 | 2.05% | −6,064.83 | −65.66% | 2,465.38 | 26.69% | 10,652.69 | 115.33% | 1,993.51 | 21.58% |
| 1989 | 11,955.49 | 100% | 277.49 | 2.32% | −5,813.45 | −48.63% | 2,923.00 | 24.45% | 11,856.04 | 99.17% | 2,712.42 | 22.69% |
| 1990 | 13,212.04 | 100% | 389.53 | 2.95% | −6,302.61 | −47.70% | 2,724.52 | 20.62% | 12,977.49 | 98.22% | 3,423.13 | 25.91% |
| 1991 | 16,378.96 | 100% | 430.75 | 2.63% | −10,190.11 | −62.21% | 5,149.27 | 31.44% | 16,890.79 | 103.12% | 4,098.26 | 25.02% |
| 1992 | 19,997.38 | 100% | 469.18 | 2.35% | −17,316.68 | −86.59% | 8,459.09 | 42.30% | 23,640.69 | 118.22% | 4,745.09 | 23.73% |
| 1993 | 24,271.84 | 100% | 511.20 | 2.11% | −23,982.48 | −98.81% | 11,560.61 | 47.63% | 30,757.59 | 126.72% | 5,424.92 | 22.35% |
| 1994 | 29,403.84 | 100% | 554.32 | 1.89% | −30,009.41 | −102.06% | 14,771.64 | 50.24% | 37,943.97 | 129.04% | 6,143.31 | 20.89% |
| 1995 | 34,887.18 | 100% | 765.71 | 2.19% | −33,776.88 | −96.82% | 16,671.25 | 47.79% | 44,357.42 | 127.15% | 6,869.68 | 19.69% |
| 1996 | 38,888.68 | 100% | 733.06 | 1.89% | −38,884.55 | −99.99% | 18,435.52 | 47.41% | 50,921.97 | 130.94% | 7,682.67 | 19.76% |
| 1997 | 38,827.83 | 100% | 281.59 | 0.73% | −46,021.17 | −118.53% | 19,668.22 | 50.65% | 56,512.94 | 145.55% | 8,386.24 | 21.60% |
| 1998 | 34,837.26 | 100% | 316.93 | 0.91% | −50,164.52 | −144.00% | 19,016.69 | 54.59% | 57,222.29 | 164.26% | 8,445.87 | 24.24% |
| 1999 | 35,357.59 | 100% | 526.96 | 1.49% | −50,832.35 | −143.77% | 18,567.06 | 52.51% | 58,549.40 | 165.59% | 8,546.50 | 24.17% |
| 2000 | 37,411.77 | 100% | 399.36 | 1.07% | −56,460.74 | −150.92% | 19,739.99 | 52.76% | 64,529.73 | 172.49% | 9,203.42 | 24.60% |
| 2001 | 39,171.90 | 100% | 466.91 | 1.19% | −60,644.40 | −154.82% | 19,984.18 | 51.02% | 69,673.59 | 177.87% | 9,691.61 | 24.74% |
| 2002 | 43,716.09 | 100% | 397.08 | 0.91% | −63,503.75 | −145.26% | 20,666.99 | 47.28% | 75,948.26 | 173.73% | 10,207.49 | 23.35% |
| 2003 | 59,430.41 | 100% | 715.15 | 1.20% | −61,253.47 | −103.07% | 23,368.35 | 39.32% | 85,610.91 | 144.05% | 10,989.46 | 18.49% |
| 2004 | 74,223.47 | 100% | 793.93 | 1.07% | −58,328.83 | −78.59% | 24,796.71 | 33.41% | 95,307.64 | 128.41% | 11,654.02 | 15.70% |
| 2005 | 86,430.03 | 100% | 1,308.80 | 1.51% | −59,671.34 | −69.04% | 25,185.50 | 29.14% | 107,238.75 | 124.08% | 12,368.32 | 14.31% |
| 2006 | 99,639.60 | 100% | 1,524.02 | 1.53% | −63,542.53 | −63.77% | 25,640.36 | 25.73% | 122,860.88 | 123.31% | 13,156.85 | 13.20% |
| 2007 | 110,951.62 | 100% | 1,601.77 | 1.44% | −74,444.77 | −67.10% | 26,899.91 | 24.24% | 142,804.16 | 128.71% | 14,090.52 | 12.70% |
4.1.1. Energy Structure Effect
4.1.2. Energy Intensity Effect
4.1.3. Economic Structure Effect
4.1.4. Economic Activity Effect
4.1.5. Population Effect
4.2. Decomposition Analysis of Industry Discrepancy
| Sector | Agriculture | Industry | Construction | Transport, storage, and postal services | Business | Urban and rural households | |
|---|---|---|---|---|---|---|---|
| Total | ΔC | 1,215.83 | 110,951.62 | 1,226.41 | 8,503.05 | 1,070.7 | −793.19 |
| dtotal | 100% | 100% | 100% | 100% | 100% | 100% | |
| Energy structure | ΔCES | −124.24 | 1,601.77 | −54.62 | −490.48 | −167.46 | −1,348.6 |
| dES | −10.22% | 1.44% | −4.45% | −5.77% | −15.64% | 170.02% | |
| Energy intensity | ΔCEI | −554.67 | −74,444.77 | −494.5 | −711.04 | −360.42 | −22,515.99 |
| dEI | −45.62% | −67.10% | −40.32% | −8.36% | −33.66% | 2,838.65% | |
| Economic structure | ΔCYS | −2,746.71 | 26,899.91 | −46.05 | 61.36 | −218.6 | 3,100.75 |
| dYS | −225.91% | 24.24% | −3.76% | 0.72% | −20.42% | −390.92% | |
| Economic activity | ΔCPCG | 4,176.32 | 142,804.16 | 1,659.79 | 8,806.69 | 1,647.83 | 17,786.79 |
| dPCG | 343.49% | 128.71% | 135.34% | 103.57% | 153.90% | −2,242.43% | |
| Population | ΔCP | 465.14 | 14,090.52 | 161.79 | 836.52 | 169.34 | 2,183.84 |
| dP | 38.26% | 12.70% | 13.19% | 9.84% | 15.82% | −275.32% | |

5. Conclusions and Policy Prescriptions
Acknowledgements
References
- The State Council of the People’s Republic of China (SCPRC). The 12th Five-Year Plan Outline of National Economy and Social Development of People’s Republic of China. Available online: http://news.xinhuanet.com/politics/2011-03/16/c_121193916.htm (accessed on 16 March 2011).
- Ang, B.W. Decomposition analysis for policymaking in energy: Which is the preferred method? Energy Policy 2004, 32, 1131–1139. [Google Scholar]
- Steenhof, P.; Woudsma, C.; Sparling, E. Greenhouse gas emissions and the surface transport of freight in Canada. Transp. Res. Part D Transp. Environ. 2006, 11, 369–376. [Google Scholar] [CrossRef]
- Ang, B.W. Decomposition analysis applied to energy. In Encyclopedia of Energy; Cleveland, C.J., Ed.; Elsevier: Amsterdam, The Netherlands, 2004; pp. 761–769. [Google Scholar]
- Ang, B.W.; Liu, N. Energy decomposition analysis: IEA model versus other methods. Energy Policy 2007, 35, 1426–1432. [Google Scholar] [CrossRef]
- Ang, B.W.; Zhang, F.Q. A survey of index decomposition analysis in energy and environmental studies. Energy 2000, 25, 1149–1176. [Google Scholar] [CrossRef]
- Ang, B.W.; Liu, F.L. A new energy decomposition method: Perfect in decomposition and consistent in aggregation. Energy 2001, 26, 537–548. [Google Scholar] [CrossRef]
- O’Mahony, T.; Zhou, P.; Sweeney, J. The driving forces of change in energy-related CO2 emissions in Ireland: A multi-sectoral decomposition from 1990 to 2007. Energy Policy 2012, 44, 256–267. [Google Scholar] [CrossRef]
- Ang, B.W.; Zhang, F.Q.; Choi, K. Factorizing changes in energy and environmental indicators through decomposition. Energy 1998, 23, 489–495. [Google Scholar] [CrossRef]
- Liu, N.; Ang, B.W. Factors shaping aggregate energy intensity trend for industry: Energy Intensity versus product mix. Energy Econ. 2007, 29, 609–635. [Google Scholar] [CrossRef]
- Ang, B.W.; Mu, A.R.; Zhou, P. Accounting frameworks for tracking energy efficiency trends. Energy Econ. 2010, 32, 1209–1219. [Google Scholar] [CrossRef]
- Peters, G.P.; Hertwich, E.G. CO2 embodied in international trade with implications for global climate policy. Environ. Sci. Technol. 2008, 42, 1401–1407. [Google Scholar] [CrossRef] [PubMed]
- Greening, L.A.; Ting, M.; Davis, W.B. Decomposition of aggregate carbon intensity for freight: Comparison of declining trends from 10 OECD countries for the period 1971–1993. Energy Econ. 1999, 21, 331–361. [Google Scholar] [CrossRef]
- Pani, R.; Mukhopadhyay, U. Identifying the major player behind increasing global carbon dioxide emissions: A decomposition analysis. Environmentalist 2010, 30, 183–205. [Google Scholar] [CrossRef]
- Greening, L.A.; Ting, M.; Krackler, T.J. Effects of changes in residential end-uses and behavior on aggregate carbon intensity: Comparison of 10 OECD countries for the period 1970–1993. Energy Econ. 2001, 23, 153–178. [Google Scholar] [CrossRef]
- Greening, L.A. Effects of human behavior on aggregate carbon intensity of personal transportation: Comparison of 10 OECD countries for the period 1970–1993. Energy Econ. 2004, 26, 1–30. [Google Scholar] [CrossRef]
- Choi, K.H.; Ang, B.W. A time-series analysis of energy-related carbon emissions in Korea. Energy Policy 2001, 29, 1155–1161. [Google Scholar] [CrossRef]
- Oh, I.; Wehrmeyer, W.; Mulugetta, Y. Decomposition analysis and mitigation strategies of CO2 emissions from energy consumption in South Korea. Energy Policy 2010, 38, 364–377. [Google Scholar] [CrossRef]
- Bhattacharyya, S.C.; Ussanarassamee, A. Decomposition of energy and CO2 intensities of Thai industry between 1981 and 2000. Energy Econ. 2004, 26, 765–781. [Google Scholar] [CrossRef]
- Paul, S.; Bhattacharya, R.N. CO2 Emission from energy use in India: A decomposition analysis. Energy Policy 2004, 32, 585–593. [Google Scholar] [CrossRef]
- Luciano, C.F.; Shinji, K. Decomposing the decoupling of CO2 emissions and economic growth in Brazil. Ecol. Econ. 2011, 70, 1459–1469. [Google Scholar] [CrossRef]
- Luciano, C.F.; Shinji, K. Decomposition of CO2 emissions change from energy consumption in Brazil: Challenges and policy implications. Energy Policy 2011, 39, 1495–1504. [Google Scholar] [CrossRef]
- Tunc, G.I.; Türüt-Asık, S.; Akbostancı, E.; Gipek, T.; Serap, T.A.; Elif, A. A decomposition analysis of CO2 emissions from energy use: Turkish case. Energy Policy 2009, 37, 4689–4699. [Google Scholar] [CrossRef]
- Kwon, T.H. Decomposition of factors determining the trend of CO2 emissions from car travel in Great Britain (1970–2000). Ecol. Econ. 2005, 53, 261–275. [Google Scholar] [CrossRef]
- Hatzigeorgiou, E.; Polatidis, H.; Haralambopoulos, D. CO2 Emissions in Greece for 1990–2002: A decomposition analysis and comparison of results using the arithmetic mean divisia index and logarithmic mean divisia index techniques. Energy 2011, 33, 492–499. [Google Scholar] [CrossRef]
- Wu, L.B.; Kaneko, S. Driving forces behind the stagnancy of Chinas energy-related CO2 emissions from 1996 to 1999: The relative importance of structural change, intensity change and scale change. Energy Policy 2005, 33, 319–335. [Google Scholar] [CrossRef]
- Wu, L.B.; Kaneko, S.; Matsuoka, S. Dynamics of energy-related CO2 emissions in China during 1980 to 2002: The relative importance of energy supply-side and demand-side effects. Energy Policy 2006, 34, 3549–3572. [Google Scholar] [CrossRef]
- Xu, G.Q.; Liu, Z.Y.; Jiang, Z.H. Decomposition model and empirical study of carbon emissions for China, 1995–2004 [in Chinese]. China Popul. Resour. Environ. 2006, 16, 158–161. [Google Scholar]
- Song, D.Y.; Lu, Z.B. The factor decomposition and periodic fluctuations of carbon emission in China [in Chinese]. China Popul. Resour. Environ. 2009, 3, 18–24. [Google Scholar]
- Fan, Y.; Liu, L.C.; Wu, G.; Tsai, H.T.; Wei, Y.M. Changes in carbon intensity in China: Empirical findings from 1980–2003. Ecol. Econ. 2007, 62, 683–691. [Google Scholar] [CrossRef]
- Zhang, M.; Mu, H.L.; Ning, Y.D.; Song, Y.C. Decomposition of energy-related CO2 emission over 1991–2006 in China. Ecol. Econ. 2009, 68, 2122–2128. [Google Scholar] [CrossRef]
- Sun, J.W.; Zhao, R.Q.; Huang, X.J.; Chen, Z.G. Research on carbon emission estimation and factor decomposition of China from 1995 to 2005. J. Nat. Resour. 2010, 25, 1284–1295. [Google Scholar]
- Zhang, Y.; Zhang, J.Y.; Yang, Z.F.; Li, S.S. Regional differences in the factors that influence China’s energy-related carbon emissions, and potential mitigation strategies. Energy Policy 2011, 39, 7712–7718. [Google Scholar] [CrossRef]
- Wu, F.; Fan, L.W.; Zhou, P.; Zhou, D.Q. Industrial energy efficiency with CO2 emissions in China: A nonparametric analysis. Energy Policy 2012, 49, 164–172. [Google Scholar] [CrossRef]
- Wang, S.S.; Zhou, D.Q.; Zhou, P.; Wang, Q.W. CO2 Emissions, energy consumption and economic growth in China: A panel data analysis. Energy Policy 2011, 39, 4870–4875. [Google Scholar] [CrossRef]
- Wang, H.T.; Mu, S.R. The characteristics and trend of carbon emissions in Beijing. Urban Studies 2010, 17, 55–61. [Google Scholar]
- Zhou, S.Y.; Chen, H.; Li, S.C. Resources use and greenhouse gas emissions in urban economy: Ecological input–output modeling for Beijing 2002. Commun. Nonlinear Sci. Numer. Simul. 2010, 15, 3201–3231. [Google Scholar] [CrossRef]
- Liu, C.C. An extended method for key factors in reducing CO2 emissions. Appl. Math. Comput. 2007, 189, 440–451. [Google Scholar] [CrossRef]
- Zhao, M.; Zhang, W.G.; Yu, L.Z. Carbon emissions from energy consumption in Shanghai city. Res. Environ. Sci. 2009, 22, 984–989. [Google Scholar]
- Brownstone, D.; Golob, T.F. The impact of residential density on vehicle usage and energy consumption. J. Urban Econ. 2010, 65, 91–98. [Google Scholar] [CrossRef]
- Glaser, E.L.; Kahn, M.E. The greenness of cities: Carbon dioxide emissions and urban development. J. Urban Econ. 2010, 26, 51–75. [Google Scholar]
- Dhakal, S. Urban energy use and carbon emissions from cities in China and policy implications. Energy Policy 2009, 37, 4208–4219. [Google Scholar] [CrossRef]
- Diakoulaki, D.; Mandaraka, M. Decomposition analysis for assessing the progress in decoupling industrial growth from CO2 emission in the EU manufacturing sector. Energy Econ. 2007, 29, 636–664. [Google Scholar] [CrossRef]
- Freeman, S.L.; Niefer, M.J.; Roop, J.M. Measuring industrial energy intensity: Practical issues and problems. Energy Policy 1997, 25, 703–714. [Google Scholar] [CrossRef]
- Ang, B.W.; Choi, K.H. Decomposition of Aggregate energy and gas emission intensities for industry: A refined divisia index method. Energy J. 1997, 18, 59–73. [Google Scholar] [CrossRef]
- Timilsina, G.R.; Shrestha, A. Factors affecting transport sector CO2 emissions growth in Latin American and Caribbean countries: An LMDI decomposition analysis. Int. J. Energy Res. 2009, 33, 396–414. [Google Scholar] [CrossRef]
- Ediger, V.S.; Huvaz, O. Examining the sectoral energy use in Turkish economy (1980–2000) with the help of decomposition analysis. Energy Convers. Manag. 2006, 47, 732–745. [Google Scholar] [CrossRef]
- Zhang, M.Y.; Huang, X.J. Effects of industrial restructuring on carbon reduction: An analysis of Jiangsu Province, China. Energy 2012, 44, 515–526. [Google Scholar] [CrossRef]
- Liu, L.; Fan, Y.; Wu, G.; Wei, Y. Using LMDI method to analyze the change of China’s industrial CO2 emissions from final fuel use: An empirical analysis. Energy Policy 2007, 35, 5892–5900. [Google Scholar] [CrossRef]
- Ren, S.G.; Fu, X.; Chen, X.H. Regional variation of energy-related industrial CO2 emissions mitigation in China [in Chinese]. China Econ. Rev. 2012, 23, 1134–1145. [Google Scholar] [CrossRef]
- Zhao, M.; Tan, L.R.; Zhang, W.G.; Ji, M.H.; Liu, Y.; Yu, L.Z. Decomposing the influencing factors of industrial carbon emissions in Shanghai using the LMDI method. Energy 2010, 35, 2505–2510. [Google Scholar] [CrossRef]
- National Bureau of Statistics of China. China Statistical Yearbook 1986; China Statistics Press: Beijing, China, 1986.
- National Bureau of Statistics of China. China Statistical Yearbook 1987; China Statistics Press: Beijing, China, 1987.
- National Bureau of Statistics of China. China Statistical Yearbook 1988; China Statistics Press: Beijing, China, 1988.
- National Bureau of Statistics of China. China Statistical Yearbook 1989; China Statistics Press: Beijing, China, 1989.
- National Bureau of Statistics of China. China Statistical Yearbook 1990; China Statistics Press: Beijing, China, 1990.
- National Bureau of Statistics of China. China Statistical Yearbook 1991; China Statistics Press: Beijing, China, 1991.
- National Bureau of Statistics of China. China Statistical Yearbook 1992; China Statistics Press: Beijing, China, 1992.
- National Bureau of Statistics of China. China Statistical Yearbook 1993; China Statistics Press: Beijing, China, 1993.
- National Bureau of Statistics of China. China Statistical Yearbook 1994; China Statistics Press: Beijing, China, 1994.
- National Bureau of Statistics of China. China Statistical Yearbook 1995; China Statistics Press: Beijing, China, 1995.
- National Bureau of Statistics of China. China Statistical Yearbook 1996; China Statistics Press: Beijing, China, 1996.
- National Bureau of Statistics of China. China Statistical Yearbook 1997; China Statistics Press: Beijing, China, 1997.
- National Bureau of Statistics of China. China Statistical Yearbook 1998; China Statistics Press: Beijing, China, 1998.
- National Bureau of Statistics of China. China Statistical Yearbook 1999; China Statistics Press: Beijing, China, 1999.
- National Bureau of Statistics of China. China Statistical Yearbook 2000; China Statistics Press: Beijing, China, 2000.
- National Bureau of Statistics of China. China Statistical Yearbook 2001; China Statistics Press: Beijing, China, 2001.
- National Bureau of Statistics of China. China Statistical Yearbook 2002; China Statistics Press: Beijing, China, 2002.
- National Bureau of Statistics of China. China Statistical Yearbook 2003; China Statistics Press: Beijing, China, 2003.
- National Bureau of Statistics of China. China Statistical Yearbook 2004; China Statistics Press: Beijing, China, 2004.
- National Bureau of Statistics of China. China Statistical Yearbook 2005; China Statistics Press: Beijing, China, 2005.
- National Bureau of Statistics of China. China Statistical Yearbook 2006; China Statistics Press: Beijing, China, 2006.
- National Bureau of Statistics of China. China Statistical Yearbook 2007; China Statistics Press: Beijing, China, 2007.
- National Bureau of Statistics of China. China Statistical Yearbook 2008; China Statistics Press: Beijing, China, 2008.
- National Bureau of Statistics of China. China Energy Statistical Yearbook 1986; China Statistics Press: Beijing, China, 1987.
- National Bureau of Statistics of China. China Energy Statistical Yearbook 1989; China Statistics Press: Beijing, China, 1990.
- National Bureau of Statistics of China. China Energy Statistical Yearbook 1991–1996; China Statistics Press: Beijing, China, 1998.
- National Bureau of Statistics of China. China Energy Statistical Yearbook 1997–1999; China Statistics Press: Beijing, China, 2001.
- National Bureau of Statistics of China. China Energy Statistical Yearbook 2000–2002; China Statistics Press: Beijing, China, 2004.
- National Bureau of Statistics of China. China Energy Statistical Yearbook 2004; China Statistics Press: Beijing, China, 2005.
- National Bureau of Statistics of China. China Energy Statistical Yearbook 2005; China Statistics Press: Beijing, China, 2006.
- National Bureau of Statistics of China. China Energy Statistical Yearbook 2006; China Statistics Press: Beijing, China, 2007.
- National Bureau of Statistics of China. China Energy Statistical Yearbook 2007; China Statistics Press: Beijing, China, 2008.
- National Bureau of Statistics of China. China Energy Statistical Yearbook 2008; China Statistics Press: Beijing, China, 2008.
- Intergovernmental Panel on Climate Change (IPCC). 2006 Intergovernmental Panel on Climate Change Guidelines for National Greenhouse Gas Inventories, Volume 2 Energy. Available online: http://www.ipcc-nggip. iges.or.jp/public/2006gl/vol2.html (accessed on 1 April 2007).
- Ang, B.W.; Choi, K. Decomposition of aggregate energy and gas emission intensities for industry: A refined divisia index method. Energy J. 1997, 18, 59–73. [Google Scholar] [CrossRef]
- National Bureau of Statistics of China (NBSC). Statistical Communiqué of the People’s Republic of China on the 1985 National Economic and Social Development [in Chinese]. In Gazette State Council of the People’s Republic of China; NBSC: Beijing, China, 1986; Volume 6, pp. 131–134. [Google Scholar]
- National Bureau of Statistics of China (NBSC). Statistical Communiqué of the People’s Republic of China on the 2007 national economic and social development [in Chinese]. In China Stat.; 2008; 3, pp. 4–9. [Google Scholar]
© 2013 by the authors; licensee MDPI, Basel, Switzerland. This article is an open access article distributed under the terms and conditions of the Creative Commons Attribution license (http://creativecommons.org/licenses/by/3.0/).
Share and Cite
Chen, L.; Yang, Z.; Chen, B. Decomposition Analysis of Energy-Related Industrial CO2 Emissions in China. Energies 2013, 6, 2319-2337. https://doi.org/10.3390/en6052319
Chen L, Yang Z, Chen B. Decomposition Analysis of Energy-Related Industrial CO2 Emissions in China. Energies. 2013; 6(5):2319-2337. https://doi.org/10.3390/en6052319
Chicago/Turabian StyleChen, Liang, Zhifeng Yang, and Bin Chen. 2013. "Decomposition Analysis of Energy-Related Industrial CO2 Emissions in China" Energies 6, no. 5: 2319-2337. https://doi.org/10.3390/en6052319
APA StyleChen, L., Yang, Z., & Chen, B. (2013). Decomposition Analysis of Energy-Related Industrial CO2 Emissions in China. Energies, 6(5), 2319-2337. https://doi.org/10.3390/en6052319


