Balancing Fiscal, Energy, and Environmental Concerns: Analyzing the Policy Options for California’s Energy and Economic Future

Abstract
:1. Introduction
2. Modeling California’s Energy and Economic Future
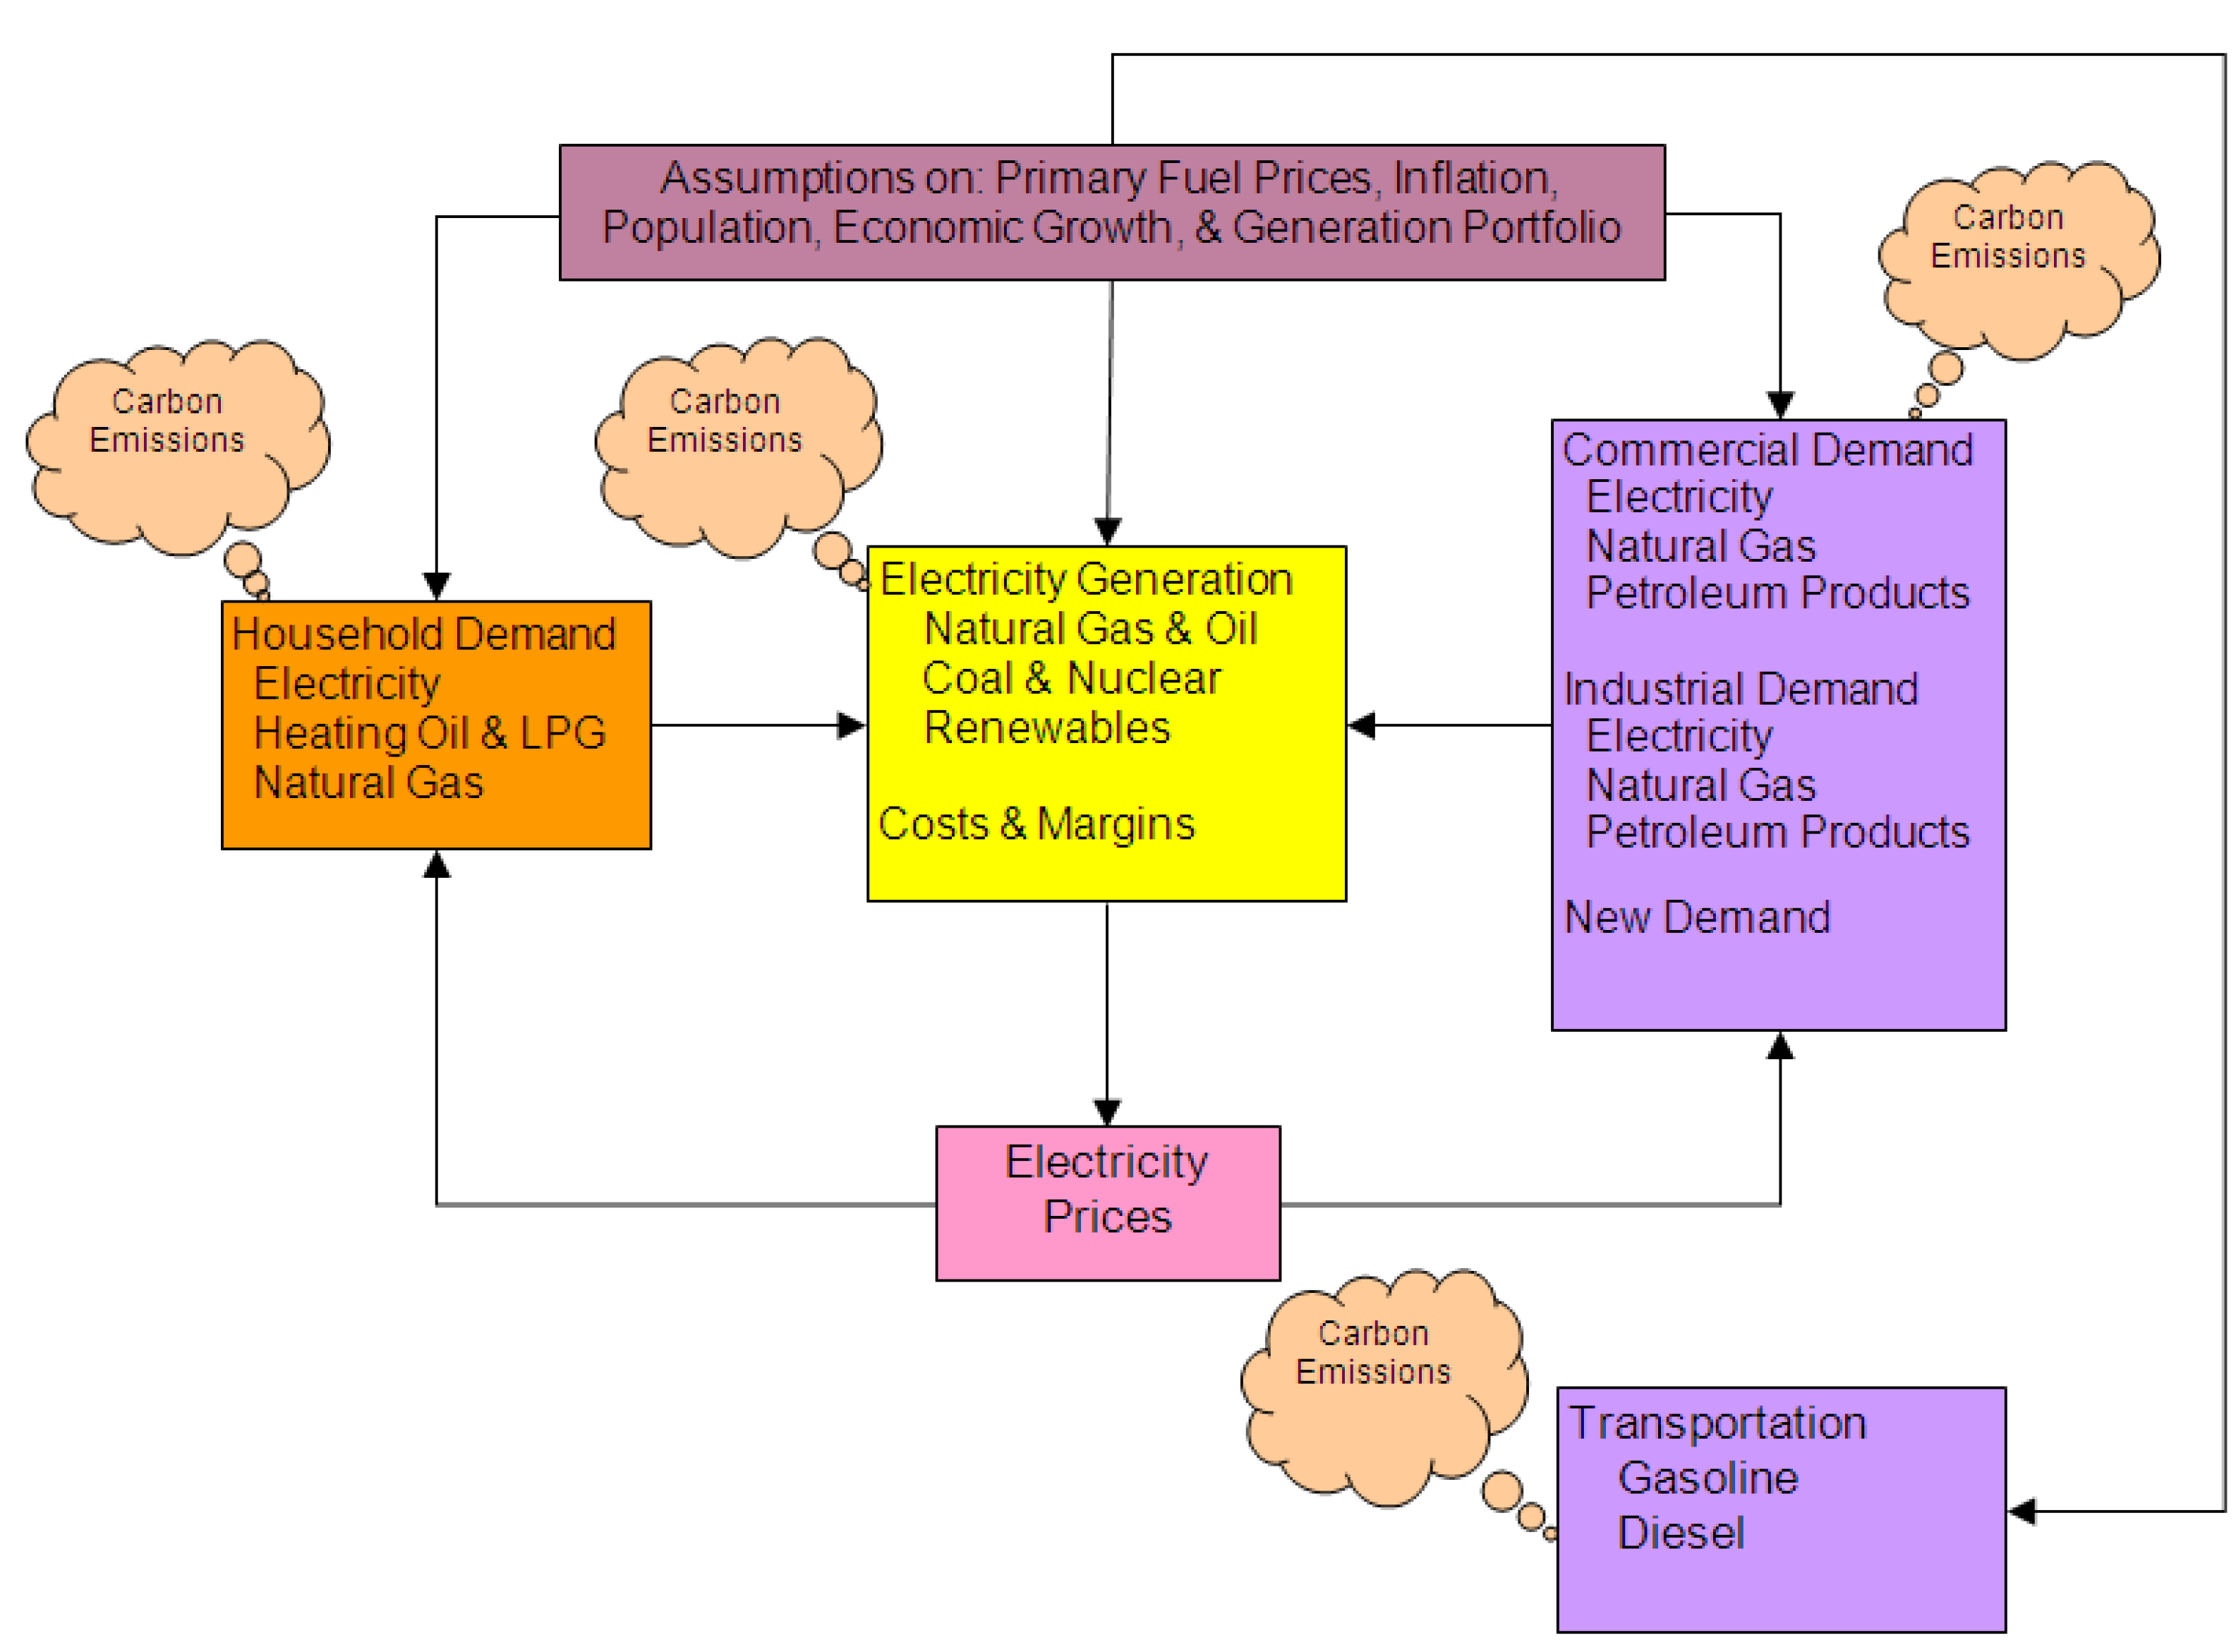
2.1. The Energy Market Forecasting Model

| Endogenous Variables | Type | Endogenous Variables | Type |
|---|---|---|---|
| Residential Sector | Commercial Sector | ||
| Divisia energy price | I | Divisia energy price | I |
| Aggregate energy quantity | B | Aggregate energy quantity | B |
| Cost shares & quantities | Cost shares & quantities | ||
| Natural Gas | B | Natural Gas | B |
| Liquid Propane Gas, etc. | B | Petroleum Products | B |
| Electricity | B | Electricity | B |
| Electricity Generation | Industrial Sector | ||
| Generation & Fuel Use | Divisia energy price | I | |
| Natural Gas | B | Aggregate energy quantity | B |
| Nuclear | B | Cost shares & quantities | |
| Coal | B | Boiler & Process Fuels | B |
| Hydroelectric | B | Natural Gas | B |
| Other Renewables | B | Coal | B |
| Electric power generation | I | Other petroleum products | B |
| Electricity consumption | I | Electricity | B |
| Average Generation Costs | I | Transportation | |
| Retail Electricity prices | B | Gasoline in road travel | B |
| Diesel in road travel | B |
2.2. Economic Impact Analysis and Models
3. Scenario Development
- Full implementation of California Renewable Energy Resources Act;
- Adoption of integrated combined cycle natural gas power generation;
- Development of crude oil and natural gas reserves in the Santa Barbara Channel;
- The level and composition of energy consumption;
- Greenhouse gas emissions;
- Employment;
- Value added;
- Tax revenues.
3.1. Baseline Scenario

3.2. California Renewable Energy Resources Act
3.3. Natural Gas Based Electricity Generation

3.4. Developing Oil and Natural Gas Resources

4. Energy, Economic, and Environmental Impacts
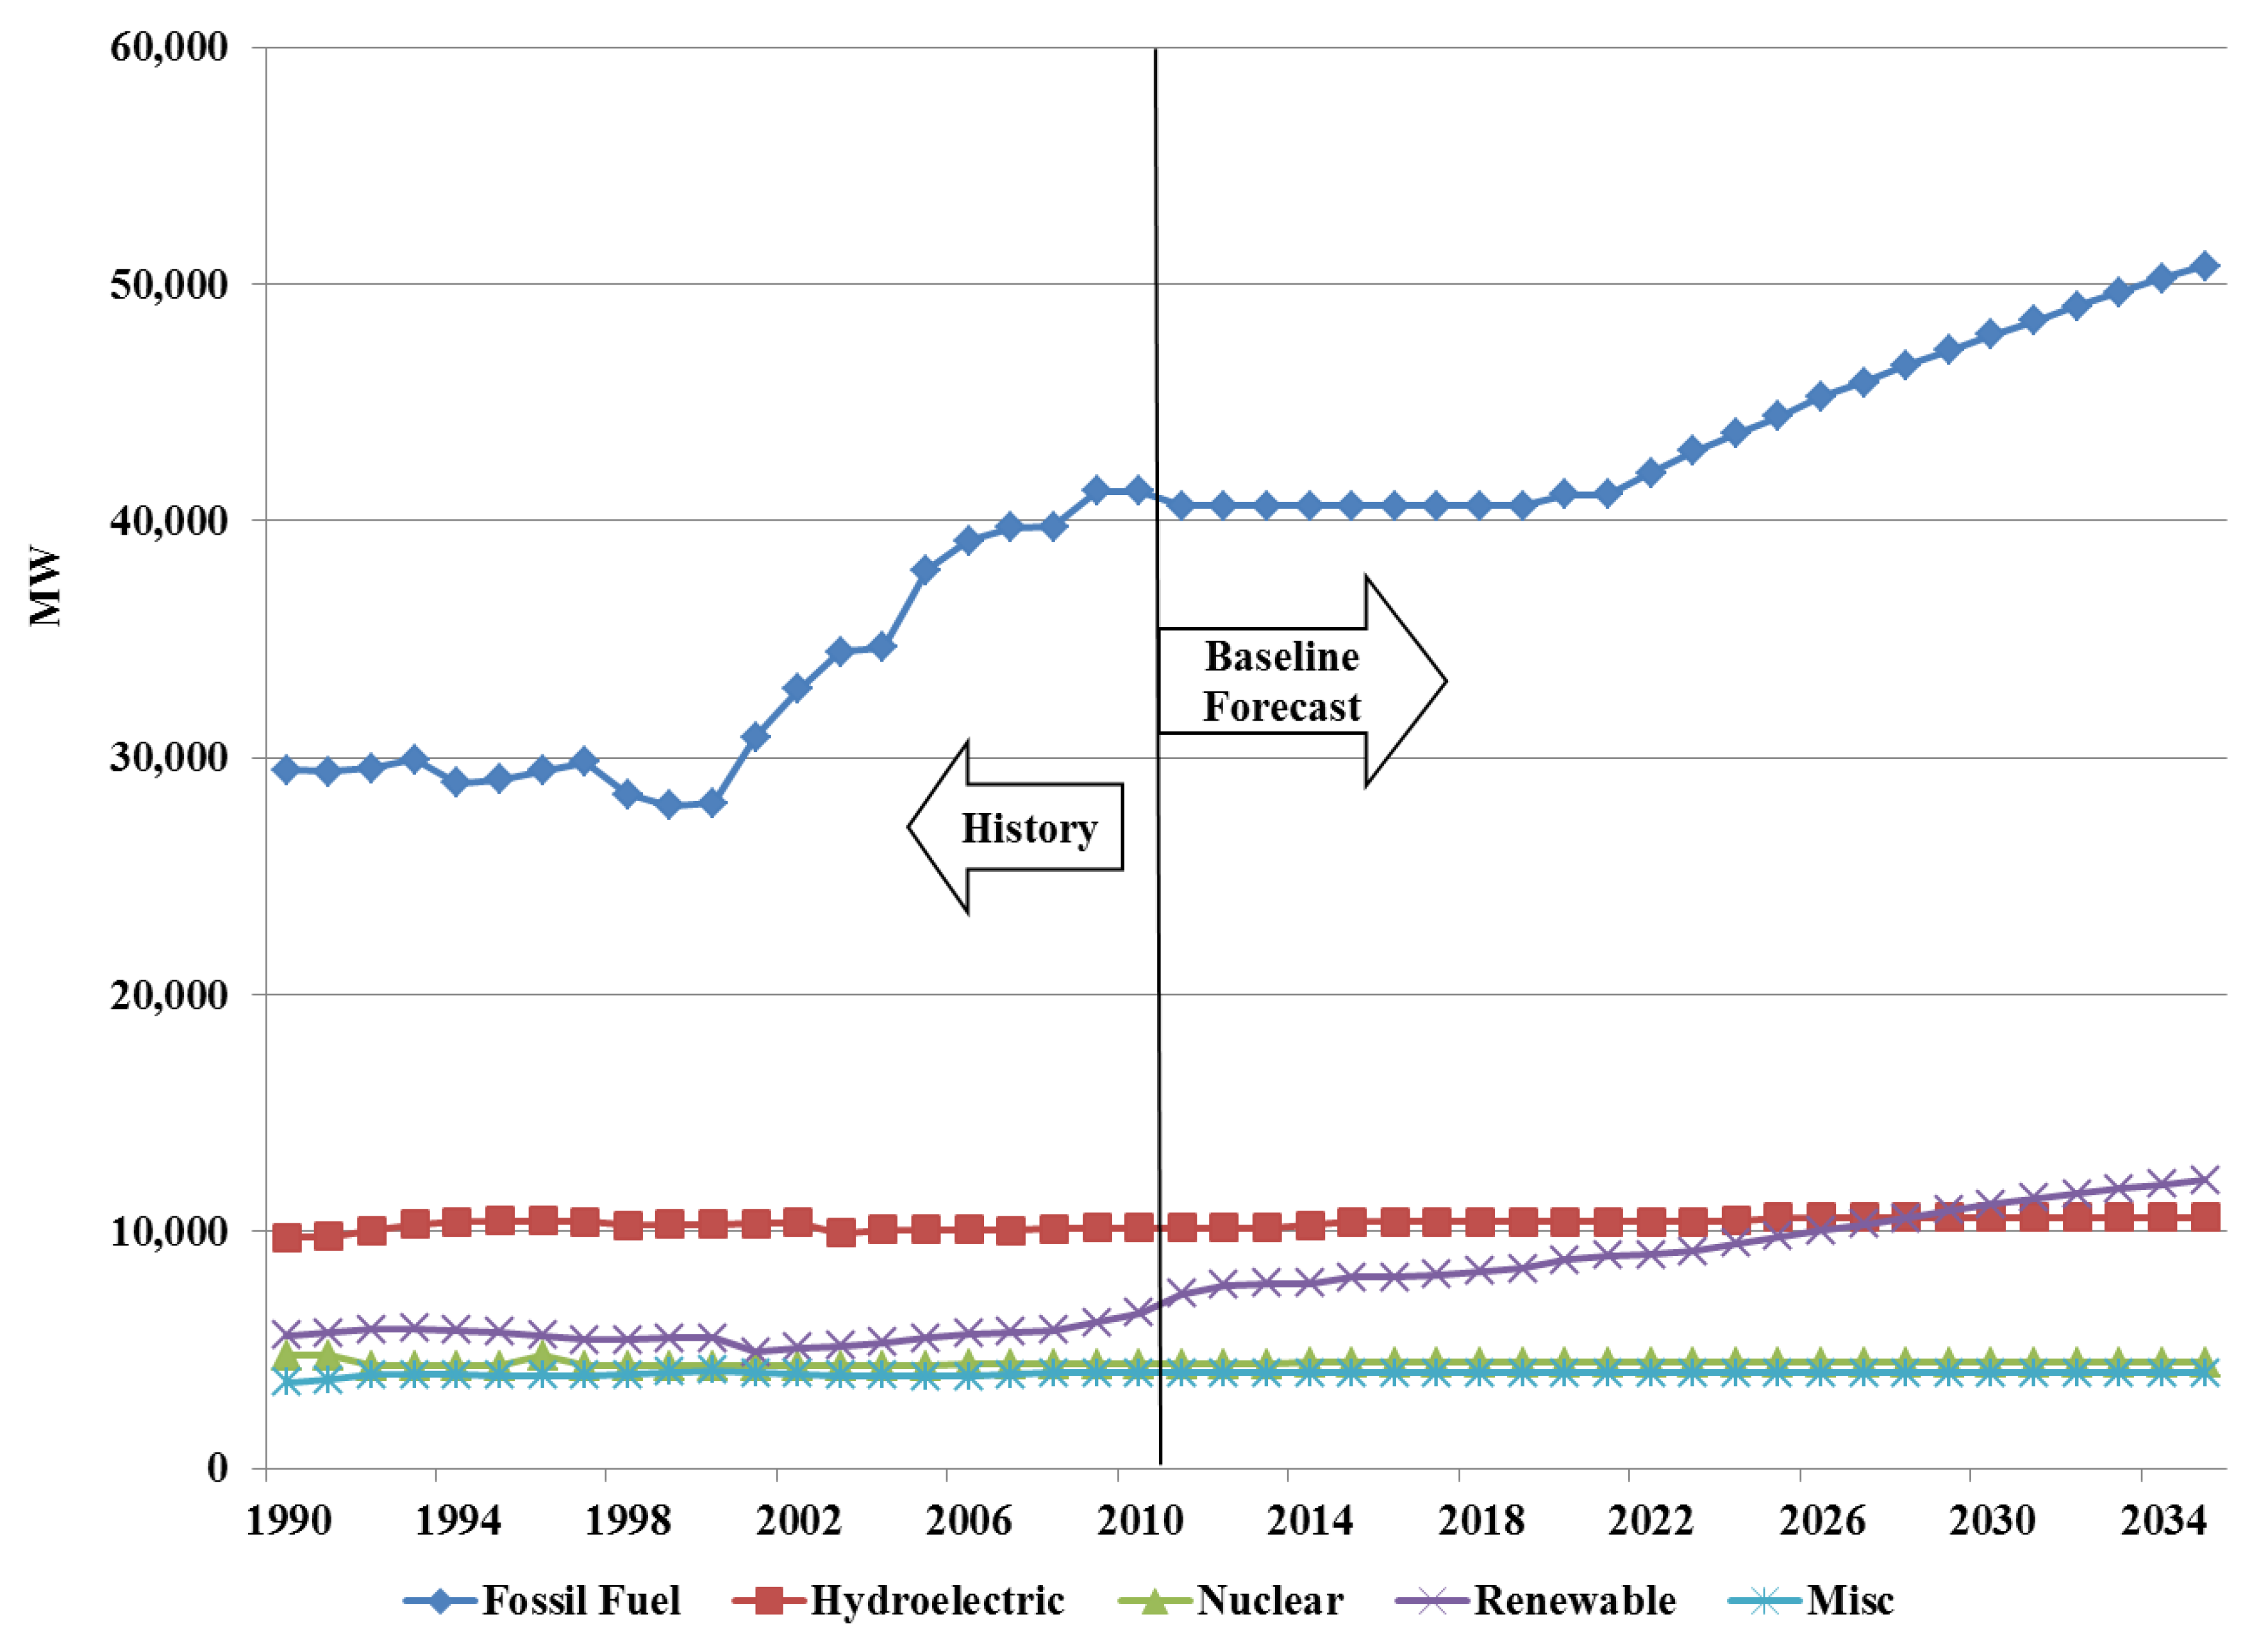
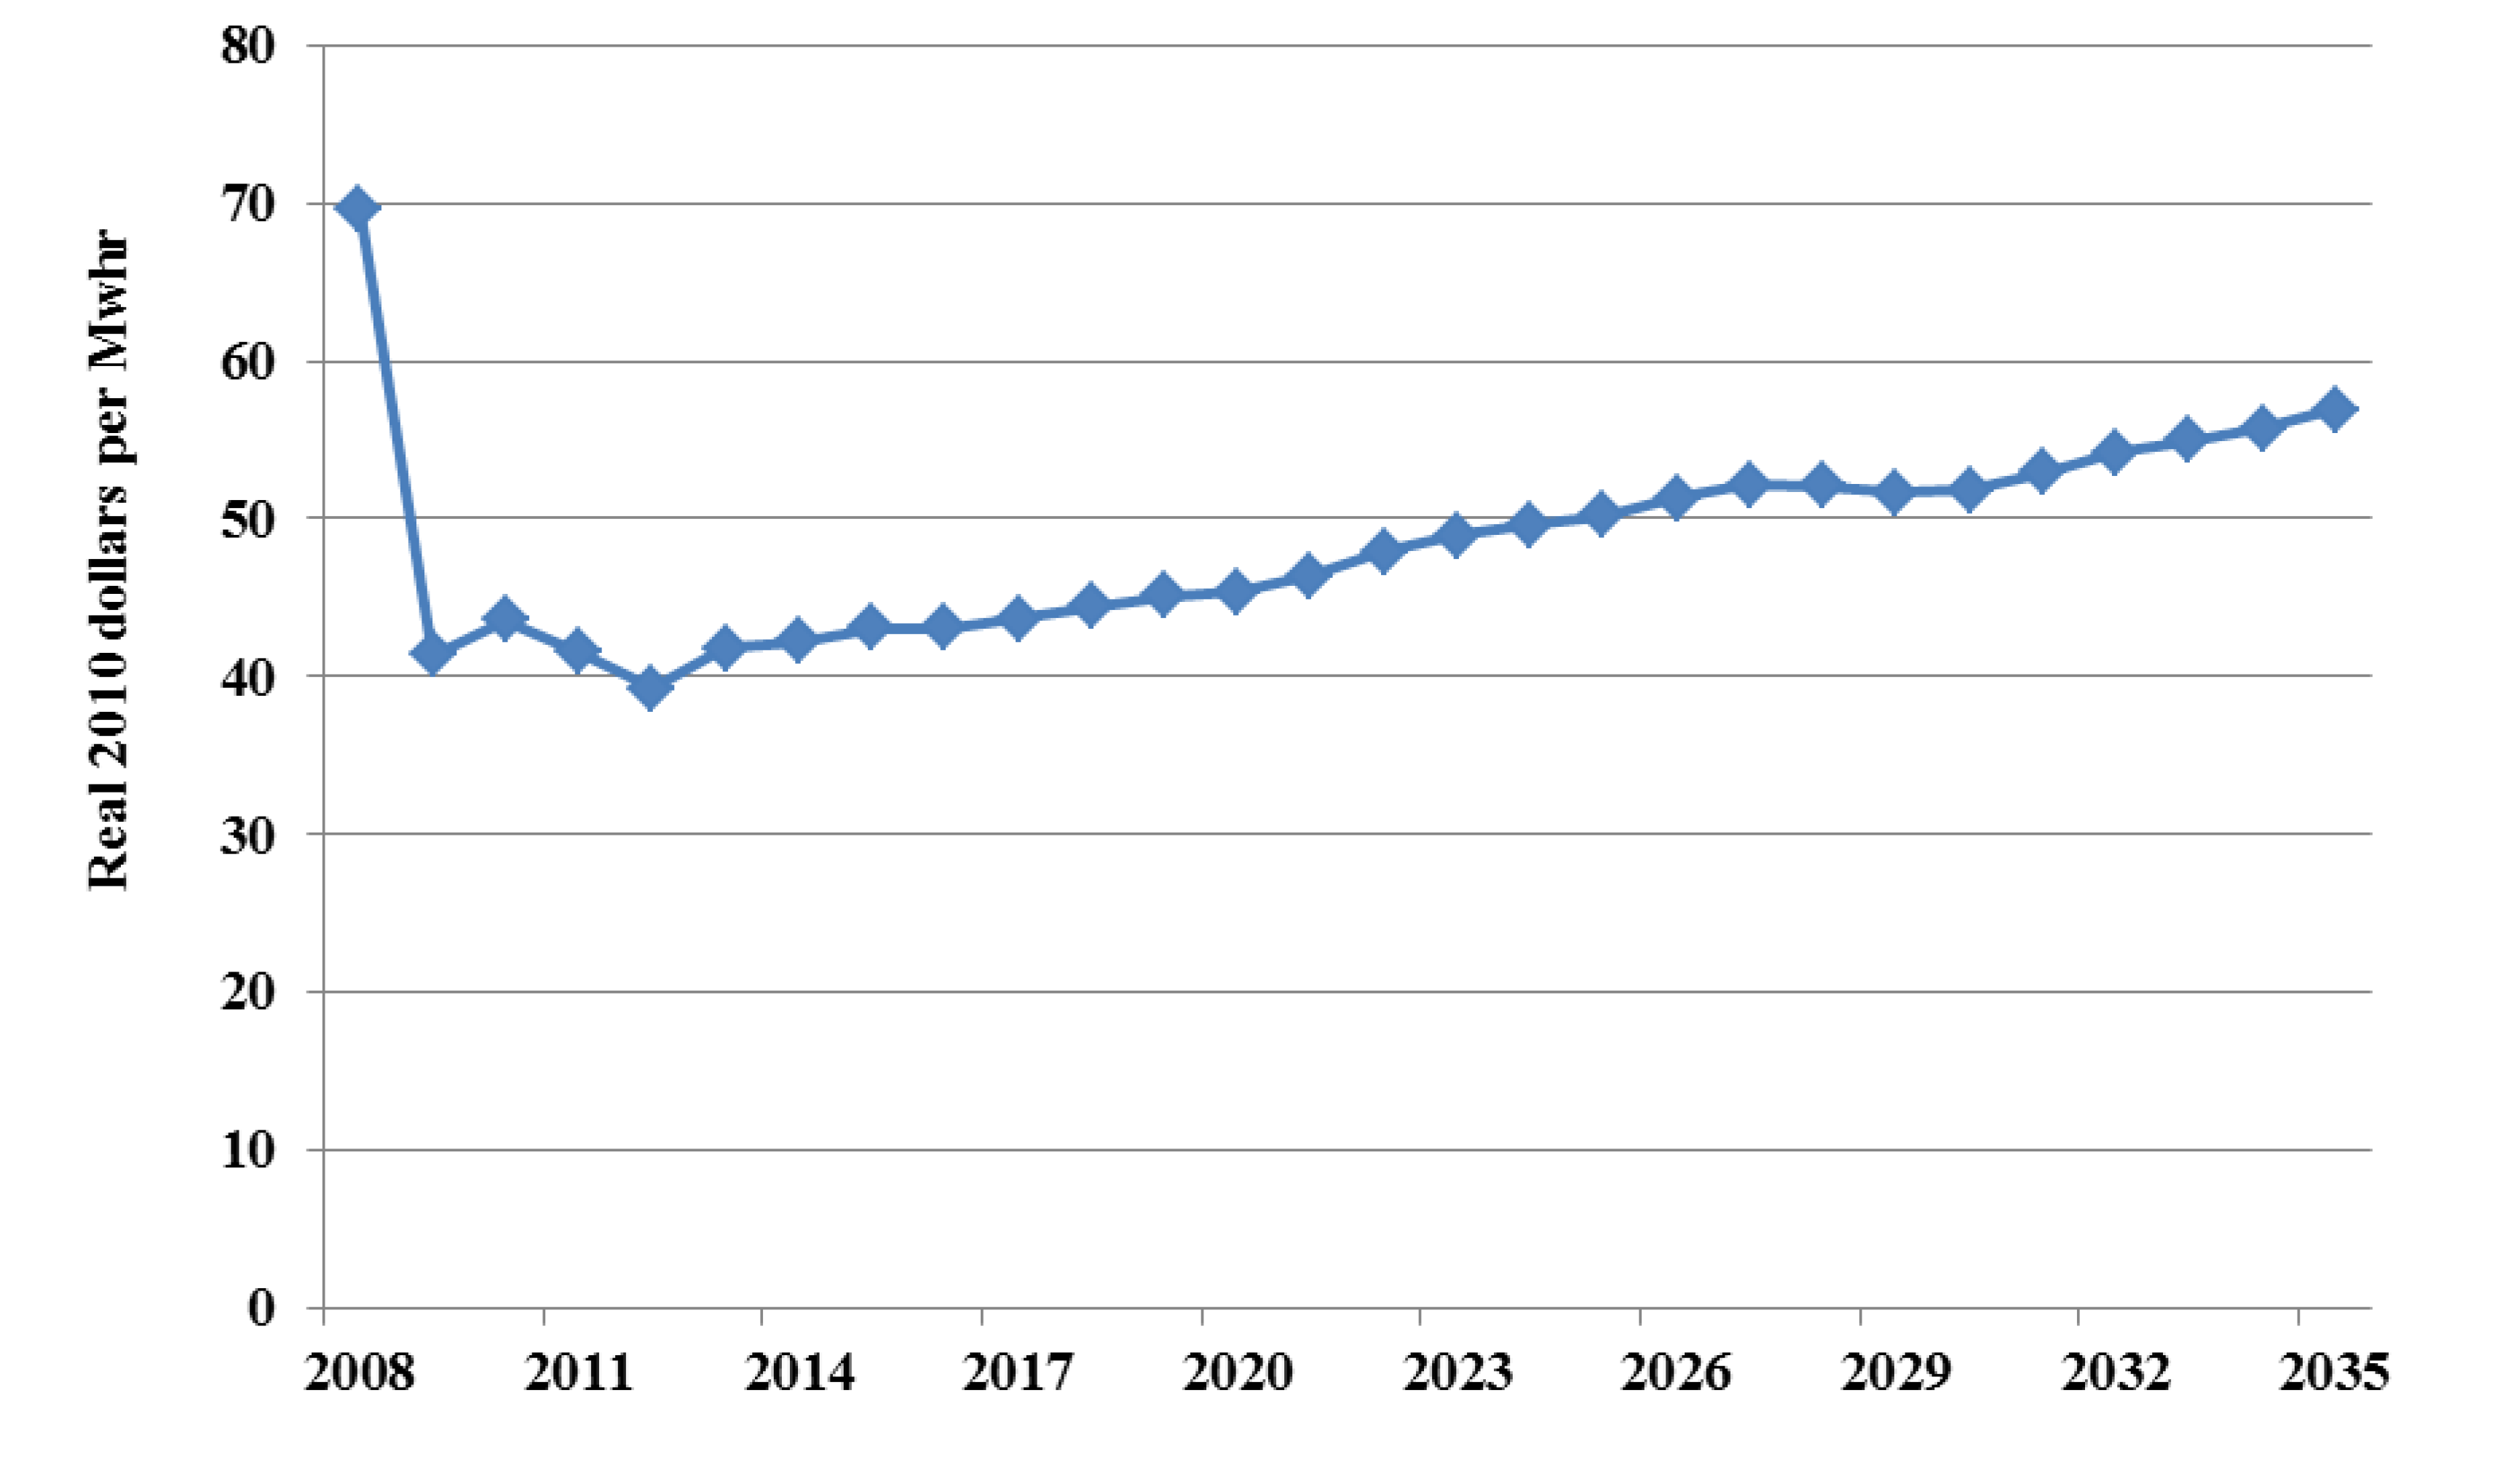
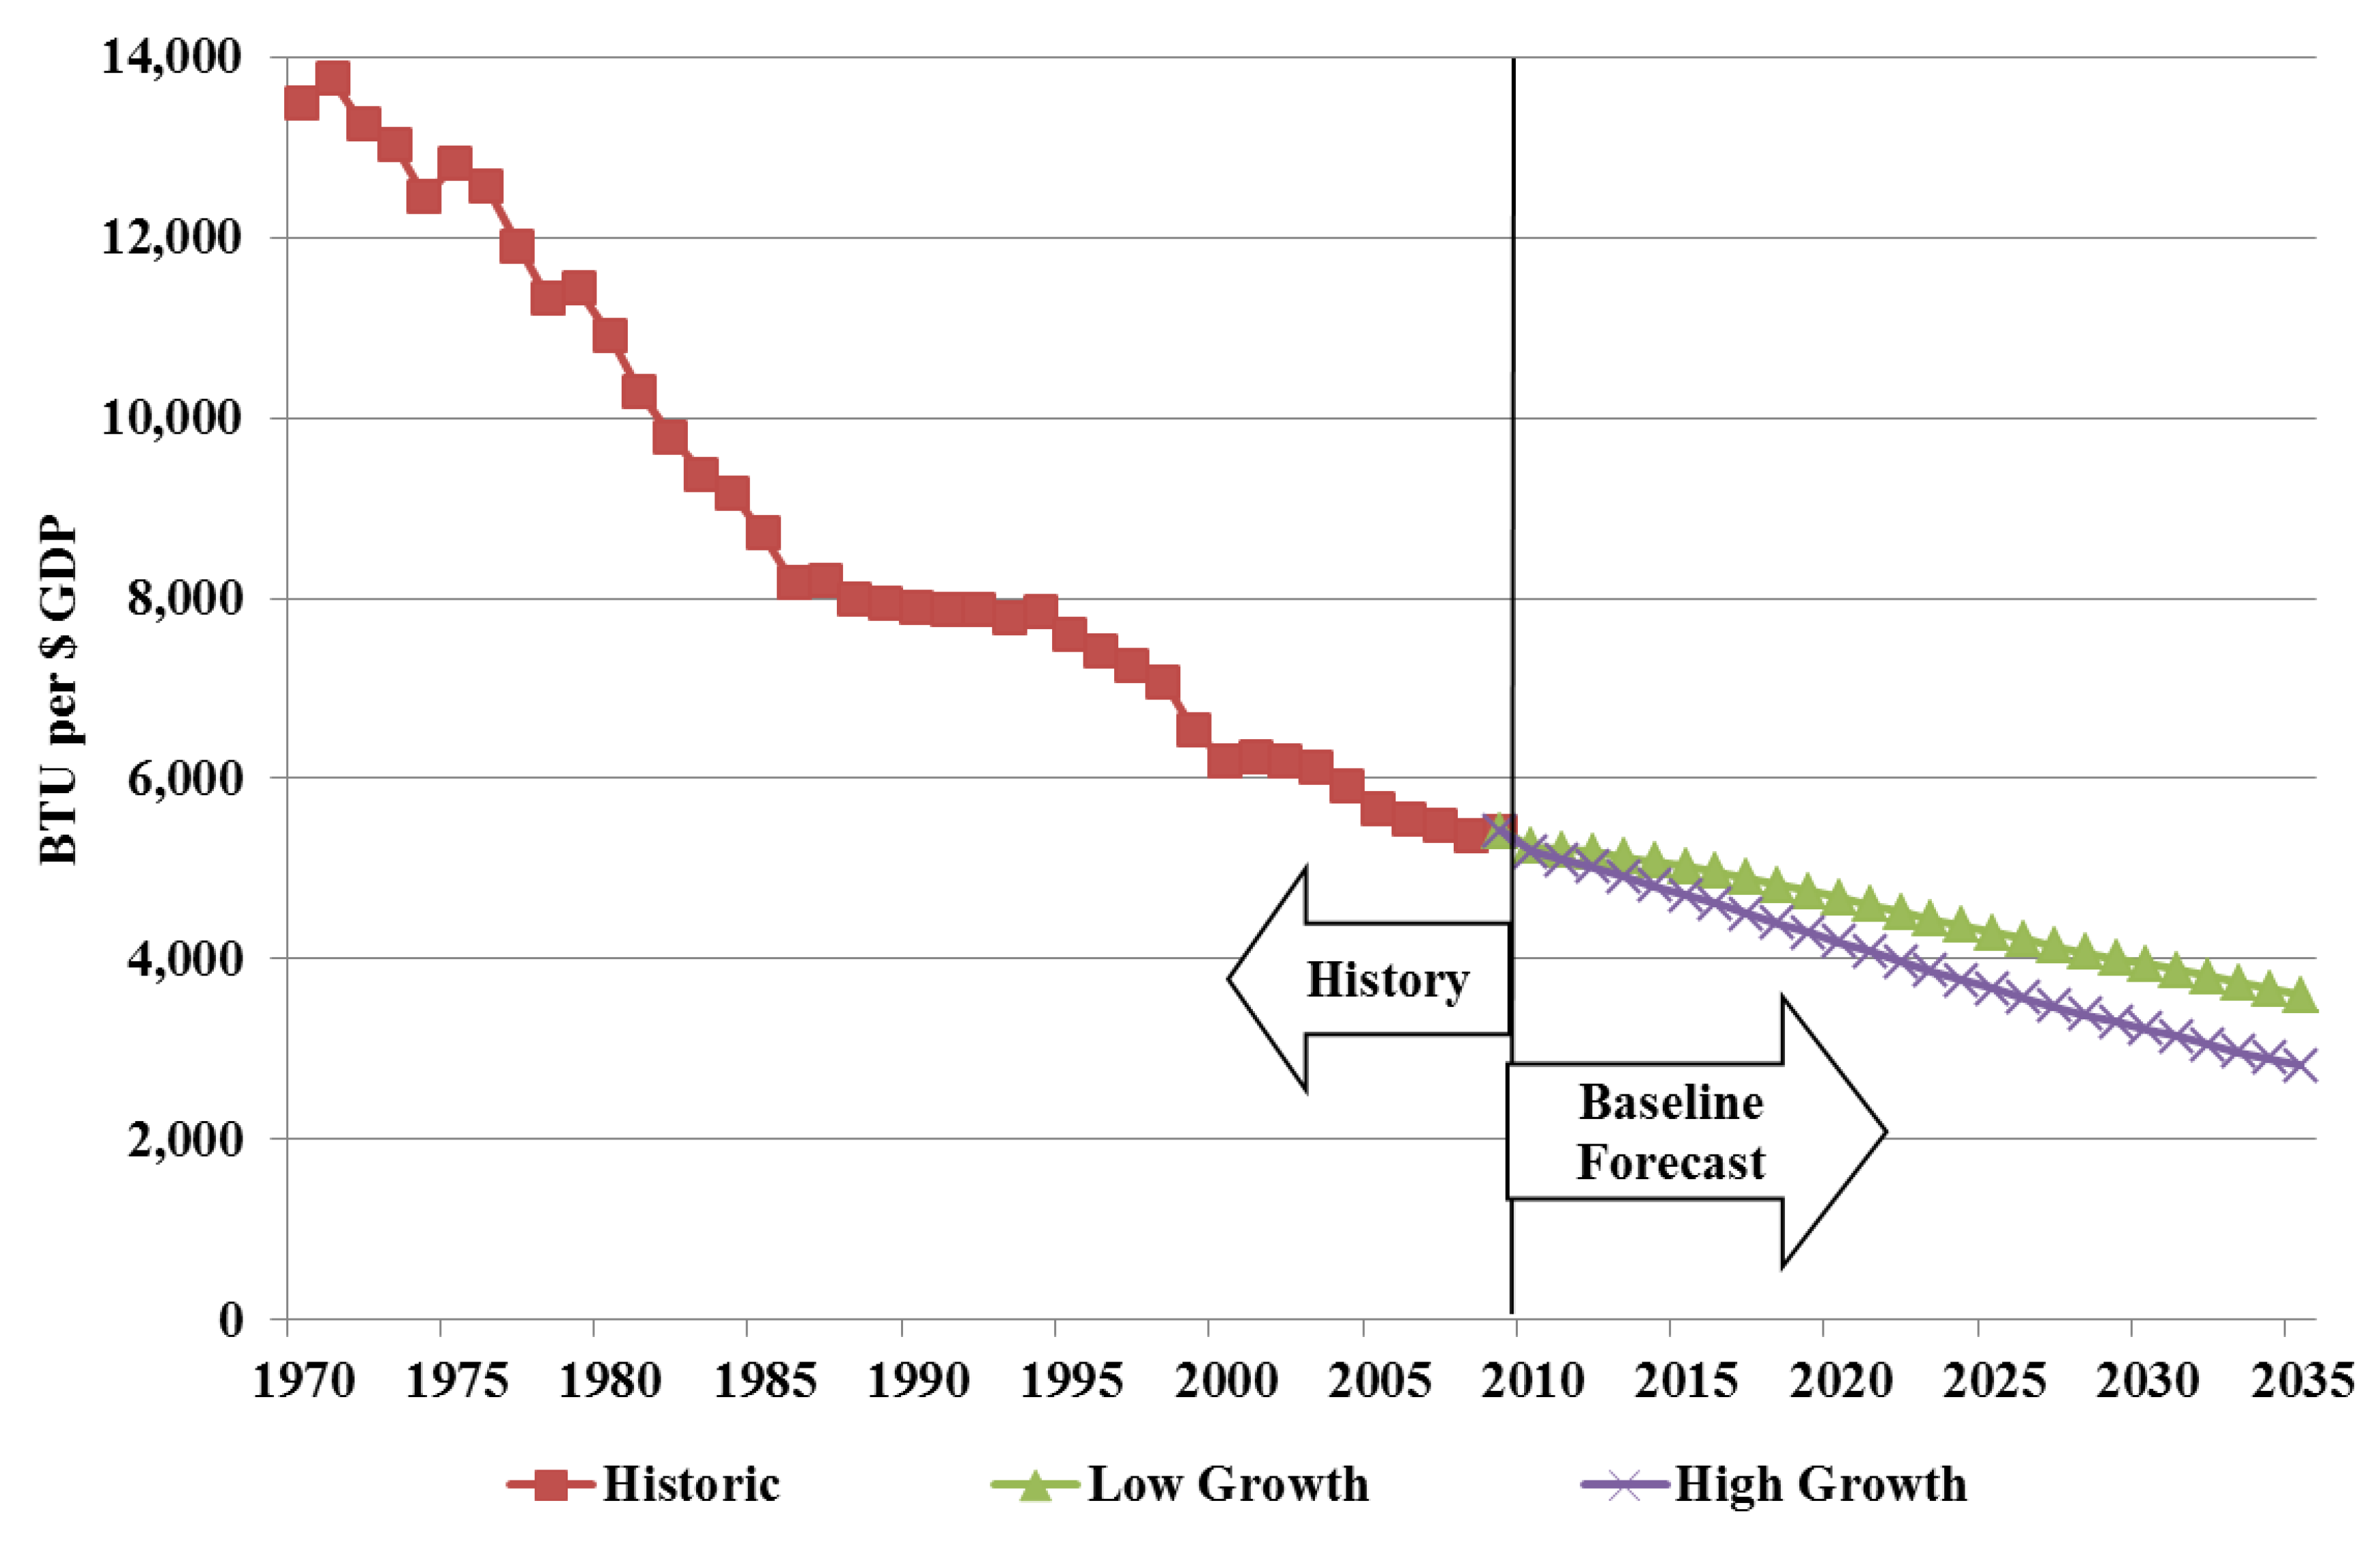
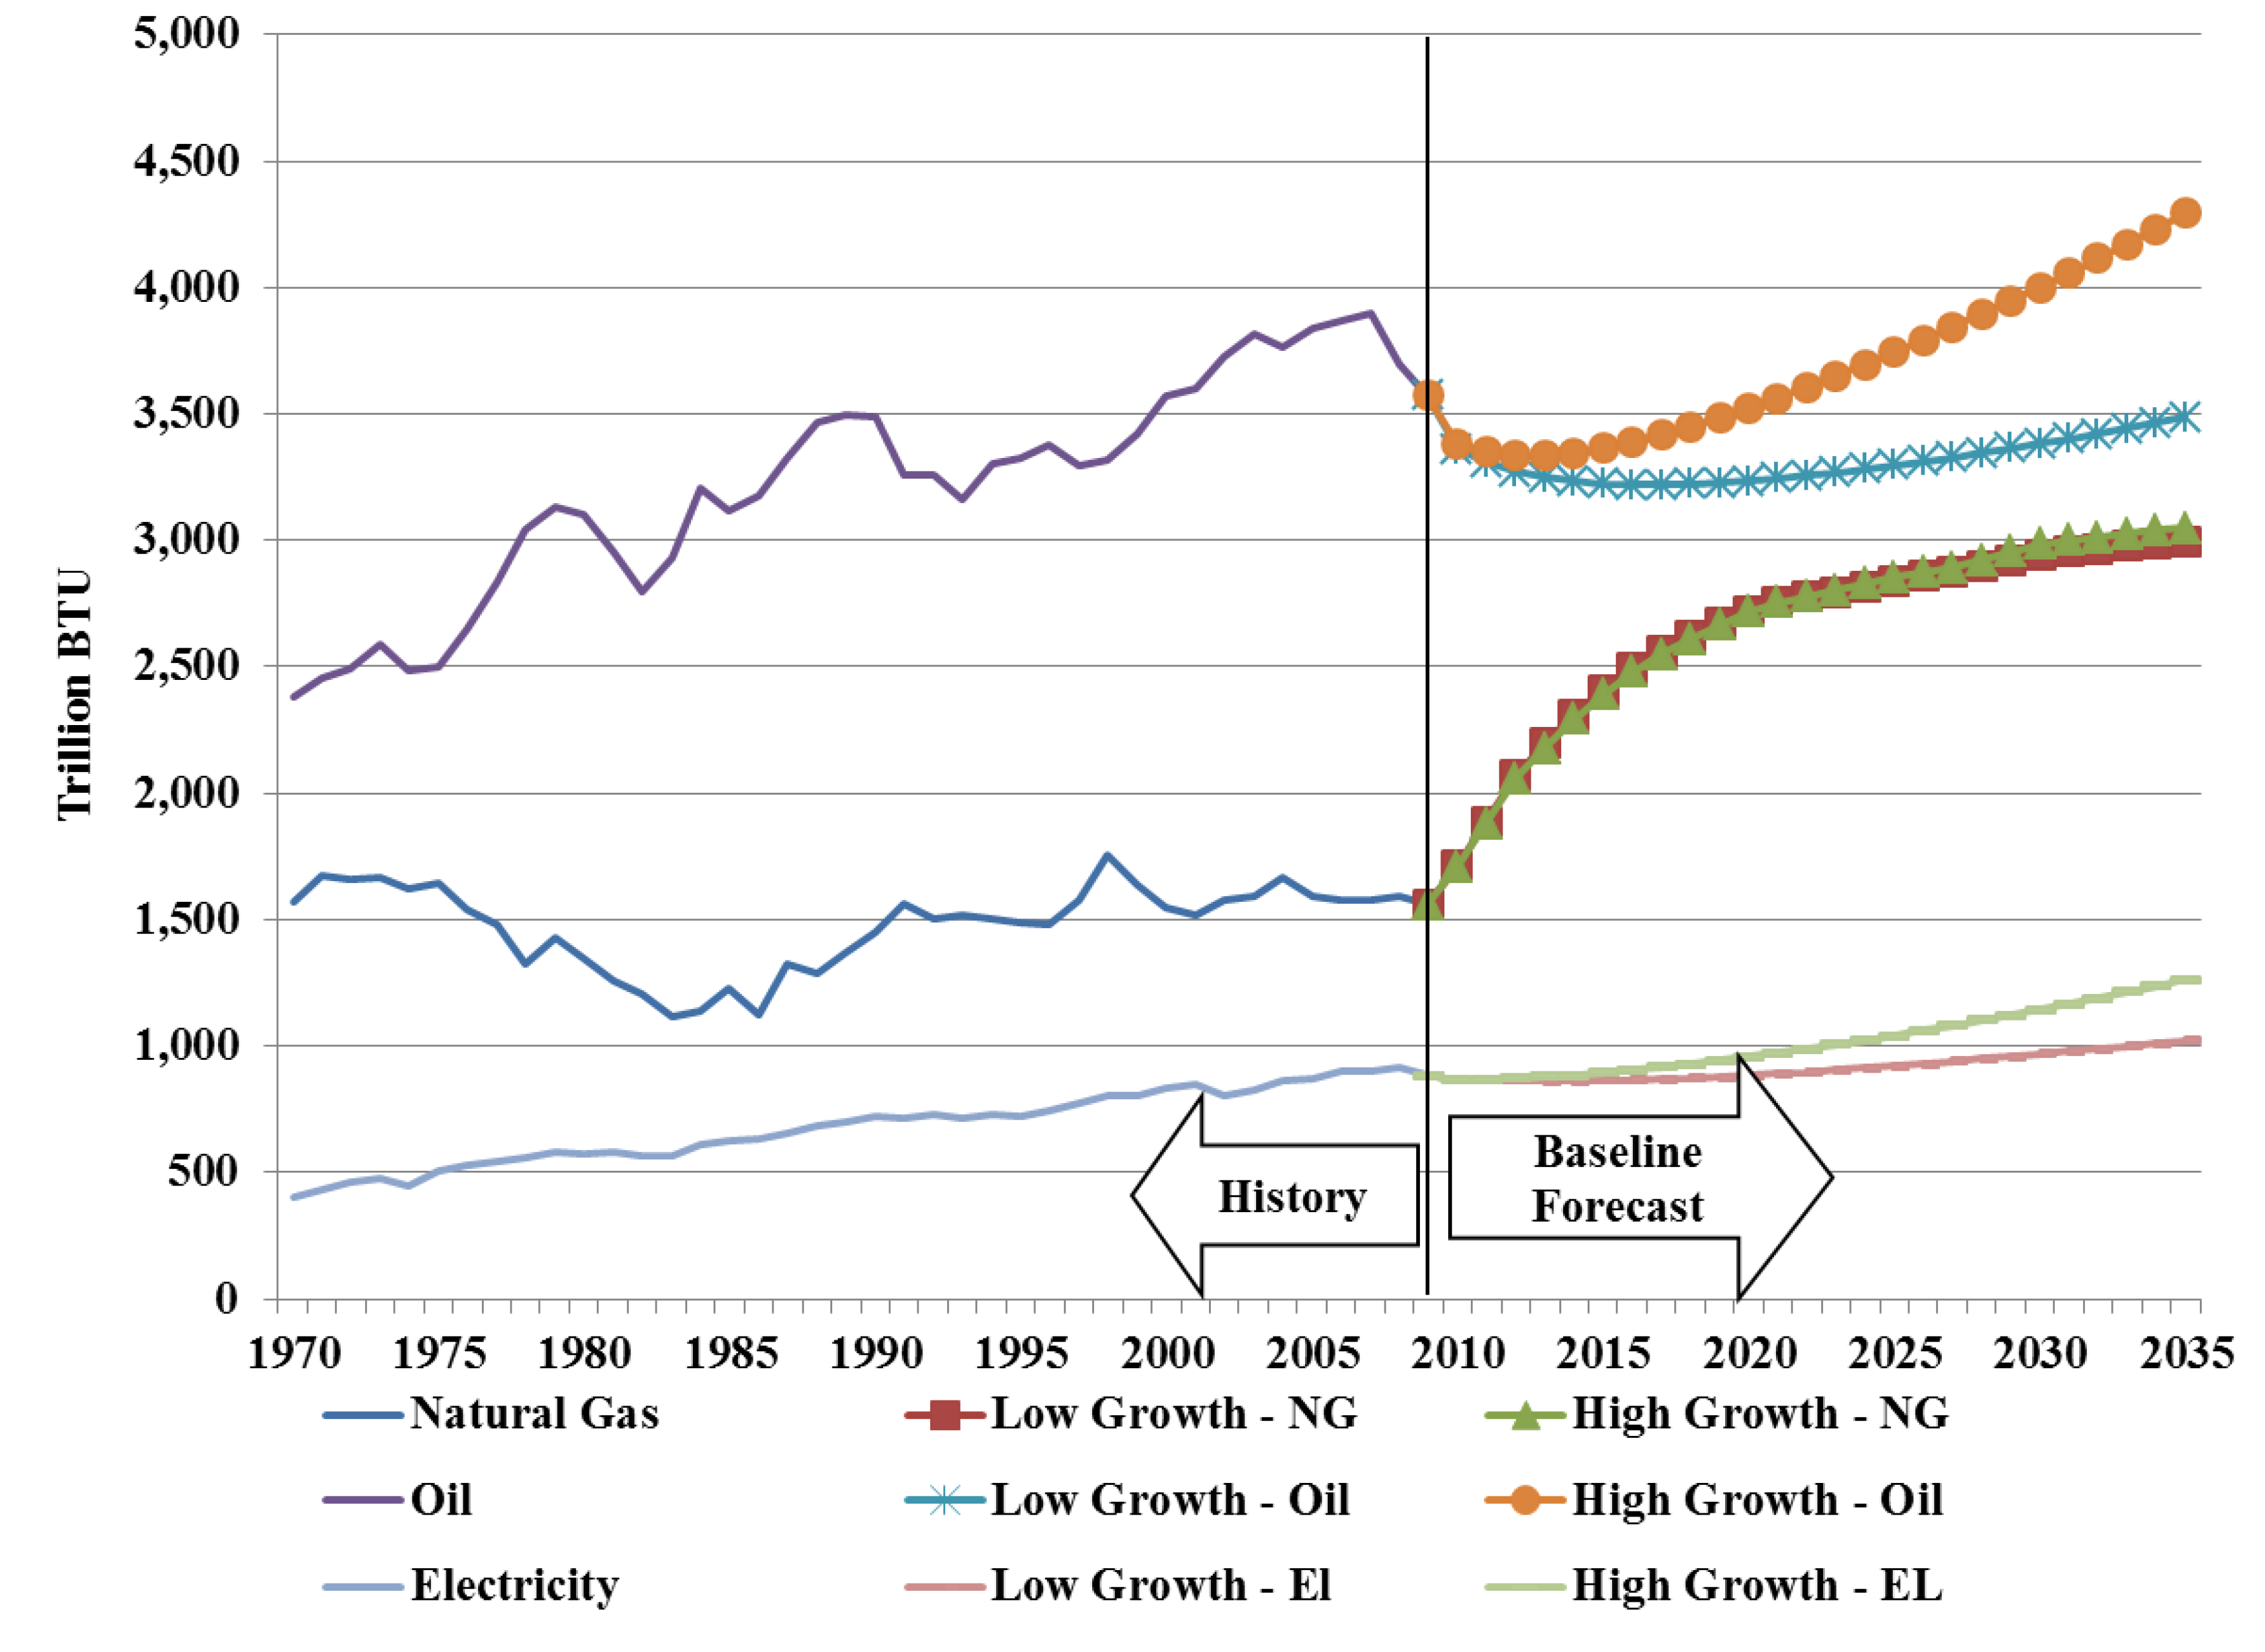
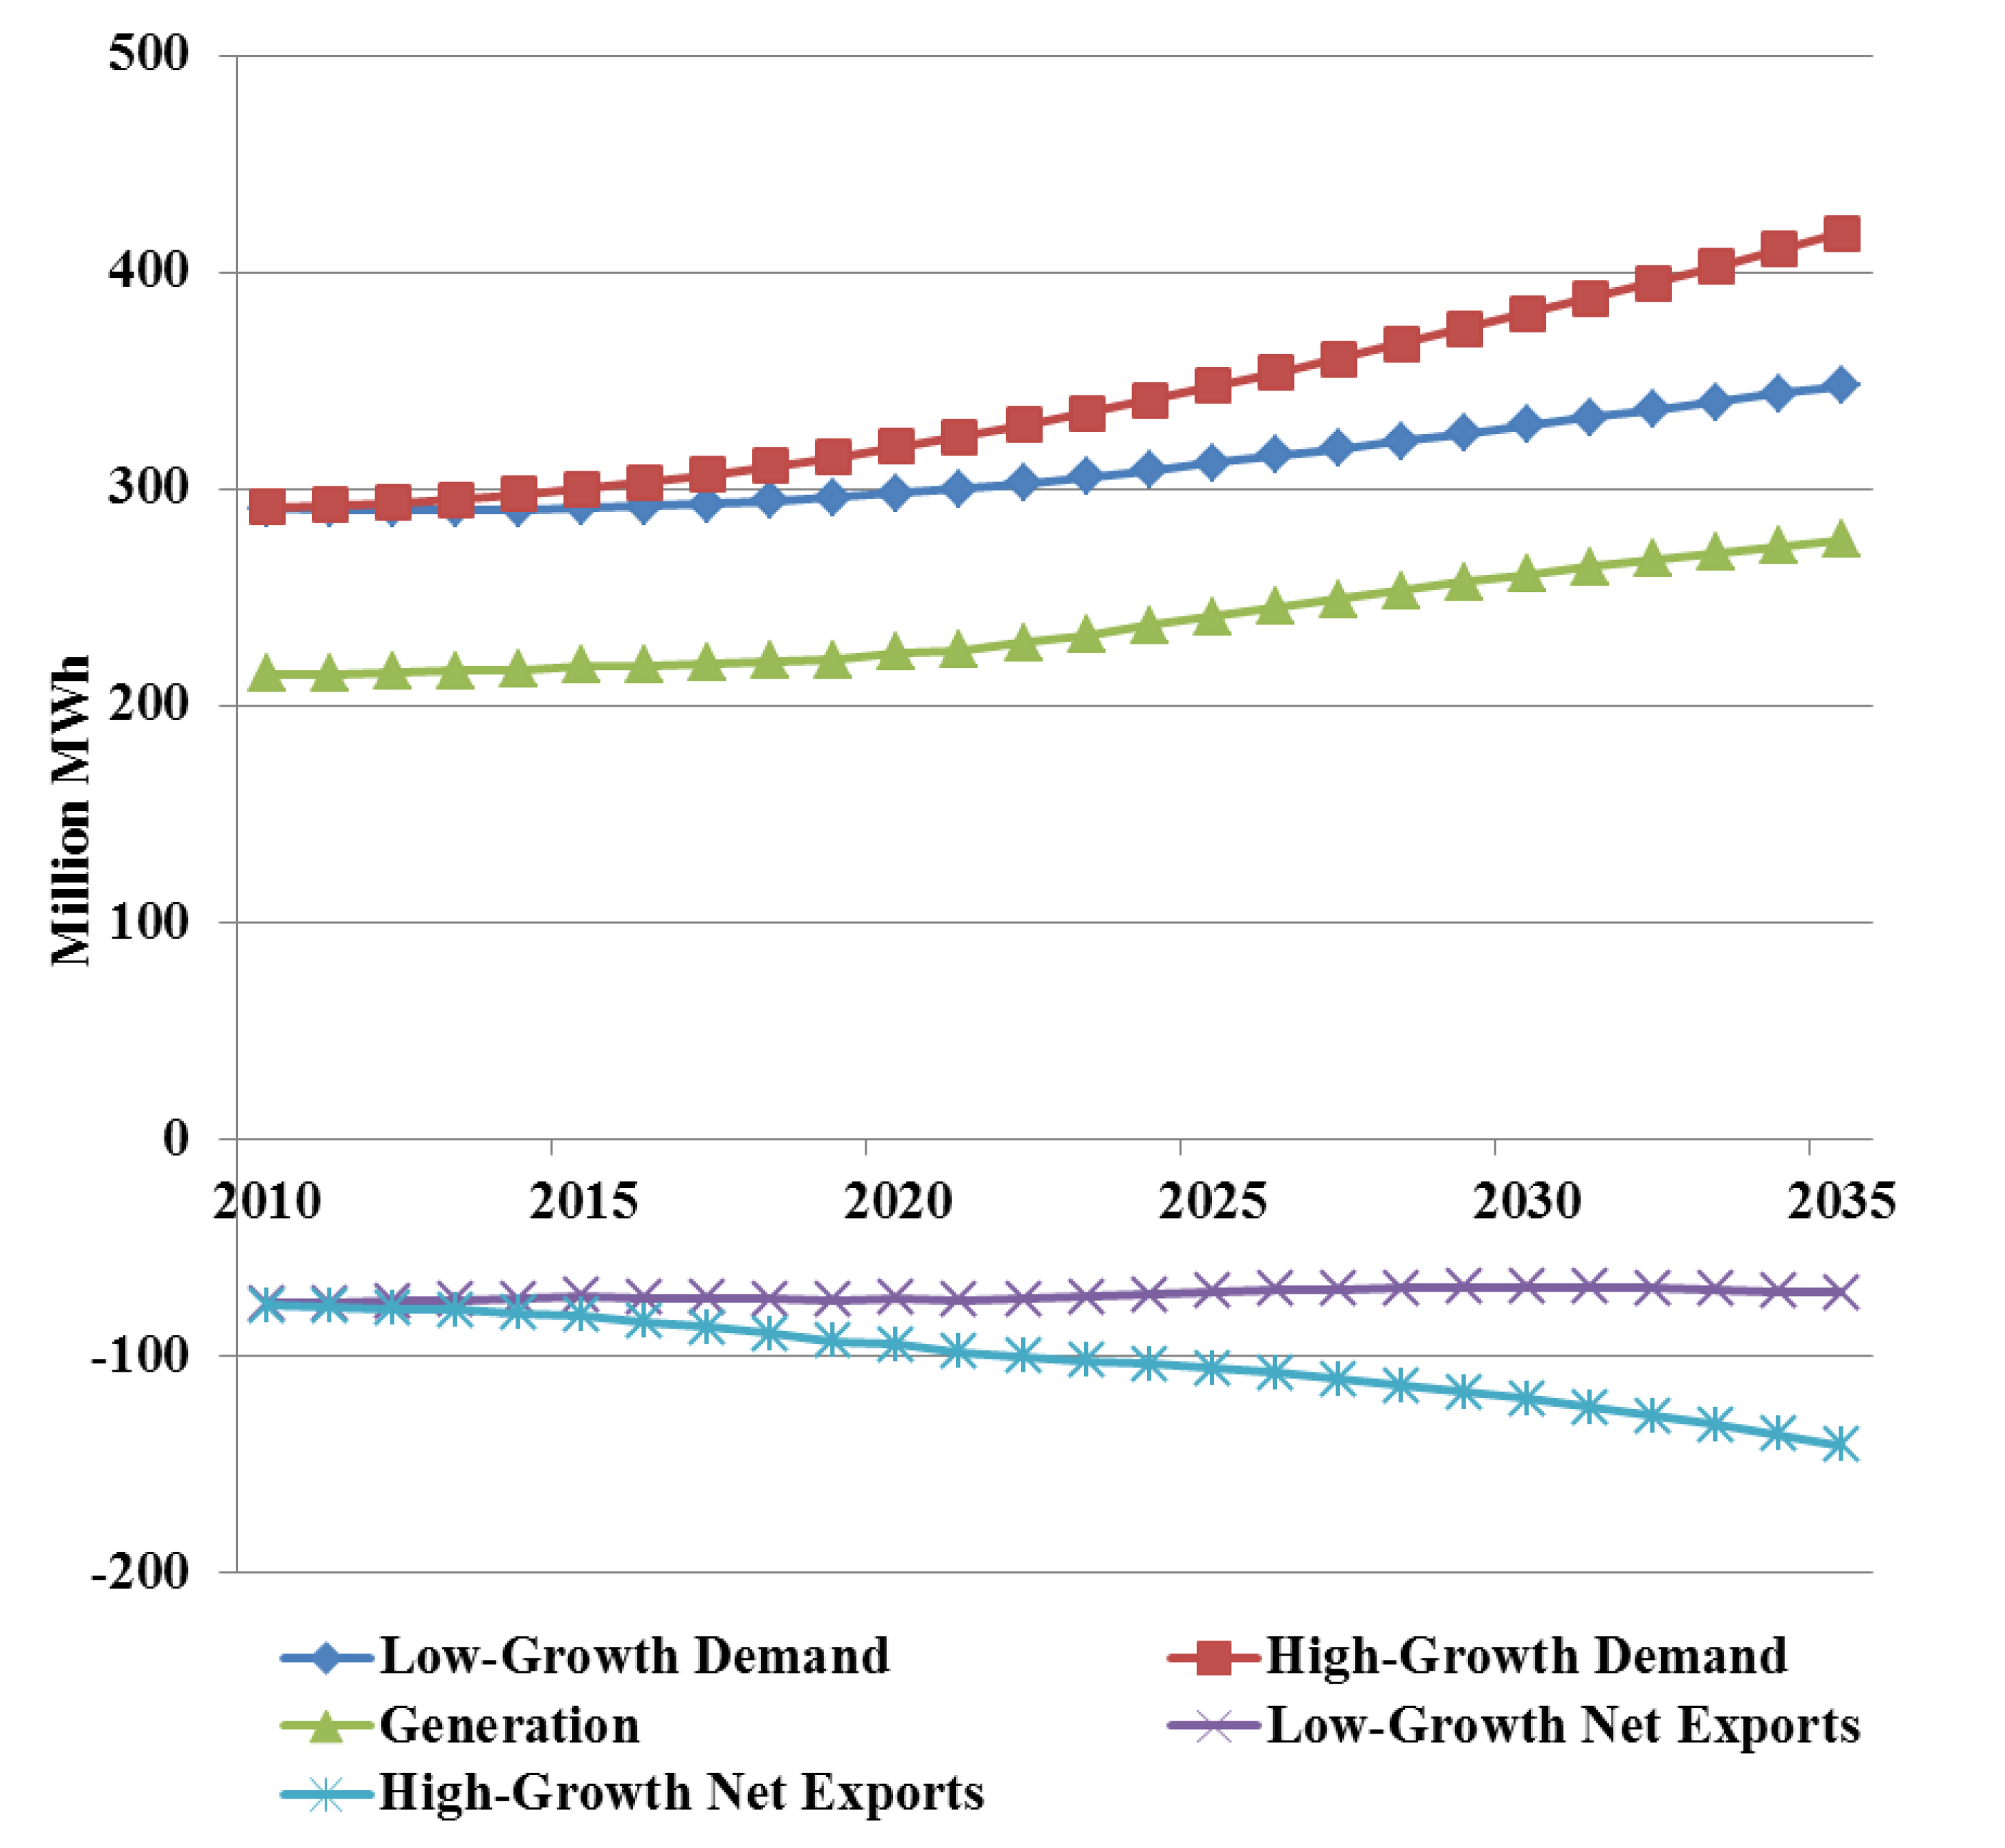
4.1. The Baseline Forecast


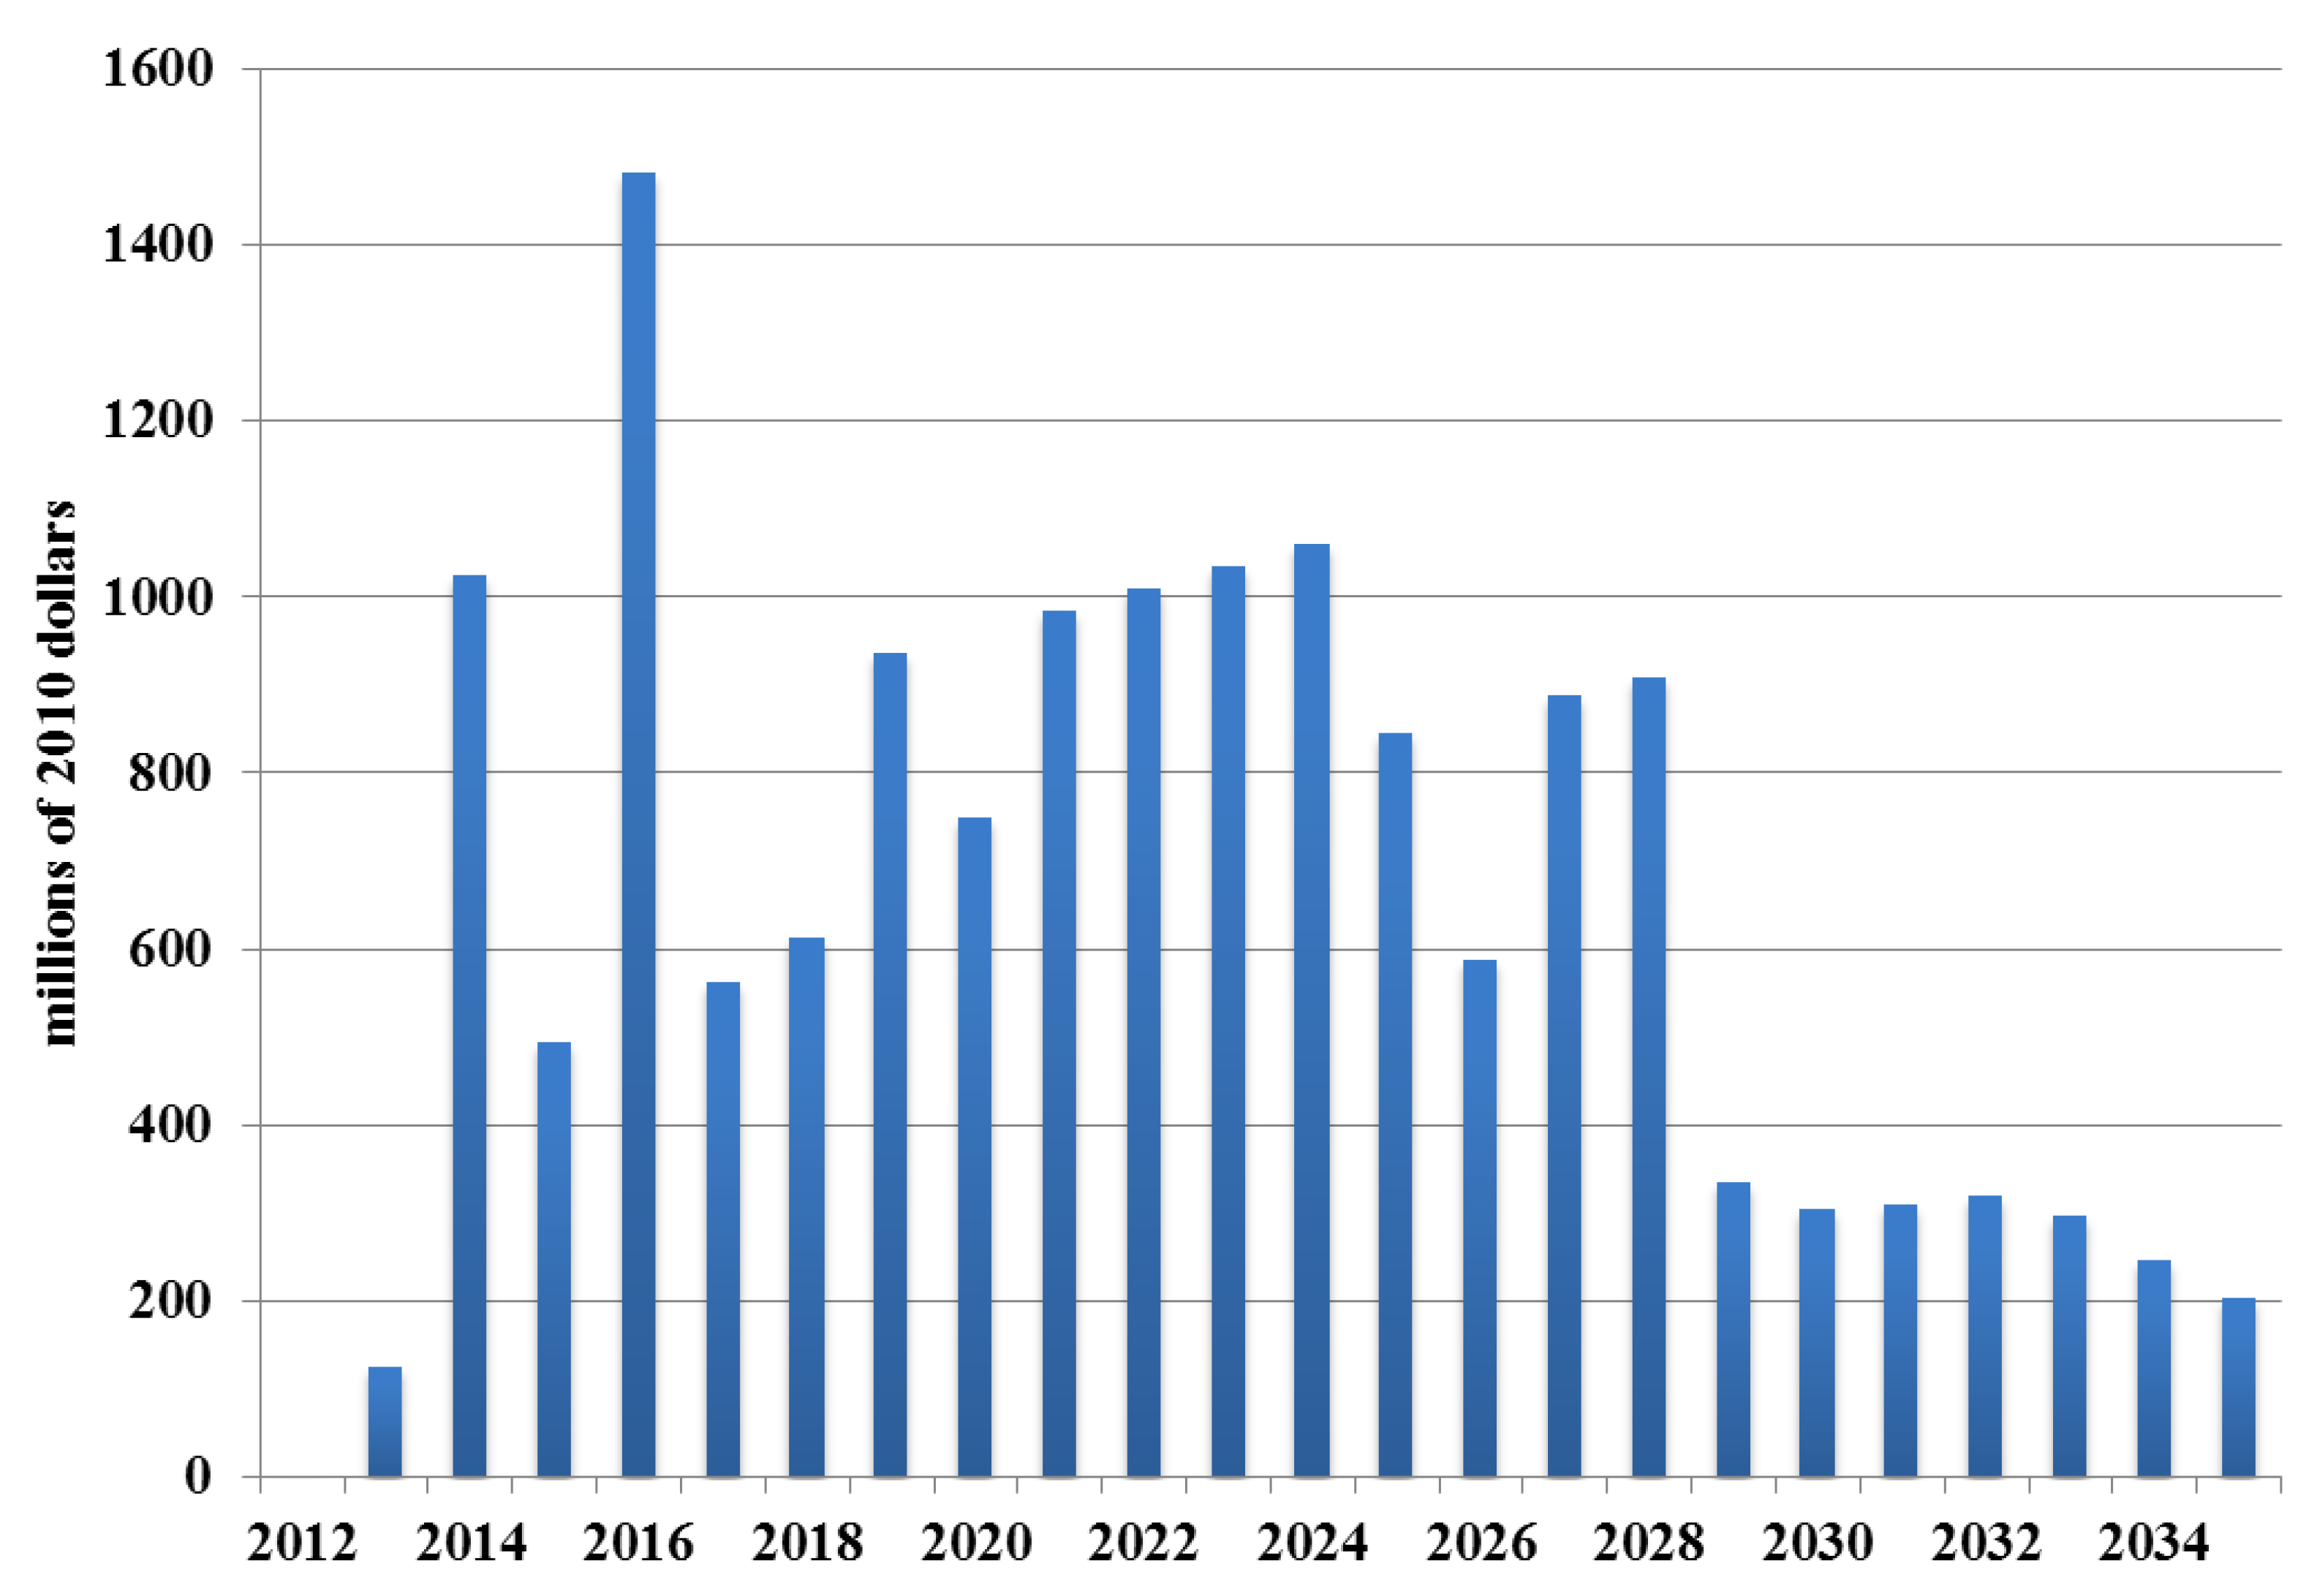
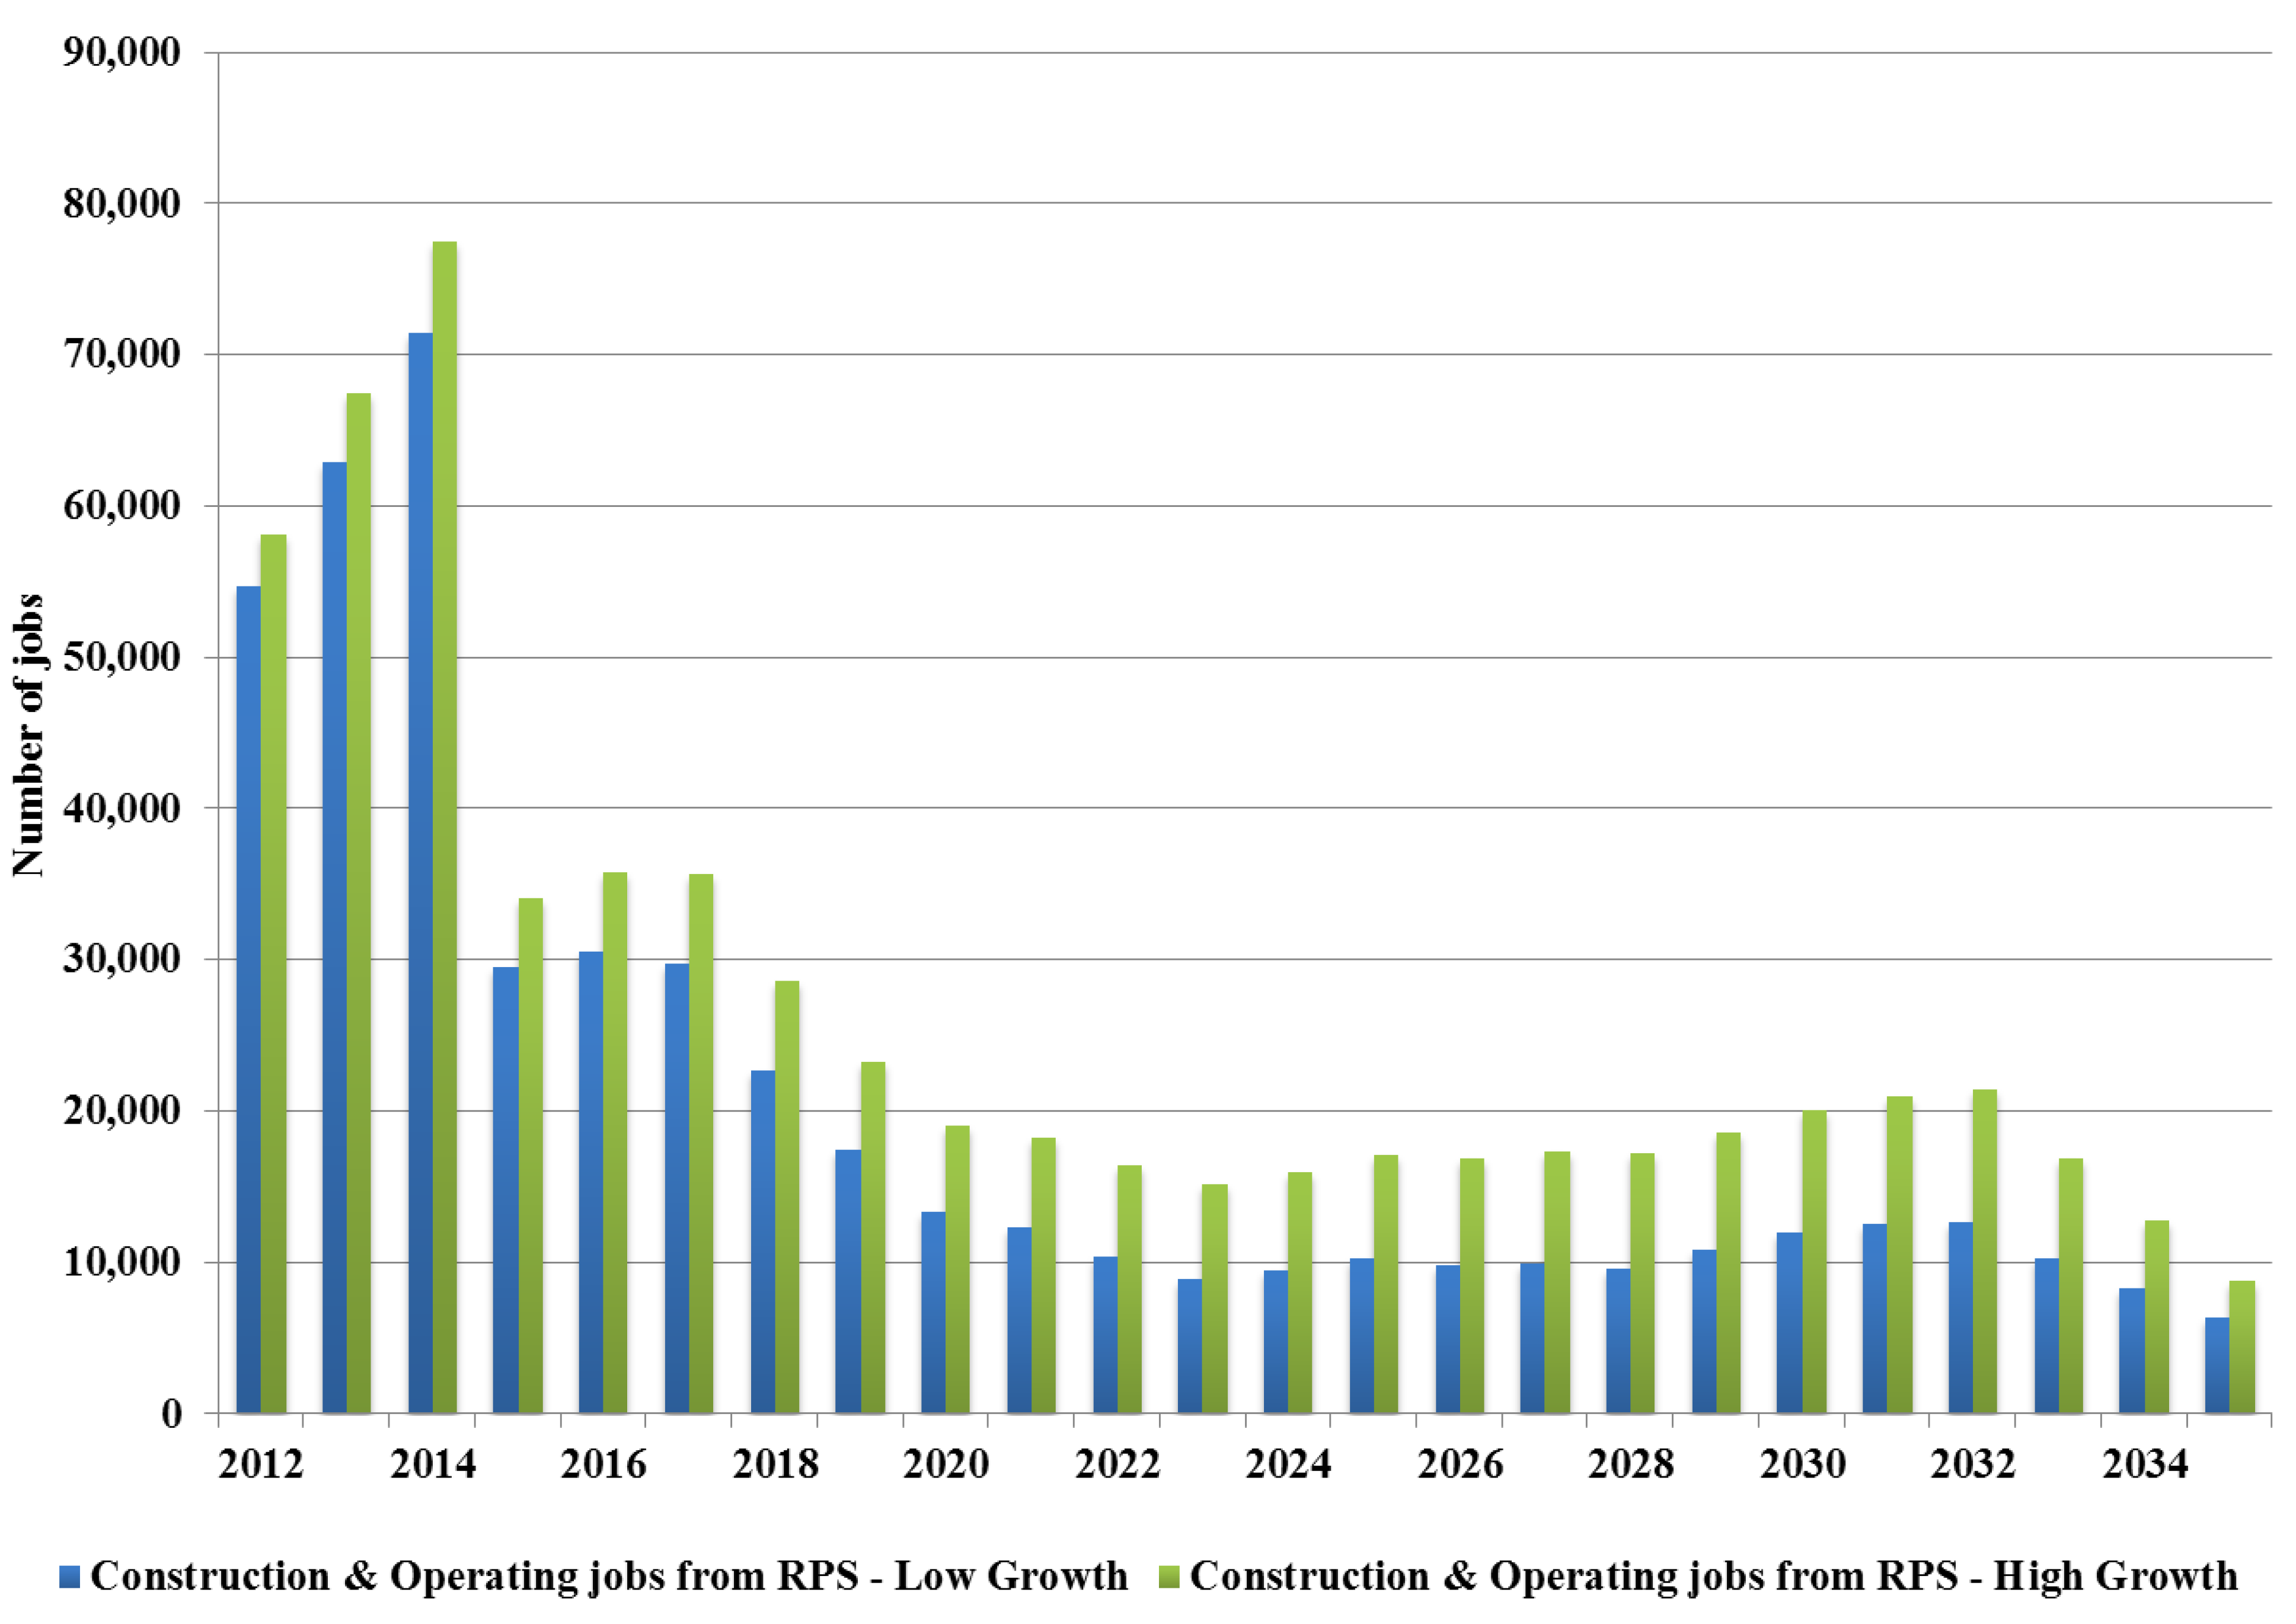
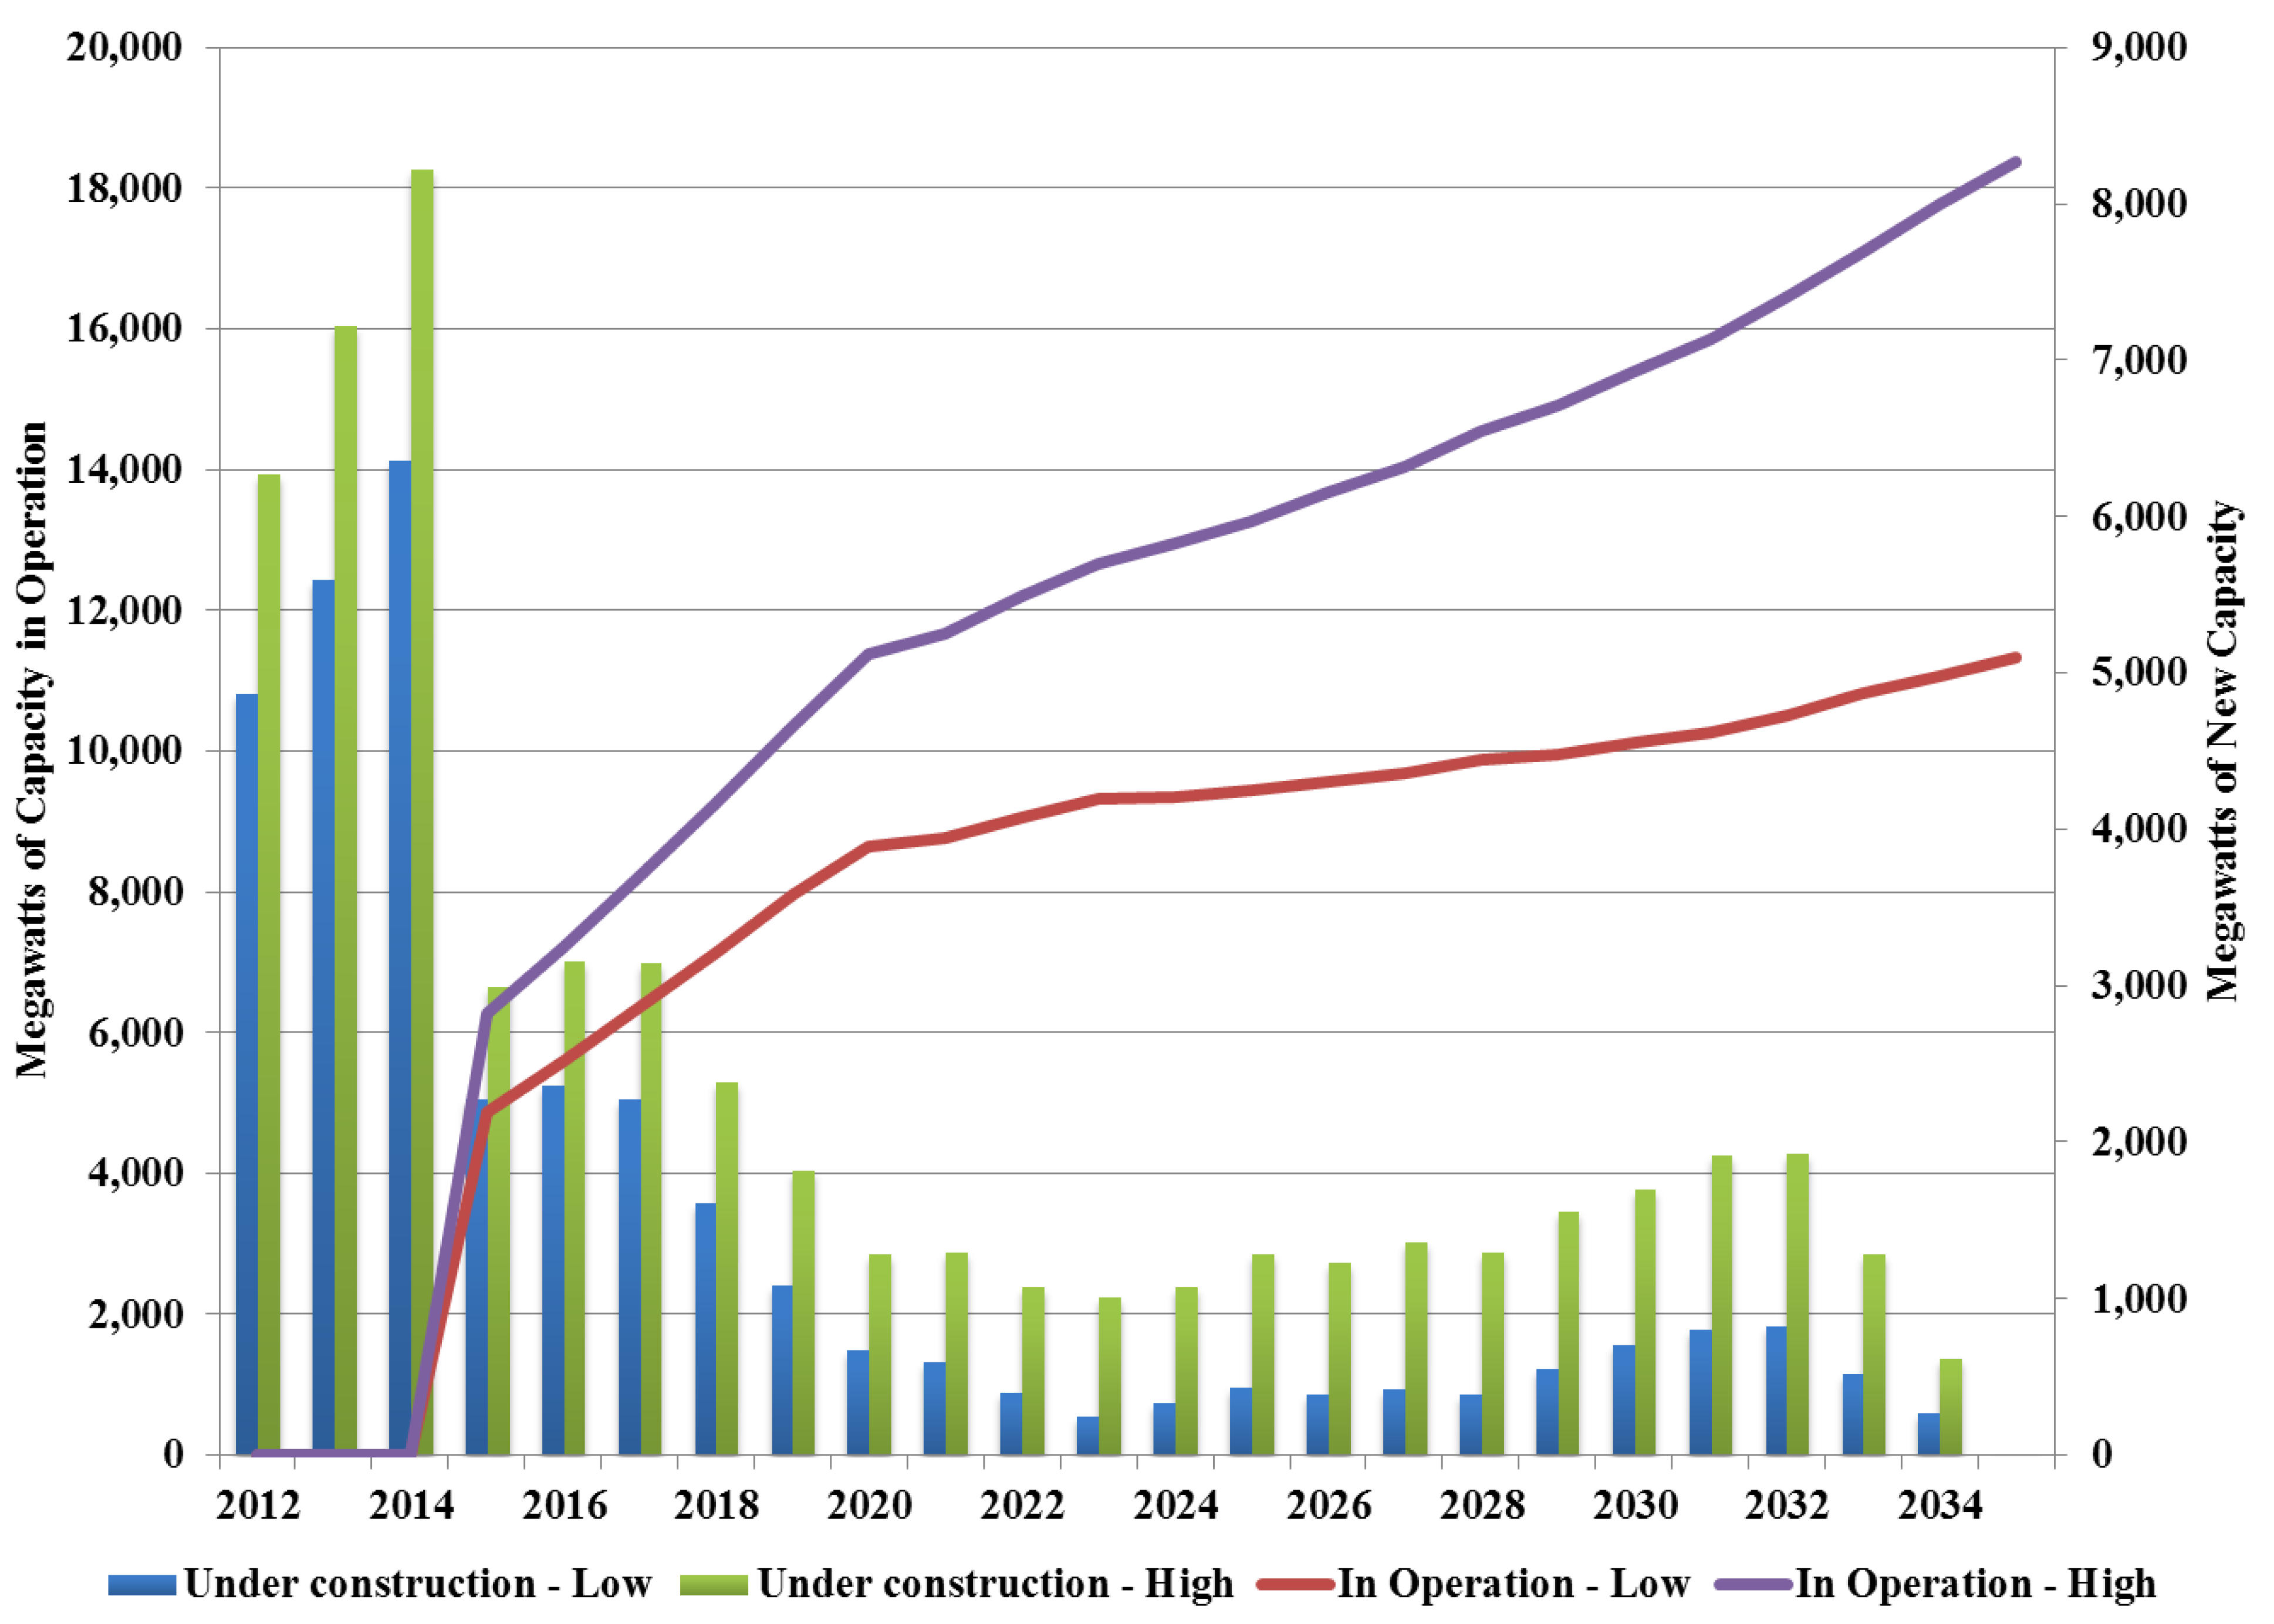
4.2. Impacts of Renewable Portfolio Standard
| Year | Low growth scenario | High growth scenario | ||||||||
|---|---|---|---|---|---|---|---|---|---|---|
| Solar Thermal | PV | Wind | Geothermal | Biomass | Solar Thermal | PV | Wind | Geothermal | Biomass | |
| 2012 | 0 | 0 | 0 | 0 | 0 | 0 | 0 | 0 | 0 | 0 |
| 2013 | 0 | 0 | 0 | 0 | 0 | 0 | 0 | 0 | 0 | 0 |
| 2014 | 0 | 0 | 0 | 0 | 0 | 0 | 0 | 0 | 0 | 0 |
| 2015 | 3795 | 1546 | 5253 | 787 | 330 | 4018 | 1637 | 5562 | 833 | 350 |
| 2016 | 567 | 231 | 785 | 118 | 49 | 649 | 264 | 898 | 135 | 56 |
| 2017 | 594 | 242 | 822 | 123 | 52 | 693 | 282 | 960 | 144 | 60 |
| 2018 | 613 | 250 | 848 | 127 | 53 | 726 | 296 | 1005 | 151 | 63 |
| 2019 | 633 | 258 | 876 | 131 | 55 | 761 | 310 | 1054 | 158 | 66 |
| 2020 | 531 | 216 | 735 | 110 | 46 | 677 | 276 | 937 | 140 | 59 |
| 2021 | 88 | 36 | 121 | 18 | 8 | 204 | 83 | 283 | 42 | 18 |
| 2022 | 226 | 92 | 313 | 47 | 20 | 347 | 141 | 480 | 72 | 30 |
| 2023 | 208 | 85 | 288 | 43 | 18 | 339 | 138 | 470 | 70 | 30 |
| 2024 | 29 | 12 | 41 | 6 | 3 | 164 | 67 | 227 | 34 | 14 |
| 2025 | 72 | 29 | 100 | 15 | 6 | 214 | 87 | 296 | 44 | 19 |
| 2026 | 92 | 38 | 128 | 19 | 8 | 240 | 98 | 332 | 50 | 21 |
| 2027 | 95 | 39 | 131 | 20 | 8 | 252 | 103 | 348 | 52 | 22 |
| 2028 | 150 | 61 | 207 | 31 | 13 | 322 | 131 | 446 | 67 | 28 |
| 2029 | 63 | 25 | 87 | 13 | 5 | 239 | 97 | 331 | 50 | 21 |
| 2030 | 119 | 48 | 165 | 25 | 10 | 302 | 123 | 418 | 63 | 26 |
| 2031 | 124 | 50 | 171 | 26 | 11 | 313 | 127 | 433 | 65 | 27 |
| 2032 | 187 | 76 | 258 | 39 | 16 | 386 | 157 | 535 | 80 | 34 |
| 2033 | 238 | 97 | 329 | 49 | 21 | 458 | 187 | 634 | 95 | 40 |
| 2034 | 201 | 82 | 278 | 42 | 17 | 423 | 172 | 586 | 88 | 37 |
| 2035 | 210 | 85 | 290 | 43 | 18 | 441 | 180 | 611 | 92 | 38 |

| Year | Low growth scenario | High growth scenario | ||||||
|---|---|---|---|---|---|---|---|---|
| Jobs | Carbon Dioxide Emissions | Value Added | State tax revenues | Jobs | Carbon Dioxide Emissions | Value Added | State tax revenues | |
| 2012 | 54,744 | 0.00 | 4,955 | 545 | 58,147 | 0.00 | 5,263 | 579 |
| 2013 | 62,927 | 0.00 | 5,696 | 627 | 67,539 | 0.00 | 6,113 | 672 |
| 2014 | 71,496 | 0.00 | 6,471 | 712 | 77,574 | 0.00 | 7,021 | 772 |
| 2015 | −11,362 | −18.74 | −1,032 | −774 | −7,684 | −20.05 | −698 | −776 |
| 2016 | −14,566 | −21.08 | −1,323 | −905 | −10,771 | −22.80 | −978 | −920 |
| 2017 | −19,676 | −23.46 | −1,788 | −1,059 | −15,880 | −25.65 | −1,443 | −1,092 |
| 2018 | −30,969 | −25.89 | −2,820 | −1,279 | −27,874 | −28.61 | −2,538 | −1,339 |
| 2019 | −39,886 | −28.41 | −3,664 | −1,482 | −37,680 | −31.71 | −3,462 | −1,573 |
| 2020 | −46,592 | −30.58 | −4,305 | −1,645 | −45,452 | −34.52 | −4,200 | −1,772 |
| 2021 | −46,310 | −30.78 | −4,286 | −1,658 | −45,488 | −34.85 | −4,210 | −1,808 |
| 2022 | −48,001 | −31.70 | −4,466 | −1,718 | −47,324 | −35.92 | −4,403 | −1,890 |
| 2023 | −48,598 | −32.42 | −4,551 | −1,763 | −48,153 | −36.84 | −4,510 | −1,961 |
| 2024 | −46,559 | −32.68 | −4,348 | −1,746 | −46,368 | −37.38 | −4,330 | −1,969 |
| 2025 | −44,453 | −32.95 | −4,139 | −1,075 | −44,342 | −37.90 | −4,129 | −1,285 |
| 2026 | −43,234 | −33.48 | −4,032 | −981 | −42,957 | −38.69 | −4,006 | −1,201 |
| 2027 | −41,478 | −33.85 | −3,853 | −874 | −40,890 | −39.19 | −3,798 | −1,101 |
| 2028 | −40,589 | −34.63 | −3,763 | −784 | −40,004 | −40.21 | −3,709 | −1,021 |
| 2029 | −37,657 | −34.92 | −3,469 | −652 | −37,030 | −40.69 | −3,411 | −897 |
| 2030 | −34,984 | −35.60 | −3,216 | −552 | −33,873 | −41.58 | −3,114 | −799 |
| 2031 | −32,456 | −36.11 | −2,981 | −533 | −30,429 | −42.22 | −2,795 | −783 |
| 2032 | −30,850 | −37.04 | −2,831 | −510 | −27,620 | −43.29 | −2,535 | −761 |
| 2033 | −31,513 | −37.98 | −2,902 | −522 | −29,513 | −44.36 | −2,718 | −802 |
| 2034 | −31,569 | −38.97 | −2,922 | −554 | −30,518 | −45.50 | −2,824 | −859 |
| 2035 | −31,167 | −39.81 | −2,911 | −577 | −30,492 | −46.40 | −2,848 | −901 |
4.3. Impacts of Adopting Natural Gas Electricity Generation

| Year | Low growth scenario | High growth scenario | ||||||
|---|---|---|---|---|---|---|---|---|
| Jobs | Carbon Dioxide Emissions | Value Added | State tax revenues | Jobs | Carbon Dioxide Emissions | Value Added | State tax revenues | |
| 2012 | 4,093 | 0.00 | 370 | 41 | 5,272 | 0.00 | 477 | 52 |
| 2013 | 4,705 | 0.00 | 426 | 47 | 6,064 | 0.00 | 549 | 60 |
| 2014 | 5,345 | 0.00 | 484 | 53 | 6,907 | 0.00 | 625 | 69 |
| 2015 | 1,093 | −2.20 | 99 | 11 | 1,218 | −2.87 | 111 | 12 |
| 2016 | 1,093 | −2.53 | 99 | 11 | 1,254 | −3.29 | 114 | 13 |
| 2017 | 700 | −2.87 | 64 | 7 | 839 | −3.75 | 76 | 8 |
| 2018 | −346 | −3.22 | −32 | −3 | −419 | −4.23 | −38 | −4 |
| 2019 | −1,206 | −3.59 | −111 | −12 | −1,449 | −4.73 | −133 | −15 |
| 2020 | −1,778 | −3.89 | −164 | −18 | −2,189 | −5.18 | −202 | −22 |
| 2021 | −2,366 | −3.94 | −219 | −24 | −2,731 | −4.97 | −253 | −28 |
| 2022 | −3,384 | −4.09 | −315 | −35 | −3,875 | −4.87 | −361 | −40 |
| 2023 | −4,033 | −4.21 | −378 | −42 | −4,468 | −4.77 | −418 | −46 |
| 2024 | −4,306 | −4.23 | −402 | −44 | −4,804 | −4.63 | −449 | −49 |
| 2025 | −4,544 | −4.27 | −423 | −47 | −4,936 | −4.46 | −460 | −51 |
| 2026 | −5,176 | −4.34 | −483 | −53 | −5,644 | −4.32 | −526 | −58 |
| 2027 | −5,680 | −4.40 | −528 | −58 | −5,927 | −4.00 | −551 | −61 |
| 2028 | −5,678 | −4.48 | −526 | −58 | −5,743 | −3.75 | −532 | −59 |
| 2029 | −5,281 | −4.51 | −486 | −54 | −4,967 | −3.38 | −457 | −50 |
| 2030 | −5,336 | −4.58 | −491 | −54 | −4,823 | −3.06 | −443 | −49 |
| 2031 | −5,995 | −4.66 | −551 | −61 | −5,192 | −2.68 | −477 | −52 |
| 2032 | −6,875 | −4.79 | −631 | −69 | −5,816 | −2.31 | −534 | −59 |
| 2033 | −7,681 | −4.95 | −707 | −78 | −6,419 | −1.89 | −591 | −65 |
| 2034 | −8,407 | −5.08 | −778 | −86 | −6,985 | −1.45 | −646 | −71 |
| 2035 | −9,417 | −5.22 | −880 | −97 | −7,650 | −0.93 | −715 | −79 |
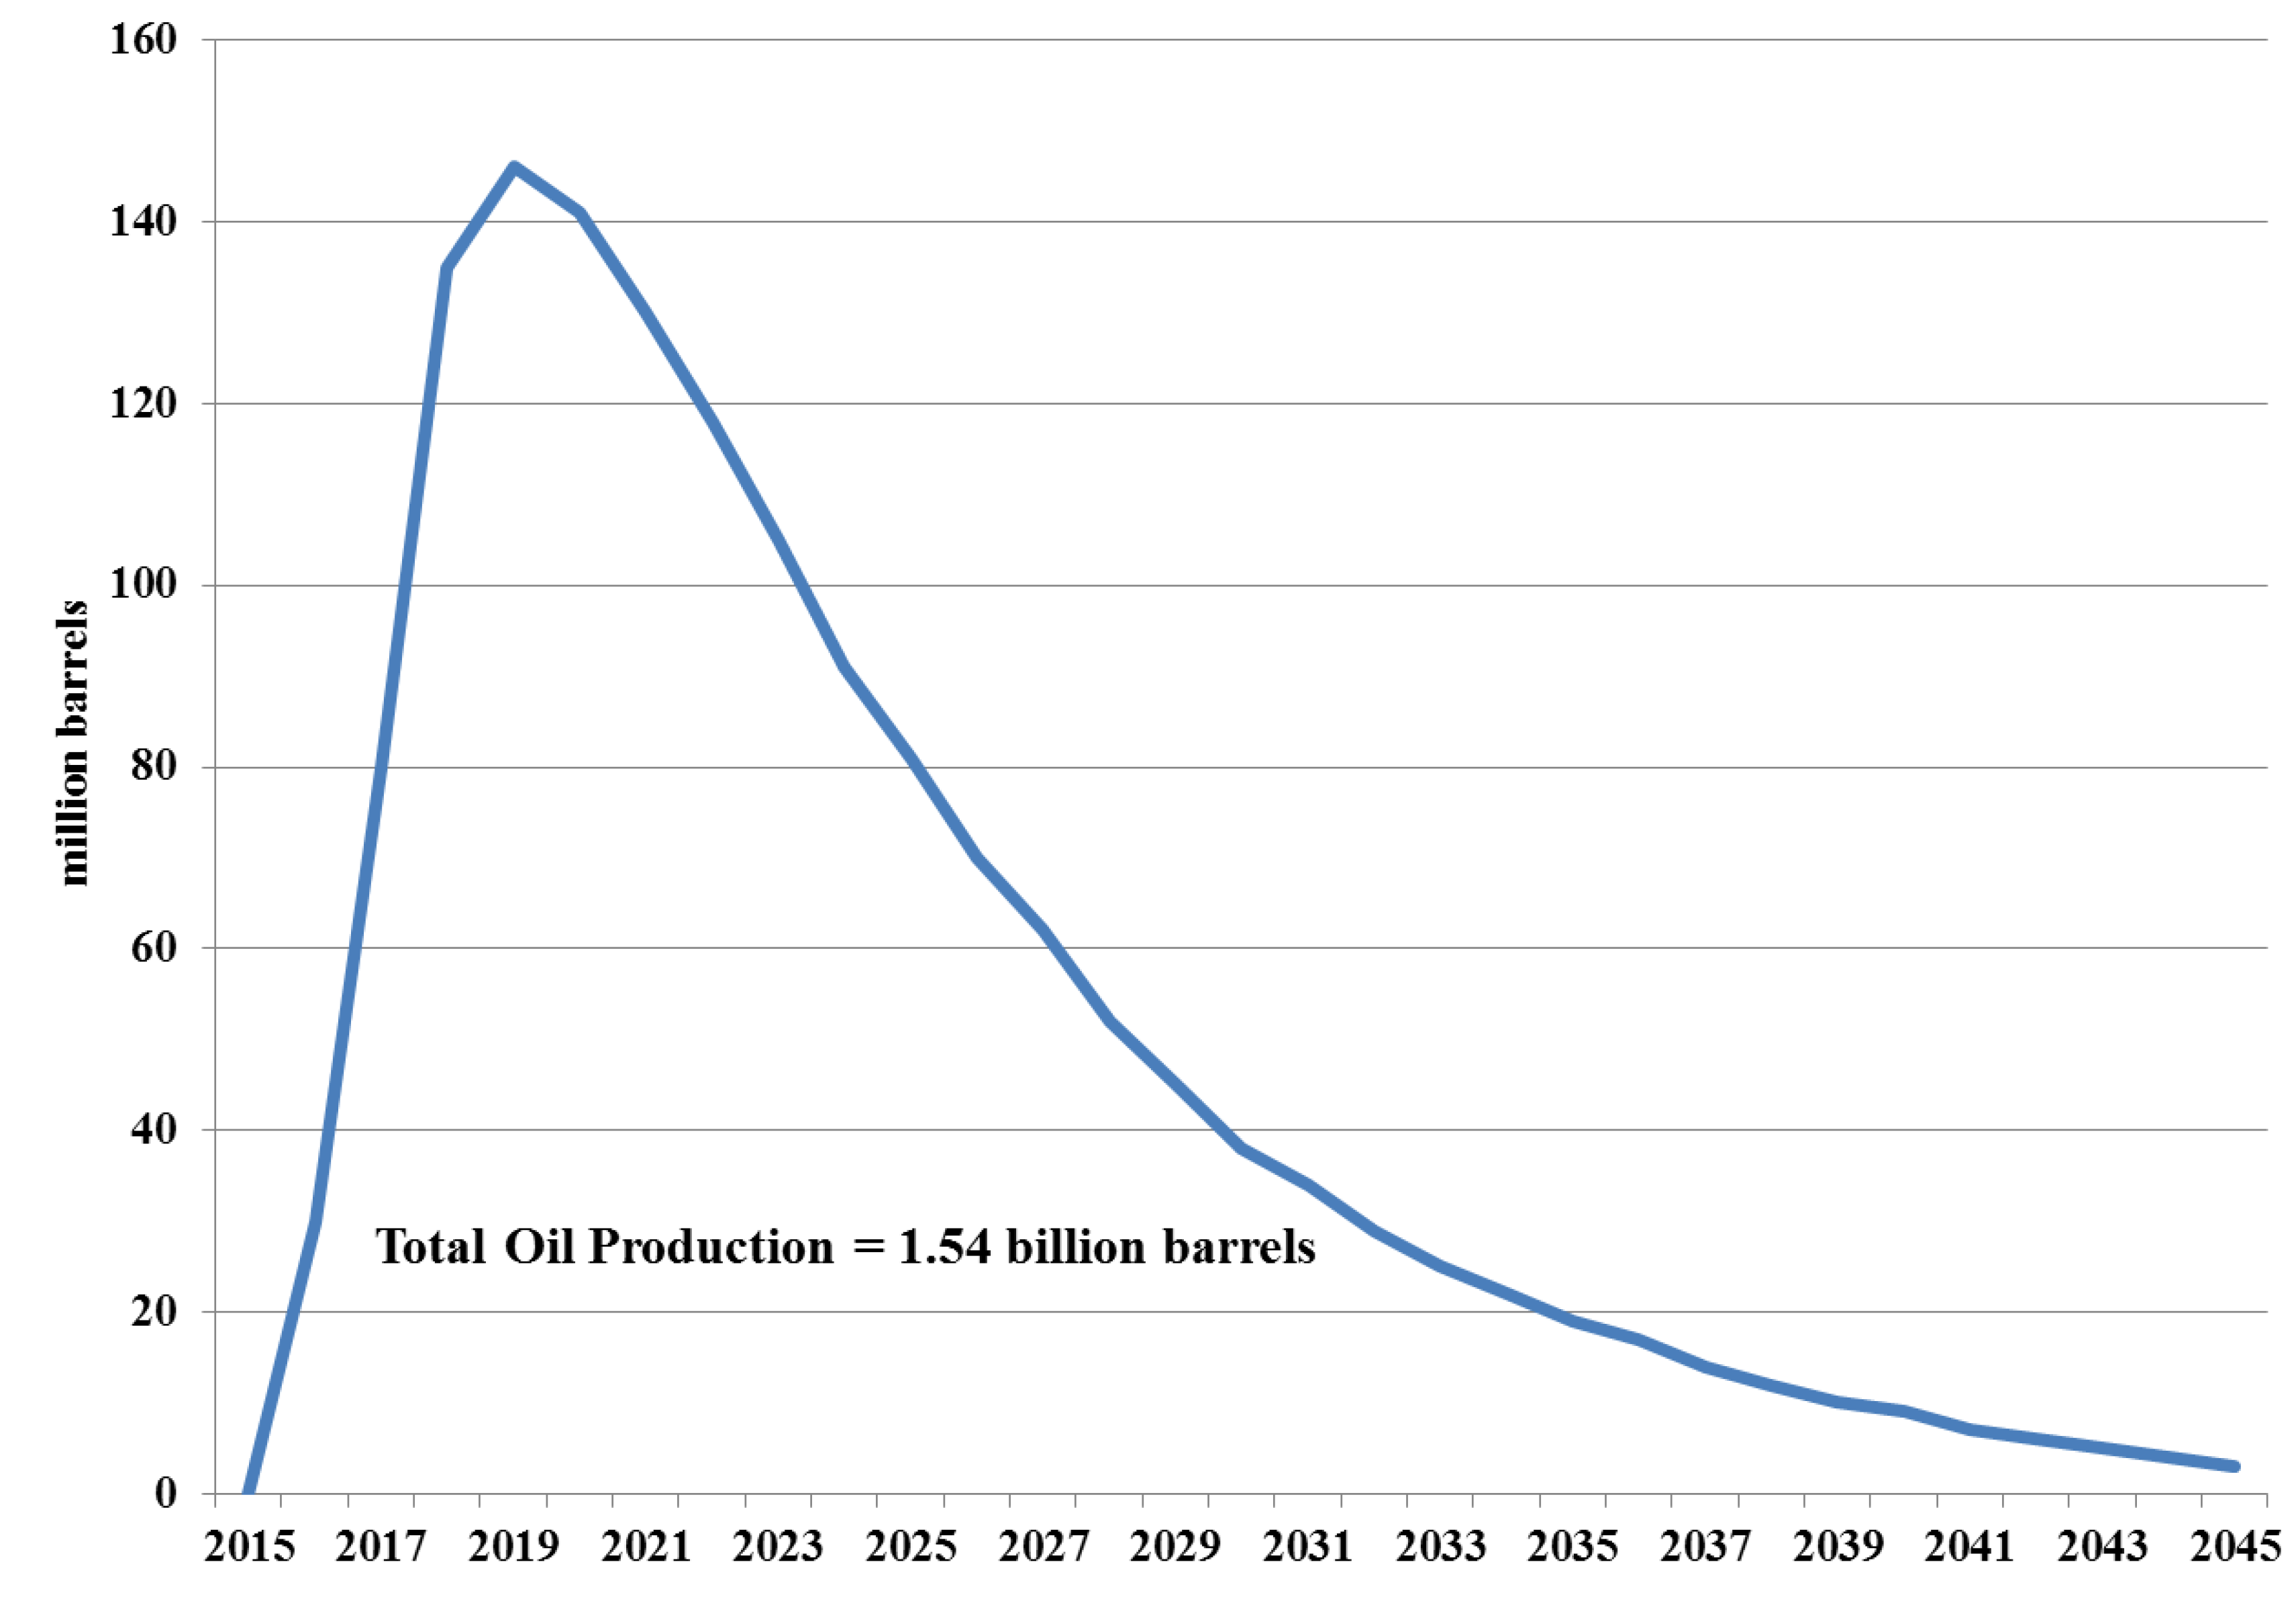
4.4. Impacts of Developing Santa Barbara Oil
5. Summary and Conclusions
| Net Impacts on | Scenarios | |||
|---|---|---|---|---|
| Renewable Energy Portfolio | Natural Gas | Santa Barbara Oil | Santa Barbara Oil with Feedback | |
| Employment | Average Annual Number of Jobs | |||
| Low Growth | −23,471 | −2,936 | 24,659 | 22,471 |
| High Growth | −21,545 | −2,603 | 22,143 | |
| Value Added | Present Value in Millions of 2010 Dollars | |||
| Low Growth | −29,982 | −3,380 | 91,769 | 83,609 |
| High Growth | −26,668 | −2,893 | 82,397 | |
| State Tax Revenues | ||||
| Low Growth | −13,420 | −372 | 23,786 | 23,371 |
| High Growth | −15,656 | −318 | 23,310 | |
| Carbon Dioxide Emissions | Cumulative in millions of tons | |||
| Low Growth | −671 | −86 | −3 | 12 |
| High Growth | −768 | −76 | 14 | |
Acknowledgments
References and Notes
- Humphries, M.; Pirog, R.; Whitney, G. U.S. Offshore Oil and Gas Resources: Prospects and Processes; Congressional Research Service, UNT Digital Library: Washington, DC, USA, 2011; Available online: http://digital.library.unt.edu/ark:/67531/metadc40077 (accessed on 1 January 2012).
- Considine, T.J.; McLaren, D. Powering Arizona: Choices and Trade-Offs for Electricity Policy; The Communications Institute, Arizona State University: Tempe, AZ, USA, 2008; pp. 1–34. [Google Scholar]
- National Renewable Energy Laboratory. Jobs and Economic Development Impact (JEDI) Models. Available online: http://www.nrel.gov/analysis/jedi (accessed on 1 January 2012).
- MIG, Inc. Regional Economic Modeling System. Available online: http://implan.com/V4/index.php?option=com_content&view=frontpage&Itemid=70 (accessed on 1st January 2012).
- Schniepp, M. Economic Benefits of Future Oil and Gas Production in Santa Barbara County, California Economic Forecast; Unpublished Analysis; Presented at the Santa Barbara Industrial Association Economic Conference, Santa Barbara, CA, USA, 31 October 2008; and the Pacific Section of the American Association of Petroleum Geologists Convention, Panel on California Offshore Energy Exploration and Development, Venture, CA, USA, 5 May 2009.
- Hamrin, J.; Dracker, R.; Martin, J.; Wiser, R.; Porter, K.; Clement, D.; Bolinger, M. Achieving a 33% Renewable Energy Target; Report for the California Public Utilities Commission: San Francisco, CA, USA, 2005; pp. 1–164. [Google Scholar]
- Roland-Holst, D. Energy Prices and California’s Economic Security; Department of agricultural and Resource Economics, University of California: Berkeley, CA, USA, 2009; Research Paper No. 0910071; pp. 1–57. Available online: http://are.berkeley.edu/~dwrh/CERES_Web/Docs/ERCES100500.pdf (accessed on 1 January 2012).
- Chen, C.; Wiser, R.; Mills, A.; Bolinger, M. Weighing the costs and benefits of state renewables portfolio standards in the United States: A comparative analysis of state-level policy impact projections. Renew. Sustain. Energy Rev. 2009, 13, 552–566. [Google Scholar] [CrossRef]
- Fischer, C. Renewable Portfolio Standards: When do They Lower Energy Prices? Energy J. 2010, 31(1), 101–119. [Google Scholar] [CrossRef]
- Tuerck, D.; Bachman, P.; Head, M. The Economic Impact of Montana’s Renewable Portfolio Standard; American Tradition Institute: Washington, DC, USA, 2011; pp. 1–22. [Google Scholar]
- Tuerck, D.; Bachman, P.; Head, M. The Economic Impact of Colorado’s Renewable Portfolio Standard; American Tradition Institute: Washington, DC, USA, 2011; pp. 1–24. [Google Scholar]
- Tuerck, D.; Bachman, P.; Head, M. Economic Impact of Oregon’s Renewable Portfolio Standard; Beacon Hill Institute and Cascade Policy Institute: Boston, MA, USA, 2011; pp. 1–24. [Google Scholar]
- Dismukes, D. Economic Impacts of New Jersey’s Proposed Renewable Portfolio Standard; Report for the New Jersey Office of Ratepayer Advocate: Baton Rouge, LA, USA, 2005; pp. 1–33. [Google Scholar]
- Davis, S.; Haltiwanger, J. Sectoral job creation and destruction responses to oil price changes. J. Monet. Econ. 2001, 48, 465–512. [Google Scholar] [CrossRef]
- Edelstein, P.; Kilian, L. How sensitive are consumer expenditures to retail energy prices? J. Monet. Econ. 2009, 56(6), 766–779. [Google Scholar] [CrossRef]
- Kammen, D.M; Kapadia, K.; Fripp, M. Putting Renewables to Work: How Many Jobs Can the Clean Energy Industry Generate? RAEL Report; University of California: Berkley, CA, USA, April 2004. [Google Scholar]
- Wei, M.; Patadia, S.; Kammen, D. Putting renewables and energy efficiency to work: How many jobs can the clean energy industry generate in the US? Energy Policy 2010, 38, 919–931. [Google Scholar] [CrossRef]
- Slattery, M.; Lantz, E.; Johnson, B. State and local economic impacts from wind energy projects: Texas case study. Energy Policy 2011, 39, 7930–7940. [Google Scholar] [CrossRef]
- U.S. Energy Information Administration. Annual Energy Outlook 2012. Available online: http://www.eia.gov/forecasts/archive/aeo12/index (accessed on 1 January 2013).
- Sandia National Laboratories. Power Towers for Utilities. Available online: http://energy.sandia.gov/?page_id=11728 (accessed on 1 January 2013).
- U.S. Energy Information Administration. Assumptions to the Annual Energy Outlook 2010. Available online: http://www.eia.gov/oiaf/aeo/assumption/renewable.html (accessed on 1 January 2013).
- Boccard, N. Capacity Factor of wind power realized values vs. estimates. Energy Policy 2009, 37, 2679–2688. [Google Scholar] [CrossRef]
- Considine, T.; Watson, R.; Considine, N.; Martin, J. Environmental regulation and compliance in marcellus shale gas drilling. Environ. Geosci. 2013. submitted. [Google Scholar]
- International Maritime Organization (IMO). Second IMO GHG Study 2009; IMO: London, UK, April 2009. [Google Scholar]
- Considine, T.J. The Economic Impacts of the Marcellus Shale: Implications for New York, Pennsylvania, and West Virginia; American Petroleum Institute: Washington DC, USA, July 2010; pp. 1–3. [Google Scholar]
© 2013 by the authors; licensee MDPI, Basel, Switzerland. This article is an open access article distributed under the terms and conditions of the Creative Commons Attribution license (http://creativecommons.org/licenses/by/3.0/).
Share and Cite
Considine, T.; Manderson, E. Balancing Fiscal, Energy, and Environmental Concerns: Analyzing the Policy Options for California’s Energy and Economic Future. Energies 2013, 6, 1266-1297. https://doi.org/10.3390/en6031266
Considine T, Manderson E. Balancing Fiscal, Energy, and Environmental Concerns: Analyzing the Policy Options for California’s Energy and Economic Future. Energies. 2013; 6(3):1266-1297. https://doi.org/10.3390/en6031266
Chicago/Turabian StyleConsidine, Timothy, and Edward Manderson. 2013. "Balancing Fiscal, Energy, and Environmental Concerns: Analyzing the Policy Options for California’s Energy and Economic Future" Energies 6, no. 3: 1266-1297. https://doi.org/10.3390/en6031266
APA StyleConsidine, T., & Manderson, E. (2013). Balancing Fiscal, Energy, and Environmental Concerns: Analyzing the Policy Options for California’s Energy and Economic Future. Energies, 6(3), 1266-1297. https://doi.org/10.3390/en6031266