Towards Energy Demand Reduction in Social Housing Buildings: Envelope System Optimization Strategies


Abstract
:
1. Introduction
2. Description of the Climate and the Building
2.1. Weather Data
- Location: Seville (Spain) (N 37° 25') (W 5° 54') (GMT +1.0 Hour)
- Elevation: 31 m.s. Standard atmospheric pressure: 100953 Pa
- Source of the data: DOE-2 WTH-083910 WMO Station 083910
- Coordinates UTM: Zone 30S; 236279.56 m E; 4140583.85 m N
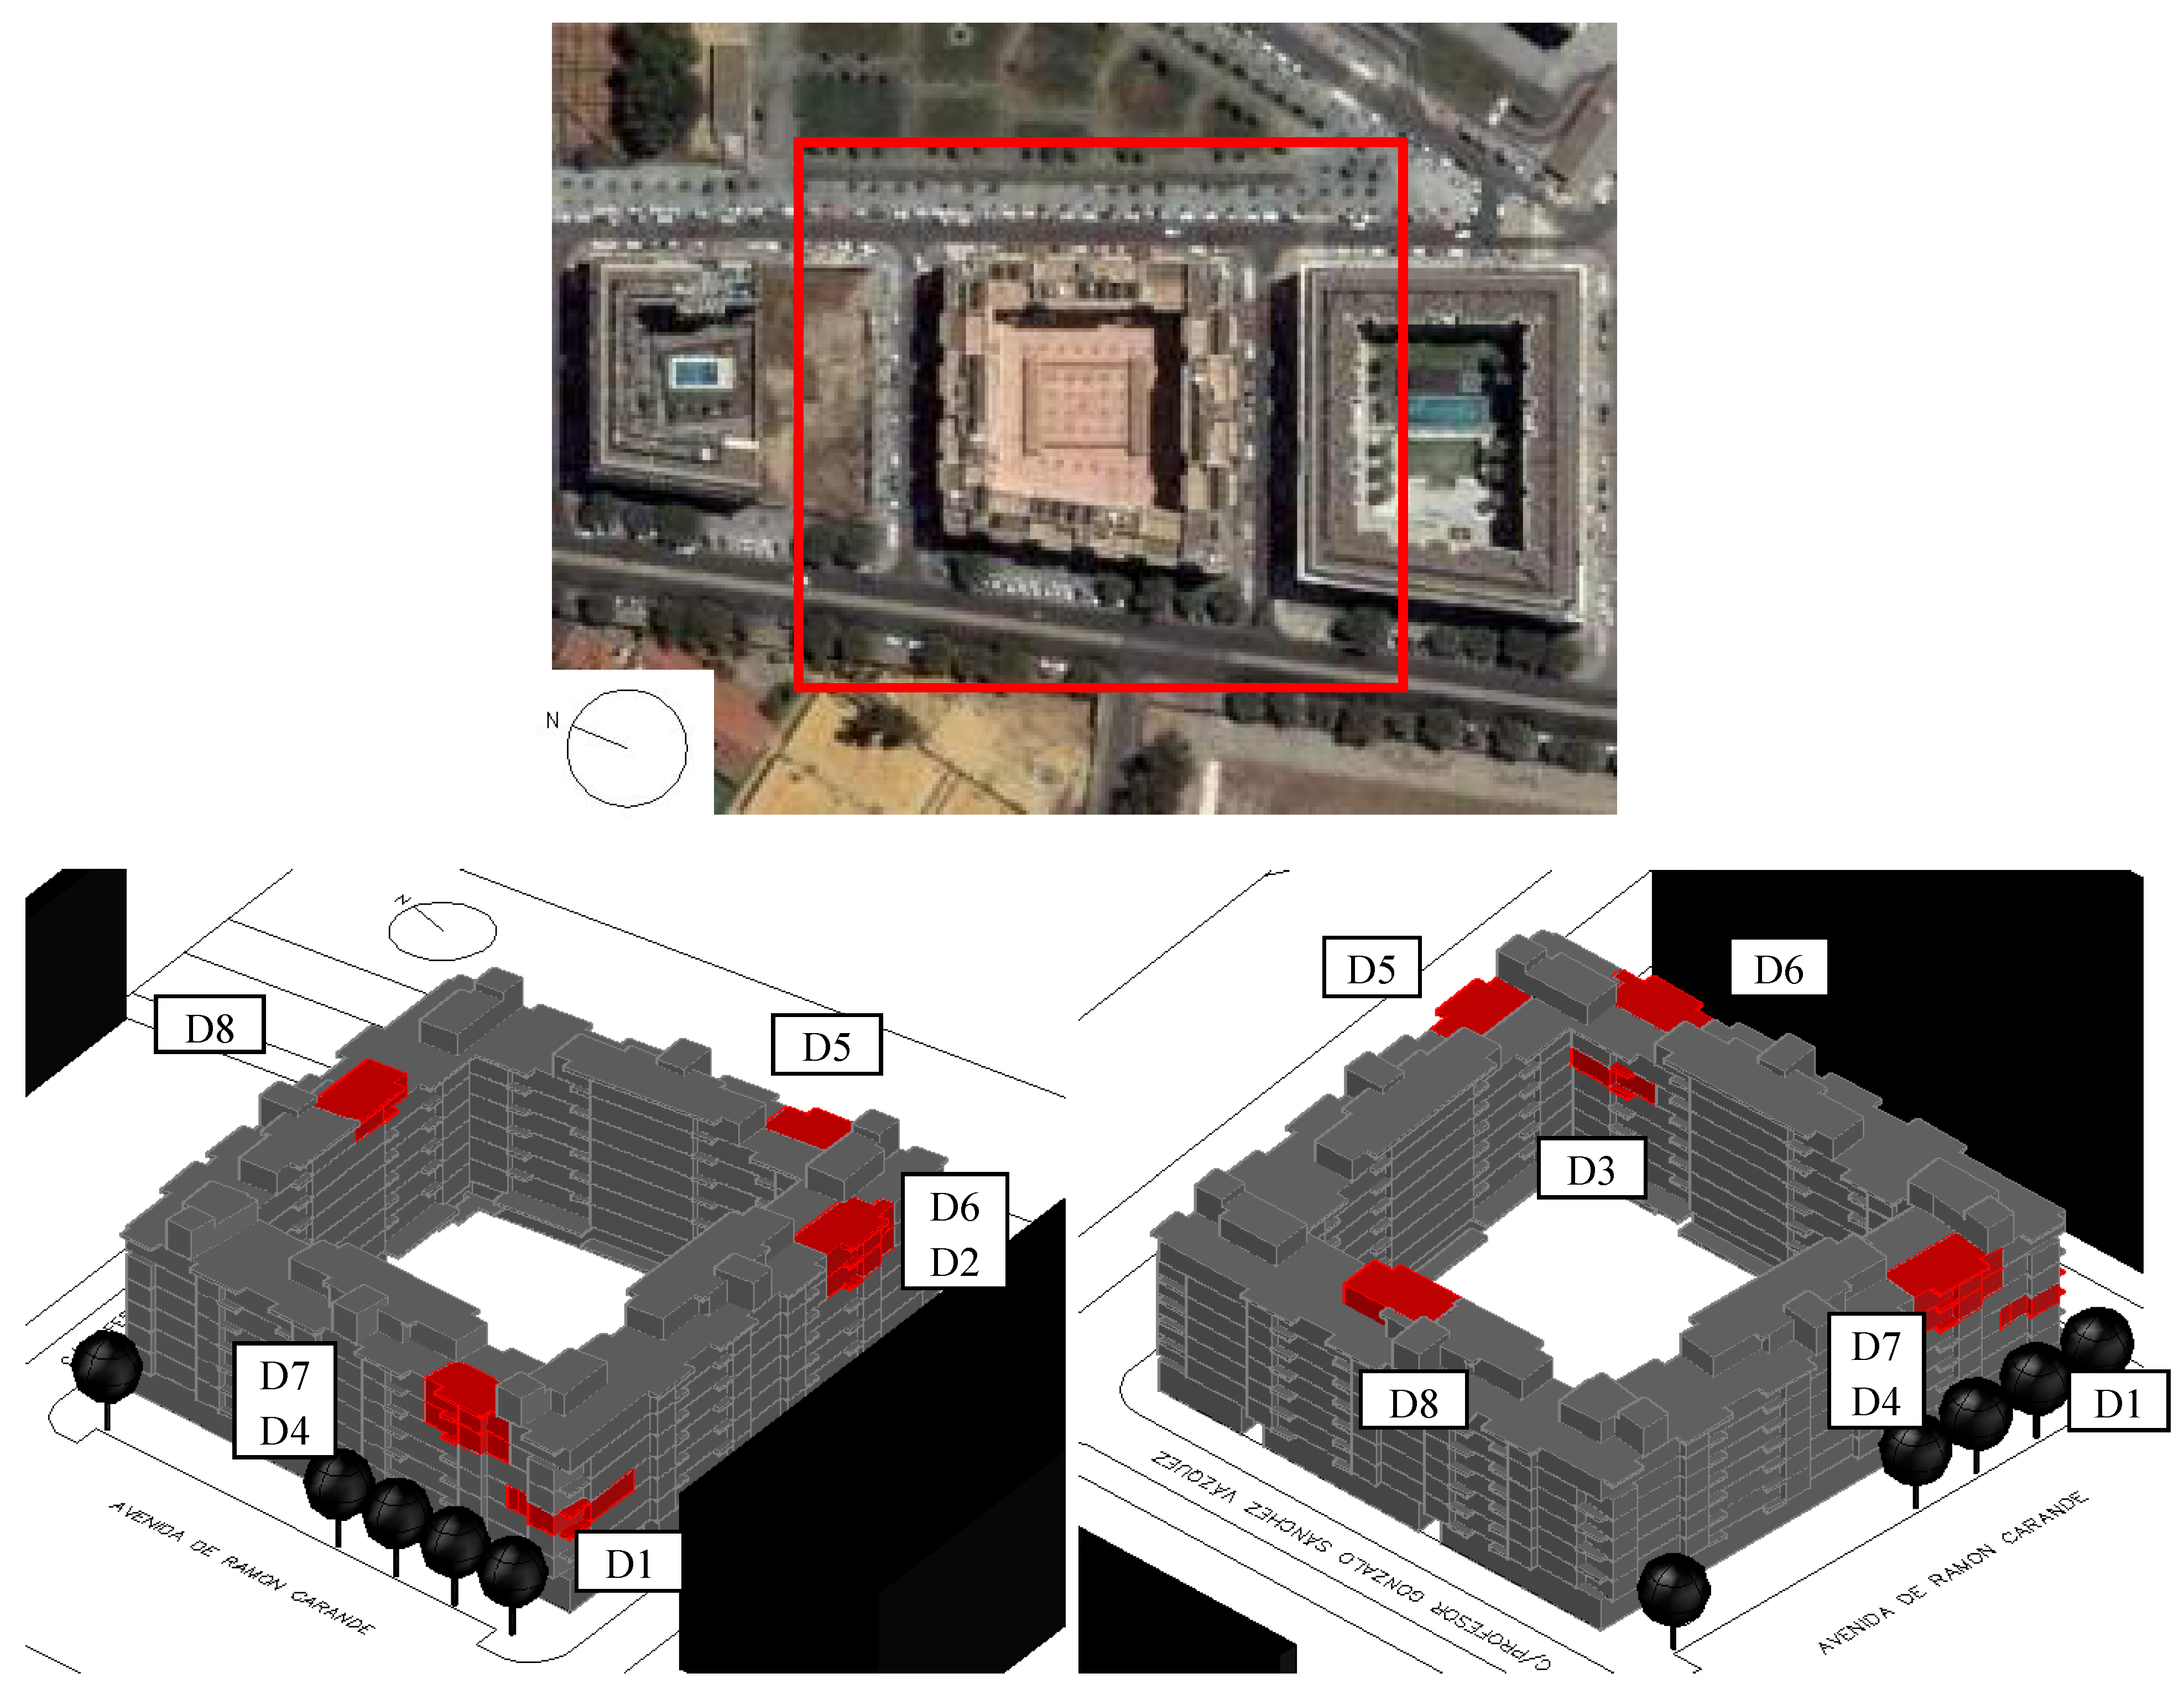
2.3. Study Sample

| Dwelling | Orientation | Floor/Elev [N°/m] | Useful Area [m2] | Built Area [m2] | Façade Surface [m2] | Window Surface [m2] | Roof Surface [m2] |
|---|---|---|---|---|---|---|---|
| D1 | S + W (+ I) | 3rd/10.69 | 64.34 | 75.73 | 58.45 | 13.98 | - |
| D2 | S(+ I) | 5th/16.81 | 58.09 | 66.75 | 37.11 | 10.80 | - |
| D3 | N(+ I) | 5th/16.81 | 57.16 | 65.75 | 33.70 | 9.36 | - |
| D4 | W(+ I) | 5th/16.81 | 58.15 | 66.78 | 36.95 | 10.80 | - |
| D5 | E (+ R) | 6th/19.87 | 59.93 | 68.72 | 38.09 | 10.80 | 66.68 |
| D6 | S (+ R) | 6th/19.87 | 58.17 | 66.75 | 37.11 | 10.80 | 64.90 |
| D7 | W (+ R) | 6th/19.87 | 58.15 | 66.78 | 36.95 | 10.80 | 64.83 |
| D8 | S (+ R) | 7th/22.93 | 56.63 | 67.29 | 68.78 | 9.36 | 64.84 |
3. Description of the Methodology
3.1. Development of the Energy Models
- -
- Each dwelling was considered as a unique space, although partitions were introduced between its rooms.
- -
- -
- The adjacent dwellings were considered as a unique space and without partitions between rooms, equipped and with the same operational conditions as the modelled house, which is why the transfer through the surfaces in contact with them was considered adiabatic.
- -
- The common circulation spaces were considered as non-conditioned spaces, which is why it was assumed that there was thermal transfer through the surface in contact with the modelled dwelling.
| Activity | Value | Schedule | |||
|---|---|---|---|---|---|
| Winter | Summer | ||||
| Occupation | 0.056 pers/m2 | 00:00 to 07:00 | 100% | 00:00 to 07:00 | 100% |
| 07:00 to 16:00 | 25% | 07:00 to 16:00 | 25% | ||
| 16:00 to 23:00 | 50% | 16:00 to 23:00 | 50% | ||
| Weekends & holidays: 00:00 to 24:00 | 50% | Weekends: 00:00 to 24:00 | 100% | ||
| Holidays: 00:00 to 24:00 | 0% | ||||
| Equipment & Lighting | 4.44 W/m2 + 4.44 W/m2 | 00:00 to 08:00 | 10% | 00:00 to 08:00 | 10% |
| 08:00 to 19:00 | 30% | 08:00 to 19:00 | 30% | ||
| 19:00 to 20:00 | 50% | 19:00 to 20:00 | 50% | ||
| 20:00 to 23:00 | 100% | 20:00 to 23:00 | 100% | ||
| 23:00 to 24:00 | 50% | 23:00 to 24:00 | 50% | ||
| Infiltration | 1 ac/h | 00:00 to 24:00 | 100% | 00:00 to 24:00 | 100% |
| Ventilation | 3 ac/h | 00:00 to 24:00 | 0% | 00:00 to 08:00 | 100% |
| 08:00 to 24:00 | 0% | ||||
| Operative set-point temperature | 20 °C | 26 °C | |||
| Winter: from last Sunday in October to last Saturday in March. Summer: from last Sunday on March to last Saturday on October. | |||||
3.2. Study of the Demand in the “Average” Dwelling
3.3. Statement and Simulation of Strategic Proposals
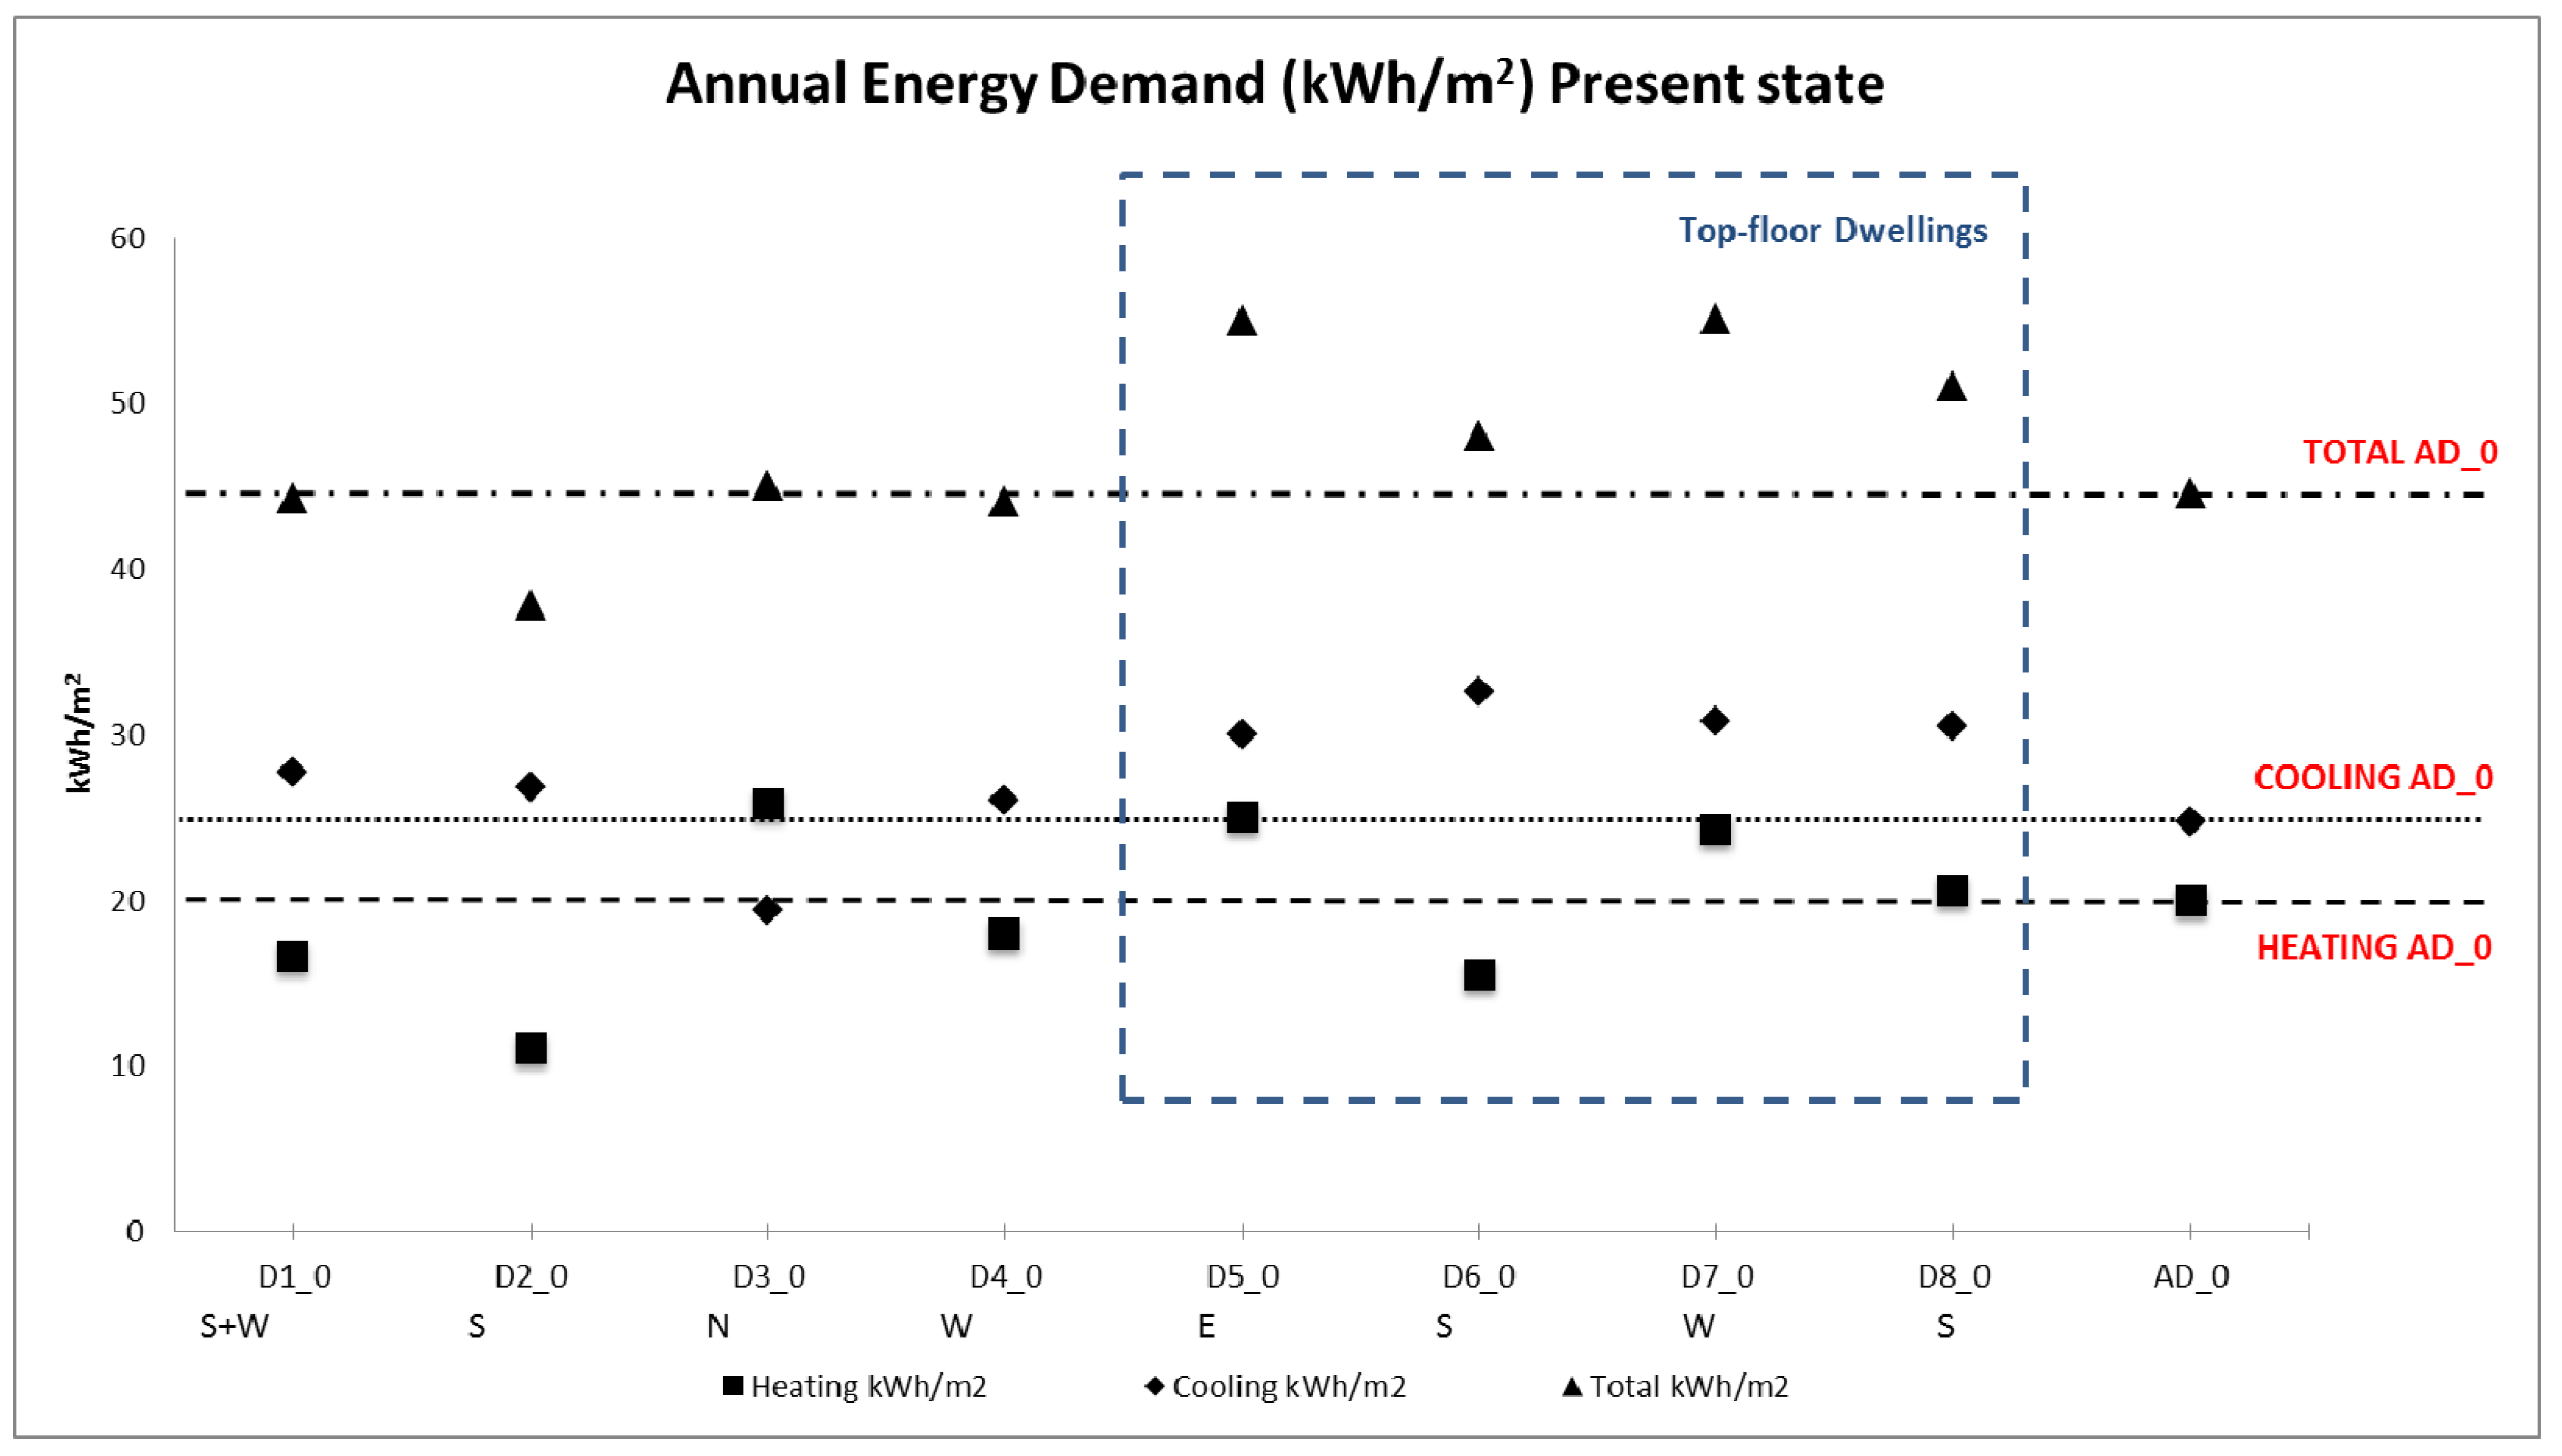
4. Energy Demand of the Present State
4.1. Construction Description and Energy Demand
| Element | Name | Construction description | U value [W/m2K] | Mass [kg/m2] |
|---|---|---|---|---|
| Façade | f0 | brick masonry, 2 cm PUR, plasterboard | 0.82 | 175.97 |
| Roof | r0 | non-ventilated inverted flat roof, 4 cm XPS | 0.45 | 727.50 |
| Dividing Wall | Dw0 | ceramic blocks | 1.30 | 188.80 |
| Partition | Pt0 | self-supporting plasterboard solution | 1.79 | 24.81 |
| Floor | Fl0 | reinforced concrete frame, artificial stone flooring | 1.77 | 518.75 |
| Type | Frame Surface [m2] | Edge glazing Surface [m2] | Centre glazing Surface [m2] | Window w0 | ||
|---|---|---|---|---|---|---|
| U value [W/m2K] | SHGC (glazing) | VT (glazing) | ||||
| Standard | 0.23 | 0.4438 | 0.7662 | 6.60 | 0.82 | 0.88 |
| Lounge | 0.29 | 0.5218 | 1.3482 | 6.46 | 0.82 | 0.88 |
| Terrace | 0.415 | 0.7558 | 2.0492 | 6.43 | 0.82 | 0.88 |
| Laundry1 | 0.275 | 0.3276 | 0.9724 | 6.67 | 0.82 | 0.88 |
| Laundry2 | 0.412 | 0.4758 | 1.1572 | 6.81 | 0.82 | 0.88 |
| Stairs | 0.257 | 0.3042 | 0.4728 | 7.06 | 0.82 | 0.88 |

4.2. Analysis of Results of the Demand in the Present State
5. Model Adjusted to the Energy Demand Limitation Regulation
5.1. Construction Description and Energy Demand
| Element | Name | Construction description | U value [W/m2K] | Mass [kg/m2] |
|---|---|---|---|---|
| Façade | f_MSR | brick masonry, 1 cm PUR, plasterboard | 1.05 | 208.22 |
| Roof | r_MSR | non-ventilated inverted flat roof, 3.1 cm XPS | 0.58 | 585.05 |
| Dividing wall | Dw_MSR | self-supporting double plasterboard solution, 1.3 cm mineral wool | 1.18 | 32.18 |
| Partition | Pt_MSR | self-supporting plasterboard solution, 2.3 cm mineral wool | 1.17 | 25.90 |
| Floor | Fl_MSR | reinforced concrete floor, artificial stone flooring, 0.5 cm reticular Polyethylene | 2.00 | 569.25 |
| w_South | 4-6-4 glazing, metal frame, no thermal break | w1 |
| w_Common | 4-6-4 glazing, metal frame with thermal break | w2 |
| Type | w1 | w2 | ||
|---|---|---|---|---|
| U value [W/m2K] | SHGC (glazing) | U value [W/m2K] | SHGC (glazing) | |
| Standard | 4.55 | 0.79 | 3.70 | 0.79 |
| Lounge | 4.31 | 0.79 | 3.60 | 0.79 |
| Terrace | 4.27 | 0.79 | 3.58 | 0.79 |
| Laundry 1 | 4.61 | 0.79 | 3.68 | 0.79 |
| Laundry 2 | 4.84 | 0.79 | 3.77 | 0.79 |
| Stairs | 5.24 | 0.79 | 3.92 | 0.79 |
5.2. Analysis of Results of the Energy Demand of the Model Adjusted to the Regulation
6. Proposals for Façades, Roofs and Windows
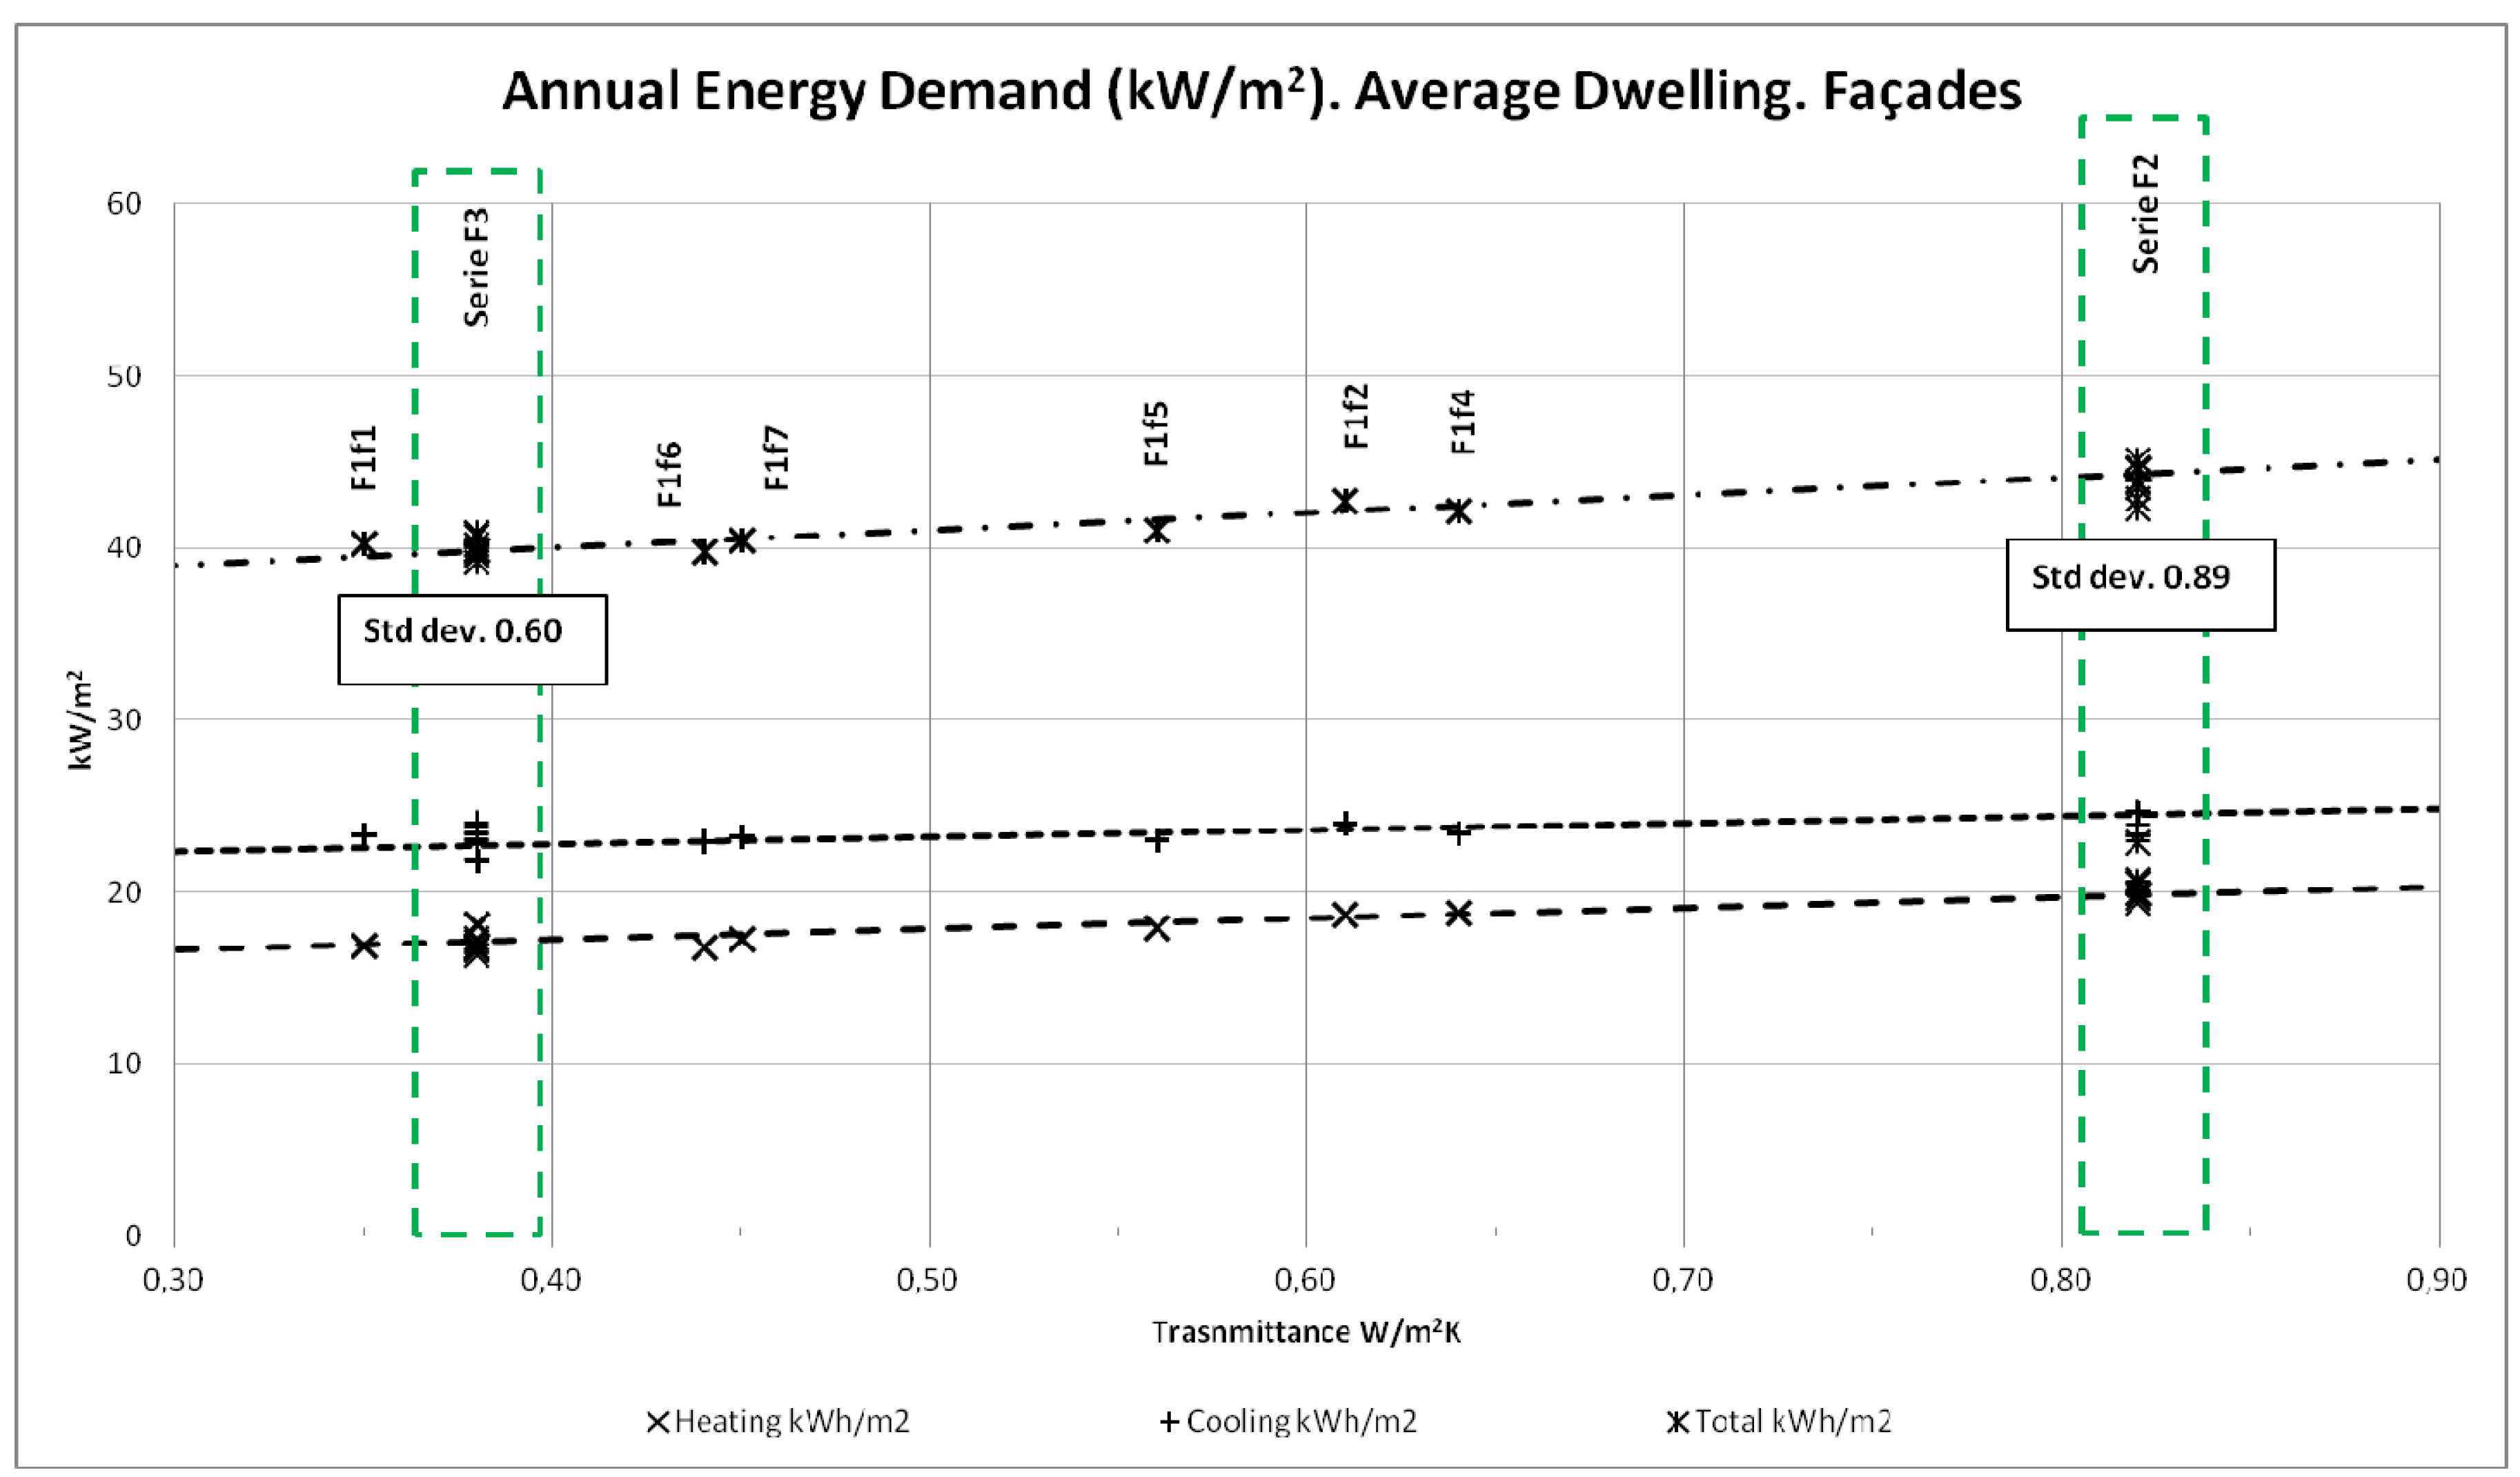
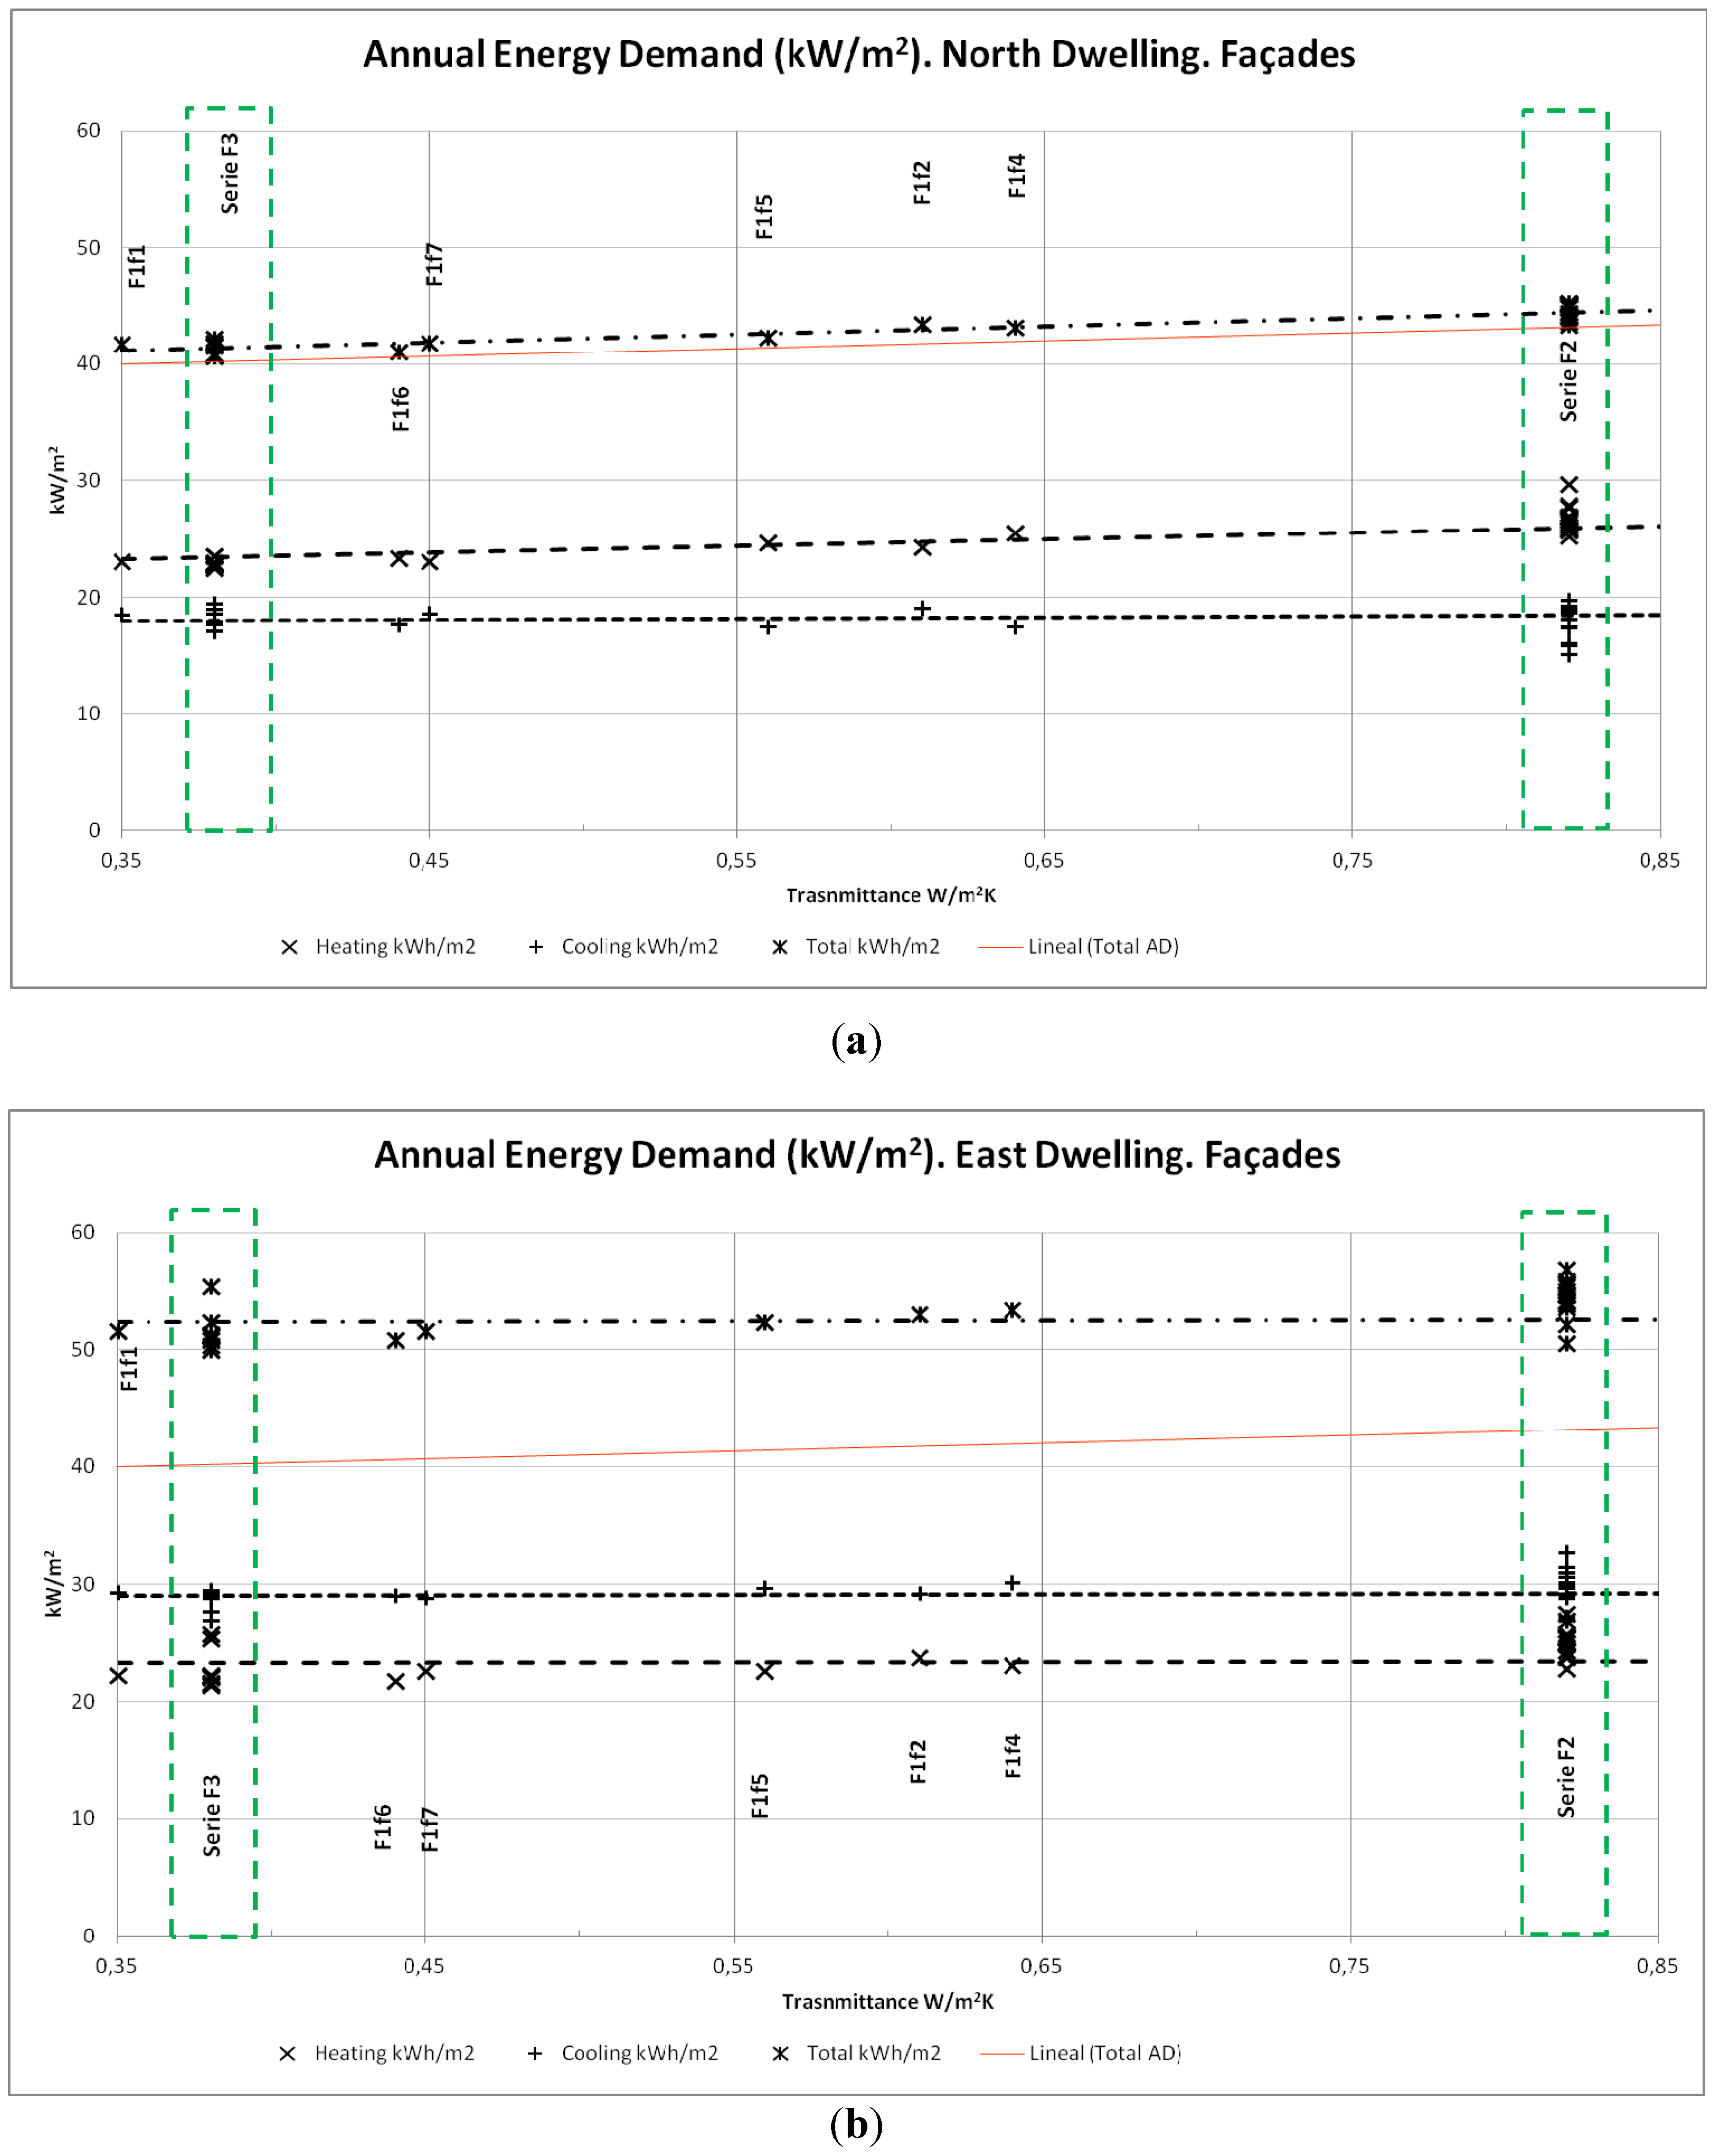
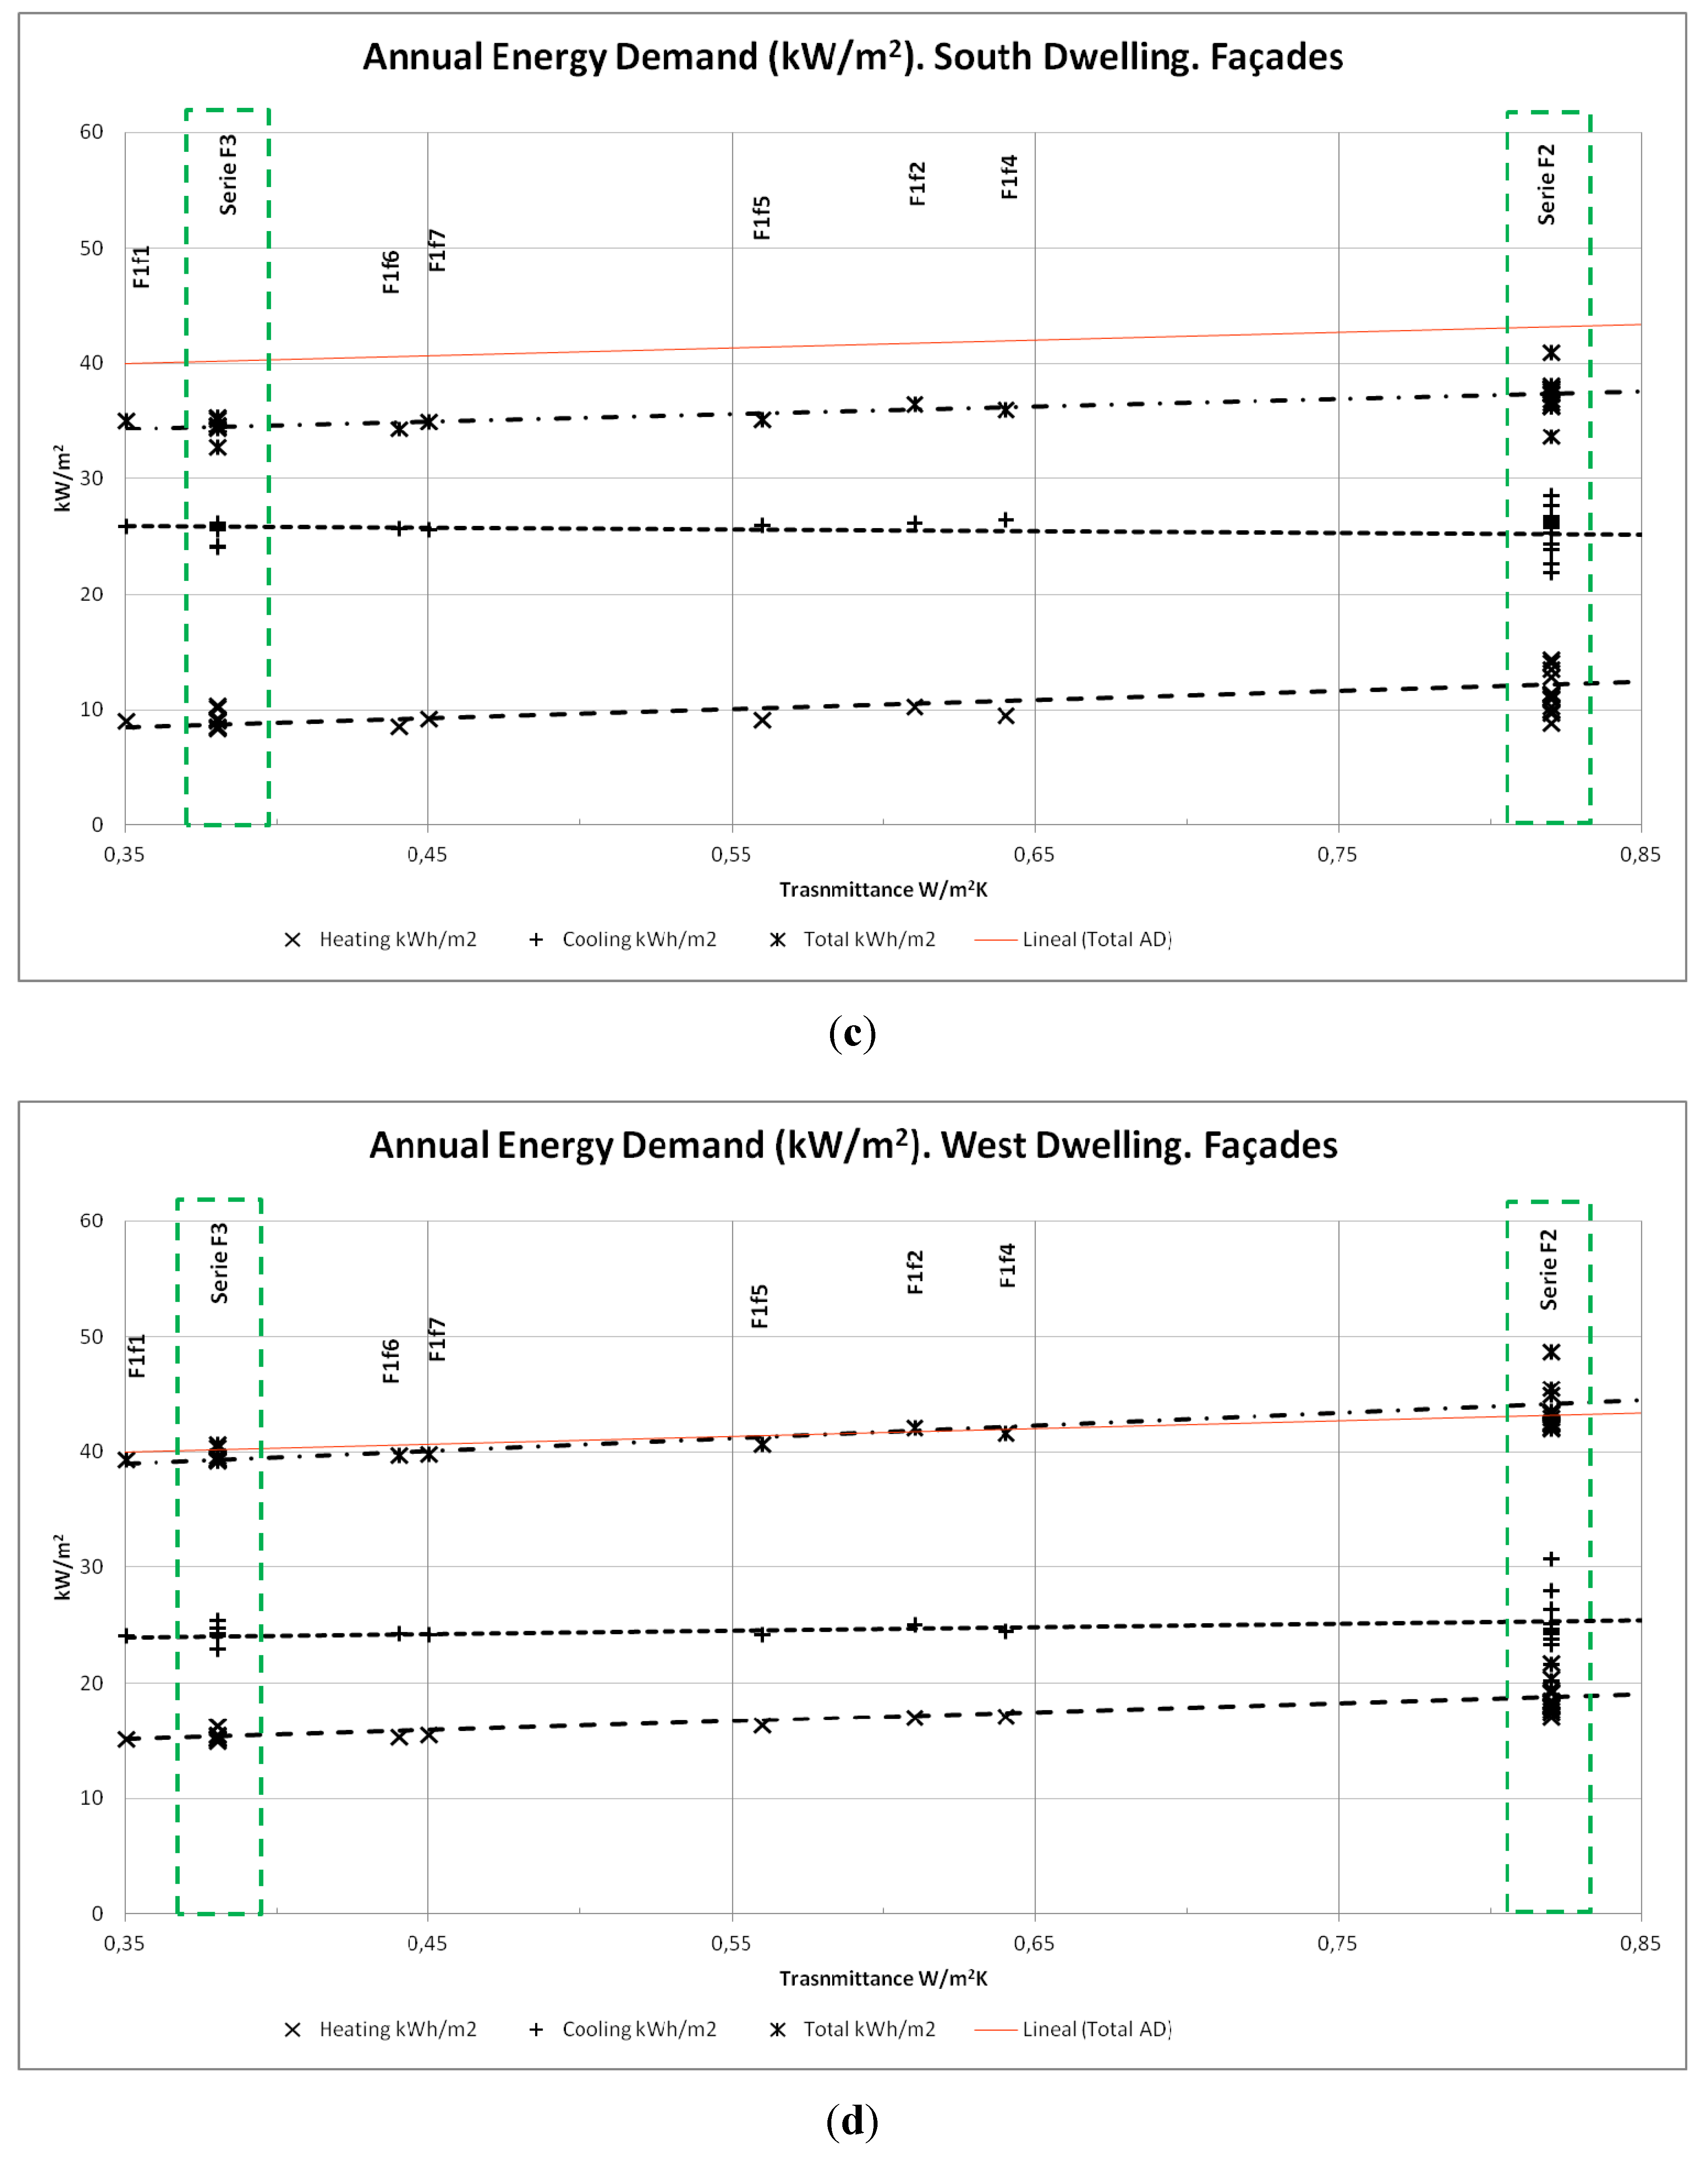
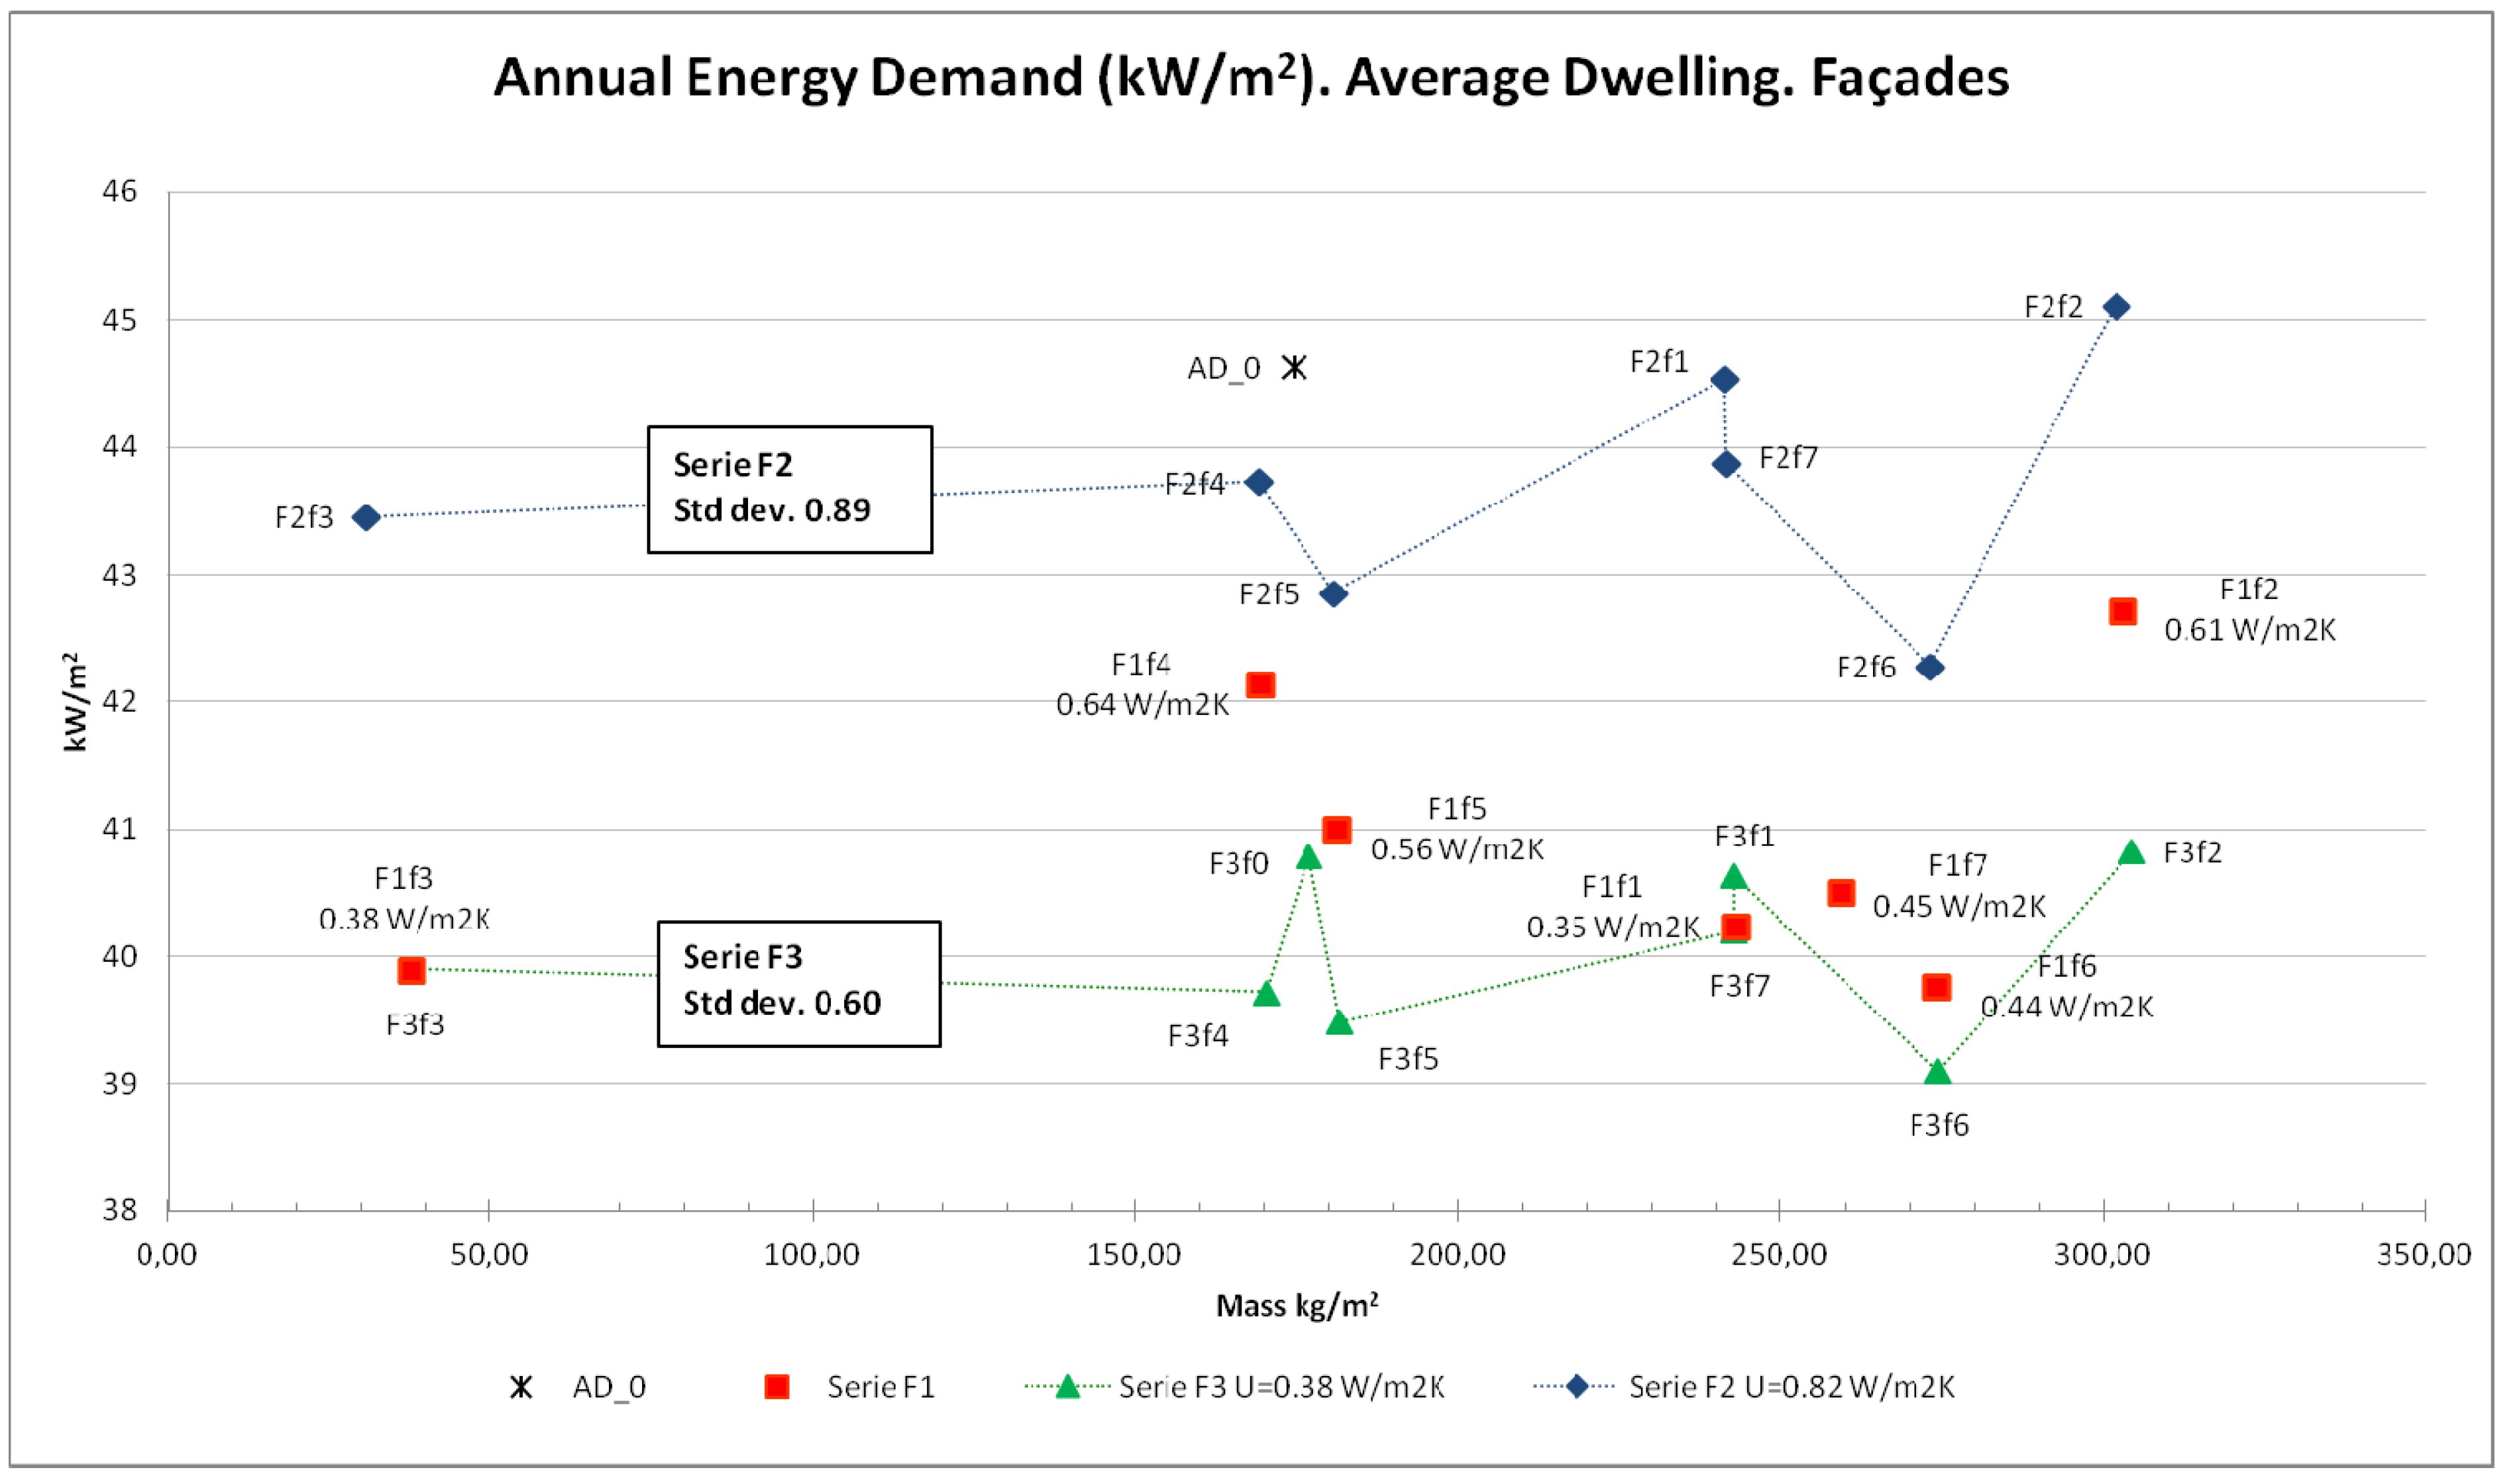
6.1. Façades
| Name | Construction description | Series F1 | Series F2 | Series F3 | |||
|---|---|---|---|---|---|---|---|
| U value [W/m2K] | Mass [kg/m2] | U value [W/m2K] | Mass [kg/m2] | U value [W/m2K] | Mass [kg/m2] | ||
| f0 | Brick masonry, PUR, plaster-board | 0.82 | 174.59 | 0.82 | 174.59 | 0.38 | 176,79 |
| f1 | Concrete panel sandwich, EPS | 0.35 | 243.00 | 0.82 | 241.14 | 0.38 | 242.70 |
| f2 | Reinforced concrete, MW, plasterboard | 0.61 | 302.89 | 0.82 | 302.00 | 0.38 | 304.39 |
| f3 | Ventilated façade, aluminium alloy panel, MW, plasterboard | 0.38 | 37.84 | 0.82 | 30.76 | 0.38 | 37.84 |
| f4 | Ventilated façade, ceramic plate, PUR, brick masonry | 0.64 | 169.29 | 0.82 | 169.02 | 0.38 | 170.19 |
| f5 | Ventilated façade, ceramic plate, PUR, ceramic blocks | 0.56 | 180.99 | 0.82 | 180.51 | 0.38 | 181.68 |
| f6 | Ventilated façade, ceramic plate, EPS, concrete | 0.44 | 273.97 | 0.82 | 273.07 | 0.38 | 274.33 |
| f7 | Ceramic blocks, EPS exterior insulation | 0.45 | 259.35 | 0.82 | 241.48 | 0.38 | 242.68 |


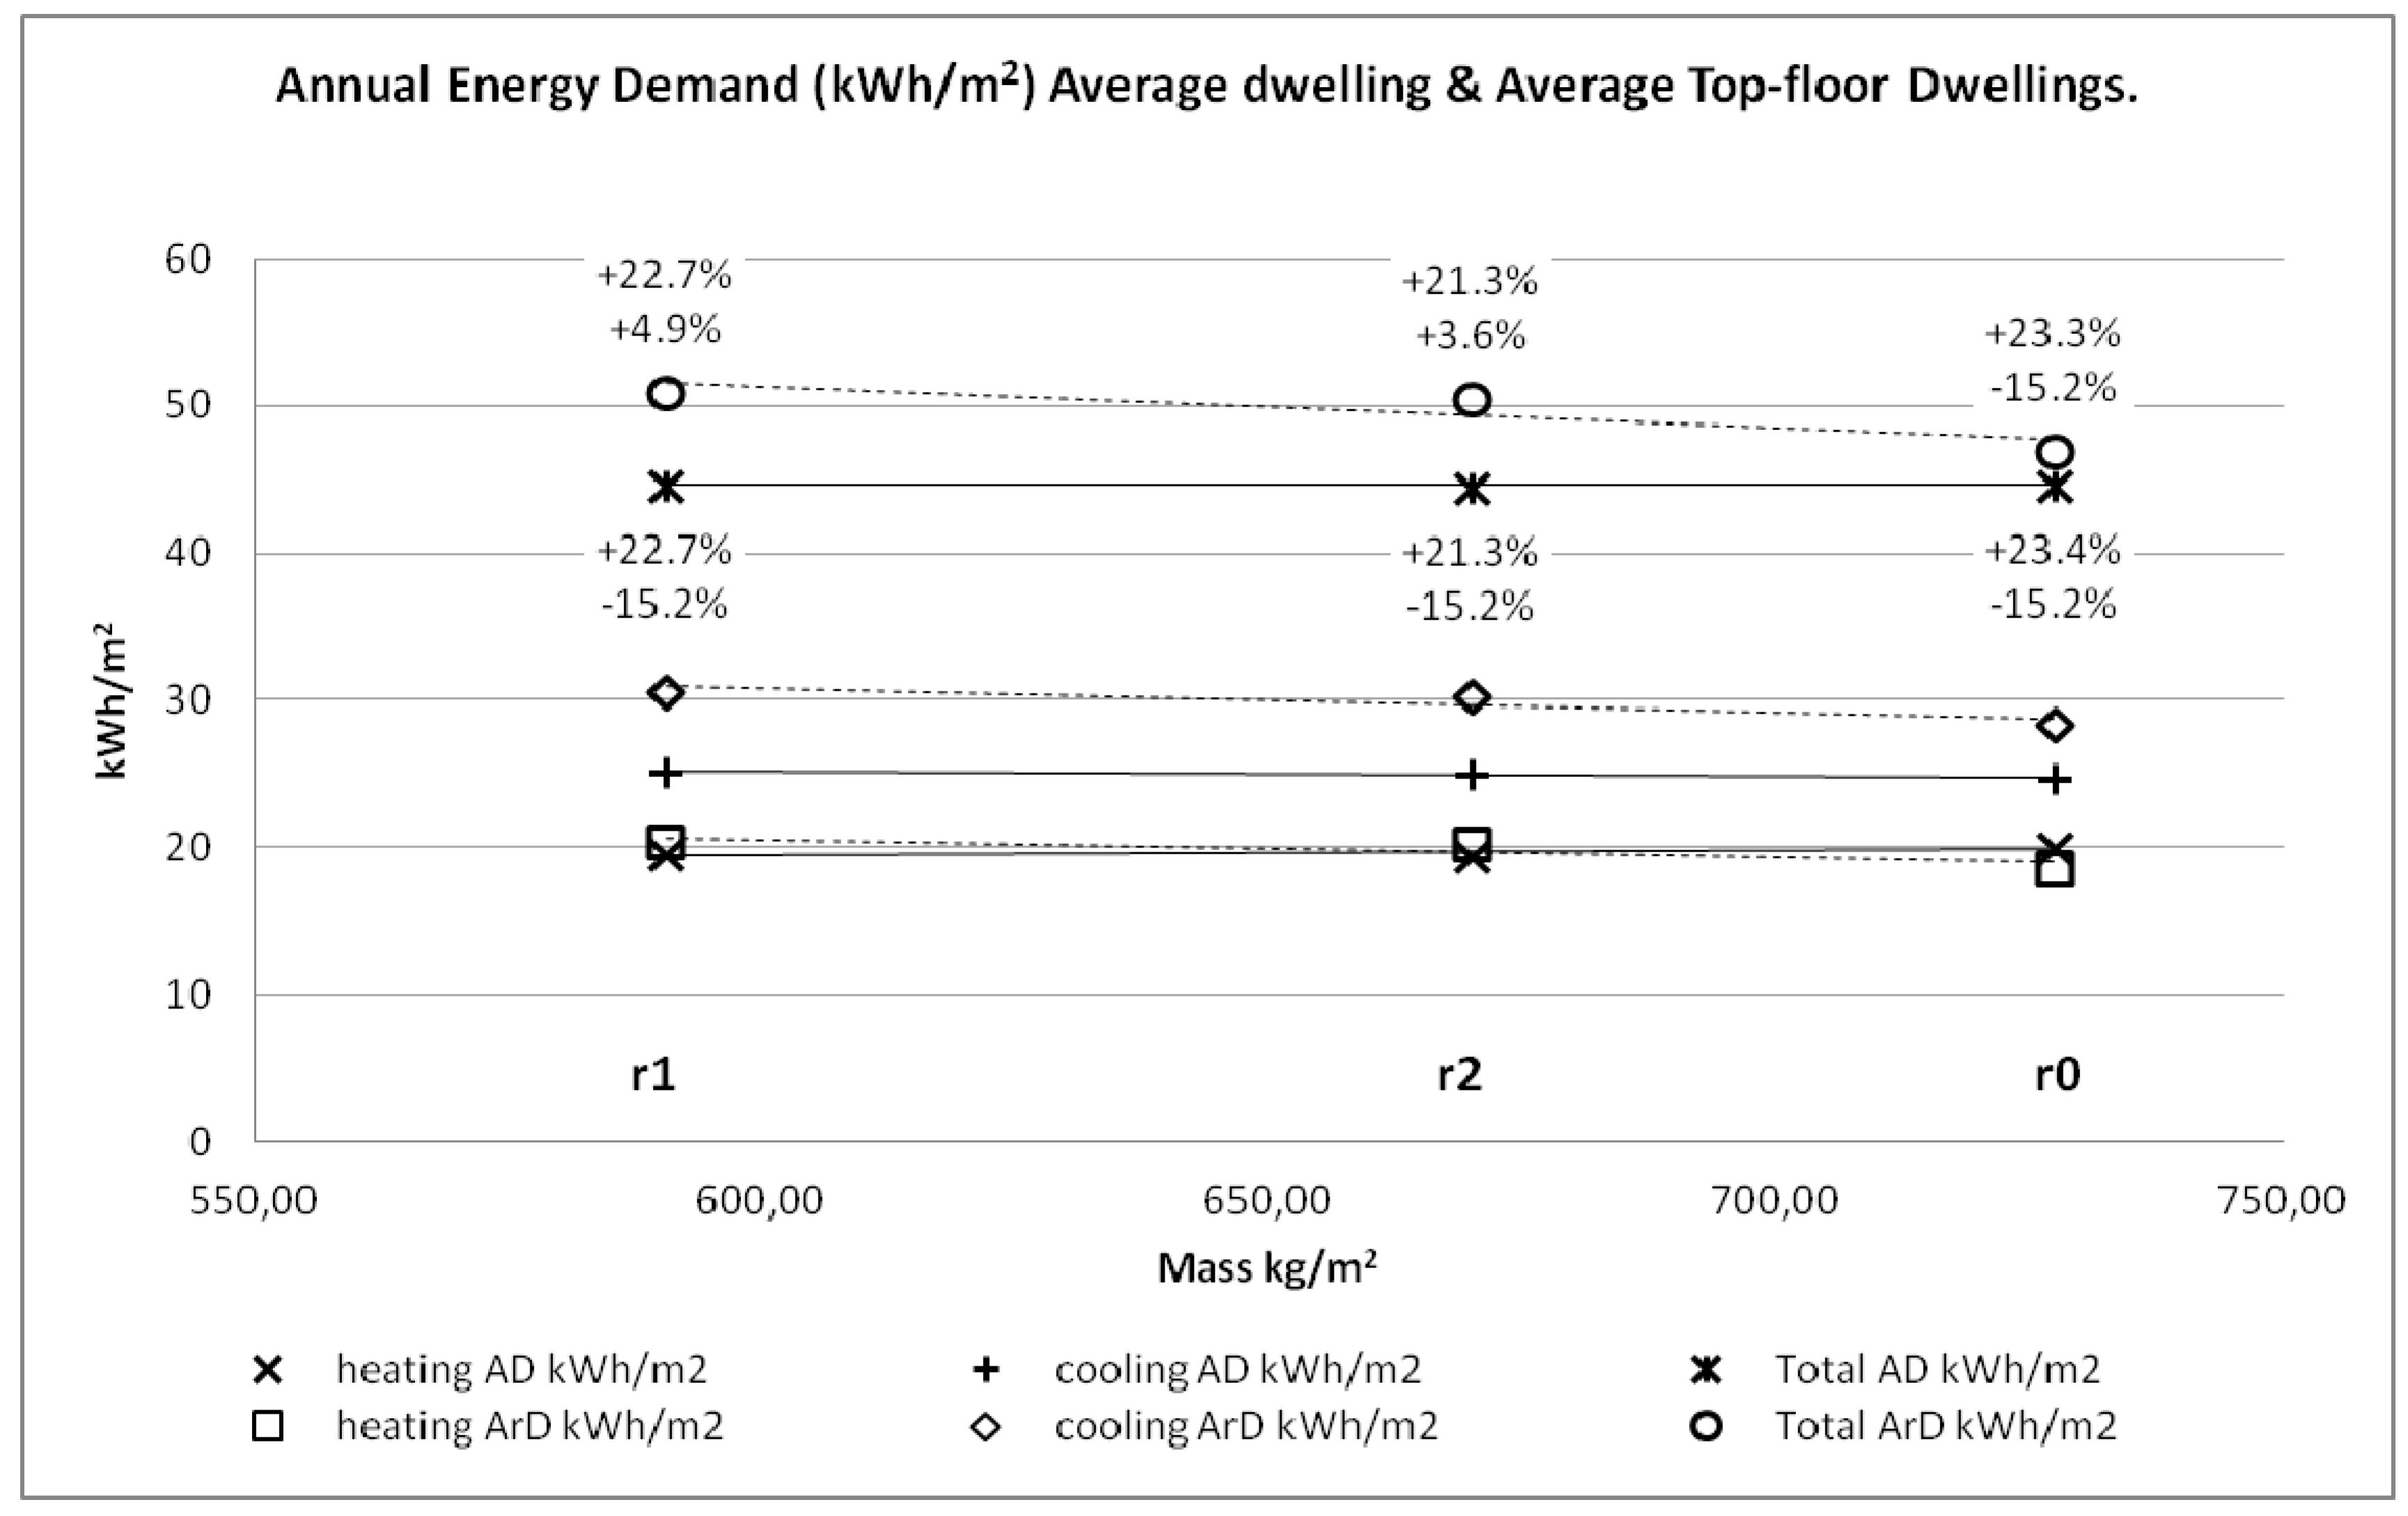
6.2. Roofs
| Name | Construction description | U value [W/m2K] | Mass [kg/m2] |
|---|---|---|---|
| r0 | non-ventilated inverted flat roof, 4 cm XPS | 0.45 | 727.50 |
| r1 | ventilated flat roof, 5 cm MW | 0.45 | 590.50 |
| r2 | ventilated inverted flat roof with floating floor, 5 cm EPS | 0.45 | 670.00 |

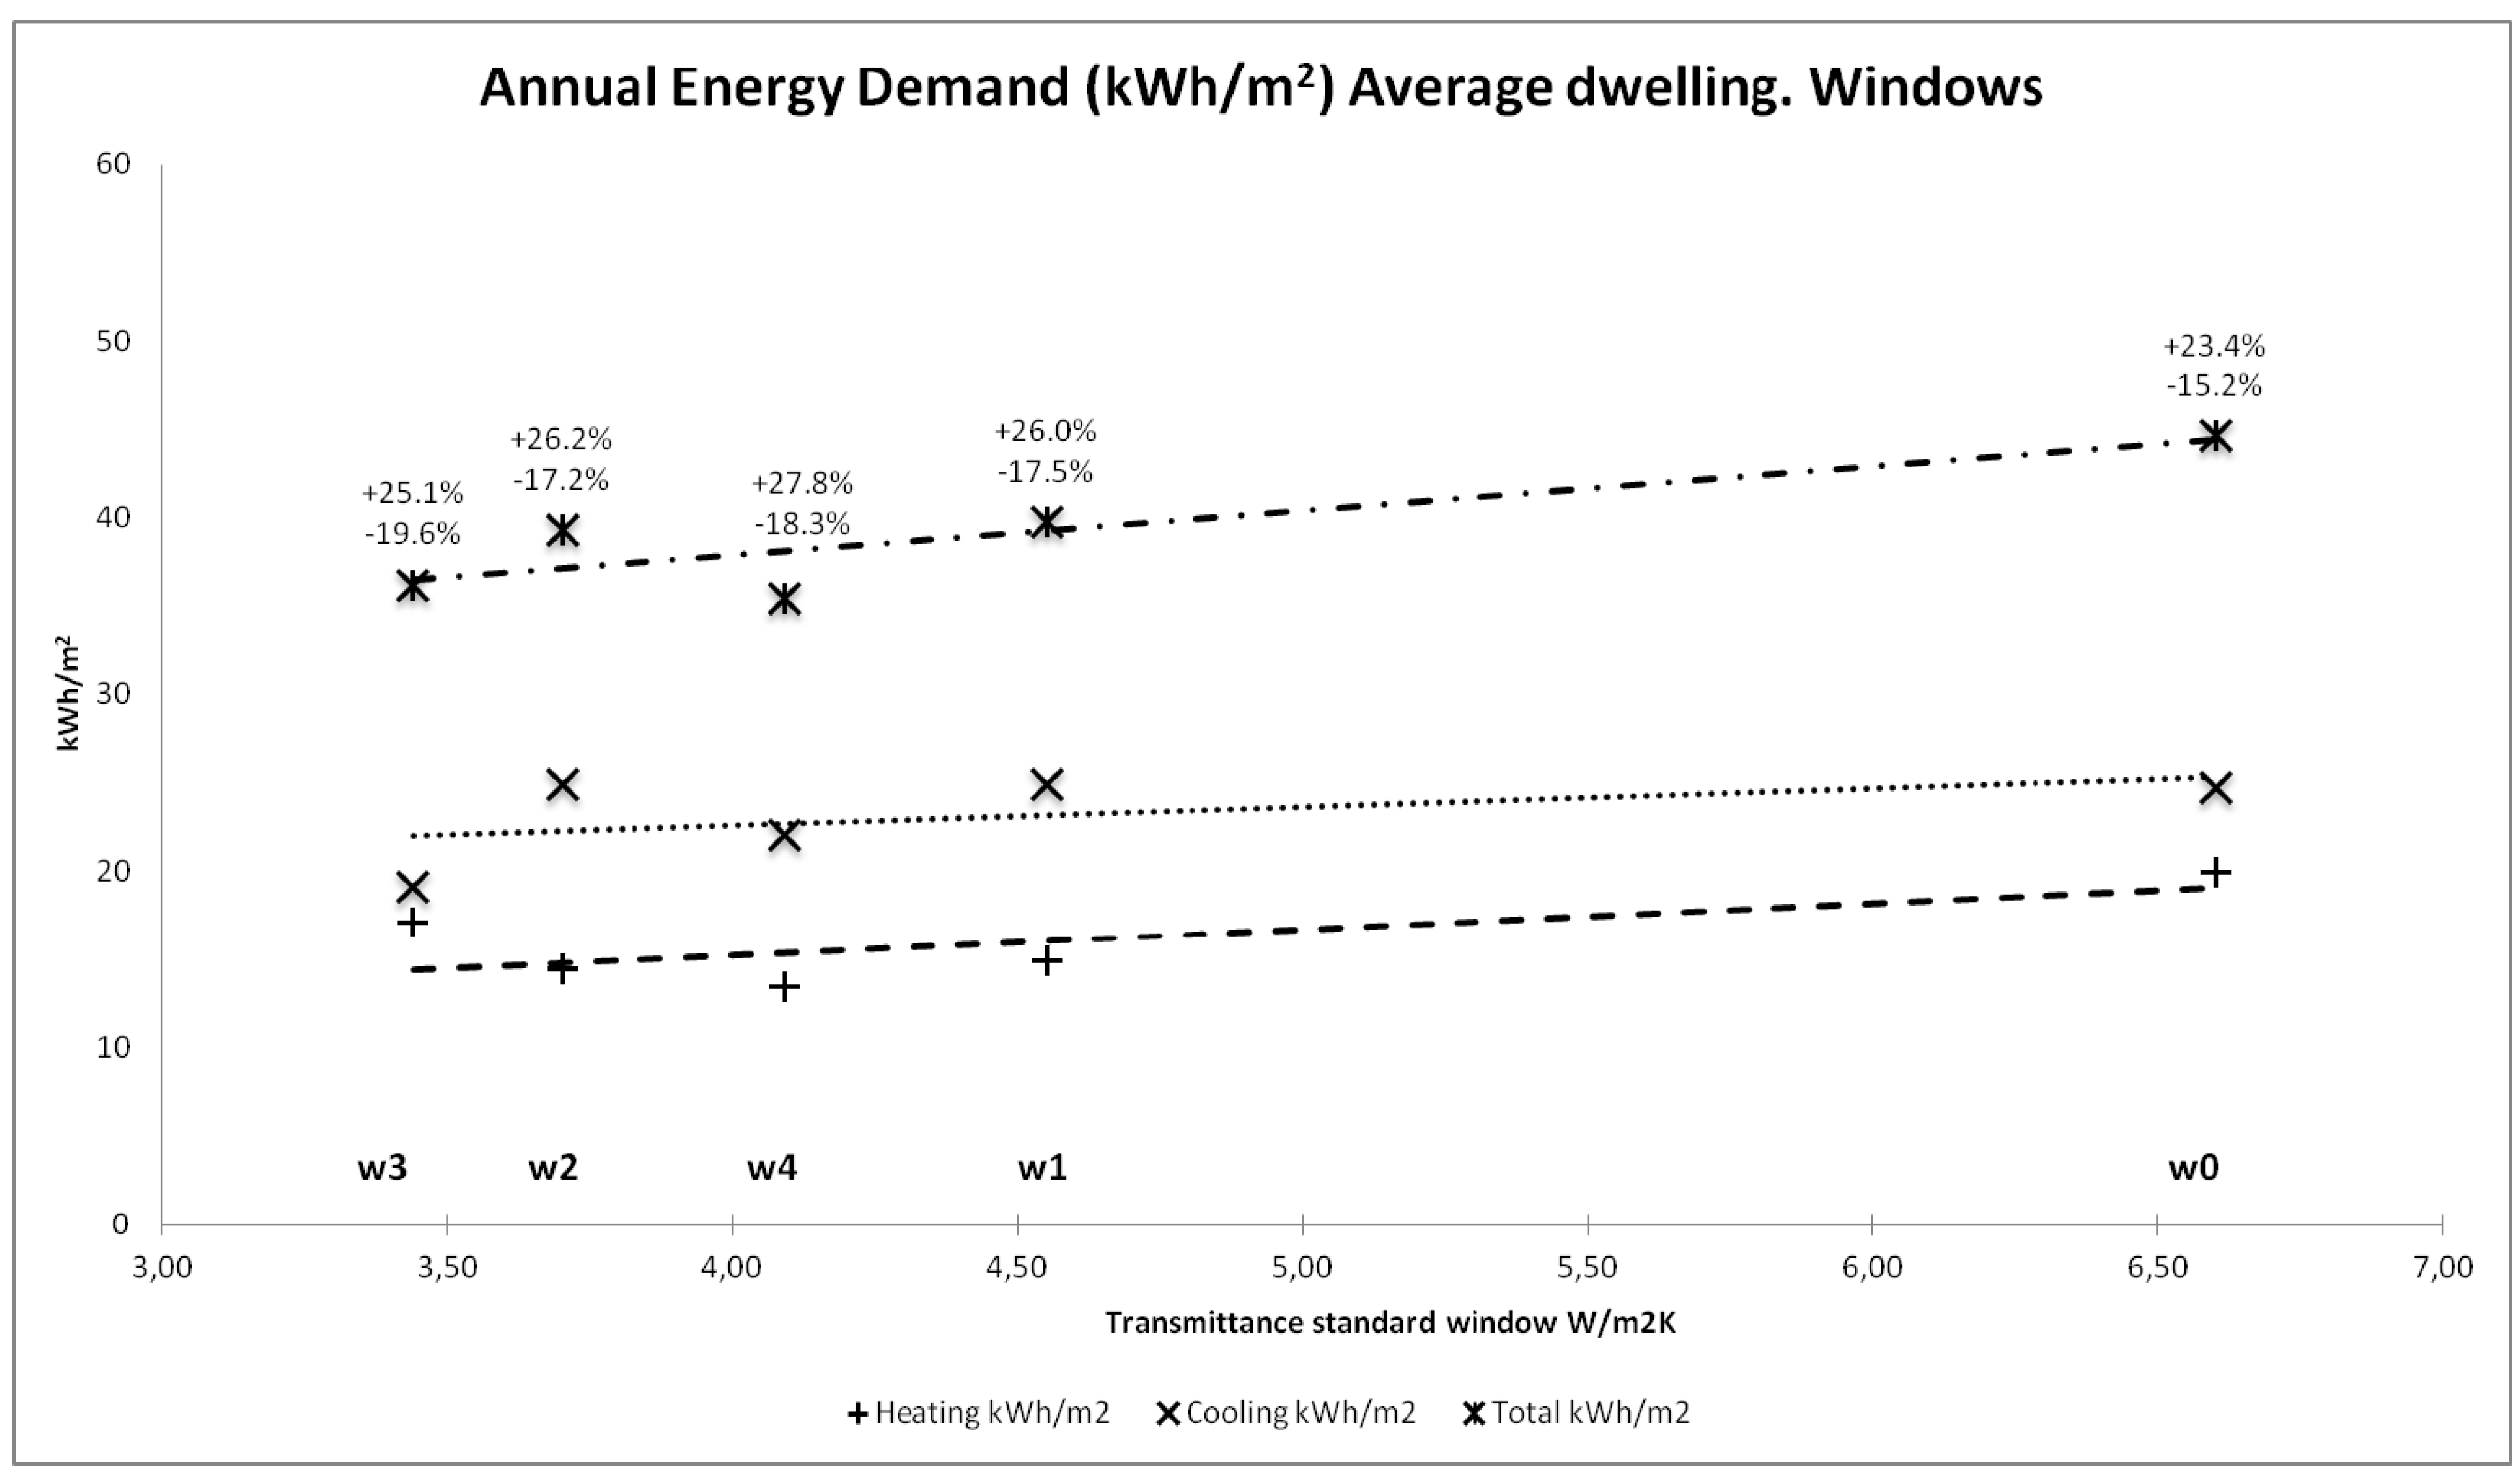
6.3. Windows
| Name | Construction description |
|---|---|
| w0 | 6 mm single glazing, metallic frame without thermal break (window in its original state) |
| w1 | 4-6-4 glazing, metallic frame without thermal break |
| w2 | 4-6-4 glazing, metallic frame with thermal break |
| w3 | 4-6-4 glazing, low-E metallic frame without thermal break. Low exterior emissivity |
| w4 | window 0 + window 1, 10 cm cavity gap |
| Type of window | w1 | w2 | w3 | w4 | ||||
|---|---|---|---|---|---|---|---|---|
| U value [W/m2K] | SHGC (glazing) | U value [W/m2K] | SHGC (glazing) | U value [W/m2K] | SHGC (glazing) | U value [W/m2K] | SHGC (glazing) | |
| Standard | 4.55 | 0.79 | 3.70 | 0.79 | 3.44 | 0.46 | 4.09 | 0.66 |
| Lounge | 4.31 | 0.79 | 3.60 | 0.79 | 3.13 | 0.46 | 3.90 | 0.66 |
| Terrace | 4.27 | 0.79 | 3.58 | 0.79 | 3.07 | 0.46 | 3.85 | 0.66 |
| Laundry 1 | 4.61 | 0.79 | 3.68 | 0.79 | 3.47 | 0.46 | 4.23 | 0.66 |
| Laundry 2 | 4.84 | 0.79 | 3.77 | 0.79 | 3.75 | 0.46 | 4.45 | 0.66 |
| Stairs | 5.24 | 0.79 | 3.92 | 0.79 | 4.26 | 0.46 | 4.82 | 0.66 |

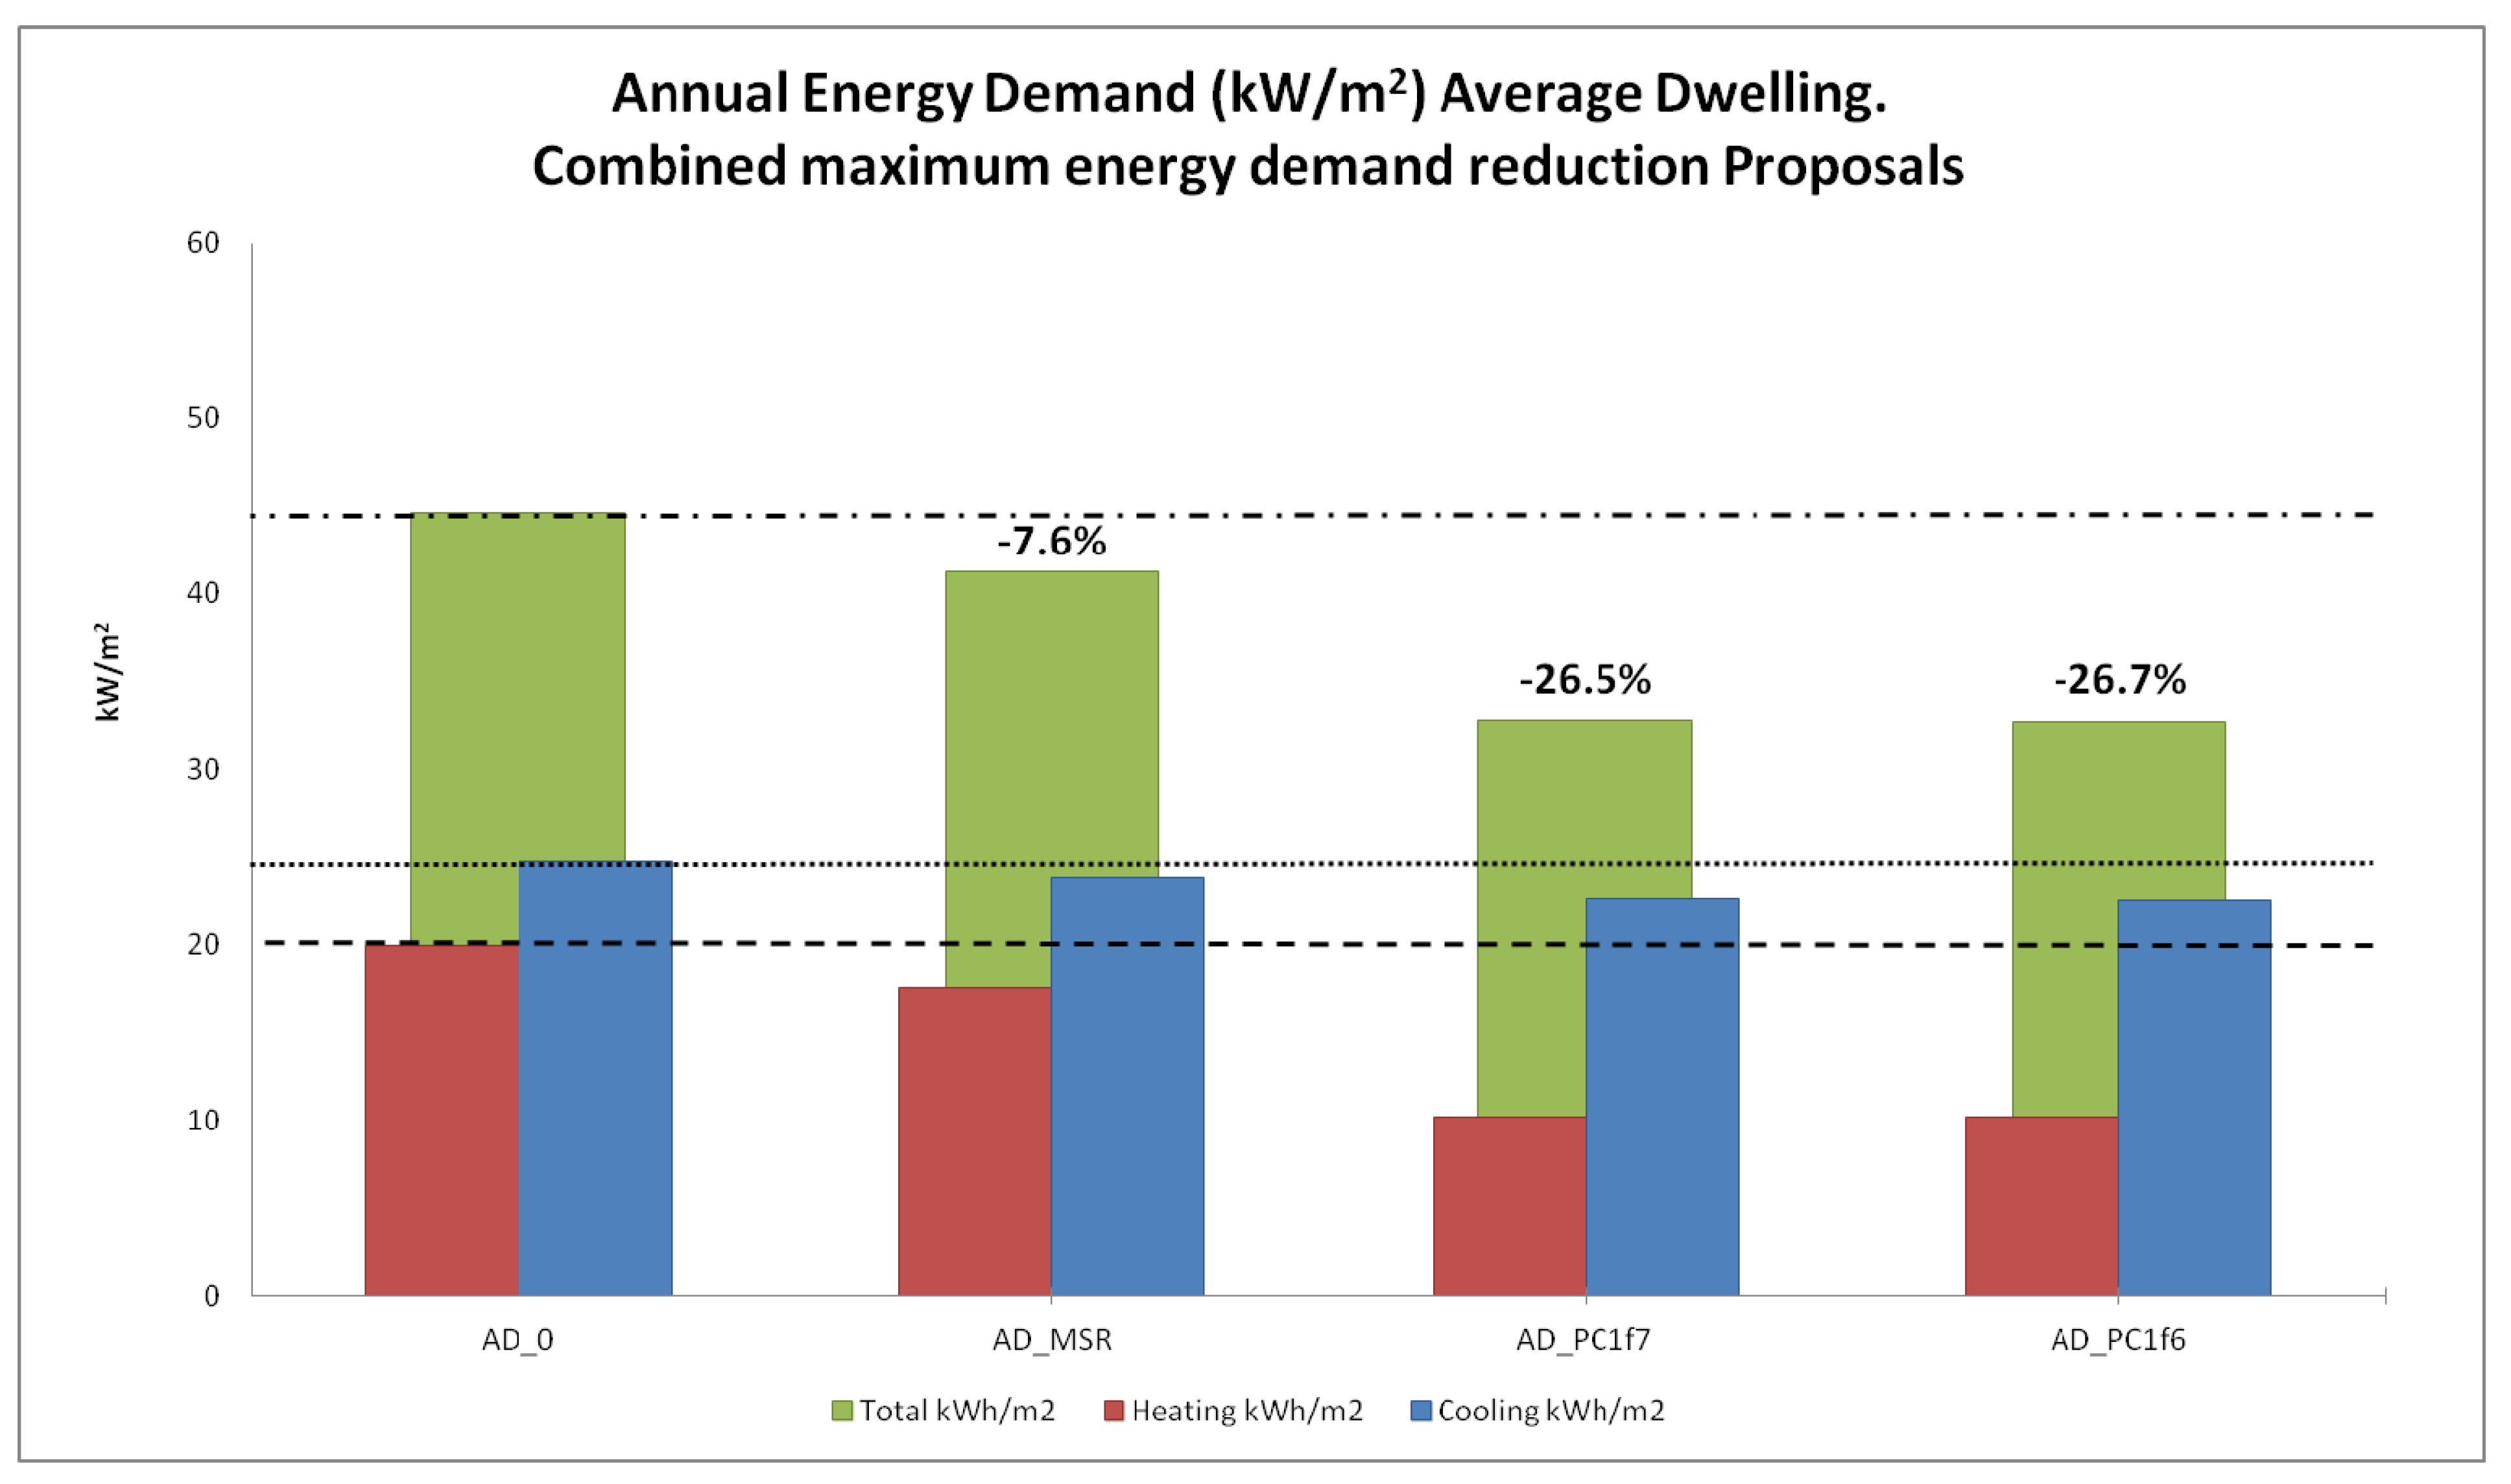
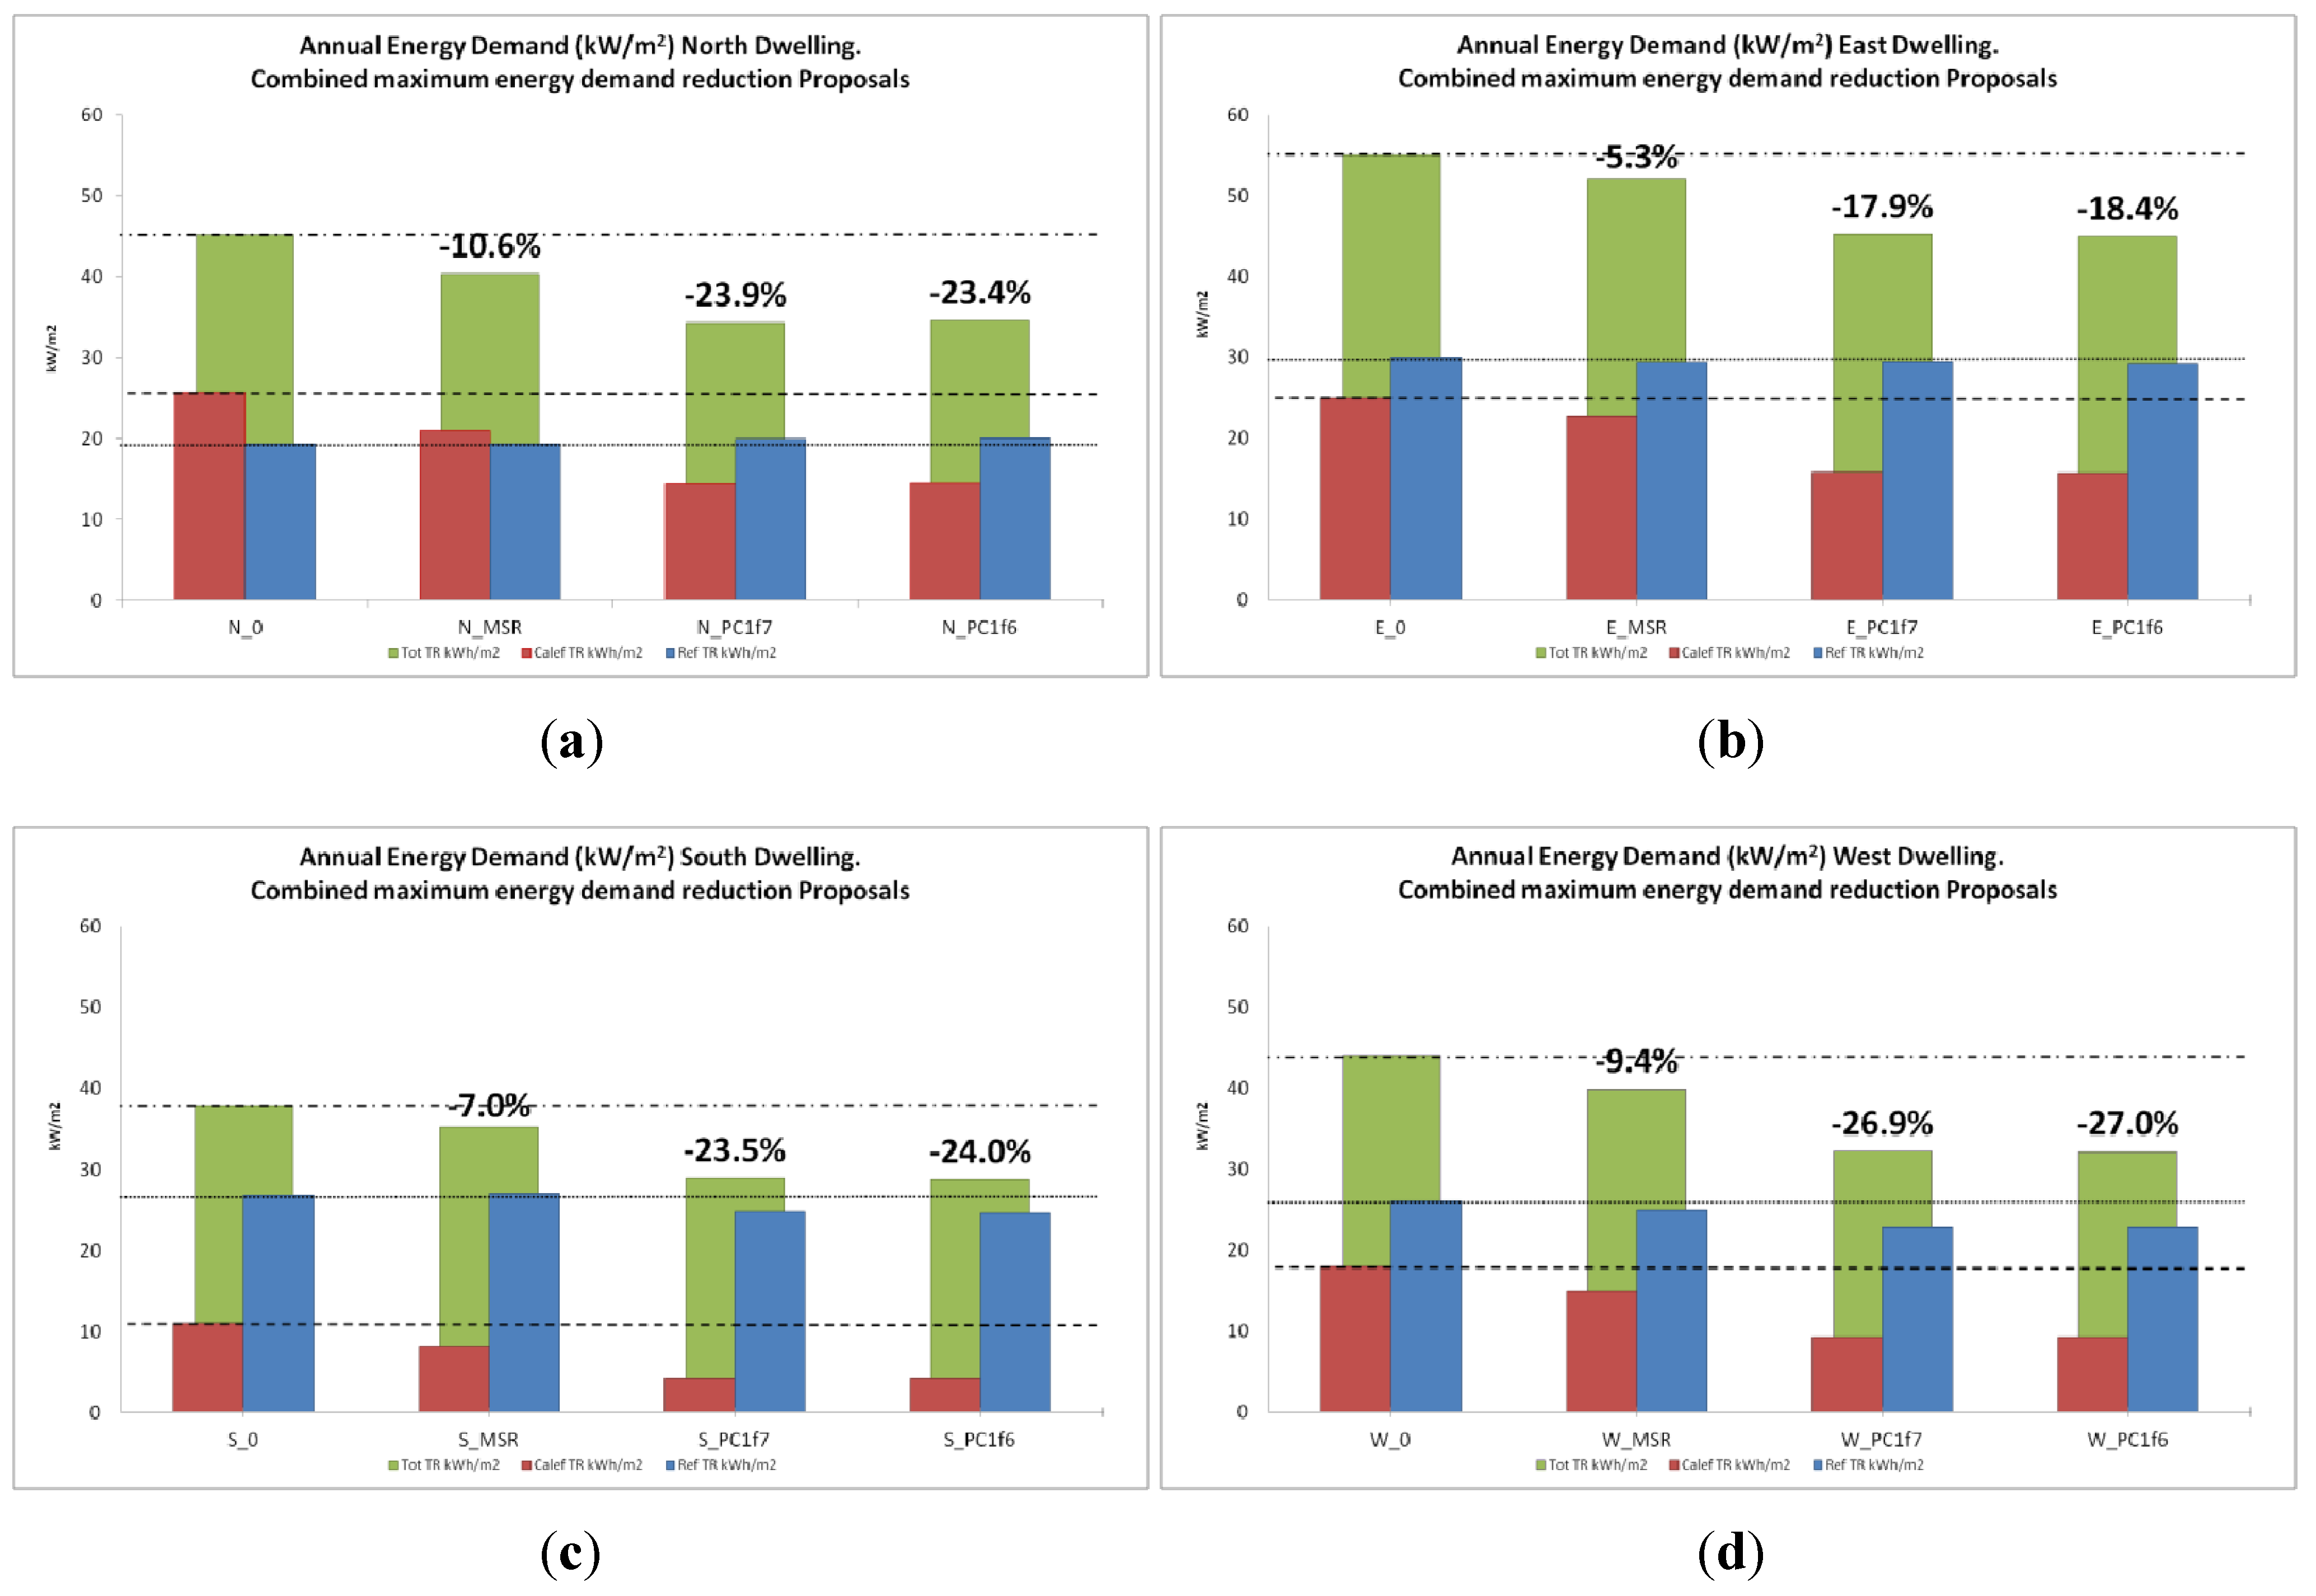
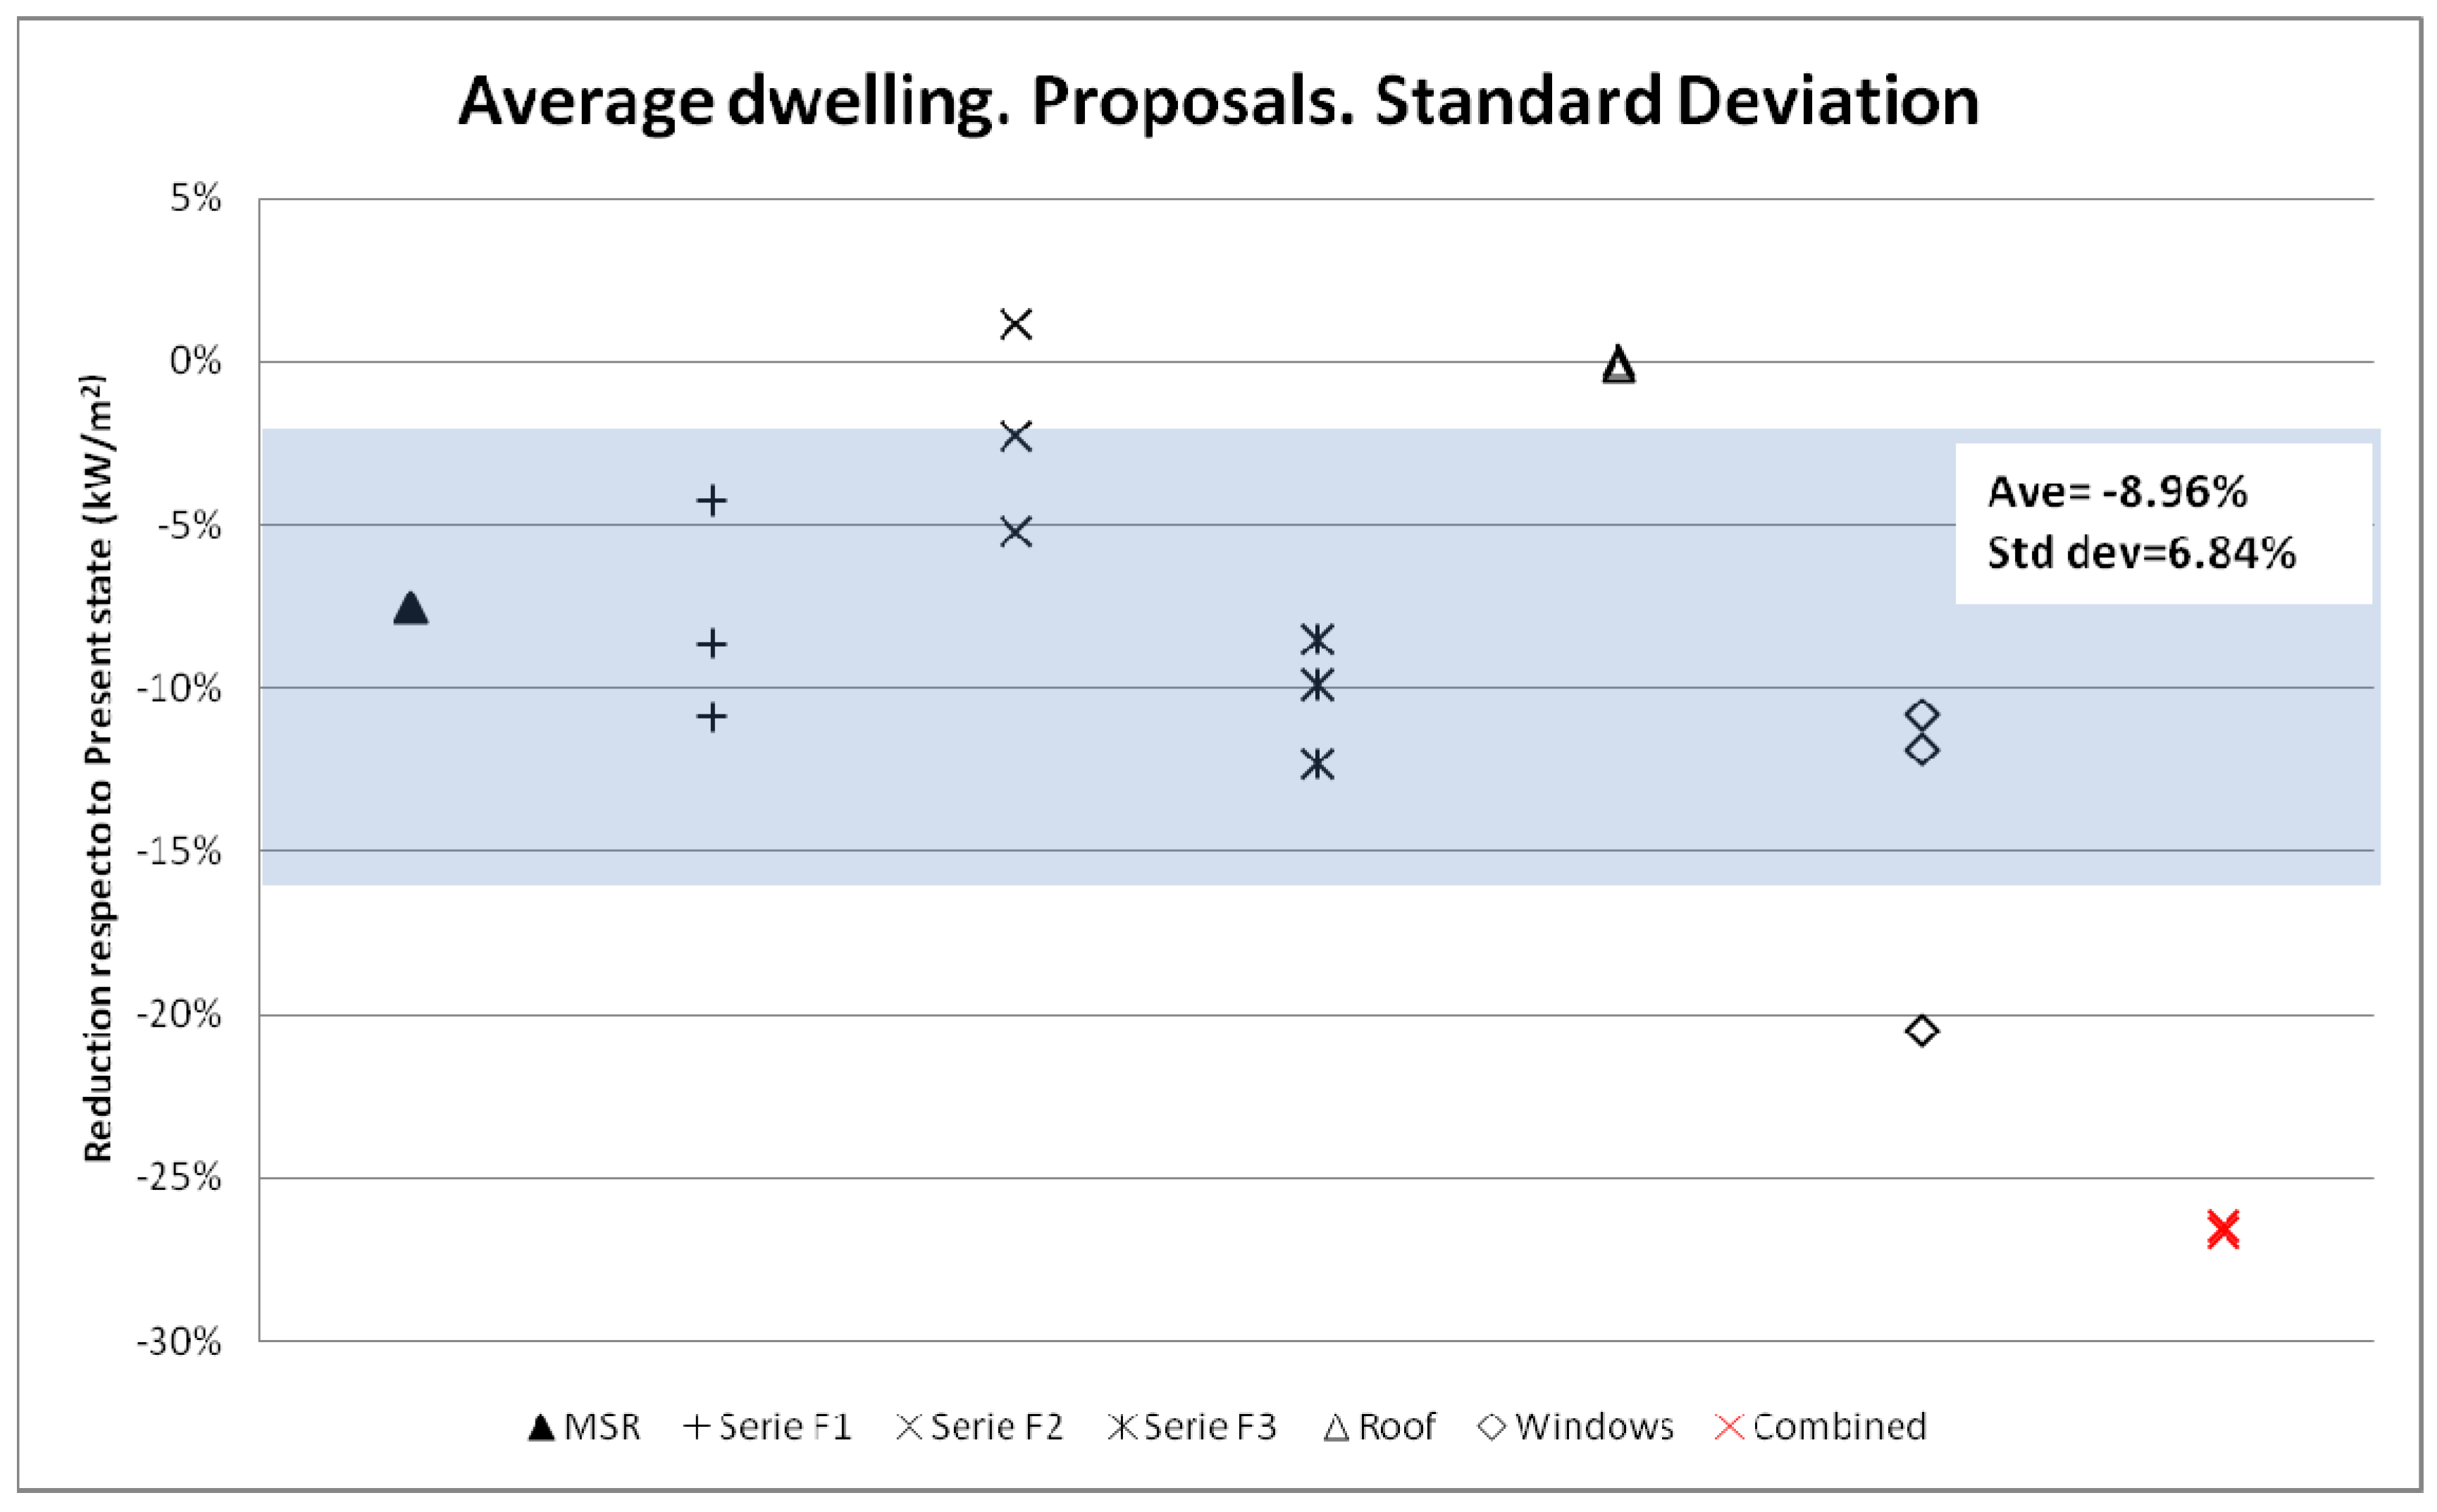
7. Combination of Proposals of Smaller Energy Demand
| Name | Construction solution | U [W/m2K] | Mass [kg/m2] |
|---|---|---|---|
| Combination 1 | |||
| Façade F3f7 | 0.38 | 178.18 | |
| Roof r1 | 0.45 | 590.50 | |
| Combination 2 | |||
| Façade F3f6 | 0.38 | 237.43 | |
| Roof r1 | 0.45 | 590.50 | |
| Window type | w4 | |
|---|---|---|
| U value [W/m2K] | SHGC (glazing) | |
| Standard | 4.09 | 0.66 |
| Lounge | 3.90 | 0.66 |
| Terrace | 3.85 | 0.66 |
| Laundry 1 | 4.23 | 0.66 |
| Laundry 2 | 4.45 | 0.66 |
| Stairs | 4.82 | 0.66 |


8. Conclusions
- Thermal parameters of the windows:
- R value of the glazing.
- Improvement of the frame material (with a thermal break).
- Construction composition of the opaque solutions for façades. Thermal transmittance:
- Thickness of the insulation.
- In façades of high U value, masses contribute an improvement.
- Construction composition of the solution for the opaque envelope. Roofs. Thermal transmittance:
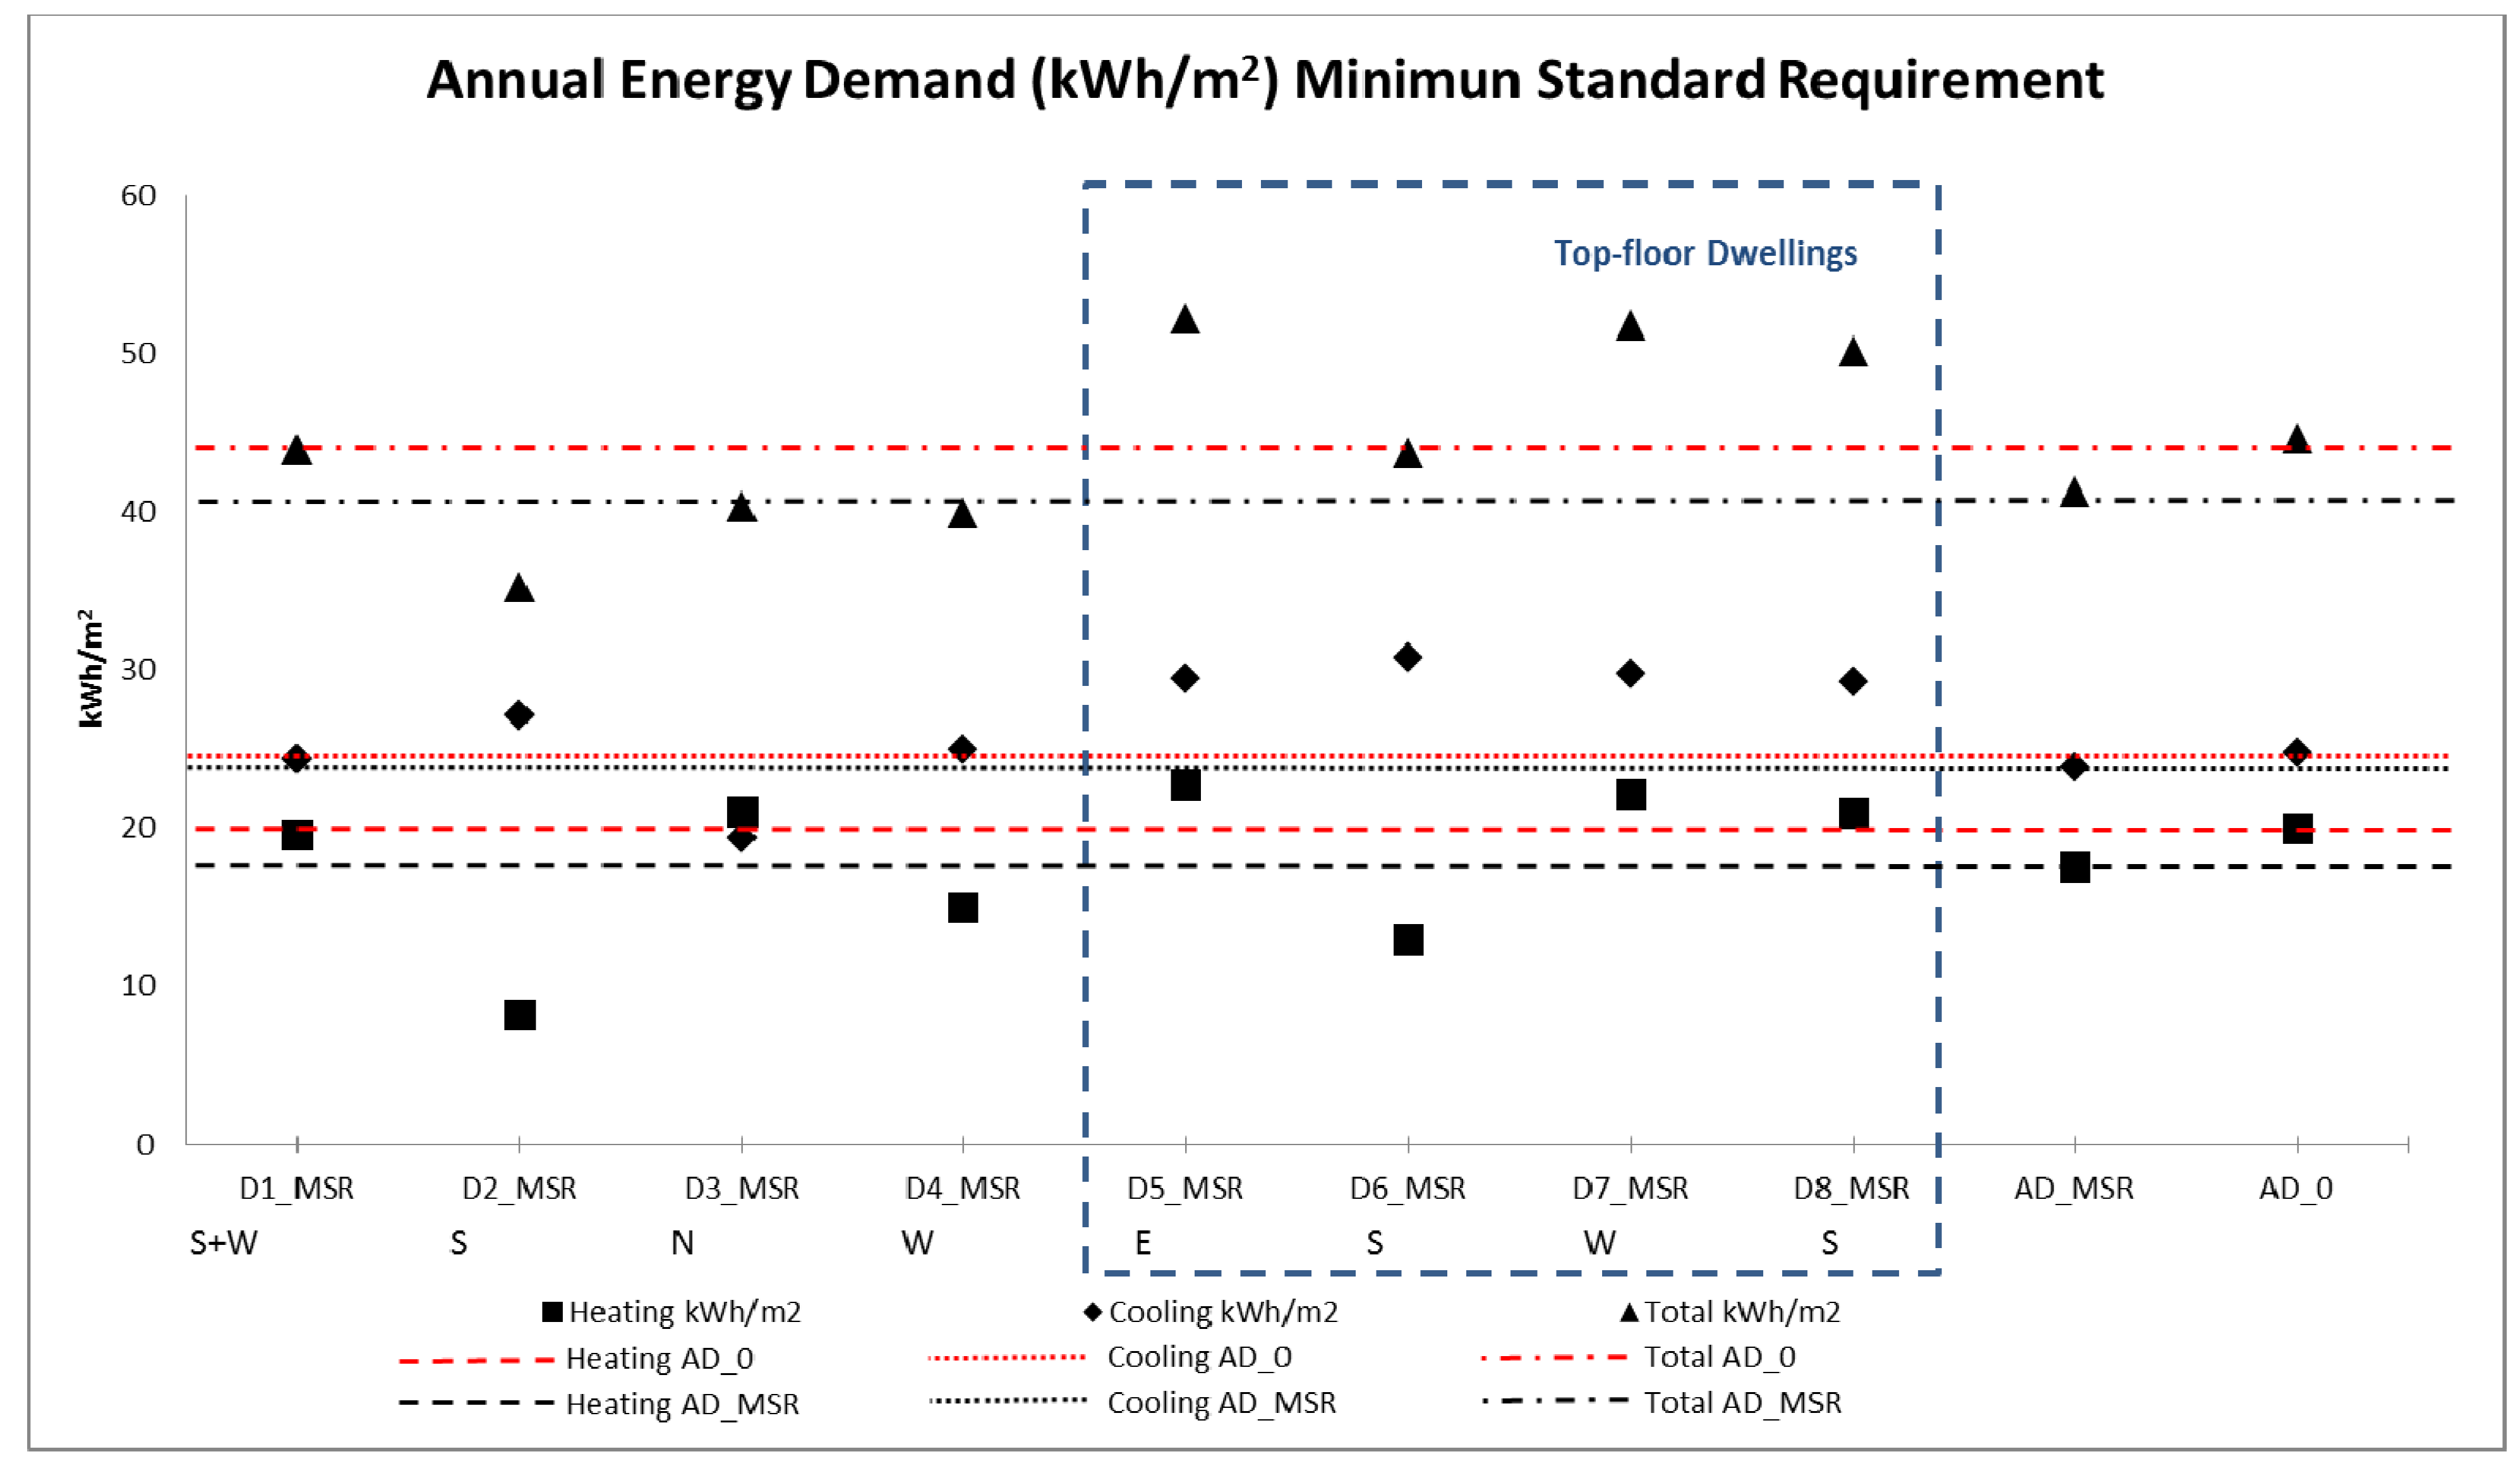
- Only significant for the dwellings on the top floor.
Acknowledgements
References
- Ryan, E.M.; Sanquist, T.F. Validation of building energy modeling tools under idealized and realistic conditions. Energy Build. 2012, 47, 375–382. [Google Scholar] [CrossRef]
- Instituto para la Diversificación y el Ahorro de la Energía. Proyecto SECH-SPAHOUSEC. Análisis del Consumo Energético del Sector Residencial en España. Informe Final, 1st ed.; IDAE: Madrid, Spain, 2011. [Google Scholar]
- Sendra, J.J.; Domínguez, S.; León, A.L.; Navarro, J.; Muñoz, S.; León, J.; Bustamante, P.; García, J.; Barrera, M.; Gentil, M.; Caro, J. Proyecto Efficacia: Optimización Energética en la Vivienda Colectiva, 1st ed.; Universidad de Sevilla, EMVISESA and SODINUR: Sevilla, Spain, 2011. [Google Scholar]
- Suárez, R.; Fernández-Agüera, J. Retrofitting of Energy Habitability in Social Housing: A Case Study in a Mediterranean Climate. Buildings 2011, 1, 4–15. [Google Scholar] [CrossRef]
- Jaber, S.; Ajib, S. Optimum, technical and energy efficiency design of residential building in Mediterranean region. Energy Build. 2011, 43, 1829–1834. [Google Scholar] [CrossRef]
- Lai, C.M.; Lin, Y.P. Energy Saving Evaluation of the Ventilated BIPV Walls. Energies 2011, 4, 948–959. [Google Scholar] [CrossRef]
- Ekici, B.B.; Gulten, A.A.; Aksoy, U.T. A study on the optimum insulation thicknesses of various types of external walls with respect to different materials, fuels and climate zones in Turkey. Appl. Energy 2012, 92, 211–217. [Google Scholar] [CrossRef]
- Friess, W.A.; Rakhshan, K.; Hendawi, T.A.; Tajerzadeh, S. Wall insulation measures for residential villas in Dubai: A case study in energy efficiency. Energy Build. 2012, 44, 26–32. [Google Scholar] [CrossRef]
- Jaffal, I.; Ouldboukhitine, S.E.; Belarbi, R. A comprehensive study of the impact of green roofs on building energy performance. Renew. Energy 2012, 43, 157–164. [Google Scholar] [CrossRef]
- Belusko, M.; Bruno, F.; Saman, W. Investigation of the thermal resistance of timber attic spaces with reflective foil and bulk insulation, heat flow up. Appl. Energy 2011, 88, 127–137. [Google Scholar] [CrossRef]
- Kuhn, T.E.; Herkel, S.; Frontini, F.; Strachan, P.; Kokogiannakis, G. Solar control: A general method for modelling of solar gains through complex facades in building simulation programs. Energy Build. 2011, 43, 19–27. [Google Scholar] [CrossRef]
- Freire, R.Z.; Mazuroski, W.; Abadie, M.O.; Mendes, N. Capacitive effect on the heat transfer through building glazing systems. Appl. Energy 2011, 88, 4310–4319. [Google Scholar] [CrossRef]
- Dall’O’, G.; Galante, A.; Pasetti, G. A methodology for evaluating the potential energy savings of retrofitting residential building stocks. Sustain. Cities Soc. 2012, 4, 12–21. [Google Scholar] [CrossRef]
- Konstantinou, T.; Knaack, U. Refurbishment of Residential Buildings: A Design Approach to Energy-Efficiency Upgrades. Procedia Eng. 2011, 21, 666–675. [Google Scholar] [CrossRef]
- Sadineni, S.B.; Madala, S.; Boehm, R.F. Passive building energy savings: A review of building envelope components. Renew. Sustain. Energy Rev. 2011, 15, 3617–3631. [Google Scholar] [CrossRef]
- Leon, A.L.; Munoz, S.; Leon, J.; Bustamante, P. Monitoring environmental and energy variables in the construction of subsidised housing: Cros-Pirotecnia building in Sevilla. Inf. Constr. 2010, 62, 67–82. [Google Scholar] [CrossRef]
- Crawley, D.B.; Hand, J.W.; Kummert, M.; Griffith, B.T. Contrasting the capabilities of building energy performance simulation programs. Build. Environ. 2008, 43, 661–673. [Google Scholar] [CrossRef]
- de la Flor, F.J.S.; Domínguez, S.A.; Félix, J.L.M.; Falcón, R.G. Climatic zoning and its application to Spanish building energy performance regulations. Energy Build. 2008, 40, 1984–1990. [Google Scholar] [CrossRef]
- Ministerio de Industria, Turismo y Comercio. Condiciones de Aceptación de Procedimientos Alternativos a LIDER y CALENER, 1st ed.; IDAE: Madrid, Spain, 2009. [Google Scholar]
Appendix
| Element | Name | Construction description | U value W/m2K | Mass kg/m2 | |
|---|---|---|---|---|---|
| Façade | f0 |  | 0.115 m Brick masonry 0.015 m Cement mortar 0.020 m Polyurethane (0.032W/mK) 0.100 m Non-ventilated air gap 0.015 m Plasterboard Total thickness: 0.265 m | 0.82 | 175.97 |
| Roof | r0 |  | 0.050 m Gravel 0.040 m Extruded polystyrene foam (0.025 W/mK) 0.015 m Cement mortar 0.100 m Concrete lightweight 0.300 m Waffle slab 0.020 m Plaster Total thickness: 0.525 m | 0.45 | 727.50 |
| Dividing Wall | Dw0 |  | 0.020 m Plaster 0.140 m Ceramic block 0.020 m Plaster Total thickness: 0.180 m | 1.30 | 188.80 |
| Partition | Pt0 |  | 0.015 m Plasterboard 0.050 m Non-ventilated air gap 0.015 m Plasterboard Total thickness: 0.080 m | 1.79 | 24.81 |
| Floor | Fl0 |  | 0.030 m Stone floor tiles 0.015 m Cement mortar 0.050 m Sand 0.300 m Waffle slab 0.020 m Plaster Total thickness: 0.380 m | 1.77 | 518.75 |
| Element | Name | Construction description | U value W/m2K | Mass kg/m2 |
|---|---|---|---|---|
| Façade | f_MSR | 0.115 m Brick masonry 0.030 m Cement mortar 0.010 m Polyurethane, (0.032W/mK) 0.100 m Non-ventilated air gap 0.020 m Plasterboard Total thickness: 0.275 m | 1.05 | 208.22 |
| Roof | r_MSR | 0.060 m Gravel 0.031 m Extruded polystyrene foam, (0.025 W/mK) 0.015 m Cement mortar 0.015 m Concrete Lightweight 0.300 m Waffle slab 0.020 m Plaster Total thickness: 0.441 m | 0.58 | 585.05 |
| Dividing Wall | Dw_MSR | 0.026 m Double-Plasterboard 0.140 m Ceramic block 0.010 m Non-ventilated air gap 0.013 m Rock wool (0.040 W/mK) 0.026 m Double-Plasterboard Total thickness: 0.075 m | 1.18 | 32.18 |
| Partition | Pt_MSR | 0.015 m Plasterboard 0.023 m Rock wool (0.040 W/mK) 0.015 m Plasterboard Total thickness: 0.053 m | 1.17 | 25.90 |
| Floor | Fl_MSR | 0.030 m Stone floor tiles 0.050 m Cement mortar 0.005 m Cross-linked polyethylene 0.300 m Waffle slab 0.020 m Plaster Total thickness: 0.405 m | 2.00 | 569.25 |
| Name | Construction description | Serie F1 Layer width | Serie F2 Layer width | Serie F3 Layer width | |
|---|---|---|---|---|---|
| f0 | 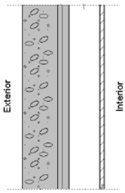 | Brick masonry Cement mortar Polyurethane (0.032 W/mK) Non-ventilated air gap Plasterboard | 0.115 m 0.015 m 0.020 m 0.100 m 0.015 m | 0.115 m 0.015 m 0.020 m 0.100 m 0.015 m | 0.115 m 0.015 m 0.064 m 0.100 m 0.015 m |
| f1 | 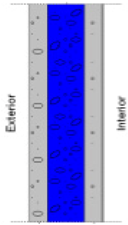 | Concrete Extruded polystyrene foam (0.037 W/mK) Concrete | 0.050 m 0.100 m 0.050 m | 0.050 m 0.038 m 0.050 m | 0.050 m 0.090 m 0.050 m |
| f2 | 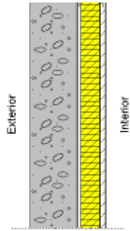 | Concrete Non-ventilated air gap Rock Wool (0.040 W/mK) Plasterboard | 0.120 m 0.010 m 0.050 m 0.015 m | 0.120 m 0.020 m 0.032 m 0.015 m | 0.120 m 0.010 m 0.080 m 0.015 m |
| f3 |  | Aluminium panel Well-ventilated air gap Rock Wool (0.040 W/mK) Stainless steel panel Non-ventilated air gap Rock Wool Plasterboard | 0.002 m 0.050 m 0.030 m 0.002 m 0.010 m 0.050 m 0.015 m | 0.002 m 0.050 m 0.011 m 0.002 m 0.010 m 0.010 m 0.010 m | 0.002 m 0.050 m 0.030 m 0.002 m 0.010 m 0.050 m 0.015 m |
| f4 | 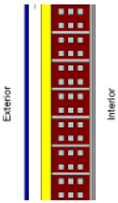 | Ceramic tiles Well-ventilated air gap Polyurethane (0.028 W/mK) Brick masonry Plasterboard | 0.010 m 0.040 m 0.030 m 0.115 m 0.015 m | 0.010 m 0.040 m 0.021 m 0.115 m 0.015 m | 0.010 m 0.040 m 0.060 m 0.115 m 0.015 m |
| f5 | 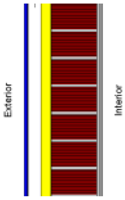 | Ceramic tiles Well-ventilated air gap Polyurethane (0.028 W/mK) Ceramic block Plasterboard | 0.010 m 0.040 m 0.030 m 0.140 m 0.015 m | 0.010 m 0.040 m 0.014 m 0.140 m 0.015 m | 0.010 m 0.040 m 0.053 m 0.140 m 0.015 m |
| f6 | 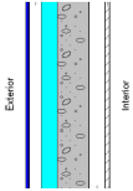 | Ceramic tiles Well-ventilated air gap Extruded polystyrene foam (0.029 W/mK) Concrete Non-ventilated air gap Plasterboard | 0.010 m 0.040 m 0.050 m 0.100 m 0.050 m 0.015 m | 0.010 m 0.040 m 0.020 m 0.100 m 0.050 m 0.015 m | 0.010 m 0.040 m 0.062 m 0.100 m 0.050 m 0.015 m |
| f7 | 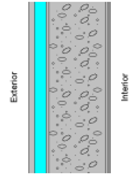 | Cement mortar Extruded polystyrene foam (0.029 W/mK) Cement mortar Ceramic block Plaster | 0.020 m 0.040 m 0.020 m 0.190 m 0.015 m | 0.020 m 0.011 m 0.010 m 0.190 m 0.015 m | 0.020 m 0.051 m 0.010 m 0.190 m 0.015 m |
| Name | Construction description | U valueW/m2K | Masskg/m2 | |
|---|---|---|---|---|
| r0 | 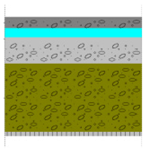 | 0.050 m Gravel 0.040 m Extruded polystyrene foam (0.025 W/mK) 0.015 m Cement mortar 0.100 m Concrete Lightweight 0.300 m Waffle slab 0.020 m Plaster Total thickness: 0.525 m | 0.45 | 727.50 |
| r1 |  | 0.020 m Ceramic floor tiles 0.015 m Cement mortar 0.040 m Brick masonry 0.200 m Light-ventilated air gap 0.050 m Rock wool (0.029 W/mK) 0.015 m Cement mortar 0.300 m Waffle slab 0.020 m Plaster Total thickness: 0.660 m | 0.45 | 590.50 |
| r2 |  | 0.020 m Ceramic floor tiles 0.100 m Light-ventilated air gap 0.050 m Extruded polystyrene foam (0.029 W/mK) 0.015 m Cement mortar 0.100 m Concrete Lightweight 0.300 m Waffle slab 0.020 m Plaster Total thickness: 0.585 m | 0.45 | 670.00 |
© 2012 by the authors; licensee MDPI, Basel, Switzerland. This article is an open access article distributed under the terms and conditions of the Creative Commons Attribution license (http://creativecommons.org/licenses/by/3.0/).
Share and Cite
Domínguez, S.; Sendra, J.J.; León, A.L.; Esquivias, P.M. Towards Energy Demand Reduction in Social Housing Buildings: Envelope System Optimization Strategies. Energies 2012, 5, 2263-2287. https://doi.org/10.3390/en5072263
Domínguez S, Sendra JJ, León AL, Esquivias PM. Towards Energy Demand Reduction in Social Housing Buildings: Envelope System Optimization Strategies. Energies. 2012; 5(7):2263-2287. https://doi.org/10.3390/en5072263
Chicago/Turabian StyleDomínguez, Samuel, Juan J. Sendra, Angel L. León, and Paula M. Esquivias. 2012. "Towards Energy Demand Reduction in Social Housing Buildings: Envelope System Optimization Strategies" Energies 5, no. 7: 2263-2287. https://doi.org/10.3390/en5072263
APA StyleDomínguez, S., Sendra, J. J., León, A. L., & Esquivias, P. M. (2012). Towards Energy Demand Reduction in Social Housing Buildings: Envelope System Optimization Strategies. Energies, 5(7), 2263-2287. https://doi.org/10.3390/en5072263