Article

Synthesis of Alcohols and Alkanes from CO and H2 over MoS2/γ-Al2O3 Catalyst in a Packed Bed with Continuous Flow

1
Graduate Institute of Environmental Engineering, National Taiwan University, 71, Chou-Shan Road, Taipei 106, Taiwan
2
Department of Environmental Engineering, National I-Lan University, I-Lan 260, Taiwan
3
Department of Chemical Engineering, National Taiwan University, 1, Section 4, Roosevelt Road, Taipei 106, Taiwan
4
Department of Environmental Science and Engineering, Tunghai University, Taichung 407, Taiwan
5
Department of Chemical Engineering and Biotechnology, National Taipei University of Technology, Taipei 106, Taiwan
*
Author to whom correspondence should be addressed.
Energies 2012, 5(10), 4147-4164; https://doi.org/10.3390/en5104147
Submission received: 25 August 2012 / Revised: 4 October 2012 / Accepted: 11 October 2012 / Published: 22 October 2012

Abstract

:
Effects of reaction conditions on the production of alcohols (AOHs) and alkanes (Alk) from CO and H2, which can be obtained from the gasification of biomass, using a molybdenum sulfide (MoS2)-based catalyst of MoS2/γ-Al2O3 were studied. A high-pressure fixed packed bed (HPFPB) was employed to carry out the reaction. The results indicate that the conversion of CO (XCO) and specific production rates of alcohol (SPRAOH) and alkane (SPRAlk) are highly depended on temperature (T). In T = 423–573 K, maximum yield of alcohols (YAOH) and SPRAOH occur at T = 523 K. In the meantime, well performance gives the selectivity of ethanol (SEtOH) of 52.0 C%. For the studies on varying H2/CO mole ratio (MH/C) from 1 to 4 at 523 K, the appropriate MH/C to produce EtOH is 2, giving higher ratios of SPRAOH/SPRAlk and YAOH/YAlk than those with other MH/C. As for varying the total gas flow rates (QG) of 300, 450, 600 to 900 cm3 min−1 tested at T = 523 K and MH/C = 2, the lower QG provides longer reaction time (or gaseous retention time, tR) thus offering higher XCO, however lower productivity. For setting pressure (PST) = 225–540 psi, a supply of higher pressure is equivalent to providing a larger amount of reactants into the reaction system, this thus suggests the use of higher PST should give both higher XCO and productivity. The assessment of the above results indicates that the MoS2/γ-Al2O3 catalyst favors the production of alcohols over alkanes, especially for ethanol. The information obtained is useful for the proper utilization of biomass derived gases of CO and H2.

1. Introduction

The energy crisis has been an issue of great concern in recent years. With the continued climbing crude oil price, utilization of alternative energy has become more and more essential. The use of biomass, such as agriculture residues and woody waste, to provide energy and chemicals is receiving increasing interest because these resources can supplement the existing supplies of raw energy materials while have less net environmental impact [1,2,3,4,5,6]. Thus, bio-energy has the potential to provide a significant share of the projected renewable energy requirement in the future. As an example, ethanol (EtOH) has been broadly utilized as a good additive for enhancing the gasoline octane value and burning efficiency [1,7].
In the hydrogenation of synthesis gas (syngas), previous studies have shown that ethanol can be produced from syngas over many metal-containing catalysts, broadly classified into four categories. These include Rh-based catalysts [8], modified high-temperature and low-temperature methanol synthesis catalysts based on ZnO/Cr2O3 and Cu/ZnO/Al2O3 [9], respectively, modified Fischer-Tropsch catalysts based on Co, Fe and Ru [10], and non-sulfide [11] and sulfide Mo-based catalysts [12,13,14]. Among these catalysts, molybdenum sulfide (MoS2) catalysts have attracted much interest because of their higher selectivity to alcohols and excellent resistance to poisoning from sulfur in the feed gas [15,16,17,18,19]. Previous studies also examined the effects of support on the Mo-based catalyst, indicating that the microstructures of MoS2 clusters on Al2O3 supports strongly affect the interaction between Mo oxide and alumina. The interaction is related to the high dispersion of Mo oxide, which leads to highly active structures [16,18].
In previous studies [2], various reaction conditions were also tested for the applications of different catalysts in order to demonstrate the feasibility for the hydrogenation of CO. Inoue et al. [20] studied the applicability of Rh catalyst reporting the activation energy result and indicating that the selectivity of methane increases at higher temperatures. Hu et al. [21] in a study concerning Rh catalyst described the mechanism of methane formation and pointed out that the reaction is very sensitive to temperature. Thus, the formation of methane becomes dominant at higher temperatures.
Besides the temperature factor, the H2/CO feed ratio is also a key adjustable variable affecting the conversion of syngas to ethanol or higher alcohols. Mazzocchia et al. [22] and Egbebi and Spivey [23] examined the effect of increasing H2/CO ratio (MH/C) on the formation of both EtOH and methane, showing that the selectivity for ethanol on Rh-based catalysts actually increases with increasing H2/CO ratio. Moreover, the H2/CO can be adjusted to maximize SEtOH and restrain methane formation. It is noted that methane is also a thermodynamically favorable product. However, its economical value is less than alcohols. The major formation reactions of ethanol and methane are as follows:
2CO (g) + 4H2 (g) → C2H5OH (g) + H2O (g)
ΔH0 298 = −253.6 kJ mol−1 and ΔG0 298 = −221.1 kJ mol−1 of ethanol.
CO (g) + 2H2 (g) → CH3OH (g)
ΔH0 298 = −90.5 kJ mol−1 and ΔG0 298 = −25.1 kJ mol−1 of methanol.
CH3OH (g) + CO (g) + 2H2 (g) → C2H5OH (g) + H2O (g)
ΔH0 298 = −165.1 kJ mol−1 and ΔG0 298 = −97.0 kJ mol−1 of ethanol.
CH3OH (g) + CO (g) → CH3COOH (g)
ΔH0 298 =−123.3 kJ mol−1 and ΔG0 298 = −77.0 kJ mol−1 of CH3COOH.
CH3COOH (g) + H2 (g) → C2H5OH (g)
ΔH0 298 = −41.7 kJ mol−1 and ΔG0 298 = −221.1 kJ mol−1 of ethanol.
CO (g) + 3H2 (g) → CH4 (g) + H2O (g)
ΔH0 298 = −205.9 kJ mol−1 and ΔG0 298 = −141.9 kJ mol−1 of methane.
The competition of the above reactions and other side reactions of hydrogenation of CO thus greatly affects the selectivities of products by the heats and free energies of the associated reactions.
Hu et al. [21] also reported the roles of gas hourly space velocity (GHSV) as well as temperature, revealing that a lower GHSV results in higher EtOH, while a lower temperature gives less methane. As for the effect of system pressure, Spivey and Egbebi [1] indicated that an increasing pressure increases the equilibrium concentration of EtOH from the hydrogenation of CO following Le Chatelier’s Principle.
In the hydrogenation of CO, molybdenum-based catalysts which have been also commonly used in the hydrogenation of petroleum have attracted much attention, especially alkali-modified catalysts. However, reports on the effects of operation conditions on the system performance employing MoS2/γ-Al2O3 catalyst, which can be easily made, have been scarce. Thus, in this study, the hydrogenation of CO over MoS2/γ-Al2O3 catalysts was practiced under various system conditions and examined concerning the production of alcohols and other hydrocarbons (HCs). The proper conditions to produce more alcohols, especially EtOH, with less methane were emphasized. Comparisons with the results using other catalyst were made to assess the corresponding effectiveness of hydrogenation of CO over various catalysts.

2. Experimental

2.1. Preparation of Catalysts

Mo-based catalysts were prepared employing the wet impregnation method. The catalyst support is γ-Al2O3 pellets (55.5 Å average pore diameter, 4 mm spherical pellet, 4–12 mesh), supplied by BDH Chemicals Ltd. (Poole, UK). It possesses a Brunauer-Emmett-Teller (BET) surface area of 280.46 m2 g−1. The γ-Al2O3 support was pre-calcined in air at 900 °C to avoid any structural changes during the following high-temperature calcination for the preparation of catalyst. About 50 g dried γ-Al2O3 was impregnated with 100 mL of 5 wt.% aqueous solution of ammonium heptamolybdate [(NH4)6Mo7O24∙4H2O], supplied by J.T. Baker (Phillipsburg, NJ, USA). The pH of the solution was controlled at 2.0 by adding nitric acid so as to avoid the overloading of the molybdenum. After being dried at 105 °C for 24 h, the sample was calcined at 500 °C for 6 h. The catalyst at this stage was denoted as MoXOY/γ-Al2O3. The resulted MoXOY/γ-Al2O3 was further reduced and sulfurized in the mixed gas stream of H2S/H2 with volume ratio of 5/95 at 673 K for 2 h to produce MoS2/γ-Al2O3 catalyst. The molybdenum content in the final sample is about 34 mg g−1. The above preparation procedures of catalyst are common, and the method is widely used because of its effectiveness.

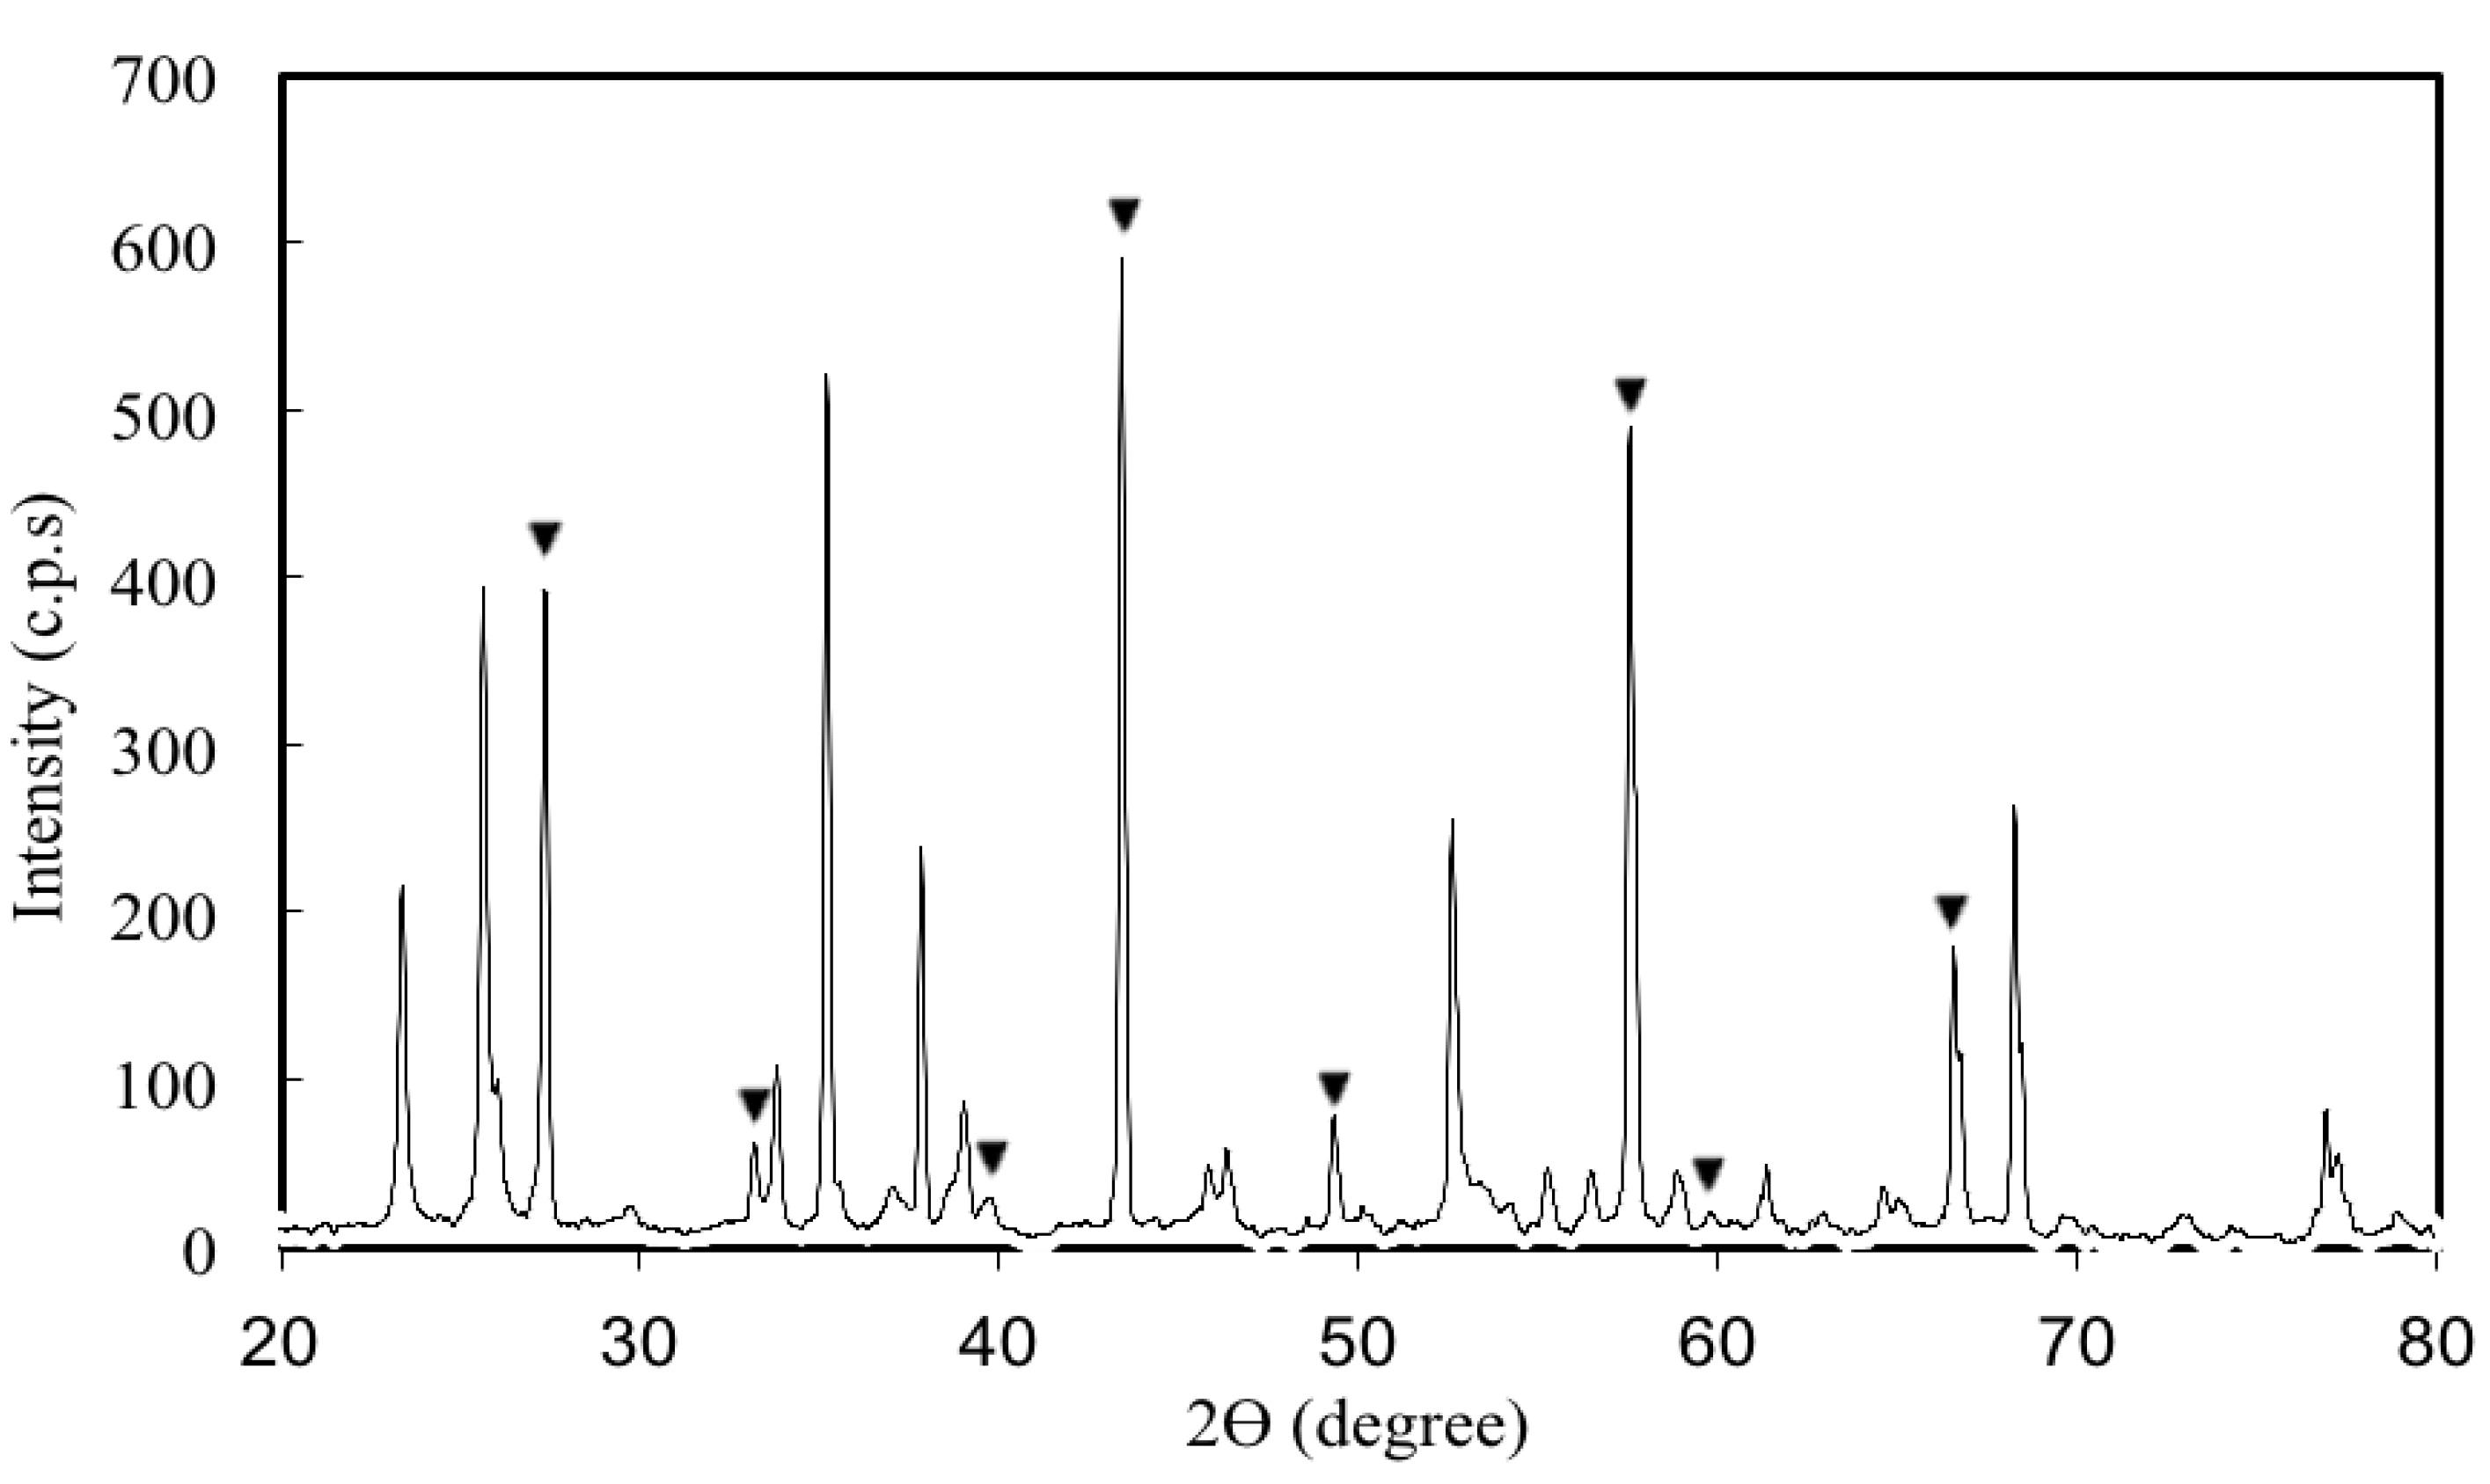
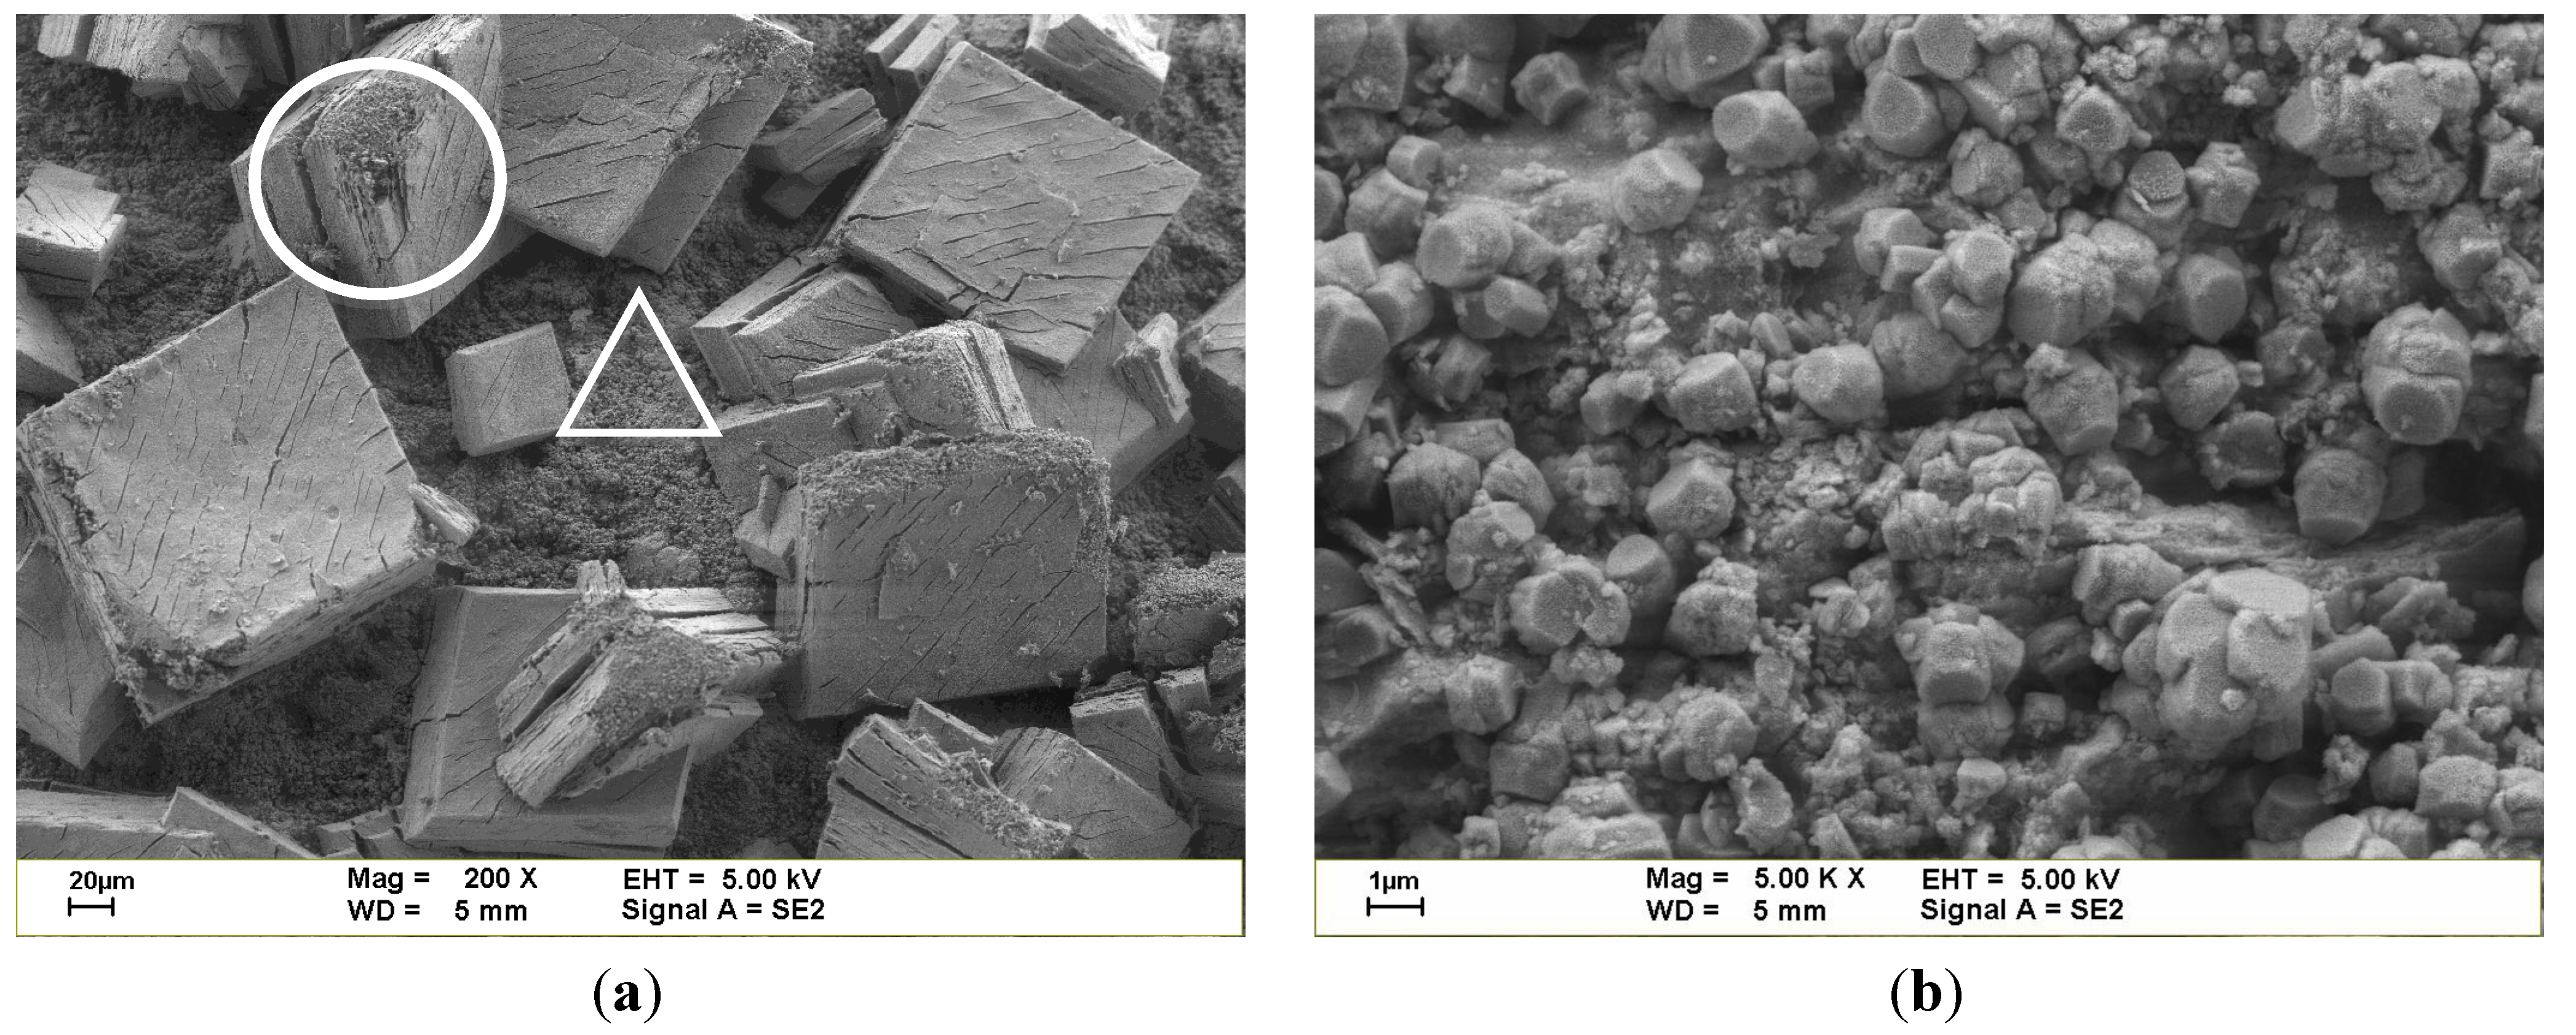
2.2. Characterization of Catalysts

X-ray powder diffraction (XRD) patterns of the tested catalysts were obtained on a Rigaku TTRAX III powder diffractometer (Sendagaya, Shibuya-Ku, Tokyo, Japan) installing with the X-ray source of 18 kW rotating anode Cu target operated at wave length of 1.5456 Å, current of 20 mA and two theta from 20.020 to 110.000 deg using 4.0 deg min−1 of scanning speed. Scanning electron microscopy (SEM) images were carried out using JEOL JSM-7600F field emission scanning electron microscope (Akishima, Tokyo, Japan). The specific surface area (SBET) was estimated by the BET equation using the data measured employing Micromeritics ASAP2020—physisorption analyzer (Norcross, GA, USA). The pore radius distribution and the mesopore analyses were obtained from the adsorption branch of the isotherm using the Barrett-Joyner-Halenda (BJH) method. The bulk particle density (ρP) and true density (ρS) (He displacement method) of catalysts were measured using Micromeritics AccuPyc II 1340 Pycnometer (Norcross, GA, USA).

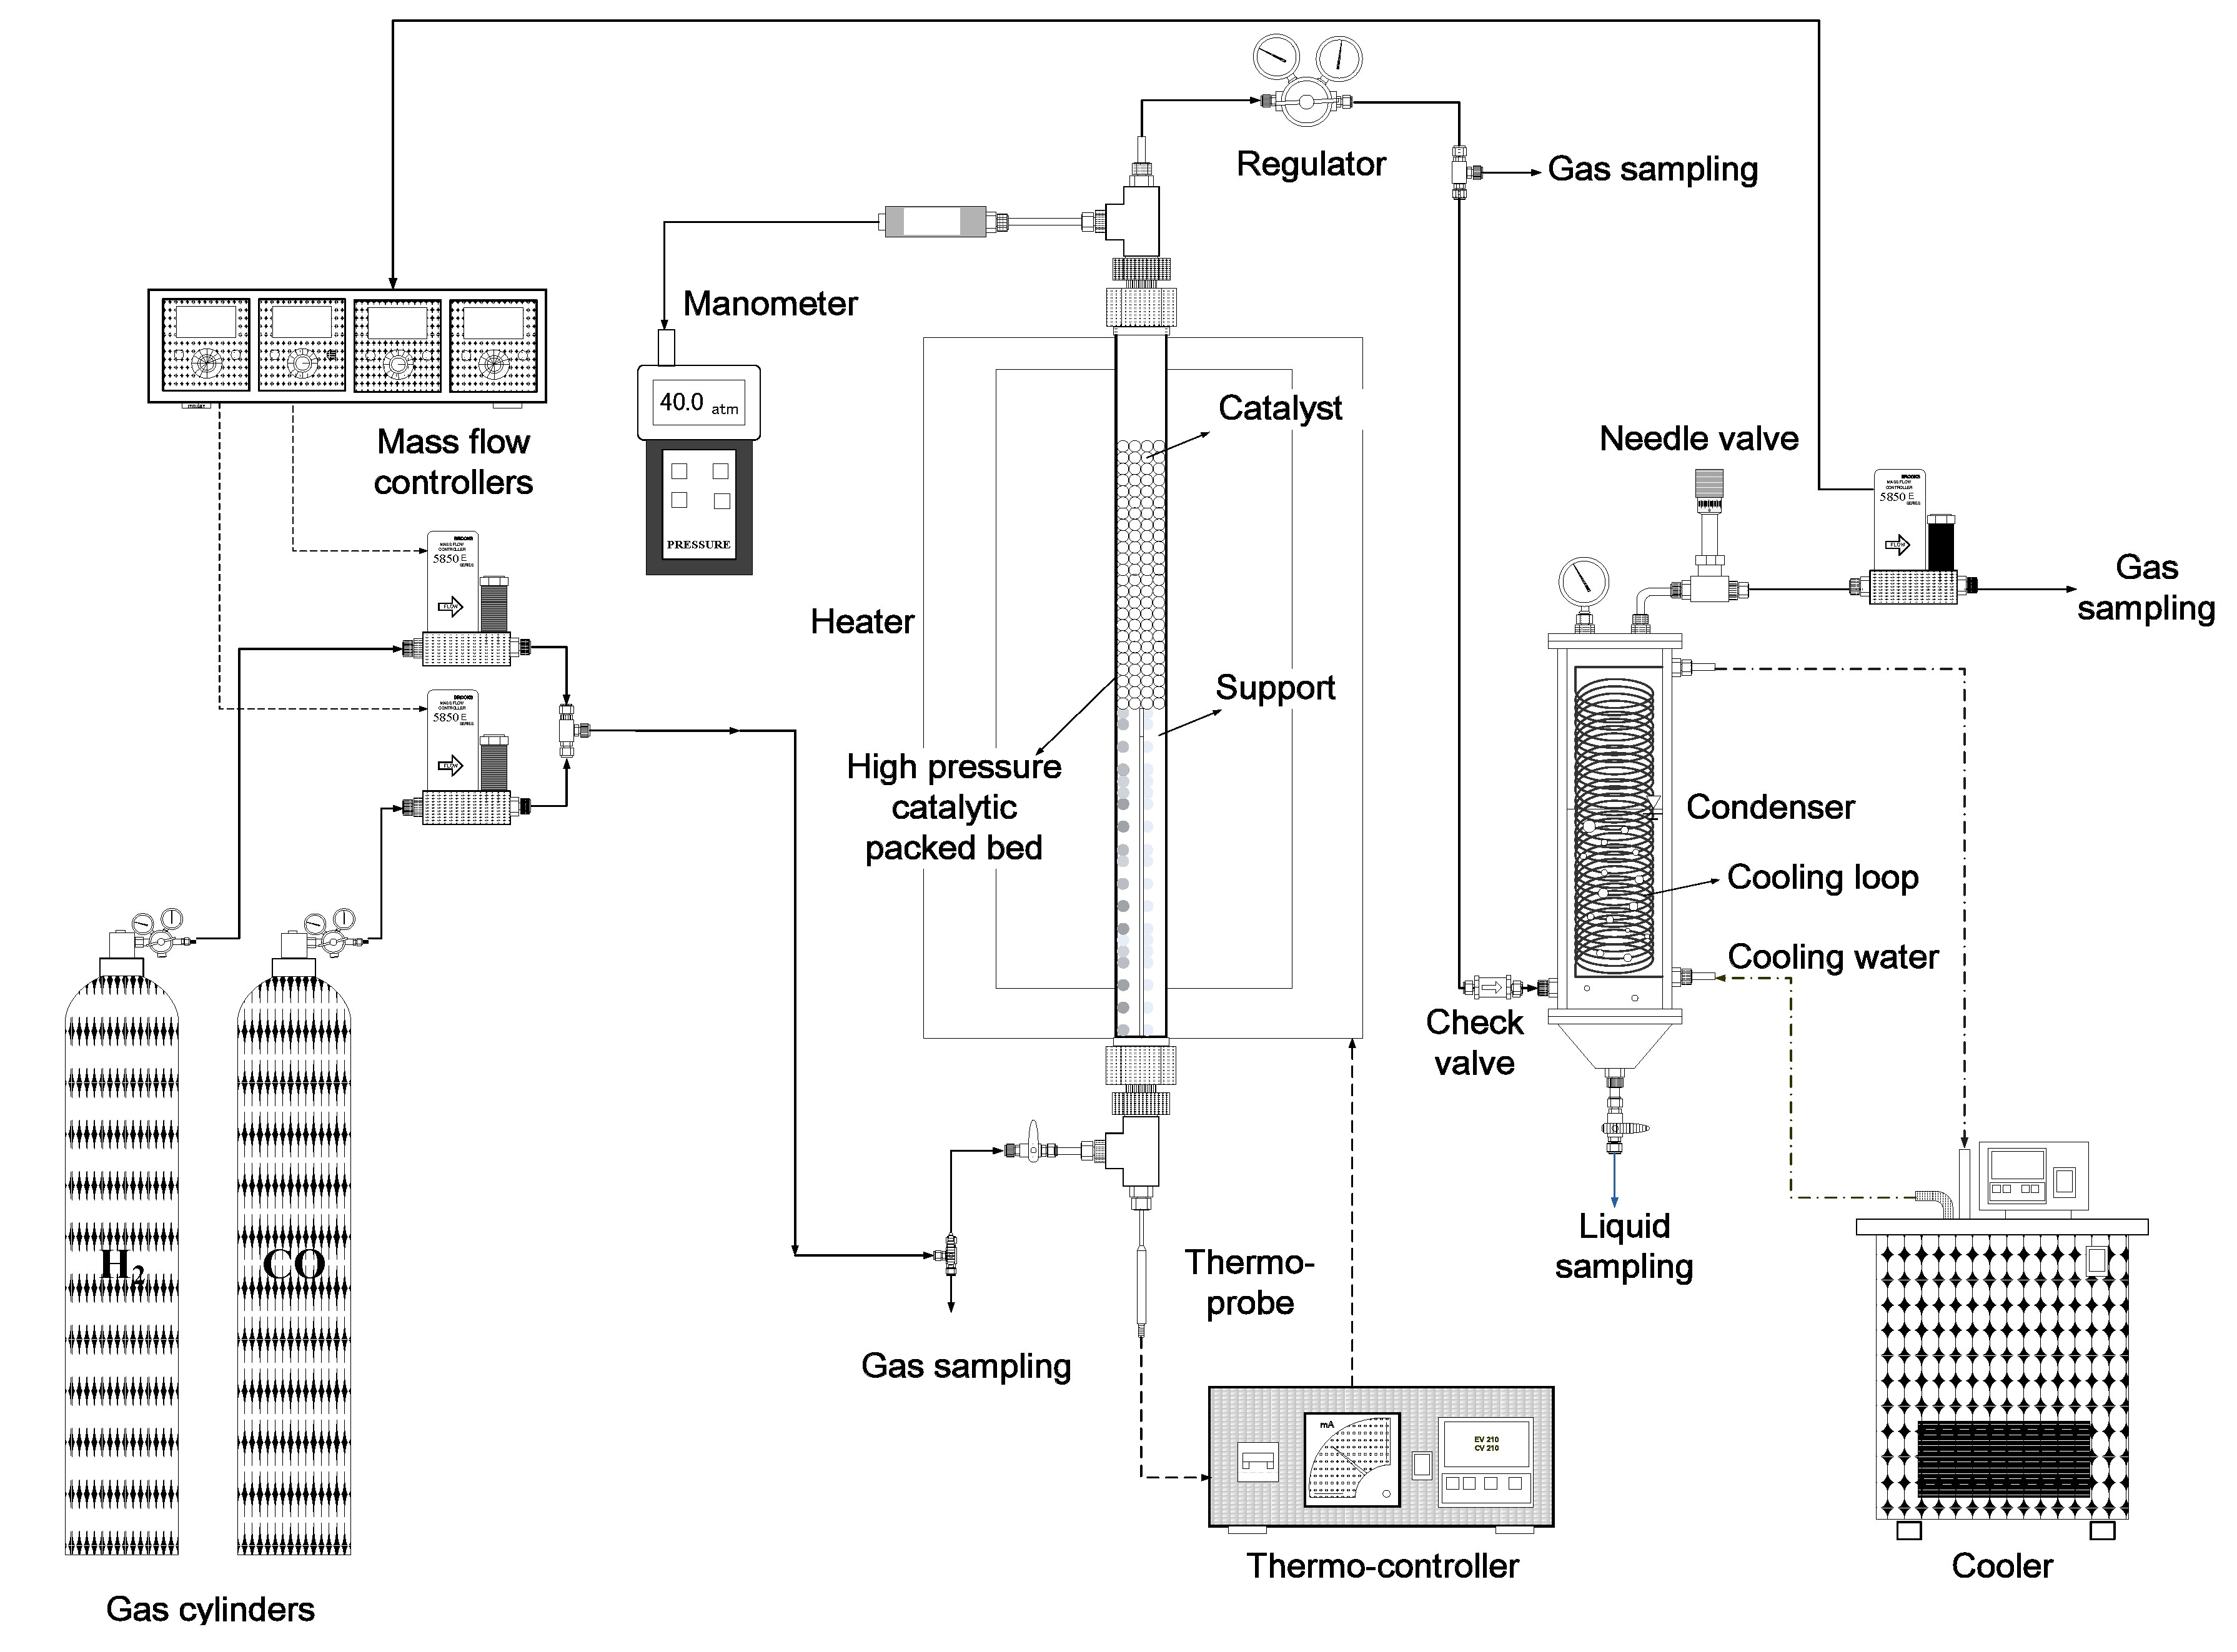
2.3. Hydrogenation of CO

The experimental high-pressure fixed packed bed (HPFPB) system was set up as shown in Figure 1. CO and H2 with purities of 0.9995 and 0.9995 were supplied by Ching-Fong Co. (Taipei, Taiwan). The syngas was provided from CO and H2 cylinders with the mole ratio adjusted by mass flow controllers (MFCs) (Brooks 5850E Series, Hatfield, Philadelphia, PA, USA). Concentration of gas mixture was measured at pre-sampling port after the pre-mix chamber while before the HPFPB to confirm the steady inlet concentration. A 3/8 inch single-tube reactor packed with catalysts and spherical glass beads was vertically set and used in this study. For the pressure control, a regulator was installed for maintaining the system pressure and adjusting the output flow rate. The polar organic products such as alcohols and acids were collected by the absorption along with condensation using de-ionized (DI) water (4 °C) in a condenser. Fresh catalyst and DI water were used for each run. Before the outlet gas from the packed bed flowed into the condenser, the gas was by passed and the instantaneous concentrations were measured at different subsequent times to ensure achieving the steady state. After reaching the steady state in the packed bed reactor, the gas was then introduced into the condenser. The unabsorbed and uncondensed gas was also examined for checking the steady state. Moreover, at the steady state, the cumulative concentrations of liquid samples measured over a period of time increased linearly with time, further assuring achieving the steady state. The linear slope can be used to obtain the steady production rate (PR) of liquid product. Data at the steady state were thus used to compute the information needed.
Figure 1. Schematic diagram of apparatus for the hydrogenation of CO.
Energies 05 04147 g001
The HPFPB system was operated under the conditions with the H2/CO mole ratio = 1–4, total gas flow rate of syngas (QG) = 300–900 cm3 min−1, temperature (T) = 423–573 K, mass of catalyst (mS) = 25 g, and setting pressure (PST) = 225–540 psi (reading at 298 K). The base conditions were as follows unless otherwise specified: H2/CO ratio MH/C = 2, mass flow rates of H2 and CO (dmH2/dt and dmCO/dt) of 1.07 and 7.50 g h−1, PST = 450 psi (30.6 atm) (reading at 298 K), mS = 25 g, QG = 300 cm3 min−1 and gas hourly space velocity GHSV = 1020 h−1.
The conversion of CO is computed according to the following equation:
XCO (%) = (Σ Nj·Mj/MCO,f) = 1− (MCO,p/MCO,f)
where Nj = number of carbon atoms in carbon-containing product j; Mj = mole of carbon-containing product j other than CO; MCO,f = mole of carbon monoxide in feed; MCO,p = mole of carbon monoxide in product stream.
The selectivity of product j is based on the total number of carbon atoms in the products and it therefore defined as:
Sj (%) = Nj·Mj/(Σ Nj·Mj)
The yield of product j is also based on the total number of carbon atoms in the products and is defined as:
Yj (%) = Nj·Mj/MCO,f

2.4. Analyses of Liquid and Gaseous Samples

The analysis of gaseous organic compounds was performed using gas chromatography/flame ionization detector (GC/FID, 6890 GC, Agilent Technologies, Santa Clara, CA, USA) with an AB-5 column (30 m × 0.53 mm × 5.00 μm, Abel Industries, Pitt Meadows, BC, Canada). A purge-and-trap sample concentrator (Model 4560, OI Analytical, College Station, TX, USA) was used to purify and inject the liquid samples into GC/FID for analysis. For the calibration of GC/FID, the standards of C1-C4 alcohols (99.9%) and C1-C6 alkanes (99.9%) employed were obtained from Accustandard Inc. (New Haven, CT, USA) and Sigma-Aldrich Inc. (Shanghai, China), respectively.
The gaseous products of CO, CO2 and H2 were analyzed by two separate chromatography/thermal conductivity detector analyzers (GC/TCD, 8900 GC, China Chromatography Co., Taipei, Taiwan). The GCs are installed with the same packed columns (60/80 Carbonxen-1000, 15 ft × 1/8 in SS, Sigma-Aldrich, Saint Louis, MO, USA). Different carrier gases of helium (He) for the analyses of CO and CO2 and argon (Ar) for that of H2 were respectively used. For the calibration of GC/TCD, the standards of CO and CO2 (99.995%) and H2 (99.995%) used were supplied by Ching-Fong Co. Standard errors (σn−1) of data were computed to indicate the level of precision. For example, the σn−1 of XCO and PRHC are about 2.6% and 4.3%.

3. Results and Discussion

3.1. Properties and Characteristics of Catalysts

The XRD patterns of MoS2/γ-Al2O3 samples are shown in Figure 2.
Figure 2. The XRD patterns of MoS2/γ-Al2O3 catalyst.
Energies 05 04147 g002
The peaks denoted with solid triangles (▼) at 2θ = 32.85°, 39.85°, 49.66°, 58.57°, 60.05° and 66.67° match the polygonal structure of MoS2 (JCPDS No. 17-0744) in accordance with the characteristic peaks reported by Berdinsky et al. [24]. However, they also additionally noted 2θ at 28.86° and 43.99° for the MoS2 nano-powder examined [24]. The SEM micrograph of sample in Figure 3a (magnification = 200×) indicates crystalline part of MoS2 (noted by white ○), and non-crystalline part of MoS2 and surface of γ-Al2O3 (denoted by white ∆). The enlargement of ∆ with magnification of 5000× is displayed in Figure 3b. The crystalline part of MoS2 consists of polygonal particles which may exhibit lamellar structure as also noted by Ye et al. [25]. However, small clusters appear on the surface as shown in Figure 3b. The MoS2 crystallite size estimated using Figure 3a is about 128 μm × 128 μm × 24 μm. More accurate size may be calculated by using Scherrer formula from XRD diffraction information. Moreover, further examination of the morphology properties using selected area electron diffraction in transmission electron microscopy may provide more clear identification of the structures of crystalline and non-crystalline MoS2.
Figure 3. SEM micrographs of MoS2/γ-Al2O3 catalysts: (a) crystalline of MoS2 (○) and non-crystalline part of MoS2 and surface of γ-Al2O3 (∆); (b) enlargement of ∆.
Energies 05 04147 g003
The BET surface areas SBET and other particle properties of Al2O3 support and MoS2/γ-Al2O3 catalyst are listed in Table 1.
Table 1. The properties of γ-Al2O3 support and MoS2/γ-Al2O3 catalyst.
SampleSBET (m2 g−1)Density (g cm−3)PorosityPore size
ρPρSεP(Å)
γ-Al2O3280.461.272.890.52855.5
MoS2/γ-Al2O3210.351.233.210.55074.7
BET: Brunauer-Emmett-Teller; ρP: particle density; ρS: solid density.
It can be seen that the BET surface areas of Al2O3 and MoS2/γ-Al2O3 prepared with concentration of ammonium heptamolybdate solution (CMo) = 10 wt.% are 280.5 and 210.4 m2 g−1, respectively. The average pore size of 55.5 Å of Al2O3 is smaller than that of 74.7 Å of MoS2/γ-Al2O3. Thus the doping of MoS2 enlarges the pore during preparation of catalyst, however, which in turn reduces the SBET. Further accordingly, the porosity (εP) increases to 0.550 while bulk particle density ρP decreases to 1.23 g cm−3 for MoS2/γ-Al2O3 after doping of MoS2. The increase of true density or solid density ρS to 3.21 g cm−3 is due to the addition of MoS2.on γ-Al2O3. The particle size of MoS2/γ-Al2O3 is about 4–5 mm with average diameter of 4.09 mm which is only slightly larger than that of γ-Al2O3.of about 4 mm.
In the above, the XRD and SEM results confirm that the MoS2 was successfully adopted on the Al2O3 support, ensuring the possession of activity by the MoS2 which promotes the restructuring of CO via hydrogenation. The SBET results of the catalyst indicate that a large portion of internal surface was retained, providing essential active sites for the adsorption and reactions.

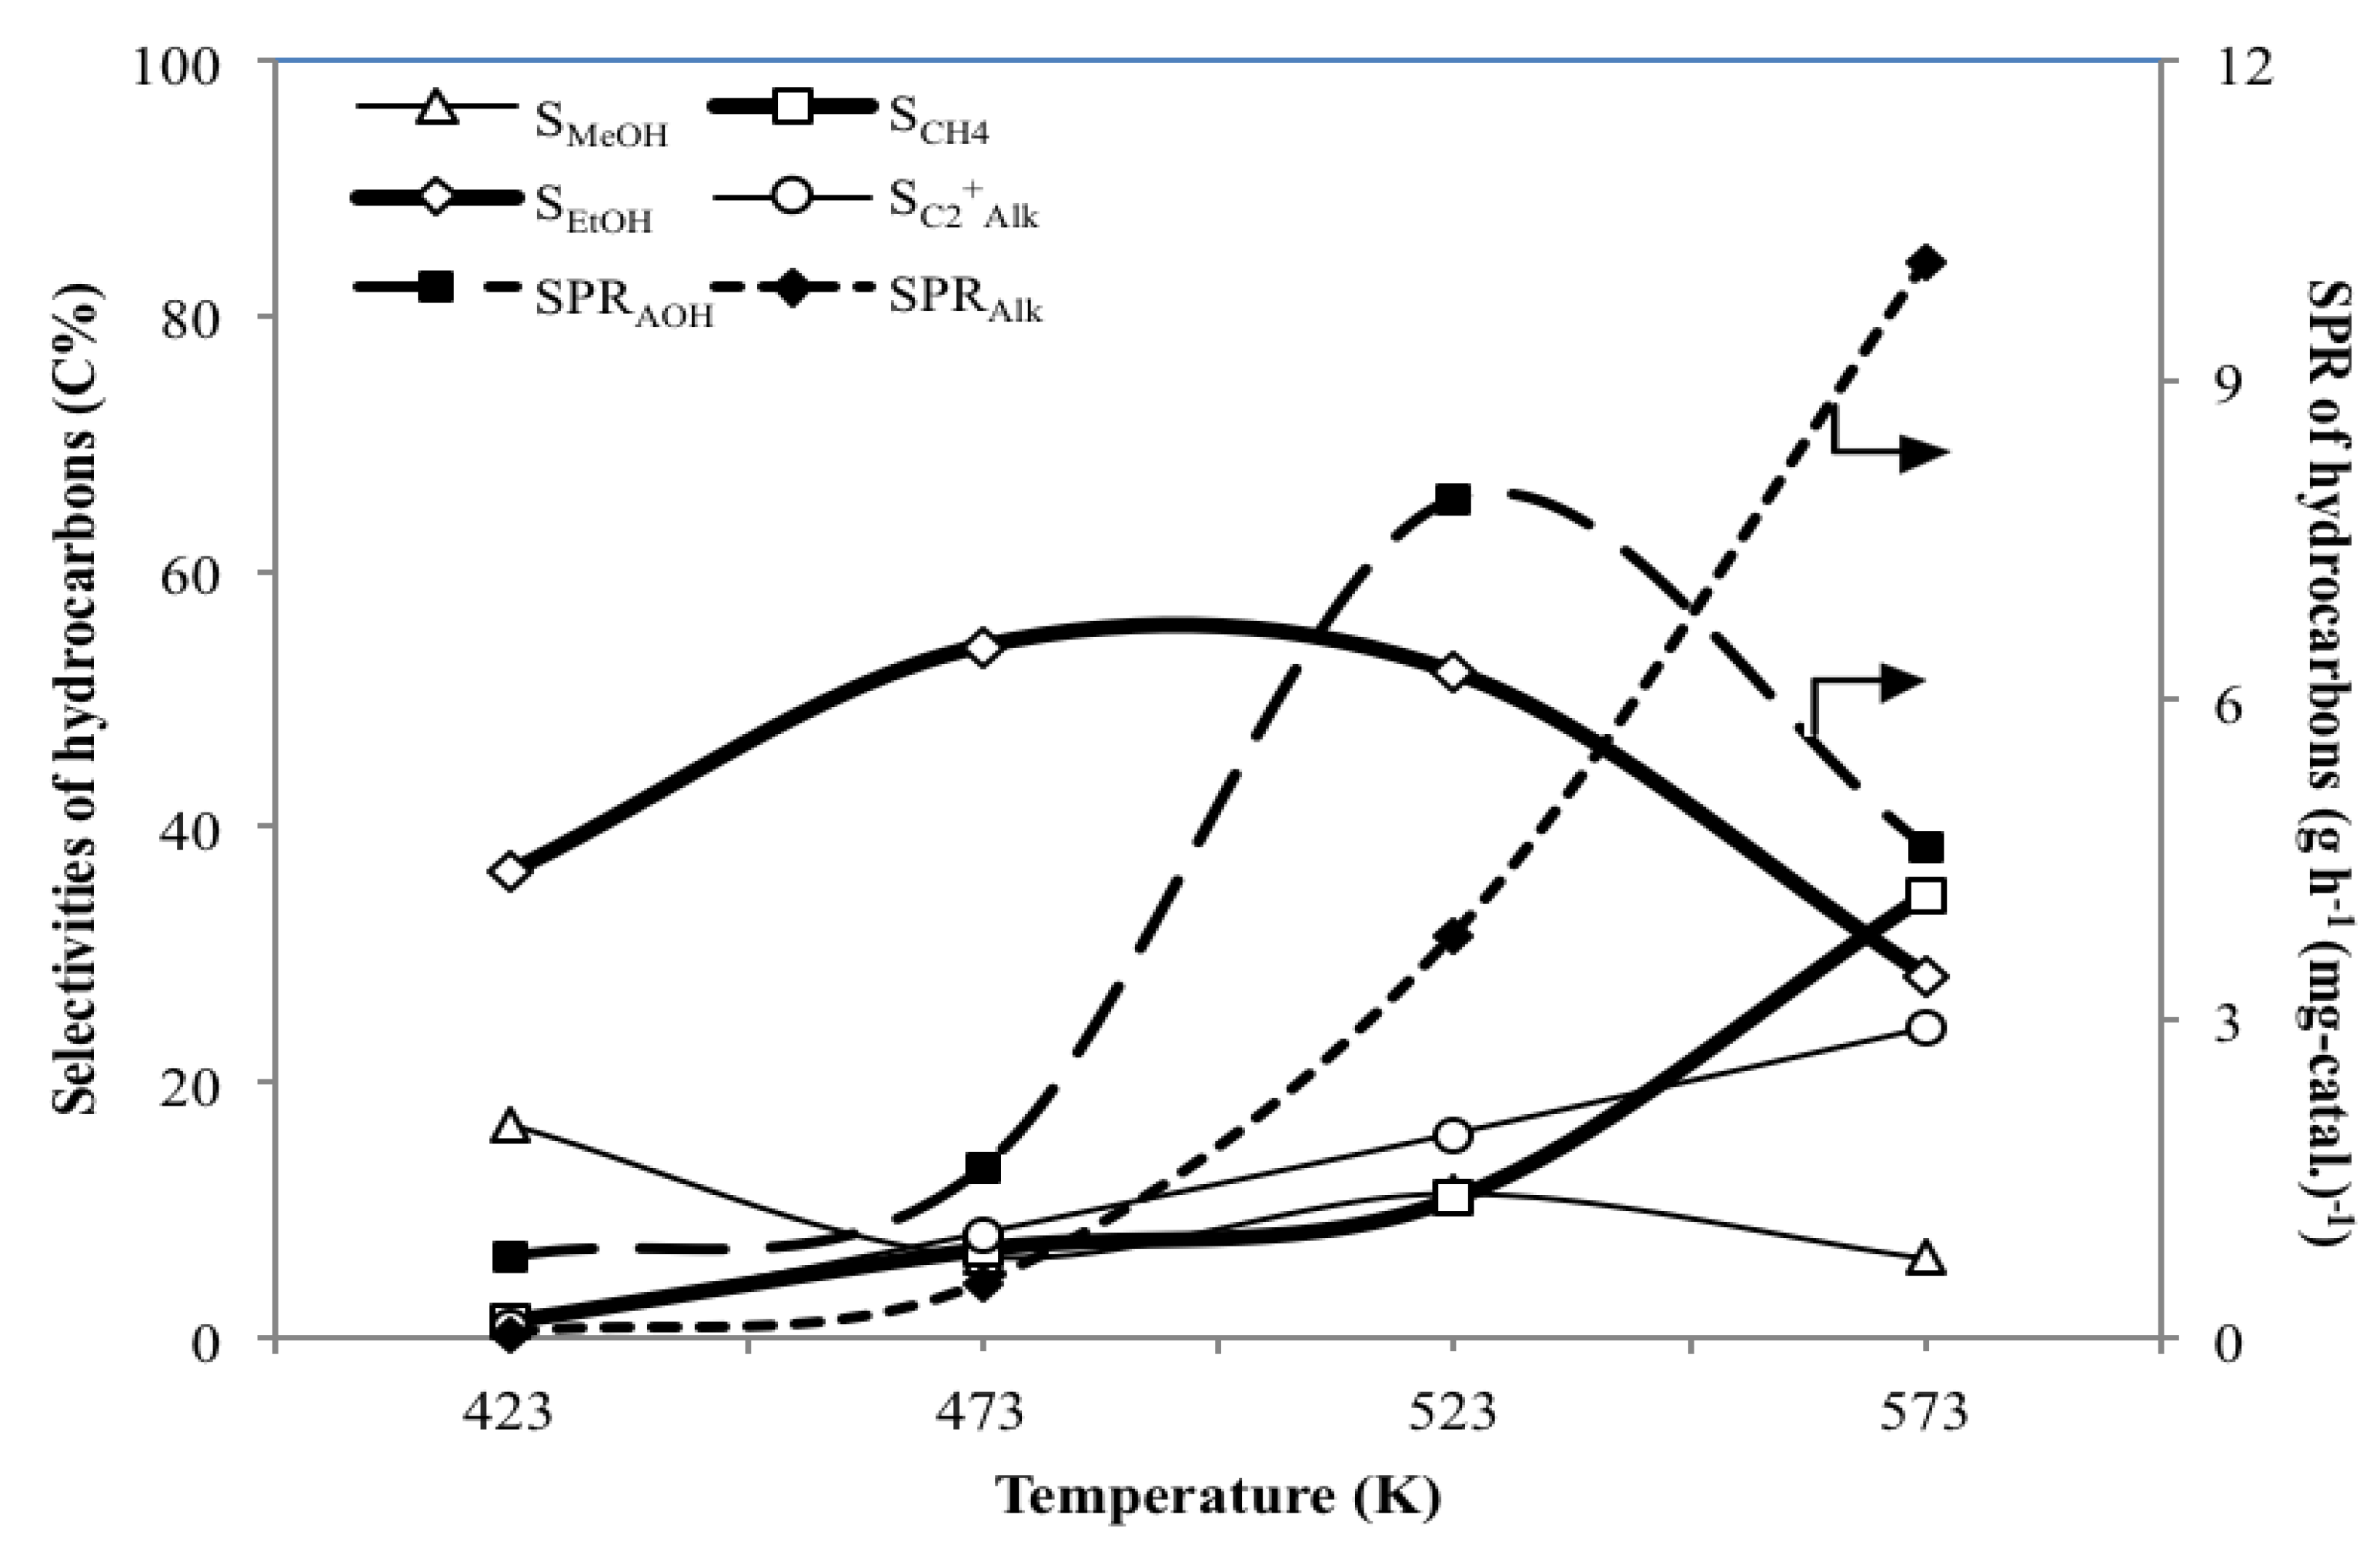
3.2. Effect of Temperature T on the Catalytic Performance of MoS2/γ-Al2O3

Table 2 illustrates the CO hydrogenation performances over MoS2/γ-Al2O3 catalysts at various temperatures (from 423 to 573 K). It can be seen that the conversion of CO (XCO) increases monotonously with the increasing temperature. At 573 K, the highest XCO and the specific production rate (SPR) of hydrocarbons (HCs) are 8.2% and 16.1 mg h−1 gcat−1, respectively. However, a comparison of the yields of alkanes (YAlk) and alcohols (YAOH) shows that YAlk is greatly higher than YAOH at 573 K. Thus, when using MoS2/γ-Al2O3 as the catalyst for the hydrogenation of CO, it is better to control the temperature around 523 K in order to harvest more AOH products.
The influences of temperature on the selectivities of HC products (SHC) and specific production rates SPR of HCs over MoS2/γ-Al2O3 catalysts are shown in Figure 4. The selectivities of ethanol (SEtOH) exhibits the highest proportion of whole distribution at each T of 423, 473 and 523 K. However, at T = 573, SEtOH decreases while that of methane (SCH4) increases over SEtOH. Note that C2+ alkanes denote C2-C4 alkanes, for which the selectivities (SC2+Alk) also increase as the temperature increases. The increase of T not only changes the selectivities, but also enhances the conversion. In order to assess the roles of temperature and conversion on the selectivities, comparison of the results at T = 523 K and 573 K is made. These two different temperatures result in about the same conversions of 8.1–8.2, indicating that the changes of selectivities are mainly associated with higher temperature.
Figure 4. Selectivities (S) of hydrocarbon products (SHC) and specific production rates (SPR) of HCs using MoS2/γ-Al2O3 catalyst at various temperatures.
Energies 05 04147 g004
Table 2. Performance of hydrogenation of CO over MoS2/γ-Al2O3 catalyst at various temperaturesa.
CatalystT (K)Conversion of CO (XCO) (C%)SPRb (mg h−1 gcat−1)Yieldc (C%)Selectivity of hydrocarbon productd (C%) (SHC)SPRHCsf
SPRAlkSPRAOHYAlkYAOHSCH4SC2+AlkSMeOHSEtOHSPrOHSBuOHSOtHCe(mg h−1 gcat−1)
MoS2/γ-Al2O34230.60.10.80.20.51.20.716.736.46.57.331.11.1
4732.10.51.61.01.16.98.16.454.00.31.922.53.2
5238.13.87.92.05.010.915.811.352.02.30.37.513.2
5738.210.14.65.32.934.624.16.228.30.40.26.316.1
Rh-Mn/SiO2g5633.646.1205.8-----56.8----
5734.853.4260.7-----67.0----
5837.4127.6314-----49.5----
5939.5189427-----44.9----
a Reaction conditions: PST = 30.6 atm (450 psi) (reading at 298 K), H2/CO = 2, QG = 300 cm3 min−1, molar flow rate of CO = 0.2678 mole h−1, GHSV = 1020 h−1, mS = 25 g; b SPR: Specific production rate; SPRAlk, SPRAOH: SPR of Alk, AOH; Alk: C1 to C4 alkanes; AOH: C1 to C4 alcohols; c Yj = (Nj Mj)/MCO, f, where Nj: number of carbon atoms in carbon-containing product j, Mj: mole of carbon-containing product j other than CO, MCO, f: mole of carbon monoxide in feed. YAlk = sum of Ycj-Alk, j = 1–4; YAOH = sum of Ycj-AOH, j = 1–4; d Sj = (Nj Mj)/(ΣNj Mj); HC: Hydrocarbon; MeOH: methanol; EtOH: ethanol; PrOH: propanol; BuOH: butanol; C2+ Alk: ethane, propane, butane and pentane; e. OtHC: HCs other than C1-C4 alkanes and C1-C4 alcohols expressed equivalent to CH4; f SPR of HCs: including C1-C4 alkanes, C1-C4 alcohols and OtHC; g PST = 29.6 atm (3.0 Mpa), H2/CO = 2, SV = 27,000 mL g−1 h−1, mS = 0.3 g (~0.6 mL), Rh/Mn = 1 [26].
The comparison between SPRAlk and SPRAOH, shows that higher temperatures are favorable for the formation of alkanes, especially for CH4. Further, a unique peak value of SPRAOH of 7.9 mg h−1 gcat−1 appears at T = 523 K that may indicate the optimal reaction temperature for higher AOH products rich in EtOH. Moreover, at T = 523 K, the higher production of alcohol products also restrains the amount of alkanes formed.
In a previous study concerning the effect of various temperatures over Rh-Mn/SiO2 catalyst [26], the results indicated that the increasing temperature improves the XCO, SPRAlk, and SPRAOH. Besides, there is also a peak value of SEtOH at T = 573 K which is also a selectable temperature for producing EtOH as the target compound. The performance of MoS2/γ-Al2O3 catalyst of this study is not as good as that of Rh-Mn/SiO2 catalyst. However, the former catalyst is much cheaper than the latter one. The maximum SEtOH of this study is 54% compared to 67% of Luo et al. [26], 4.8% of Egbebi and Spivey [23], 56.1% of Hu et al. [21] and 35.7% of Haider et al. [27].

3.3. Effect of H2/CO Ratio MH/C on the Catalytic Performance

Although the ratio of H2 and CO from biomass gasification is no more than 2, however, excess H2 may be added for the adjustment of CO to produce more valuable products if feasible. Thus, the characteristics of production at 523 K using MoS2/γ-Al2O3 catalysts with different MH/C are presented in Table 3. It shows a slight increase of XCO from 7.6 to 8.3% as the MH/C increases from 1 to 4. However, for the consideration of the relative proportion of AOH to Alk products, the MH/C of 2 gives higher ratios of SPRAOH/SPRAlk and YAOH/YAlk than other MH/C. This is consistent with the stoichiometric mole ratio of H2 to CO of the synthesis reaction 2CO + 4H2 → C2H5OH + H2O, favoring the formation of ethanol.
As for the selectivities of HC products at various MH/C, Figure 5 indicates that sum of selectivities of total AOH products are obviously higher than that of total alkane products, for which SEtOH is dominant. The results illustrate that MoS2/γ-Al2O3 is an alcohol favorite catalyst, particularly for EtOH. The favor of formation of AOH holds for other MH/C values of 1, 3 and 4 examined. Note that there is an increase of C2+Alk at MH/C = 1 due to the lack of H2 for promoting the formation of other HCs. Thus, MH/C of 2 is proper for alcohol synthesis because of its high SAOH, SEtOH and SPRAOH.
In a previous study as listed in Table 3, Egbebi and Spivey [23] showed a higher MH/C at 3 gives a higher SCH4 while a lower SEtOH using alkane favorite catalyst of Rh-Mn-Li/TiO2, which favors the reaction of CO + 3H2 → CH4 + H2O. Although the MoS2/γ-Al2O3 catalyst employed in the present study does not favor the formation of CH4 but ethanol, an increase of MH/C indeed slightly enhances its formation, consisting with the trend reported by Egbebi and Spivey [23].
Table 3. Performances of hydrogenation of CO over MoS2/γ-Al2O3 catalysts at various H2/COa.
CatalystH2/CO (vol./vol.)XCO (C%)SPRb (mg h−1 gcat−1)Yieldc (C%)SHCd (C%)SPRHCsf
SPRAlkSPRAOHYAlkYAOHSCH4SC2+AlkSMeOHSEtOHSPrOHSBuOHSOtHCe(mg h−1 gcat−1)
MoS2/γ-Al2O317.64.66.42.74.111.826.29.044.91.81.25.111.9
28.13.87.92.05.010.915.811.352.02.30.37.513.2
38.04.17.82.24.812.716.312.748.72.10.57.013.3
48.34.87.72.54.914.716.713.945.62.10.56.513.8
Rh-Mn-Li/TiO2g10.46--0.340.0373.6-3.33.5--18.5-
20.94--0.740.0778.4-3.44.3--13.0-
31.57--1.270.1380.8-3.44.8--10.3-
a. Reaction conditions: T = 523 K; other conditions are as specified in Table 2; b–f. As specified in Table 2; g. T = 543 K, PST = 19.7 atm (20 bar), QG = 220 mL min−1, Rh/Mn/Li = 1/0.1/0.55 [23].
Figure 5. SAOH, SAlk and XCO using MoS2/γ-Al2O3 catalyst at different H2/CO ratios (vol./vol.) at T = 523 K.
Energies 05 04147 g005

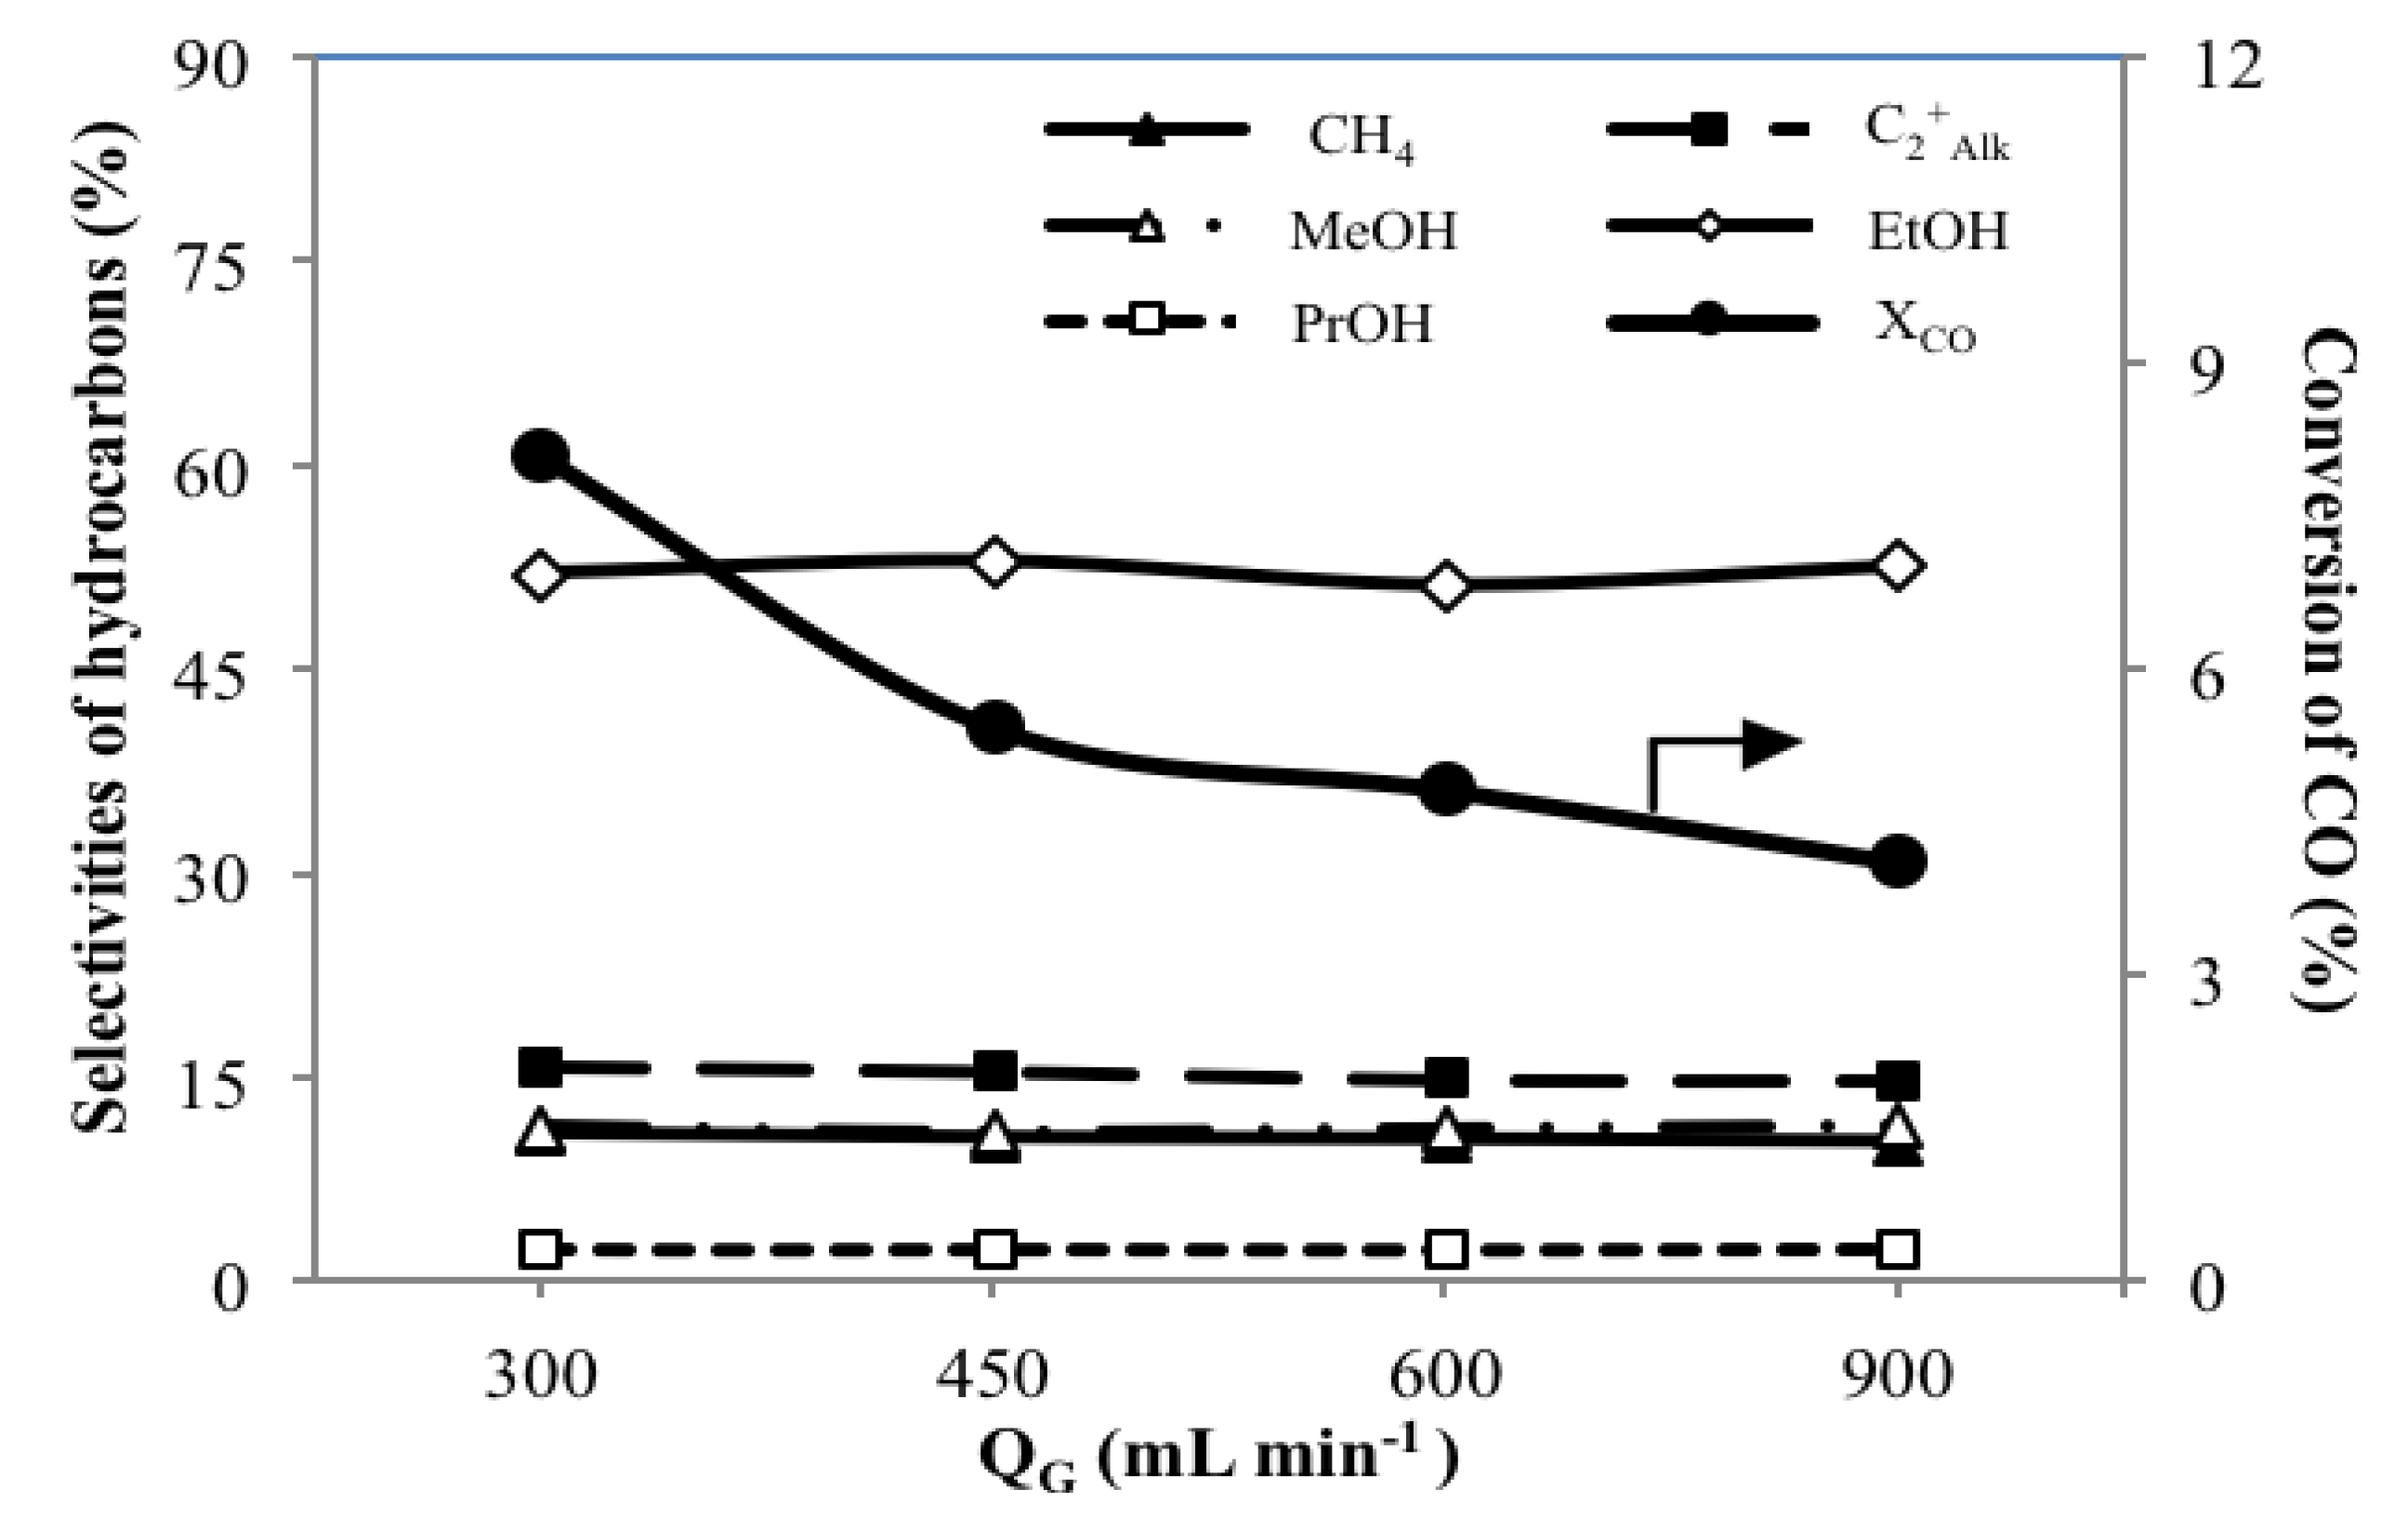
3.4. Effect of Total Gas Flow Rates QG on the Catalytic Performance

Table 4 illustrates the CO hydrogenation performances under the conditions of T = 523 K and H2/CO = 2 with various QG over MoS2/γ-Al2O3 catalysts. The XCO significantly reduces from 8.1 to 4.1% as QG increases from 300 to 900 mL min−1 because of the decrease in reaction time (or gaseous retention time, tR) with increasing QG. For the same reason, the YAlk and YAOH also exhibit decreasing trends with increasing QG. However, the SPRs of alcohol and HCs show rising trends from 7.9 to 18.0 mg h−1 gcat−1 and 13.2 to 30.0 mg h−1 gcat−1, respectively, as QG increases. This is because more reactants are supplied with higher QG. For efficient utilization of reactants aiming at synthesizing AOH with higher XCO and YAOH, a lower QG may meet the needs, but this is accompanied by a reduction in reactor productivity. The above said trend is also consistent with the findings of Hu et al. [21] concerning the effect of various GHSV and indicating that a lower GHSV improves the XCO over Rh-Mn/SiO2 catalyst.
Figure 6 further compares the SAOH, SAlk and XCO at various QG for the case using MoS2/γ-Al2O3 catalyst. It indicates the domination of SEtOH over others. Moreover, the effect of QG on XCO is more vigorous than on SAOH and SAlk. Combined evaluation of the role of QG on XCO as well as the aforementioned YAOH suggests the use of lower QG.
Noting that the volume of catalysts divided by QG is equal to the 1/GHSV which represents the reaction time, the variation of XCO with 1/GHSV was examined for elucidating the global reaction kinetics. Kinetics in the form of d[CO]/dt = −kn [CO]n were then tested for the reaction order n = 0, 1 and 2 with the following linear equations:
1 − XCO = 1 − (k0/[CO]0) t for n = 0,
−ln(1 − XCO) = k1 t for n = 1
1/(1 − XCO) = 1 + k2 [CO]0 t for n = 2
The correlation coefficients r2 are 0.938, 0.945 and 0.951, respectively, for n = 0, 1 and 2. The fittings are re-plotted as 1 − XCO vs. 1/GHSV as shown in Figure 7. The data for short 1/GHSV, say 3.5 s, are essentially linear and well fitted by the said three kinetic models as illustrated in Figure 7a, revealing negligible differences. However, the aforementioned three models exhibit differences which increase with increasing reaction time as indicated in Figure 7b. Further study on the mass transfer effect and the mechanism of the hydrogenation of CO, which may involve rather complicated reactions, on the reaction system would be helpful for establishing and confirming the proper kinetic model.
Table 4. Performances of hydrogenation of CO over MoS2/γ-Al2O3 catalysts at various gas flow ratesa.
CatalystQG (mL min−1)GHSV (h−1)WHSV (h−1)XCO (C%)SPRb (mg h−1 gcat−1)Yieldc (C%)SHCd(C%)SPRHCsf (mg h−1 gcat−1)
SPRAlkSPRAOHYAlkYAOHSCH4SC2+AlkSMeOHSEtOHSPrOHSBuOHSOtHCe
MoS2/γ-Al2O33001,0200.348.13.87.92.05.010.915.811.352.02.30.37.513.2
4501,5250.515.45.612.01.42.910.515.510.952.92.40.37.620.0
6002,0350.694.86.414.31.22.610.414.911.251.12.30.37.823.6
9003,0501.034.18.118.00.52.210.314.811.452.52.40.38.430.0
Rh-Mn/SiO2g1,70038.7--15.621.940.2-2.853.9--3.1-
3,75024.6--9.4514.838.4-3.956.1--1.6-
a. Reaction conditions: T = 523 K; other conditions are as specified in Table 2; b–f. As specified in Table 2; g. T= 573 K, PST = 53.3 atm (5.4 Mpa), H2/CO = 2, mS = 0.2 g, Rh/Mn = 4 [21].
Figure 6. SAOH, SAlk and XCO using MoS2/γ-Al2O3 catalyst at different total gas flow rates (QG) at T = 523 K.
Energies 05 04147 g006
Figure 7. Plots of 1 − XCO vs. 1/GHSV. (a,b): For short and long 1/GHSV. ○, □, ∆: Experimental data fitted by zero- (Zero), first- (1st), second- (2nd) order reaction kinetic models.
Energies 05 04147 g007

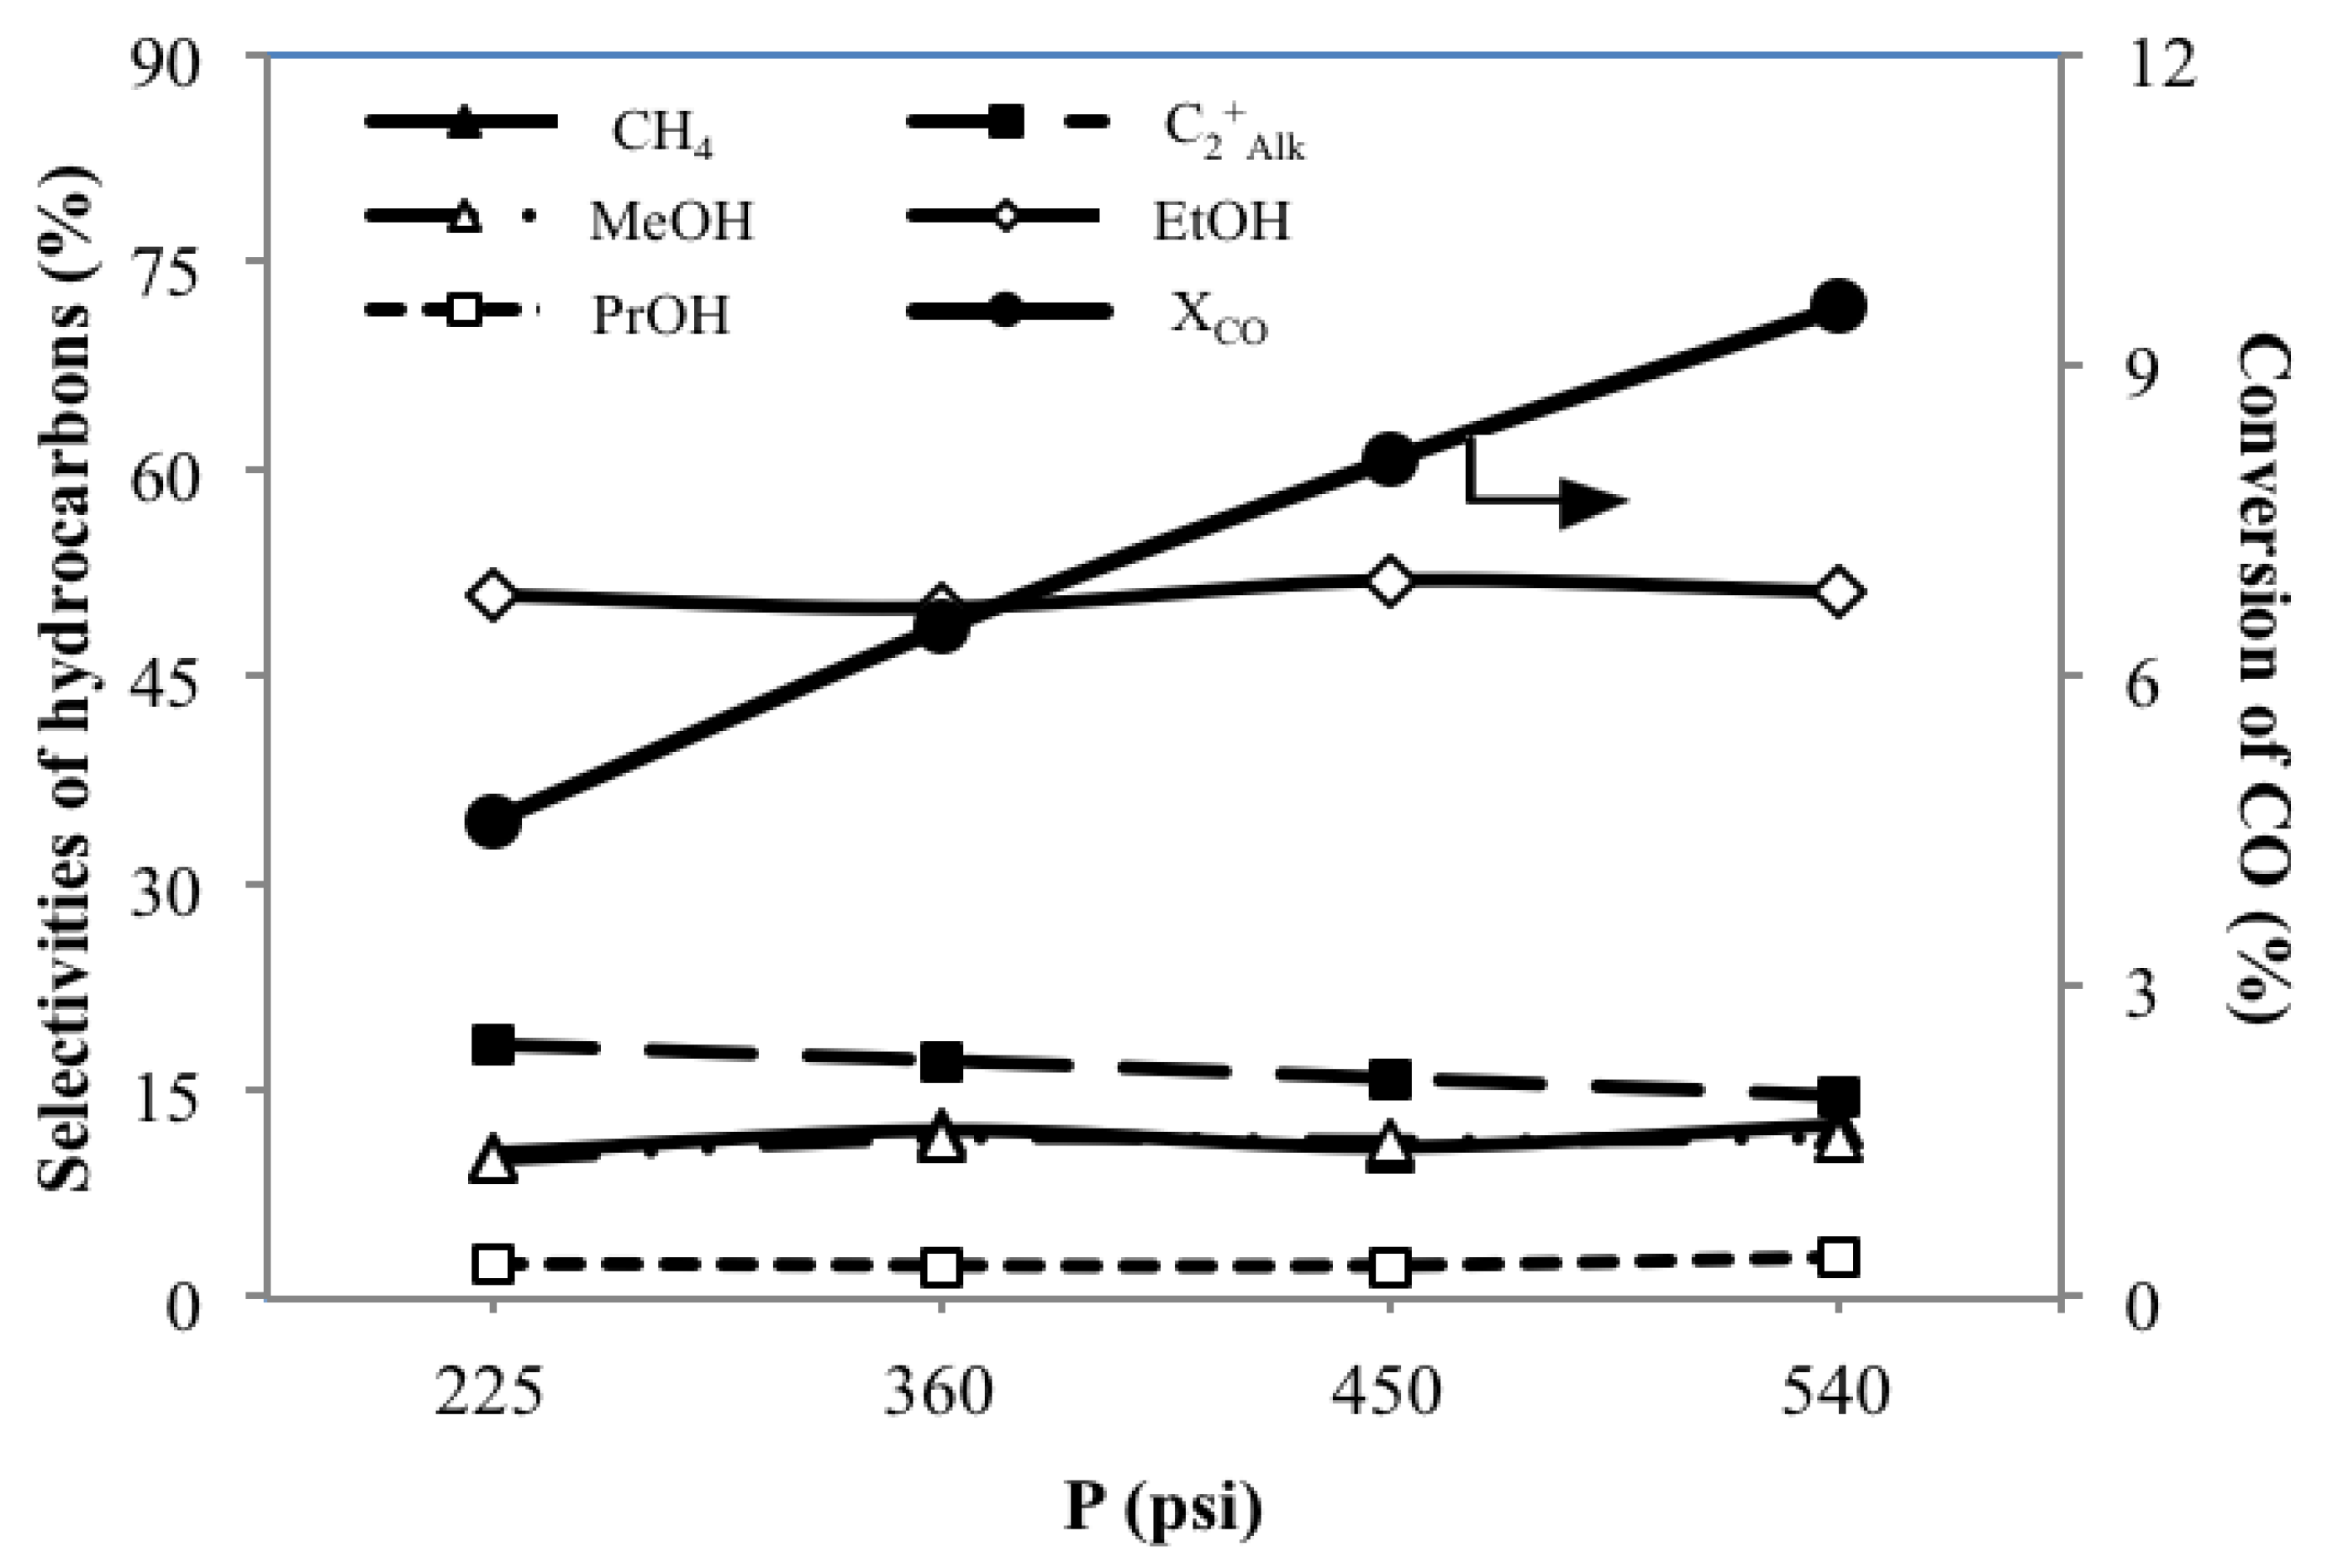
3.5. Effect of System Pressures PST on the Catalytic Performance

Table 5 illustrates the performances of hydrogenation of CO at various PST (from 255 to 540 psi) over MoS2/γ-Al2O3 catalyst. It can be seen that XCO increases monotonously with increasing pressure. At 540 psi, the highest XCO and SPRHCs are obtained, with values of 9.6% and 15.8 mg h−1 gcat−1, respectively. In addition, the SPR and Y also rise for alkanes as well as alcohol with increasing system pressure. A supply of higher pressure is equivalent to provide a larger amount of reactants into the reaction system, thus enhancing the reactions. Focusing on the SPR and Y of both Alk and AOH, it can be seen that an increasing pressure does not significantly change the relative proportions between the AOH and Alk, giving SPRAOH/SPRAlk of about 1.91–2.08 and YAOH/YAlk of about 2.18–2.52. Production of Alk as well as of AOH increases with pressure. Figure 8 shows the variations of SHCs and XCO with PST.
Table 5. Performances of hydrogenation of CO over MoS2/γ-Al2O3 catalysts at various pressurea.
CatalystPST (psi)XCO (C%)SPRb (mg h−1 gcat−1)Yieldc (C%)SHCd(C%)SPRHCsf
SPRAlkSPRAOHYAlkYAOHSCH4SC2+AlkSMeOHSEtOHSPrOHSBuOHSOtHCe(mg h−1 gcat−1)
MoS2/γ-Al2O32254.62.24.21.22.710.318.39.950.92.5-8.17.4
3606.53.36.21.83.912.117.111.550.02.3-7.110.7
4508.13.87.92.05.010.915.811.352.02.30.37.513.2
5409.64.79.32.46.112.514.611.551.22.90.37.115.8
Fe/TiO2g2066.7----36.27.23.335.7--17.6-
4128.8----37.57.62.830.4--21.7-
a. Reaction conditions: T = 523 K; other conditions are as specified in Table 2; b–f. As specified in Table 2; g. T = 543 K, H2/CO = 1, QG = 20 mL min−1, ms = 2.65 g, weight hourly space velocity (WHSV) = 8,000 cm3 h−1 gcat−1 [27].
Figure 8. SAOH, SAlk and XCO using MoS2/γ-Al2O3 catalysts at different system pressures (P = PST) at T = 523 K.
Energies 05 04147 g008
The results indicate that SEtOH values of 50.9–52.0 C% are higher than the others. However, the variations of SHCs of each HC with system pressure are minor. Thus, the main benefits of increasing PST are to enhance the aforesaid XCO, YAlk and YAOH, reaching XCO = 9.6%, YAlk = 2.4 C% and YAOH = 6.1 C% at 540 psi. In a previous study employing an alkane favoring Fe/TiO2 catalyst, Haider et al. [27] also showed that an increasing pressure enhances the XCO producing CH4 with SCH4 as high as 37.5 C%.
Although the XCO over MoS2/γ-Al2O3 catalyst of 9.6% is only comparable to that of 9.5% using Rh-Mn/SiO2 with Rh/Mn = 1 [26] while lower than that of 24.6%–38.7% employing Rh-Mn/SiO2 with Rh/Mn = 4 [21], the MoS2/γ-Al2O3 is more advantageous to use than the Rh-Mn/SiO2 with Rh/Mn = 4 because it is relatively cheap and easy to make. However, for commercialization, the XCO should be improved. Thus, modification of MoS2 catalyst by some cheap ways to enhance its activity would be very desirable and useful. An increase of reaction time may also enhance the conversion.

4. Conclusions

  • For the hydrogenation of CO using MoS2/γ-Al2O3 catalyst, T at 523 K is proper not only to yield SPRAOH and YAOH higher than SPRAlk and YAlk, respectively, but also to give a satisfactory high value of SEtOH of 52.0 C%.
  • Compared to other settings of H2/CO, H2/CO at 2 gives highest SEtOH of 52.0 C%, which is in accordance with the stoichiometry of the formation of EtOH.
  • A lower QG offers longer tR, resulting in higher reaction extents with higher XCO and YAOH along with a significantly high value of SEtOH of 52.0 C%.
  • An increasing pressure enhances the XCO, YAlk and YAOH, while only slightly changing the SHCs of each HC.
  • The beneficial use of MoS2/γ-Al2O3 in the hydrogenation of CO favors the production of ethanol with the proper operation conditions at T = 523 K, H2/CO = 2, lower flow rate and higher pressure.

Acknowledgements

The authors gratefully acknowledge the National Science Council, Taiwan for supporting this study.

References

  1. Spivey, J.J.; Egbebi, A. Heterogeneous catalytic synthesis of ethanol from biomass-derived syngas. Chem. Soc. Rev. 2007, 36, 1514–1528. [Google Scholar] [CrossRef] [PubMed]
  2. Subramani, V.; Gangwal, S.K. A review of recent literature to search for an efficient catalytic process for the conversion of syngas to ethanol. Energy Fuels 2008, 22, 814–839. [Google Scholar] [CrossRef]
  3. Mori, S. Development of utilization technologies of biomass energy. J. Environ. Eng. Manag. 2009, 19, 67–72. [Google Scholar]
  4. Pambudi, N.A.; Torii, S.; Saptoadi, H.; Sumbodo, W.; Syamsiyo, M.; Surono, U.B. Experimental study on combustion of biobriquettes jatropha curcas solid waste. J. Environ. Eng. Manag. 2010, 20, 133–136. [Google Scholar]
  5. Chuang, Y.S.; Chen, C.C.; Lay, C.H.; Sung, I.Y.; Wu, J.S.; Lee, S.C.; Sen, B.; Lin, C.Y. Optimization of incubation factors for fermentative hydrogen production from agricultural wastes. Sustain. Environ. Res. 2012, 22, 99–106. [Google Scholar]
  6. Syu, F.S.; Chiueh, P.T. Process simulation of rice straw torrefaction. Sustain. Environ. Res. 2012, 22, 177–183. [Google Scholar]
  7. Ragauskas, A.J.; Williams, C.K.; Davison, B.H.; Britovsek, G.; Cairney, J.; Eckert, C.A.; Frederick, W.J.; Hallett, J.P.; Leak, D.J.; Liotta, C.L.; Mielenz, J.R.; Murphy, R.; Templer, R.; Tschaplinski, T. The path forward for biofuels and biomaterials. Science 2006, 311, 484–489. [Google Scholar] [CrossRef] [PubMed]
  8. Burch, R.; Hayes, M.J. The preparation and characterisation of Fe-promoted Al2O3-supported Rh catalysts for the selective production of ethanol from syngas. J. Catal. 1997, 165, 249–261. [Google Scholar] [CrossRef]
  9. Mazzocchia, C.; Gronchi, P.; Kaddouri, A.; Tempesti, E.; Zanderighi, L.; Kiennemann, A. Hydrogenation of CO over Rh/SiO2-CeO2 catalysts: Kinetic evidences. J. Mol. Catal. A Chem. 2001, 165, 219–230. [Google Scholar] [CrossRef]
  10. Ojeda, M.; Granados, M.L.; Rojas, S.; Terreros, P.; Garcia-Garcia, F.J.; Fierro, J.L.G. Manganese-promoted Rh/Al2O3 for C-2-oxygenates synthesis from syngas—Effect of manganese loading. Appl. Catal. A Gen. 2004, 261, 47–55. [Google Scholar] [CrossRef]
  11. Koizumi, N.; Murai, K.; Ozaki, T.; Yamada, M. Development of sulfur tolerant catalysts for the synthesis of high quality transportation fuels. Catal. Today 2004, 89, 465–478. [Google Scholar] [CrossRef]
  12. Li, D.B.; Yang, C.; Qi, H.J.; Zhang, H.R.; Li, W.H.; Sun, Y.H.; Zhong, B. Higher alcohol synthesis over a La promoted Ni/K2CO3/MoS2 catalyst. Catal. Commun. 2004, 5, 605–609. [Google Scholar] [CrossRef]
  13. Li, D.B.; Zhao, N.; Qi, H.J.; Li, W.H.; Sun, Y.H.; Zhong, B. Ultrasonic preparation of Ni modified K2CO3/MoS2 catalyst for higher alcohols synthesis. Catal. Commun. 2005, 6, 674–678. [Google Scholar] [CrossRef]
  14. Li, D.; Yang, C.; Zhao, N.; Qi, H.; Li, W.; Sun, Y.; Zhong, B. The performances of higher alcohol synthesis over nickel modified K2CO3/MoS2 catalyst. Fuel Process. Technol. 2007, 88, 125–127. [Google Scholar] [CrossRef]
  15. Woo, H.C.; Park, T.Y.; Kim, Y.G.; Nam, I.S.; Lee, J.S.; Chung, J.S. Alkali-promoted MoS2 catalysts for alcohol synthesis—The effect of alkali promotion and preparation condition on activity and selectivity. Stud. Surf. Sci. Catal. 1993, 75, 2749–2752. [Google Scholar]
  16. Sakashita, Y.; Araki, Y.; Shimada, H. Effects of surface orientation of alumina supports on the catalytic functionality of molybdenum sulfide catalysts. Appl. Catal. A Gen. 2001, 215, 101–110. [Google Scholar] [CrossRef]
  17. Qi, H.J.; Li, D.B.; Yang, C.; Ma, Y.G.; Li, W.H.; Sun, Y.H.; Zhong, B. Nickel and manganese co-modified K/MoS2 catalyst: High performance for higher alcohols synthesis from CO hydrogenation. Catal. Commun. 2003, 4, 339–342. [Google Scholar] [CrossRef]
  18. Huang, M.; Cho, K. Density functional theory study of CO hydrogenation on a MoS2 surface. J. Phys. Chem. C 2009, 113, 5238–5243. [Google Scholar] [CrossRef]
  19. Surisetty, V.R.; Dalai, A.K.; Kozinski, J. Effect of Rh promoter on MWCNT-supported alkali-modified MoS2 catalysts for higher alcohols synthesis from CO hydrogenation. Appl. Catal. A Gen. 2010, 381, 282–288. [Google Scholar] [CrossRef]
  20. Inoue, T.; Iizuka, T.; Tanabe, K. Hydrogenation of carbon dioxide and carbon monoxide over supported rhodium catalysts under 10 bar pressure. Appl. Catal. 1989, 46, 1–9. [Google Scholar] [CrossRef]
  21. Hu, J.; Wang, Y.; Cao, C.; Elliott, D.C.; Stevens, D.J.; White, J.F. Conversion of biomass-derived syngas to alcohols and C2 oxygenates using supported Rh catalysts in a microchannel reactor. Catal. Today 2007, 120, 90–95. [Google Scholar] [CrossRef]
  22. Mazzocchia, C.; Tempesti, E.; Gronchi, P.; Giuffrè, L.; Zanderighi, L. Hydrogenation of CO over ZrO2-supported Rh catalysts: Role of experimental parameters in modifying the C2H5OHCH4 product ratio. J. Catal. 1988, 111, 345–352. [Google Scholar] [CrossRef]
  23. Egbebi, A.; Spivey, J.J. Effect of H2/CO ratio and temperature on methane selectivity in the synthesis of ethanol on Rh-based catalysts. Catal. Commun. 2008, 9, 2308–2311. [Google Scholar] [CrossRef]
  24. Berdinsky, A.S.; Chadderton, L.T.; Yoo, J.B.; Gutakovsky, A.K.; Fedorov, V.E.; Mazalov, L.N.; Fink, D. Structural changes of MoS2 nano-powder in dependence on the annealing temperature. Appl. Phys. A Mater. Sci. Process. 2005, 80, 61–67. [Google Scholar] [CrossRef]
  25. Ye, L.; Wu, C.; Guo, W.; Xie, Y. MoS2 hierarchical hollow cubic cages assembled by bilayers: One-step synthesis and their electrochemical hydrogen storage properties. Chem. Commun. 2006, 45, 4738–4740. [Google Scholar] [CrossRef]
  26. Luo, H.Y.; Lin, P.Z.; Xie, S.B.; Zhou, H.W.; Xu, C.H.; Huang, S.Y.; Lin, L.W.; Liang, D.B.; Yin, P.L.; Xin, Q. The role of Mn and Li promoters in supported rhodium catalysts in the formation of acetic acid and acetaldehyde. J. Mol. Catal. A Chem. 1997, 122, 115–123. [Google Scholar] [CrossRef]
  27. Haider, M.A.; Gogate, M.R.; Davis, R.J. Fe-promotion of supported Rh catalysts for direct conversion of syngas to ethanol. J. Catal. 2009, 261, 9–16. [Google Scholar] [CrossRef]

