Article

Improved Bagging Algorithm for Pattern Recognition in UHF Signals of Partial Discharges

State Key Laboratory of Power Transmission Equipment& System Security and New Technology, College of Electrical Engineering, Chongqing University, Chongqing 400030, China
*
Author to whom correspondence should be addressed.
Energies 2011, 4(7), 1087-1101; https://doi.org/10.3390/en4071087
Submission received: 25 April 2011 / Revised: 24 June 2011 / Accepted: 14 July 2011 / Published: 21 July 2011

Abstract

:
This paper presents an Improved Bagging Algorithm (IBA) to recognize ultra-high-frequency (UHF) signals of partial discharges (PDs). This approach establishes the sample information entropy for each sample and the re-sampling process of the traditional Bagging algorithm is optimized. Four typical discharge models were designed in the laboratory to simulate the internal insulation faults of power transformers. The optimized third order Peano fractal antenna was applied to capture the PD UHF signals. Multi-scale fractal dimensions as well as energy parameters extracted from the decomposed signals by wavelet packet transform were used as the characteristic parameters for pattern recognition. In order to verify the effectiveness of the proposed algorithm, the back propagation neural network (BPNN) and the support vector machine (SVM) based on the IBA were adopted in this paper to carry out the pattern recognition for PD UHF signals. Experimental results show that the proposed approach of IBA can effectively enhance the generalization capability and also improve the accuracy of the recognition for PD UHF signals.

1. Introduction

The safe and stable operation of power transformers is a guarantee of a reliably working power system, while insulation properties are major factors affecting the transformer performance [1]. Partial discharge (PD) pattern recognition is one of the most effective ways to prevent sudden power transformer insulation accidents. Since ultra-high-frequency (UHF) PD detection can effectively avoid the low-frequency electromagnetic interference and the corona pulse disturbance, the technology of pattern recognition of PD UHF signals has been rapidly developed for this purpose.
The existing literature covers a wide range of PD pattern recognition classifiers, including artificial neural network [1,2,3,4], support vector machine [5,6,7] and other methods [8,9,10], which all have achieved good performance. Nevertheless, variations will appear in the accuracy of a pattern recognition algorithm when the training sample data are changed [11,12]. Therefore, the stability of the classification algorithms for different data sample sets has become an obstacle for the widespread application of PD UHF on-line monitoring for power transformers.
Since ensemble learning [13] can improve the generalized capability [11] of various machine learning approaches, an Improved Bagging Algorithm (IBA) for the recognition of PD UHF signals is proposed in this paper. In this algorithm, the weights of various sample points are defined as the sample information entropy. Thus the sample selection process in the traditional Bagging algorithm is optimized. Samples are selected based on the entropy weights of each sample, so that the more valuable samples for the recognition will be selected more easily in each selection turn. Four typical PD models were designed in the laboratory and the multi-band Peano fractal antenna was applied to capture the PD UHF signals. The wavelet packet method was adopted to decompose PD UHF signals into multiple scales. Thus, the multi-scale fractal dimension and energy characteristic parameters were extracted, which can be applied to the pattern recognition. In order to verify the effectiveness of the IBA, the back propagation neural network (BPNN) and the support vector machine (SVM) based on the IBA were adopted in this paper to recognize PD UHF signals. The comparison results show that IBA can effectively enhance the generalization capability and also improve the accuracy of the recognition for PD UHF signals, making it a suitable approach for the pattern recognition of PD UHF signals.

2. Description of the Improved Bagging Algorithm

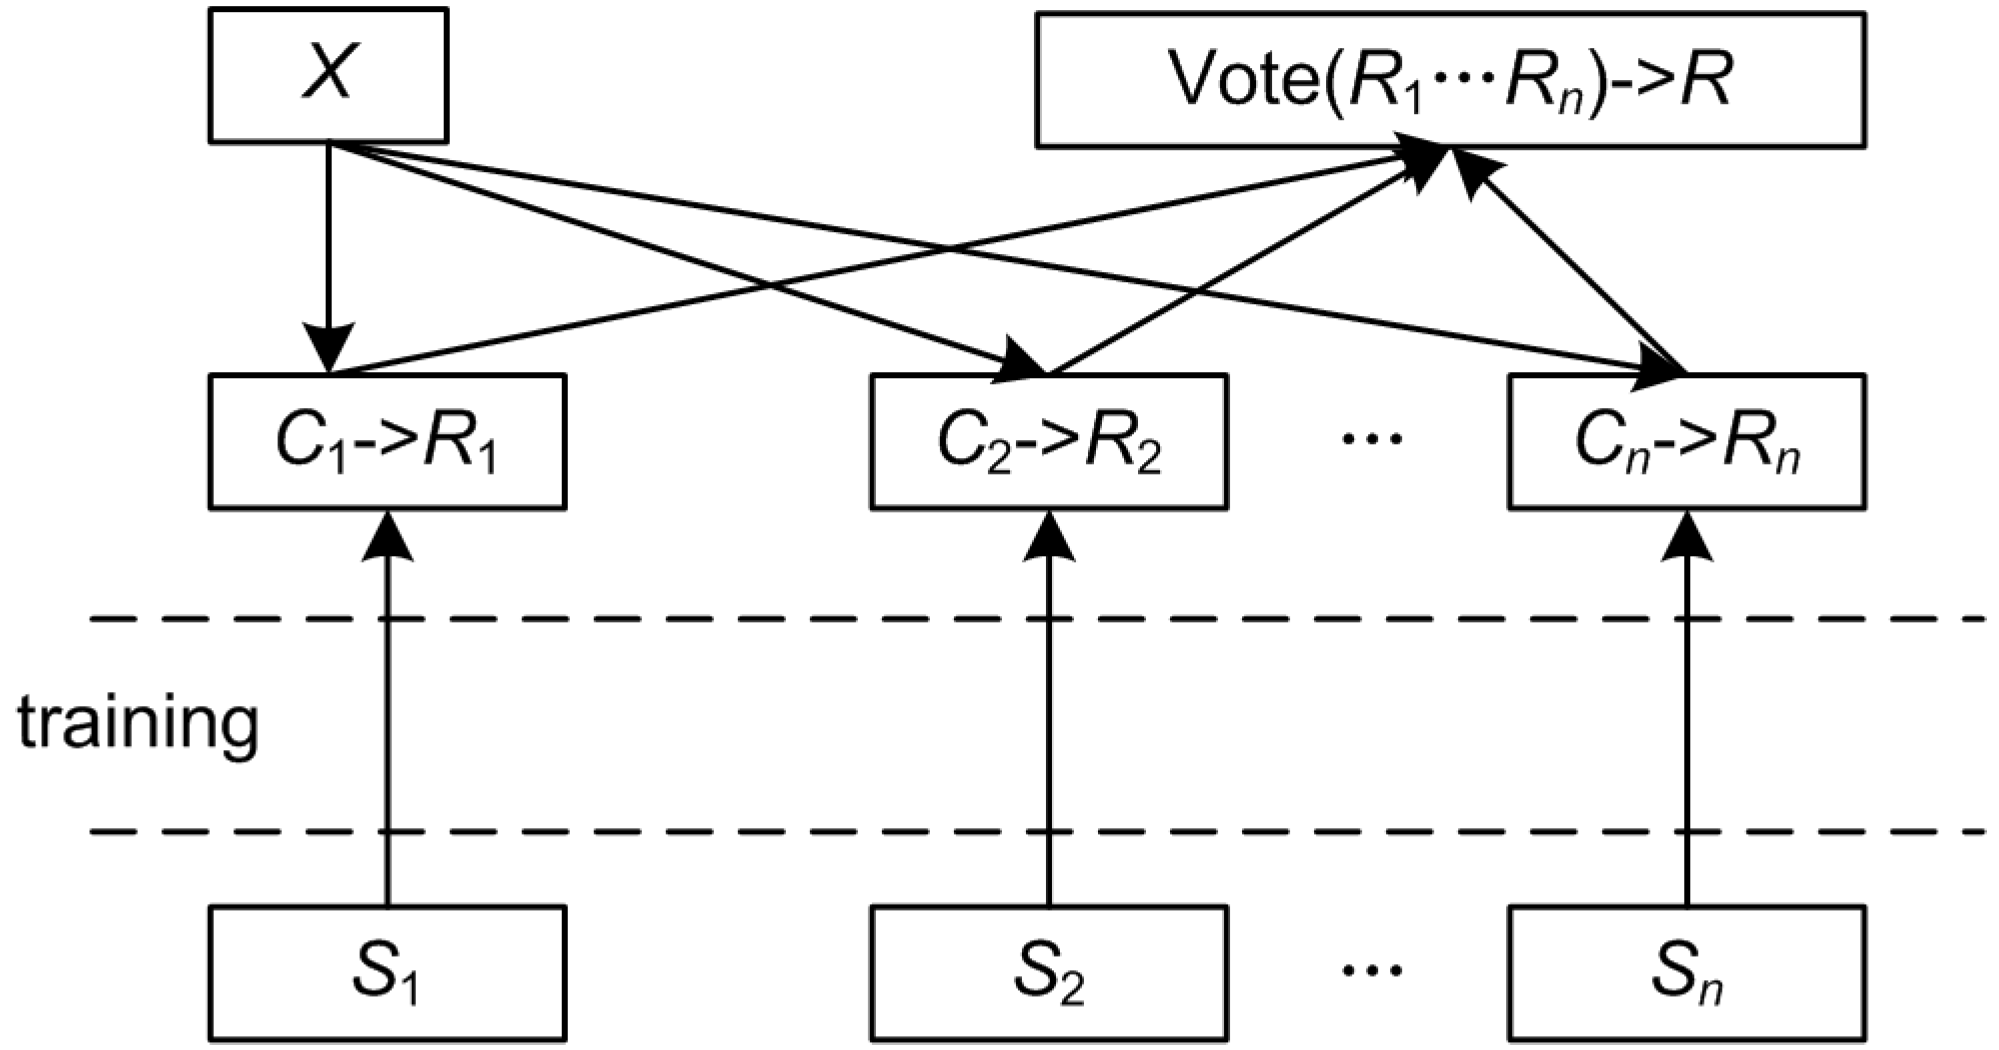
2.1. Bagging Algorithm

The Bagging algorithm is derived from a very important statistical theory [14,15], which is an effective training method. The Bagging algorithm can significantly improve the generalization capability of a learning algorithm, and it can save a lot of time by using parallel training for those time-consuming machine learning algorithms such as the neural network. The process of the Bagging algorithm is shown in Figure 1. From the finite samples set S, multiple sample sets Si are produced by means of the random return selection. The corresponding classifier Ci is trained based on the training set Si, respectively. Thus, the primary recognition results can be obtained and applied to the final pattern recognition. Furthermore, the final pattern recognition result of the testing sample X is obtained by the voting method. The classifiers Cj can be any kind of classifiers, such as the BPNN, SVM, etc.
Figure 1. Bagging algorithm description.
Energies 04 01087 g001
In the traditional Bagging algorithm, all training rounds are independent [14]. Meanwhile, each training set is generated through random selection from all samples, that is to say, the selected probability for all training samples is equal. However, the voltage level and operation environments of power transformer are different, which causes differences between the PD signals of different transformers. For the PD pattern recognition, the PD signals with more valuable data should be selected with more probability to be training samples. Thus, the PD samples of power transformers should be selected with the different probability. However, the sample selection process in the traditional Bagging algorithm is random. Therefore, in order to select more appropriate samples as training sets for maintaining generalization capability, the sample selection process in the Bagging algorithm needs to be further improved.

2.2. Entropy-Based Improved Bagging Algorithm

For the sample of UHF PD signals, some samples are bound to have more reference value to the pattern recognition, and these samples should be selected with a higher probability in the training process. Therefore, the concept of the information-entropy-based weight of samples is introduced in this paper. And the method based on this concept is employed to improve the sampling process of the Bagging algorithm. Theoretically, samples with more implicit information will be selected with a higher probability into the sample training set and the results will be more stable and accurate.

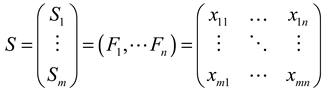
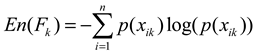
2.2.1. Sample Information Entropy

Information entropy [16] indicates the value of information, while the sample information entropy tells how much information there is in certain sample. The sample information entropy can be described as follows: suppose there are m samples (S1,S2,…,Sm) and each sample contains n features (F1,F2,…,Fn), the matrix, S , containing m samples is expressed as:
Energies 04 01087 i001
Each feature value of each sample is xij. The information entropy of feature Fk is expressed as:
Energies 04 01087 i002
Here, p(xij) is the probability mass function. It can be obtained by the following formula:
Energies 04 01087 i003
In Formula (3), the function discrete(u) represents the mapping value of u after the discretization on the feature Energies 04 01087 i006
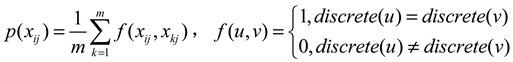
. In this paper, the equal-width interval division method [17] is employed to the discretization process for the continuous features.
In the equal-width interval division method, several equal fixed width partitions of the range from the minimum to the maximum value of the data are defined first. Then the data are assigned to the partitions in accordance with their respective values. In each partition, the average value can be the discrete mapping value for the data. Thus the discretization function, discrete(u), is realized.
The information entropy of single sample point Si can be described as:
Energies 04 01087 i004

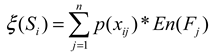
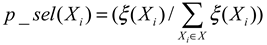
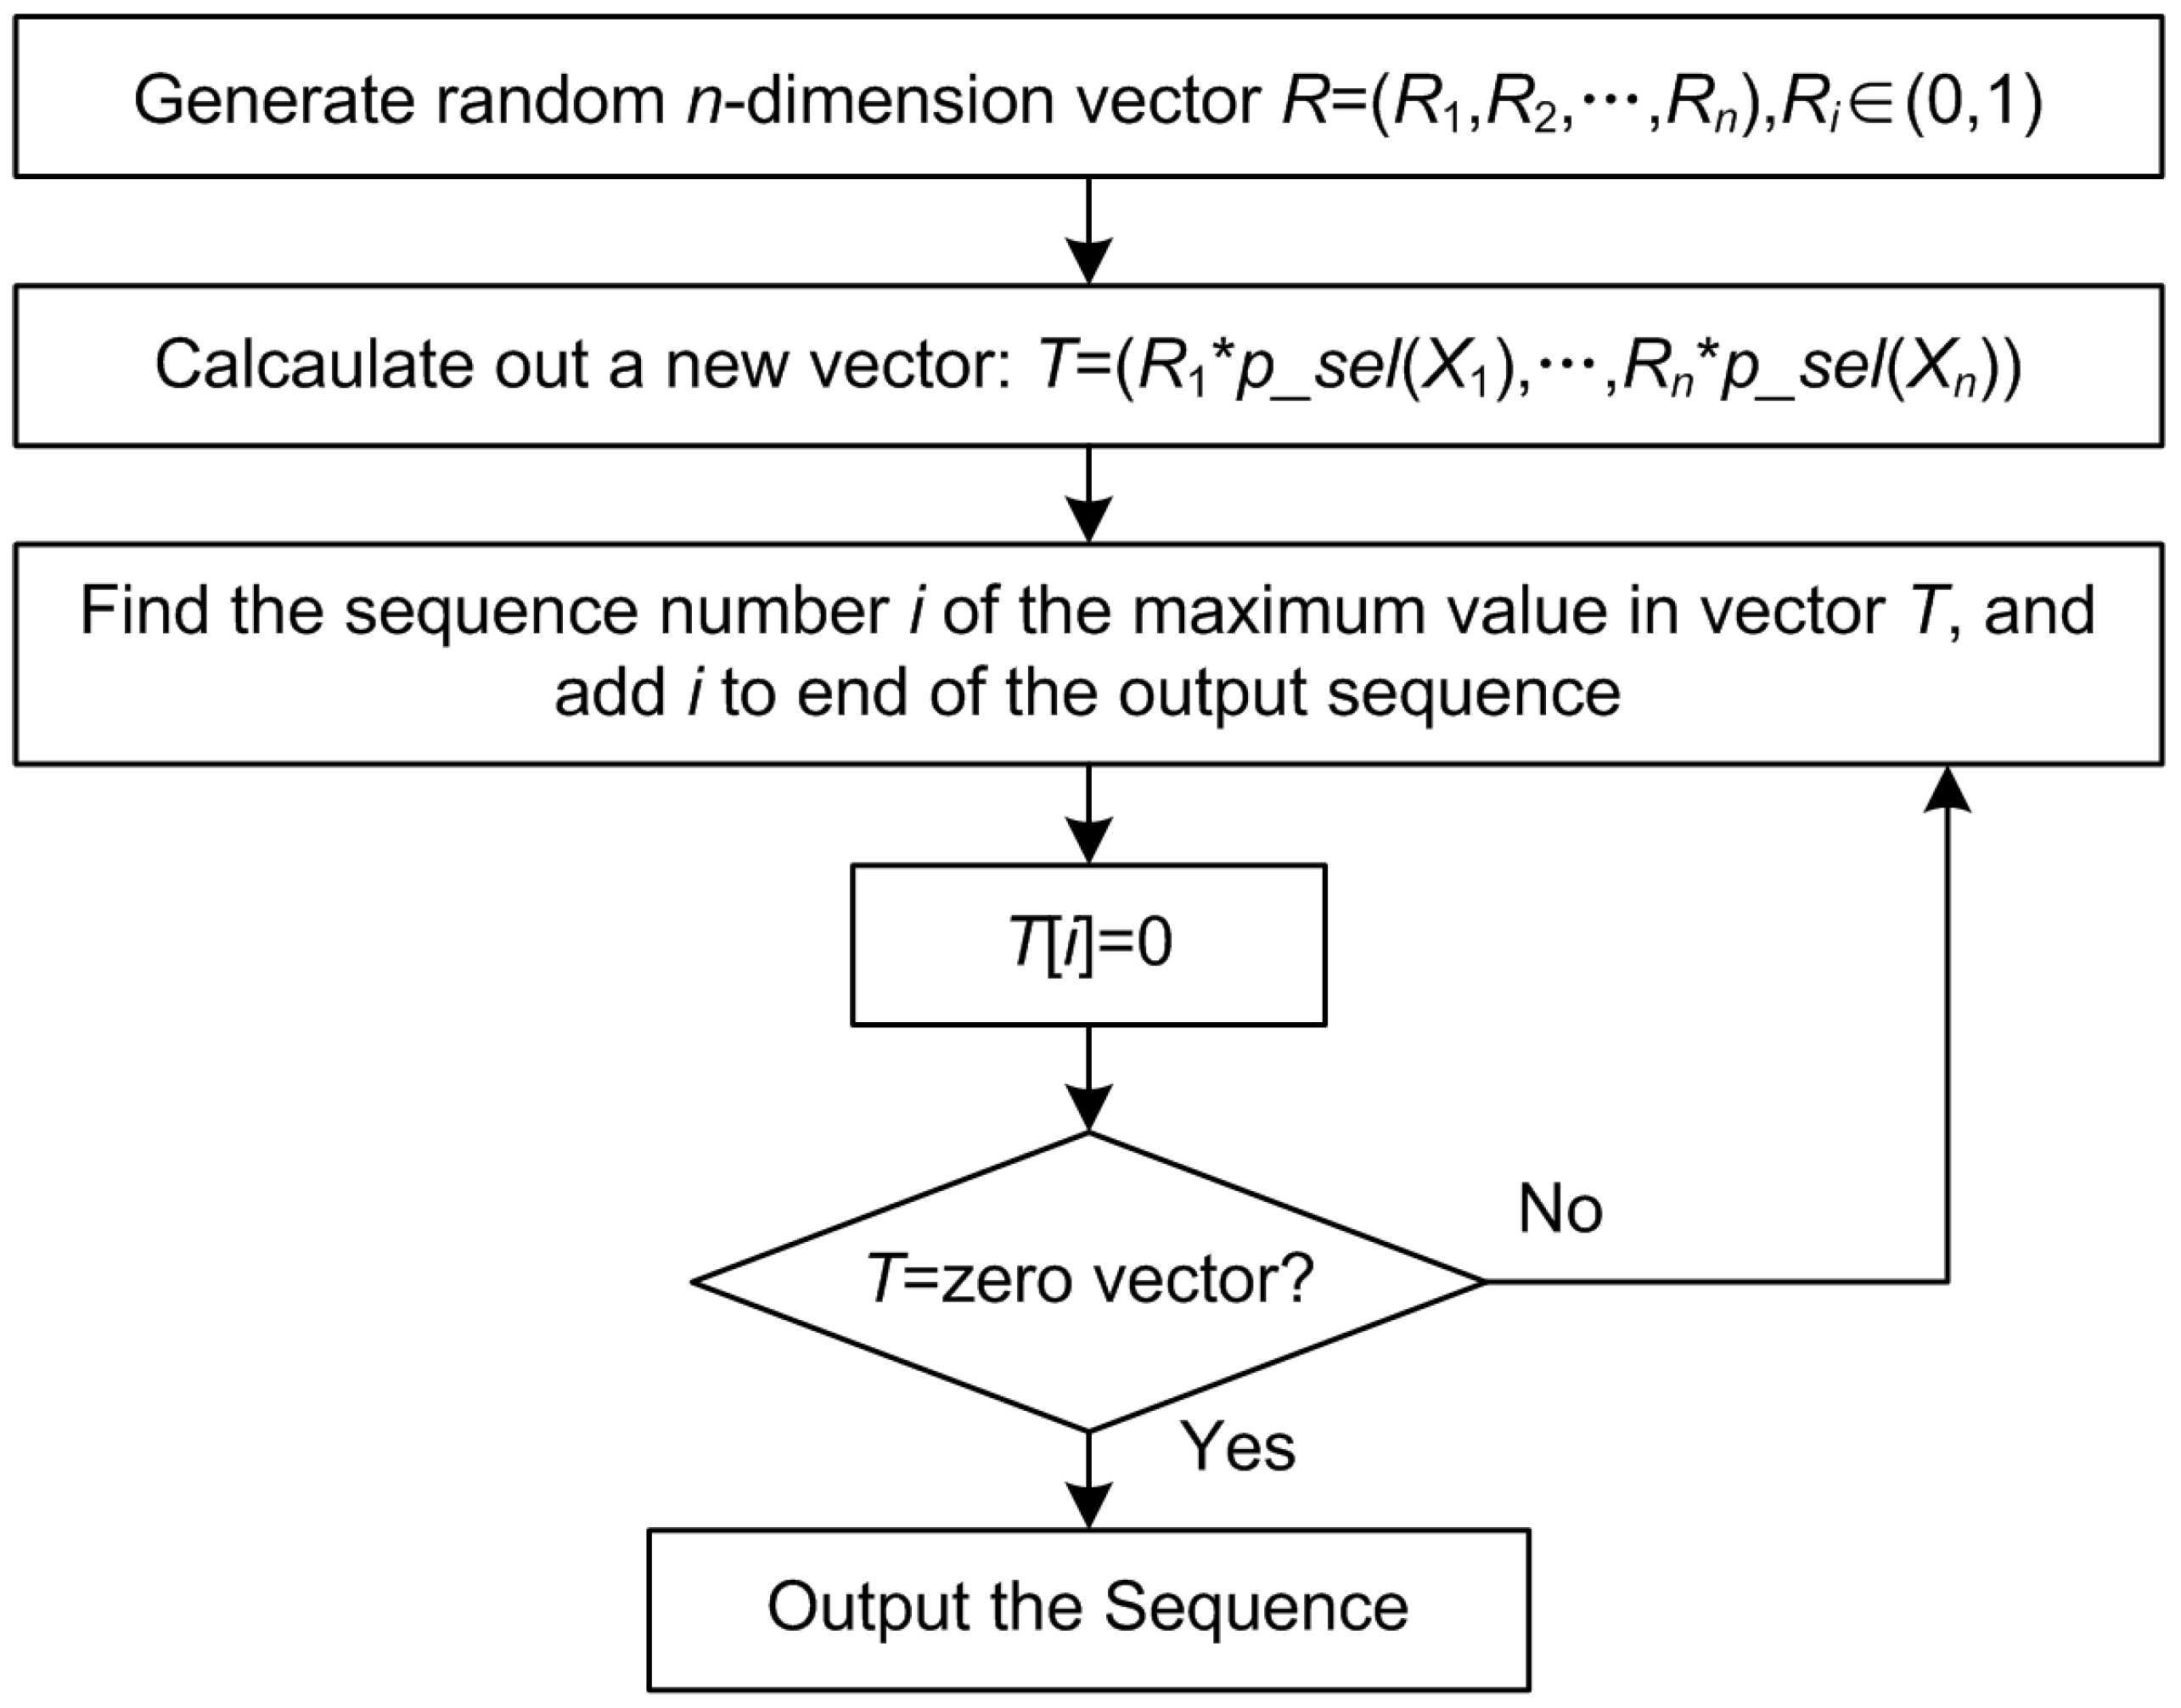
2.2.2. Sampling Algorithm Based on Sample Entropy

Suppose the information entropy of sample point Xi is ξ(Xi). The selected probability of each sample point can be normalized according to (5):
Energies 04 01087 i005
The sampling algorithm is shown in Figure 2.
Figure 2. Sampling algorithm description.
Energies 04 01087 g002

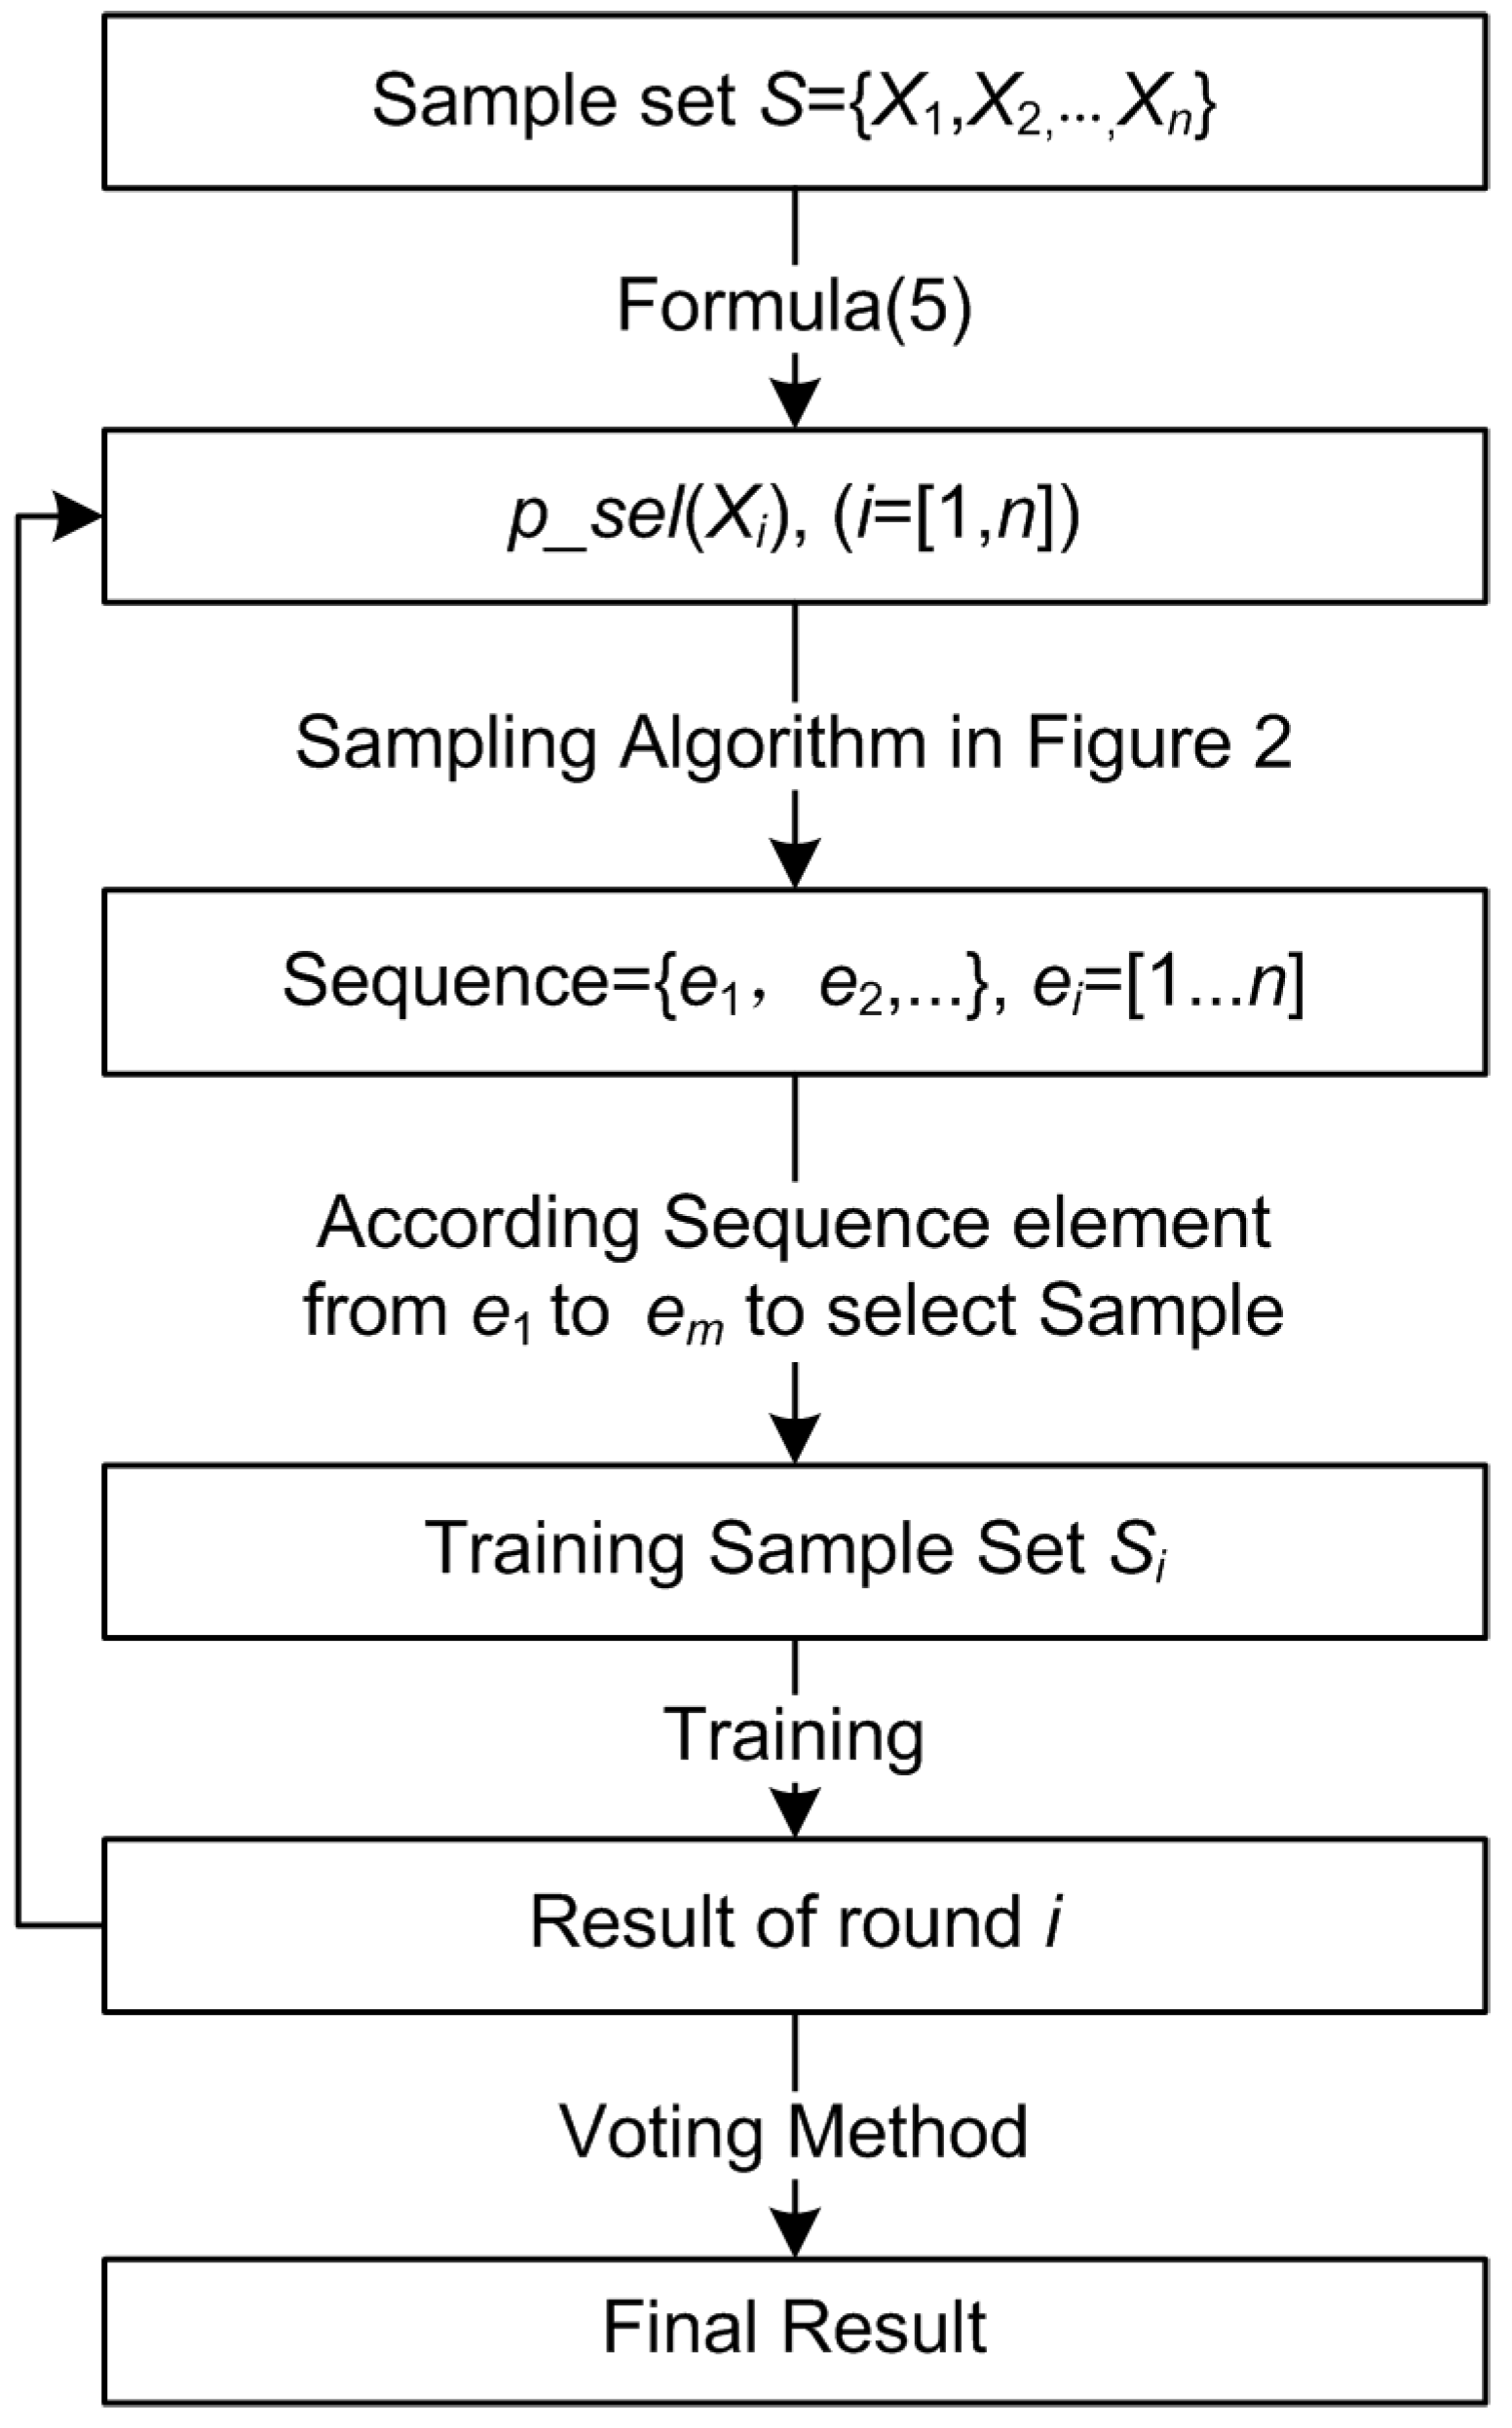
2.2.3. Improved Bagging Algorithm Process

The idea of the Improved Bagging Algorithm (IBA) is to improve the sampling process of the training sets from S1 to Sn. Figure 3 shows the IBA process that is summarized as follows:
(1) Assign each sample a serial number from 1 to n and calculate out the information entropy of each sample according to Formula (4);
(2) Implement the sampling algorithm in Figure 2 to obtain the sample selection sequence; the values of the element in the sequence are corresponding to the serial number of the samples;
(3) In accordance with the first m (m < n) element values in the sequence, select the corresponding sample from the entire sample sets to be the training set, Si of Figure 1, of the current round;
(4) According to the specified classification algorithm, implement the training process on Si to obtain the training results of the current round;
(5) Repeat steps 2–4;
(6) Obtain the ultimate result by voting method on all rounds of training results.
Figure 3. The process of the Improved Bagging algorithm.
Energies 04 01087 g003

3. Experiment

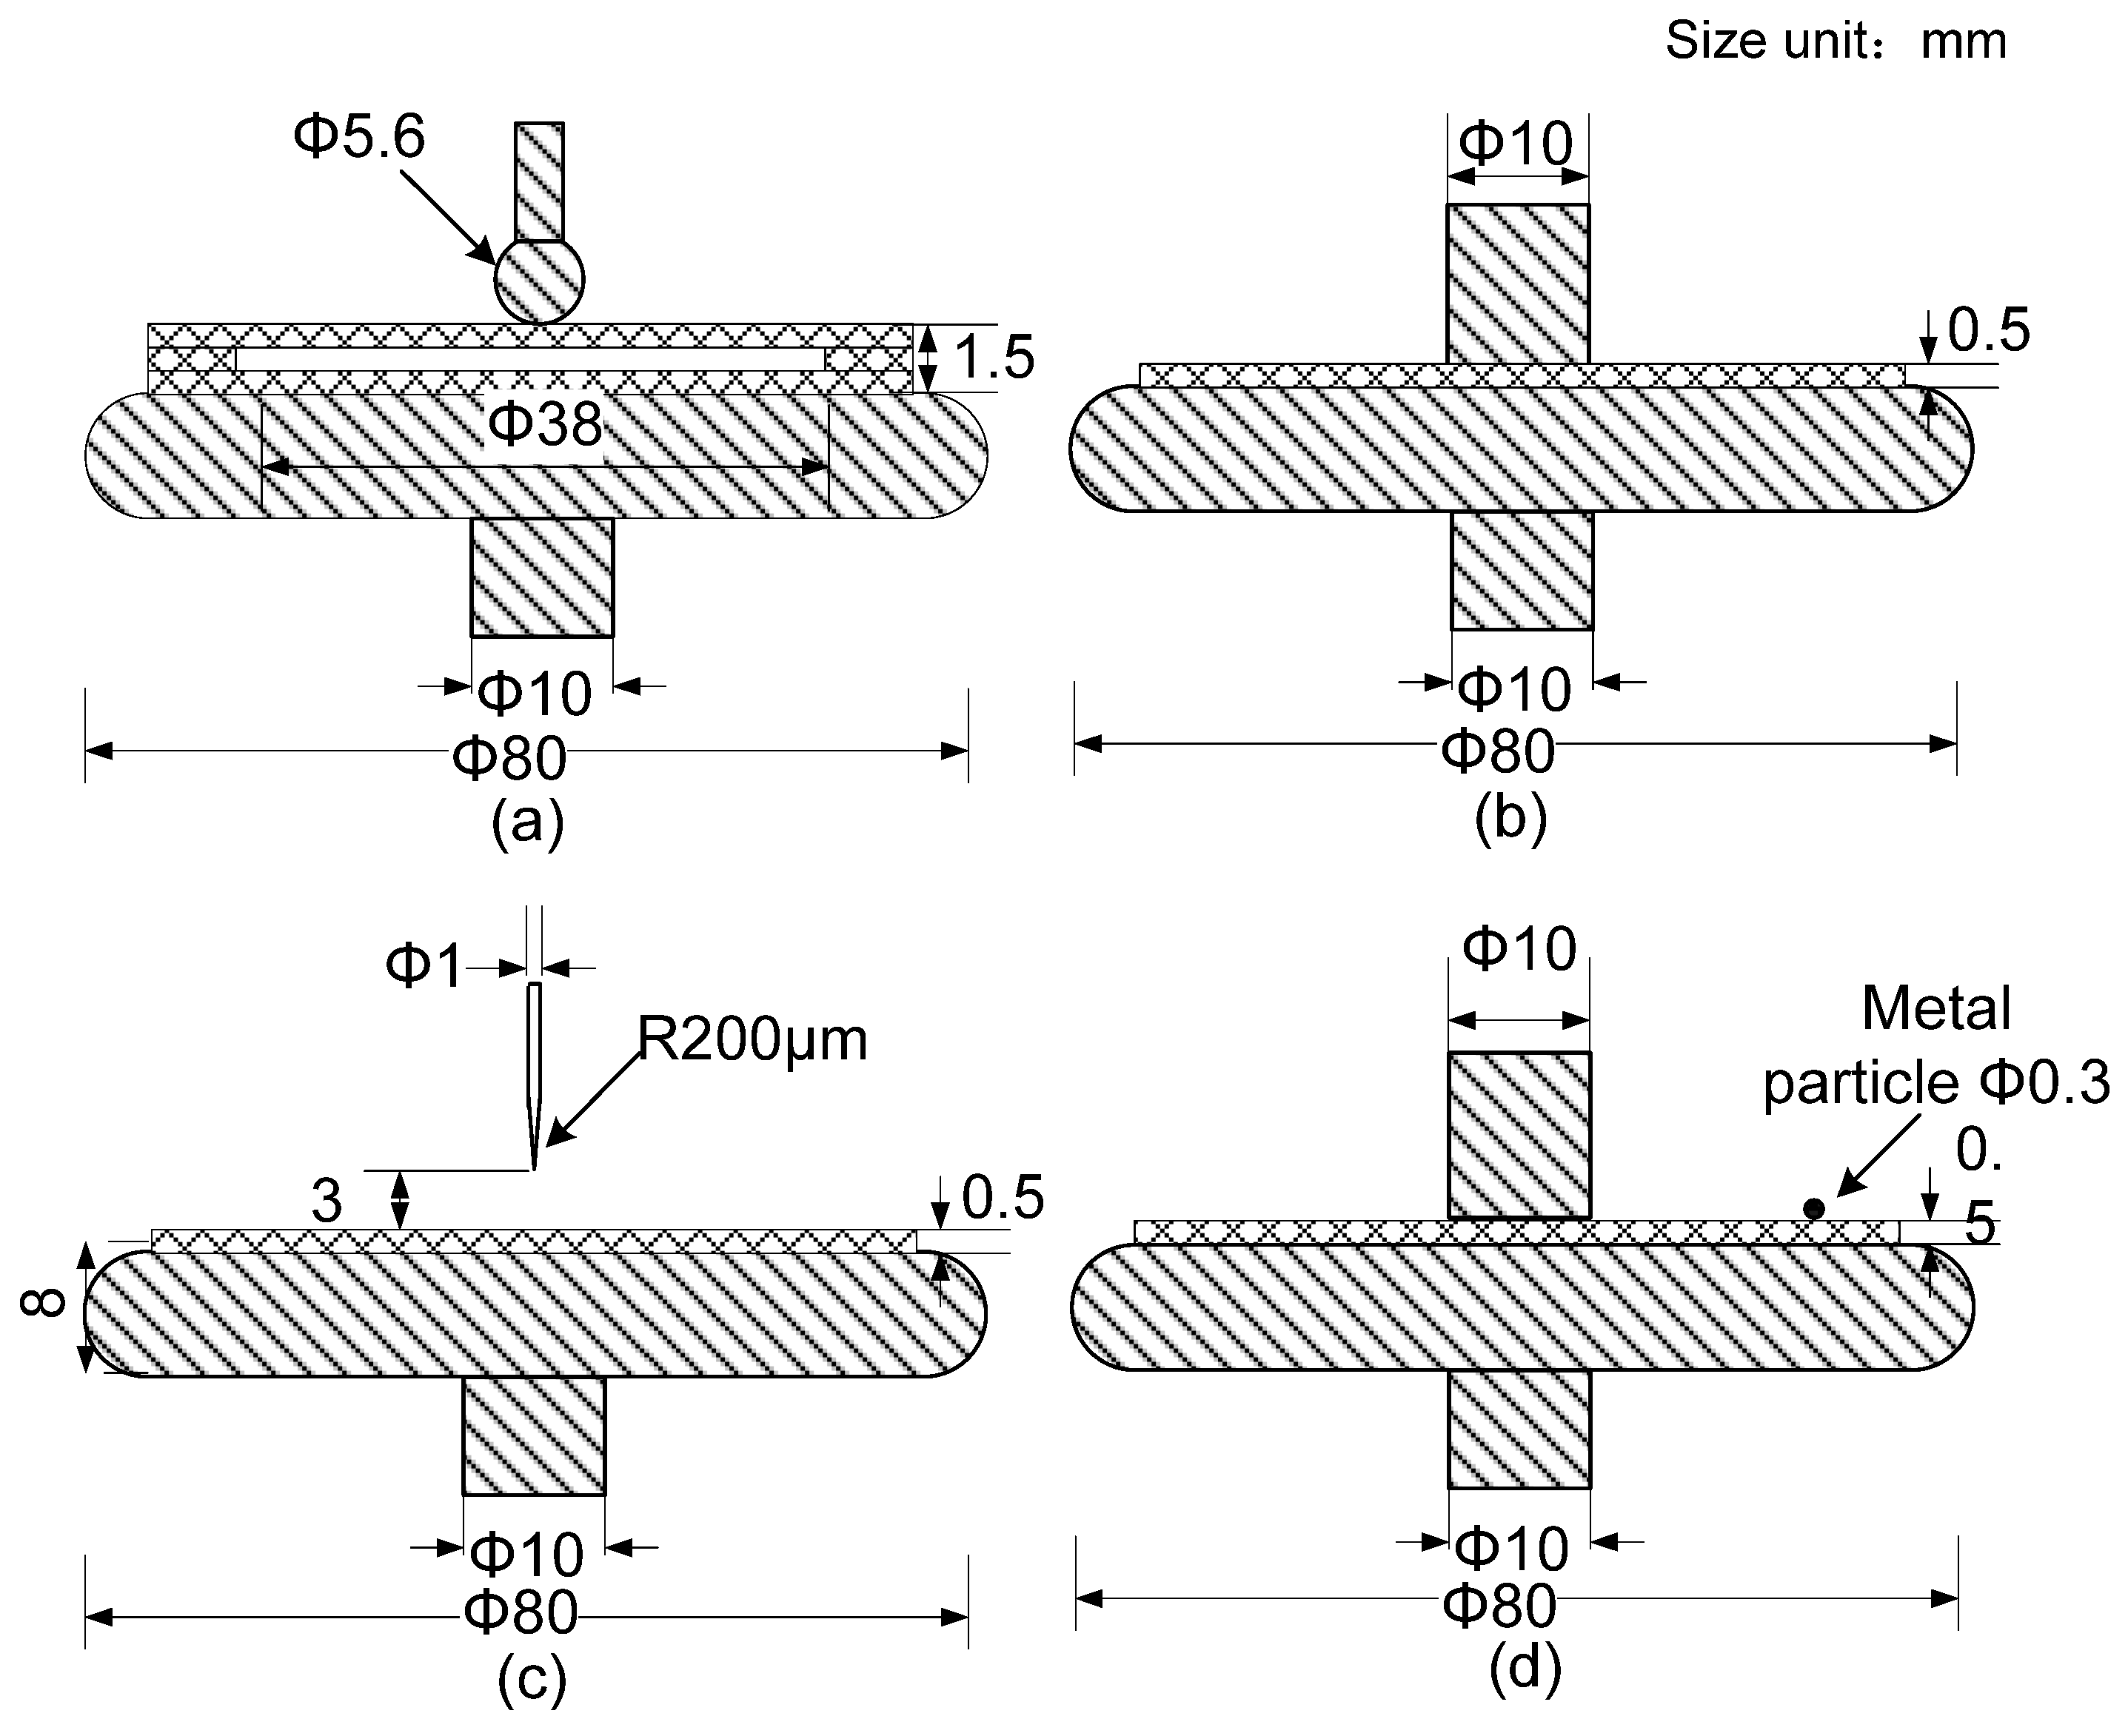
3.1. Artificial Insulation Fault Models

In order to get a large number of testing samples for pattern recognition, four typical insulation fault models were designed in the laboratory to simulate PD in power transformers (shown in Figure 4). Figure 4a shows the internal cavity discharge model (called as discharge model G). The cavity in this model is made up of three layers of oil-paper, which is 80 mm in diameter and 0.5 mm in thickness. There is a round hole with a diameter of 38 mm in the center of the paper board. Figure 4b shows the oil surface discharge model (called as discharge model S). Figure 4c shows the oil corona discharge model (called as discharge model C), in which the tip of needle electrode is 3 mm away from the paper board. Figure 4d shows the oil floating electrode discharge model (called as discharge model F), in which a metal particle with a diameter of 0.3 mm is placed at the edge of the paper board.
Figure 4. Four types of artificial insulation defect model: (a) Oil gas-cavity discharge model; (b) Oil surface discharge model; (c) Oil corona discharge model; and (d) Oil floating electrode discharge model.
Energies 04 01087 g004

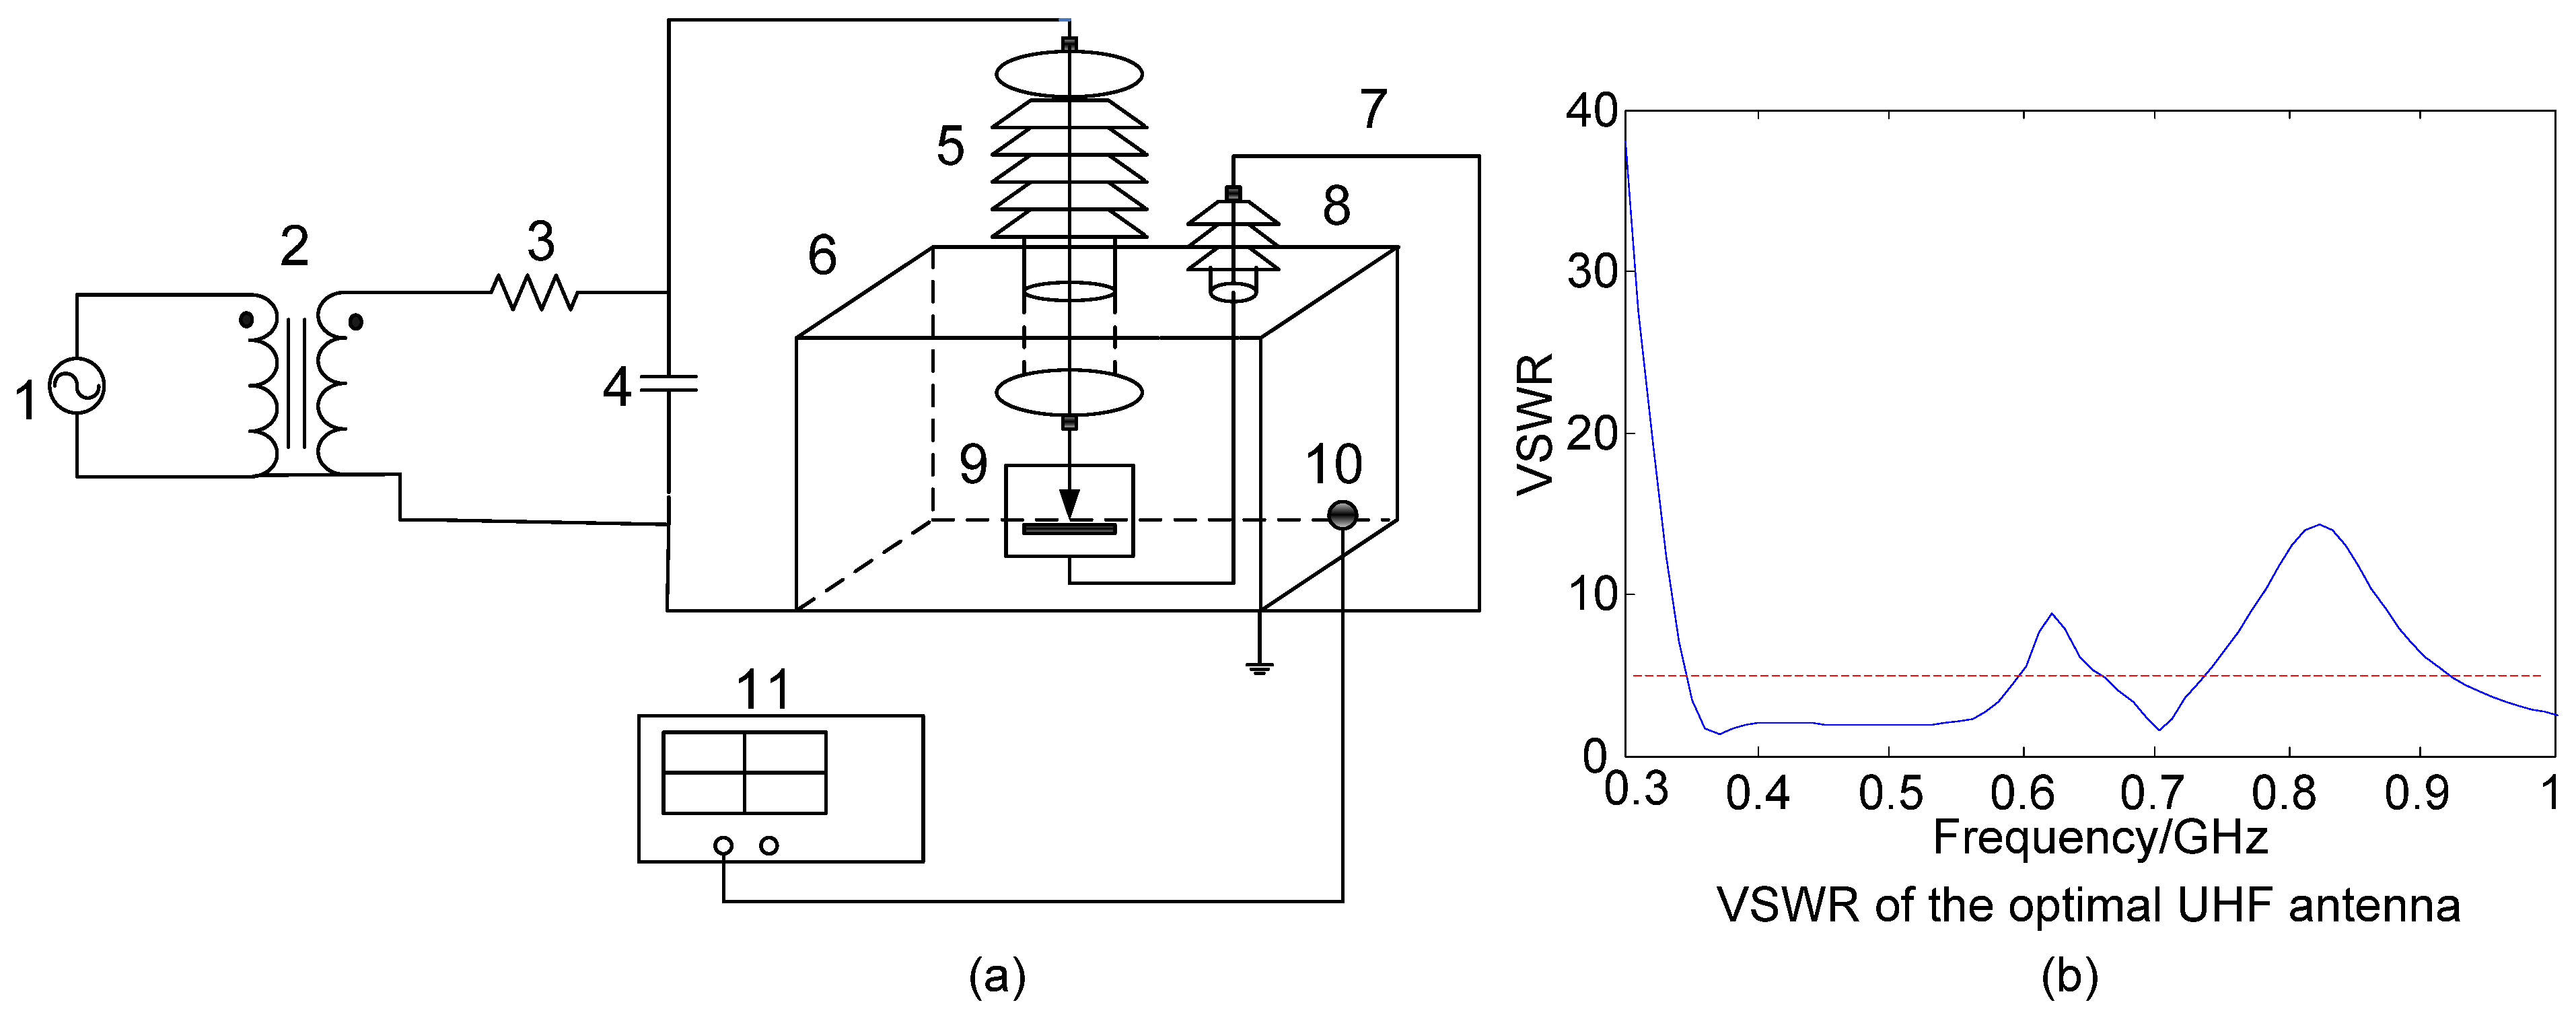
3.2. Experimental Setup

Figure 5 shows the experimental setup of PD UHF measurement and voltage standing wave ratio (VSWR) of the optimal third-order Peano fractal antenna. The experiments were carried out in a simulated transformer tank in the shielded laboratory. During the experiments, the artificial insulation fault model test samples were placed in the middle of the oil tank and connected to the ground through a small bushing. The tank is rectangular, with a length of 90 mm, width of 70 cm and height of 90 cm, respectively. The UHF electromagnetic waves produced by the sample PD were received by the third-order Peano fractal antenna. The antenna was installed on the inner side of the tank, as shown in Figure 5a. The optimally designed antenna had three frequency pass-bands between 300 MHz and 1 GHz, as shown in Figure 5b. The measured signals of Peano fractal antenna were transmitted to the LeCory7200 digital oscilloscope through a coaxial cable with the length of 8 m and the impedance of 50 Ω. The sampling rate of the oscilloscope is 5 GS/s.
Figure 5. (a) Laboratory partial discharge test diagram: (1) Alternating current power supply; (2) Step-up transformer; (3) Protective resistance; (4) Coupling capacitor; (5) High-tension bushing; (6) Oil tank; (7) Ground connection; (8) Small bushing; (9) Insulation fault; (10) UHF antenna; and (11) Oscilloscope; (b) VSWR of the optimal UHF antenna.
Energies 04 01087 g005
The experimental conditions and results of the tests for the four typical insulation fault models are listed briefly in Table 1. There were 50 test samples for each model. Each test sample was measured under the conditions of three different voltages for the acquisition of PD UHF signal samples. Therefore, each type of test samples can produce 150 groups of PD samples, and in total 600 groups of sample data were obtained.
Table 1. Conditions and results of insulation fault model tests.
Discharge ModelInception Voltage (kV)Testing Voltage (kV)Acquired Sample Size
G (Gas-cavity)5.8750
850
950
S (Surface)5650
750
850
C (Corona)7.5950
1050
1150
F (Floating)4.2550
650
750

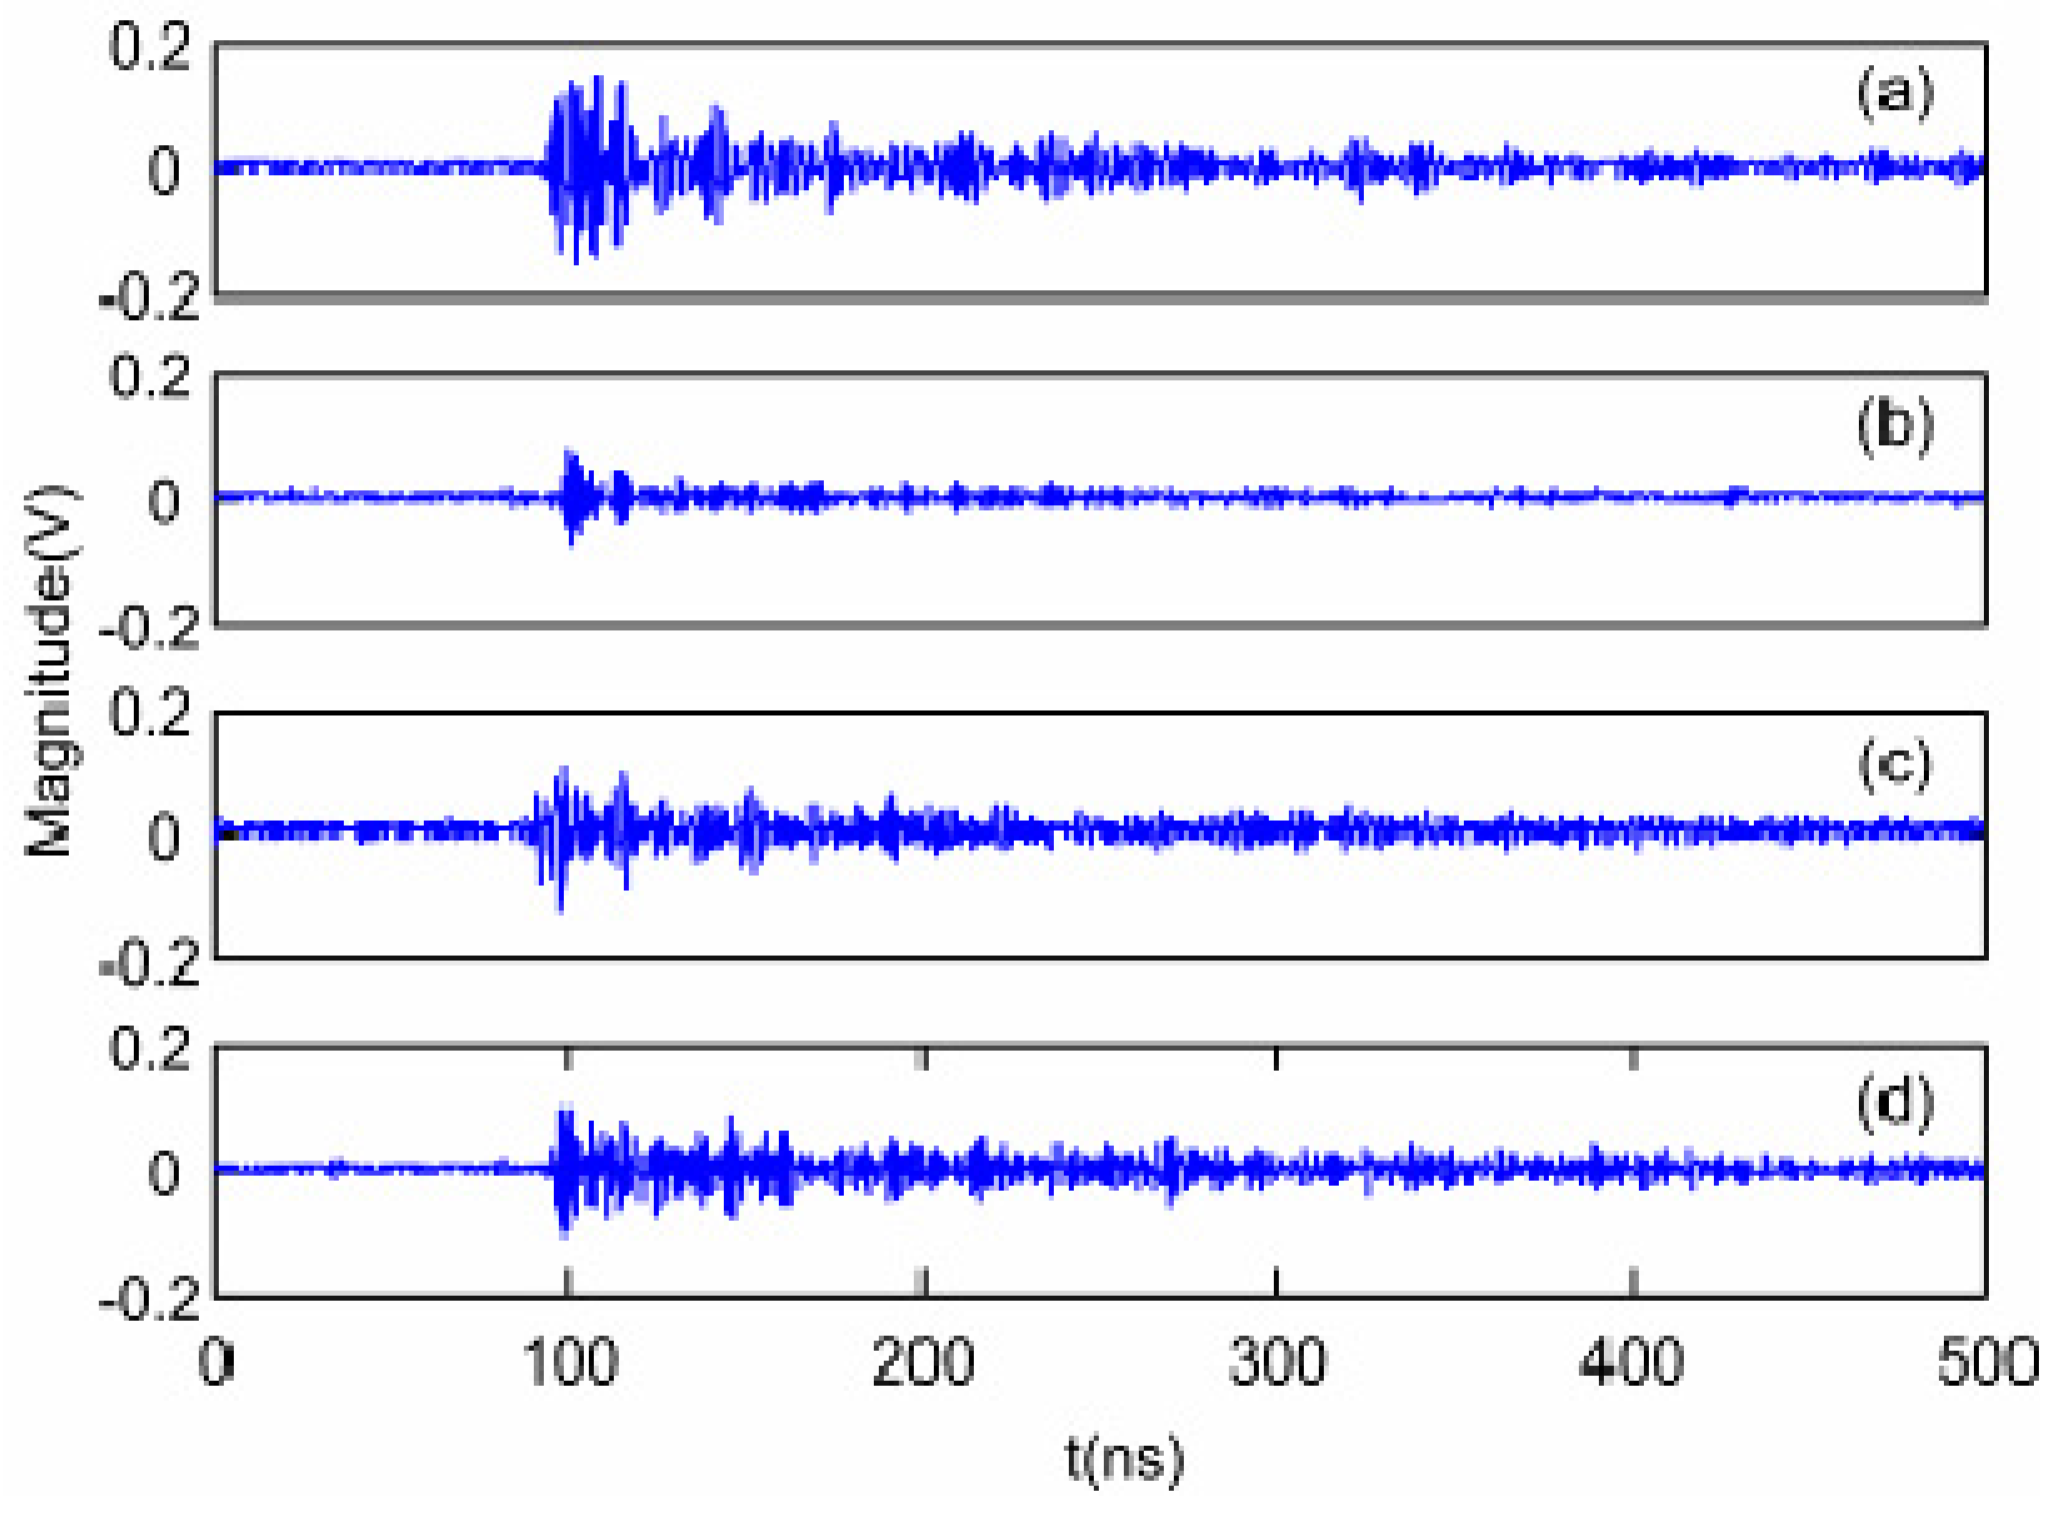
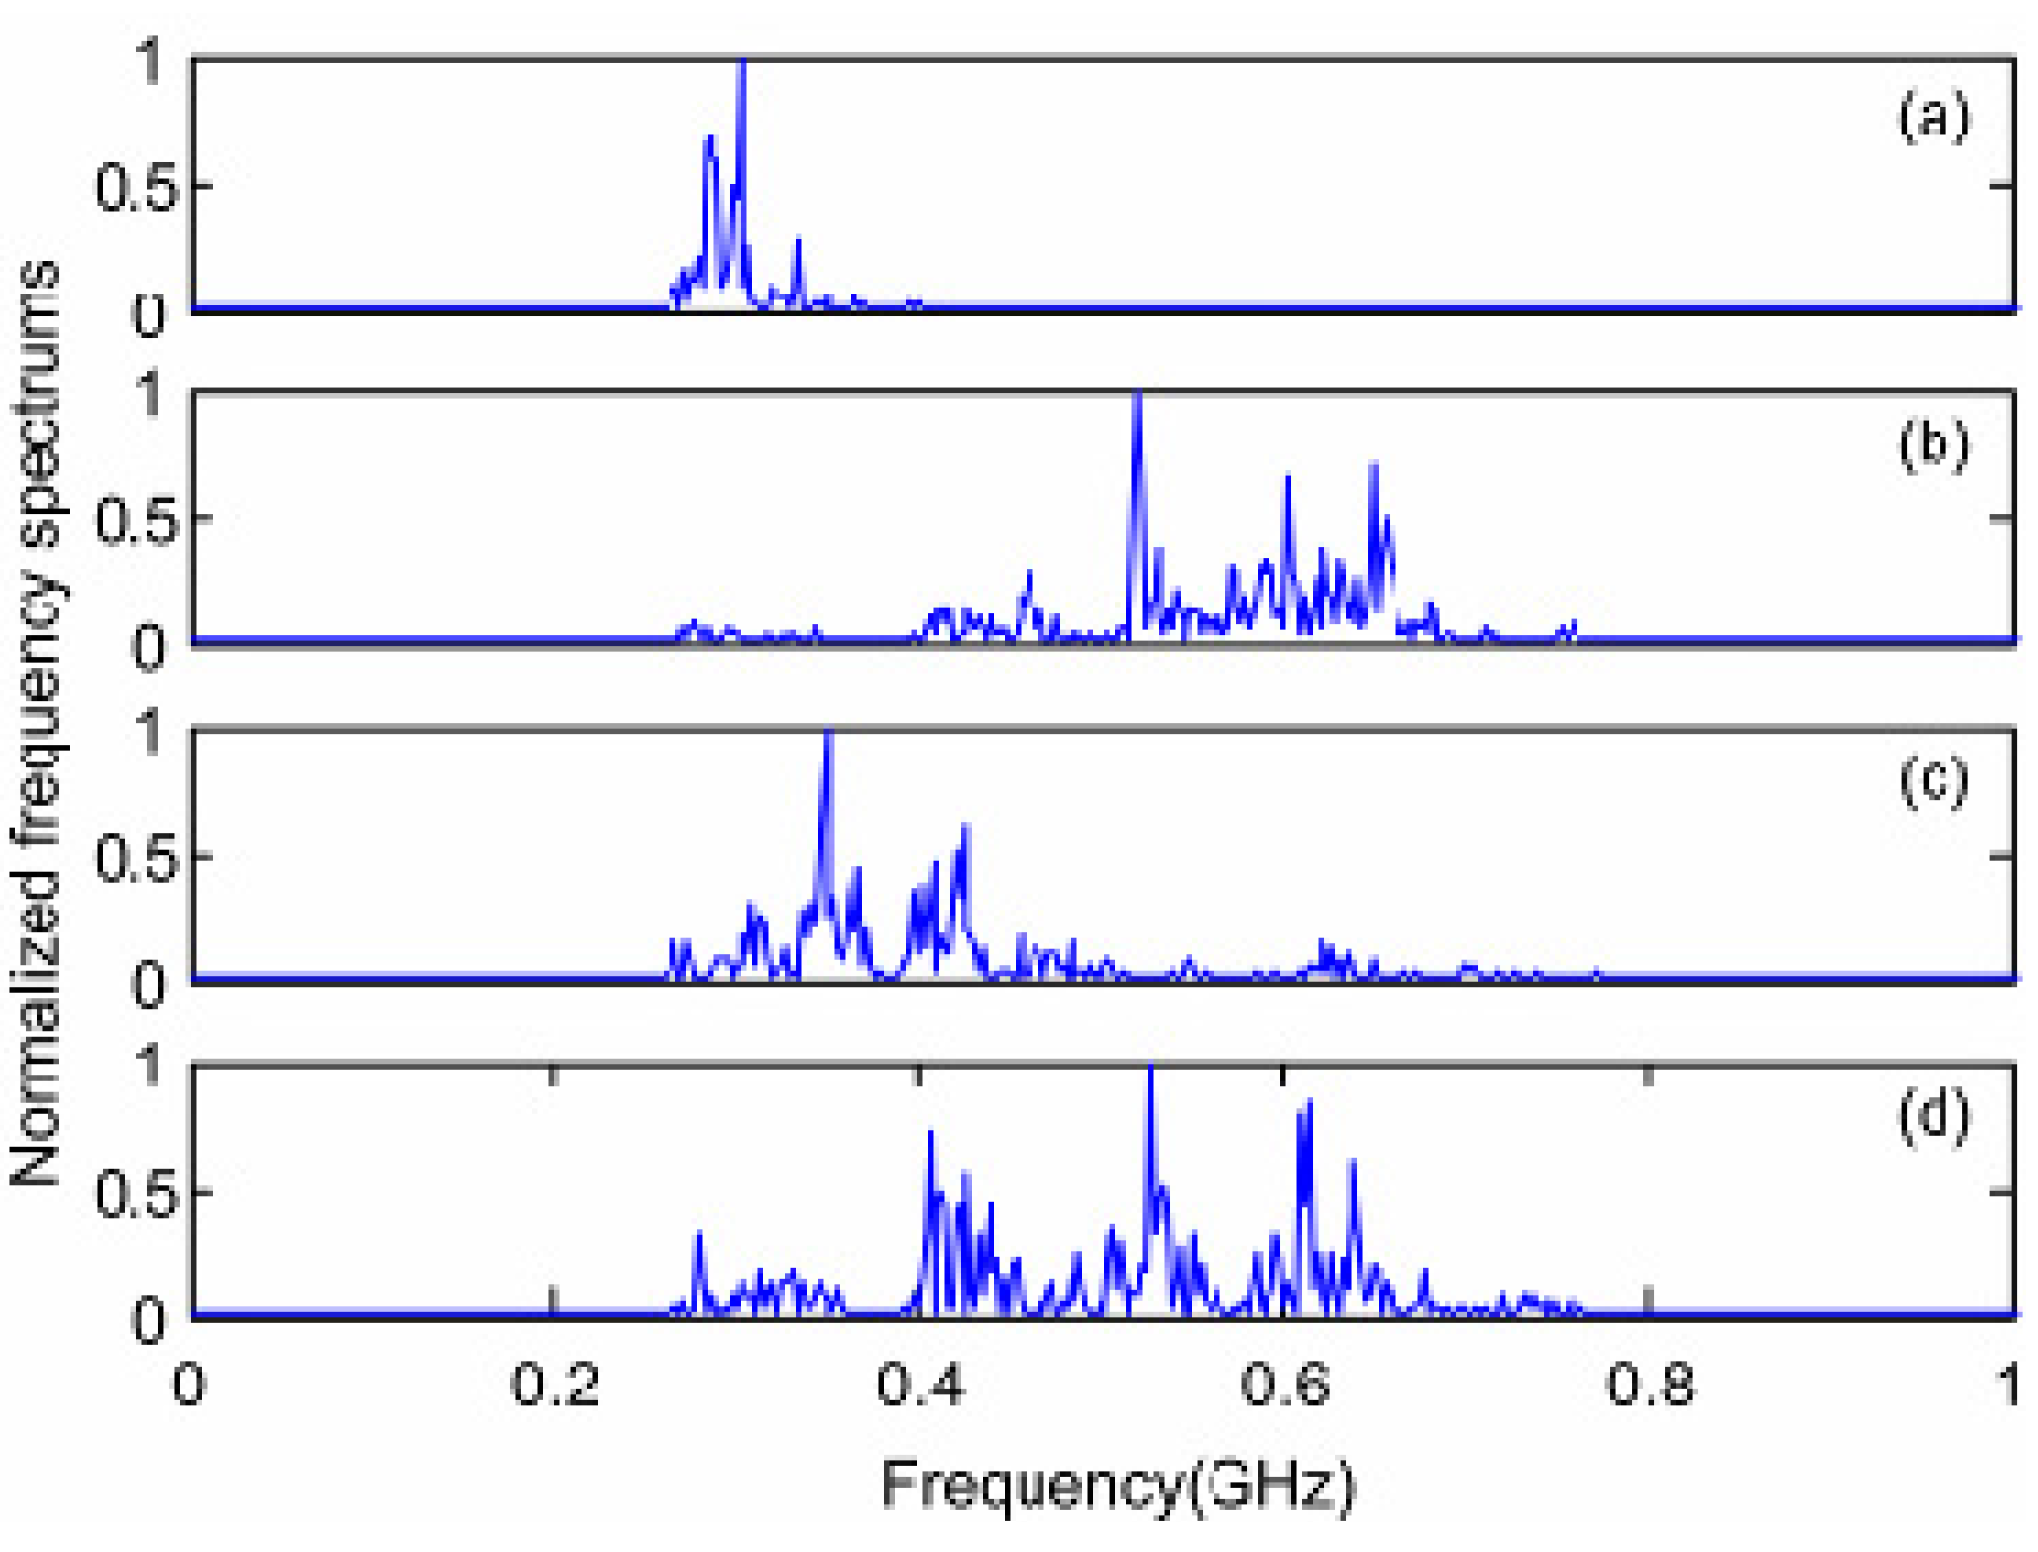
3.3. Analysis of Partial Discharge UHF Signals

Figure 6 and Figure 7 show the waveforms and normalized power spectra of the UHF signals produced by the four discharge models. The background noise of the experimental system is 30 mV. The four PD signals seem similar to each other, but differ in details. It is obvious that the UHF signals produced by the four PD types vary greatly in frequency domain. The PD UHF signals can be recognized based on the waveform characteristics.
Figure 6. Waveforms of UHF PD signals occurring in the four defects: (a) Discharge model G; (b) Discharge model S; (c) Discharge model C; and (d) Discharge model F.
Energies 04 01087 g006
Figure 7. Normalized power frequency spectra of UHF PD signals for the six models: (a) Discharge model G; (b) Discharge model S; (c) Discharge model C; and (d) Discharge model F.
Energies 04 01087 g007

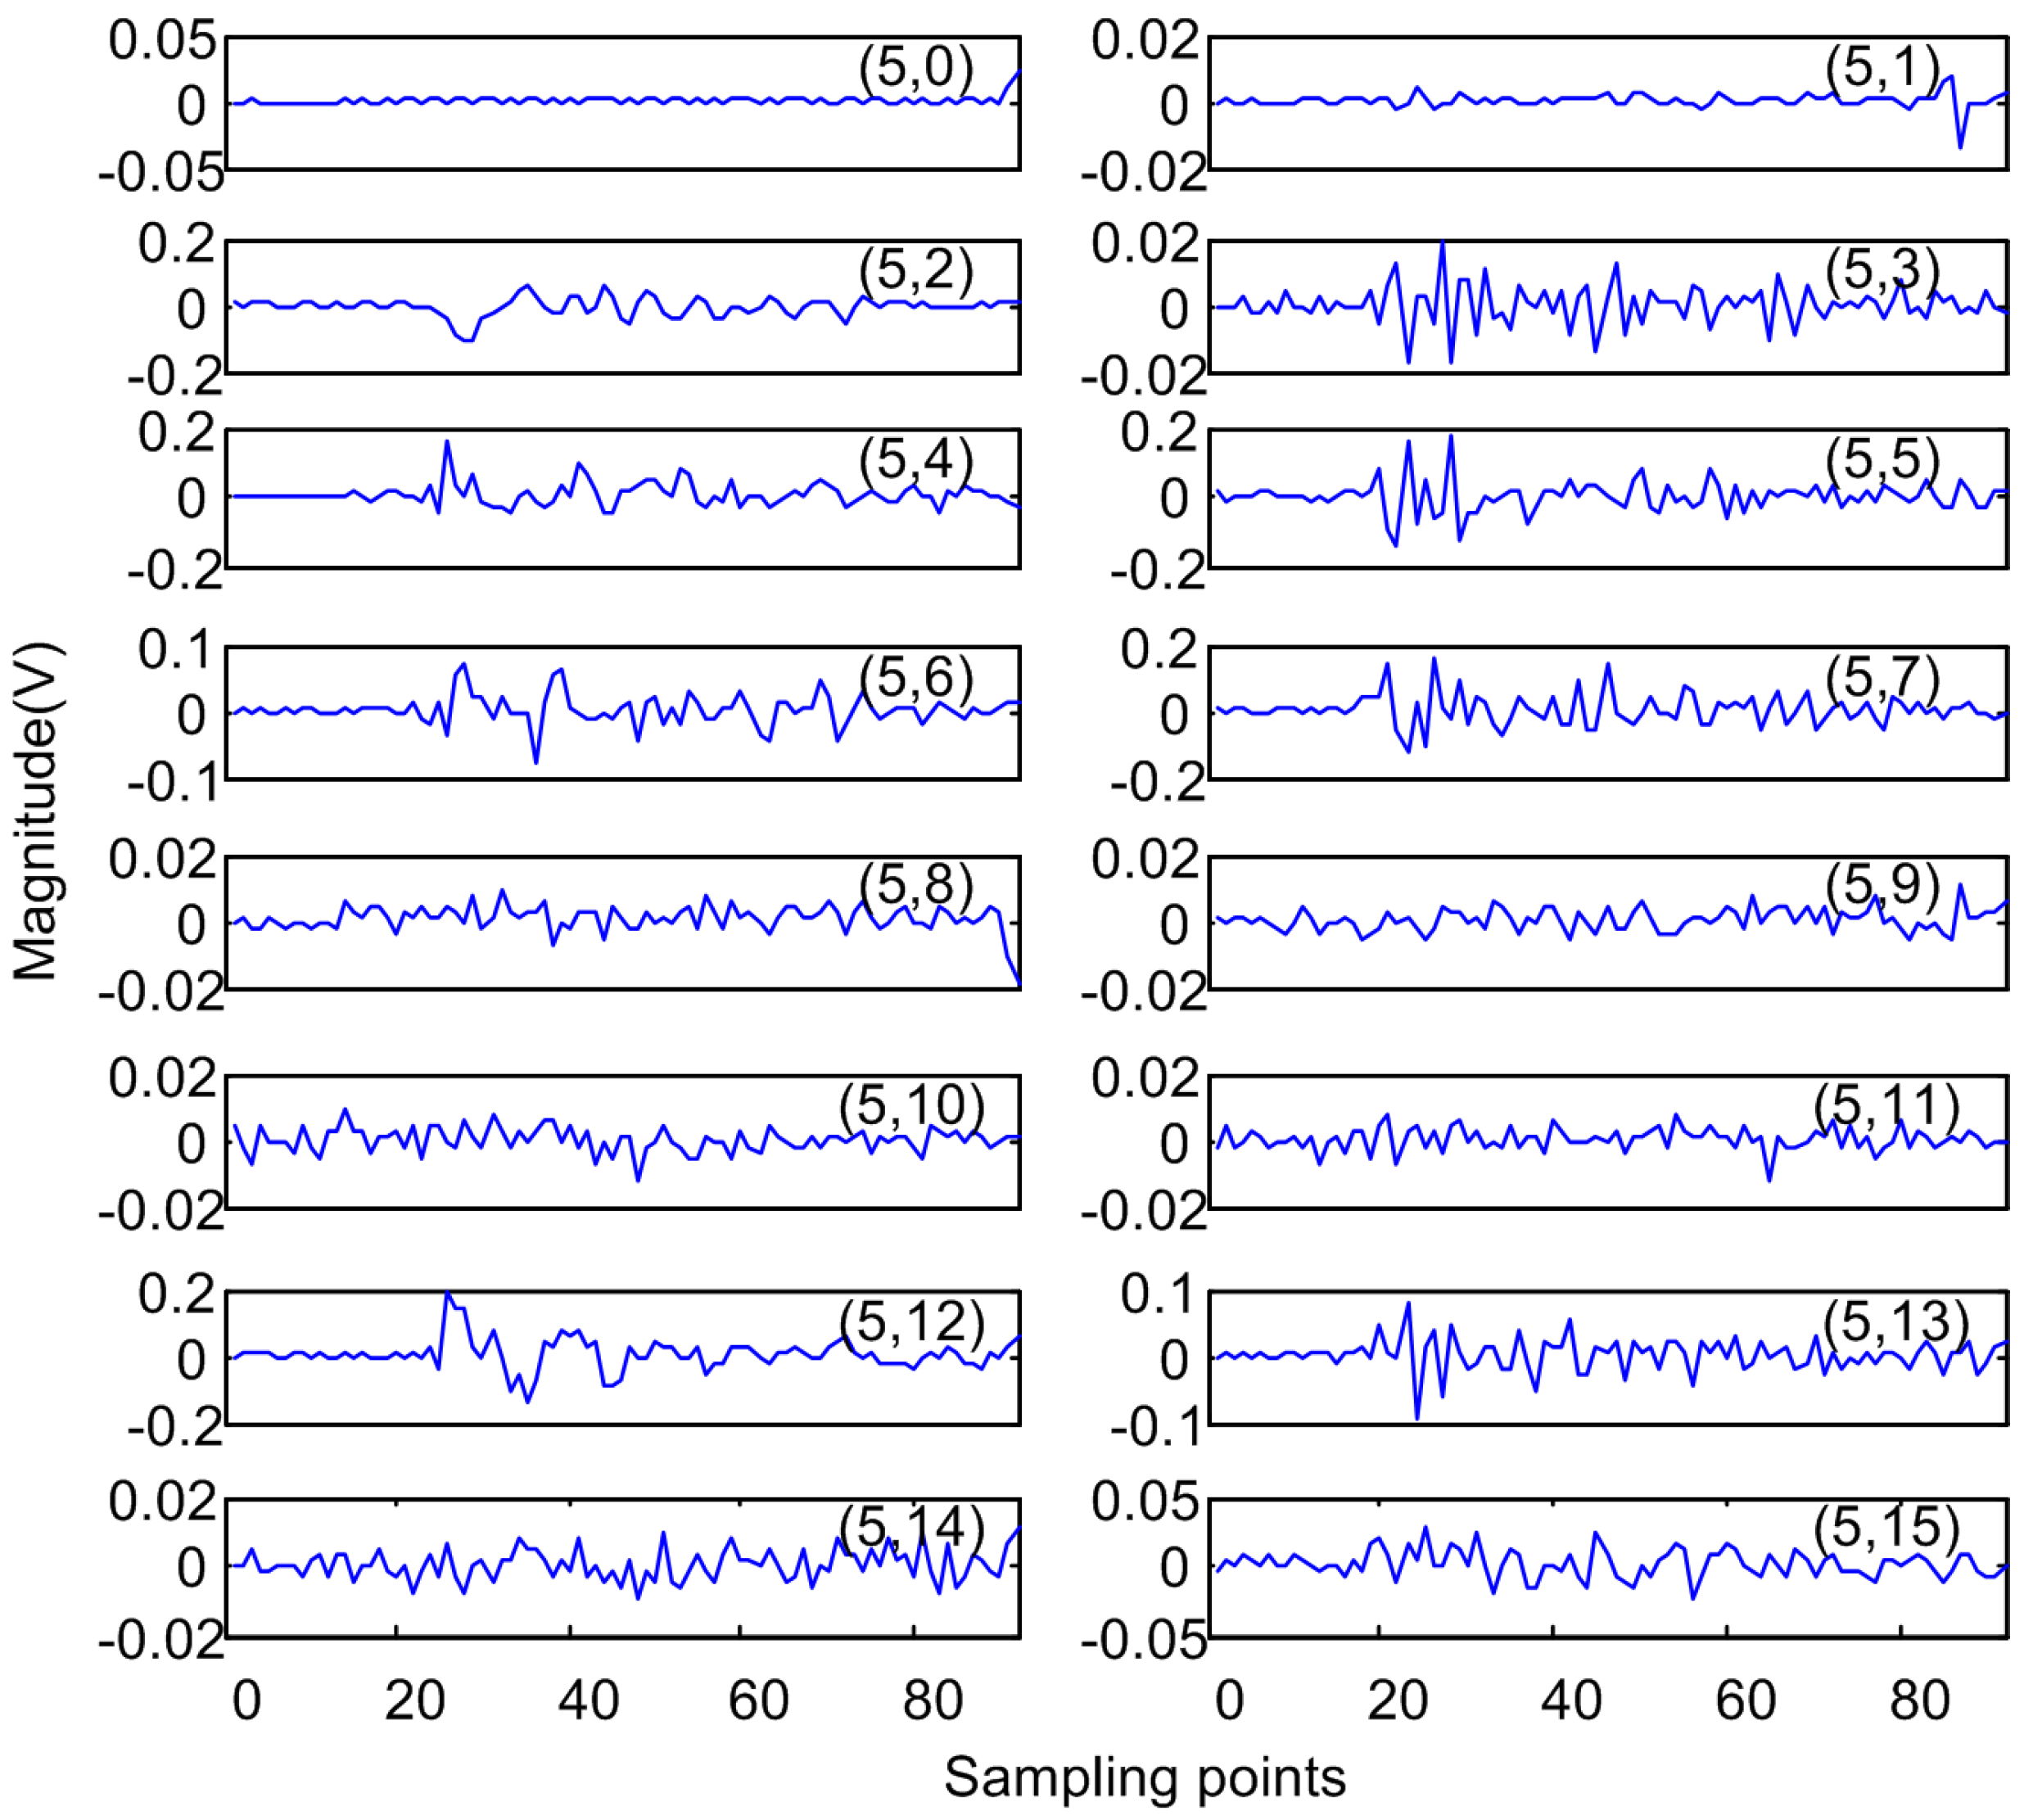
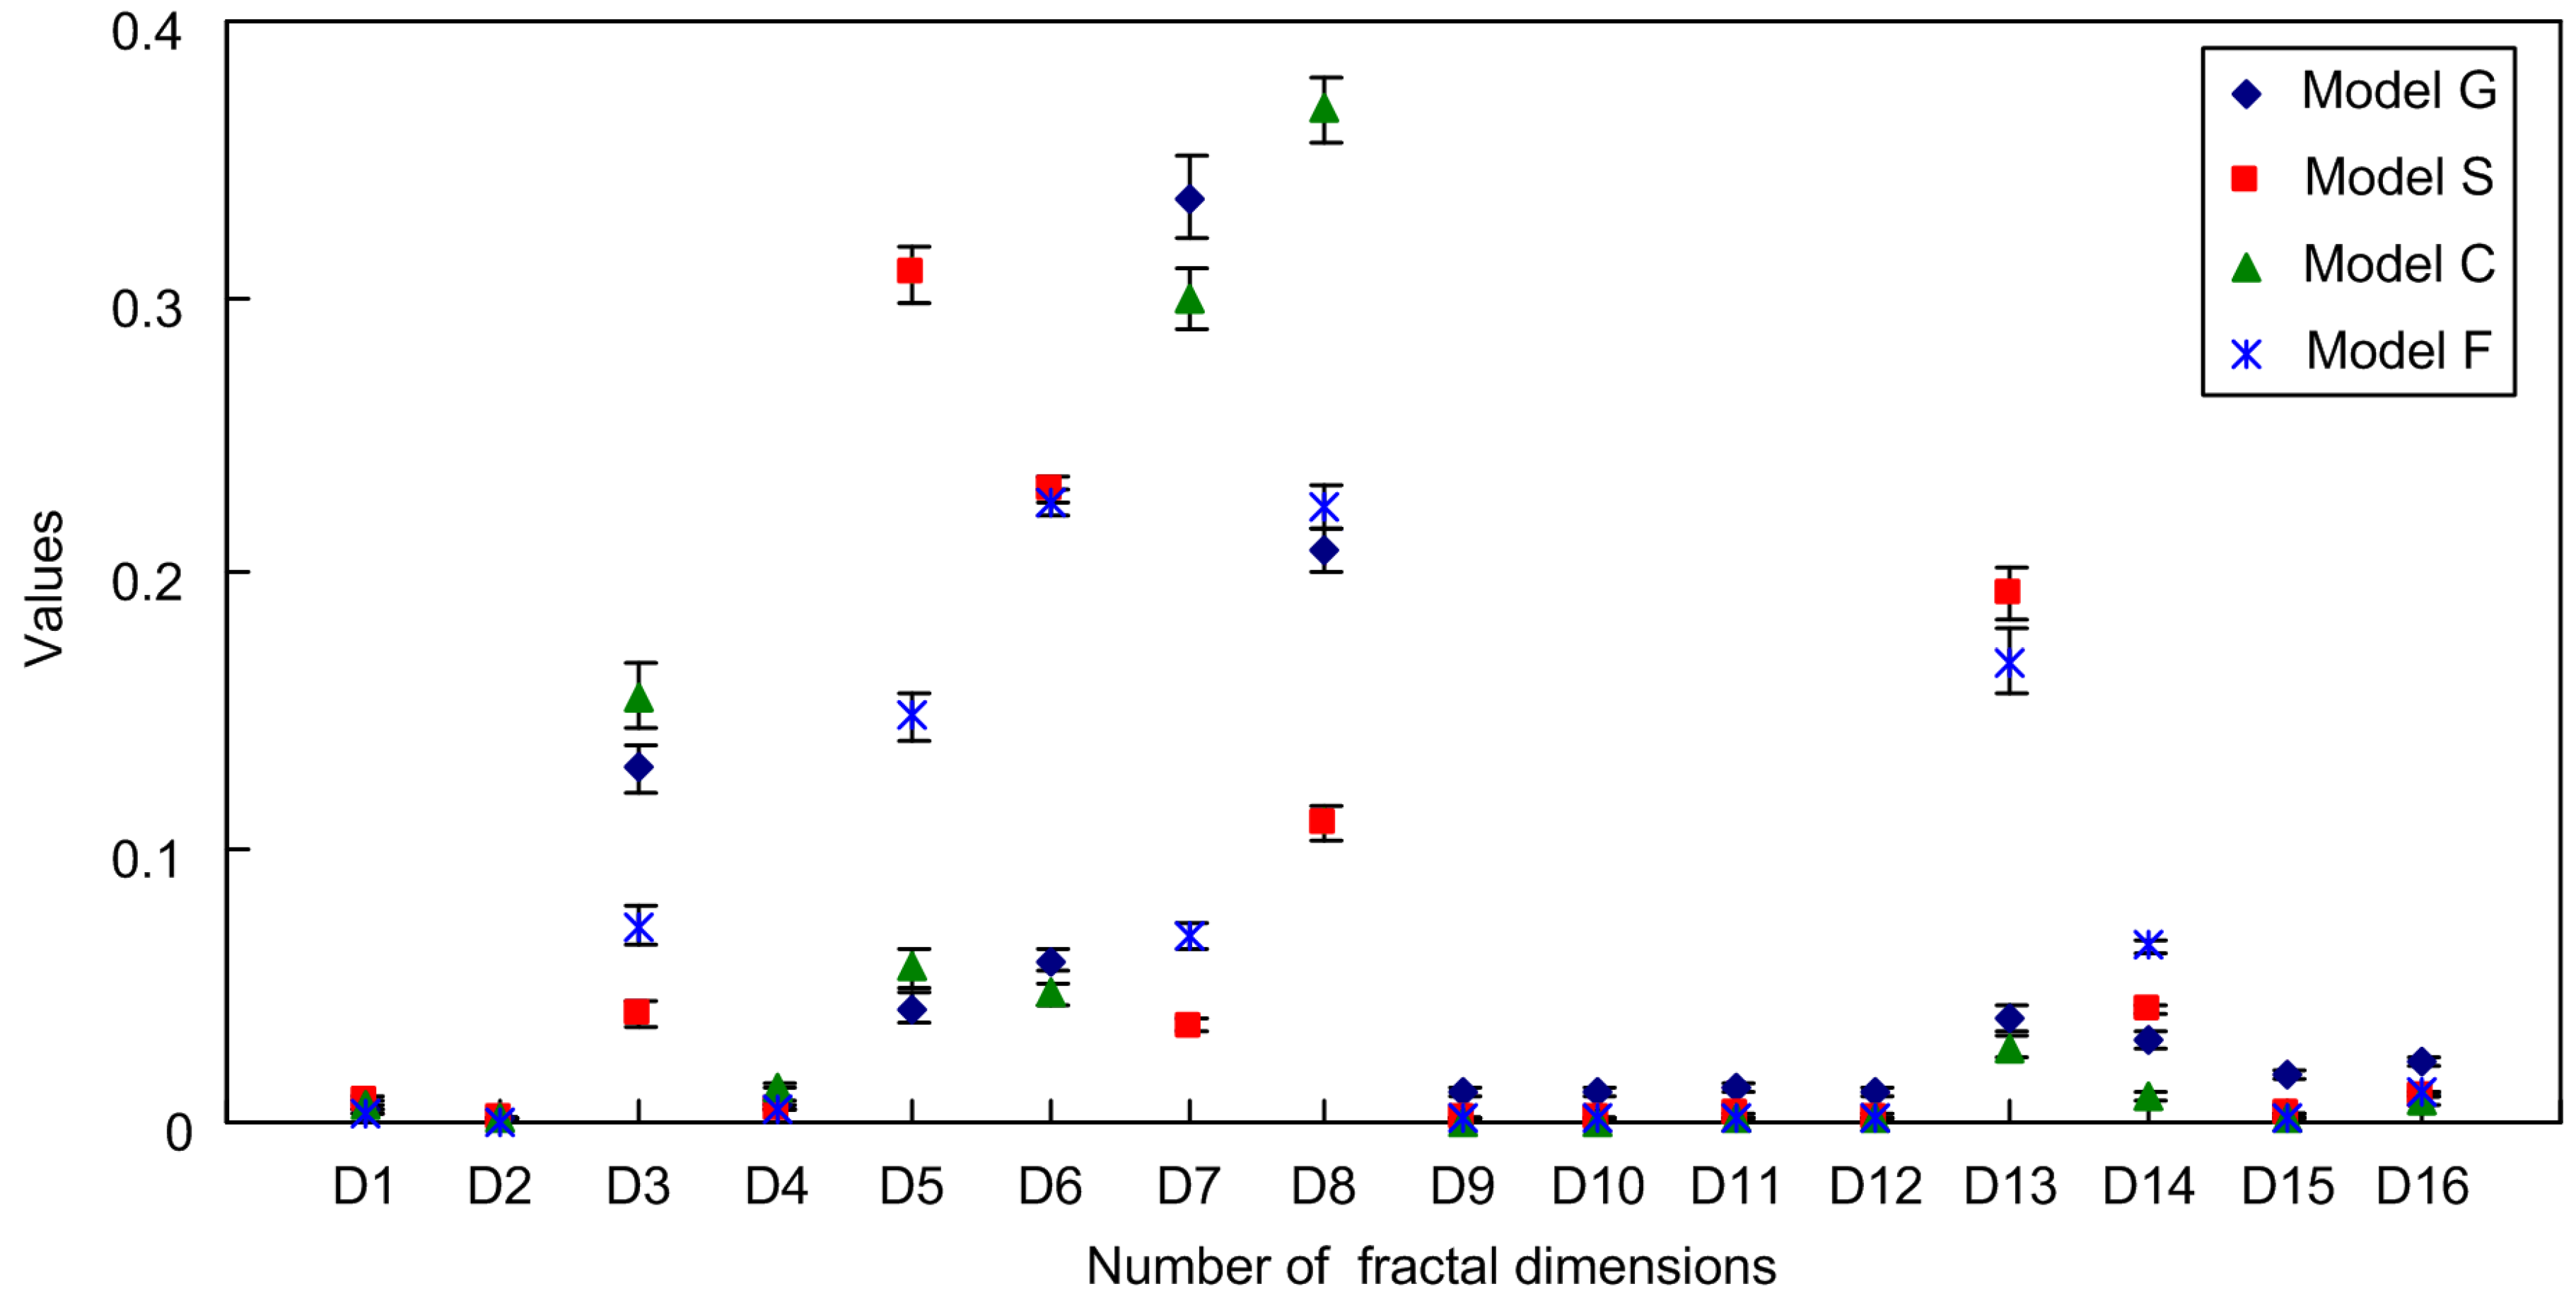
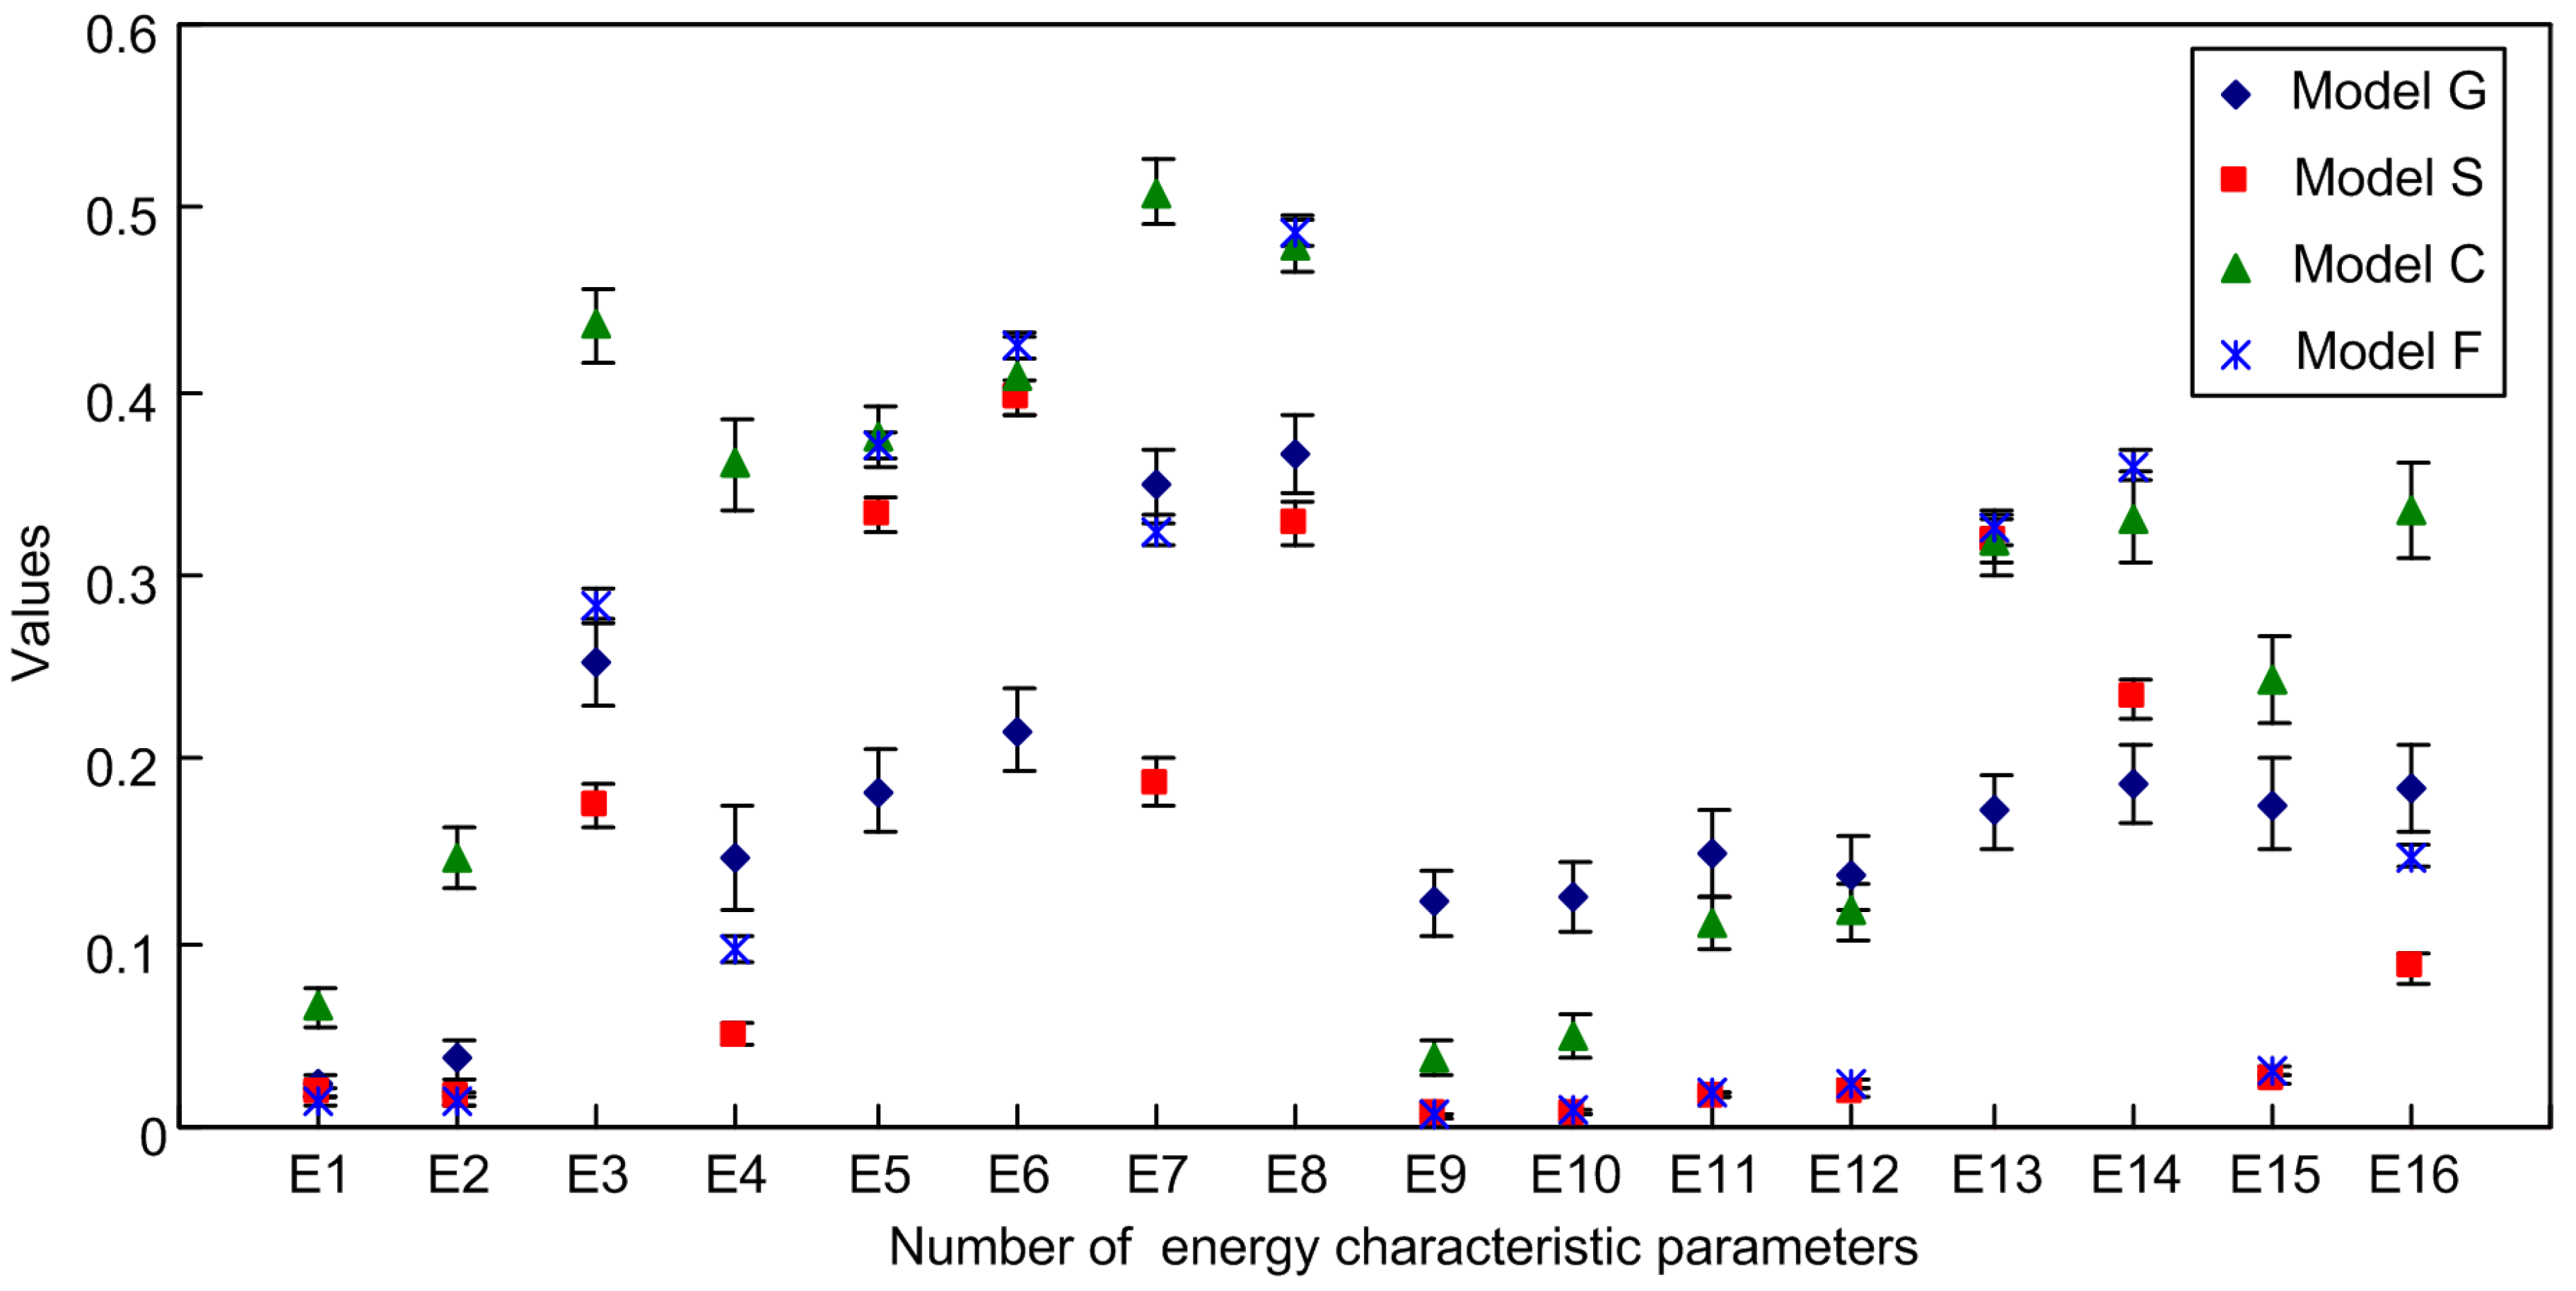
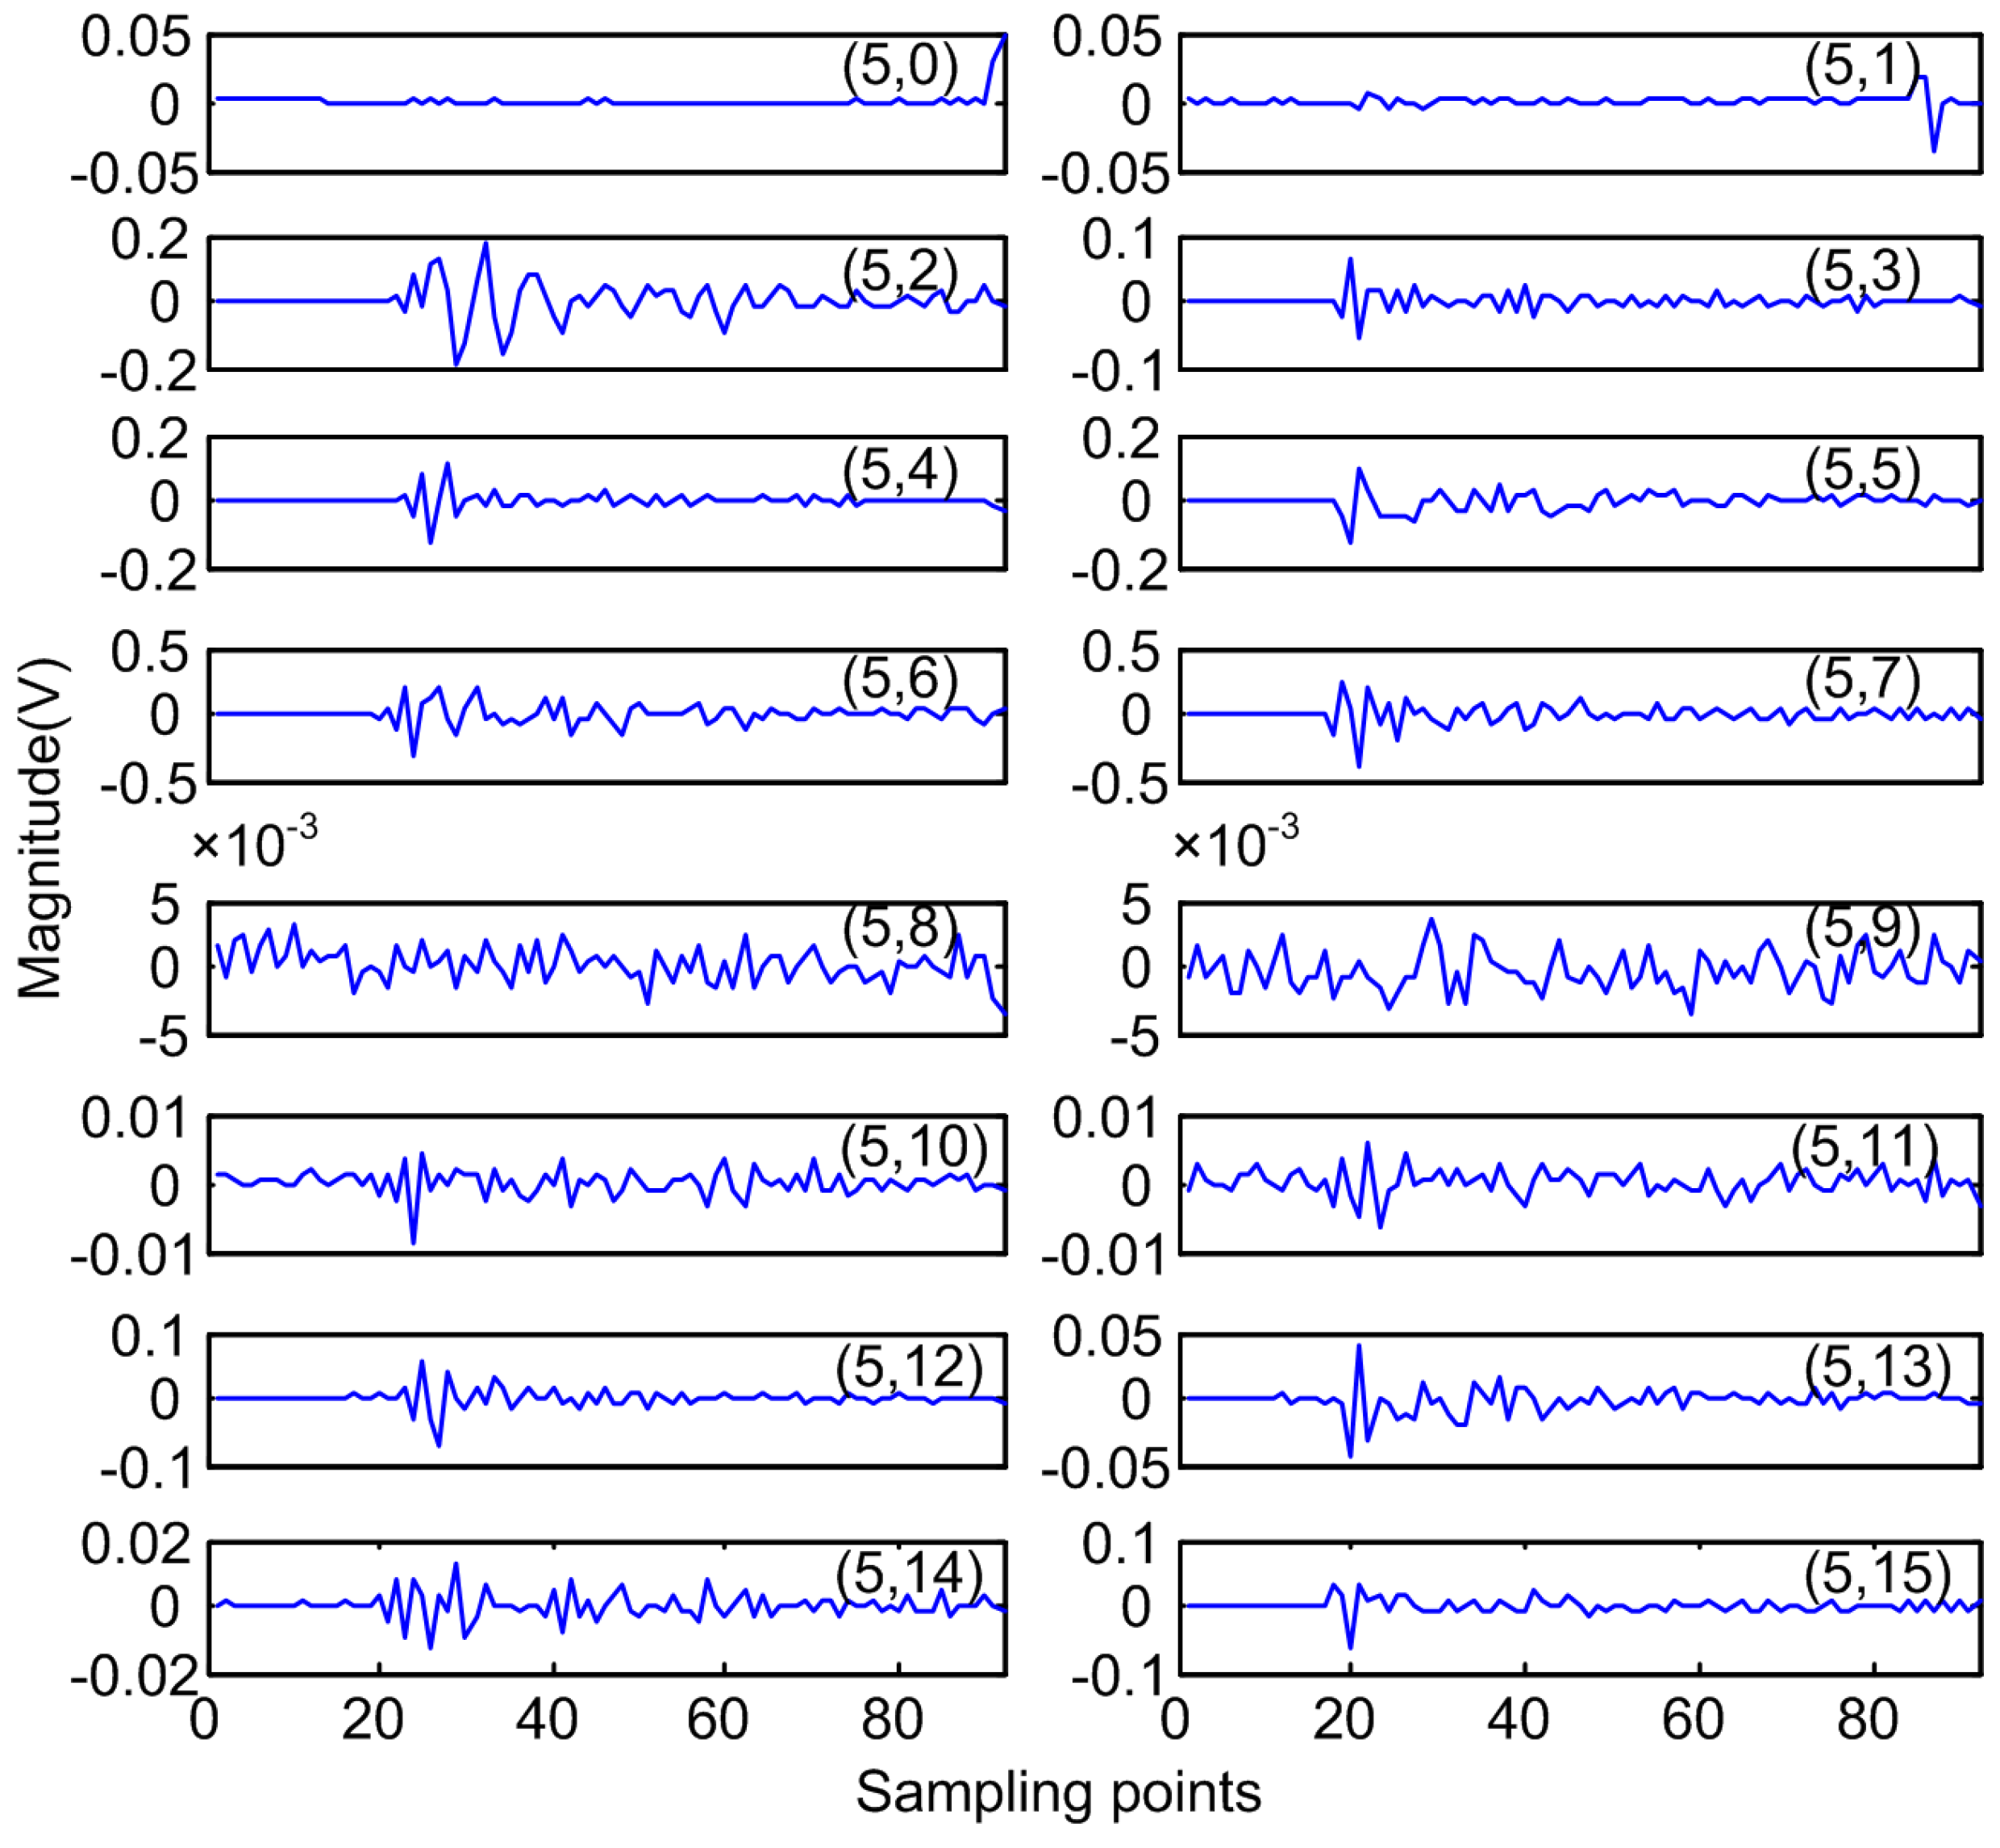
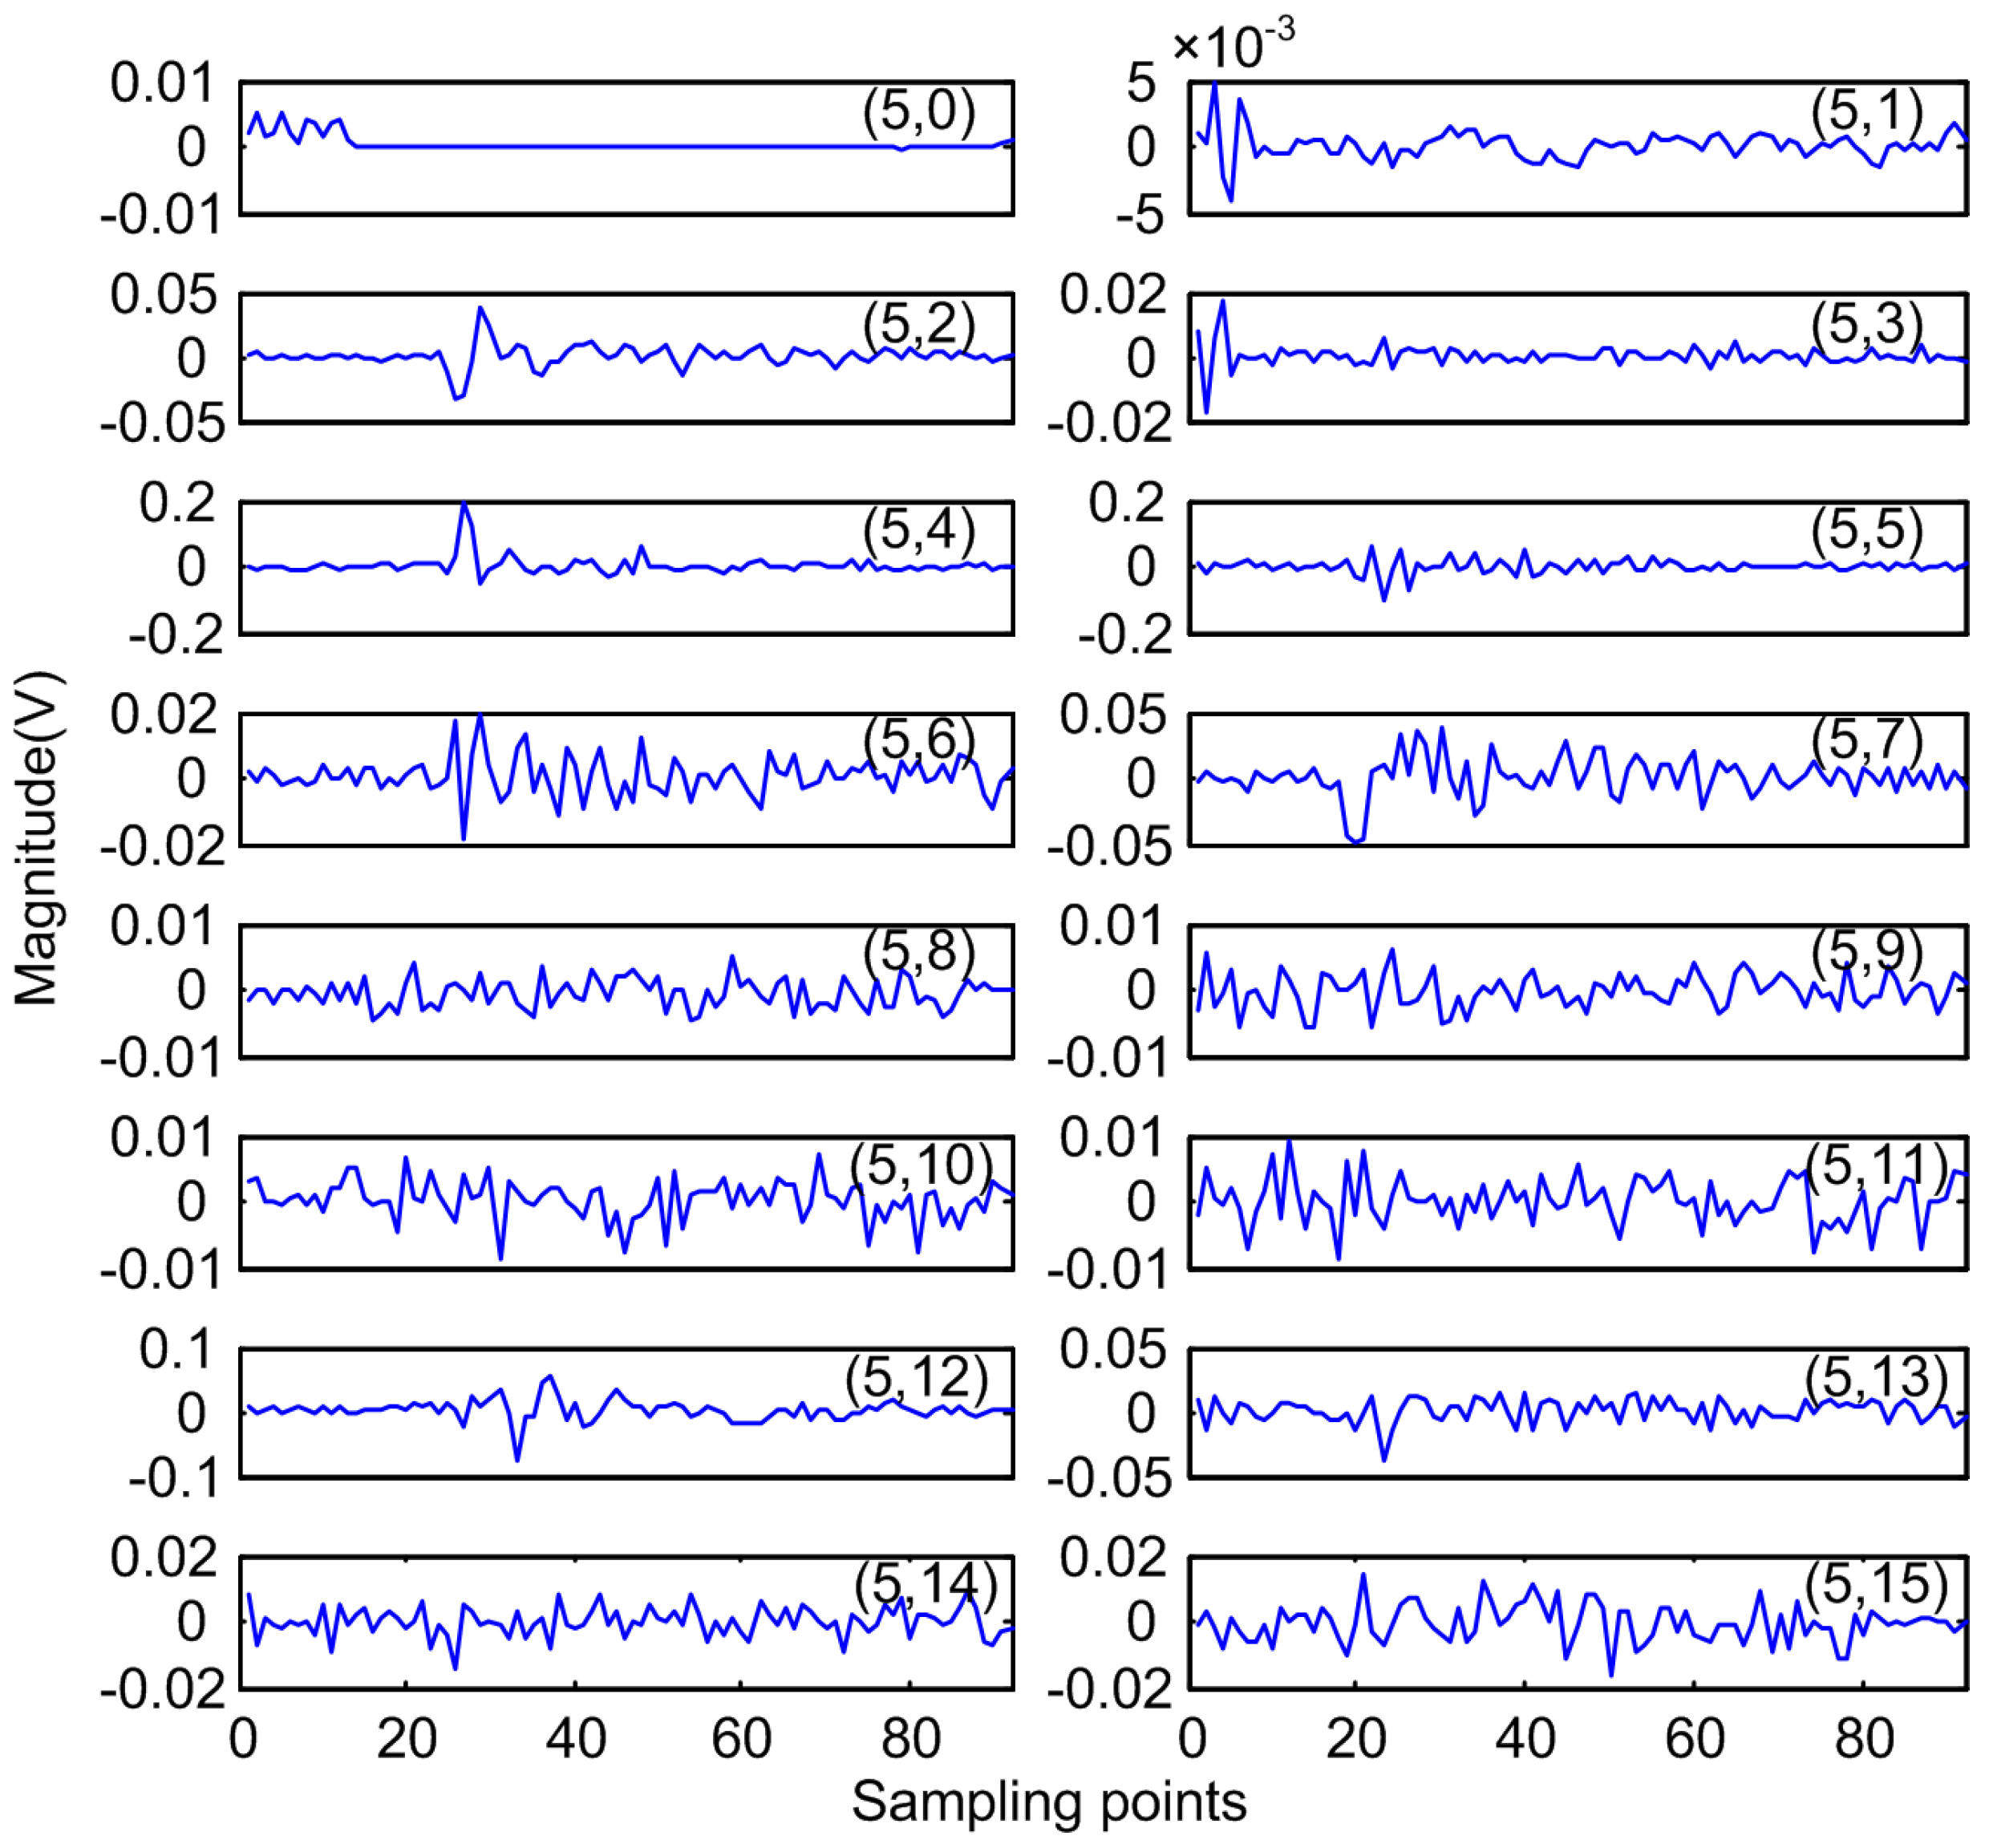
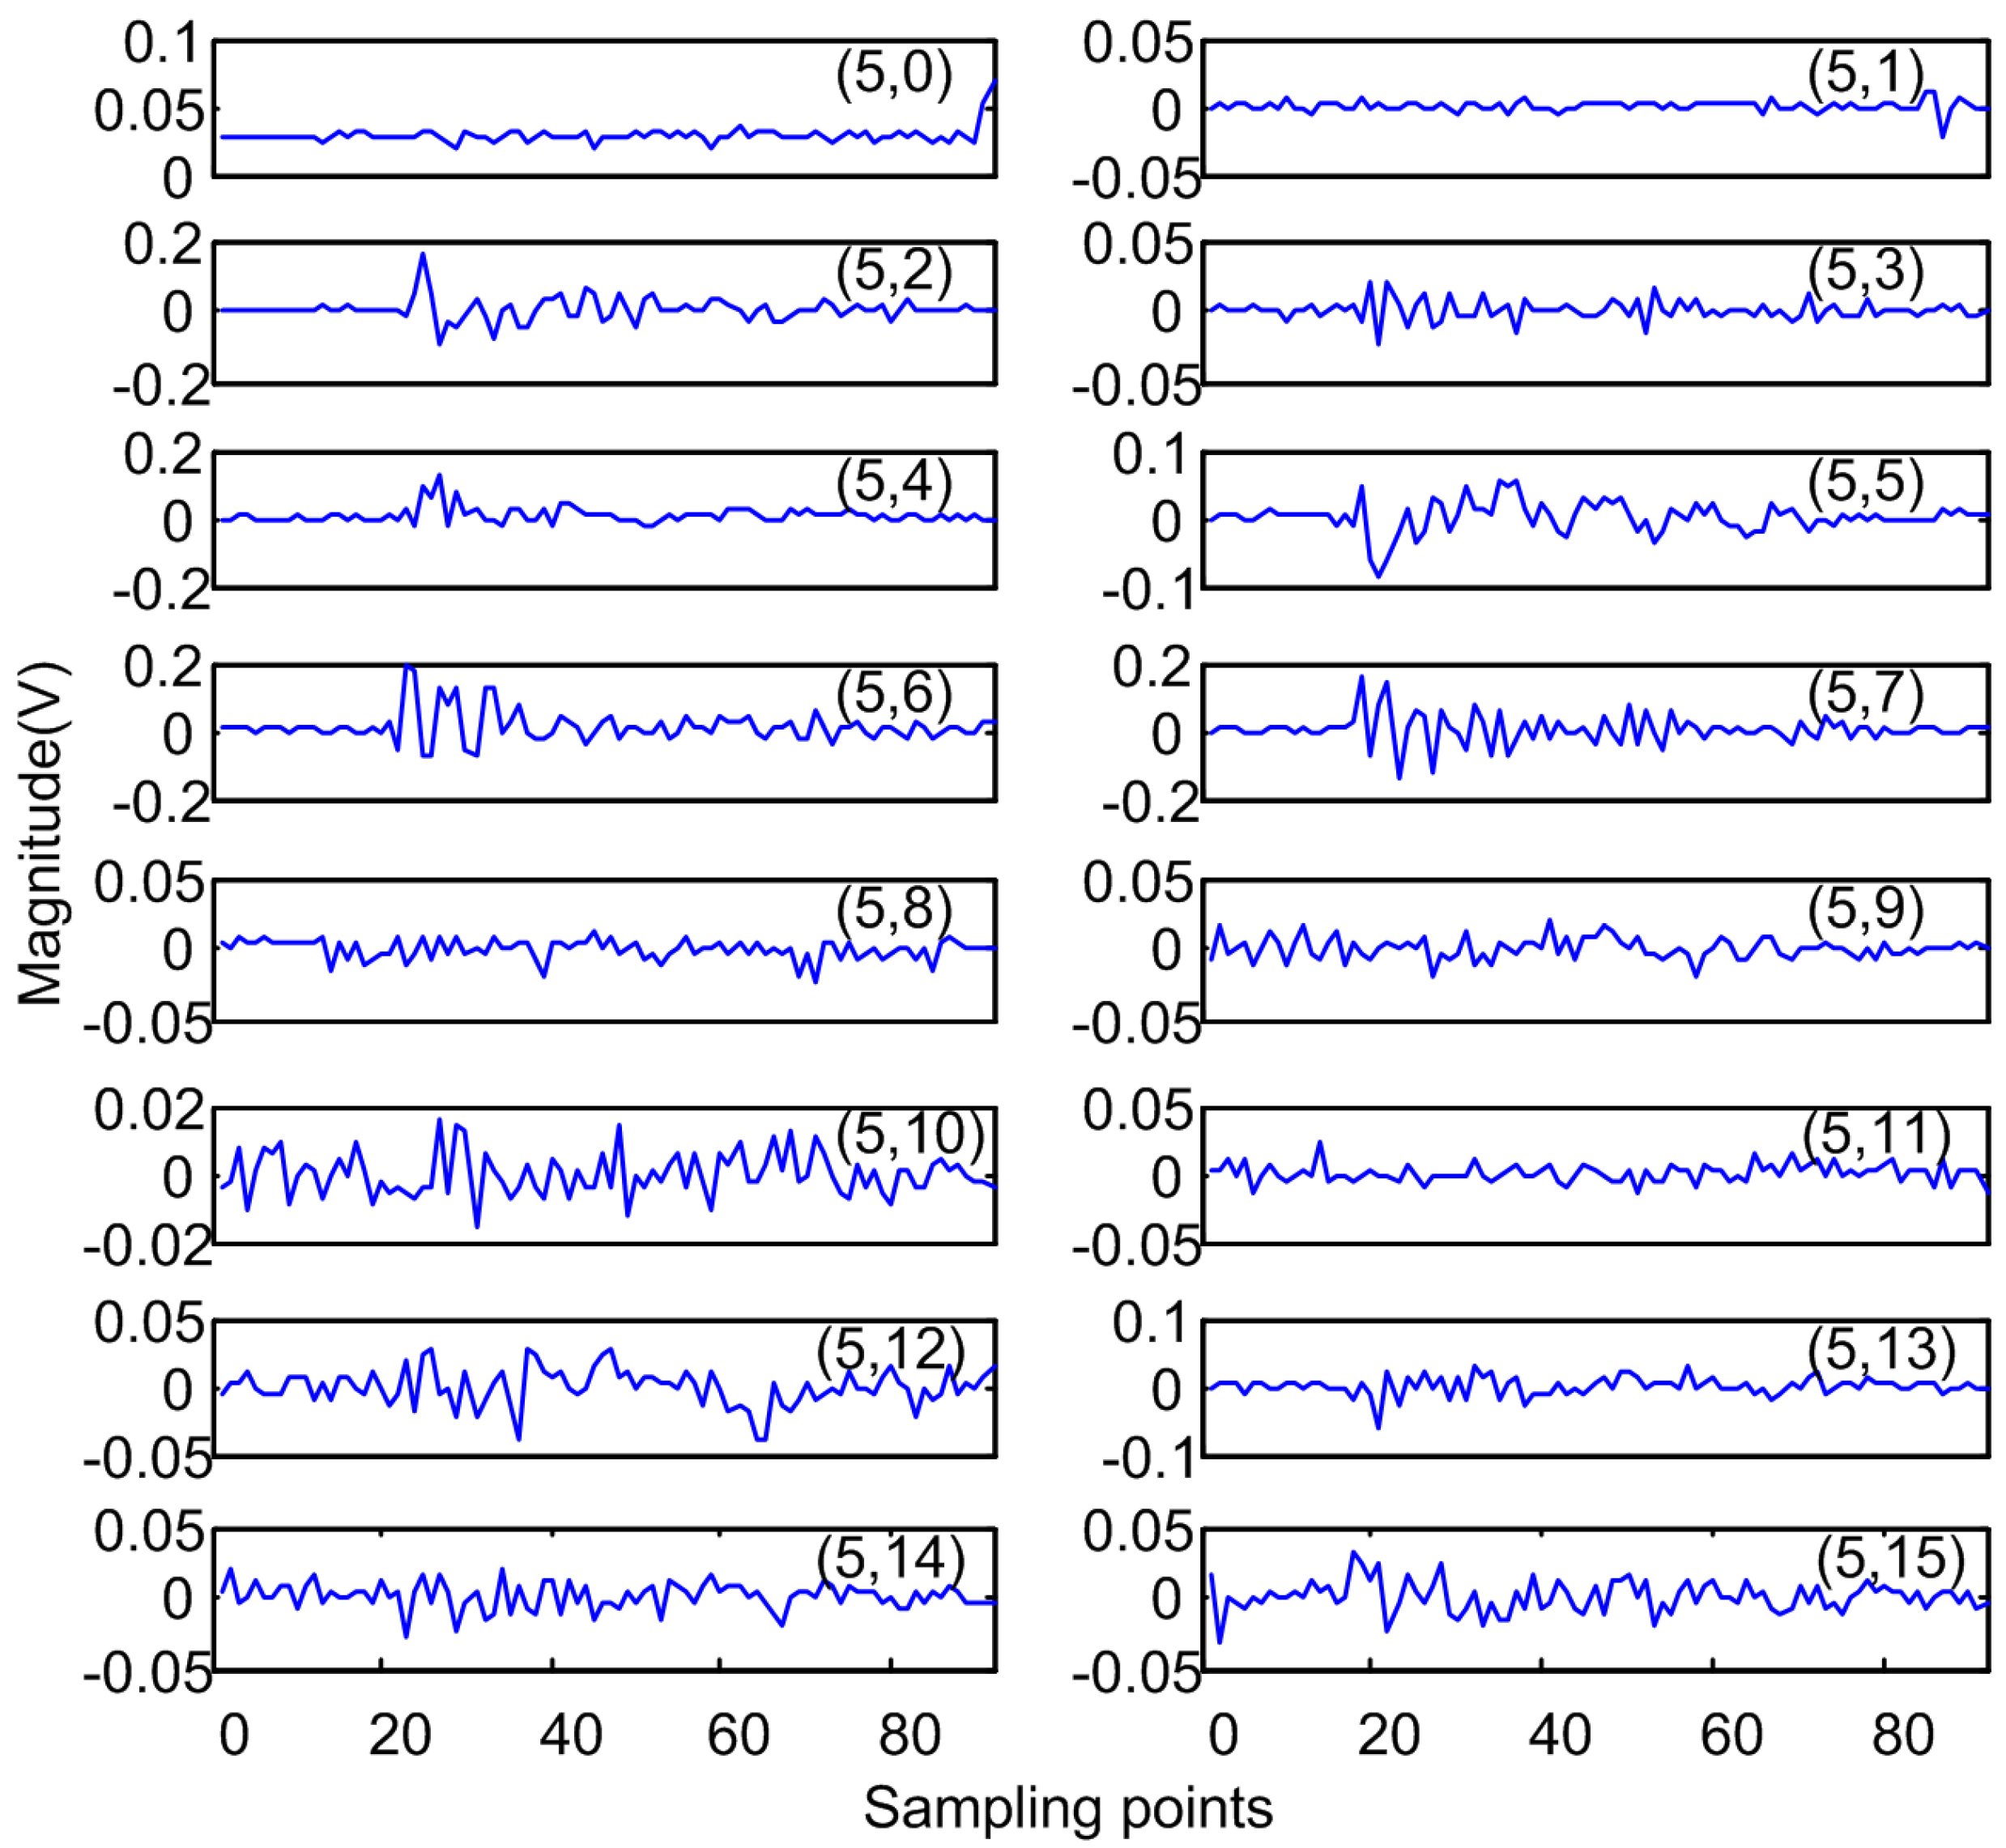
3.4. Features Extraction of PD UHF Signals

Multi-scale decomposition of signals can be realized through the wavelet packet transformation. In this paper, five layers of wavelet packets are applied to decompose the PD UHF signals and 16 multi-scale signals were extracted for each PD UHF signal [18]. The decomposition signals of the four types of PD UHF signals by the wavelet packet are shown in Figure 8, Figure 9, Figure 10 and Figure 11. It is clear that the decomposed signals in multiple scales of different discharge models are different from each other. Furthermore, the improved Differential Box Counting (DBC) and energy characteristic calculation formula proposed in the reference [18] were employed to extract the multi-scale fractal dimensions and the energy characteristic parameters of the PD UHF signals. The 95% confidence intervals of the features are shown in Figure 12 and Figure 13, respectively. The calculated results show that the multi-scale features of different defect models are different. This is helpful for the recognition by the analysis of the multi-scale features of the captured PD UHF signals.
Figure 8. The first 16 multi-scale signals of PD UHF signal generated by the cavity discharge decomposed by the five layers of wavelet packet.
Energies 04 01087 g008
Figure 9. The first 16 multi-scale signals of PD UHF signal generated by the suraface discharge decomposed by the five layers of wavelet packet.
Energies 04 01087 g009
Figure 10. The first 16 multi-scale signals of PD UHF signal generated by the corona discharge decomposed by the five layers of wavelet packet.
Energies 04 01087 g010
Figure 11. The first 16 multi-scale signals of PD UHF signal generated by the floating discharge decomposed by the five layers of wavelet packet.
Energies 04 01087 g011
Figure 12. The 95% confidence intervals of multi-scale fractal dimensions of PD UHF signal samples decomposed by wavelet packets.
Energies 04 01087 g012
Figure 13. The 95% confidence intervals of multi-scale energy parameters of PD UHF signal samples decomposed by wavelet packets.
Energies 04 01087 g013

4. Results and Discussion

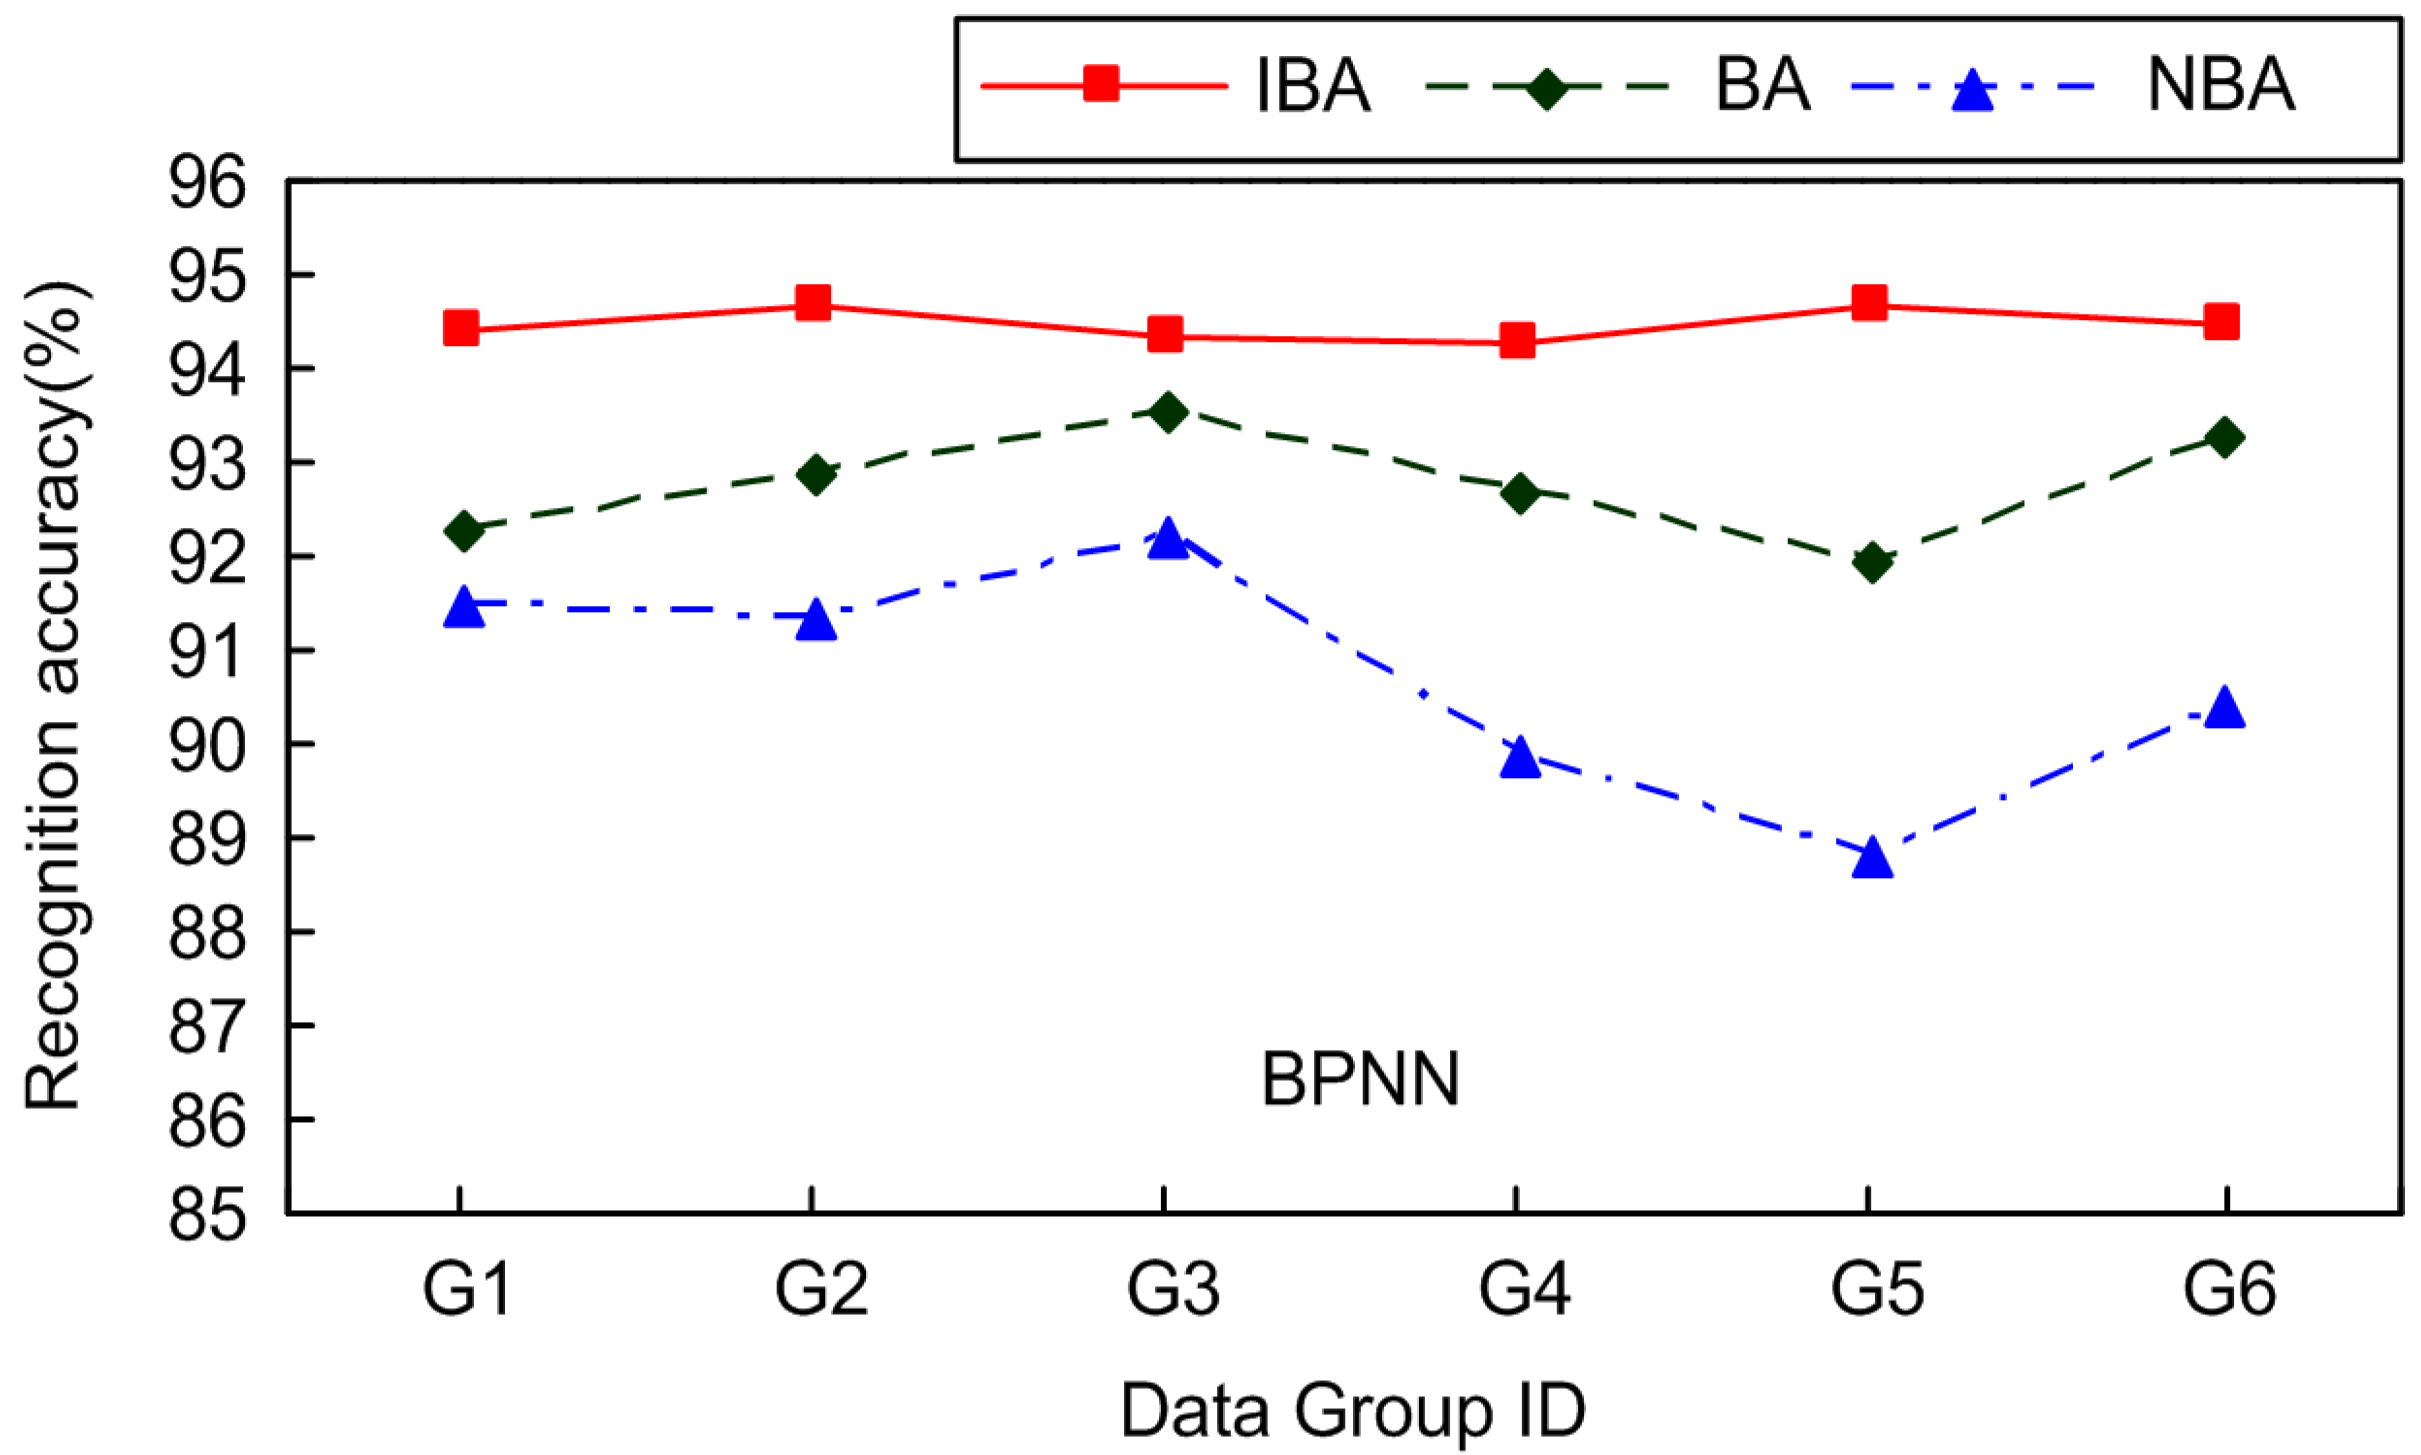
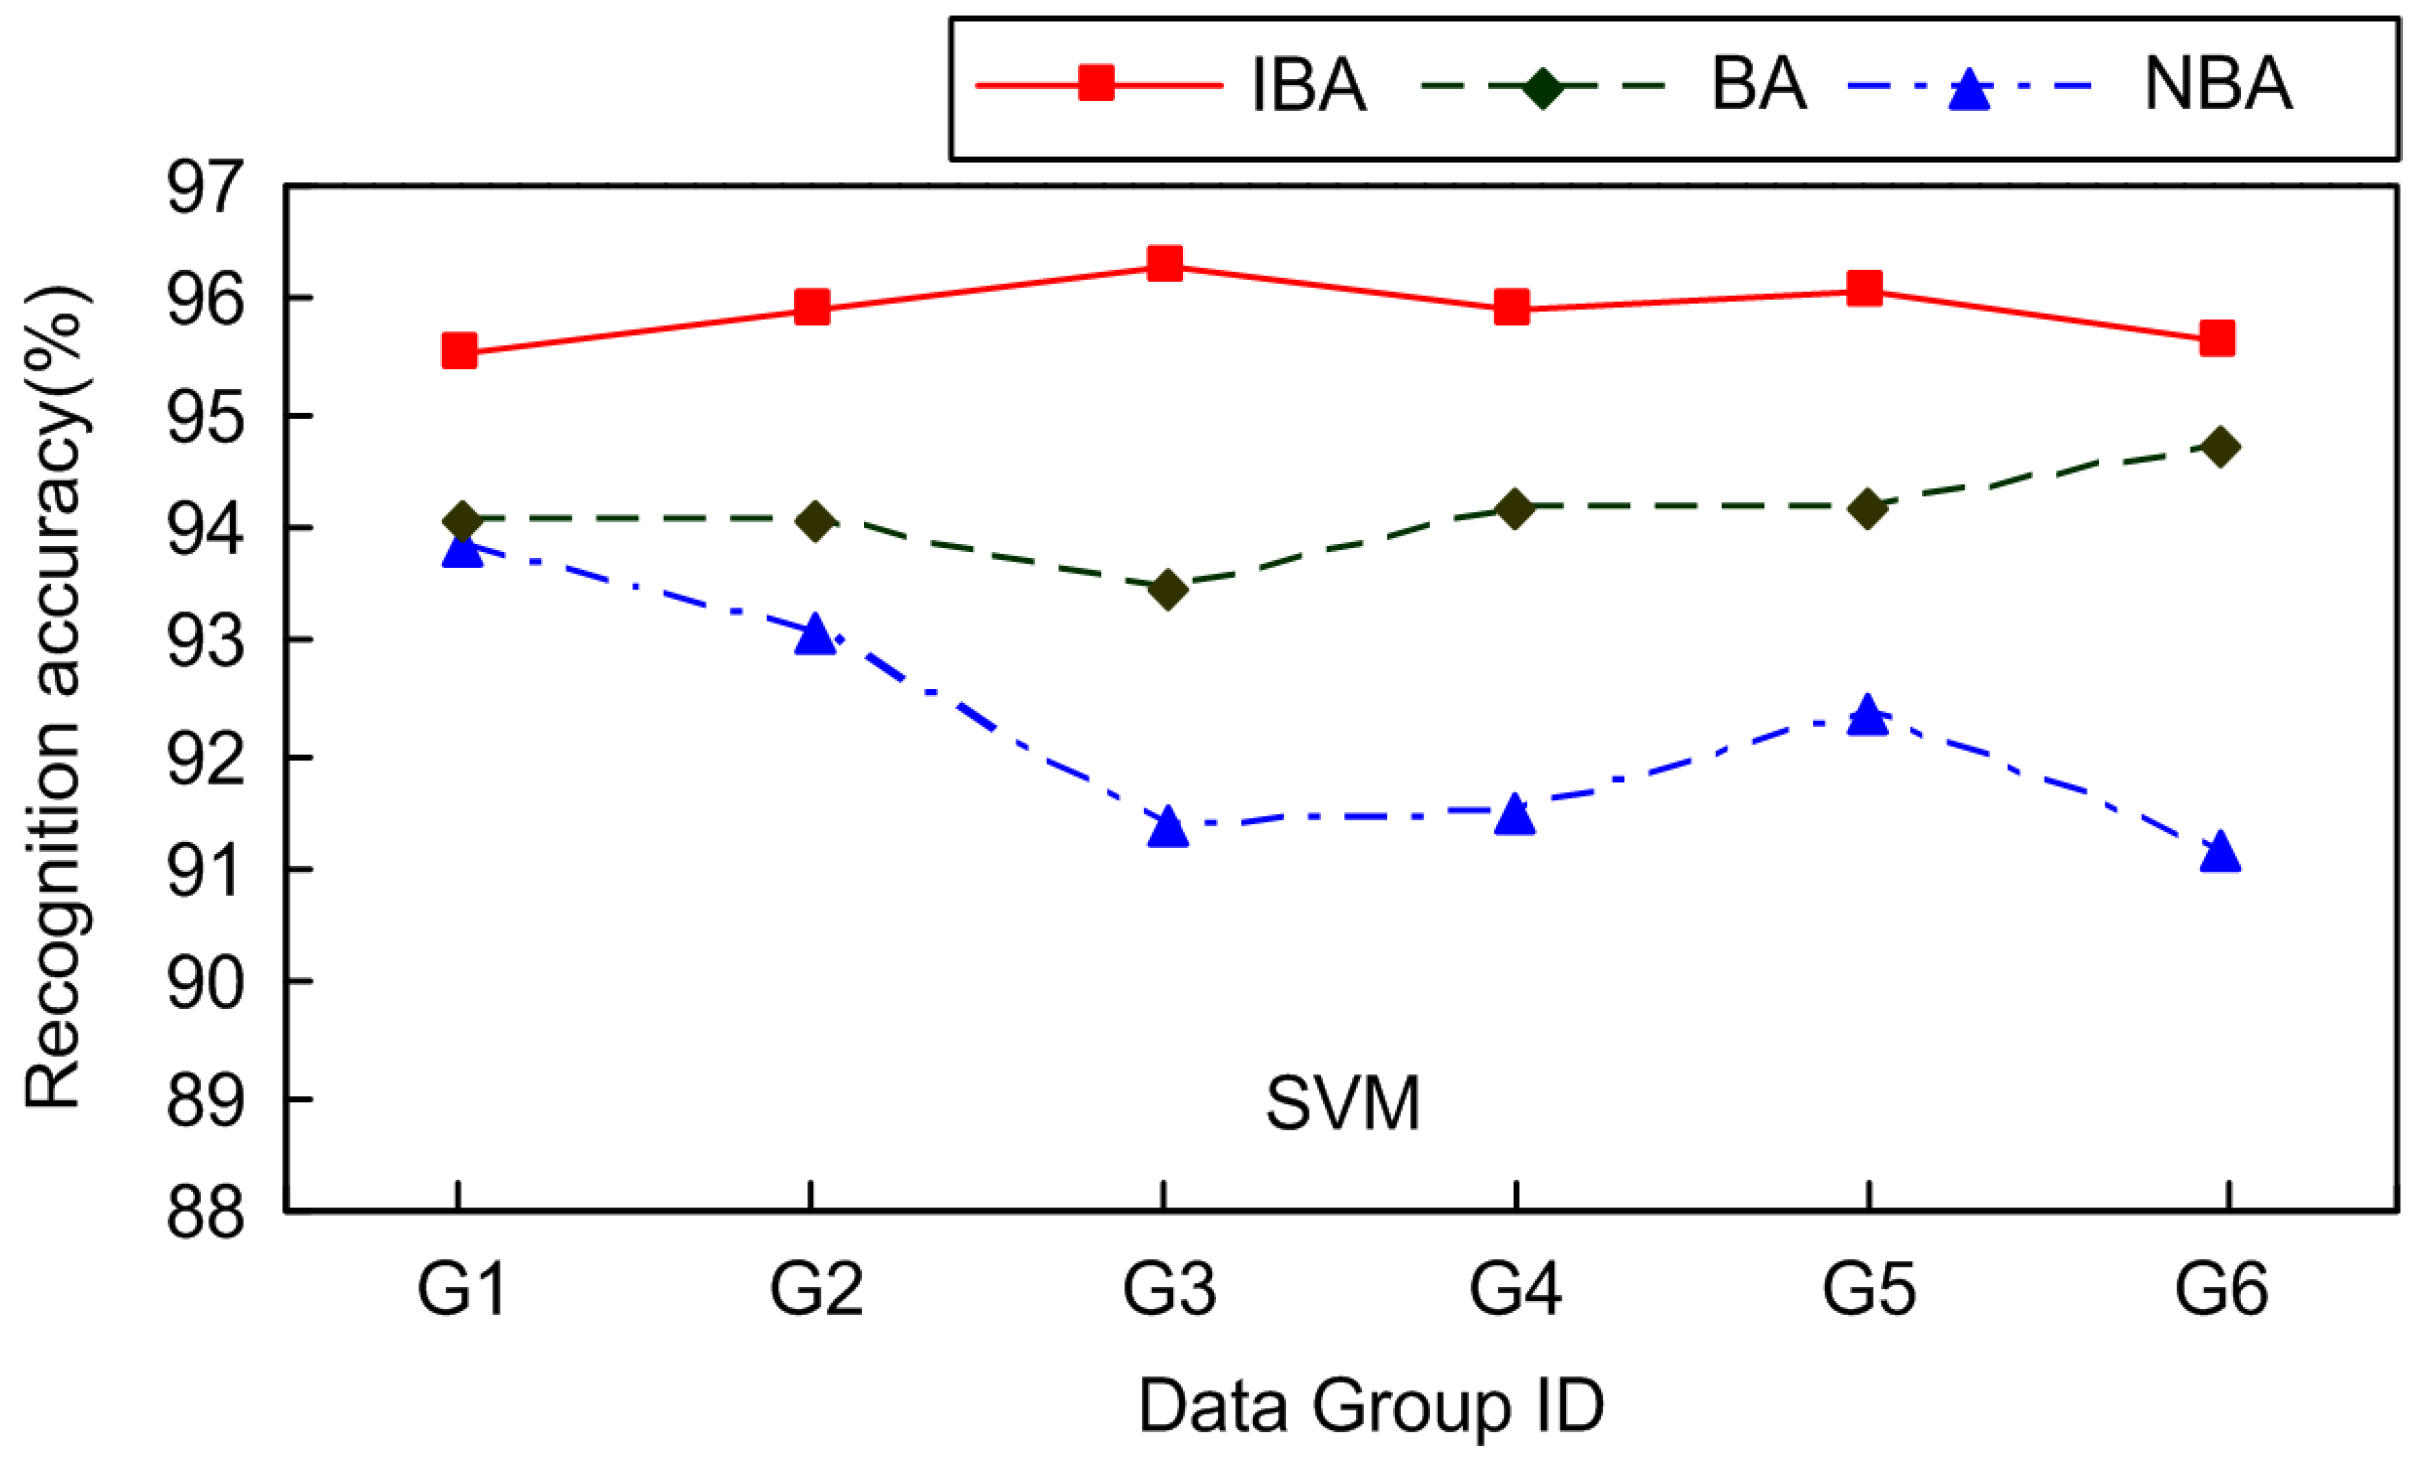
4.1. Comparison Experiments of Algorithm Accuracy

To validate the proposed IBA approach, the back propagation neural network (BPNN) and the support vector machine (SVM) were both used for classification of the UHF PD signals. BPNN used in this paper is a three-layer neural network, including an input layer, an output layer and a hidden layer. And the input layer consists of 32 nodes corresponding to the identified characteristics, the hidden layer consists of 64 nodes, and the output layer consists of four nodes corresponding to four types of partial discharge mode. The neural network training function in the MATLAB toolbox, “newff” and “train”, are used to train the neural network. The hidden layer transfer function is set to “tansig”, the output layer transfer function is set to “logsig”, and the training algorithm is set to “TRAINGDX”. After several attempts, it was found that when the parameter “epochs” (training times) was set to 10,000, goal (the training target) was 0.000001, and lr (the value of learning rate 0.01), the result would be better. SVM classification algorithm is implemented C-SVM based on the RBF kernel (radial basis function kernel: K(xi,x) = exp(−|xxi|2/σ2)). The most important parameter is the penalty factor C and kernel function parameters σ and in this paper the better parameters are found by the PSO (particle swarm optimization) method [19].
The IBA, Bagging algorithm (BA) and non-Bagging approach (NBA) were used to compare the pattern recognition accuracies respectively. For each type of PD model, a total of 50 sets of the decomposed PD data were selected from the 120 sets of the decomposed PD data to train the classifiers. The above process was repeated 20 times. It should be noted that the selection process for BA is completely random, and the selection process for IBA is conditional random according to Section 2. The rest 120 decomposed PD data were applied to the validation of the classifiers. The pattern recognition accuracies of various algorithms are shown in Table 2. It can be seen that the accuracy has been improved with the IBA in contrast to the original methods.
Table 2. Recognized accuracy of PD UHF signals (%).
Discharge TypeBPNNSVM
IBABANBAIBABANBA
G (Gas-cavity)96.6695.0494.8196.995.795.67
S (Surface)93.8591.1190.3394.8992.7891.87
C (Corona)94.5793.9993.1198.2796.0095.33
F (Floating)93.1491.1990.6793.9293.6492.83
Average accuracy94.5692.8392.2396.0094.5393.93

4.2. Comparison Experiments of Algorithm Stability

The stability of pattern recognition algorithms for different data training sets is more important than the accuracy when IBA is applied, because the stability reflects the generalization capability of the algorithm. The 480 decomposed data samples obtained above were divided into six groups. In each group there are 20 decomposed data samples for each PD fault type. Then four of the six groups were taken to form the new training sample sets. Thus, there are totally six different training sample sets (G1–G6) and each sample set has 320 training samples. For the six different training sample sets, two classifiers, BPNN and SVM, and three training methods, IBA, BA and NBA, were employed for the pattern recognition. The recognition accuracy for the six training sets (G1–G6) by the BPNN and SVM are shown in Figure 14 and Figure 15, respectively. It can be seen from the figures that with the IBA, the recognition accuracy for different data sets is improved, and the stability of the recognition accuracy for different data sets increases.
Figure 14. Average recognition accuracy of BPNN under three different training methods.
Energies 04 01087 g014
Figure 15. Average recognition accuracy of SVM under three different training methods.
Energies 04 01087 g015
Furthermore, the stability of the recognition algorithms can be measured with the standard deviations of recognition accuracies. The standard deviations of the average recognition accuracies of the six sample sets are shown in Table 3. It can be found that the variance of recognition accuracies using the IBA training method is smaller than that of the BA and NBA approaches.
Table 3. Standard deviations of recognition accuracies.
IBABANBA
BPNN0.16520.59571.2215
SVM0.27180.39501.0681

5. Conclusions

In this paper, an Improved Bagging Algorithm (IBA) for recognition for ultra-high-frequency (UHF) signals of partial discharges (PDs) is introduced. By the proposed approach, each sample is marked with sample information entropy, which can optimize the traditional Bagging re-sampling process. Thus, the samples with more value for pattern recognition can be selected with a higher probability in each round of selection. The experimental results show that the application of this algorithm can effectively enhance the generalization capability and improve the accuracy of the back propagation neural network (BPNN) and the support vector machine (SVM) in the pattern recognition of ultra-high-frequency signals of partial discharge. The proposed approach is qualified for pattern recognition for ultra-high-frequency signals of partial discharge in power transformers.
In future work, the characteristics of PD UHF signals influenced by more factors such as transformer components must be quantified. Testing with the field data using the proposed approach is required to verify that the laboratory-based recognition approach can translate to practical applications.

Acknowledgments

The authors acknowledge the National Science Foundation of China (51021005) to support this work. The fund of National Basic Research Program of China (973 program, 2009CB724508) and the Natural Science Foundation of Chongqing, China (CSTC 2009BA4048) are also appreciated for supporting this work.

References

  1. Gulski, E.; Krivda, A. Neural networks as a tool for recognition of partial discharges. IEEE Trans. Electr. Insul. 1993, 28, 984–1001. [Google Scholar] [CrossRef]
  2. Satish, L.; Zaengl, W.S. Artificial neural networks for recognition cognition of 3-D partial discharge patterns. IEEE Trans. Dielectr. Electr. Insul. 1994, 1, 265–275. [Google Scholar] [CrossRef]
  3. Ahmad, A.S.; Ghosh, P.S.; Ahmed, S.S.; Aljunid, S.A.K. Assessment of ESDD on high-voltage insulators using artificial neural network. Electr. Power Syst. Res. 2004, 72, 131–136. [Google Scholar] [CrossRef]
  4. Niu, W.; Xu, L.F.; Wu, J.L. The application of particle swarm optimization-based RBF neural network in fault diagnosis of power transformer. In Proceedings of IEEE International Conference on Computer Science and Information Technology, Beijing, China, August 2009; pp. 534–536.
  5. Hao, L.; Lewin, P.L. Partial discharge source discrimination using a support vector machine. IEEE Trans. Dielectr. Electr. Insul. 2010, 17, 189–197. [Google Scholar] [CrossRef]
  6. Sharkawy, R.M.; Mangoubi, R.S.; Abdel-Galil, T.K.; Salama, M.M.A.; Bartnikas, R. SVM classification of contaminating particles in liquid dielectrics using higher order statistics of electrical and acoustic PD measurements. IEEE Trans. Dielectr. Electr. Insul. 2007, 14, 669–678. [Google Scholar] [CrossRef]
  7. Jiang, T.Y.; Li, J.; Wang, Y.Y.; Grzybowski, S. Recognition on ultra-high-frequency signals of partial discharge by support vector machine. In Proceedings of International Conference on High Voltage Engineering and Application, New Orleans, LA, USA, October 2010; pp. 634–637.
  8. Li, J.; Sun, C.X.; Grzybowski, S.; Taylor, C.D. Partial discharge image recognition using a new group of features. IEEE Trans. Dielectr. Electr. Insul. 2006, 13, 1245–1253. [Google Scholar] [CrossRef]
  9. Sharkawy, R.M.; Abdel-Galil, T.K.; Mangoubi, R.S.; Salama, M.M.; Bartnikas, R. Particle Identification in Terms of Acoustic Partial Discharge Measurements in Transformer Oils. IEEE Trans. Dielectr. Electr. Insul. 2008, 15, 1649–1656. [Google Scholar] [CrossRef]
  10. Chen, H.C.; Gu, F.C.; Lee, C.Y. A new method based on extension theory for partial discharge pattern recognition. WSEAS Trans. Syst. 2008, 12, 1402–1411. [Google Scholar]
  11. Behzad, M.; Asghari, K.; Eazi, M.; Palhang, M. Generalization performance of support vector machines and neural networks in runoff modeling. Expert Syst. Appl. 2009, 36, 7624–7629. [Google Scholar] [CrossRef]
  12. Zhao, Z.Q.; Huang, D.S. A mended hybrid learning algorithm for radial basis function neural networks to improve generalization capability. Appl. Math. Modell. 2007, 31, 1271–1281. [Google Scholar] [CrossRef]
  13. Schapire, R.E. The strength of weak learn ability. Mach. Learn. 1990, 5, 197–227. [Google Scholar]
  14. Breiman, L. Bagging predictors. Mach. Learn. 1996, 24, 123–140. [Google Scholar]
  15. Valiant, L.G. A theory of the learnable, communications of the ACM. Res. Contrib. 1984, 27, 1134–1142. [Google Scholar]
  16. Masoumi, B.; Meybodi, M.R. Speeding up learning automata based multi agent systems using the concepts of stigmergy and entropy. Expert Syst. Appl. 2010, 12, 8105–8118. [Google Scholar]
  17. Serqio, T.; Konstantinos, K. Pattern Recognition, 3rd ed.; Academic Press: Durham, NC, USA, 2006. [Google Scholar]
  18. Li, J.; Wang, X.W.; Jin, Z.R.; Sun, C.X.; Cheng, C.K. Multi-scale grid dimension extraction and recognition of ultra-high frequency signals of transformer partial discharge. Power Syst. Technol. 2010, 34, 159–163. [Google Scholar] [CrossRef]
  19. Melgani, F.; Bazi, Y. Classification of electrocardiogram signals with support vector machines and particle swarm optimization. IEEE Trans. Inf. Technol. Biomed. 2008, 12, 667–677. [Google Scholar] [CrossRef]

