Large-Scale Battery System Development and User-Specific Driving Behavior Analysis for Emerging Electric-Drive Vehicles

Abstract
1. Introduction
1.1. Related Work
1.2. Our Contributions
- The proposed large-scale battery system development tool models the run-time charge-cycle usage and long-term capacity fading of individual battery cells (e.g., thermal and depth-of-discharge dependent aging effects). Considering variation effects among a number of individual battery cells, a unified frequency-domain technique for battery system electric and thermal analysis is adopted in the system design, supporting year-level battery long-term cycle life analysis via second-level accurate run-time performance analysis. To the best of our knowledge, this is the first study investigating large-scale battery system modeling that considers the major run-time charge-cycle usage and long-term capacity degradation effects.
- The proposed personalized mobile monitoring system design and deployment emphasize transparent services for ease of deployment and low-power design. It enables comprehensive data acquisition of user driving patterns, such as speed and acceleration, as well as (P)HEV energy usage and run-time performance. A series of user studies have been conducted, covering diverse driving behaviors under different road and traffic conditions. Using the real-world sensing data, we analyze user-specific driving behaviors and their impacts on (P)HEV energy consumption, battery system usage, and energy economy.
2. Motivations and Rationale
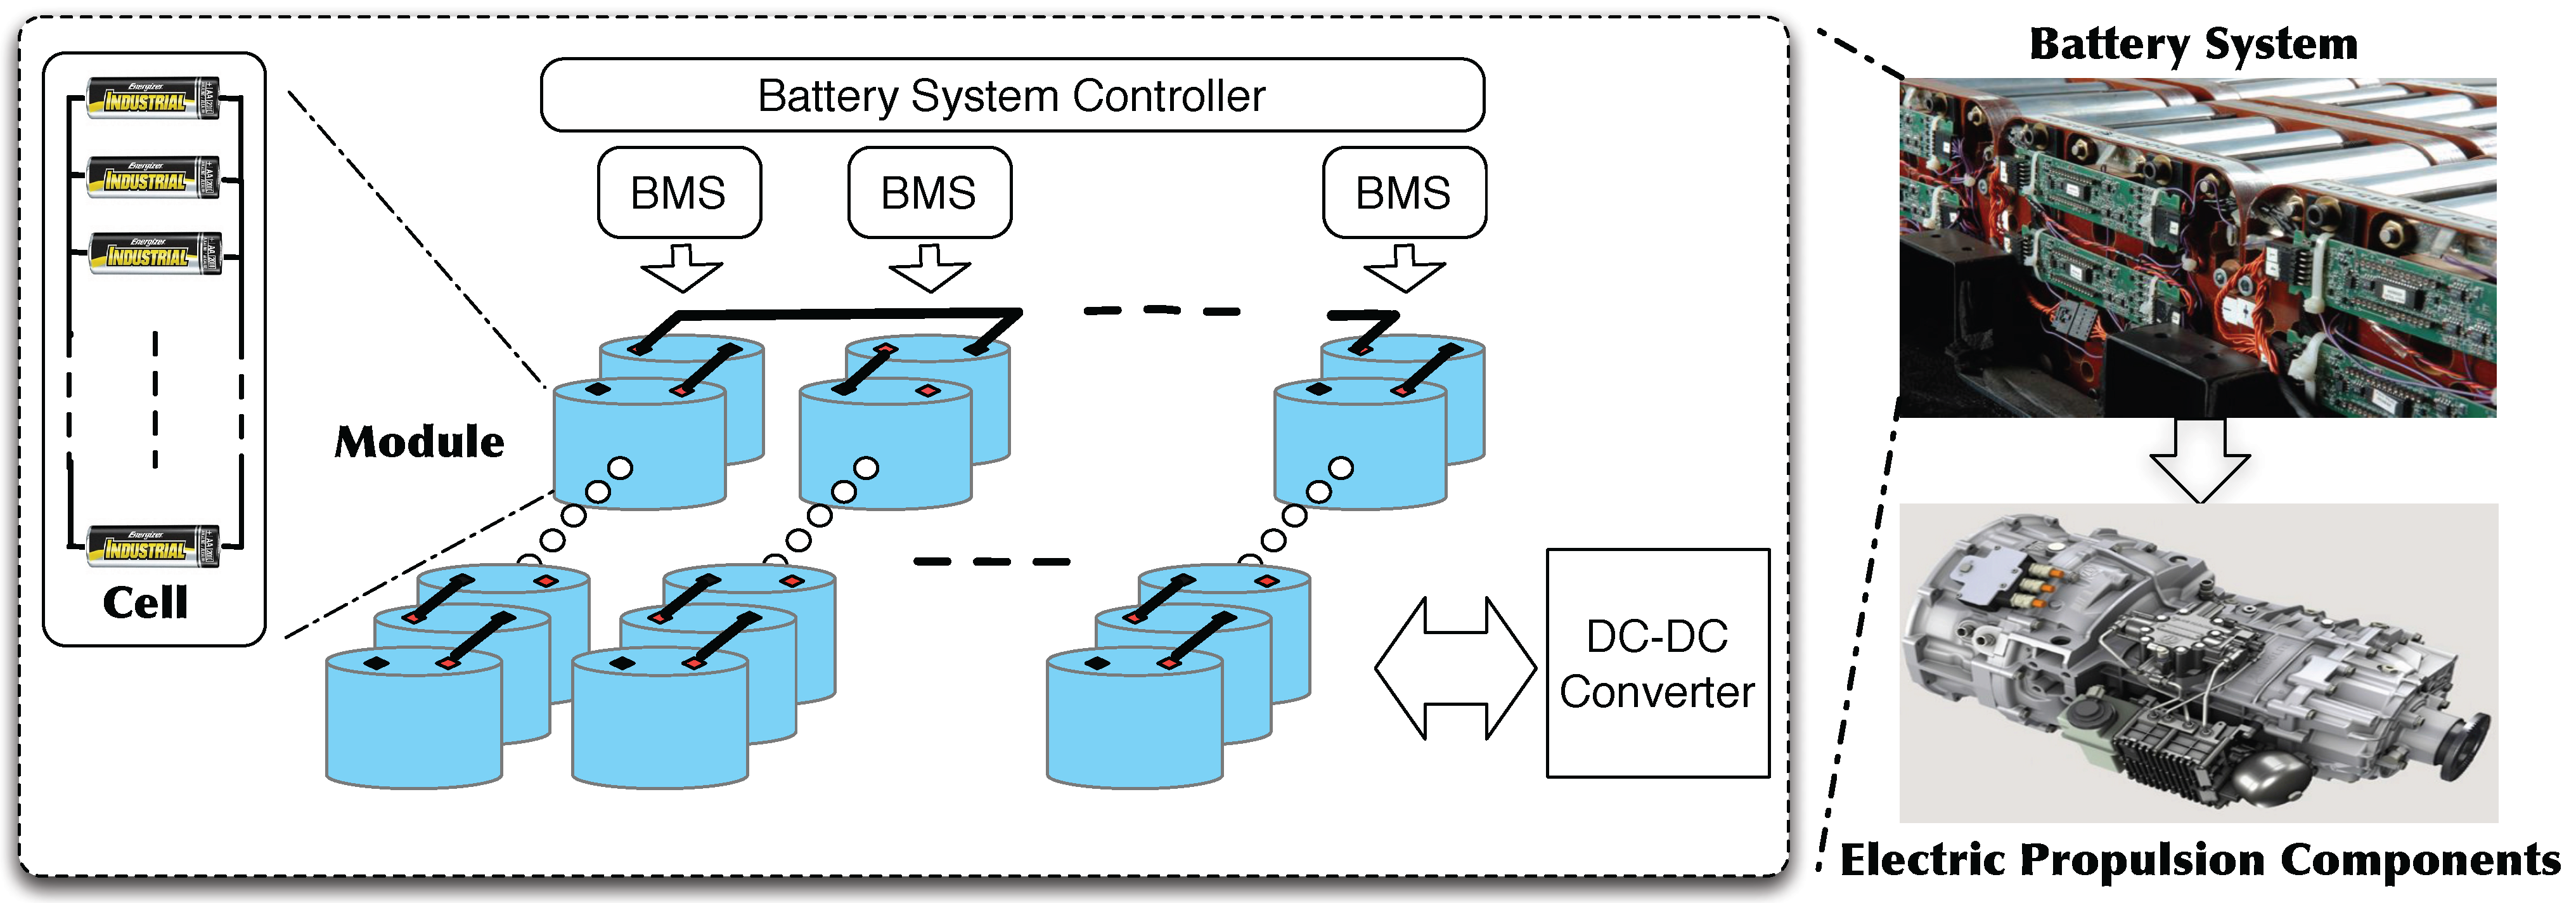
2.1. Battery System Overview
2.2. Battery System Design Challenges

- Battery system cost. Consider the recently developed Toyota Prius PHEVs. Each vehicle has a large-scale energy storage system containing over 500 Lithium-ion electrochemical battery cells with a total cost of over $35,000 [20] for 50-mile electric mode driving. Battery system cost is strongly correlated with user-specific driving behavior, run-time charge-cycle efficiency, and long-term lifetime reliability. Thus, accurate large-scale battery system modeling and development are essential for (P)HEV applications.
- Battery system run-time performance. User-specific run-time driving behavior results in different (P)HEV operations. Those vehicle operations directly affect the battery system run-time charging–discharging efficiency and run-time energy usage. For instance, frequent slowing down and speeding up of a vehicle can trigger intensive battery system usage, which causes electrochemical battery self-heating and accelerates battery system long-term capacity degradation. Therefore, it is important to characterize user-specific driving behavior, determine its relationship with battery system usage, and design the large-scale battery system accordingly.
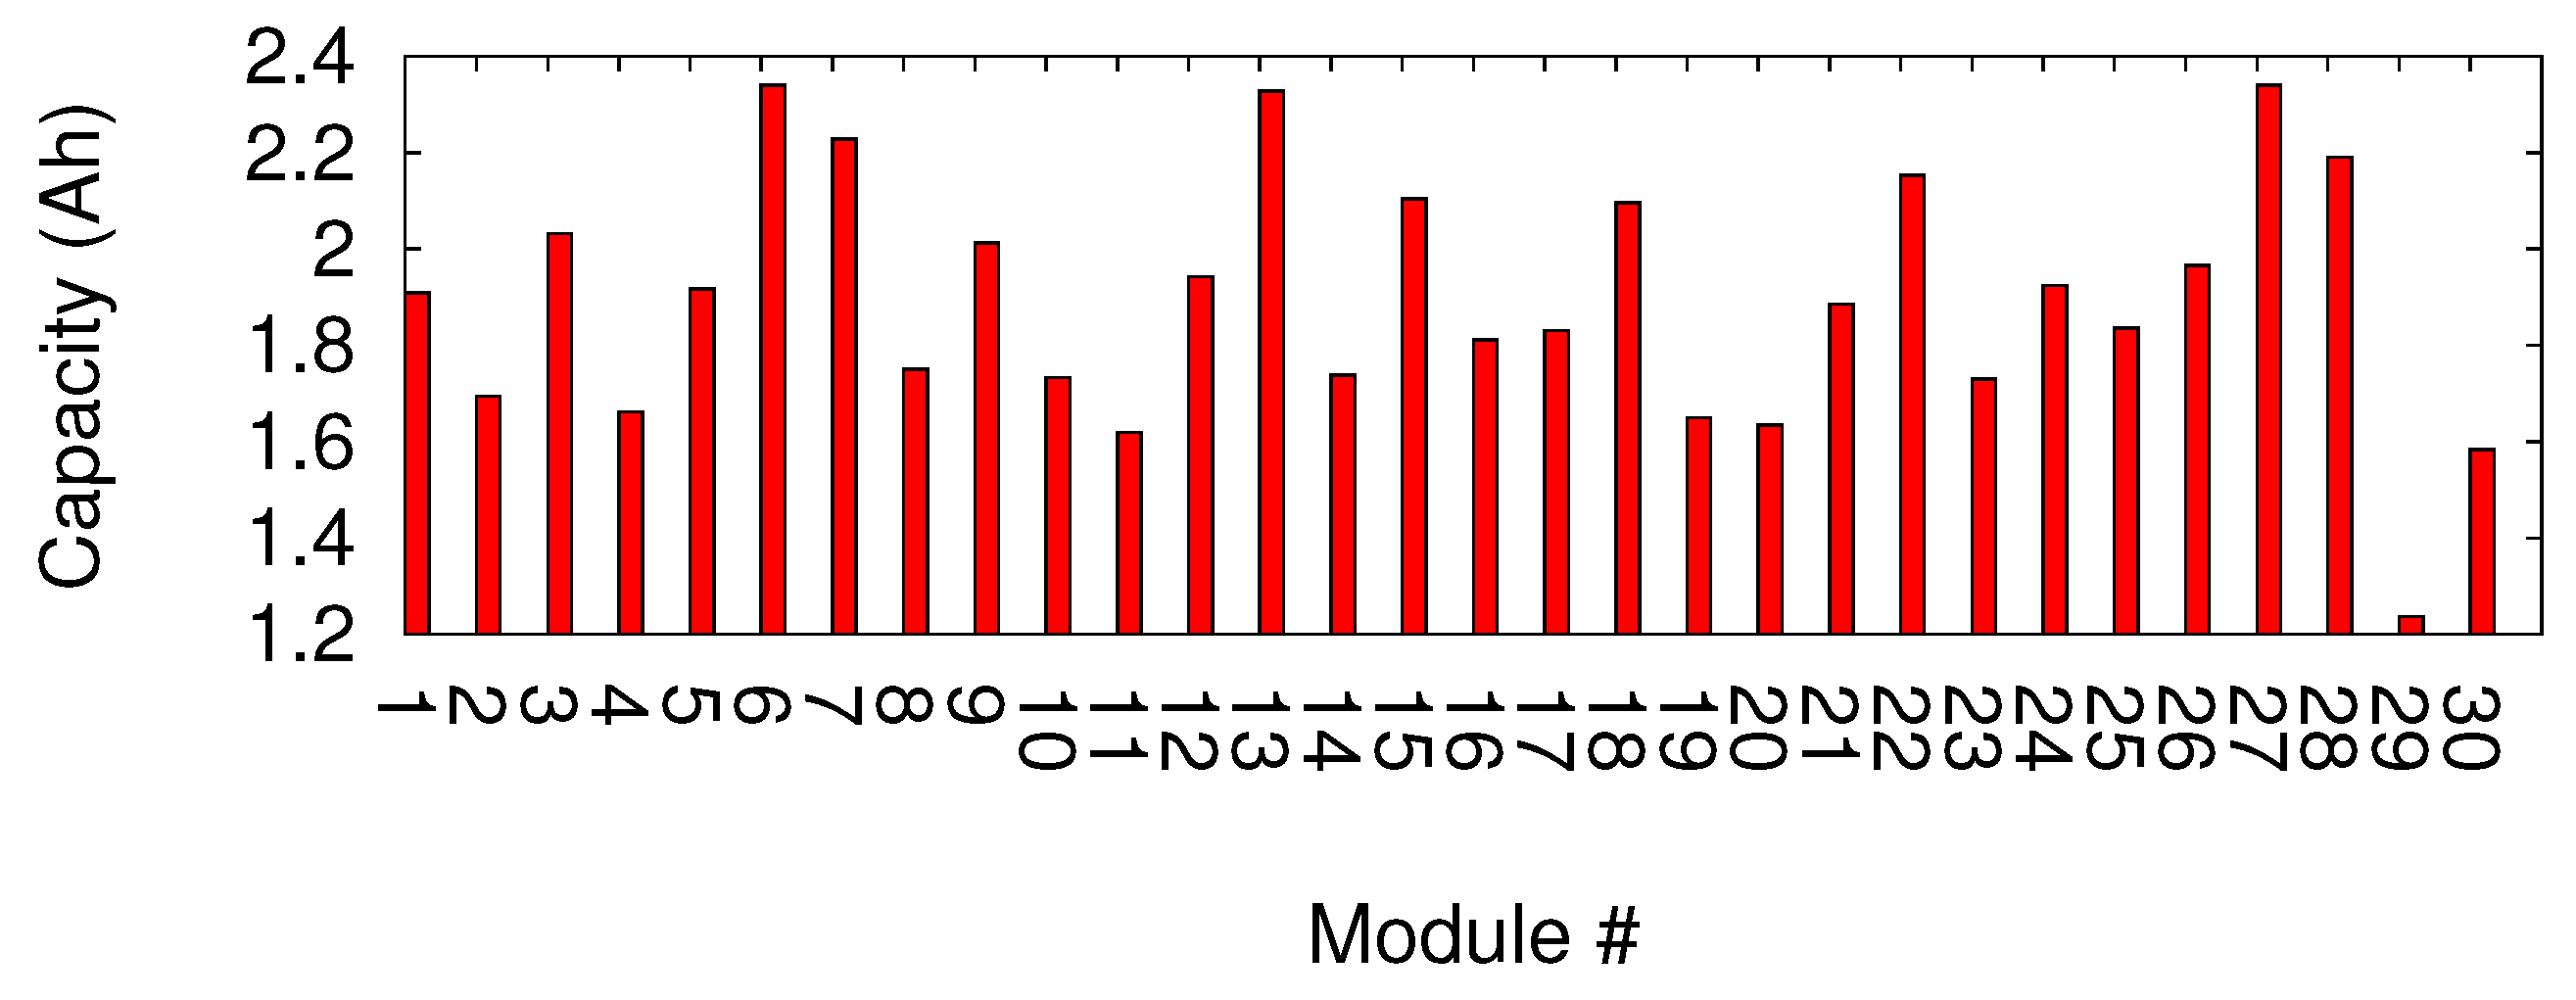
- Battery system long-term lifetime reliability. Based on the literature [11], temperature and depth-of-discharge are two factors with key impact on the battery aging effect and long-term lifetime reliability. A large-scale battery system’s reliability and performance are limited by its weakest cells, which can incur severe system performance penalties, as well as reliability and safety concerns. Heterogeneous run-time usage, various ambient environment, battery cells’ manufacture variation, and system mismatch problem, which lead to significant degradations and variations among individual battery cells, are the deep roots of battery system lifetime reliability crisis. Figure 2 shows the capacity degradation measurement results we obtained from 30 Lithium-ion battery modules in a PHEV. Over 40% capacity variation is observed among these modules due to aging. Hence, it is of particular importance to build an accurate battery system long-term lifetime model.
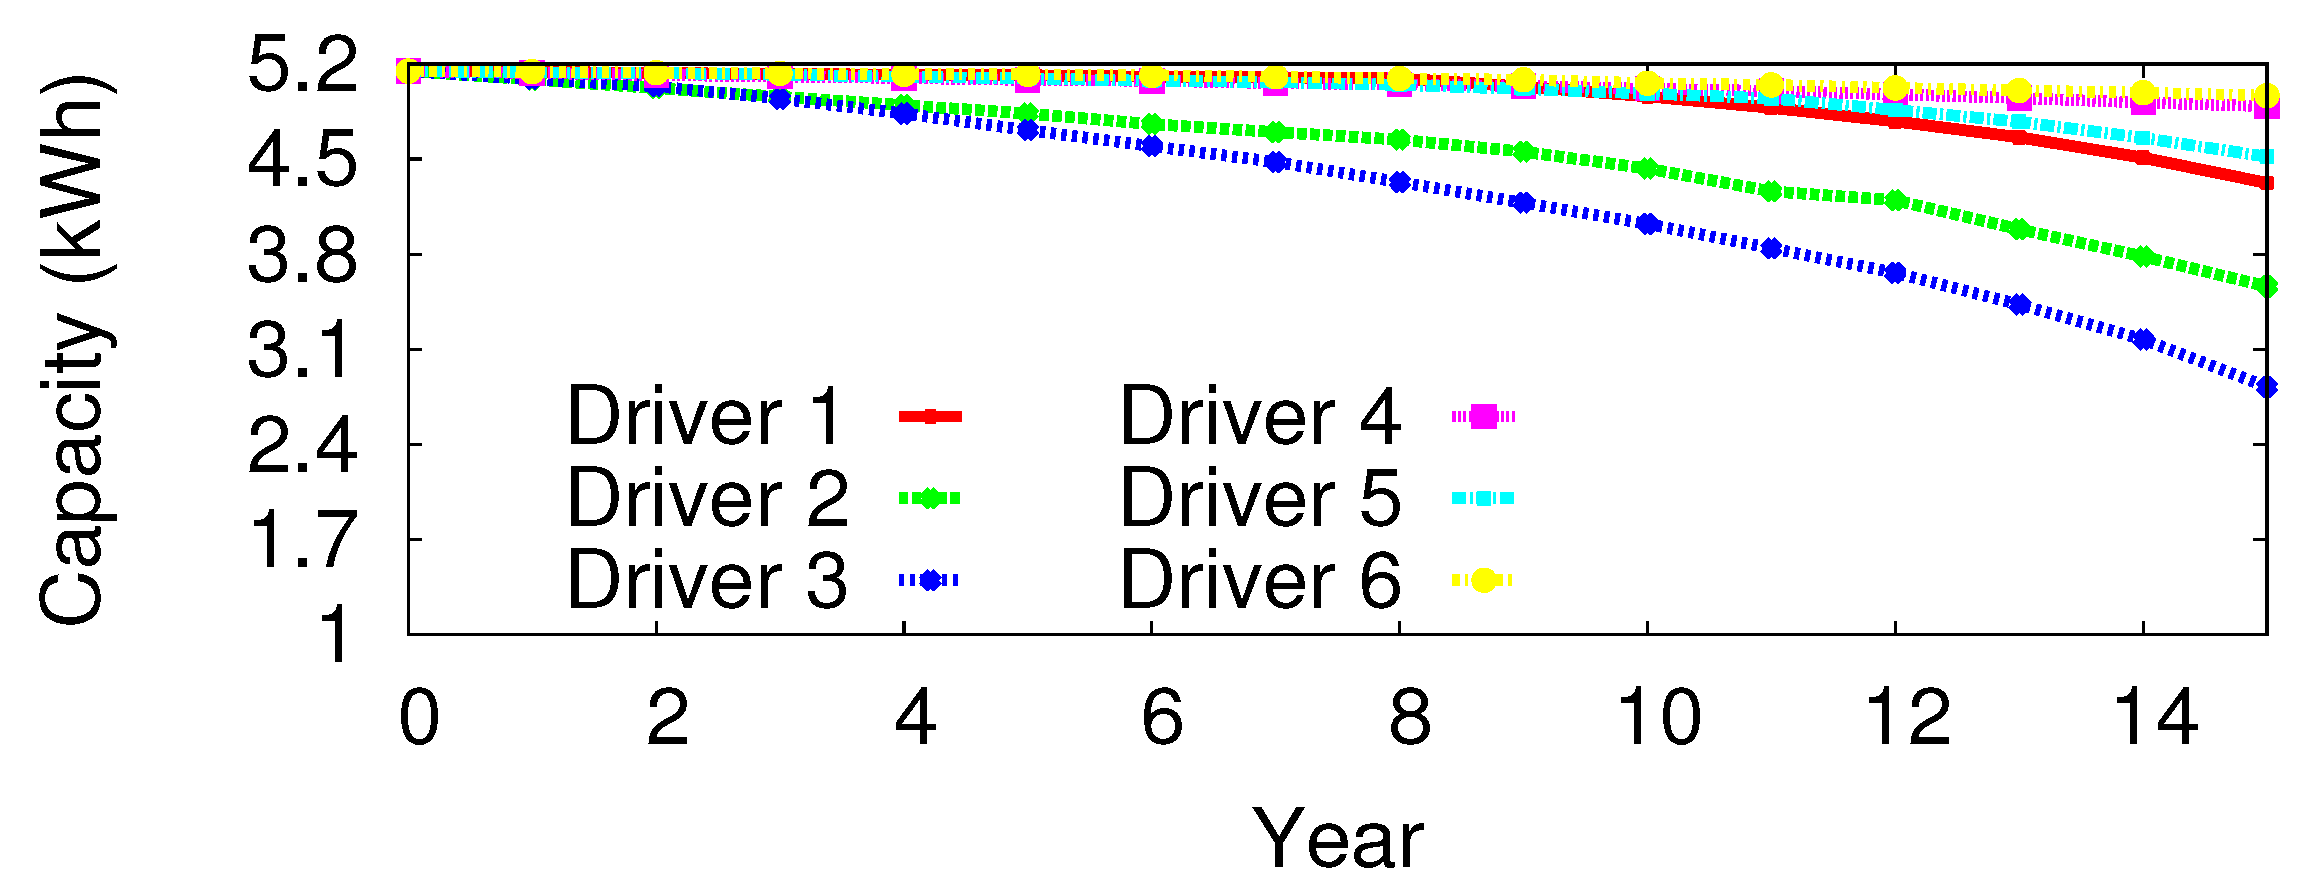
- User-specific driving behavior. People drive their vehicles very differently, and with diverse road and traffic conditions. These run-time user-specific driving behaviors have a significant impact on PHEV battery system run-time charge-cycle efficiency and long-term cycle lifetime. For instance, some aggressive driving behaviors, such as frequently slowing down or speeding up the vehicle, lead to intensive battery system charge and discharge. Such intensive run-time usage causes significant battery self-heating and accelerates temperature-dependent aging effects, leading to battery long-term capacity degradation. Using the proposed battery system model (Section 3), Figure 3 shows the estimated battery system long-term capacity degradation based on six different users’ daily commute driving profiles. It demonstrates that users’ driving patterns can significantly impact battery system long-term cycle life. Without knowledge of user-specific driving pattern, it is impossible to accurately model the run-time and long-term effects of a large-scale battery system.
3. Large-Scale Battery System Modeling Development
- Battery system performance is affected by various electrochemical effects. For instance, battery system long-term cycle life is affected by various aging effects, which in turn are influenced by run-time thermal effects and depth of discharge. All these factors must be carefully considered during battery system modeling and analysis.
- Computational complexity is a primary challenge for large-scale battery system modeling. Since each (P)HEV battery system contains a large number of battery cells and the system’s performance depends on the weakest battery cell, it is essential that we model the run-time behavior of individual cells accurately. Run-time battery system usage changes from second to second, and the long-term aging effects vary from months to years. Accurate and fast modeling of a battery system over such a large time span is challenging. Battery system modeling is further complicated by thermal analysis, which is known to have high computational complexity.
3.1. Battery Electrochemical Mechanisms
3.2. Run-Time Charge Cycle and Long-Term Cycle Life Analysis
3.3. Large-Scale Battery System Modeling
3.4. Large-Scale Battery System Validation
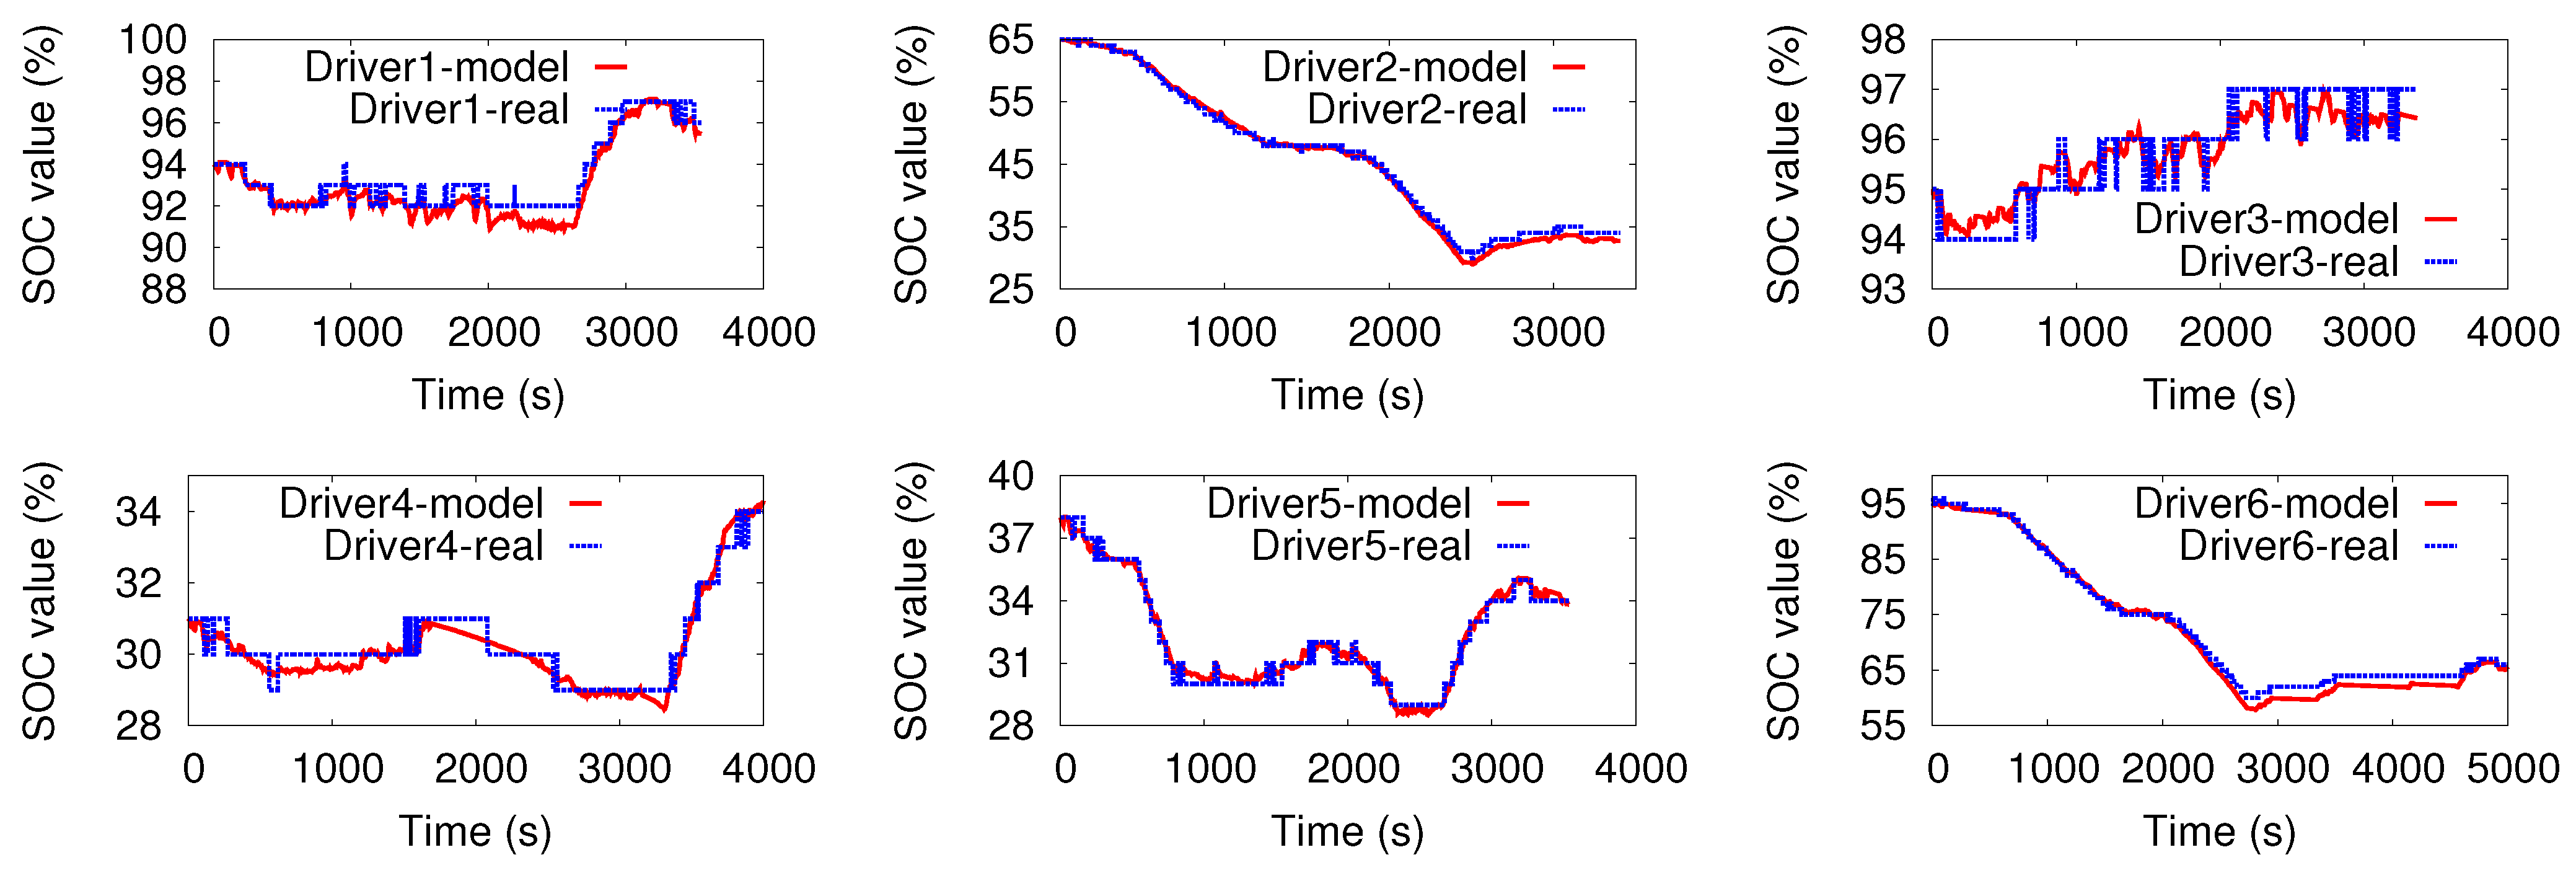
- Battery System Run-Time Validation Based on real-world driving data acquisition, we pick six driving traces and use their current, voltage and temperature information to simulate the SOC at each time point and compare the simulated SOC values to the physically measured values. In this study, the PHEV battery system consists of 1200 lithium-ion battery cells with a total energy capacity of 5.1 kWh. Figure 4 shows that the battery system run-time charge-cycle analysis accurately matches the measurement results of six different users’ driving profiles.Figure 4. Battery system run-time charge-cycle model validation.
![]()
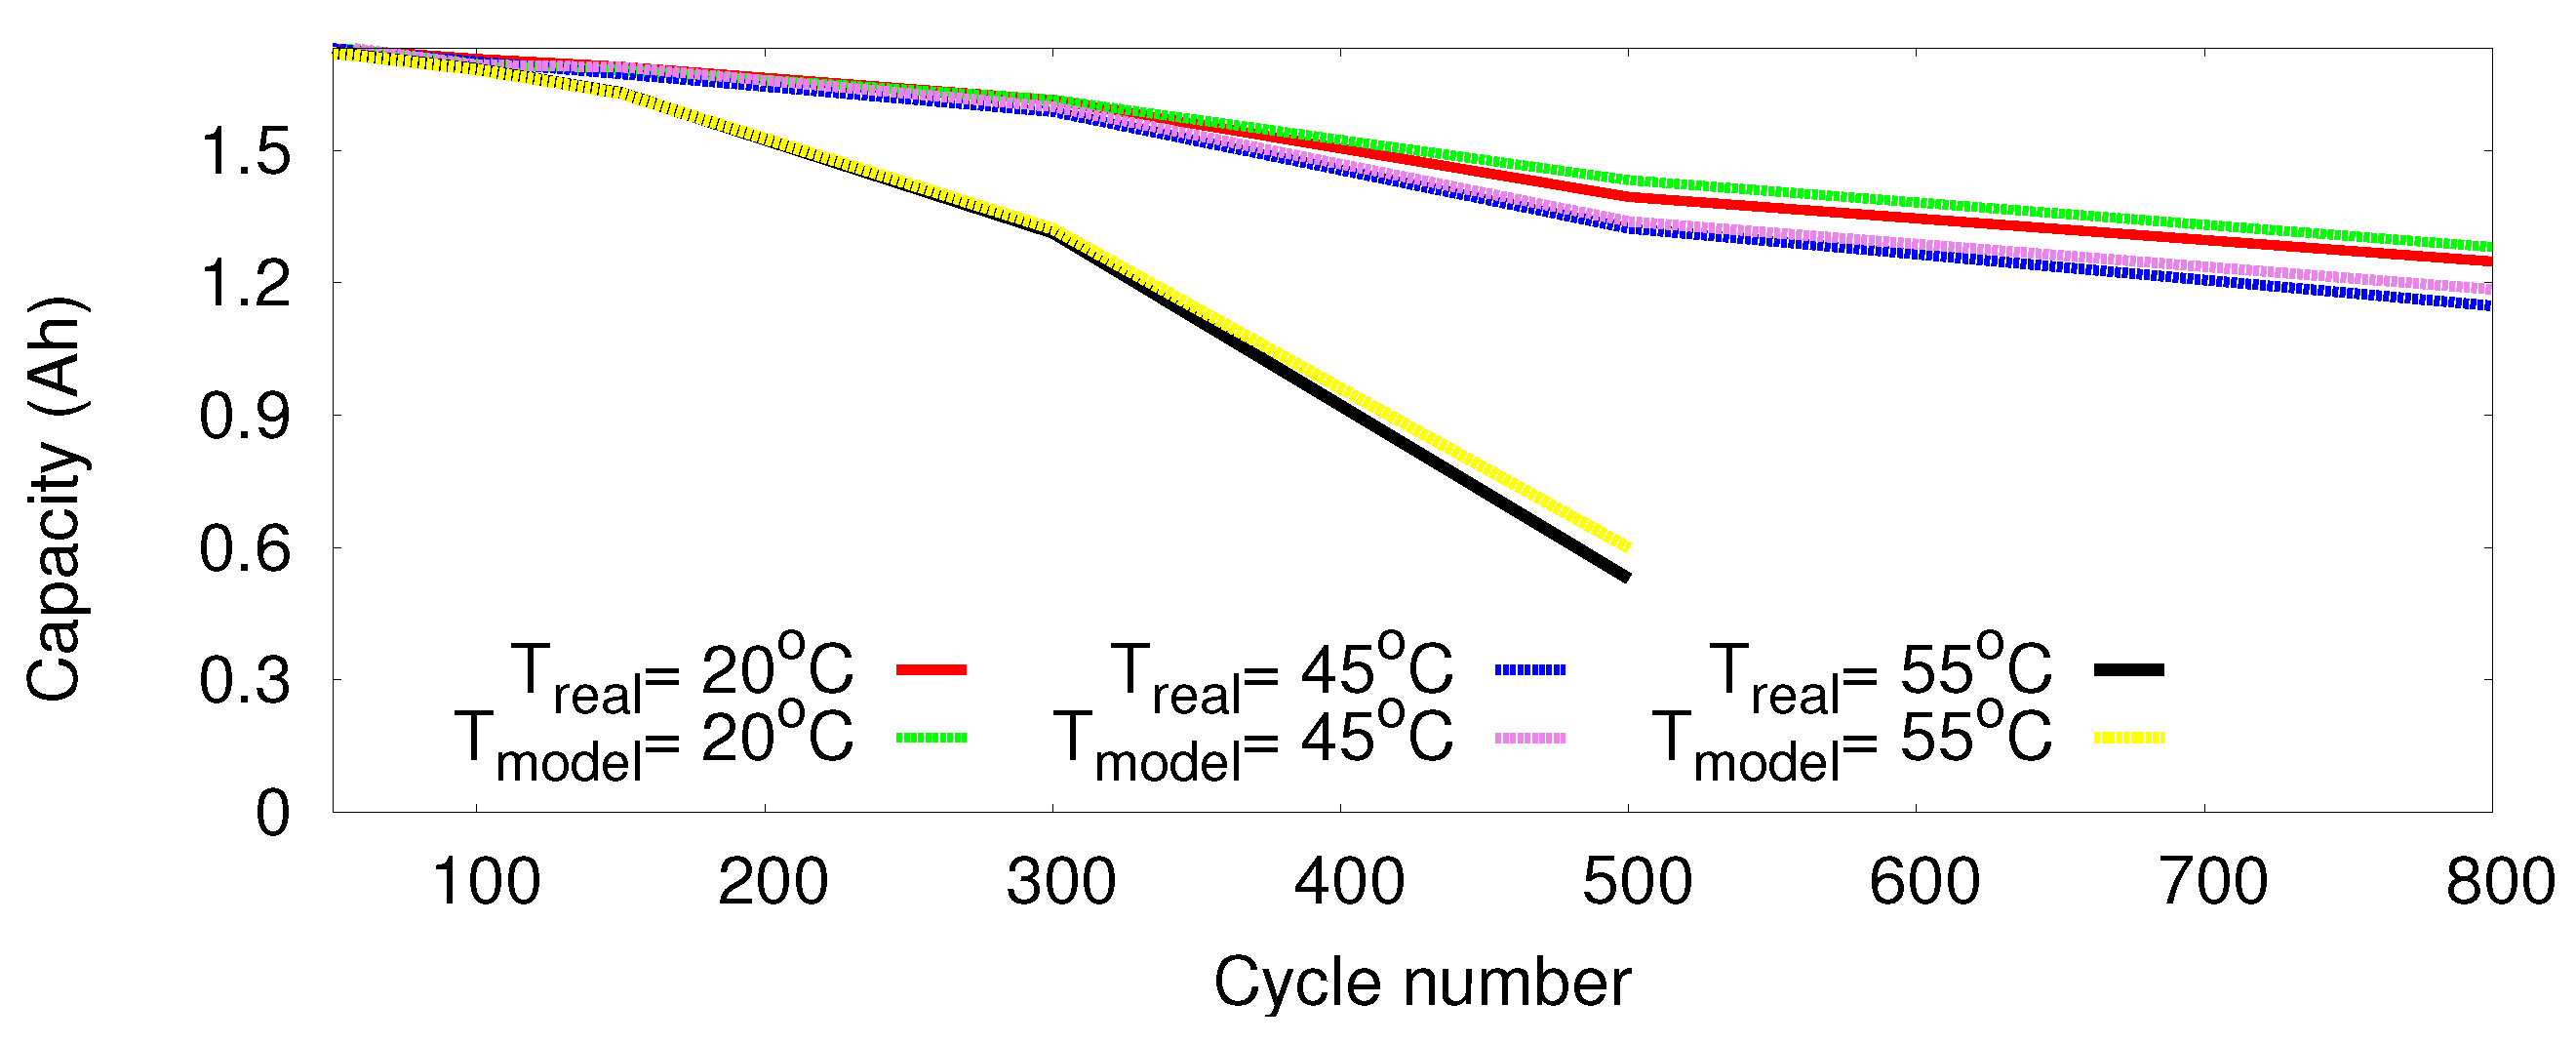
- Battery Cell Long-Term Aging Effect Validation To validate the model of long-term aging effect, we use generalized Sony 18650 cell with 1.8 Ah capacity. We adopt the conventional constant current and constant voltage charge/discharge policy. A direct current of 1 A is used to charge the cell during the constant current part, and the cut-off voltage is set to 4.2 V. Subsequently, the voltage is held constant at 4.2 V till the current drops to 2.0 V. In the validation, we consider three temperature settings: 20 C, 45 C, and 55 C. The simulation results are shown in Figure 5, which are consistent with the measurement results from the literature [25]. As shown in the figure, during the initial cycles, different temperatures have a similar impact on battery aging. As the number of cycles increases, higher battery temperature leads to more significant degradation of battery capacity.
- Battery System Modeling Efficiency In order to validate the battery system modeling efficiency, we adopt ten daily driving traces with diverse duration to measure the computation time of 15-year battery system lifetime simulation. For the experiment, we assume that during the 15 years, the same trace is repeated daily. As shown in Table 1, the proposed model can simulate 15-year battery system lifetime in less than two minutes, and it scales well as trace duration increases.

| Trace | 1 | 2 | 3 | 4 | 5 |
| Daily trip duration (s) | 211 | 516 | 1202 | 1470 | 1598 |
| Computation time (s) | 8.6 | 15.5 | 37.5 | 45.3 | 50.0 |
| Trace | 6 | 7 | 8 | 9 | 10 |
| Daily trip duration (s) | 1717 | 2140 | 2571 | 2571 | 3536 |
| Computation time (s) | 53.5 | 67.5 | 81.7 | 92.0 | 112.4 |
4. Comprehensive Analysis of Driving Behavior and Energy Usage
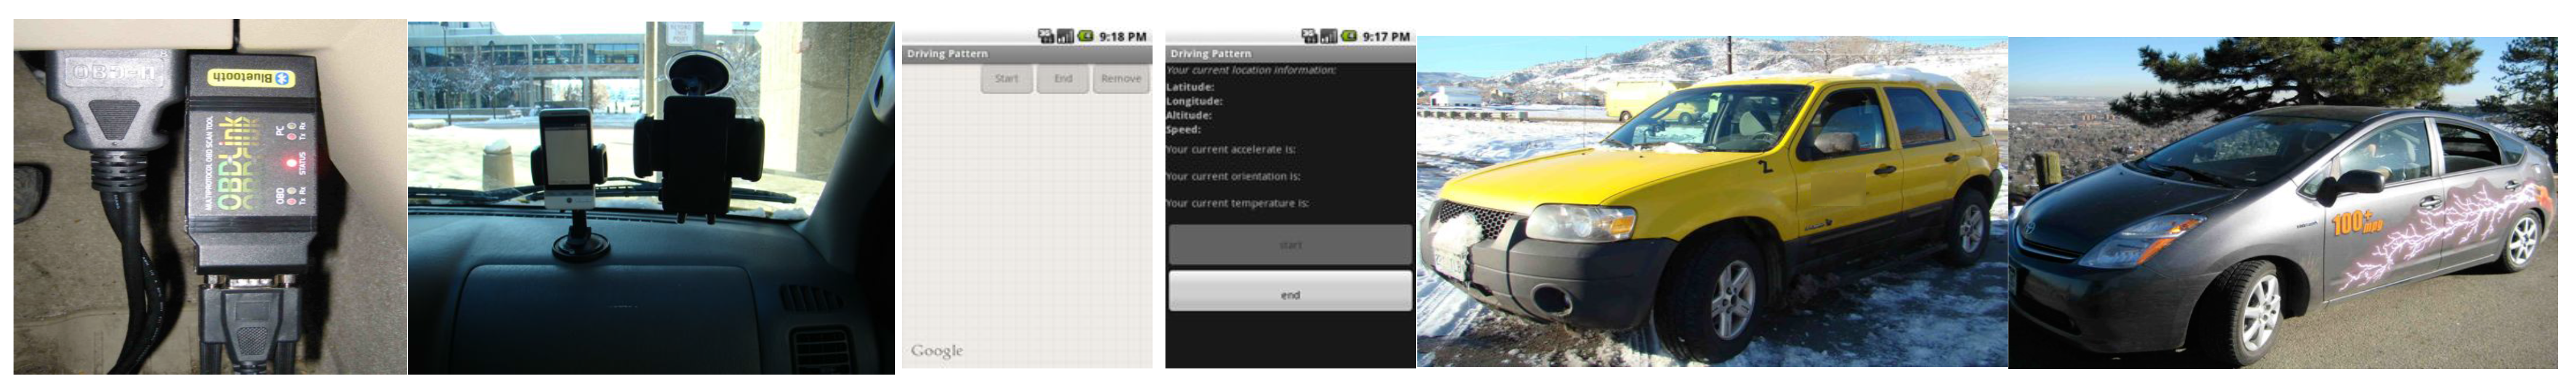
4.1. Real-World User Driving Pattern Monitoring System
4.2. Real-World User Driving Behavior Impact Analysis
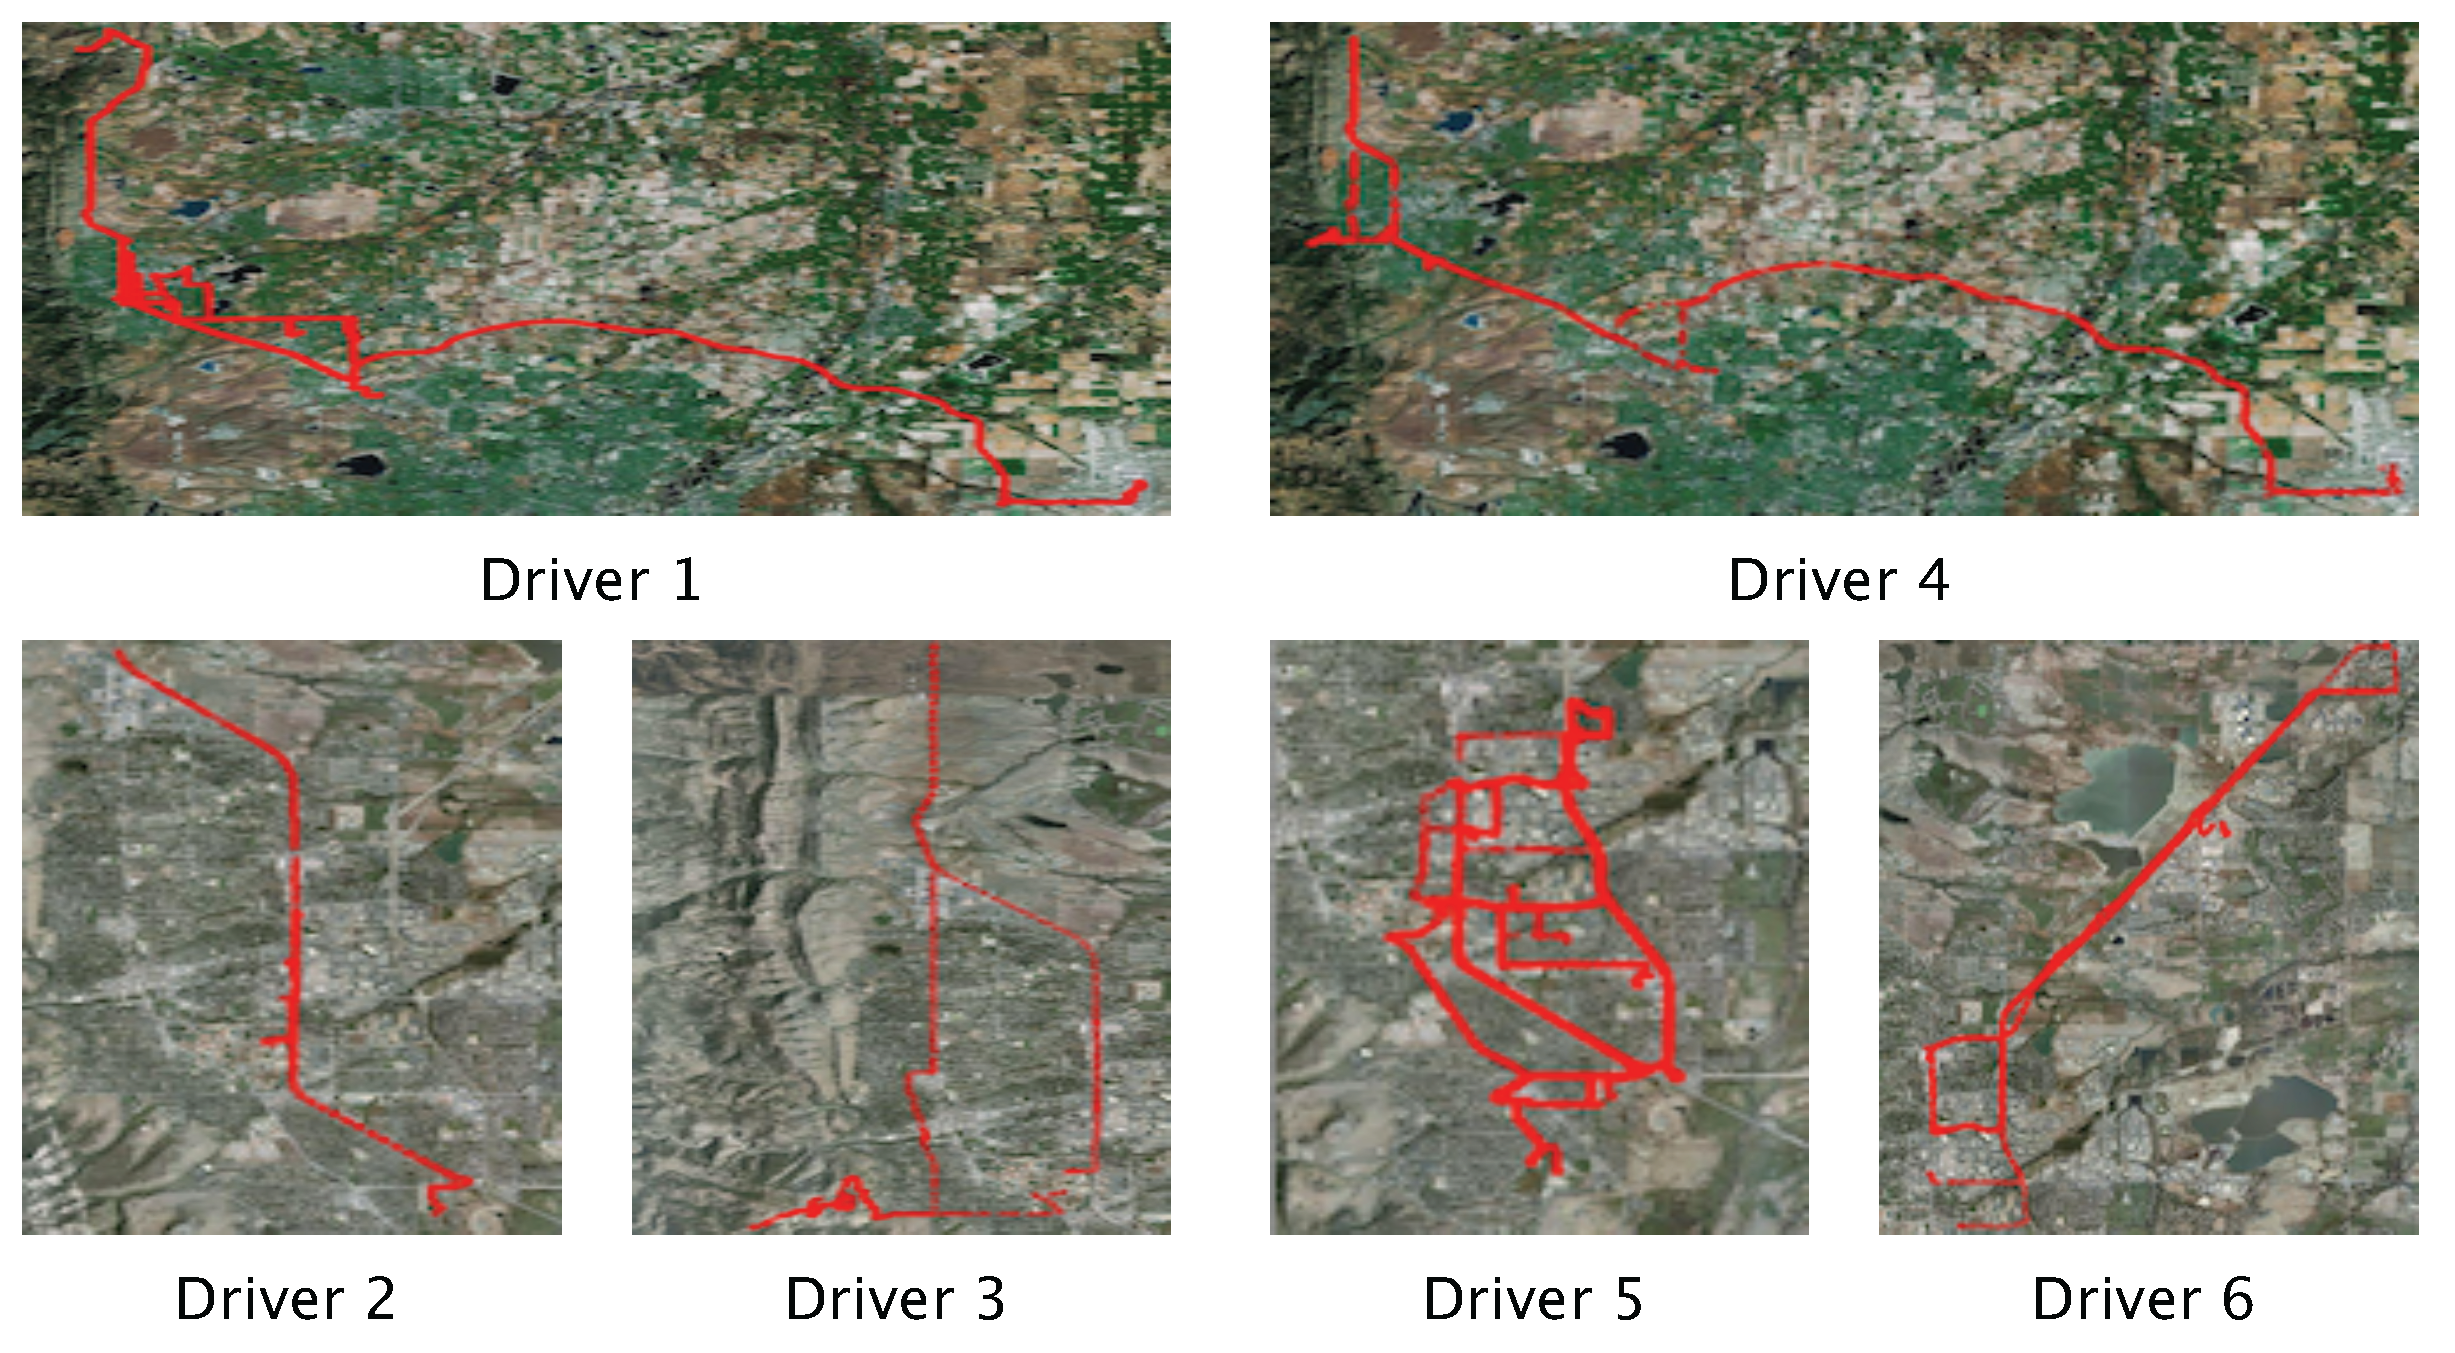
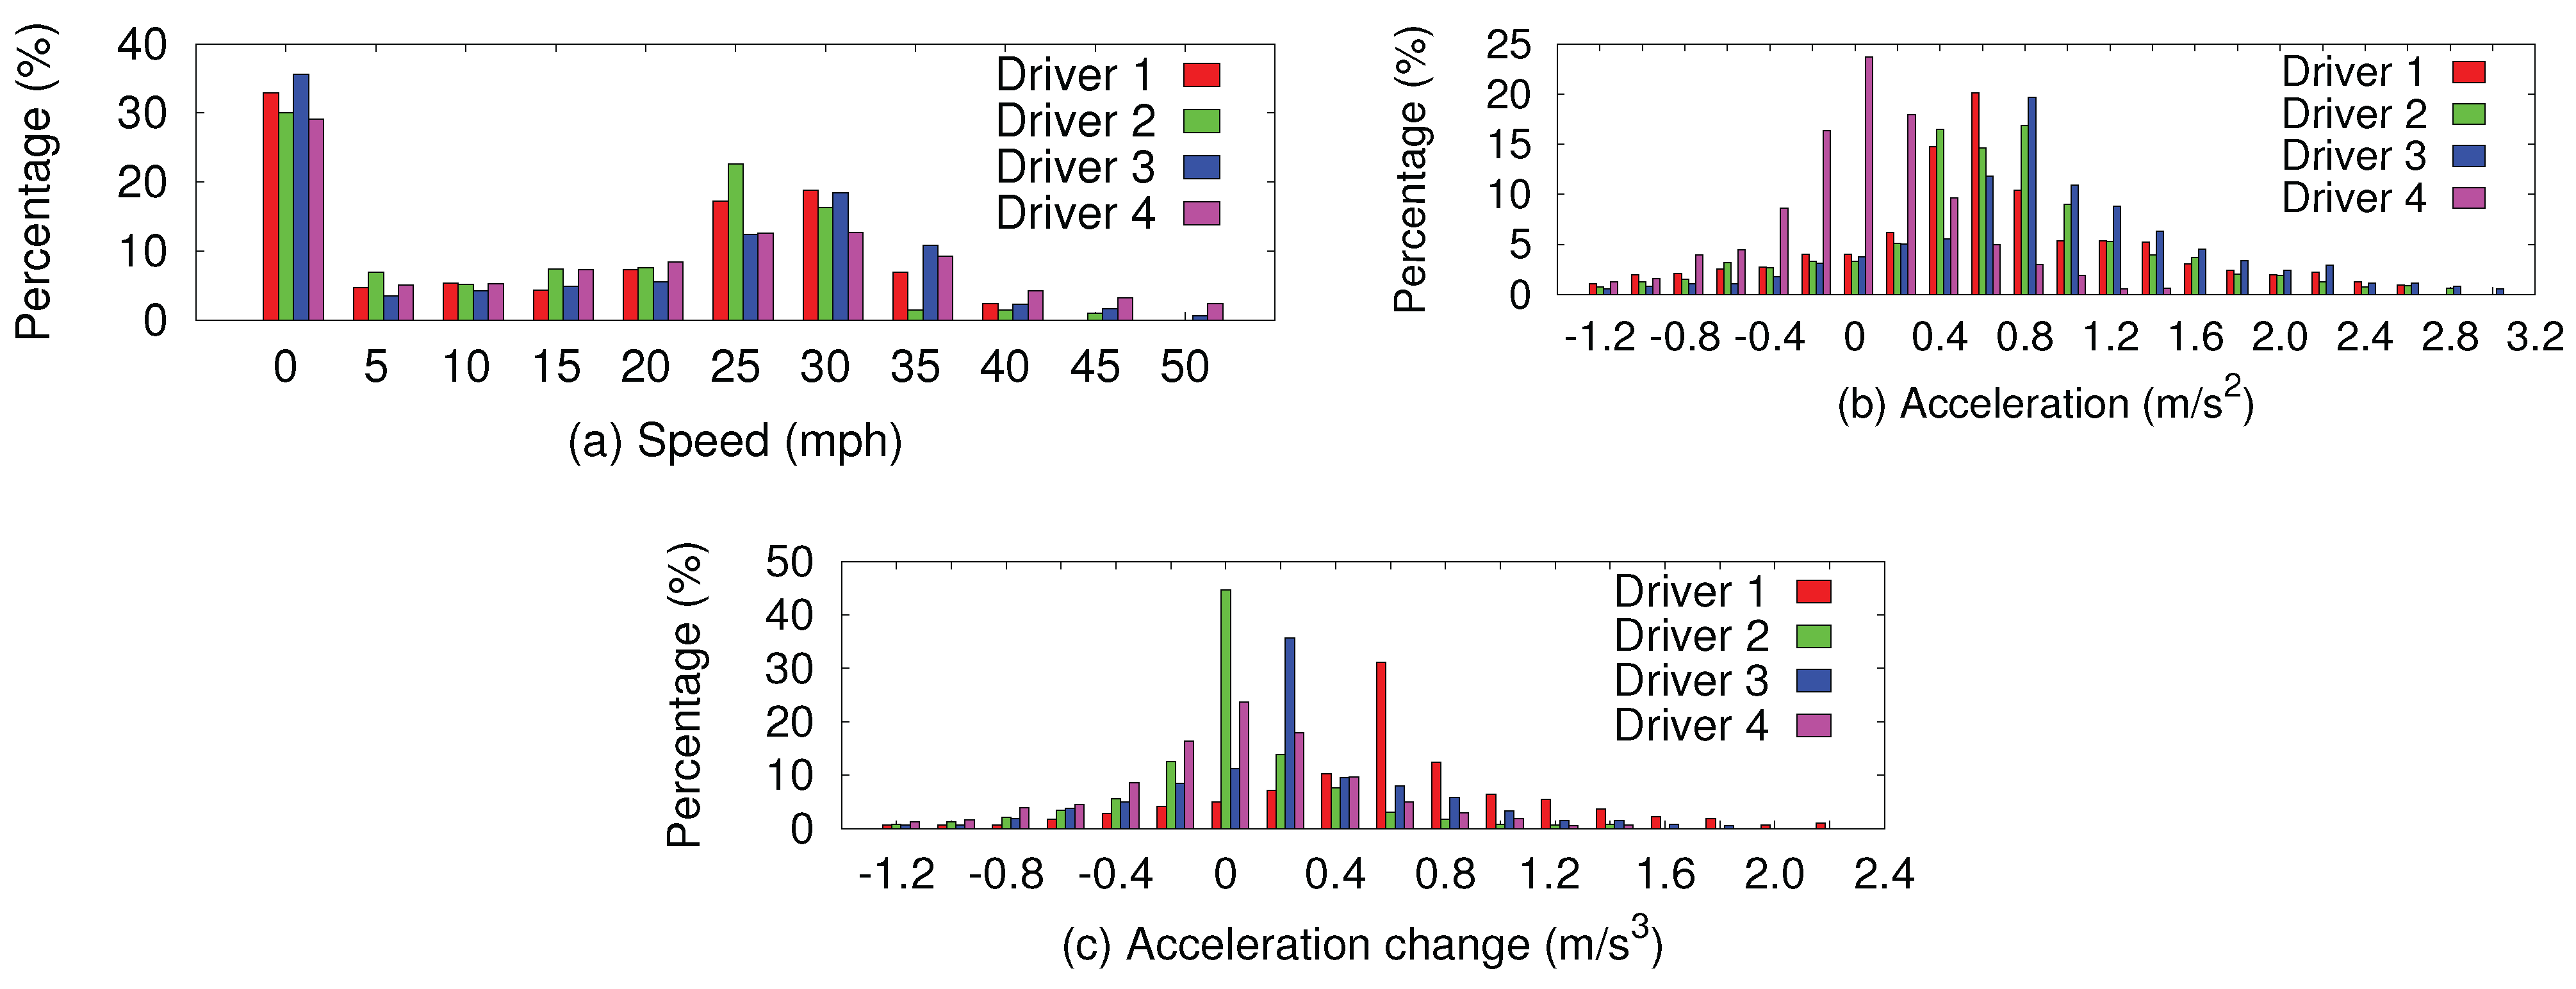
- User-Specific Driving Behavior Analysis In (P)HEV applications, the energy usage of large-scale battery system is strongly correlated with users’ driving behavior, which differ significantly from one driver to another. Figure 7 shows the heterogeneous routes taken by our six drivers in their regular driving activities. For instance, driver 4 travels more often on highway, while driver 5 spends most of his/her driving time on city roads. These routes vary in road condition with different slope and speed limit. Table 2 compares the driving trips of the six participants. Note that the driving behavior of different users may differ significantly even when the road and traffic conditions are the same. Some drivers drive their vehicles more aggressively than others, e.g., frequently speeding up and slowing down the vehicle. In order to evaluate this phenomenon, we conducted a study in which four drivers drove the same selected route with the same starting time, which eliminates possible variations of road and traffic conditions. Figure 8a–c shows the vehicle speed, acceleration and acceleration change profiles of the four drivers. As can be seen from these figures, the four drivers have similar speed profiles due to the same traffic congestion, stop signs, speed limit, and traffic lights. On the other hand, their driving profiles vary significantly in terms of vehicle acceleration and acceleration change.Figure 7. Heterogeneous routes driven by the six users in our study.
![]()
Table 2. Comparison of different participants’ driving trips. Driver ID 1 2 3 4 5 6 Total time (s) 43,176 26,218 22,188 37,498 44,615 103,608 Total distance (mile) 366.4 177.8 166.5 322.4 185.6 537.1 Total days 14 9 5 27 11 25 Total trips 26 22 18 37 43 35 Time per day (s) 3084 2913 4438 1388 4056 4144 Distance per day (mile) 26.2 19.8 33.3 11.9 16.9 21.5 Figure 8. Speed and acceleration comparison of four different drivers on the same route.![]() Based on the analysis above, users’ driving behaviors are mainly manifested in the following aspects: acceleration, change of acceleration, slope and speed.
Based on the analysis above, users’ driving behaviors are mainly manifested in the following aspects: acceleration, change of acceleration, slope and speed. - (P)HEV Energy Studies This part investigates the impacts of user driving behavior on (P)HEV fuel efficiency and battery system usage. The following studies use the real-world user-driving data gathered from the deployed personalized mobile sensing systems, and the proposed modeling and analysis framework to investigate the impacts of road conditions, as well as user-specific driving patterns.
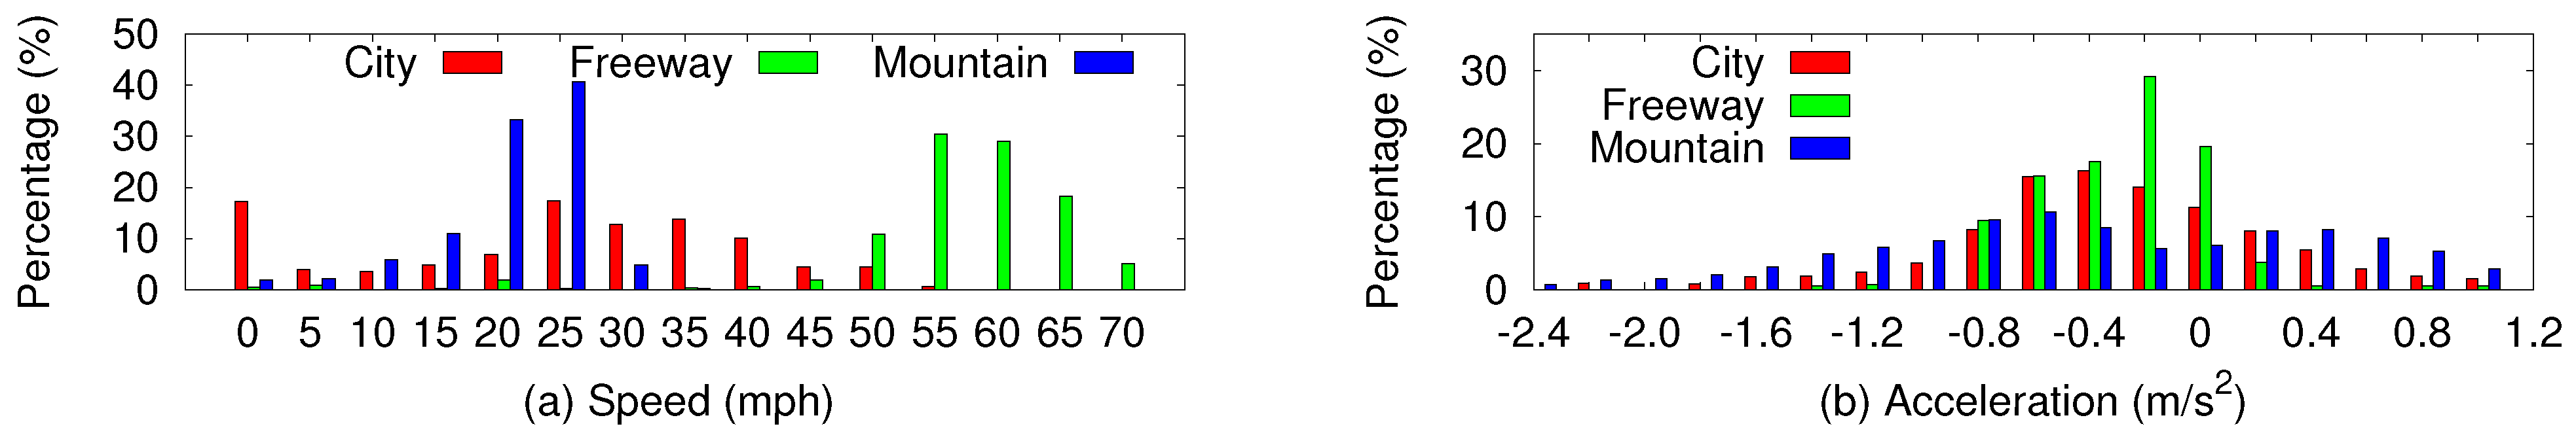
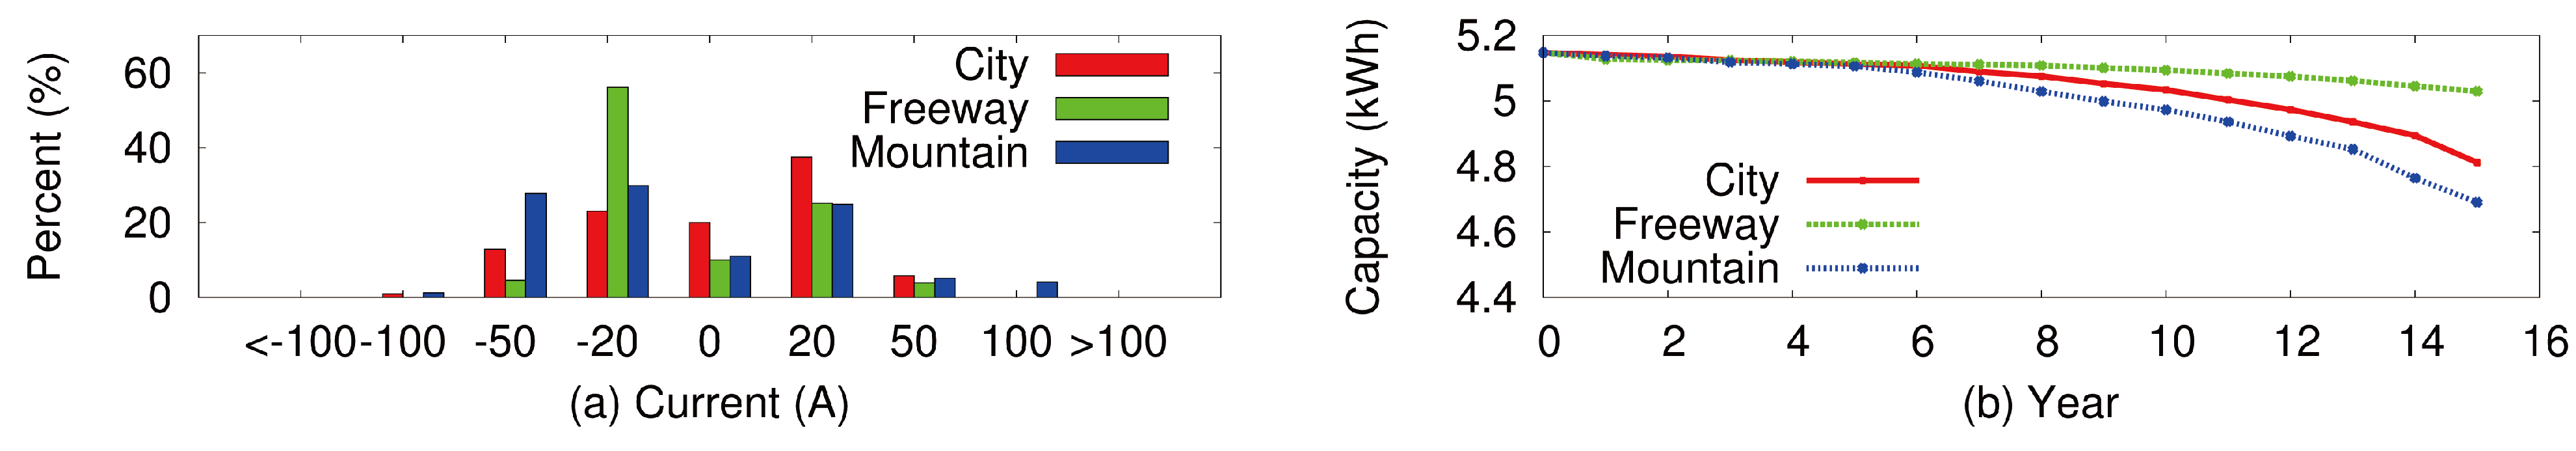
- Impact of Road Conditions. Road conditions vary within users’ daily trips, which affect user driving patterns and (P)HEV operation. Figure 9 shows the speed and acceleration profiles under three road conditions: city, freeway, and mountain. As shown in this figure, road condition has direct impact on vehicle operation. One key factor is the dynamic elevation change during mountain driving. Freeway driving exhibits the minimal vehicle acceleration, due to the smooth road and traffic conditions. Figure 10 investigates vehicle fuel usage and battery use under different road conditions. In this study, to evaluate the impact on both fuel efficiency and battery system, the PHEV operates in the normal hybrid mode, and the EV mode is disabled. Figure 10a shows the PHEV battery system use. From freeway, city, to mountain driving, the battery system operation becomes increasingly intensive, as more demand from the electric motor (battery discharge) and more braking energy can be harnessed (battery charge). However, the assistance of the battery system does not come for free. Figure 10b estimates the long-term battery capacity loss due to thermal-dependent battery aging effects. It demonstrates that, such intensive battery use causes significant battery self-heating, which accelerates thermal-dependent battery aging effects.Figure 9. Speed and acceleration comparison under different road conditions.
![]() Figure 10. Fuel usage and battery use comparison under different road conditions.
Figure 10. Fuel usage and battery use comparison under different road conditions.![]()
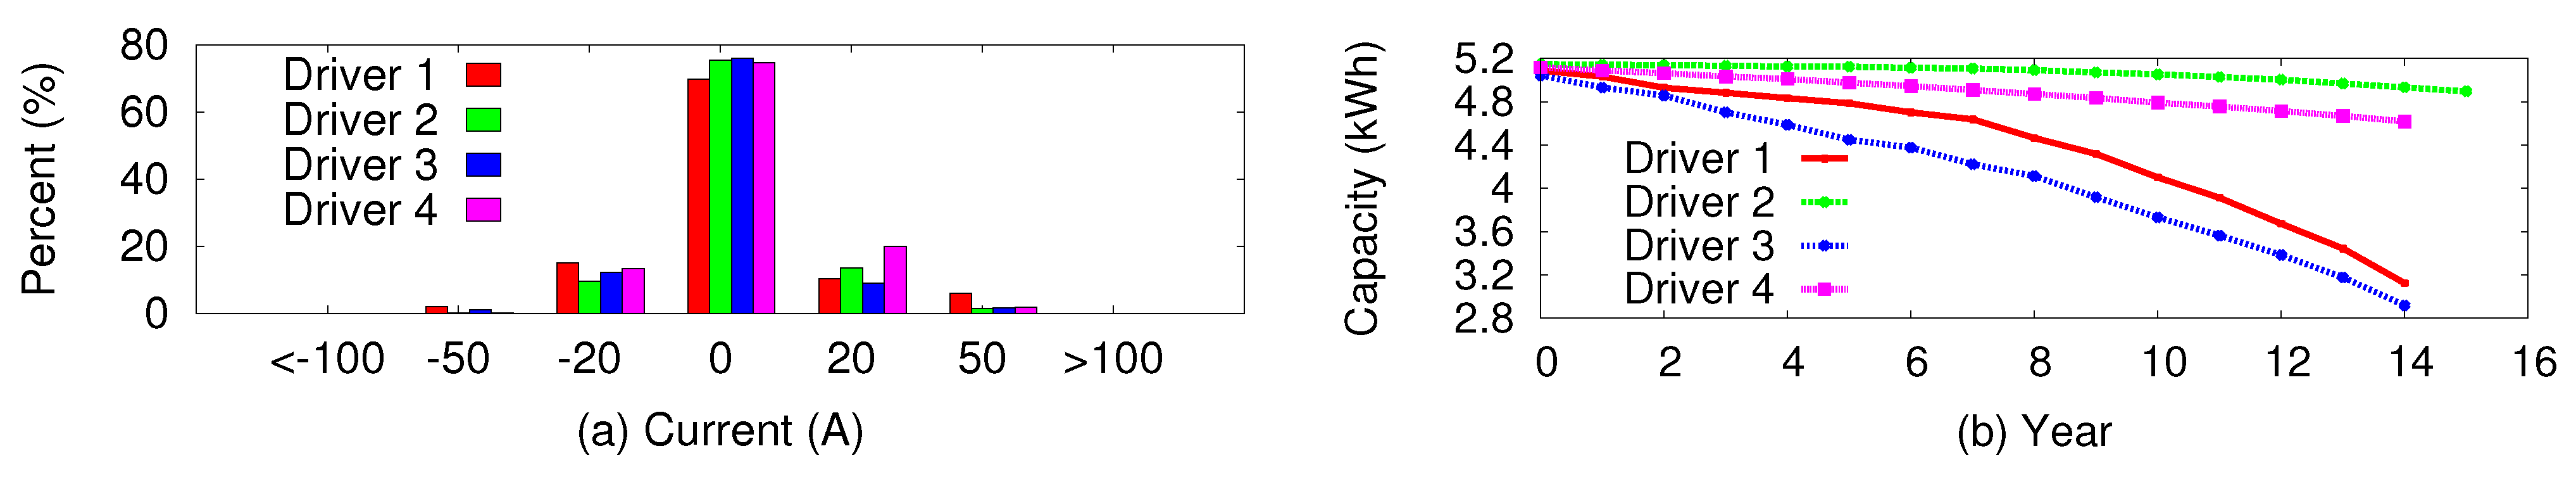
- Impact of User-Specific Driving Patterns. Driving behavior differs significantly among users, even under the same road and traffic conditions. According to the analysis above, four participants drove along the same selected route with the same starting time, in order to eliminate possible variations of road and traffic conditions. Figure 11 investigates the impact of user-specific driving patterns, which demonstrate the strong correlation between user-specific driving pattern and vehicle battery system use and capacity degradation. Aggressive driving patterns result in intensive battery system use, causing significant battery life-time aging and capacity loss.
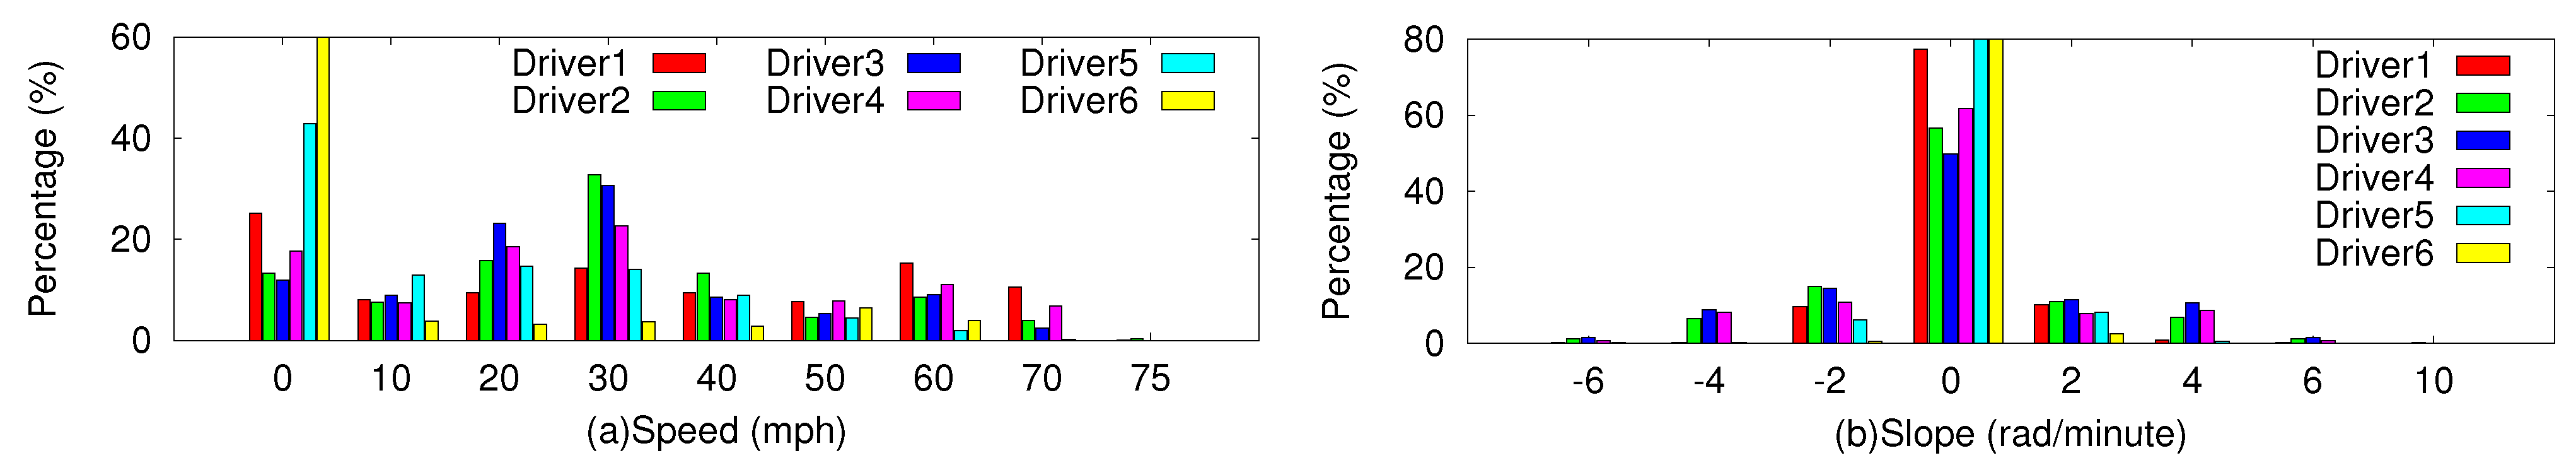
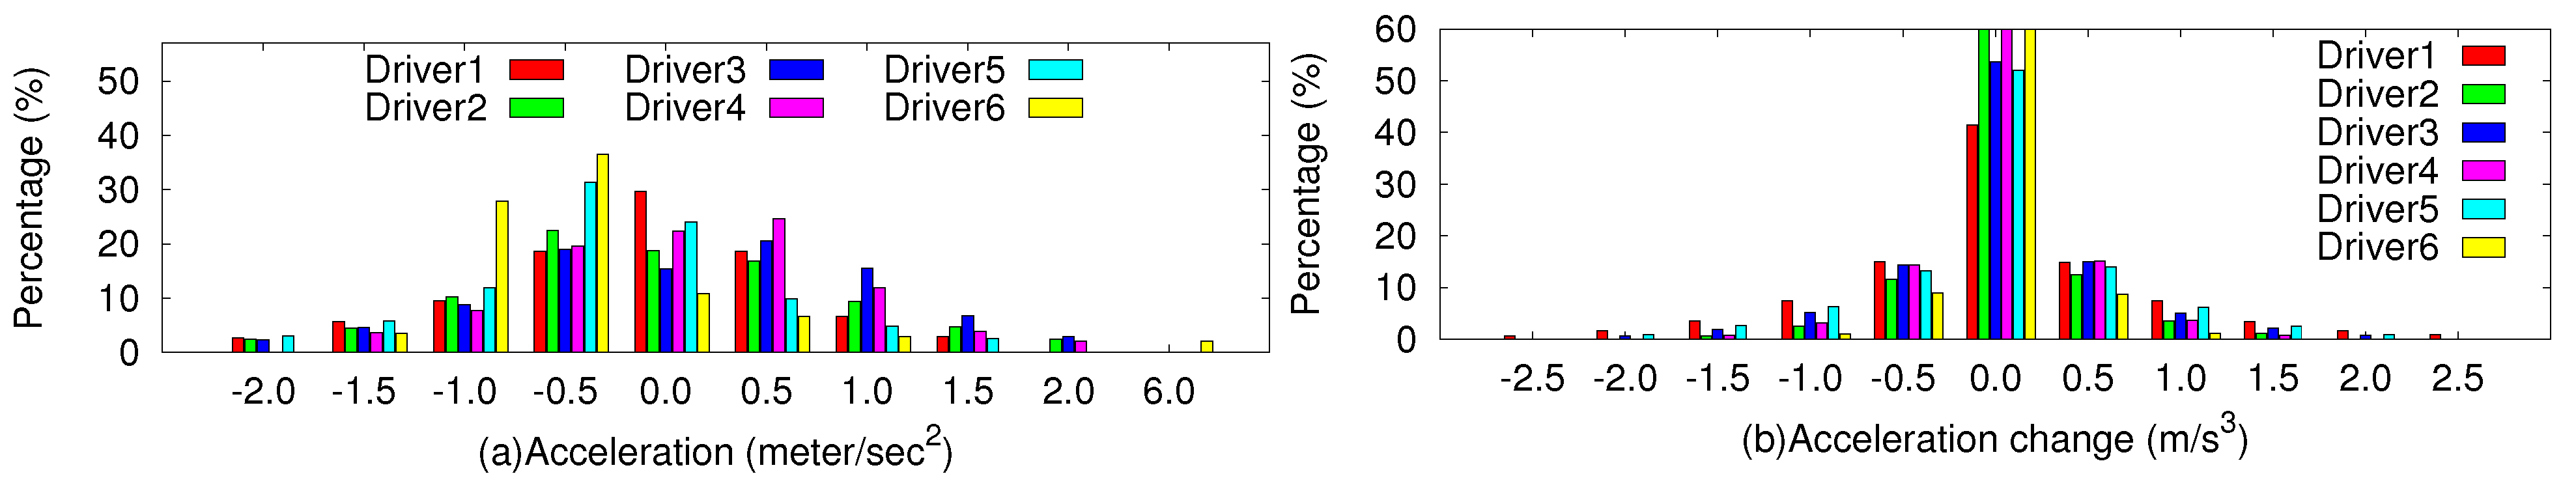
- Impact of User-Specific Routes and Driving Patterns. Different users have different driving patterns, and their routes can be different. Here, we investigate the mixed impact of both routes and driving patterns using six different users’ daily driving data. Firstly, Figure 12,Figure 13 show the histogram of acceleration, the change frequency of acceleration, speed and slop for different drivers. Based on Figure 12 different people drive differently with regard to acceleration. Some drive more aggressively with higher acceleration values and more acceleration changes, while others drive more smoothly with lower acceleration values and fewer acceleration changes. Figure 13a compares the speed histograms of different drivers. For instance, driver 5, who drives mostly on city roads, generally has a lower speed profile than people who drive on freeway (e.g., drivers 1 and 4). Figure 13b shows the histograms of slope in different users’ trips, measured as rad per minute. As shown in this figure, some people drive mostly on level roads (e.g., drivers 5 and 6), while others also drive in the mountain with more diverse slopes (e.g., drivers 2, 3 and 4).Figure 11. Battery use and capacity loss comparison of different drivers on the same route.
![]() Figure 12. Acceleration (acc.) and Acc. change frequency histogram comparison of different drivers.
Figure 12. Acceleration (acc.) and Acc. change frequency histogram comparison of different drivers.![]() Figure 13. Speed and slope histogram comparison of different drivers.
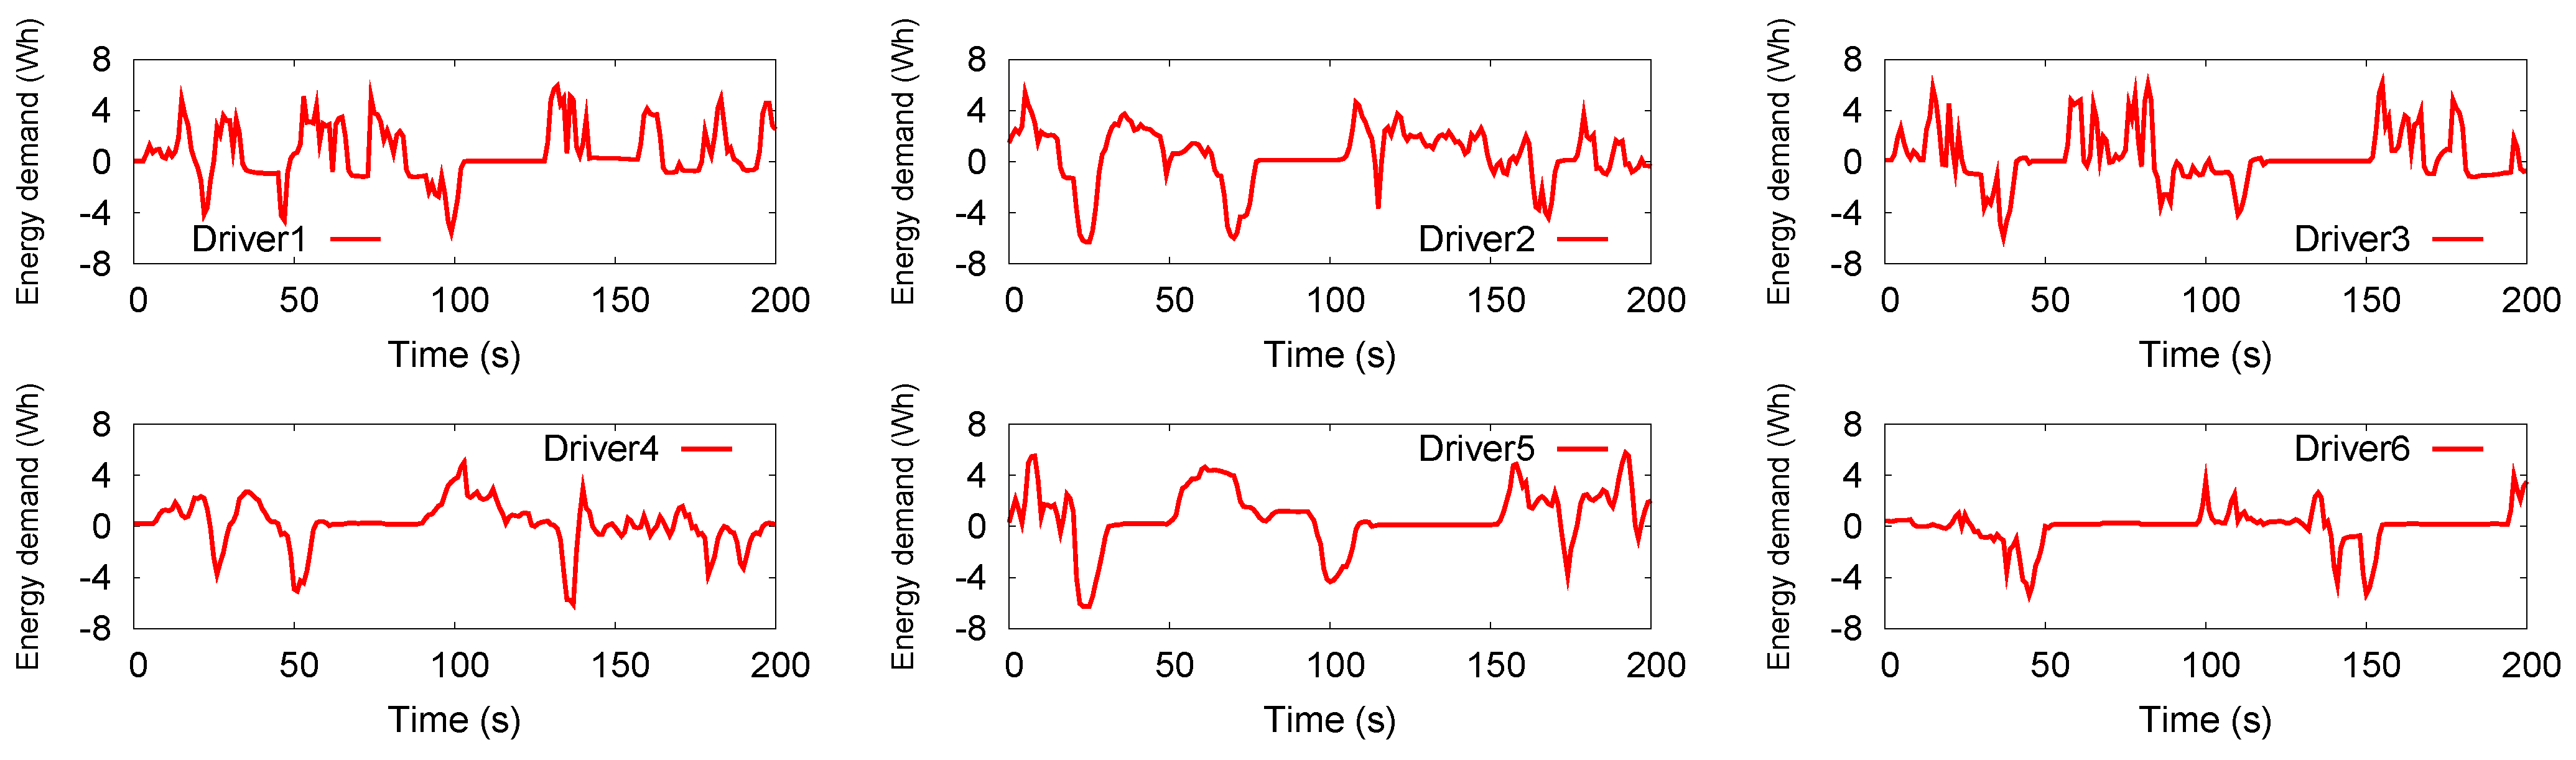
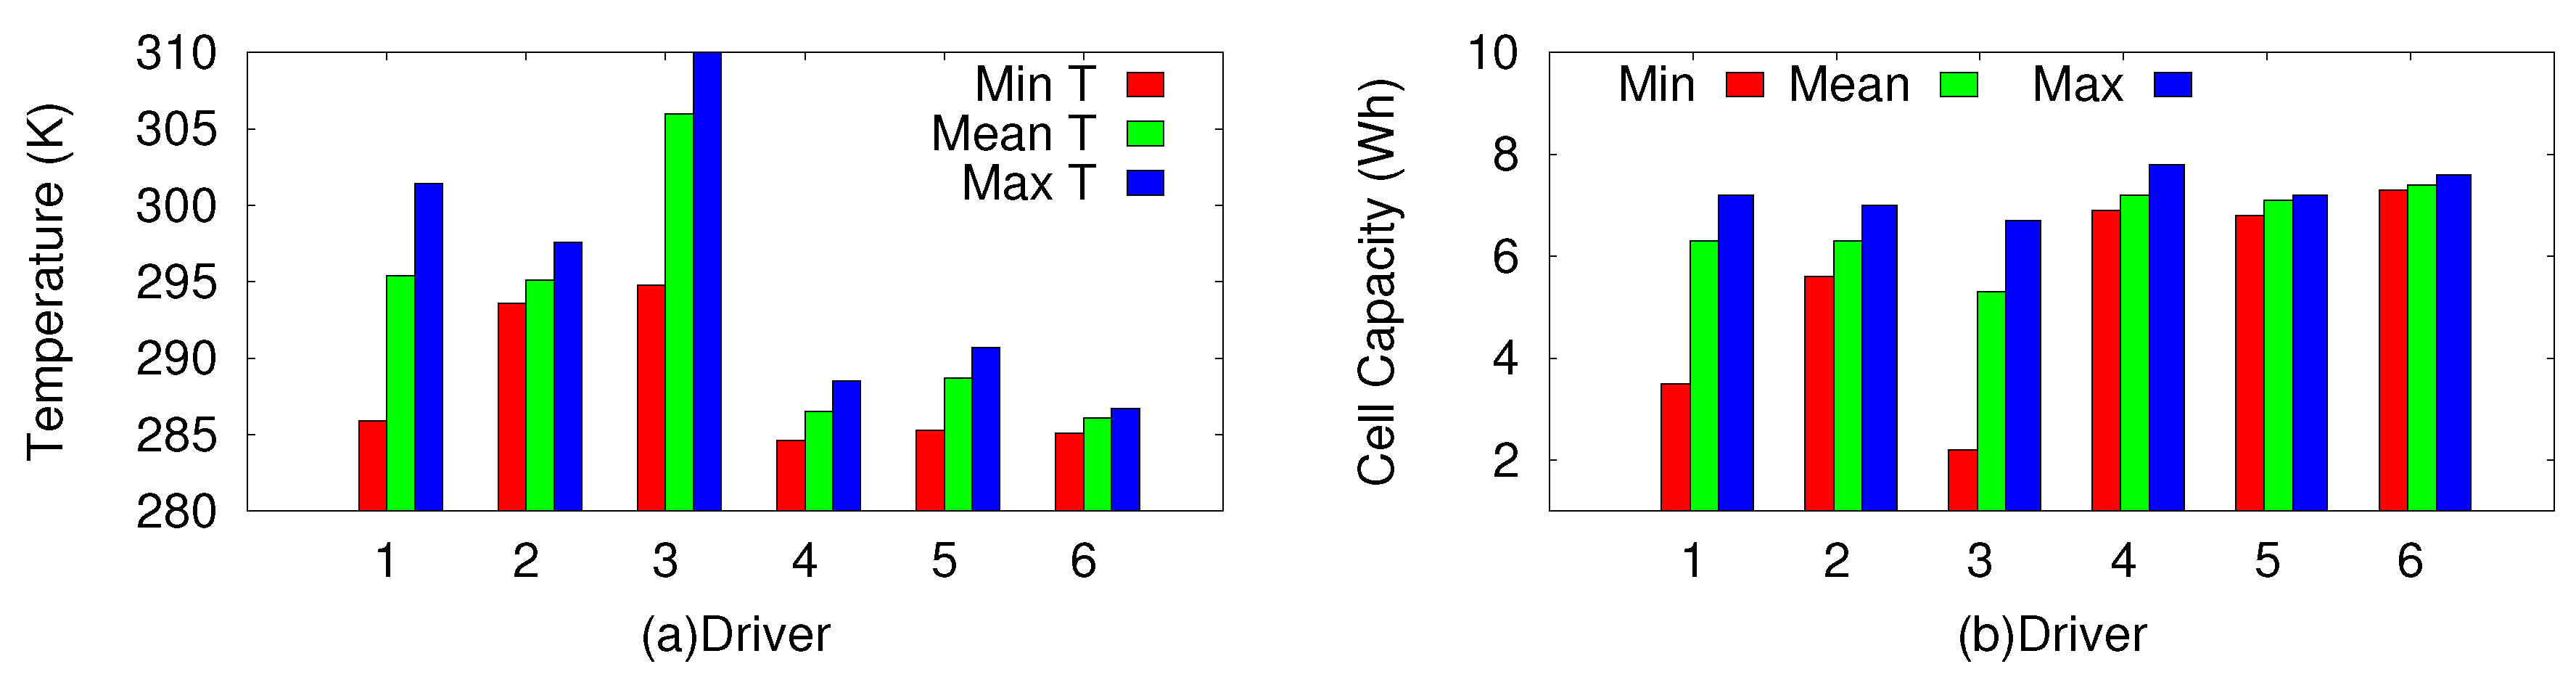
Figure 13. Speed and slope histogram comparison of different drivers.![]() Secondly, in order to analyze the battery system long-term energy usage, we assume that each user drives his/her vehicle for daily commute with the same trip under same road and traffic condition for 15 years. As shown in Figure 14, different people drive differently, thus having different energy demand. Those who drive aggressively have higher acceleration values and more acceleration changes, resulting in higher energy demand. Others who drive more smoothly with lower acceleration values and fewer acceleration changes have lower energy demand. Using the six different users’ driving profiles and the proposed large-scale battery system model (Section 3), we obtain the battery system long-term capacity degradation as shown in Figure 3. For instance, some aggressive driving patterns, such as frequent slowing down or speeding up of the vehicle, lead to battery system’s intensive charge and discharge operation. Such intensive run-time use makes significant battery self-heating, accelerates temperature-dependent life-time aging effects and capacity loss.Figure 15a illustrates the thermal distribution in a 15-year battery system for six different drivers. As we can see from this figure, different driving behaviors lead to different long-time thermal distribution in the battery system. Figure 15b demonstrates significant variation of battery system aging among the six drivers, ranging from 14.9% to 74.3%. More importantly, due to the heterogeneous thermal distribution in a battery system, the aging effects vary significantly among the individual battery cells. Strong correlation is demonstrated between user-specific driving pattern and battery system capacity. For instance, driver 3 has the most aggressive driving profile and therefore the worst battery capacity fading effect, while the best battery system performance is achieved under driver 6’s driving profile.Figure 14. Real-time energy demand of different drivers.
Secondly, in order to analyze the battery system long-term energy usage, we assume that each user drives his/her vehicle for daily commute with the same trip under same road and traffic condition for 15 years. As shown in Figure 14, different people drive differently, thus having different energy demand. Those who drive aggressively have higher acceleration values and more acceleration changes, resulting in higher energy demand. Others who drive more smoothly with lower acceleration values and fewer acceleration changes have lower energy demand. Using the six different users’ driving profiles and the proposed large-scale battery system model (Section 3), we obtain the battery system long-term capacity degradation as shown in Figure 3. For instance, some aggressive driving patterns, such as frequent slowing down or speeding up of the vehicle, lead to battery system’s intensive charge and discharge operation. Such intensive run-time use makes significant battery self-heating, accelerates temperature-dependent life-time aging effects and capacity loss.Figure 15a illustrates the thermal distribution in a 15-year battery system for six different drivers. As we can see from this figure, different driving behaviors lead to different long-time thermal distribution in the battery system. Figure 15b demonstrates significant variation of battery system aging among the six drivers, ranging from 14.9% to 74.3%. More importantly, due to the heterogeneous thermal distribution in a battery system, the aging effects vary significantly among the individual battery cells. Strong correlation is demonstrated between user-specific driving pattern and battery system capacity. For instance, driver 3 has the most aggressive driving profile and therefore the worst battery capacity fading effect, while the best battery system performance is achieved under driver 6’s driving profile.Figure 14. Real-time energy demand of different drivers.![]() Figure 15. 15-year battery system thermal and capacity distribution of different drivers.
Figure 15. 15-year battery system thermal and capacity distribution of different drivers.![]()


4.3. Energy Economy Analysis
| Component | Specifications |
|---|---|
| Powertrain | parallel hybrid |
| Axle | four-wheel drive |
| Transmission | ECVT (electronically controlled continuously variable transmission) |
| Engine | 2004 US Prius |
| Single Grear Ratio (torque coupling) | 2 |
| Final Drive Ratio | 3.8 |
| Frontal Area (m) | 2.1 |
| Drag Coefficient | 0.26 |
| Tire Rolling Resistance | 0.007 (plus speed related term) |
| Wheel Radius (m) | 0.317 |
- Charge Sustain (CS) mode. In this mode, Prius acts as a conventional HEV with charge and discharge cycles and try to sustain the SOC level. During a trip, when the driver steps on the gas pedal to cause acceleration, the battery provides necessary auxiliary power. In this case, discharge current is observed. When brakes are applied and the vehicle is decelerating or standing still, battery recharge and charge current are observed, and the current profile is determined primarily by the driving behavior.
- Charge Deplete (CD) mode. In this mode, once the vehicle is fully charged, it can be operated almost exclusively (except during hard acceleration) on electric power until its battery state of charge is depleted to a predetermined level, at which time the vehicle’s internal combustion engine or fuel component will be engaged.
- Blended mode. This is a special charge-deplete mode and usually employed by vehicles, Prius for instance. This is needed when there is not enough electric power to sustain high speed, therefore requiring the help of the internal combustion portion of the powertrain. In Prius, when the speed is less than a preset value, which is considered to be the bottom line of the vehicle speed below which the engine cannot operate steadily, the vehicle will only use electric power no matter what the driving behavior is, while the engine is idling. This is called EV mode by Toyota, which is short for Electric Vehicle mode. This mode is similar to the standard CD mode except for the condition of speed limitation. At higher speed, the internal combustion engine will be used to provide power, while electric power can continued to be used.
- Energy Economy Modeling. To compare the economic implications of purchasing a PHEV or conventional automobile, we conduct an analysis based on the following assumptions. PHEVs and conventional automobiles provide similar transportation utility and average (amortized) maintenance cost [30]. We do not consider the cost of battery replacement because the hybrid battery packs are designed to last for the lifetime of the vehicle, according to Toyota. Since Prius first went on sale in 2000, they have not replaced a single battery for wear and tear [30]. We ignore the impact of inflation, but note that inflation has a similar relative impact on the return of investment for both types of vehicles. We also assume that air pollution is proportional to both gasoline and grid-distributed electricity use, albeit with different factors. We use 12 cents per kWh [31] and $2.578 per gallon. Table 4 shows the cost breakdown of conventional and hybrid vehicles. We can then calculate the energy usage cost model for conventional vehicle and PHEV according to Equation 14 and Equation 15.where and are the energy usage cost for conventional vehicle and (P)HEV in the i-th year, respectively. is the cost of fossil fuel usage, and is the cost of electric usage.
Table 4. Cost breakdown of conventional and hybrid vehicles. Type Cost Conventional Hybrid Purchasing $17,245 $21,881 Electricity N/A 12 cents per kWh Gasoline $2.578 per gallon $2.578 per gallon - Energy Economical Analysis. For each driver in our study, we pick the most frequent trip as the driver’s representative daily trip. By feeding the trip information into PSAT, the energy consumption of six different drivers is calculated and shown in Table 5.Note that the data in Table 5 are calculated under the initial condition that the built-in battery system is brand new. As time goes by, battery system capacity decreases based on the proposed battery system model, and the proportion of fuel usage will increase accordingly. As shown in Table 5, drivers 1, 2, 3 have similar energy usage profiles, and their fuel ratios are much higher than that of others. For drivers 4, 5 and 6, although their fuel ratios differ from each other, the values are fairly low compared with the first 3 drivers. This trend is in accordance with their respective driving behaviors in these representation trips. Table 6 characterizes the driving behavior for each driver based on his/her corresponding representative trip, and the variance value represents how steadily he/she drove on this trip. Larger variance values represent more aggressive driving, and vice versa. The table shows that drivers 1, 2, 3 have greater variance of acceleration than drivers 4, 5, 6. Driver 6 drove most steadily, resulting in the smallest fuel ratio.
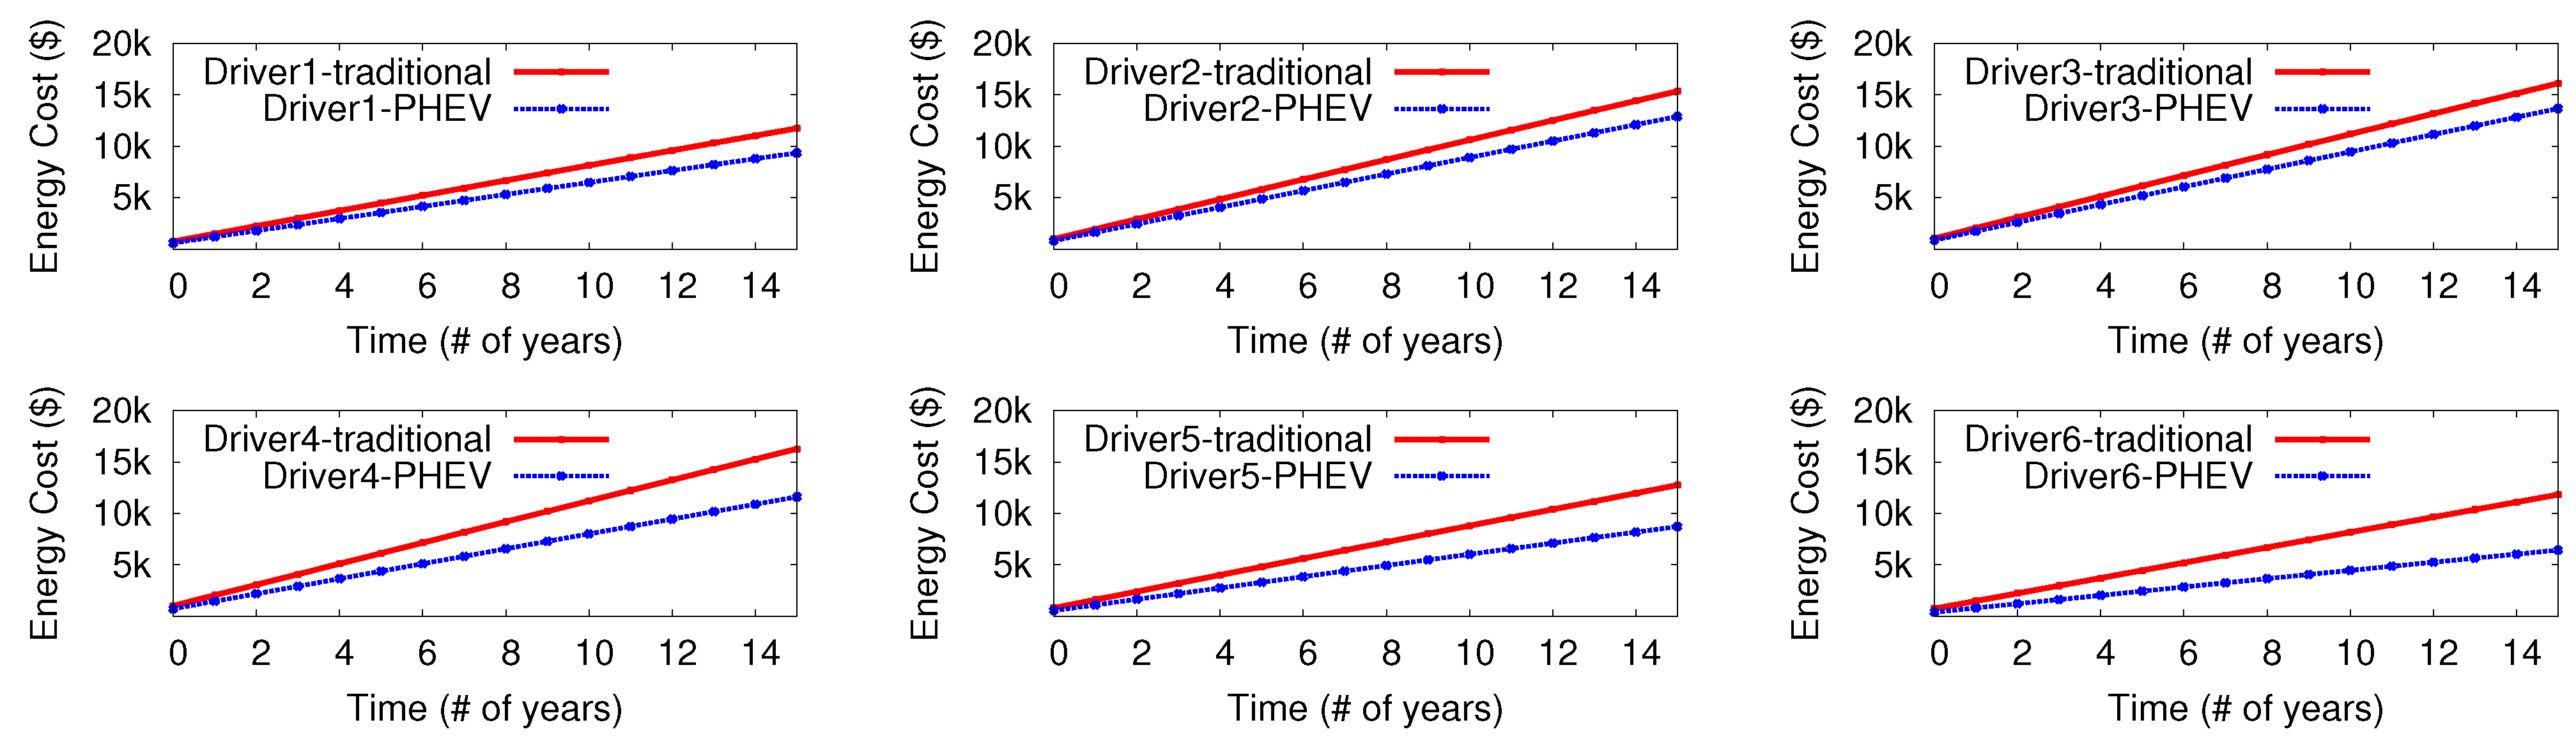
Table 5. Vehicle energy consumption breakdown of six drivers’ daily trips. Consumption Fuel(Wh) Electrical(Wh) Total(Wh) Fuel Ratio Electricity Ratio Driver 1 15,298 7298.0 22,696 80.19 19.81 Driver 2 23,155 7419.8 27,057 85.58 14.42 Driver 3 25,125 7525.2 30574.8 86.24 13.76 Driver 4 19,104 13,351 32,455 58.87 41.13 Driver 5 13,656 10,958 24,614 64.73 35.27 Driver 6 8440.3 14,085 22525.3 45.40 54.60 Using the PSAT tool and our proposed battery system model, we can compare the economic impact of purchasing a conventional or hybrid vehicle. We first calculate the 15-year energy cost for both conventional vehicle and PHEV. The overall cost saving is showed in Figure 16. As shown in the figure, the energy cost of conventional vehicle is greater than that of PHEVs, but the extent depends on the driving behavior. For instance, driver 6 has the largest cost saving, while the savings for the first three drivers are much less, This trend matches well with Table 5. Therefore, we can draw the conclusion that the more steadily a person drives, the more saving he/she is able to get.Table 6. Mean and Variance of Acceleration of Six Different Drivers. Driver 1 Driver 2 Driver 3 Fuel Driver 4 Driver 5 Driver 6 Mean 0.2901 −0.3762 −0.1462 −0.2718 −0.5153 −0.3849 Variance 0.5638 0.6085 0.7270 0.4683 0.5259 0.1699 Figure 16. Energy economy comparison between conventional vehicle and PHEV.![]()

5. Conclusions
References
- OTM. The Road Ahead. Technical report for U.S. Department of Commerce: Washington, DC, USA, 2009. [Google Scholar]
- EPRI. Environmental assessment of plug-in hybrid electric vehicles, Volume 1: Nationwide greenhouse gas emissions. Technical report for Electric Power Research Institute (EPRI): Palo Alto, CA, USA, 2007. [Google Scholar]
- Samaras, C.; Meisterling, K.R. Life cycle assessment of greenhouse gas emissions from plug-in hybrid vehicles: Implications for policy. Environ. Sci. Technol. 2008, 42, 3170–3176. [Google Scholar] [CrossRef] [PubMed]
- Wikipedia. Hybrid electric vehicle. Avialable online: http://en.wikipedia.org/wiki/Hybrid _electric _vehicle (accessed on 25 September 2010).
- Howell, D. Progress Report for Energy Storage Research and Development. Technical report for U.S. Department of Energy, Office of Vehicle Technologies: Washington, DC, USA, January 2008. [Google Scholar]
- Miller, J.M. Energy storage system technology challenges facing strong hybrid, plug-in and battery electric vehicles. In Proceedings of the 5th IEEE Vehicle Power & Propulsion Conference, Dearborn, MI, USA, 9 September 2009; pp. 4–10.
- Gonder, J.; Markel, T.; Simpson, A.; Thornton, M. Using GPS travel data to assess the real world driving energy use of plug-in hybrid electric vehicles PHEVs. In Presented at the Transportation Research Board (TRB) 86th Annual Meeting 2007, Washington, DC, USA, 21–25 January 2007.
- Adornato, B.; Patil, R.; Filipi, Z.; Baraket, Z.; Gordon, T. Characterizing naturalistic driving patterns for Plug-in Hybrid Electric Vehicle analysis. In Proceedings of the IEEE Vehicle Power and Propulsion Conference, Dearborn, MI, USA, 7–10 Septemper 2009; pp. 655–660.
- Rakhmatov, D.; Vrudhula, S.; Wallach, D. Battery Lifetime Prediction for Energy-Aware Computing. In Proceedings of the 2002 International Symposium on Low Power Electronics and Design, Monterey, CA, USA, 12–14 August 2002; pp. 154–159.
- Rakhmatov, D.; Vrudhula, S.; Wallach, D. Model for Battery Lifetime Analysis for Organizing Applications on a Pocket Computer. IEEE Trans. Very Large Scale Integr. Syst. I 2003, 11, 1019–1030. [Google Scholar] [CrossRef]
- Peled, E.; Golodnitsky, D.; Ardel, G.; Eshkenazy, V. The sei model–application to lithium-polymer electrolyte batteries. Electrochim. Acta 1995, 40, 2197–2204. [Google Scholar] [CrossRef]
- Rong, P.; Pedram, M. An Analytical Model for Predicting the Remaining Battery Capacity of Lithium-Ion Batteries. IEEE Trans. Very Large Scale Integr. Syst. I 2006, 14, 441–451. [Google Scholar] [CrossRef]
- Ali Emadi, Y.J.L.; Rajashekara, K. Power Electronics and Motor Drives in Electric, Hybrid Electric, and Plug-In Hybrid Electric Vehicles. IEEE Trans. Ind. Electron. 2008, 55, 2237–2245. [Google Scholar] [CrossRef]
- Johnson, V.H. Battery performance models in ADVISOR. J. Power Sources 2002, 110, 321–329. [Google Scholar] [CrossRef]
- Nelson; Amine, K. Advanced Lithium-Ion Batteries for Plug-in Hybrid-Electric Vehicles. In Proceedings of the 23rd International Electric Vehicle Symposium, Anaheim, CA, USA, 2 December 2007.
- Dubarry, M.; Vuillaume, N.; Yann, B. From single cell model to battery pack simulation for Li-ion batteries. J. Power Sources 2009, 186, 500–507. [Google Scholar] [CrossRef]
- Sierra Research Inc. Development of Speed Correction Cycles. Technical report for US EPA Assessment and Modeling Division, National Vehicle Fuel and Emissions Laboratory: Ann Arbor, MI, USA, 1997. [Google Scholar]
- Lin, J.; Niemeier, D.A. Regional driving characteristics, regional driving cycles. Transp. Res. Part D Transport Environ. 2003, 8, 361–381. [Google Scholar] [CrossRef]
- Hull, B.; Bychkovsky, V.; Zhang, Y.; Chen, K.; Goraczko, M.; Miu, A.; Shih, E.; Balakrishnan, H.; Madden, S. CarTel: a distributed mobile sensor computing system. In Proceedings of the 4th International Conference on Embedded Networked Sensor Systems, Boulder, CO, USA, 2006; pp. 125–138.
- Markel, T.; Simpson, A. Cost-Benefit Analysis of Plug-in Hybrid Electric Vehicle Technology. In Proceedings of the 22nd International Electric Vehicle Symposium, Yokohama, Japan, 25–28 October 2006.
- Vetter, J.; Novak, P.; Wagner, M.R.; Veit, C.; Moller, K.C.; Besenhard, J.O.; Winter, M.; Wohlfahrt-Mehrens, M.; Vogler, C. Ageing mechanisms in lithium-ion batteries. J. Power Sources 2005, 147, 269–281. [Google Scholar] [CrossRef]
- Laidler, K.J. The World of Physical Chemistry; Oxford University Press: New York, NY, USA, 1995. [Google Scholar]
- Li, K.; Wu, J.; Jiang, Y.; Hassan, Z.; Lv, Q.; Shang, L.; Maksimovic, D. Large-Scale Battery System Modeling and Analysis for Emerging Electric-Drive Vehicles. In Proceedings of the ACM Proceedings of the 2010 International Symposium on Low Power Electronics and Design, Austin, TX, USA, 18–20 August 2010.
- Ismail; Yehea, I. Efficient model order reduction via multi-node moment matching. In Proceedings of International Conference on Computer Aided Design, San Jose, CA, USA, 10–14 November 1996. [Green Version]
- Ramadass, P.; Haran, B.; White, R.; Popov, B.N. Capacity fade of Sony 18650 cells cycled at elevated temperatures: Part I. Cycling performance. J. Power Sources 2002, 112, 606–613. [Google Scholar] [CrossRef]
- Survivor’s Guide to the Fuel Crisis. Avialable online: http://www.3sixty.transcore.com/fuelincentives (accessed on 25 September 2010).
- Duvall, M. Comparing the Benefits and Impacts of Hybrid Electric Vehicle Options. Technical report for Electric Power Research Institute EPRI: Palo Alto, CA, USA, July 2001. [Google Scholar]
- Plotkin, S.; Santini, D.; Vyas, A.; Anderson, J.; Wang, M.; Bharathan, D.; He, J. Hybrid Electric Vehicle Technology Assessment: Methodology, Analytical Issues, and Interim Results. Technical report for Argonne National Lab: Chicago, IL, USA, 2001. [Google Scholar]
- EEtrex. PHEV Background Information. Avialable online: http://www.eetrex.com/plugin/ (accessed on 20 October 2010).
- How often do hybrid batteries need replacing. Avialable online: http://www.hybridcars.com/cars.html#maintain (accessed on 25 September 2010).
- How much electricity costs. Avialable online: http://michaelbluejay.com/electricity/cost.html (accessed on 20 October 2010).
© 2011 by the authors; licensee MDPI, Basel, Switzerland. This article is an open access article distributed under the terms and conditions of the Creative Commons Attribution license (http://creativecommons.org/licenses/by/3.0/).
Share and Cite
Wu, J.; Li, K.; Jiang, Y.; Lv, Q.; Shang, L.; Sun, Y. Large-Scale Battery System Development and User-Specific Driving Behavior Analysis for Emerging Electric-Drive Vehicles. Energies 2011, 4, 758-779. https://doi.org/10.3390/en4050758
Wu J, Li K, Jiang Y, Lv Q, Shang L, Sun Y. Large-Scale Battery System Development and User-Specific Driving Behavior Analysis for Emerging Electric-Drive Vehicles. Energies. 2011; 4(5):758-779. https://doi.org/10.3390/en4050758
Chicago/Turabian StyleWu, Jie, Kun Li, Yifei Jiang, Qin Lv, Li Shang, and Yihe Sun. 2011. "Large-Scale Battery System Development and User-Specific Driving Behavior Analysis for Emerging Electric-Drive Vehicles" Energies 4, no. 5: 758-779. https://doi.org/10.3390/en4050758
APA StyleWu, J., Li, K., Jiang, Y., Lv, Q., Shang, L., & Sun, Y. (2011). Large-Scale Battery System Development and User-Specific Driving Behavior Analysis for Emerging Electric-Drive Vehicles. Energies, 4(5), 758-779. https://doi.org/10.3390/en4050758