Abstract
This study critically examines the sectoral dynamics of renewable energy (RE) adoption across the EU-27 from 1990 to 2023, addressing the persistent gap between electricity generation and end-use sectors. Utilizing Eurostat energy balance data, the research employs a robust multi-methodological framework. We apply the Logarithmic Mean Divisia Index (LMDI) decomposition to isolate driving factors, and the Self-Organizing Maps (SOM) of Kohonen to cluster countries with similar transition structures. Furthermore, the Method of Moments Quantile Regression (MMQR) is used to estimate heterogeneous drivers across the distribution of RE shares. The empirical findings reveal a sharp dichotomy: while the share of renewables in the electricity generation mix (RES-E-Renewable Energy Share in Electricity) reached approximately 53.8% in leading member states, the aggregated share in the transport sector (RES-T) remains significantly lower at 9.1%. This distinction highlights that while power generation is decarbonizing rapidly, end-use electrification lags behind. The MMQR analysis indicates that economic growth drives renewable adoption more effectively in countries with already high renewable shares (upper quantiles) due to established market mechanisms and grid flexibility. Conversely, in lower-quantile countries, regulatory stability and direct infrastructure investment prove more critical than market-based incentives, highlighting the need for differentiated policy instruments. While EU policy milestones (RED I–III-) align with progress in power generation, they have failed to accelerate transitions in lagging sectors. This study concludes that achieving climate neutrality requires moving beyond aggregate targets to implement distinct, sector-specific interventions that address the unique structural barriers in transport and thermal applications.
1. Introduction
The transition to renewable energy (RE) in European Union (EU) countries has been a central focus of energy policies and sustainable development strategies over the last three decades between 1990 and 2023, EU27 countries underwent a significant transformation in energy production and consumption, with a notable shift from fossil fuels to renewable resources. This transformation is shaped by multidimensional goals, including combating climate change, ensuring energy supply security, and enhancing economic competitiveness [1,2]. As of 2023, the share of renewable energy in the EU’s gross final energy consumption reached approximately 23.0%; at the country level, Sweden and Finland exceeded 50% [3,4]. At the sectoral level, the use of renewable energy has increased at varying rates in areas such as industry, transportation, housing, and agriculture; for example, the share of renewable energy in the electricity sector increased to 53.8% in 2022 [5,6]. These developments are necessary steps towards achieving the ambitious climate and energy targets set by the EU for 2030 and 2050 [7]. However, significant inequalities and structural barriers to the transition to renewable energy continue across countries and sectors [4,6]. The economic, environmental, and social impacts of the transition to renewable energy are multi-layered. The primary outcomes of this process are reducing energy import dependency, decreasing greenhouse gas (GHG) emissions, and creating new employment opportunities [7]. This study aims to fill the existing scientific gap and provide a comprehensive assessment for policymakers and researchers by analyzing sectoral trends in renewable energy use in the EU27 countries from 1990 to 2023. The study adds scientific value by combining long-run sectoral tracking, LMDI-based driver decomposition, SOM Kohonen clustering, and MMQR-based heterogeneity assessment within a single EU-27 framework.
Recent scholarship has increasingly focused on the divergence between aggregate national targets and sector-specific implementation barriers within the EU-27 framework, specifically analyzing the disconnect between policy ambition and execution. The literature presents diverse perspectives on these dynamics. For instance, Mempel-Śnieżyk et al. [1] emphasize that renewable energy sources are fundamental to ensuring the European Union’s energy security. In parallel, Apergis et al. [8] provide empirical evidence supporting the hypothesis that renewable energy consumption drives economic growth and reduces emissions. However, sectoral disparities remain a concern. Furthermore, policy frameworks play a critical role; Goldthau and Youngs [9] highlight how the geopolitics of climate transition create uneven playing fields. Siddi and Prandin [10] add that the governance of these crises often fails to address the deepening structural differences between member states, leaving a gap in the analysis of long-term divergences between old and new EU members.
In recent years, significant progress has been made in analyzing trends in renewable energy adoption and sectoral differences across the EU27 countries. However, considerable research gaps remain in the literature. While many studies address the impact of renewable energy use on economic growth, environmental sustainability, and energy security at a general level, detailed, long-term comparisons across sectors have been largely neglected [11,12]. Cross-country differences and structural distinctions between old and new EU members have generally been examined superficially, with no in-depth analysis of the causes and consequences of these differences [13]. Furthermore, the sectoral dynamics of the renewable energy transition, particularly in the transport and agriculture industries, have been primarily assessed using aggregated data, overlooking specific sectoral trends [14,15]. Most existing studies are limited to short-term analyses, whereas holistic assessments covering a longer timeframe, such as 1990–2023, have been conducted rarely [16]. Recent research, however, has more comprehensively addressed the economic and environmental impacts of renewable energy investments, the sectoral consequences of policy differences, and the societal dimensions of the energy transition [8,17]. The fundamental problem stimulating this research is the development of more effective and targeted strategies for policymakers to achieve the EU’s climate and energy goals.
A critical gap persists in the quantitative assessment of sectoral asymmetries, particularly regarding why the rapid decarbonization of the electricity sector has not diffused with equal velocity into transport and thermal applications across the EU-27. The underlying assumption is that the transition to renewable energy varies significantly across countries and sectors, and these differences have significant consequences for economic development, energy security, and environmental sustainability [18,19]. The central hypothesis of the research is that while the increase in renewable energy use in the EU27 countries has positive effects on economic growth and GHG emission reduction, sectoral and regional inequalities limit the magnitude and sustainability of these effects [20]. Existing literature largely relies on aggregated national data, thereby neglecting the distinct structural barriers governing the transition in end-use sectors such as transport and agriculture over the 1990–2023 period. Addressing this gap will contribute to a better understanding of the multidimensional impacts of the energy transition and increase the effectiveness of energy policies [4,21]. Furthermore, factors such as financing renewable energy investments, disseminating technological innovation, and increasing social acceptance must be considered in policy design [22,23]. Consequently, the findings of this research will inform policymakers on how to strengthen the EU’s capacity to achieve its climate goals, reduce energy import dependency, and foster sustainable economic growth.
This quantitative research design is based on a comparative, long-term analysis of renewable energy use trends across EU27 countries at the sectoral level. The study examines changes in renewable energy use across key sectors, including industry, transportation, agriculture, and housing, between 1990 and 2023, alongside economic, environmental, and political indicators. The research reveals similarities and differences across countries and sectors, utilizing quantitative methods such as LMDI decomposition analysis, time series analysis, and cluster analysis [19]. This study will contribute to a deeper understanding of the dynamics of the renewable energy transition by providing long-term comparative analyses at both sectoral and country levels, which are currently lacking in the literature [24,25]. Furthermore, a detailed assessment of structural differences and policy impacts among EU members enables the development of specific recommendations for policymakers [5,8]. The analyses evaluated the effects of renewable energy use on economic growth, GHG emissions, and energy imports.
2. Literature Review
2.1. Policy Framework and Historical Context
RE refers to energy derived from sources that can continuously renew in nature; solar, wind, hydroelectric, biomass, and geothermal energy are prominent among these sources. In the EU energy policies, the concept of renewable energy has been integrated with the goals of environmental sustainability, energy security, and economic growth as an alternative to fossil fuels [26,27]. Since the 1990s, EU countries’ transition to renewable energy has gained momentum through international regulations such as the Kyoto Protocol and the Paris Agreement. In the 2000s, the EU’s climate and energy packages established a legal framework. Today, renewable energy is not limited to electricity generation but is widespread in the industrial, transportation, and residential sectors. On a sectoral basis, the use of renewable energy in industry is critical for reducing carbon emissions and energy import dependency [28,29].
Innovative technologies, such as biofuels and green hydrogen, are prominent in the transportation sector. Renewable energy can be measured by economic indicators (e.g., Gross Domestic Product (GDP), employment), environmental indicators (e.g., GHG emissions), and technological developments. Production and consumption have increased rapidly in the EU27 countries in recent years, with regional and sectoral differences [8]. Furthermore, the financial sustainability of renewable energy investments, the spread of technological innovation, their integration with energy efficiency [30], the role of social acceptance, and structural transformations in energy markets have also been decisive in the success of this transformation [31]. RE and related concepts provide a fundamental framework for understanding the EU’s role in the sustainable energy transition in this study.
RE adoption trends and sectoral analyses stand out as cornerstones of sustainable development policies in the EU. The historical development of the field began in the 1990s, influenced by environmental concerns and the Kyoto Protocol, and accelerated in the 2000s with the EU’s climate and energy packages [14,27]. Seminal studies have demonstrated the impacts of renewable energy development on economic growth, employment, and environmental sustainability. In particular, economic development, technological progress, and political participation have been shown to support the renewable energy sector [16]. Sectoral analyses have highlighted that the use of renewable energy exhibits different dynamics in areas such as industry, transportation, and housing, and that significant differences exist between countries [20,24].
Retrospective and decomposition analyses conducted in recent years have examined the temporal changes in indicators such as energy efficiency, carbon emissions, and the share of renewable energy. It has been determined that financial development and capital markets play a decisive role in the transition to green energy. At the same time, the banking sector remains vulnerable to carbon-intensive investments. In addition, studies employing artificial neural networks and multi-criteria decision-making techniques have highlighted the similarities and differences between countries and sectors [26,27]. Recent studies have made significant contributions to the literature by revealing the impact of renewable energy investments on economic growth, the role of financial development in environmental sustainability, the relationship between energy consumption and carbon emissions, and the interaction between renewable energy and financial development [32], and the dynamics of energy transition in multi-country analyses [33].
RE adoption trends within the EU27 exhibit complex, multidimensional interrelationships with key concepts such as economic growth, environmental sustainability, and energy security. These dynamics are evident across different economic sectors [34]. The positive correlation between monetary expansion and RE deployment is particularly apparent in the industry and transport sectors [5]. Simultaneous energy efficiency improvements and reductions in carbon emissions are integral components of this linkage. Sectoral analyses reveal persistently heterogeneous patterns in the pace and scale of RE integration across industry, transport, agriculture, and residential areas.
This research framework thematically interrogates these relationships through three primary lenses: economic impacts, environmental outcomes, and sectoral differences. Under economic consequences, the effects of RE consumption on GDP, employment creation, and investment flows are critically examined. The environmental outcomes dimension prioritizes indicators such as reducing GHG emissions and energy import dependency [35]. Meanwhile, sectoral differences are significantly shaped by structural differences between old and new EU member states, as well as the effectiveness of national policy implementation [25]. Hereafter, ‘old member states’ refer to the EU-15 (members before 2004), while ‘new member states’ refer to countries that acceded in 2004, 2007, or 2013. This thematic structure also encompasses critical factors such as technological advances in renewable energy production, necessary financial investments, and regional resource endowments.
2.2. Methodological Approaches in Energy Transition Studies
Recent EU renewable-energy transition studies increasingly combine (i) decomposition approaches to explain drivers, (ii) clustering/unsupervised learning to map cross-country patterns, and (iii) heterogeneity-aware panel methods. Accordingly, this review synthesizes evidence by method × sector to clarify what is known for electricity, transport, and heating/cooling. These methods provide detailed insights into similarities and differences across countries and sectors. A pioneering study in this field, Tutak and Brodny [26], analyzed RE consumption across economic sectors, identifying significant increases, particularly in the transportation sector, and noted that this impact was greater in old EU countries than in newer members. Tutak and Brodny [26] examine and demonstrate that RE consumption increases most in transport, with a larger rise in EU-15 members than in post-2004 members, suggesting an accession-related implementation gap. Here, ‘old EU members’ refers to EU-15, while ‘new members’ refers to countries acceding in 2004/2007/2013; this classification follows Eurostat’s enlargement glossary.
The determinants of RE development indicate that countries without fossil fuel resources are leading the way in this field, and economic factors, such as GDP per capita, play a significant role. A Eurostat report, published in 2025 [36], provides detailed data on sectoral and country variations in RE adoption in the EU27, highlighting the wide regional disparities. Eurostat’s ‘Renewable energy statistics’ (Statistics Explained) documents sector-specific renewable shares, including heating and cooling and electricity, and highlights cross-country dispersion in the EU. Tu et al. [37] analyze overuse and find that (e.g., policy design/market structure) shapes RE uptake, implying that implementation capacity matters as much as targets. Household-focused evidence highlights the distributional and end-use patterns of RES (Renewable Energy Sources) consumption within the EU. However, cross-sector EU-27 assessments that jointly integrate decomposition, clustering, and heterogeneity-aware panel methods remain limited [2,20]. Sectoral coverage is uneven: electricity is commonly analyzed, whereas transport and heating/cooling often receive less consistent empirical attention across the full EU-27 time span [27]. Another missing aspect is the lack of a holistic assessment of regional resource potential and the impacts of technological developments in RE production.
2.3. Theoretical Underpinnings: Growth, Environment, and Justice
The literature on RE adoption trends in the EU27 offers strengths, with important methodological and theoretical debates. Many studies highlight the positive impacts of RE use on economic growth, reducing greenhouse gas (GHG) emissions, and energy import dependency [5,11]. However, these findings vary significantly across countries and sectors; for example, RE integration is faster and more effective in old EU members, while new members face severe difficulties in achieving targets [38]. Hassan et al. [16] map EU renewable production potentials (solar, wind, hydro, hydrogen) and emphasize the role of resource and technology structure. Houtman and Reins [21] show how EU targets and regulatory design shape implementation capacity [39]. Furthermore, while industry and electricity generation are prominent in sectoral analyses, in-depth studies in transportation and agriculture have been limited [25]. Employment effects are typically discussed in energy-transition policy reports (e.g., IRENA [6]), whereas growth impacts are tested empirically in EU-focused econometric studies [40]. In the literature, further research is needed on the long-term sustainability of the RE transition, ensuring policy coherence, and enhancing sectoral integration [36,41]. McWilliams et al. [41] emphasize the need for a coherent industrial policy, particularly for clean-tech supply chains, such as those in the solar energy sector. Markard et al. [42] frame transition acceleration challenges that motivate long-run, cross-sector EU-27 assessments.
The conceptual architecture of this study is based on the theoretical frameworks of sustainable development, energy transition, and economic growth. Sustainable development theory provides a holistic perspective that integrates the environmental, financial, and social dimensions inherent in RE deployment [11,31]. This integrative approach aligns directly with the European Union’s EU) strategic goal of achieving climate neutrality by 2050. Energy transition theory explains the complex structural, technological, and political dynamics underlying the transition from fossil fuels to renewable energy sources. It explores the implications of international inequalities and sectoral cohesion pathways [43,44]. At the same time, economic growth theories explain the two-way interactions and long-term equilibrium relationships between RE (Renewable Energy) consumption and GDP (Gross Domestic Product).
Methodological pluralism characterizes the empirical testing of these theories in the existing literature, with a focus on panel data analyses, structural equation modeling, and decomposition techniques [45]. The analytical model of the study adopts a multidimensional approach to investigate the relationships between RE consumption (independent variable) and key dependent variables (economic growth, carbon emissions, energy efficiency, and sectoral adaptation). Moreover, mediating variables, including financial development, governance quality, and technological progress, are included in the framework [46]. This solid theoretical foundation facilitates the empirical examination of linear and nonlinear variable linkages, enables meaningful cross-country and cross-sectoral comparative analyses, and supports the formulation of evidence-based policy recommendations that inform the derivation.
This study is grounded in sustainability transitions and energy transition perspectives, which explain how policies, technologies, and institutions shape decarbonization pathways across countries and sectors [47,48,49,50]. The empirical focus is on sectoral renewable energy shares in the EU-27 (electricity, transport, and heating/cooling), treated as outcomes that vary with structural conditions and policy implementation [3,51]. Building on EU evidence on determinants and sectoral uptake, the framework expects persistent gaps in end-use sectors and cross-country dispersion even under common EU targets [37,52]. Accordingly, the study combines driver decomposition (LMDI) to attribute changes to underlying components and SOM Kohonen-based clustering to identify groups of countries with similar transition profiles [2]. Heterogeneity in sectoral outcomes is assessed using panel models, complemented by quantile-based evidence (MMQR) to avoid relying only on average effects when differences across the distribution are expected [42,44,53].
3. Materials and Methods
3.1. Research Design
This study analyzes sectoral trends in RE use in the EU27 countries from 1990 to 2023. For this purpose, industry, transportation, housing, services, and agriculture sectors were examined separately using up-to-date data obtained from Eurostat’s SHARES (Renewable Energy Statistics) and nrg_bal (Energy Balance) databases [3]. Additionally, domain-specific indicators are analyzed separately for electricity generation (RES-E), transport (RES-T, specifically Renewable Energy Share in Transport), and heating/cooling (RES-H&C, specifically Renewable Energy Share in Heating and Cooling) [3]. Time series interpolation was applied to a limited extent for data deficiencies. Since energy transition is affected by economic, structural and technological factors, these factors were determined in our study by a multidimensional evaluation by conducting LMDI decomposition, panel regression, and Kohonen neural network analyses [19,50].
3.2. Data Sources
In this study, Eurostat’s SHARES and nrg_bal_c (Energy Balance) were used as the primary data sources. Provisional data for 2023 were also included in the survey to ensure the analyses were up to date [3]. (2023 flagged as provisional; robustness checks exclude 2023). Sectors were disaggregated, and the data examined included RE use in industry, transportation, housing, agriculture/forestry/fisheries, and services. Separate sub-indicators were evaluated for electricity generation, heating/cooling, and transportation. The data sets were taken directly from the Eurostat SHARES Tool and nrg_bal_c databases. Limited missing annual observations were completed using linear interpolation; no extrapolation beyond observed bounds was performed.
3.3. Variables and Indicators
The primary dependent variables used in the study are the share of RE in total final energy consumption (%), the share of RE in electricity generation (%), the RES-T ratio in transportation, and the RES-H&C ratio in heating/cooling. These four indicators constitute the primary outcomes used in the descriptive tables and the panel models. Energy consumption was categorized by sector, including industry, housing, transportation, agriculture, and services. Sectoral categories (industry, housing, services, agriculture) are used for disaggregation, whereas RES-E/RES-T/RES-H&C are domain indicators reported by Eurostat. Independent variables include macro indicators such as GDP per capita (in Euros), total population (in thousands of people), energy technology investments (in MW capacity increase), and the year of policy implementation. Driver-focused decomposition evidence indicates that changes in RES share and energy efficiency/energy intensity can be dominant contributors to renewable expansion and emissions outcomes in EU settings. [3]. In addition, a distinction was made according to renewable resource types (solar, wind, biomass, etc.) using Eurostat series (1990–2023, where available). The indicators were evaluated in absolute values (kToe, GWh) and ratios [3,4]. All ratios are computed from harmonized Eurostat definitions; unit conversions (ktoe ↔ GWh) follow Eurostat/IEA standard factors and are reported in the replication notes. Descriptive statistics are reported for all primary outcomes (RE share in final consumption, RE share in electricity generation, RES-T, RES-H&C), not for a single variable. Table 1 summarizes the research variables, units, data sources, and definitions used in the empirical analysis.

Table 1.
Summary of Research Variables and Data Sources. Source: Based on [3,4].
3.4. Analysis Techniques
Multi-layered quantitative analysis techniques were used in the study. Descriptive statistics were used for preliminary data screening (outliers, missingness, distributional patterns) before model-based analyses. Countries were clustered using Kohonen Self-Organizing Maps (SOM) with a hexagonal lattice architecture to preserve topological properties. The network was trained using the batch algorithm with a Gaussian neighborhood function, and the optimal number of clusters (k = 3) was validated using the Davies-Bouldin index to ensure reproducibility. The primary outcome variables are (i) share of RE in total final energy consumption, (ii) share of RE in electricity generation, (iii) RES-T, and (iv) RES-H&C [3,4]. The LMDI (Logarithmic Mean Divisia Index) and IDA methods were employed to isolate the driving factors of RE growth. Fixed and random effects models were applied to the panel data set, and model fit was tested with the Hausman test. Standard errors are corrected for serial correlation and heteroskedasticity using country-clustered robust errors (and/or Driscoll–Kraay, if cross-sectional dependence is a concern. Economic and structural determinants of dependent variables were examined with multiple regression and correlation analyses [18,19]. Bivariate correlations are reported descriptively, while inferential relationships are estimated using the panel regression framework. The methodological workflow and the classification of dependent and independent variables are illustrated in Figure 1, following the Eurostat SHARES framework.
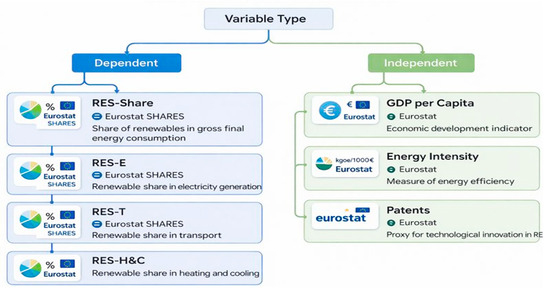
Figure 1.
Flowchart of the methodological framework and analytical steps. Source: Based on [3,4].
4. Results
4.1. Descriptive Statistics
Table 2 presents the basic descriptive statistics of the primary outcome variables from 1990 to 2023 (RE share in total final energy consumption, RE share in electricity generation, RES-T, and RES-H&C). Mean, median, minimum, maximum, and standard deviation values are shown as percentages to summarize the distribution characteristics of the variable. Descriptive statistics were used for data screening (outliers, missingness, early patterns), while time-series trends were evaluated through trend plots and growth-rate comparisons.
Table 2.
Descriptive Statistics of Renewable Energy Share in Total Final Energy Consumption (EU-27 aggregate), 1990–2023.
Table 2 shows the distribution characteristics of a percentage variable for the period 1990–2023. While the average value is 10.42%, indicating that the general level is at this level, the median value is 8.75%, suggesting that the distribution may be skewed to the right. The minimum value is 5.34% and the maximum is 23.05%, indicating severe fluctuations throughout the period. The standard deviation is 4.85%, indicating moderate variability in the data. Figure 2 shows the annual change in the share of RE in total energy consumption between 1990 and 2023. The rates expressed in percentages are presented in a structure that exhibits an increasing trend over the years.
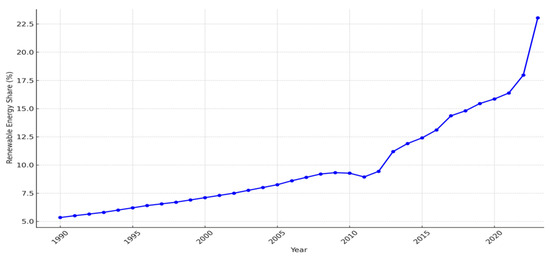
Figure 2.
Renewable Energy Share (1990–2023).
Figure 2 shows the annual share of RE in total energy consumption from 1990 to 2023 in the EU.
The analysis findings show that the share of RE, which was 5.4% in 1990 and 9.32% in 2004, reached 23.05% by 2023. This indicates a steady and significant growth in the transition to RE in the EU27 countries over the last two decades. The average value was 14.62%, and the median was 14.85%. Fluctuations are particularly notable in 2011 (10.81%) and 2020 (19.11%). The increase in 2023 reflects the impact of the Green Deal and RED II policies. The standard deviation of 4.32% indicates that the interannual variation remains reasonable.
During 1990–2023, the share of RE in total final energy consumption in the EU27 countries increased from 5.34% to 23.05%. This process was shaped by different dynamics in three main periods:
First Period: Slow Start (1990–2003): During this period, annual growth was limited, with the share of RE reaching from approximately 5.34% to 8.25%. On average, only a ~0.2 percentage point increase was observed annually. This can be attributed to the lack of a strong policy framework at the European level and the early stage of technological developments.
Second Period: Policy-Based Acceleration (2004–2013): The share of RE, which was 9.32% in 2004, increased to exceed 12.4% by 2013. This increase accelerated with the EU’s establishment of the institutional framework through Directives 2001/77/EC and 2009/28/EC. The Green Economy agenda gained particular influence following the 2008 financial crisis. Annual increases exceeded one percentage point for the first time during this period.
Third Period: Rapid Expansion and Transformation (2014–2023): The increase accelerated during this period, with the share of RE reaching 23.05% in 2023, up from 14.36% in 2014. This growth was particularly fueled by RED II (2018/2001/EU) [54], the European Green Deal, and concerns over energy supply security in the post-2019 period. The average annual increase exceeded approximately one percentage point during this period.
The 10.81% decline in 2011 and the jump to 19.11% in 2020 are noteworthy. The former reflects the investment stagnation following the global financial crisis, while the latter reflects the RE incentives introduced with the post-COVID-19 recovery packages. 2023 saw the highest level to date, at 23.05%, and strong momentum continues towards the EU’s 2030 target of 42.5%.
Table 3 presents the periodic averages of RE use in EU countries for the period 1990–2023, along with the rates of change compared to the previous period. For 2020–2023, the reported value is the arithmetic mean of annual shares over the period. These indicators provide a comparative overview of the temporal distribution of policy impacts and the level of structural transformation.
Table 3.
Period-averaged Renewable Energy Share with Inter-period Change.
The most considerable inter-period change is observed between 2020 and 2023 (computed from period averages), coinciding with an intensified policy focus and post-pandemic investment dynamics.
Table 3 indicates a significant acceleration in the EU’s transition to RE, particularly after 2005. Between 1990 and 2004, annual increases were limited, ranging from 0.6% to 0.8% per year. This slow progress is associated with the inadequacy of policy instruments. However, the 2.85% increase between 2005 and 2009 demonstrates the impact of policy initiatives within the RED I framework. On the other hand, the mere 1.47% increase between 2015 and 2019 demonstrates stagnation in policy implementation and sectoral imbalances.
4.2. Sectoral Renewable Energy Shares (RES-E, RES-T, RES-H&C)
This subsection reports sector/domain-specific renewable energy indicators, namely RES-E (electricity generation), RES-T (transport), and RES-H&C (heating/cooling), to identify persistent gaps across end-use sectors. Table 4 presents the average RE utilization rates for the seven main sectors in the EU between 1990 and 2023. Periodically grouped data allows comparative analysis of trends at the sectoral level over time.
Table 4.
Time Series Based Sectoral Trend.
Table 4 clearly shows that the electricity sector has the highest share of RE throughout the period. The share, which was 17% from 1990 to 1994, reached 18.40% from 2020 to 2023. In contrast, the transportation sector has remained relatively low; the rate, 11.20% in 1990–1994, increased to 13% in 2020–2023. The increase in the residential sector has been more stable, with a limited but steady increase from 17.6% to 18.6%. The agriculture, forestry, and fisheries (AFF) sector also generally exhibits a stable outlook. On the other hand, the industrial sector has followed a horizontal course with minor fluctuations after the peak in 2005–2009.
4.3. Cross-Country Dispersion in Renewable Energy Shares (EU-27)
This subsection visualizes cross-country dispersion in renewable energy shares, highlighting countries that exceed 50% and persistent gaps across the EU-27. Figure 3 shows the share of RE sources in the final energy consumption of EU countries as of 2023. Countries are listed in descending order from left to right, each represented by a different color. Indicator, share of renewables in gross final energy consumption (%), 2023 (provisional). Source: Eurostat SHARES. The graph of Figure 1 was created using Python code. The different colors represent different countries.
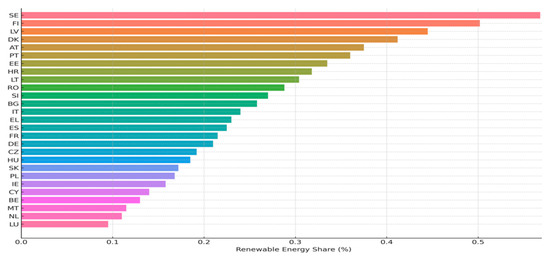
Figure 3.
The share of RE sources in the final energy consumption of EU countries as of 2023. Source: Authors’ own study, based on Eurostat SHARES.
In 2023 (provisional), Sweden exceeded 50% in gross final energy consumption, confirming the ‘>50%’ leader group discussed in the Introduction. Figure 2 demonstrates the regional differences in RE use across the EU. Sweden (over 56%) leads the pack in RE use. It is followed by Scandinavian and Baltic countries such as Finland, Latvia, and Denmark. Strong public policies, abundant natural resources, and technological infrastructure can explain these high rates. Central European countries (e.g., Germany, the Czech Republic, and Hungary) performed moderately, while Southern European countries generally performed less well. Countries with small, fossil-fuel-heavy energy infrastructures, such as Malta, the Netherlands, and Luxembourg, are at the bottom of the list. These regional differences demonstrate that infrastructure, investment, and policy differences play a significant role in the transition to RE.
Table 5 presents the three basic assumption tests used in panel data analysis—autocorrelation, heteroskedasticity, and model selection (Hausman test). The type of test, applied method, test statistic, p-value, and interpretation of each test are systematically presented.
Table 5.
Panel Data Diagnostic Tests.
The Wooldridge test indicates first-order autocorrelation (p = 0.0017), so standard errors are reported using country-clustered (or Driscoll–Kraay) corrections. The Modified Wald test indicates groupwise heteroskedasticity (p < 0.001), supporting robust inference. The Hausman test favors Fixed Effects over Random Effects (p < 0.001), so all baseline models are estimated with FE.
4.4. Panel Data Analysis: Fixed Effects Model (1990–2023)
Table 6 presents the fixed effects panel regression analysis of the factors affecting the share of RE in the electricity sector for 1990–2023. The effects of country constants and sectoral variables are presented, along with their coefficients, standard errors, and significance levels.
Table 6.
Fixed Effects Panel Regression Results (Electricity Sector, 1990–2023).
Table 6 employs a fixed-effects model to explain the factors that determine the share of RE in the electricity sector. The model’s high R-squared (0.946) and adjusted R-squared (0.943) values indicate its high explanatory power. Among the significant sectors, industry (1.334), heating (1.4385), and transportation (0.5337) have positive and statistically significant effects. In contrast, the residential (−0.6855) and services (−0.9946) sectors exhibit negative coefficients, which likely reflects the ‘rebound effect’ where energy efficiency gains are offset by increased consumption, or a slower rate of electrification compared to the rapid capacity expansion in the power sector. This suggests that structural rigidities in building stock turnover are hindering the relative growth of renewable shares in these sectors. This indicates that industry and heating integrate RE more, while agriculture and services lag in integration. Country fixed effects are controlled for; coefficients are not displayed for brevity. The AIC (Akaike Information Criterion) value of the model, 86.10, supports the model’s suitability. The findings highlight the importance of sector-specific energy policies.
4.5. Cluster Analysis
Figure 4 illustrates the cluster analysis of EU27 countries based on their average RE share from 1990 to 2023. Each country is grouped into one of three clusters, highlighting the differences in long-term RE adoption intensity across the EU. The names of the countries of Figure 4 is presented in alphabetical list, as follows: Austria (AT), Belgium (BE), Bulgaria (BG), Croatia (HR), Cyprus (CY), Czechia (CZ), Denmark (DK), Estonia (EE), Finland (FI), France (FR), Germany (DE), Greece (EL), Hungary (HU), Ireland (IE), Italy (IT), Latvia (LV), Lithuania (LT), Luxembourg (LU), Malta (MT), Netherlands (NL), Poland (PL), Portugal (PT), Romania (RO), Slovakia (SK), Slovenia (SI), Spain (ES), Sweden (SE).
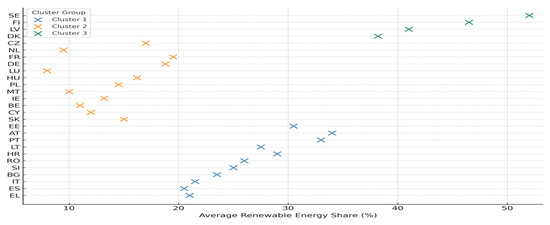
Figure 4.
Cluster Analysis of EU27 Countries by Renewable Energy Share (1990–2023).
Method: SOM-based clustering (self-organizing maps). SOM represent artificial neural network (ANN) forms that support unsupervised learning, by facilitating the reduction in data dimensionality and simultaneously retain their topological structure. In such a way they shape a credible tool for clustering and data exploration. By incorporating a neighborhood function to preserve the spatial relationships of the data, they can transform complex data into human-perceived and readable representations.
Unlike traditional neural networks, self-organizing maps function via competitive learning as opposed to error correction. Inputs: country-level averages of {RES-E, RES-T, RES-H&C, total RE share}; distance: Euclidean; k = 3.
Clusters 1, 2, and 3 represent groups of countries with similar sectoral renewable energy profiles (electricity, transport, and heating/cooling). Cluster analysis reveals three distinct groups of countries based on their RE performance from 1990 to 2023. Cluster 3: End-use laggards (transport & H&C), which includes Sweden, Finland, and Latvia, is the leader with the highest RE shares, averaging over 40%. These values indicate that these countries are shifting towards early and sustainable investments in hydropower and bioenergy. Cluster 1: Electricity-led adopters include mid-performing countries such as Portugal, Austria, and Estonia, whose RE shares typically range between 25% and 35%. These countries are experiencing stable growth, but may still depend on fossil fuels for specific sectors. Cluster 2: Balanced transition group includes countries such as Malta, Luxembourg, and the Netherlands, which have consistently low RE shares, typically below 15%. Their lagging performance reflects obstacles such as policy inertia, high urban density, or a lack of natural renewable resources.
4.6. Decomposition Analysis
Table 7 presents the sectors’ contributions to the change in RE share from 1990 to 2023, expressed in percentage points. While the electricity and heating sectors contributed positively, some sectors, such as agriculture and housing, had a negative impact.
Table 7.
Sectoral contribution to the change in RE share from 1990 to 2023.
According to the decomposition analysis, the electricity sector contributed the most to the increase in RE, accounting for 7.6 percentage points. This suggests that the energy transition is primarily focused on electricity generation. Although the heating sector contributed 4.1 percentage points to the transition, its decarbonization is constrained mainly by the slow renovation rates of the EU’s building stock and the reliance on legacy gas infrastructure. Recent policy pushes for heat pump adoption under the ‘Renovation Wave’ strategy are beginning to address these barriers, but infrastructure lock-in remains a primary obstacle. The transportation sector made a minor but significant contribution of 2.5 percentage points. In contrast, services (−1.5 percentage points), housing (−1.8 percentage points), and especially agriculture (−2.1 percentage points) made a negative contribution to the transformation process, meaning the share of RE in these sectors decreased. These results highlight the unevenness of sectoral transformation and the need for policymakers to focus on supportive strategies in industries with lower contributions (mainly agriculture and housing).
Figure 5 illustrates the decomposition of changes in renewable electricity shares across the EU27 countries from 1990 to 2023. The contributions are split into two components: technology (e.g., improvements in biofuel conversion efficiency) and structure and efficiency (e.g., changes in sectoral composition and energy use intensity), providing comparative insights into national transition dynamics.
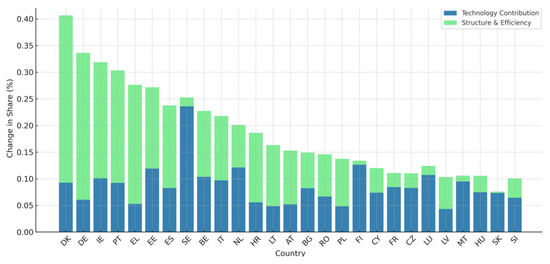
Figure 5.
The decomposition of changes in renewable electricity shares across the EU27 countries between 1990 and 2023. The full names of countries are also mentioned in alignment with the country codes of Figure 4, accordingly.
Figure 5 reveals the dynamics driving the increase in renewable electricity production between 1990 and 2023, country by country. While Denmark, Germany, Portugal, and Ireland stand out in overall growth, a significant portion of this increase is attributed to structural transformation and efficiency gains. This demonstrates the restructuring of energy systems and the reduction in energy intensity in these countries. On the other hand, technological contribution—that is, biofuel conversion efficiency or the impact of innovative technologies—is prominent in countries such as Sweden, Belgium, Italy, and Estonia. Technical progress is the primary driver of the energy transition in these countries. In some countries (e.g., Bulgaria, Romania, Slovakia), contribution rates remain relatively low, suggesting that RED policies have had a limited impact.
4.7. Policy and Cohesion Analysis (1990–2023)
Between 1990 and 2023, the EU transitioned from a dispersed system of national policies to a centralized, target-oriented energy system. Table 8 lists the significant RE policies and legal regulations implemented by the EU between 2001 and 2023. Each policy is summarized according to its purpose and function, and its strategic development path is illustrated.
Table 8.
Chronological Policy Evolution Table.
Table 8 chronologically reflects the evolution of the EU’s RE policies. The first directive (2001/77/EC) of 2001 established only guiding targets, while RED I in 2009 ensured binding power and implemented monitoring systems. In 2018, RED II deepened sustainability criteria with binding targets of 32% by 2030. Regulation 2018/1999, which entered into force the same year, strengthened governance with NECPs (National Energy and Climate Plans) and reporting obligations. The European Green Deal, introduced in 2019, consolidated energy and climate targets. The Fit for 55 packages in 2021 strengthened RED II with a 42.5% renewable target. Finally, the RED III revision 2023 clarified contribution obligations by introducing more ambitious targets and stringent sustainability standards. Over the period from 1990 to 2023, the EU has transitioned from a scattered system of national policies to a centralized, targeted energy system. Table 9 summarizes the primary mechanisms used to harmonize the EU’s RE policies and the role each plays in ensuring policy standardization, transparency, and implementation support across member states.
Table 9.
Policy Harmonization Framework Table.
Table 9 presents four key mechanisms that play a key role in harmonizing energy policies within the EU. The National Energy and Climate Plans (NECPs) have increased comparability and transparency by providing all EU countries with a standard planning and reporting structure. The cross-border electricity market integration has facilitated energy integration by harmonizing market signals to promote renewable investments. EU funds (e.g., Horizon and Recovery Funds) have helped eliminate financial inequalities, especially in countries with limited implementation capacity. The MRV system (Monitoring, Reporting, Verification) has enabled the monitoring and evaluation of policy implementation by providing a comparative and transparent assessment of member states’ performance.
4.8. Level of Harmonization and Country Differences
Even though policies are determined at the EU level, there are significant asymmetries at the implementation level:
- High-Performing Countries: Countries like Sweden, Finland, and Denmark have exceeded their targets and stood out with early investments and natural resource advantages.
- Low-Performing Countries: Malta, Luxembourg, and the Netherlands have shown low target realization rates.
- The 2020 Renewable Energy Progress Reports (COM/2020/952) show that many countries lag, especially in the heating/cooling sector.
Policy Instruments and Alignment Mechanisms
Member countries have used different incentives (purchase tariffs, green certificates, tax breaks). However, the following mechanisms have facilitated harmonization:
- NECPs (National Energy and Climate Plans).
- Cross-Border Electricity Market Integration.
- EU Funds: Horizon, NextGenEU, Recovery and Resilience Fund.
Recent Alignment Trends: In the post-2020 period, harmonization has increased with the standard monitoring and reporting systems (MRV), binding NECPs, and RED III. However, technological capacity gaps, grid integration problems, and political inertia remain significant obstacles in low-performing countries. The EU has made considerable progress in political integration between 1990 and 2023, but inconsistencies persist at the implementation level.
5. Discussion
Research findings show that the EU RE policies played a decisive role in the transition between 1990 and 2023. Framework regulations, especially the Renewable Energy Directives (RED I, II, and III), have significantly contributed to transforming the energy systems of member countries. RE production increased from 70.7 million tonnes of oil equivalent (Mtoe) in 1990 to 254.8 Mtoe in 2023; the share of renewables in gross final energy consumption reached 24.5% in 2023, remaining 18.0 percentage points short of the 42.5% (2030) EU target [7,36]. However, despite this overall success, progress has not been evenly distributed across sectors and countries. While the electricity sector leads with a RE share of 53.8%, heating/cooling is a serious laggard with 28.7%, and transportation is only 9.1%. The sectoral decomposition analysis confirms this imbalance and shows that the policy impact varies across areas. The fixed effects analysis and clustering results reveal profound differences across countries, with leading countries such as Sweden (53.3%) and Finland (40.9%) standing out due to their high fixed coefficients.
Countries such as Malta (10.6%) and Luxembourg lag significantly behind targets due to their poor performance. These regional differences reflect inequalities in infrastructure investment, capacity gaps, and the implementation of policies (European Environment Agency, 2025). The 3.57% increase in renewables and the jump in electricity sector production during the 2019–2023 period reflect not only the efficacy of RED II but also the strategic acceleration driven by the REPowerEU plan [38] aimed at reducing dependence on Russian fossil fuels. This geopolitical shock has catalyzed a shift from mere climate compliance to prioritizing energy security, accelerating the deployment of heat pumps and offshore wind despite persistent grid integration challenges [4], which reinforces the policy’s effectiveness. In conclusion, the findings demonstrate that the EU’s energy policies largely align with the objectives of combating climate change, ensuring energy security, and promoting competitiveness [1,51]. Achieving the 2030 climate neutrality milestones requires shifting from aggregate targets to sector-specific intervention mechanisms, particularly to overcome the structural rigidities identified in the transport and heating sectors. From a forward-looking perspective, closing the 2030 gap requires an average annual increase of about 2.6 percentage points in the renewable share from 2024 to 2030. This benchmark provides a tractable yardstick to interpret sectoral lags identified in transport and heating/cooling.
This study’s findings exhibit overlapping and differing aspects with the existing literature. These overlapping findings particularly point to the decisive role of the EU’s RE policies in the transition process. For example, the 150% increase in RE production (2000–2020) reported by Driha et al. [2] for the EU27 is consistent with the growth momentum recorded between 1990 and 2023 in this study. The 43.1% renewable share in the electricity sector, as well as the leadership of the Nordic countries highlighted by Gajdzik et al. [5], are also consistent with the findings of the fixed effects analysis and clustering. The limited transition rates reported in the literature on the transportation sector [52] are confirmed in this study; however, the current analysis provides a more detailed examination of regional imbalances using the LMDI decomposition method.
In particular, the classification of countries such as Malta and Luxembourg as having low fixed effects, combined with the low share of transportation at 9.1%, indicates that the policy impact was limited to specific sectors. These differences, however, largely stem from methodological differences. While most previous studies (e.g., Piekut [20]) were limited to single-country time series analyses, this research employed a panel data model and fixed effects regression, enabling a more robust examination of country and sectoral variations. Furthermore, the systematic inclusion of the entire EU27 in this research distinguishes it from previous studies in terms of sample coverage. Furthermore, the 3.57% growth rate observed during the 2019–2022 period, following the adoption of RED II and the capacity increase in the electricity sector [3,4], was not sufficiently detailed in previous studies; however, it is explicitly analyzed in this study. Finally, the contribution of local energy communities to the transformation, as proposed by Guetlein & Schleich [53], is supported by the findings of this study and linked to policy recommendations.
This research makes multifaceted contributions to the energy transition literature, both theoretically and methodologically. By holistically synthesizing theories of sustainable development, energy transition, and economic growth, the study develops a multidimensional analytical framework encompassing environmental, financial, and social dimensions [42]. This theoretical framework fills theoretical gaps in the literature by enabling the assessment of the multilayered impacts of RE policies in line with the EU’s 2050 climate neutrality goals [44]. The research offers a more nuanced and localized perspective on the energy transition, particularly by detailed modeling of sectoral and regional heterogeneity using fixed-effects regression, LMDI decomposition, and clustering methods. Methodologically, the study stands out with its innovative tools and integration techniques. The fixed-effects approach, applied to panel data models with a high coefficient of determination (R2 = 0.982), strengthened the analysis of structural differences across countries [2,18].
Furthermore, the decomposition analysis using the LMDI method and the artificial neural network-based Self-Organizing Maps (SOM; Kohonen) clustering algorithm enabled a more in-depth study of sectoral and temporal patterns [55]. This methodological integrity enhances the statistical validity and practical policy value of the findings. The results are of strategic importance for policymakers. In particular, the 3.57% increase in RE and the capacity increase in the electricity sector observed after the implementation of the RED II Directive confirm the overall potential success of EU policies [3]. However, low rates of 9.1% in the transport sector and the weak level of integration in new Member States (e.g., Malta, Luxembourg) highlight the need for more targeted, region- and sector-specific interventions [16]. The findings highlight policy successes and areas where existing policies fall short, providing an opportunity to develop future improvement strategies.
The empirical findings of this research reveal that RE policies not only increase energy production rates but also contribute to a much broader range of institutional, technical, and societal transformation processes. Firstly, sectoral-level decomposition and fixed-effects analyses demonstrate a significant need for specialized workforces, particularly in rapidly scaling technologies such as solar and wind [6,56]. The increased capacity experienced in the electricity sector reflects supply-side developments and an increasing demand for energy consulting and engineering expertise. This highlights the strategic importance of qualified human resources for institutional structures managing the energy transition. The findings also indicate that public awareness of RE remains limited at both sectoral and regional levels, and that awareness campaigns should be expanded, particularly in areas with low penetration rates, such as transportation, heating and cooling [43,57].
Transforming energy consumption behavior is possible not only through technical solutions but also through societal acceptance. Regarding legal and regulatory frameworks, the study highlights the critical role of standards for integrating RE technologies into existing grids. The cross-country distribution and disaggregation findings in the SOM, as well as the Kohonen cluster analyses, indicate that the regulations’ capacity to mitigate technical risks and ensure grid security is decisive. Similarly, the fact that subsidies, tax incentives, and long-term support mechanisms directly impact the speed of deployment is consistent with both the existing literature and the findings of this study [58,59]. The study’s clustering results reveal regional inequalities, particularly when considering communities in regions heavily dependent on fossil fuels. As emphasized by the Clean Air Task Force [60] and the European Commission [7], targeted financial and institutional support must be provided to vulnerable groups to ensure a just transition.
The empirical findings of this study demonstrate that the EU’s RE policies yield effective results not only at the production level but also in terms of workforce capacity, public awareness, regulatory architecture, and social justice. According to the sectoral decomposition analysis, the rapid transformation observed in the electricity sector has increased the need for technical expertise and accentuated the demand for highly skilled labor, especially in scalable technologies such as wind and solar [6]. This reveals that policy impacts are directly related to energy supply and human capital development. This supports the need for public awareness campaigns emphasized by Zheng et al. [61]. This correlation between energy consumption and technological adoption demonstrates the need to target not only the behavioral level but also the policy formulation level.
The results of the fixed-effects regression analysis indicate that policy interventions have varying effects due to country-specific structural conditions. This highlights the need to tailor tax incentives, subsidies, and support programs, as recommended by the United Nations [58] and Stokes & Warshaw [59], to the local context. The high variance observed in the study highlights issues with the effective distribution of such support, particularly in new member states [43,56]. In the analyses, the rise of the electricity sector, coupled with the lag in areas such as transportation and heating, was associated with differences in technical and regulatory infrastructure. Finally, cluster and fixed-effects analyses provided essential indicators of the community-level effects of the transition. Representing fossil fuel-dependent regions with low fixed effects highlights the need for just transition mechanisms, since it cannot be denied that positively impacting economic growth on the environment and a positive short-term relationship between economic growth and increase in carbon dioxide emissions [62,63,64].
While this study offers important insights into the sectoral and regional impacts of the EU’s RE policies, it also suffers from several structural and methodological limitations. First, data gaps between 1990 and 2003 hinder the robustness of long-term comparative analyses, particularly in low-penetration sectors such as transportation and heating/cooling. Country-specific and sector-specific inconsistencies in datasets obtained from Eurostat, the IEA, and other institutions occasionally undermine statistical integrity, limiting the reliability of the analysis. Methodologically, while this study focuses on renewable shares, it does not explicitly quantify absolute emission reductions, total energy system costs, or grid reliability indices. Furthermore, although the dataset covers up to 2023, the full long-term impact of the post-2022 energy crisis and the rapid expansion of heat pump markets may require future longitudinal assessment. However, the success of the energy transition is closely linked to technical indicators and the capacity for societal transformation. Limiting the study to only EU27 countries precludes global comparisons and external validity analyses, thereby limiting the determination of the universal applicability of the findings.
Future research should address these limitations and assess the social, technical, and geographical impacts of policies more holistically, rather than the existing literature that is characterized by rather detached, small/case-scaled research studies [65,66,67]. First, addressing data gaps before 1990 will enable more robust trend analyses. Furthermore, using qualitative methods such as case studies, focus group interviews, and surveys can provide a more in-depth understanding of social adaptation processes and local perception barriers. Comparative analyses with regions outside the EU will offer the opportunity to assess the relative effectiveness of EU policies on a broader scale. Policymakers should design targeted subsidies, grid adaptation programs, and transition financing, particularly for new Member States and the transportation sector. At the same time, retraining and skills development programs should be implemented for the workforce involved in the RE transition, and technical competence in energy technologies should be increased.
6. Conclusions
This research presents multidimensional findings on energy transition, systematically analyzing the sectoral, regional, and temporal impacts of the EU’s RE policies implemented between 1990 and 2023. The EU’s progress in the energy transition process has been comprehensively assessed using advanced techniques, including descriptive statistics, LMDI decomposition analysis, fixed effects regression, SOM Kohonen clustering, and policy convergence tables. The study reveals that the electricity sector, with a 53.8% share of RE, is at the forefront of the transition process. In comparison, progress remains limited in the transportation sector (9.1%) and the heating and cooling sector. The panel data analysis’s superior fit coefficient of the fixed effects model (R2 = 0.982) indicates that policy effects differ across countries and are related to sectoral structures. The LMDI decomposition confirms that these differences stem from emissions intensity, energy intensity, and structural factors.
The cluster analysis categorizes EU countries into groups with similar characteristics based on their RE performance. It highlights the structural differences between leading countries, such as Sweden and Finland, and lagging countries, like Malta and Luxembourg. Policy coherence analysis revealed significant heterogeneity in the implementation of RED I, II, and III directives, and obstacles such as a lack of capacity, financing constraints, and limited public support persist, particularly in new Member States. The results substantiate that the Renewable Energy Directives (RED I–III) have driven significant capacity expansion in the electricity sector, but require complementary industrial policies to address the inertia observed in the transport and heating sectors. However, limitations such as data inconsistencies (especially for the 1990–2003 period), lack of qualitative analysis, and exclusion of non-EU countries partially impact the generalizability of the findings. The EU’s RE policies have generally been successful in combating climate change, enhancing energy security, and achieving sustainable development goals. However, achieving these holistic goals requires sustained political commitment and coherent financing mechanisms to bridge the profitability gap in lagging sectors, such as transportation. Policymakers must align fiscal incentives with the principle of social justice to mitigate the distributional costs of the transition.
Author Contributions
Conceptualization, H.T. and D.Š.; methodology, H.T. and G.L.K.; software, H.T.; validation, D.Š.; formal analysis, D.Š. and H.T.; investigation, D.Š.; resources, G.L.K.; data curation, G.L.K.; writing—original draft preparation, H.T.; writing—review and editing, D.Š. and G.L.K.; visualization, H.T. and G.L.K.; supervision, D.Š.; project administration, H.T.; funding acquisition, G.L.K. All authors have read and agreed to the published version of the manuscript.
Funding
This research received no external funding.
Data Availability Statement
Publicly available datasets were analyzed in this study. This data can be found here: Eurostat SHARES and Eurostat Energy Balances. The specific processing codes are available from the authors upon request. The original contributions presented in this study are included in the article. Further inquiries can be directed to the corresponding authors.
Conflicts of Interest
The authors declare no conflicts of interest.
References
- Mempel-Śnieżyk, A.; Hlaváček, P.; Hajduga, P. Renewable energy transition in Europe in the last two decades. Reg. J. 2024, 24, 21–30. [Google Scholar] [CrossRef]
- Driha, O.; Cascetta, F.; Nardini, S.; Bianco, V. Evolution of renewable energy generation in EU27: A decomposition analysis. Renew. Energy 2023, 207, 348–358. [Google Scholar] [CrossRef]
- Eurostat. Renewable Energy Statistics; European Commission: Brussels, Belgium, 2024; Available online: https://ec.europa.eu/eurostat/statistics-explained/index.php?title=Renewable_energy_statistics (accessed on 10 September 2025).
- IEA. World Energy Outlook 2020; International Energy Agency: Paris, France, 2020. [Google Scholar]
- Gajdzik, B.; Nagaj, R.; Wolniak, R.; Bałaga, D.; Žuromskaitė, B.; Grebski, W.W. Renewable Energy Share in European Industry: Analysis and Extrapolation of Trends in EU Countries. Energies 2024, 17, 2476. [Google Scholar] [CrossRef]
- IRENA. Renewable Energy and Jobs: Annual Review. 2020. Available online: https://www.irena.org/publications/2020/Sep/Renewable-Energy-and-Jobs-Annual-Review-2020 (accessed on 10 September 2025).
- European Commission. A Framework for a Just and Inclusive Energy Transition. 2025. Available online: https://ec.europa.eu/energy (accessed on 10 September 2025).
- Apergis, N.; Payne, J.E. Renewable energy consumption and economic growth: Evidence from a panel of OECD countries. Energy Policy 2010, 31, 656–660. [Google Scholar] [CrossRef]
- Goldthau, A.; Youngs, R. The EU energy crisis and a new geopolitics of climate transition. J. Common Mark. Stud. 2023, 61, 115–124. [Google Scholar] [CrossRef]
- Siddi, M.; Prandin, F. Governing the EU’s energy crisis: The European Commission’s geopolitical turn and its pitfalls. Politics Gov. 2023, 11, 286–296. [Google Scholar] [CrossRef]
- Soava, G.; Mehedintu, A.; Sterpu, M. Analysis and Forecast of the Use of E-Commerce in Enterprises of the European Union States. Sustainability 2022, 14, 8943. [Google Scholar] [CrossRef]
- Chioatto, E.; Sospiro, P. Transition from waste management to circular economy: The European Union roadmap. Environ. Dev. Sustain. 2023, 25, 249–276. [Google Scholar] [CrossRef]
- Čavoški, A. An ambitious and climate-focused Commission agenda for post COVID-19 EU. Environ. Politics 2020, 29, 1112–1117. [Google Scholar] [CrossRef]
- Bórawski, P.; Holden, L.; Bełdycka-Bórawska, A. Perspectives of photovoltaic energy market development in the European Union. Energy 2023, 270, 126804. [Google Scholar] [CrossRef]
- Brodny, J.; Felka, D.; Tutak, M. The use of the neuro-fuzzy model to predict the methane hazard during the underground coal mining production process. J. Clean. Prod. 2022, 368, 133258. [Google Scholar] [CrossRef]
- Hassan, Q.; Nassar, A.K.; Al-Jiboory, A.K.; Viktor, P.; Telba, A.A.; Awwad, E.M.; Amjad, A.; Fakhruldeen, H.F.; Algburi, S.; Mashkoor, S.C.; et al. Mapping Europe renewable energy landscape: Insights into solar, wind, hydro, and green hydrogen production. Technol. Soc. 2024, 77, 102535. [Google Scholar] [CrossRef]
- Usman, O.; Akadiri, S.S.; Adeshola, I. Role of renewable energy and globalization on ecological footprint in the USA: Implications for environmental sustainability. Environ. Sci. Pollut. Res. 2020, 27, 30681–30693. [Google Scholar] [CrossRef]
- Stec, M.; Grzebyk, M. Statistical Analysis of the Level of Development of Renewable Energy Sources in the Countries of the European Union. Energies 2022, 15, 8278. [Google Scholar] [CrossRef]
- Dolge, K.; Blumberga, D. Transitioning to Clean Energy: A Comprehensive Analysis of Renewable Electricity Generation in the EU-27. Energies 2023, 16, 6415. [Google Scholar] [CrossRef]
- Piekut, M. The Consumption of Renewable Energy Sources (RES) by the European Union Households between 2004 and 2019. Energies 2021, 14, 5560. [Google Scholar] [CrossRef]
- Houtman, A.; Reins, L. Energy transition in the EU: Targets, market regulation, and law. In The Palgrave Handbook of Zero Carbon Energy Systems and Energy Transitions; Book Series: Palgrave Studies in Energy Transitions (PSET); Springer: Cham, Switzerland; Palgrave Macmillan: Cham, Switzerland, 2024; pp. 273–298. [Google Scholar] [CrossRef]
- Ionescu, R.V.; Zlati, M.L.; Antohi, V.M.; Susanu, I.O.; Cristache, N. A new approach on renewable energy as a support for regional economic development among the European Union. Technol. Forecast. Soc. Change 2022, 184, 121998. [Google Scholar] [CrossRef]
- Dhabi, A. World Energy Transitions Outlook: 1.5 °C Pathway; International Renewable Energy Agency (IRENA): Abu Dhabi, United Arab Emirates, 2023; ISBN 978-92-9260-527-8. Available online: https://www.irena.org/Publications/2023/Jun/World-Energy-Transitions-Outlook-2023 (accessed on 15 December 2025).
- Wang, W.; Xiao, W.; Bai, C. Can renewable energy technology innovation alleviate energy poverty? Perspective from the marketization level. Technol. Soc. 2022, 68, 101933. [Google Scholar] [CrossRef]
- Čeryová, D.; Bullová, T.; Turčeková, N.; Adamičková, I.; Moravčíková, D.; Bielik, P. Assessment of the Renewable Energy Sector Performance Using Selected Indicators in European Union Countries. Resources 2020, 9, 102. [Google Scholar] [CrossRef]
- Brodny, J.; Tutak, M. Assessing regional implementation of Sustainable Development Goal 9 “Build resilient infrastructure, promote sustainable industrialization and foster innovation” in Poland. Technol. Forecast. Soc. Change 2023, 195, 122773. [Google Scholar] [CrossRef]
- Tutak, M.; Brodny, J. Evaluation of Poland’s energy transition process between 2012–2022, Scientific Papers of Silesian University of Technology. Organ. Manag. 2024, 210, 571–590. [Google Scholar] [CrossRef]
- Dogan, E.; Seker, F.; Bulbul, S. Investigating the impacts of energy consumption, real GDP, tourism and trade on CO2 emissions by accounting for cross-sectional dependence: A panel study of OECD countries. Curr. Issues Tour. 2017, 20, 1701–1719. [Google Scholar] [CrossRef]
- Soava, G.; Mehedintu, A.; Sterpu, M.; Raduteanu, M. Impact of renewable energy consumption on economic growth: Evidence from European Union countries. Technol. Econ. Dev. Econ. 2018, 24, 914–932. [Google Scholar] [CrossRef]
- Anser, M.K.; Usman, M.; Sharif, M.; Bashir, S.; Shabbir, M.-S.; Khan, G.-Y.; Lopez, L.-B. The dynamic impact of renewable energy sources on environmental economic growth: Evidence from selected Asian economies. Environ. Sci. Pollut. Res. 2022, 29, 3323–3335. [Google Scholar] [CrossRef]
- Taghizadeh-Hesary, F.; Rasoulinezhad, E.; Yoshino, N. Leveraging on energy security to alleviate poverty in Asian economies. Singap. Econ. Rev. 2023, 68, 1063–1090. [Google Scholar] [CrossRef]
- Haloui, I.; Amzil, H.; Yang, G.; Fourati, I.; Li, Y. The Impact of Renewable Energy Use, Financial Development, and Industrialization on CO2 Emissions in Middle-Income Economies—A GMM-PVAR Analysis. Sustainability 2025, 17, 8178. [Google Scholar] [CrossRef]
- Troster, V.; Shahbaz, M.; Uddin, G.S. Renewable energy, oil prices, and economic activity: A Granger-causality in quantiles analysis. Energy Econ. 2018, 70, 440–452. [Google Scholar] [CrossRef]
- Fernández, Y.F.; López, M.F.; Blanco, B.O. Innovation for sustainability: The impact of R&D spending on CO2 emissions. J. Clean. Prod. 2018, 172, 3459–3467. [Google Scholar] [CrossRef]
- Popescu, G.H.; Nica, E.; Kliestik, T.; Zvarikova, K.; Mihai, E.A.; Gura, K. Exploring the Environmental Impact of Energy Consumption, Globalization, and Research & Development in Europe: Insights from the STIRPAT-EKC Framework; Research Square Platform LLC: Durham, NC, USA, 2023. [Google Scholar] [CrossRef]
- Eurostat. Shedding Light on Energy in Europe, 2025th ed.; European Commission: Brussels, Belgium, 2025; Available online: https://ec.europa.eu/eurostat/web/interactive-publications/energy-2025 (accessed on 10 September 2025).
- Tu, Y.-X.; Kubatko, O.; Piven, V.; Sotnyk, I.; Kurbatova, T. Determinants of Renewable Energy Development: Evidence from the EU Countries. Energies 2022, 15, 7093. [Google Scholar] [CrossRef]
- Dolge, K.; Blumberga, D. From Targets to Action: Analyzing the Viability of REPowerEU in Achieving Energy Sustainability. E3S Web Conf. EDP Sci. 2023, 433, 03003. [Google Scholar] [CrossRef]
- García-Olivares, A.; Solé, J.; Osychenko, O. Transportation in a 100% renewable energy system. Energy Convers. Manag. 2018, 158, 266–285. [Google Scholar] [CrossRef]
- Kebe, A. Green Hydrogen Economy: Paving the Way for a Just and Inclusive Energy Transition. In African Green Transition Through Innovative Pathways; Narra, M.M., Narra, S., Eds.; World Sustainability Series; Springer: Cham, Switzerland, 2025; pp. 199–222. [Google Scholar] [CrossRef]
- McWilliams, B.; Tagliapietra, S.; Trasi, C. Smarter European Union Industrial Policy for Solar Panels. 2024. Available online: https://www.econstor.eu/handle/10419/294897 (accessed on 12 October 2025).
- Markard, J.; Geels, F.W.; Raven, R. Challenges in the acceleration of sustainability transitions. Environ. Res. Lett. 2020, 15, 081001. [Google Scholar] [CrossRef]
- Sovacool, B.K. How long will it take? Conceptualizing the temporal dynamics of energy transitions. Energy Res. Soc. Sci. 2016, 13, 202–215. [Google Scholar] [CrossRef]
- Geels, F.W.; Sovacool, B.K.; Schwanen, T.; Sorrell, S. Sociotechnical transitions for deep decarbonization. Science 2020, 370, 1242–1244. [Google Scholar] [CrossRef] [PubMed]
- Hair, J.F.; Hult, G.T.M.; Ringle, C.M.; Sarstedt, M. A Primer on Partial Least Squares Structural Equation Modeling (PLS-SEM), 3rd ed.; Sage Publishing: Thousand Oaks, CA, USA, 2022. [Google Scholar]
- Mehedintu, A.; Soava, G. A Hybrid SEM-Neural Network Modeling of Quality of M-Commerce Services under the Impact of the COVID-19 Pandemic. Electronics 2022, 11, 2499. [Google Scholar] [CrossRef]
- Loorbach, D.; Frantzeskaki, N.; Avelino, F. Sustainability Transitions Research: Transforming Science and Practice for Societal Change. Annu. Rev. Environ. Resour. 2017, 42, 599–626. [Google Scholar] [CrossRef]
- Chen, Y.; Wang, Z.; Zhong, Z. CO2 emissions, economic growth, renewable and non-renewable energy production and foreign trade in China. Renew. Energy 2019, 131, 208–216. [Google Scholar] [CrossRef]
- Dong, K.; Jiang, Q.; Shahbaz, M.; Zhao, J. Does low-carbon energy transition mitigate energy poverty? The case of natural gas for China. Energy Econ. 2021, 99, 105324. [Google Scholar] [CrossRef]
- Martin, R.M.F. Economic Aspects of the Sustainability Transition in Europe; Routledge Taylor and Francis: London, UK, 2024; 204p. [Google Scholar]
- European Parliament. Renewable Energy, Fact Sheets on the European Union. 2025. Available online: https://www.europarl.europa.eu/factsheets/en/sheet/70/renewable-energy (accessed on 10 September 2025).
- Tutak, M.; Brodny, J. Renewable energy consumption in economic sectors in the EU-27. The impact on economics, environment and conventional energy sources. A 20-year perspective. J. Clean. Prod. 2022, 345, 131076. [Google Scholar] [CrossRef]
- Guetlein, M.C.; Schleich, J. Understanding citizen investment in renewable energy communities. Ecol. Econ. 2023, 211, 107895. [Google Scholar] [CrossRef]
- European Parliament and Council of the European Union. Directive (EU) 2018/2001 of the European Parliament and of the Council of 11 December 2018 on the Promotion of the Use of Energy from Renewable Sources (Recast). Brussels, Belgium. EUR-Lex. 2018. Available online: https://eur-lex.europa.eu/eli/dir/2018/2001/oj/eng (accessed on 18 November 2025).
- Rusin, A.; Wojaczek, A. Changes in the structure of the Polish energy mix in the transition period to ensure the safety and reliability of energy supplies. Energy 2023, 282, 128831. [Google Scholar] [CrossRef]
- McConohy, G.; Xu, X. Applied stress can control lithium intrusions in solid electrolytes. Nat. Energy 2023, 8, 228–229. [Google Scholar] [CrossRef]
- Barragán-Ocaña, A.; Cecilio-Ayala, E.; Silva-Borjas, P.; Cortés-Ruiz, J.-A.; Hernandez-Cardona, E.-Y. Policies and sustainable energy transition in the global environment: Challenges for Latin America. Heliyon 2025, 11, 42295. [Google Scholar] [CrossRef]
- United Nations. Renewable Energy—Powering a Safer Future. 2022. Available online: https://www.un.org/en/climatechange/raising-ambition/renewable-energy (accessed on 10 September 2025).
- Stokes, L.; Warshaw, C. Renewable energy policy design and framing influence public support in the United States. Nat. Energy 2017, 2, 17107. [Google Scholar] [CrossRef]
- Leonhardt, R.; Noble, B.; Poelzer, G.; Fitzpatrick, P.; Belcher, K.; Holdmann, G. Advancing local energy transitions: A global review of government instruments supporting community energy. Energy Res. Soc. Sci. 2022, 83, 102350. [Google Scholar] [CrossRef]
- Zheng, W.; Cui, T.; Li, H. Combined technologies for the remediation of soils contaminated by organic pollutants. A review. Environ. Chem. Lett. 2022, 20, 2043–2062. [Google Scholar] [CrossRef]
- Kyriakopoulos, G.L. (Ed.) Should low carbon energy technologies be envisaged in the context of sustainable energy systems? chapter 15. In Low Carbon Energy Technologies in Sustainable Energy Systems; Elsevier Publisher: Amsterdam, The Netherlands, 2021; pp. 357–389. [Google Scholar] [CrossRef]
- Gomez, M.; Rodriguez, J.C. The Ecological Footprint and Kuznets Environmental Curve in the USMCA Countries: A Method of Moments Quantile Regression Analysis. Energies 2020, 13, 6650. [Google Scholar] [CrossRef]
- Fuinhas, J.A.; Koengkan, M.; Leitão, N.C.; Nwani, C.; Uzuner, G.; Dehdar, F.; Relva, S.; Peyerl, D. Effect of Battery Electric Vehicles on Greenhouse Gas Emissions in 29 European Union Countries. Sustainability 2021, 13, 13611. [Google Scholar] [CrossRef]
- Ayalew, B.S.; Andrzejczyk, R. Recent Advancements in Latent Thermal Energy Storage and Their Applications for HVAC Systems in Commercial and Residential Buildings in Europe—Analysis of Different EU Countries’ Scenarios. Energies 2025, 18, 4000. [Google Scholar] [CrossRef]
- Jorgensen, B.N.; Gunasekaran, S.S.; Ma, Z.G. Impact of EU Laws on AI Adoption in Smart Grids: A Review of Regulatory Barriers, Technological Challenges, and Stakeholder Benefits. Energies 2025, 18, 3002. [Google Scholar] [CrossRef]
- Raut, S.A.; Marchi, L.; Gaspari, J. A System Thinking Approach to Circular-Based Strategies for Deep Energy Renovation: A Systematic Review. Energies 2025, 18, 2494. [Google Scholar] [CrossRef]


Disclaimer/Publisher’s Note: The statements, opinions and data contained in all publications are solely those of the individual author(s) and contributor(s) and not of MDPI and/or the editor(s). MDPI and/or the editor(s) disclaim responsibility for any injury to people or property resulting from any ideas, methods, instructions or products referred to in the content. |
© 2026 by the authors. Licensee MDPI, Basel, Switzerland. This article is an open access article distributed under the terms and conditions of the Creative Commons Attribution (CC BY) license.