Article

Diagenetic Path of Deeply Buried Clastic Rocks and Pore Evolution of Reservoirs in the Oligocene Huagang Formation of the Xihu Sag


1
State Key Laboratory of Oil and Gas Reservoir Geology and Exploitation, Chengdu University of Technology, Chengdu 610059, China
2
Shanghai Branch, China National Offshore Oil Corporation Co., Ltd., Shanghai 200030, China
*
Author to whom correspondence should be addressed.
Energies 2026, 19(1), 238; https://doi.org/10.3390/en19010238
Submission received: 5 December 2025 / Revised: 24 December 2025 / Accepted: 30 December 2025 / Published: 31 December 2025
(This article belongs to the Section H3: Fossil)

Abstract

To elucidate the development control factors, diagenetic evolution, and pore evolution of oil and gas reservoirs of the Huagang Formation in the East China Sea Shelf Basin Central Anticlinal Belt, this study involved geological analyses, including thin-section petrography, scanning electron microscopy (SEM), mineral analysis via TESCAN Integrated Mineral Analyzer (TIMA), X-ray diffraction (XRD), and petrophysical measurements. We investigated the reservoir characteristics and primary diagenetic processes of the Huagang Formation reservoirs using logging and nuclear magnetic resonance (NMR) data, identified provenance differences between the north-central (FN) and south-central (FS) areas, divided diagenetic environments, established distinct diagenetic sequences, and uncovered high-quality reservoir pore evolution patterns. The results showed that the provenance in the FN area of the Central Anticlinal Belt is primarily acidic igneous rocks, which exhibits low resistance to compaction but is susceptible to dissolution modification, and the “high-dissolution zone” developed at burial depths of 3600–3900 m constitutes the primary high-quality reservoir; the provenance in the FS area is a mixture of medium- and high-grade metamorphic rocks and acidic igneous rocks, which exhibits stronger resistance to compaction, but dissolution zones are poorly developed. The Huagang Formation has experienced multiple diagenetic processes, such as compaction, cementation, and dissolution. During destructive diagenesis, the average reduction in pore volume due to compaction accounts for 76% (FN area) and 81% (FS area), while cementation accounts for 18% (FN area) and 12% (FS area). Vertically, 3900 m and 4000 m are the boundaries between the acidic zone and acid-alkaline transition zone of the Huagang Formation in the FN and FS areas, respectively, and the whole Huagang Formation is considered within the meso-diagenetic A2 stage. The pore evolution is closely related to diagenesis. The porosity of the sandstones in the Upper Member of the Huagang Formation in the FN area changes from 37.5% to 10.62%, and the porosity of the sand-stones in the Lower Member of the Huagang Formation in the FS area changes from 36.5% to 8.90%. The results of this study provide a reference for the study of differential diagenetic evolution of sandstones in the Xihu Sag and the exploration of deep high-quality reservoirs.

1. Introduction

Unconventional resources have become important for global oil and gas exploration. In particular, studies on tight sandstone reservoirs have received increasing attention with increasing exploration and development [1]. In recent years, global oil and gas exploration of deep and ultradeep clastic rocks has achieved a series of major breakthroughs. For instance, the deepwater Jack/St. Malo project in the U.S. Gulf of Mexico, with reserves of ~682 million BOE in Lower Tertiary turbidites buried up to 8839 m, yielded a test production of 818 tons per day from the Jack-2 well at 7620 m depth [2,3]. Moreover, China’s demand for natural gas resources is growing significantly, and the direction of exploration is rapidly shifting from conventional reservoirs to unconventional, deep-sea, and deep reservoirs [4]. For the East China Sea continental shelf basin, based on its geographical uniqueness, geological characteristics, and exploration practices, scholars have defined the range of 3500–4500 m as deep water and areas exceeding 4500 m as ultra-deep water [5,6]. As the burial depth increases, clastic reservoirs generally tend to be densified, and high temperature and high pressure complicate the diagenetic evolution process. In this context, whether primary pores can be effectively preserved and whether secondary pores can be fully developed are key scientific issues for the formation of deep high-quality clastic reservoirs [2,7,8].
Previous studies generally report that sedimentary factors not only control the primary pore structure of sediments but also strongly influence the subsequent diagenetic evolution path [9,10,11]. As the key factor controlling reservoir quality, diagenesis has long been a research hotspot, and its process mainly includes compaction, cementation, and dissolution [12,13,14], which plays a decisive role in controlling the evolution of sandstone pore structure and rock petrological characteristics; among them, compaction reduces primary pores through grain rearrangement and plastic deformation [15,16]. Cementation fills the pores with cements, such as calcite and quartz, and significantly reduces the permeability. In contrast, dissolution results in the formation of secondary pores through the dissolution of skeletal particles or cements, thereby improving the petrophysical characteristics of the reservoir [17,18]. The local sections in the reservoir with good petrophysical characteristics, high oil and gas content, and the most economic extraction value are “sweet spots”, and the sections with poor petrophysical characteristics, relatively low oil and gas content, and high extraction cost are “nonsweet spots”. The main controlling factors for the development of clastic reservoirs (“sweet spots”) are the dissolution of acidic unstable minerals (e.g., calcite cements and feldspar clasts) to increase porosity and the preservation of porosity by the overburden resistance to compaction triggered by the overpressure caused by tectonic compression or rapid burial [19,20]. Extensive research has been conducted on the single diagenetic process, evolution of diagenetic fluid environments, and mechanisms of compaction in the Huagang Formation sandstone reservoirs across the northern and southern regions of the Central Anticlinal Belt [21,22,23,24,25]; however, key issues, such as differences in diagenetic evolution, remain to be clarified. The burial depths of the sandstone reservoirs in the Huagang Formation have large spans. There are differences in temperature and diagenetic processes between different layers, resulting in different diagenetic paths and petrophysical characteristics. Especially in closed diagenetic systems, basement-type calcite cements in local strata weaken fluid activity and prevent large-scale dissolution; moreover, the lack of sufficient rigid particle support causes significant compaction, and the preservation and development of pores must be further clarified.
According to the principle of mass equilibrium, the overall chemical composition of a closed system changes slightly during burial diagenesis, and the dissolution and deposition of minerals tend to be in equilibrium [26]. In an open system, fluid flow and solute migration (or loss) dominate the diagenetic process [26,27,28]. Existing evidence shows that deep burial environments often exhibit closed system characteristics because of limited pore water flow rates and concentration gradients [29,30]; however, some open diagenetic systems [26,28,31] still exist. To thoroughly elucidate the controlling mechanism of diagenetic evolution on the difference in reservoir quality, this study selected the Huagang Formation sandstone reservoirs in the FN area (north-central part) and FS area (south-central part) of the Central Anticlinal Belt within the Xihu Sag as the study objects.
Therefore, building upon prior research, this study aims to systematically unravel the differential diagenetic evolution and pore evolution of the Huagang Formation sandstones in the Xihu Sag. By integrating sedimentary-structural context with a suite of analytical data (including petrography, SEM, TIMA, XRD, and petrophysical measurements) and examining reservoir characteristics at both macro- and micro-scales, we seek to elucidate the key controlling factors on reservoir quality. Ultimately, this work aims to establish a new theoretical framework for predicting high-quality ‘sweet spot’ reservoirs in this deep, tight sandstone play.

2. Geological Setting

2.1. Location of the Study Area

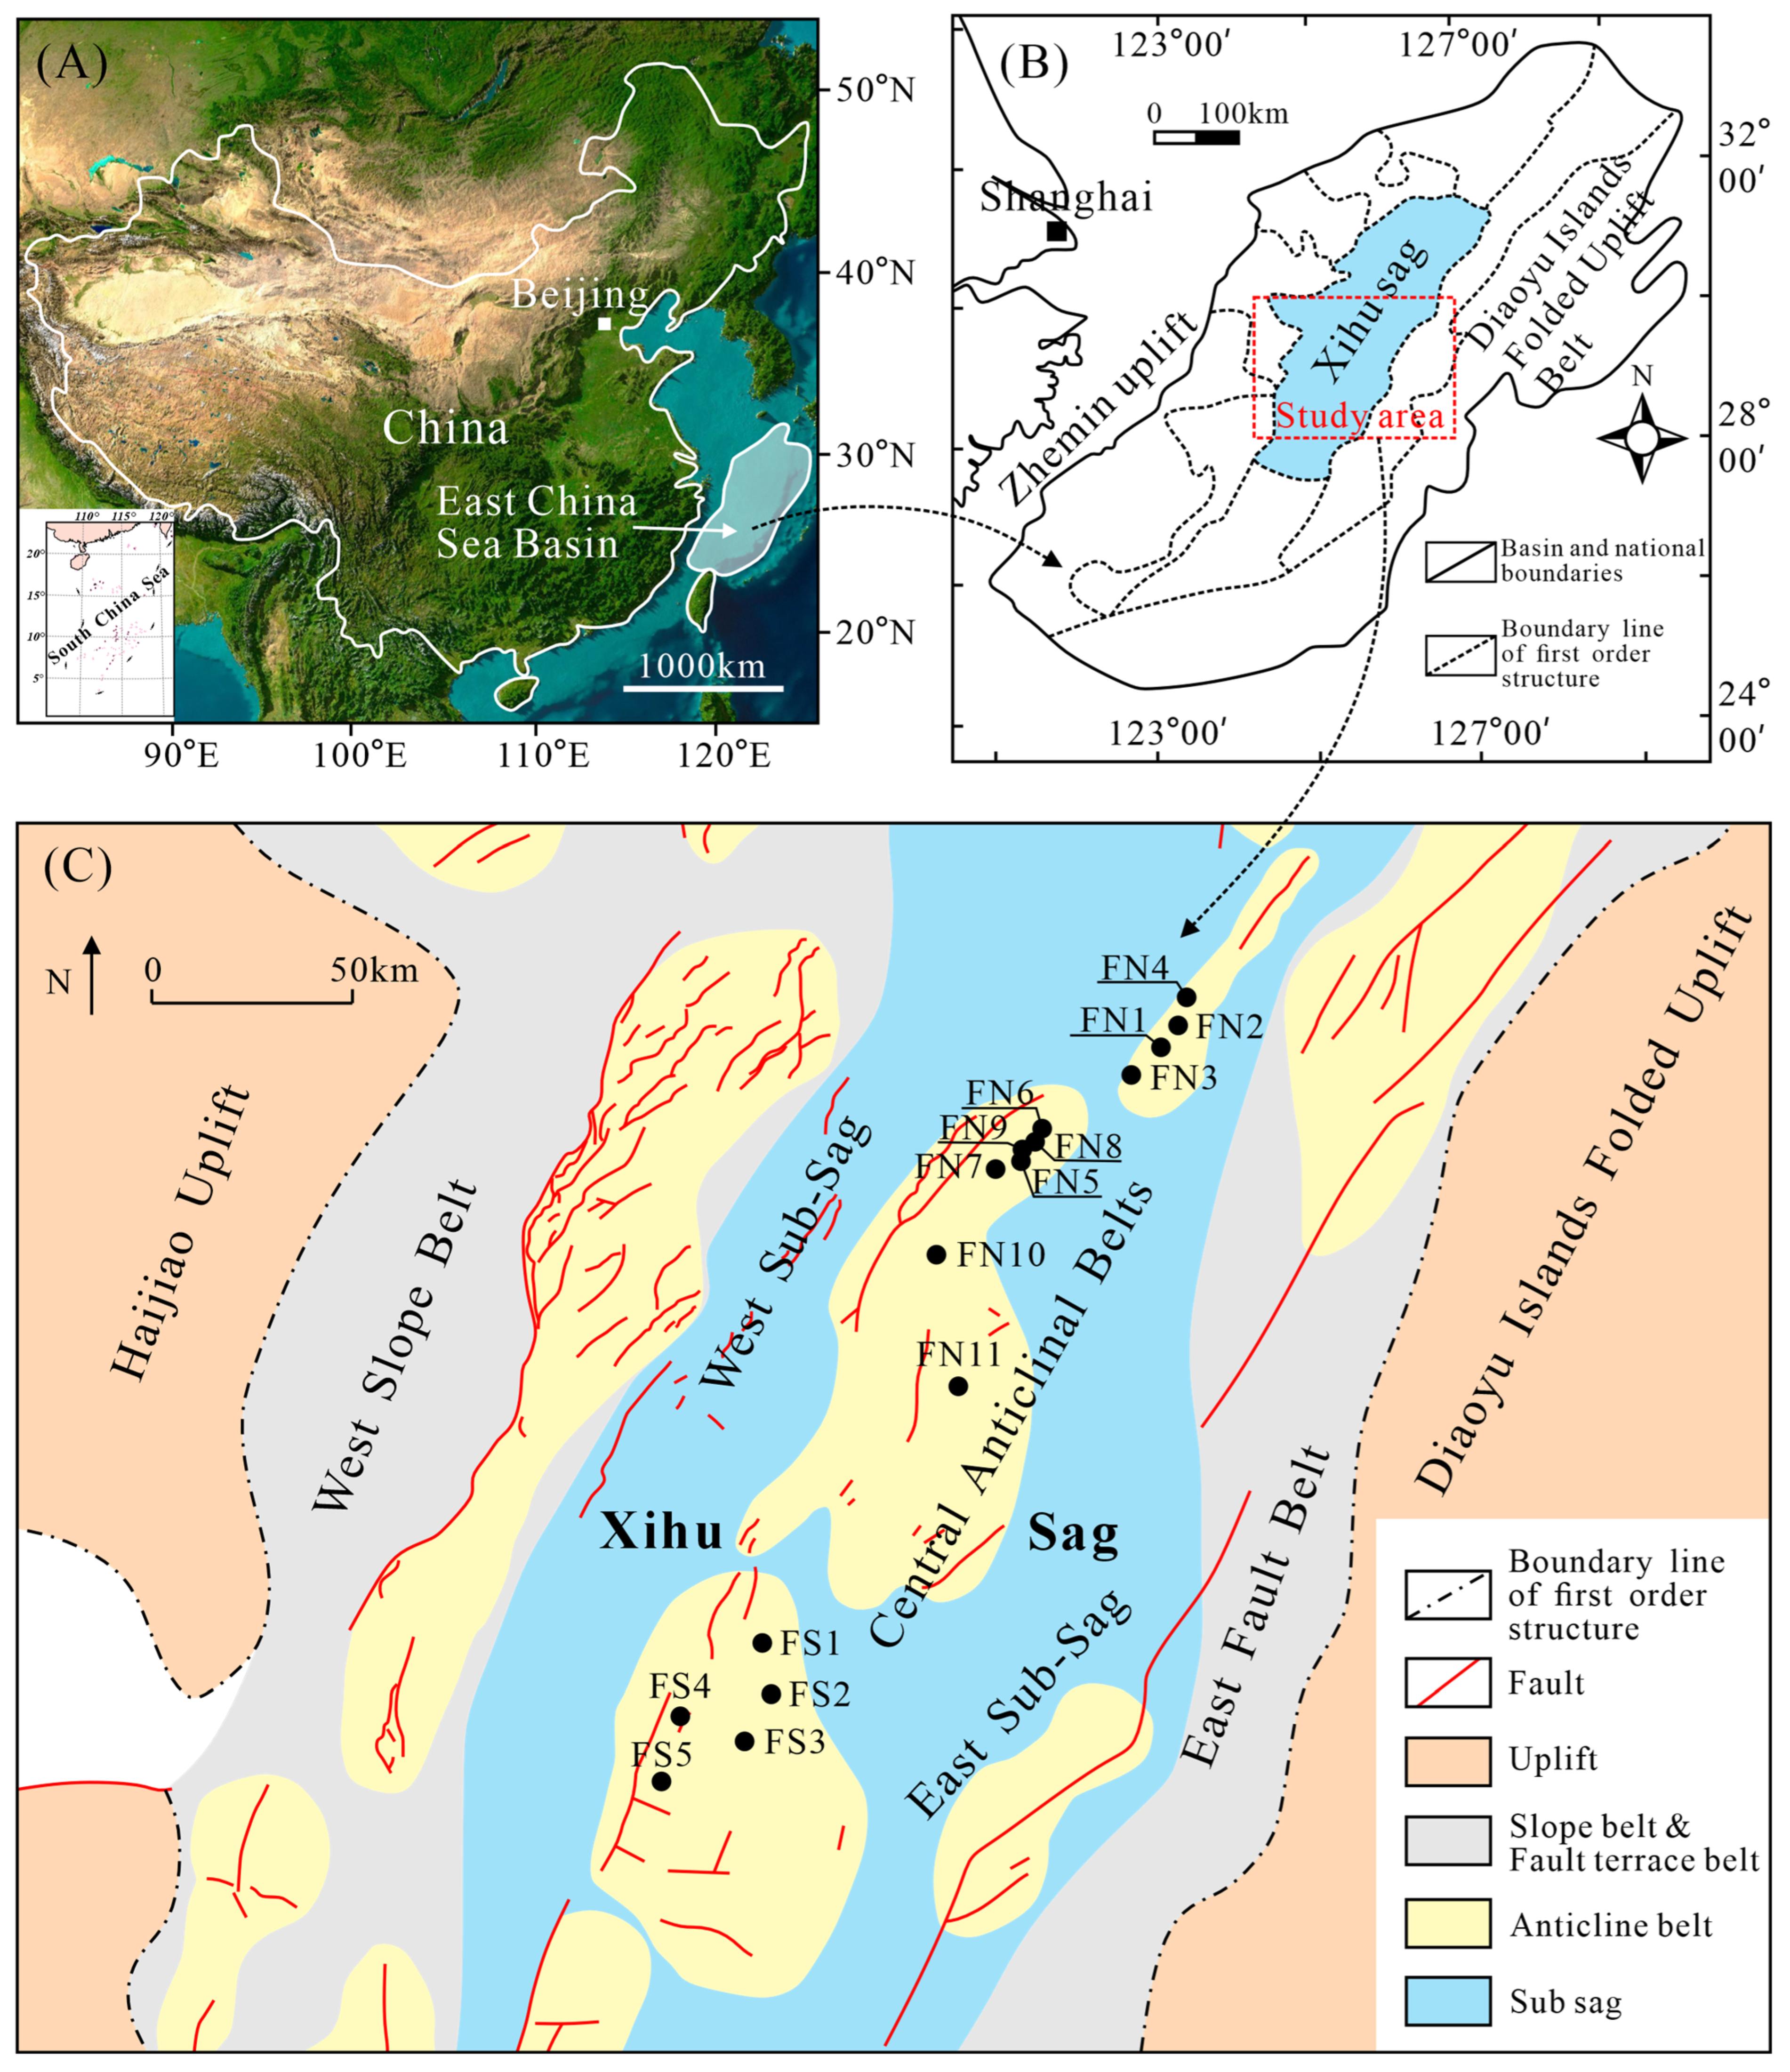
The Xihu Sag is located in the northeastern East China Sea Shelf Basin and features a NE–SW-trending, elongated (strip-like) geometry, covering an area of approximately 5.18 × 10⁴ km2. As an important hydrocarbon generation sag in the East China Sea Basin (Figure 1A,B) [25,32,33], its tectonic evolution comprises three main stages: an initial rifting phase, a post-rift thermal subsidence (depression) stage, and a subsequent regional subsidence stage, resulting in an overall deep burial of the strata. Under the influence of multistage tectonic evolution, the Xihu Sag developed a structural pattern consisting of two depressions flanking a central uplift, with pronounced east–west zoning and north–south compartmentalization [34,35]. From west to east, the Xihu Sag is subdivided into five secondary structural units: the West Slope Belt, the West Sub-Sag, the Central Anticlinal Belts, the East Sub-Sag, and the East Fault Belt (Figure 1C) [36,37]. The study area is located in the south-central region of the Central Anticlinal Belt of the Xihu Sag, including the FN well area and FS well area, is linearly distributed from southeast to northwest, and is a typical petroliferous structure in the Xihu Sag.

2.2. Stratigraphy and Sedimentology

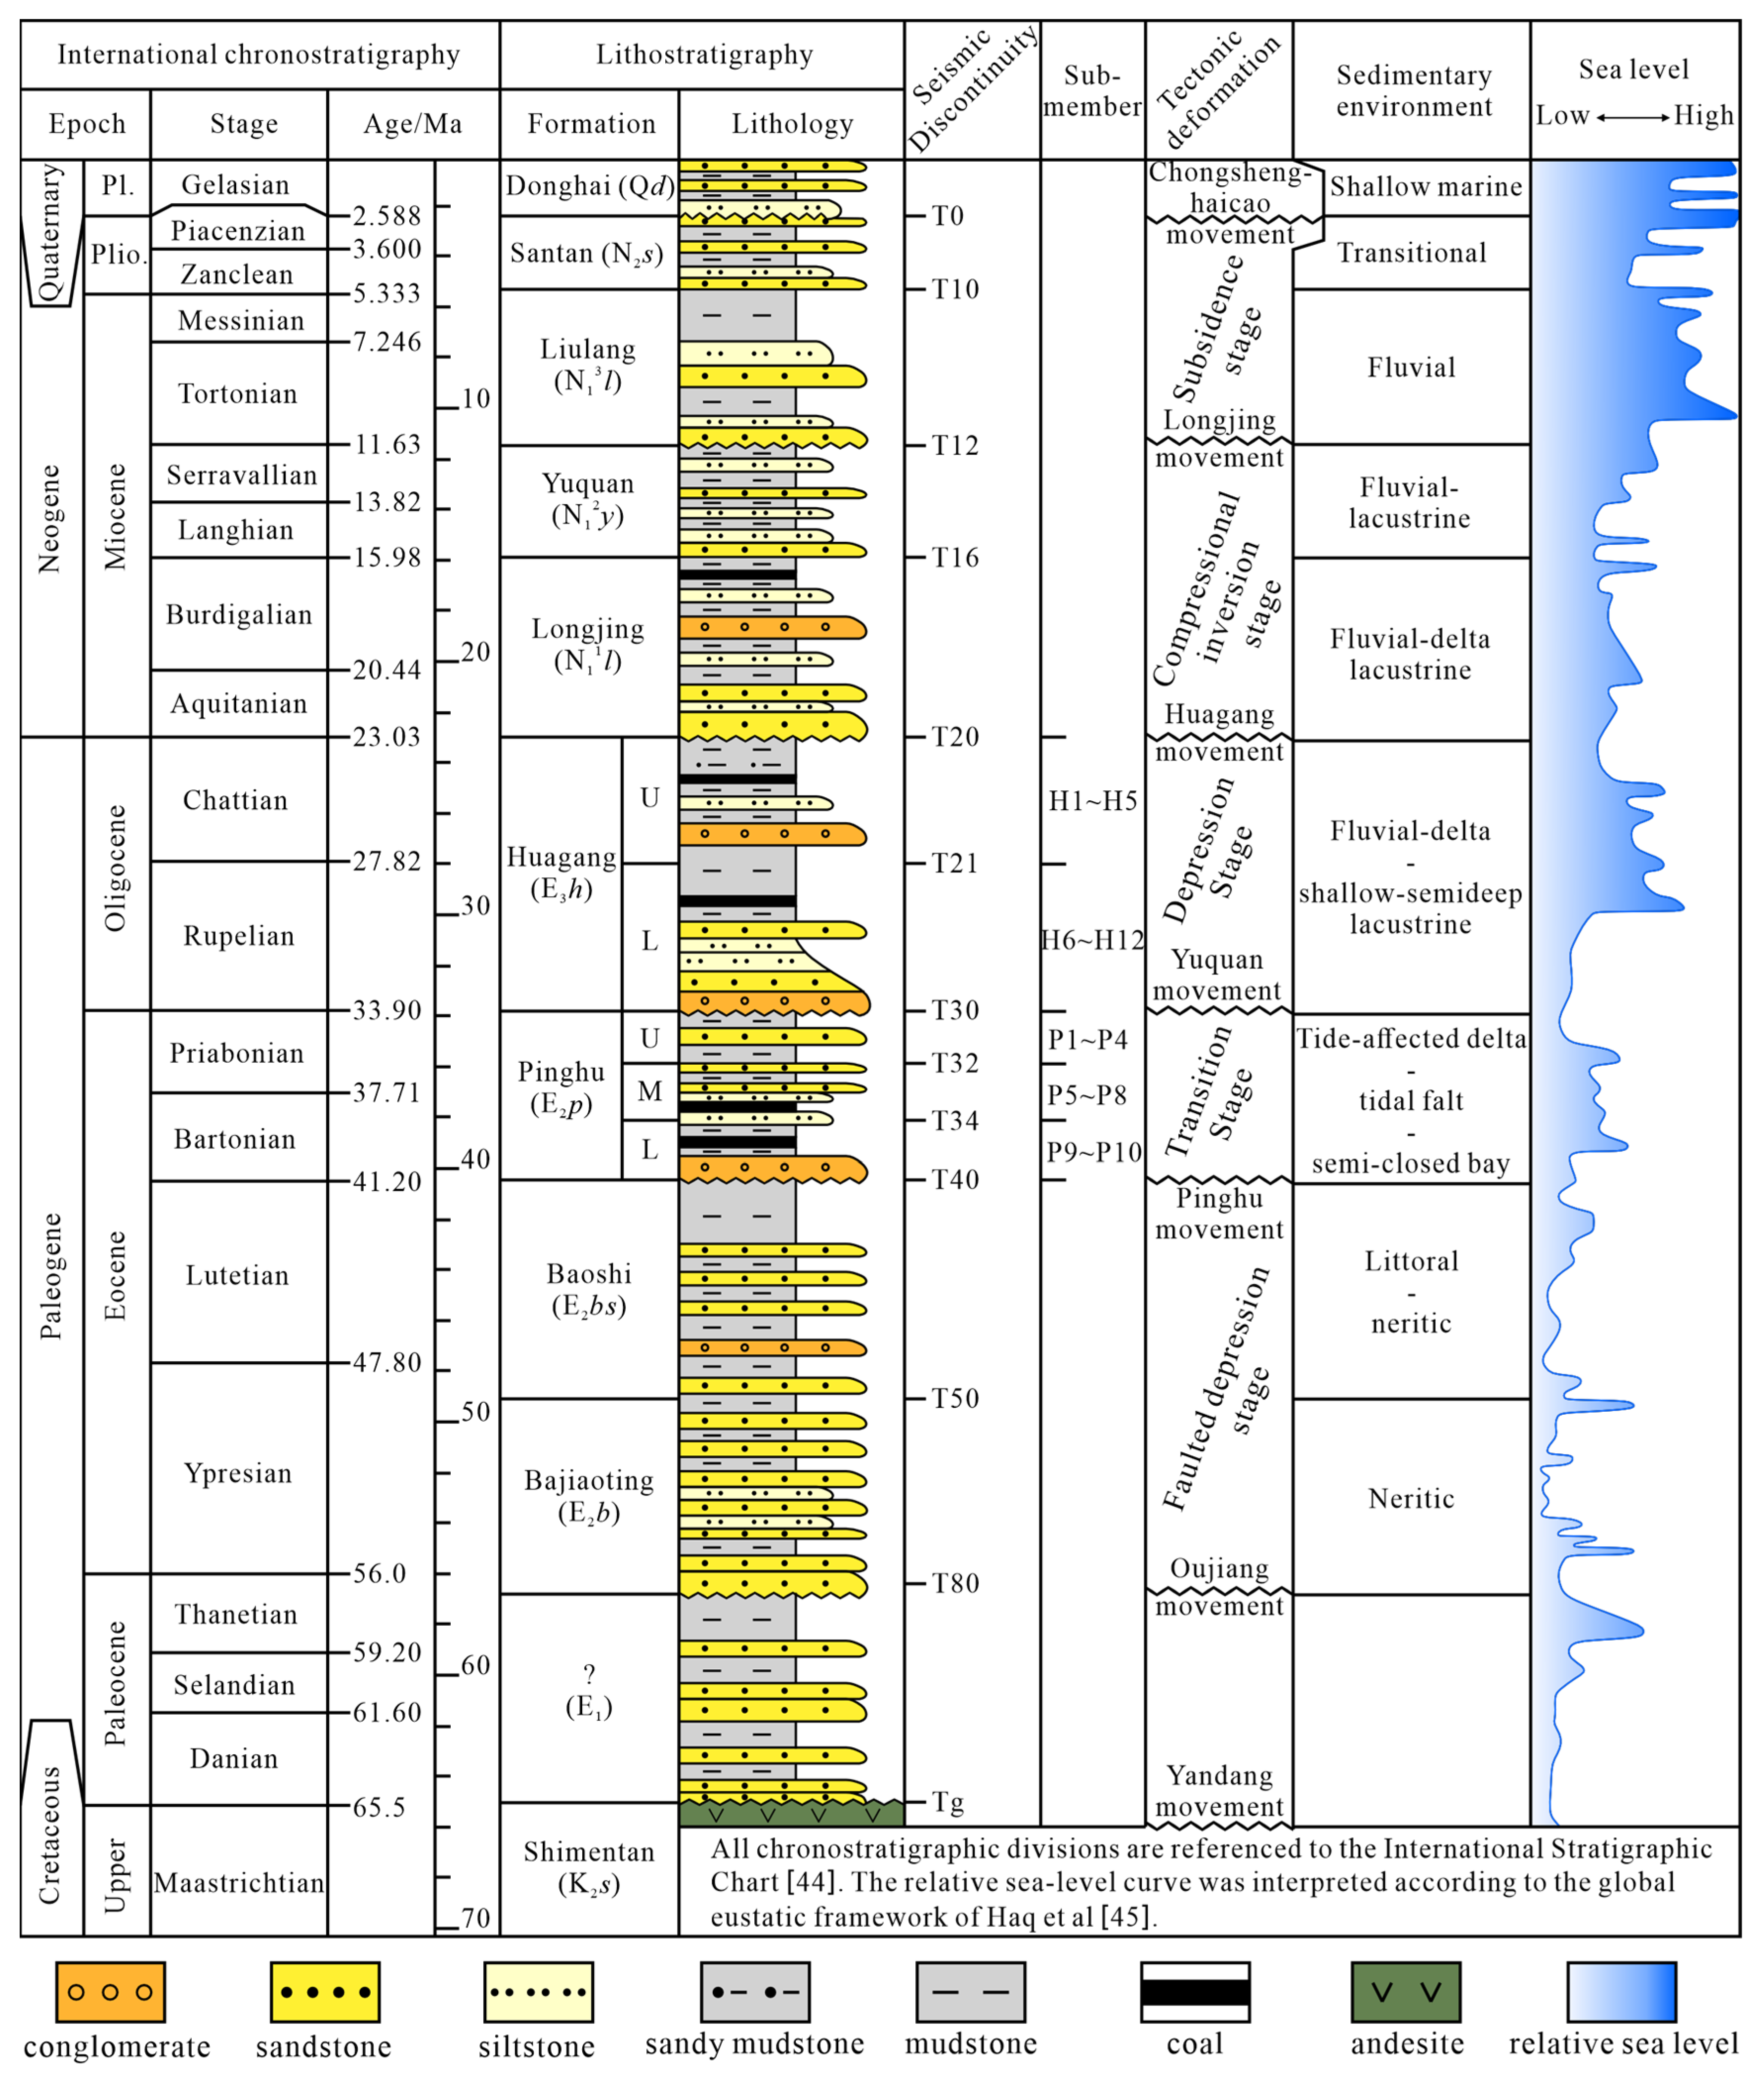
The Xihu Sag contains a sedimentary sequence from the Paleocene to the Quaternary, including, in ascending order, the Paleocene, Eocene (Bajiaoting, Baoshi, and Pinghu formations), Oligocene Huagang Formation, Miocene (Longjing, Yuquan, and Liulang formations), Pliocene Santan Formation, and Quaternary Donghai Formation [21]. This study focuses on the Oligocene Huagang Formation, the primary reservoir-caprock assemblage, which was deposited in a NE-SW trending braided river-delta-lacustrine system with sediments mainly derived from the Hupi Reef Uplift (metamorphic rocks), and subsidiarily from the Diaoyu Islands Folded-Uplift Belt, Yushan Uplift (magmatic rocks), and Haijiao Uplift (metamorphic rocks) [22,24,38]. Based on seismic characteristics, the formation is subdivided into an Upper Member and a Lower Member at the T21 interface (Figure 2), comprising 12 sandstone intervals (H1–H12); intervals H1–H5 belong to the Upper Member, and H6–H12 to the Lower Member. The Upper Member is characterized by a regional, thick mudstone seal at its top [39], underlain by heterogeneous, stacked braided river sandstones that form the principal reservoirs. In contrast, the Lower Member is separated by local mudstone caps of poorer quality and features heterolithic bedding in its lower part. The coal-bearing Eocene Pinghu Formation [40], deposited in a lacustrine-deltaic environment beneath the Huagang Formation, serves as the major source rock and entered its main hydrocarbon generation phase in the Miocene [41]. Regarding burial history, the area experienced four principal stages: slow burial, rapid burial, transient tectonic uplift, and regional stable subsidence, with the Huagang Formation sandstones exceeding 3000 m depth during the rapid burial stage [42].
Figure 1. (A) Geographical location of the East China Sea Shelf Basin; (B) secondary tectonic units of the East China Sea Basin; (C) secondary tectonic units of the Xihu Sag and main drilling sites in the area (Figure 1C is modified from [43]).
Energies 19 00238 g001
Figure 2. Comprehensive stratigraphic column diagram of the Xihu Sag (modified from [42,44,45]; U, upper member; M, middle member; L, lower member). Note: The question mark (?) following the “E1” unit indicates that the formal stratigraphic name for this Paleocene interval has not been established in the published literature.
Energies 19 00238 g002

3. Samples and Methods

3.1. Samples

Sandstone samples from the H3 to H11 sublayers of the Huagang Formation within the Central Anticlinal Belt of the Xihu Sag served as the primary study material. Cores from nine representative wells—FN2, FN4, FN6, and FN9 in the northern (FN) area, and FS1, FS2, FS3, FS4, and FS5 in the southern (FS) area—were selected based on “sweet spot” identification. Representative cores and lithic fragments from depths of 3400–4400 m were analyzed. The suite of analytical techniques included: thin-section identification, scanning electron microscopy (SEM), mineral analysis via TESCAN Integrated Mineral Analyzer (TIMA), petrophysical testing, clay mineral analysis via X-ray diffraction (XRD), cathodoluminescence, fluid inclusion analysis, and C–O isotope testing. These data were integrated with additional drilling analysis data from the Shanghai Branch of CNOOC to investigate regional diagenetic pathways and pore evolution. Well locations are shown in Figure 1C.

3.2. Experimental Methods

Standard petrographic methods were employed. A total of 406 thin sections were prepared from core samples vacuum-impregnated with blue epoxy resin. Point-counting was used to determine mineral proportions and plane porosity. Selected samples were stained with alizarin red S to identify carbonate minerals. Grain size analysis was conducted using a Malvern Mastersizer laser diffraction particle size analyzer (Malvern Panalytical Ltd., Malvern, UK).
Petrophysical properties (porosity and permeability) were measured using standard core analysis equipment (mercury porosimeter, permeability meter) at the State Key Laboratory of Oil and Gas Reservoir Geology and Exploitation, Chengdu University of Technology.
Field-emission SEM (FEI Quanta FEG 650; FEI Company, Hillsboro, OR, USA) was used for micromorphology observation and EDS analysis. Samples were prepared by mechanical and argon-ion polishing followed by carbon coating [46,47,48].
Automated mineralogy and pore structure analysis were performed using a TIMA (TESCAN MIRA3 SEM; TESCAN, Brno, Czech Republic) at Guangzhou Tuoyan Analytical Technology Co., Ltd. (Guangzhou, China). Operational parameters included an acceleration voltage of 25 kV and a pixel size of 3 μm.
Clay mineral identification and quantification were conducted via XRD (Bruker D8 Discover; Bruker, Billerica, MA, USA) using the K-factor method on size-fractionated (<2 μm, <10 μm) samples [49].
Fluid inclusion microthermometry (homogenization and freezing temperatures) was performed using a Linkam THMS600 stage (Linkam, Redhill, UK). Inclusion composition was analyzed via confocal Raman microscopy (LabRAM HR Evolution; HORIBA, Kyoto, Japan) and fluorescence spectroscopy. Carbon and oxygen isotope compositions of carbonate cements were determined using an offline phosphoric acid digestion method followed by analysis on a Thermo Fisher MAT252 mass spectrometer (Thermo Fisher Scientific, Waltham, MA, USA).
The principal experimental techniques, sample counts, and relevant analytical sections for both the FN and FS areas are provided in Table 1.

4. Results

4.1. Petrological Characteristics of the Clastic Reservoir

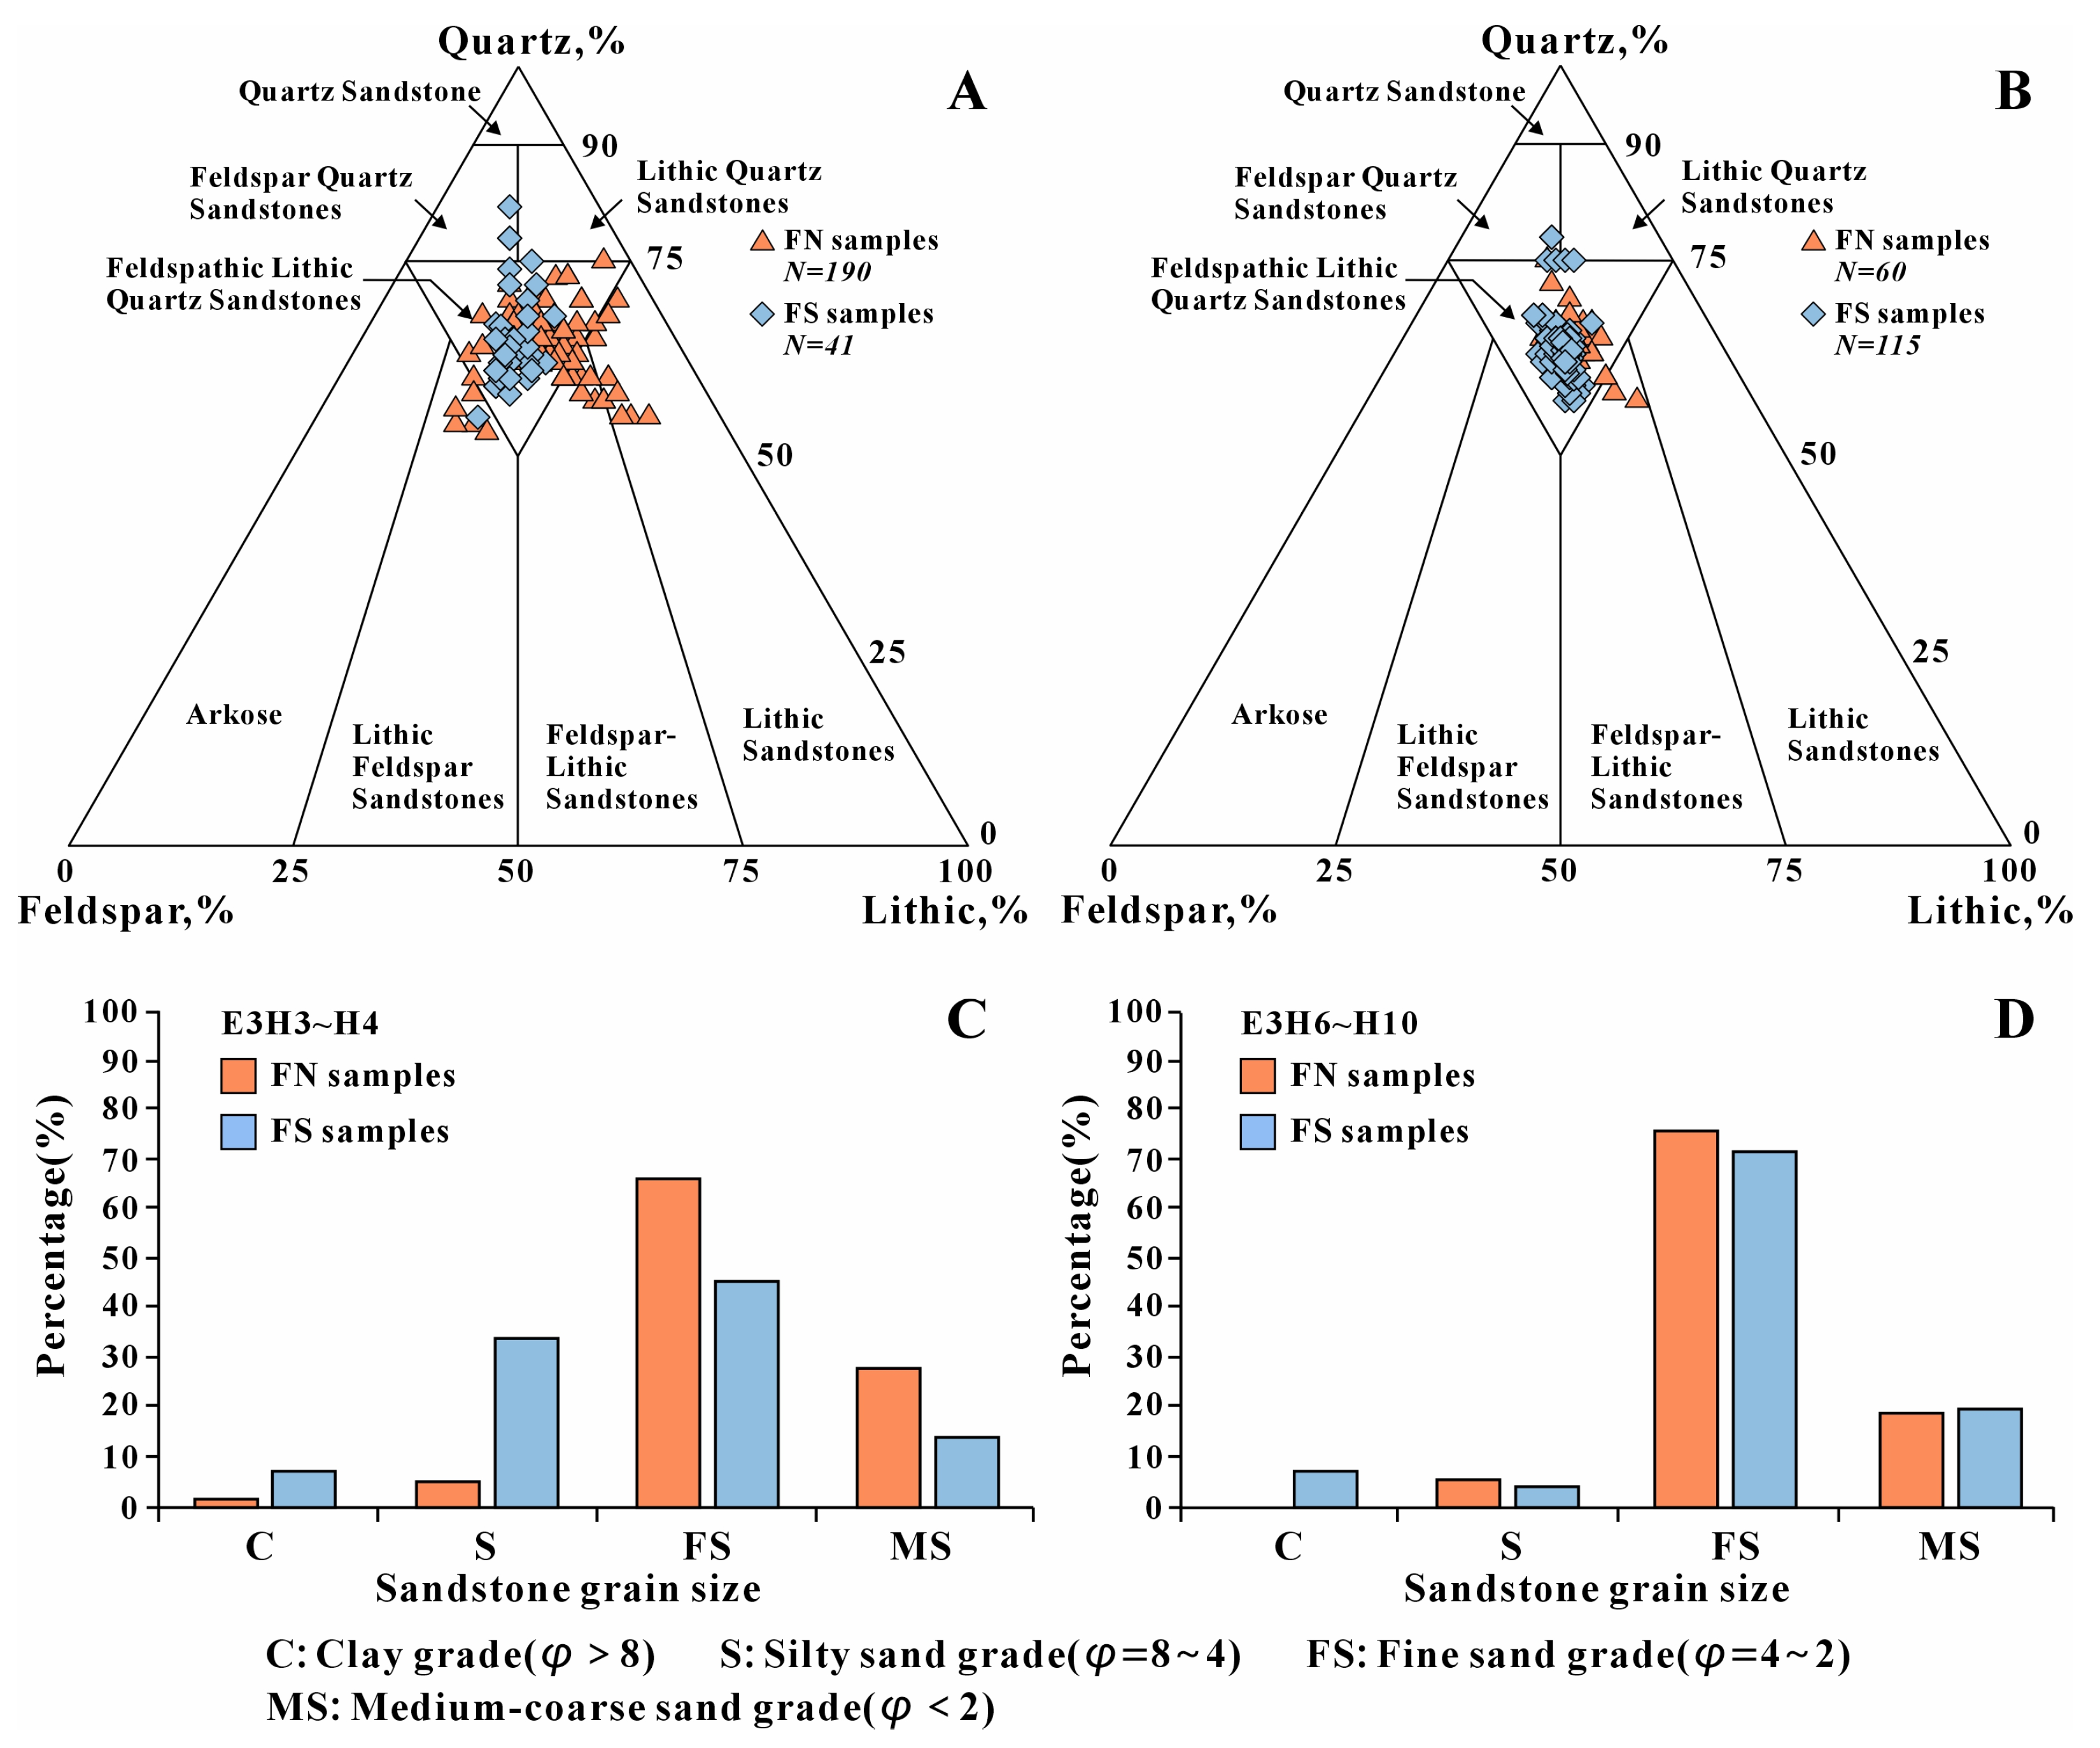
Microscopic observations of 406 rock sections of the Huagang Formation reveal that the volume fraction of quartz in the terrigenous clastic components of the Upper Member of the Huagang Formation (mainly H3–H4 sublayer samples) is 53–82%, with an average of 64.40%; the volume fraction of feldspar ranges from 3 to 30%, with an average of 15.84%, and plagioclase is slightly more abundant than potassium feldspar; and the volume fraction of rock fragments ranges from 8 to 37%, with an average of 19.81%. Igneous rock fragments are dominant, followed by metamorphic rock fragments, and small amounts of sedimentary rock fragments and volcanic tuff materials are present. The quartz volume fraction in the terrigenous clastic components of sandstone from the Lower Member of the Huagang Formation (primarily H6–H10 sub-layer samples) ranges from 57 to 78%, with an average of 64.23%; the volume fraction of feldspar is 11–21%, with an average of 17.49%; and plagioclase is slightly more abundant than potassium feldspar; the volume fraction of rock fragments ranges from 10 to 30%, with an average of 18.29%. Metamorphic and igneous rock fragments are dominant, with small amounts of sedimentary rock fragments. Overall, the volume fractions of quartz, feldspar, and rock fragments in the Upper and Lower Members of the Huagang Formation are relatively close, and the volume fraction of feldspar in the Lower Member of the Huagang Formation is relatively high. In accordance with the traditional classification and naming principles of sandstone [50], the sandstones in the Lower Member of the Huagang Formation are dominated by feldspar-lithic quartz sandstones (83.94%), and the proportions of feldspar-lithic sandstones (5.96%), lithic sandstones (5.05%), lithic feldspar sandstones (3.21%), feldspar quartz sandstones (1.38%), and lithic quartz sandstone (0.46%) are relatively low (Figure 3A). The sandstones in the Lower Member of Huagang Formation are dominated by feldspar lithic quartz sandstone (93.45%), and the proportions of feldspar quartz sandstone (2.98%), feldspar lithic sandstone (2.38%), and lithic quartz sandstone (1.19%) are relatively low (Figure 3B).
Affected by the sedimentary environment of high-energy meandering channels and braided channels, the gas-bearing sections of the Huagang Formation contain relatively low amounts of sandstone argillaceous clay matrix. The particles are classified according to the particle size: φ > 8 is the clay grade, φ between 4 and 8 is the silty sand grade, φ between 2 and 4 is the fine sand grade, and φ < 2 is the medium-coarse sand grade [42]. According to the grain size, the clastics in the H3–H4 sublayers of the Upper Member of the Huagang Formation are mainly fine sands, followed by moderately coarse sands (Figure 3C). In the north (FN) area, the sorting is moderate, the roundness is subangular–subrounded and subrounded–subangular, the primary support is from particles, and the point-line contact is the predominant contact relationship, followed by line concavity contact. In the southern (FS) area, the proportion of silty sand-grained particles is relatively high, the sorting is good, the roundness is subangular–subrounded, the primary support is from particles, and the point–line contact is the predominant contact relationship.
According to the grain size, the clastic particles in the H6–H10 sublayers of the Lower Member of the Huagang Formation are mainly fine sands, with a small number of medium-coarse sands (Figure 3D). In the north (FN area), the sorting is moderate, the roundness is subangular–subrounded, the primary support is from particles, and the line concavity contact is the predominant contact relationship. In the southern (FS) area, the sorting is good, the roundness is subangular–subrounded and subrounded–subangular, the primary support is from particles, and the point–line contact and line–concavity contact are the predominant contact relationships. Microscopic observation reveals that the cements in the reservoirs of the Huagang Formation are mostly siliceous, calcite, and kaolinite. The cementing type is dominated by contact–compression cementation, followed by contact cementation. The matrix content in sandstone generally falls below 15%, which meets the standard of clean sandstone and is conducive to the preservation of primary reservoir space [25]. The maturity of the sandstone components is relatively low (Q/(F + R)). The component maturity of the H3–H4 sublayers of the Upper Member of the Huagang Formation is between 1.13 and 4.56, with an average of 1.85 and a median of 1.86, and the component maturity of the H6–H10 sublayers of the Lower Member of the Huagang Formation is between 1.33 and 3.55, with an average of 1.83 and a median of 1.78. The maturity of the components in the Lower and Upper Members of Huagang Formation does not change significantly, indicating that the direction of the provenance supply does not change much. Low component maturity indicates that unstable feldspars are retained in a great quantities, which belongs to near-source sedimentary systems [51].

4.2. Pore Types and Petrophysical Characteristics

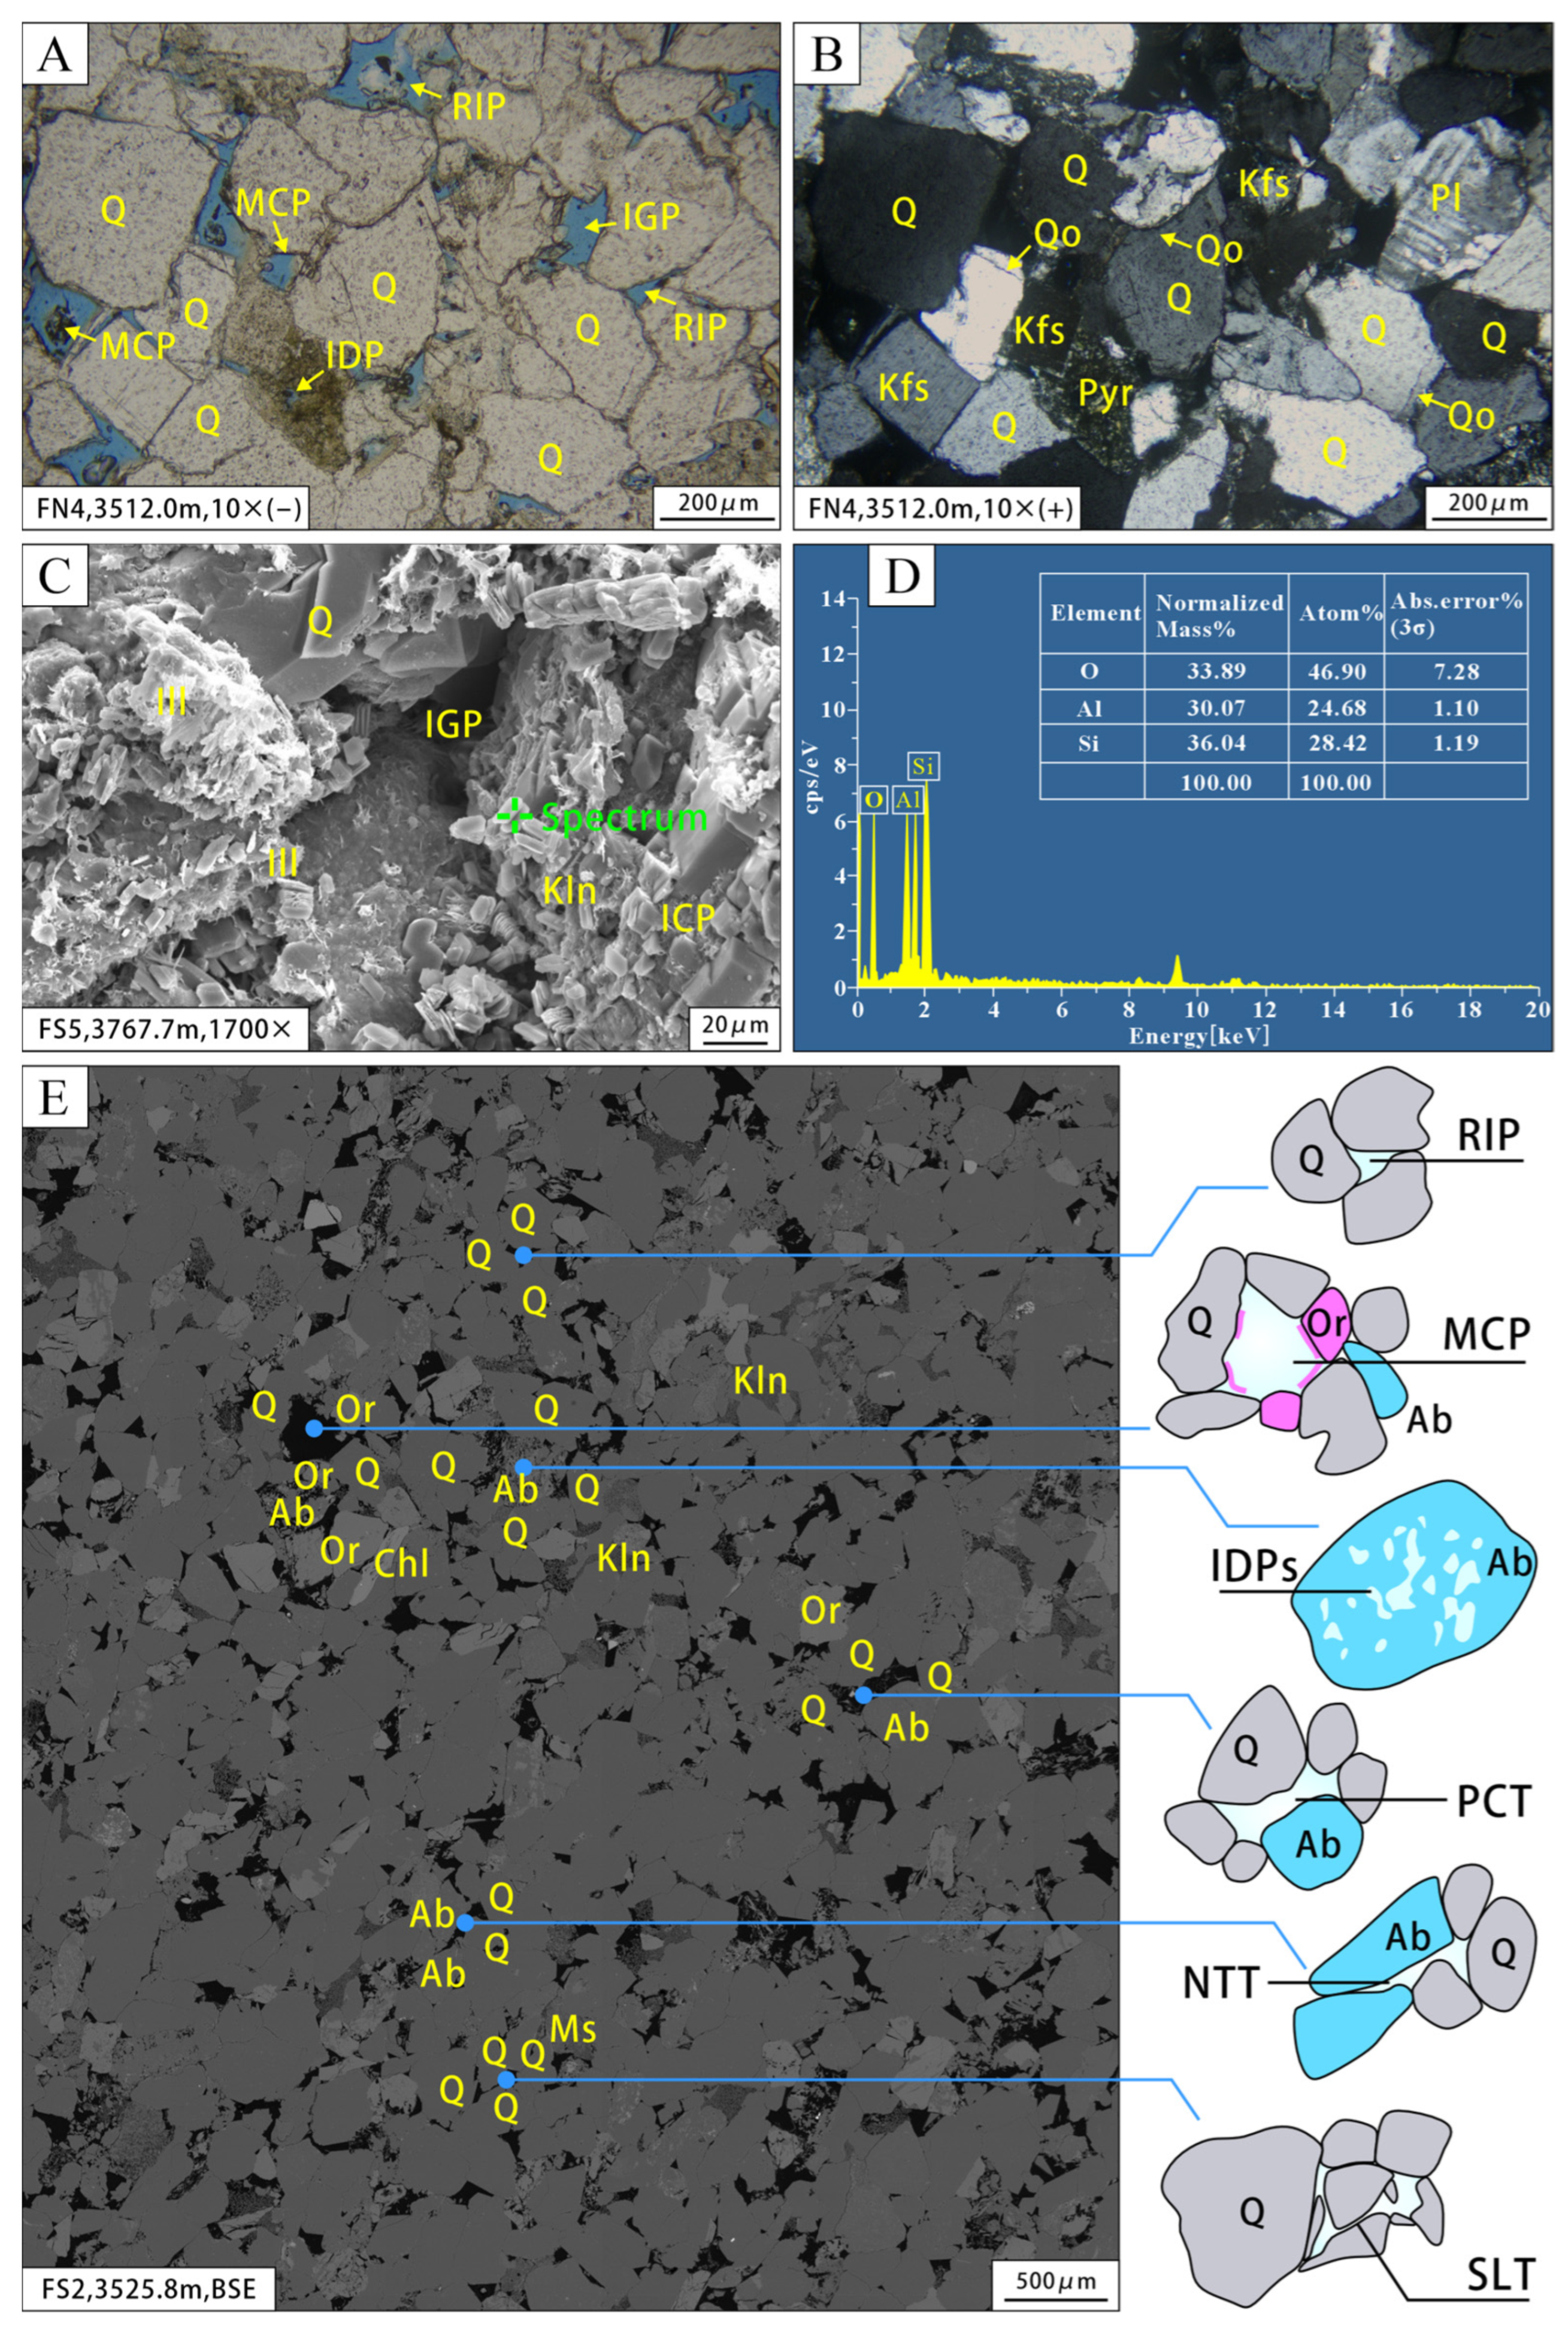
Thin-section identification and SEM clarified the pore types that mainly provide reservoir space in the reservoirs of the Huagang Formation: residual primary intergranular pores (RIPs), intergranular pores (IGPs), intergranular dissolution pores (IDPs), and mold cavity pores (MCPs). Primary IGPs are formed between clastic grains during the sedimentary process and are often reduced by compaction or partially or completely filled by cements. The currently observed pores are mainly RIPs and secondary dissolution pores. The RIPs are triangular or polygonal, with straight edges and nonuniform distributions (Figure 4A). The secondary pore types are primarily IDPs (Figure 4C) and intragranular dissolution pores. There are two main types of intragranular dissolution pores: feldspar dissolution pores and lithic dissolution pores (Figure 4B,E). Feldspar dissolution pores are characterized by dissolution along the cleavage planes of parenchymal feldspar and albite. The lithic dissolution pores consist of small caverns in acidic volcanic clastics and metamorphic clastics. When the clastic grains are completely dissolved, MCPs are formed. Under a microscope, only the contours of the original grains and the residual insoluble components are visible. There are relatively few MCPs, but they are usually large in size (Figure 4A). In addition, intercrystalline pores (ICPs) are present mainly between authigenic kaolinite crystals and illite and kaolinite particles (Figure 4C,D), and this type of pore provides relatively little reservoir space and is relatively small in diameter (<1.0 μm).
The high-quality reservoirs of the Huagang Formation feature four main types of throats, including sheet-like throats, neck-type throats, pore-contracted throats (Figure 4E), and bundle throats. Sheet-like throats are a common throat type in deep reservoirs, characterized by a small radius and a flat, straight shape. As the intensity of compaction continues to increase, when the clastic grains of the reservoirs exhibit point–line contact or concavity contact, the free silica generated by compaction and dissolution processes could form secondary overgrowths around clastic quartz grains, continuously filling pores and maintaining close contact between clastic particles, which leads to the formation of sheet-like throats at the interface between cement and clastic grains. Sheet throats are generally connected in the rock but are often discontinuous in the 2D backscattering plane (BSE), suggesting heterogeneous connectivity. A sheet throat with a curved shape is referred to as a curved sheet-like throat, which has a small radius, a long length, and good connectivity to intergranular pores. Neck-type throats are developed mainly near the point contact of two mineral grains, the throat radius is relatively small, and the length is limited. The pores on both sides are connected by extremely short, narrow throats, primarily formed by brittle mineral supports under relatively weak compaction. Pore-contracted throats are formed mainly by the local shrinkage of pores caused by the compression of mineral particles. Pore-contracted throats are generally large, the difference between the throat radius and pore radius is not significant, and they develop mainly between relatively large intergranular pores. Bundle throats are fine throats, which are observed under SEM. Bundle throats have small radii and long lengths, similar to water tubes. This type of throat has good continuity and strong resistance to damage and is a high-quality long-distance connecting channel. In addition, a small number of unconnected throats develop within the deep reservoir, isolated between mineral grains. These throats are left behind on the contact surfaces of mineral particles under compaction, and the close contact formed when mineral particles are intensely compacted blocks the connection between the throats and the external environment.
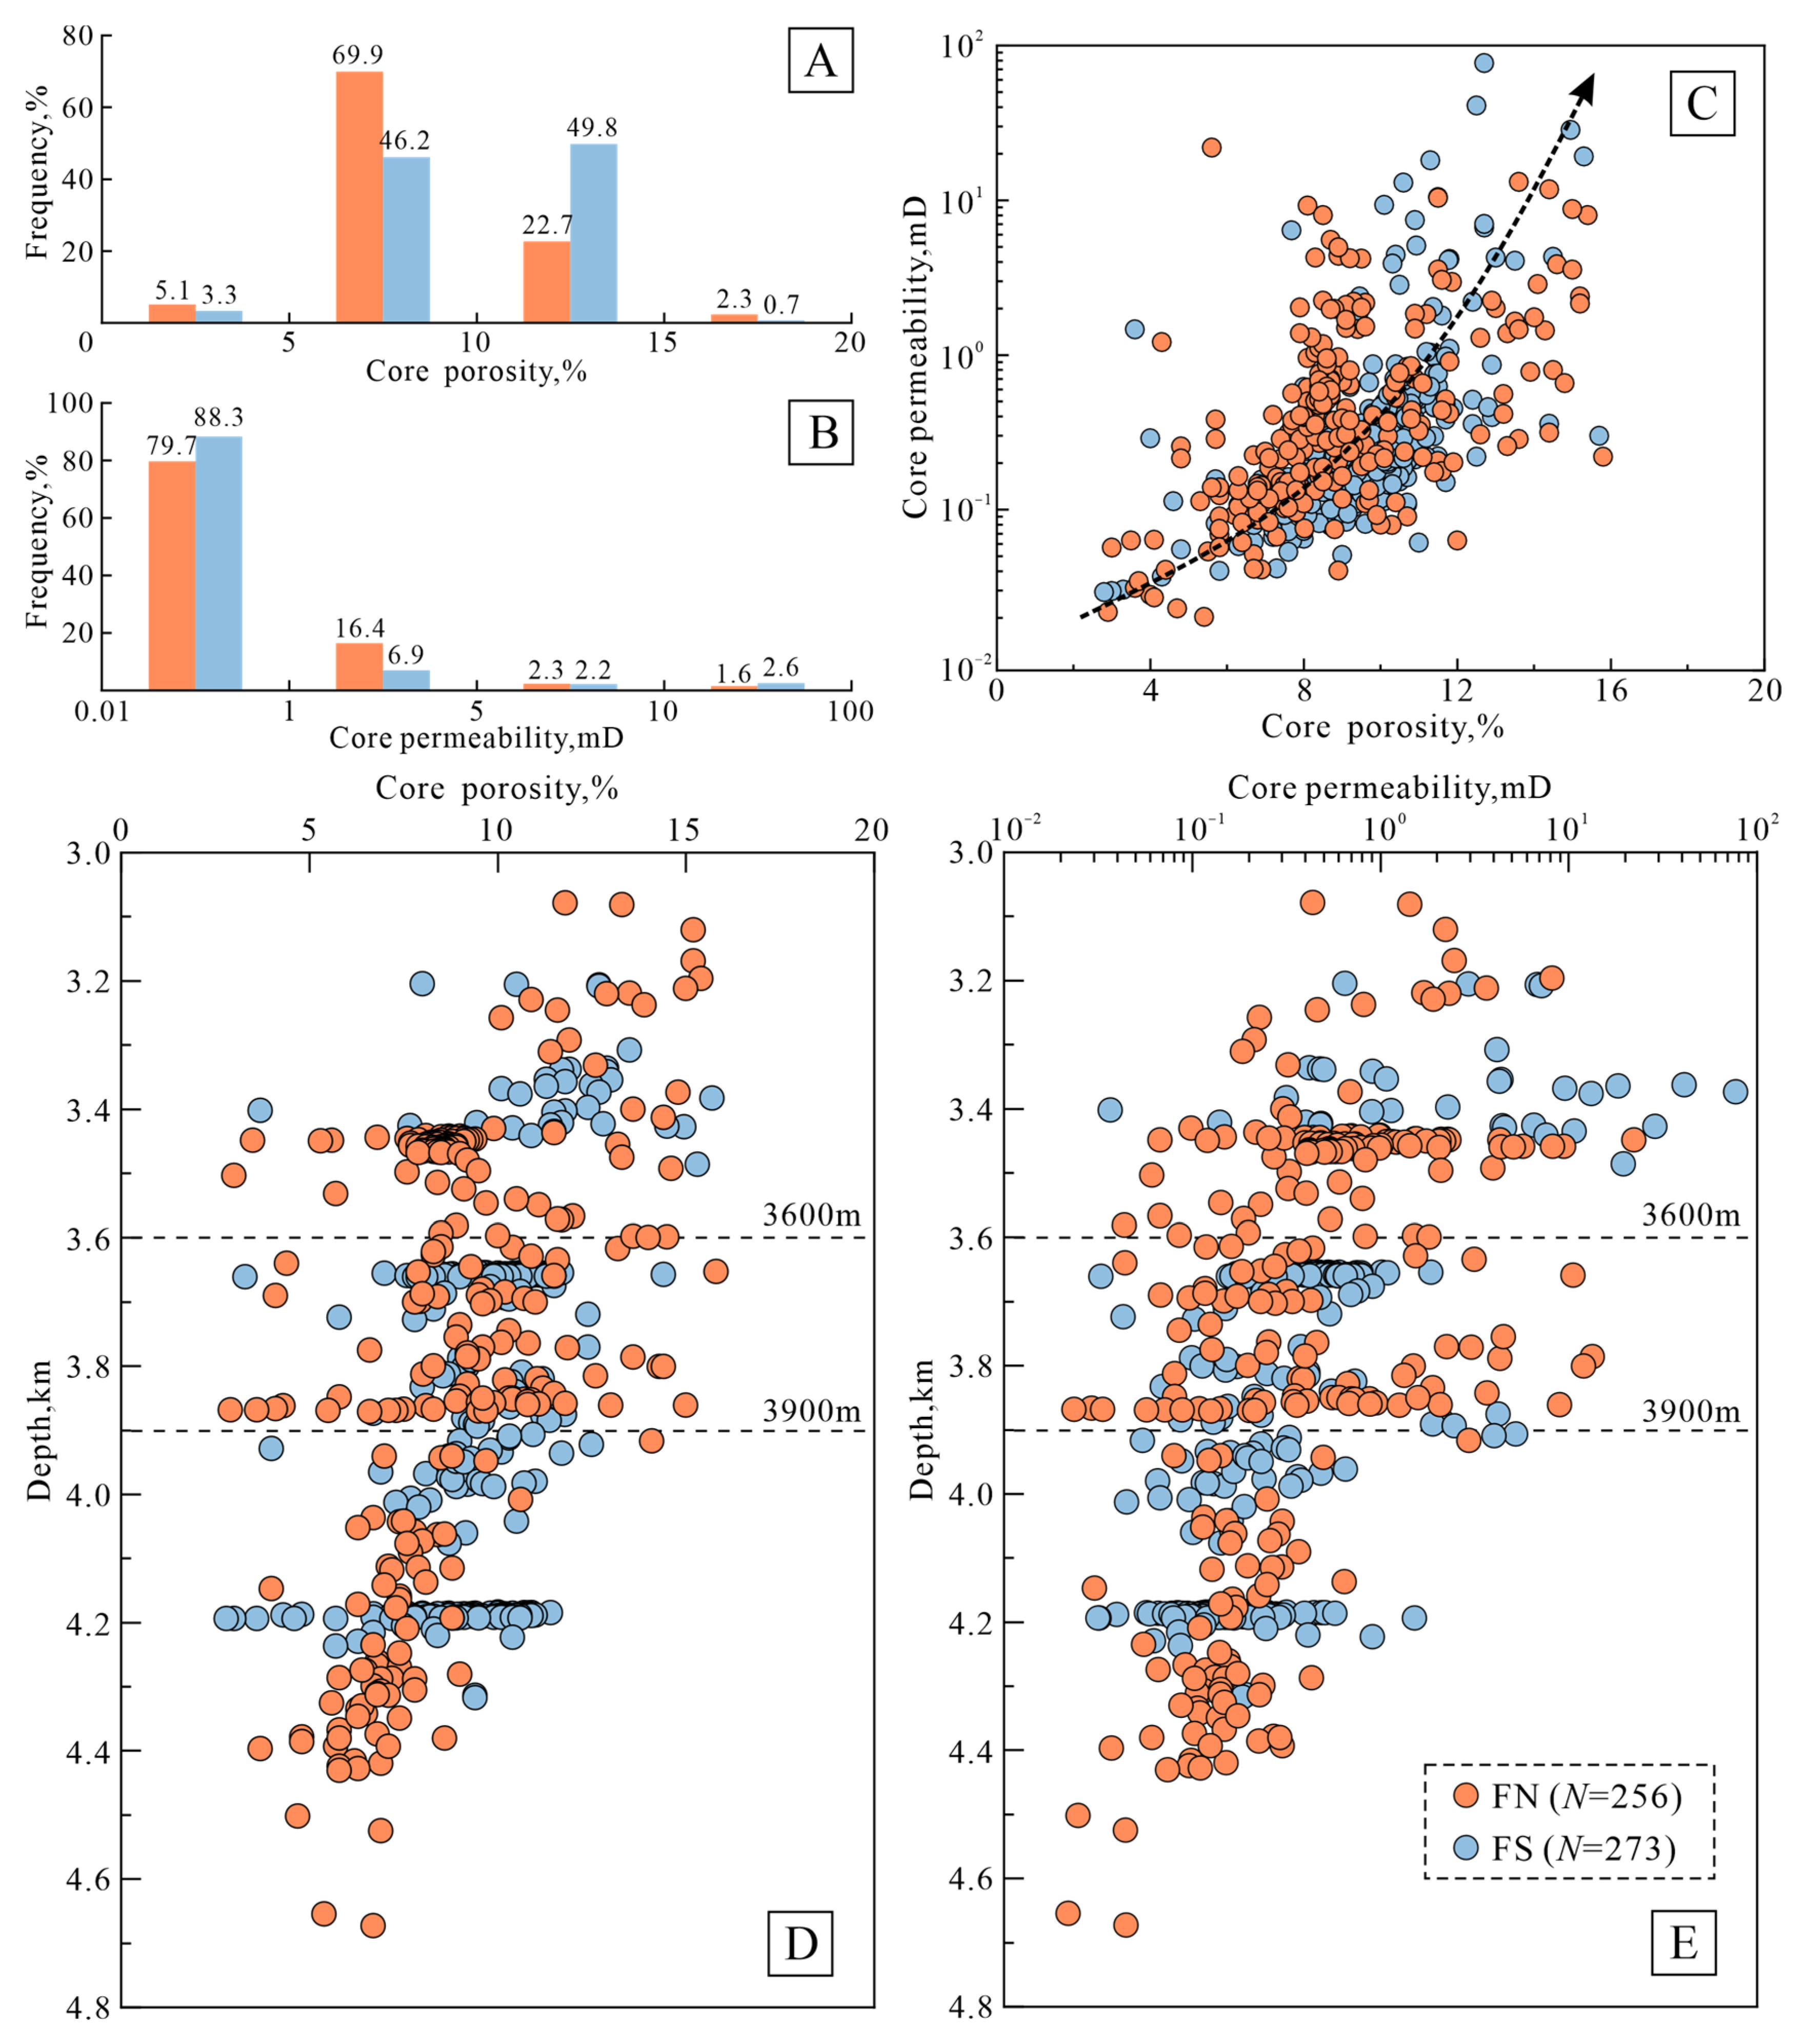
The statistical results of the measured petrophysical characteristics data of 529 rock cores from 8 wells indicate that the reservoir porosity of the Huagang Formation in the Central Anticlinal Belts is mainly in the range of 5–15%, with an average of 9.29% and a maximum of 15.8%. There is a difference in reservoir porosity between the northern (FN) area and the southern (FS) area. The porosity of the FN area is mainly 5–10%, and that of all the samples is in the range of 2.9–15.8%, with an average of 8.86%. The FS area exhibits a 10–15% increase in overall porosity compared to the FN area, with all samples ranging from 2.8 to 15.7%, with an average of 9.69% (Figure 5A).
There is little difference in the permeability of the Huagang Formation between the northern (FN) area and the southern (FS) area, and the overall permeability is 0.01–1 mD. The permeability of the FN area ranges from 0.22 to 22.2 mD, with an average of 1.03 mD. The permeability of the FS area ranges from 0.03– 77.2 mD, with an average value of 1.36 mD (Figure 5B). The porosity and permeability of reservoirs are positively correlated (Figure 5C). Fractures are undeveloped and are distributed mainly in rocks with low porosity. The overall reservoir is a pore-type reservoir, and secondary dissolution pores are the main seepage pathways for fluids. Tight reservoirs are typically defined as having air permeability below 1.0 mD and porosity below 10% [52]. Therefore, in the Central Anticlinal Belt of the Huagang Formation, there are low-porosity and low-permeability reservoirs in the range of 3500–4400 m, and the deep sandstone reservoirs (>4400 m) have largely become compacted (Figure 5D,E). Vertically, the porosity and permeability of the FN area decrease faster with increasing burial depth. At the same depth, the petrophysical characteristics of the reservoir in the FS area are relatively high. However, within the 3600–3900 m range, the FN area exhibits a strong dissolution belt (sweet spot section), where petrophysical characteristics of the reservoir are relatively better (Figure 5D,E).

4.3. Micropore and Throat Characteristics

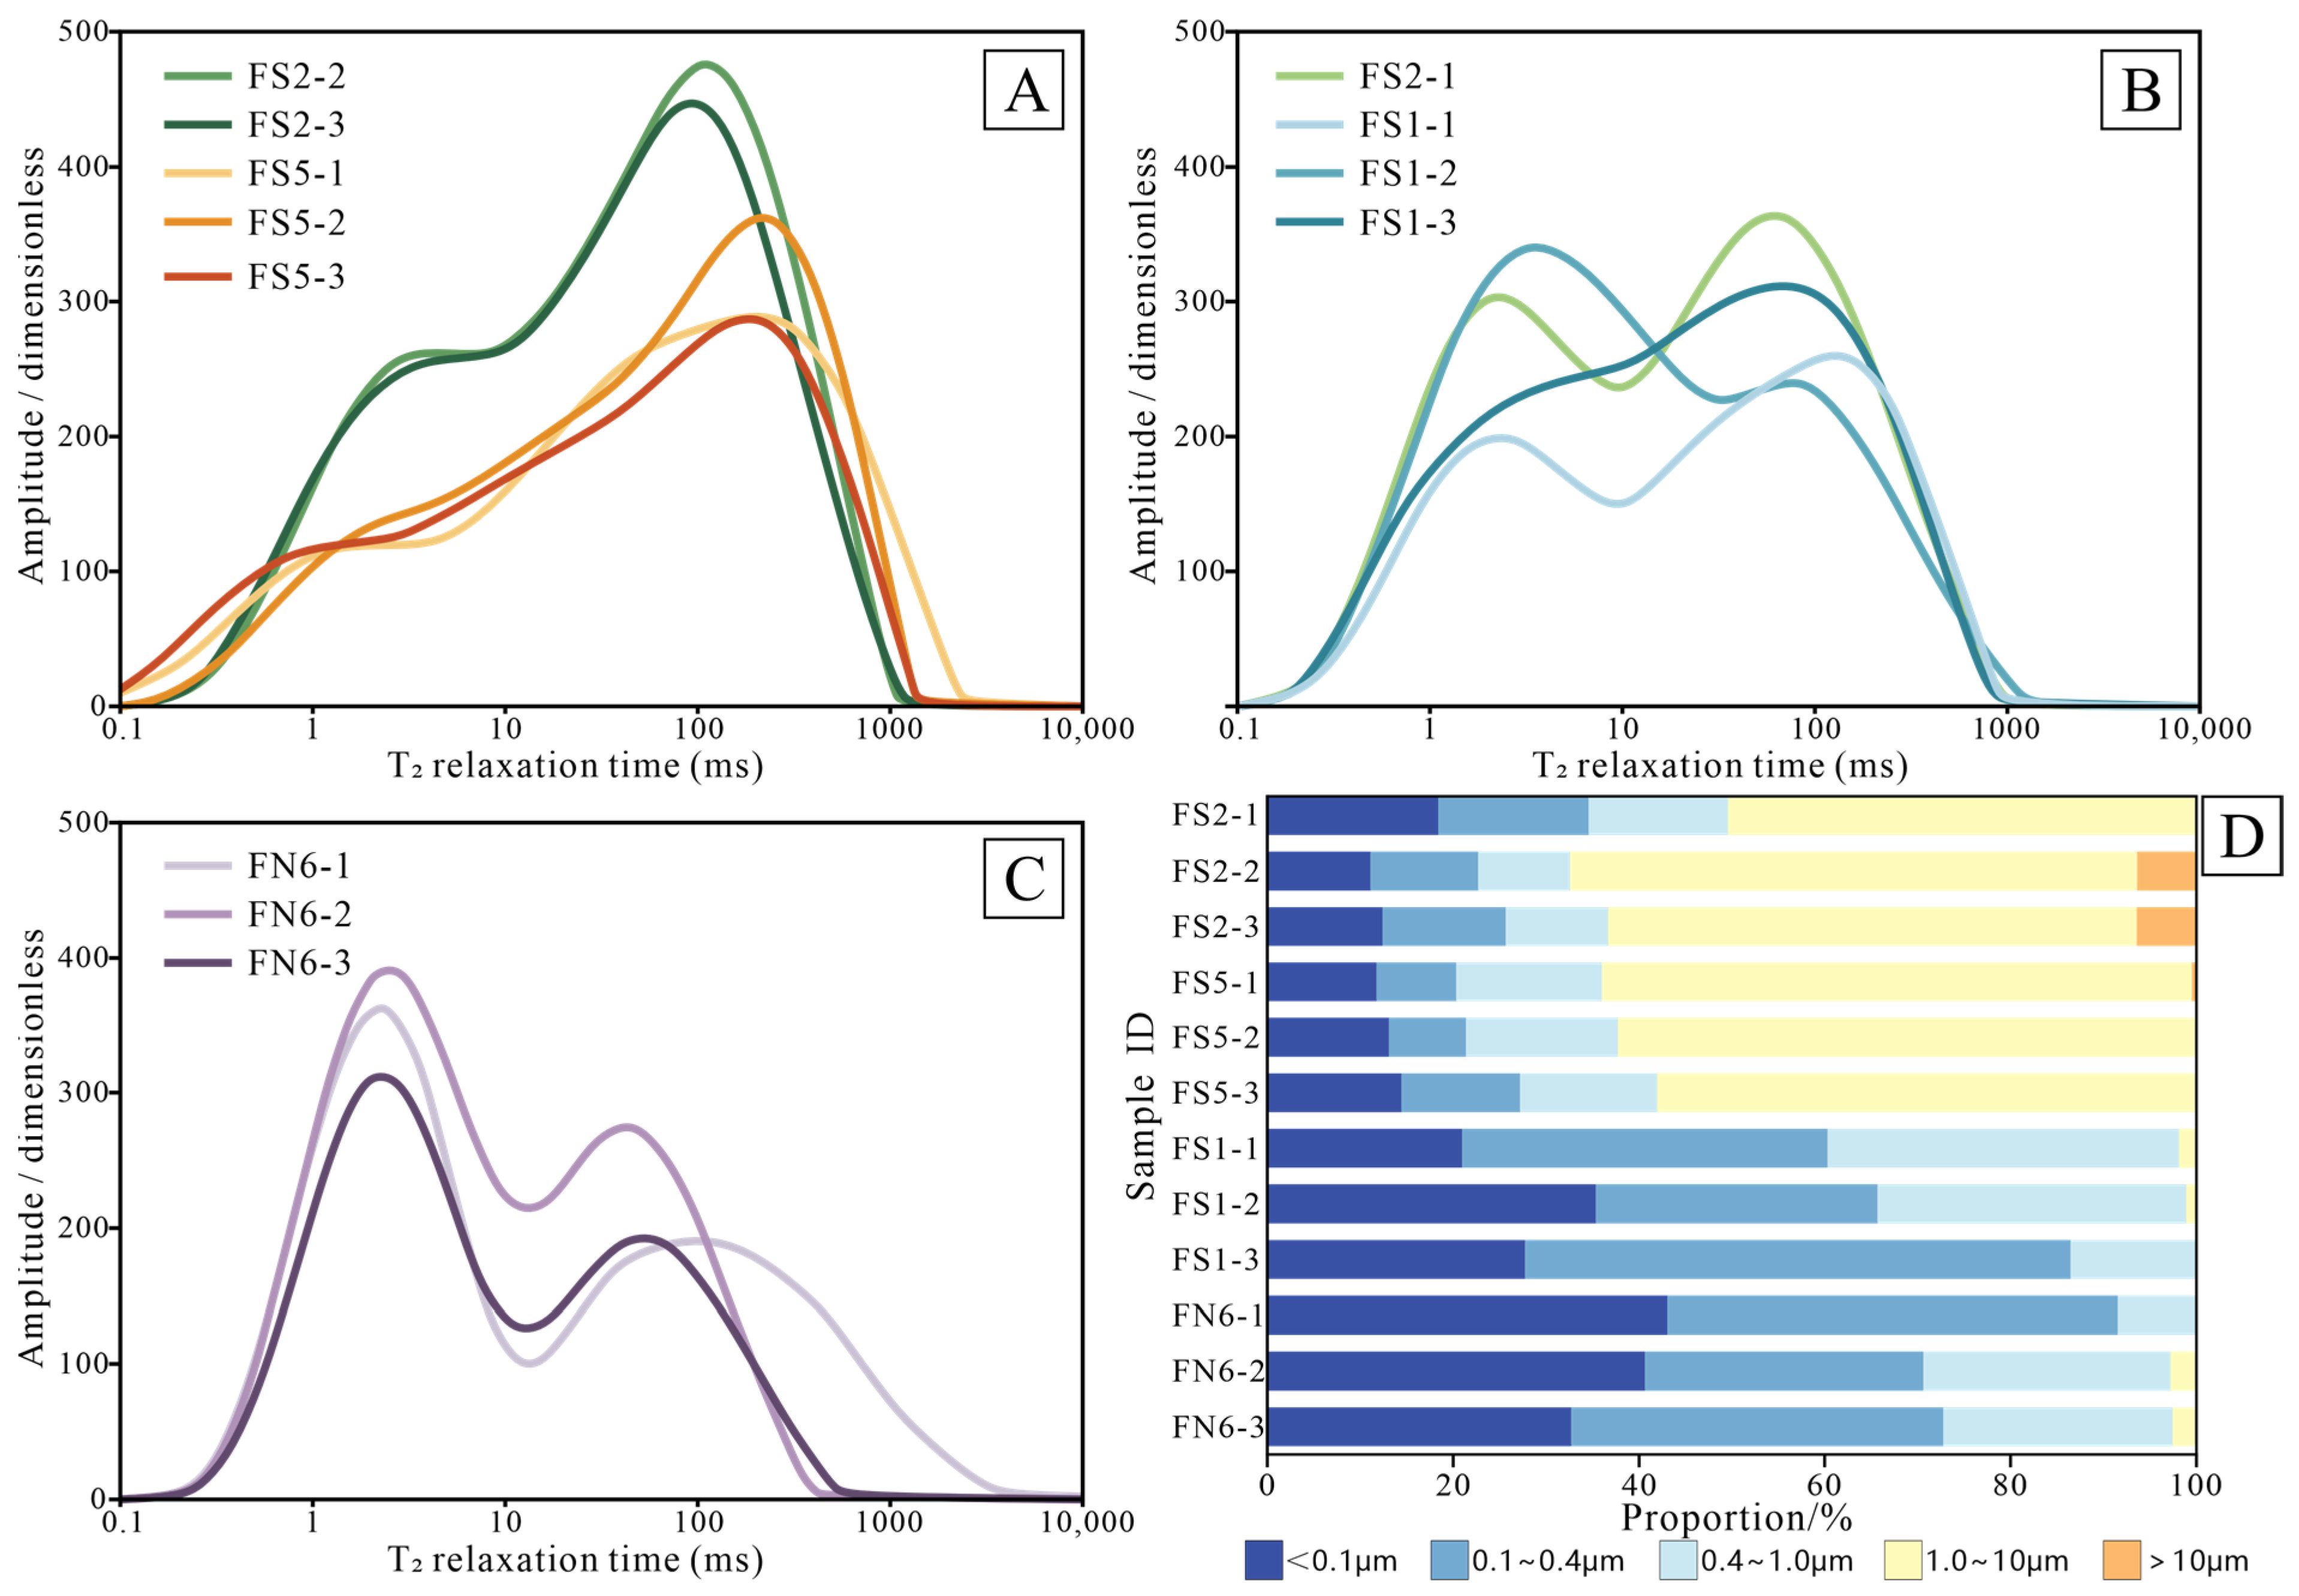
NMR technology can detect information related to rock pore structure and pore fluid by measuring the amplitude and rate of the NMR relaxation signal of hydrogen nuclei in rock pore fluid, which can characterize the distribution of pores of different sizes; a larger pore size corresponds to a larger T2 value [53]. The detailed pore structure parameters are shown in Table 2. The T2 spectral distribution of deep fine-grained sandstone samples in the study area is shown in Figure 6. The overall distribution of T2 values is wide, ranging from 0.1–10,000 ms, and the morphology shows a “double-peak” feature, with the left peak between 1 and 10 ms and the right peak between 10 and 1000 ms. The morphologies of the T2 spectral curves of the samples can be roughly divided into three types. Type I pore structure develops double peaks low on the left and high on the right (Figure 6A), indicating that this type of pore structure is dominated by relatively large pores. The T2 spectrum of the type II pore structure has nearly symmetrical double peaks, and the double peak morphology is not prominent, indicating that this type of pore structure has similar proportions of large and small pores. The type III pore structure has double peaks on the left and right, and the nuclear magnetic signal intensity of the left peak is slightly greater than that of the right peak, indicating that the type III pore structure is dominated by relatively small pores. Vertically, with increasing burial depth, the Huagang Formation reservoirs show a systematic increase in bound fluid saturation and a decrease in movable fluid porosity. Concurrently, displacement pressure and median pressure increase significantly, while the median pore-throat radius decreases. These trends indicate a progressive complexity in pore structure and a deterioration in flow capacity with depth. This evolution is further evidenced by a vertical transition from Type I to Type III pore structures, highlighting the pronounced variability of pore architecture within the formation.
In accordance with previous classification criteria for pore throat size [53], in this study, the pore throats of deep reservoirs are divided into nanopores (<0.1 μm), micropores (0.1–0.4 μm), small pores (0.4–1 μm), mesopores (1–10 μm), and macropores (>10 μm), and the proportion of each pore throat is calculated (Figure 6D). The statistical results reveal that the pore throat radii of the deep reservoirs in the study area are widely distributed, and mesopores, micropores, and nanopores are the main types of pore throats. Among them, mesopores are the most developed, accounting for an average of 30.03%, followed by micropores and nanopores, with average proportions of 26.46% and 23.48%, respectively, small pores account for an average of 18.92%, and macropores are the least developed, averaging only 1.11%. As the depth increases, the proportions of mesopores and macropores decrease overall, whereas the proportions of nanopores and micropores increase overall. When the burial depth is greater than 3930 m, type II and type III are the main pore structure types, with nanopores and microsmall pores dominating, mesopores and macropores are essentially undeveloped, and the reservoir gradually becomes tight.

4.4. Diagenesis Characteristics

4.4.1. Compaction

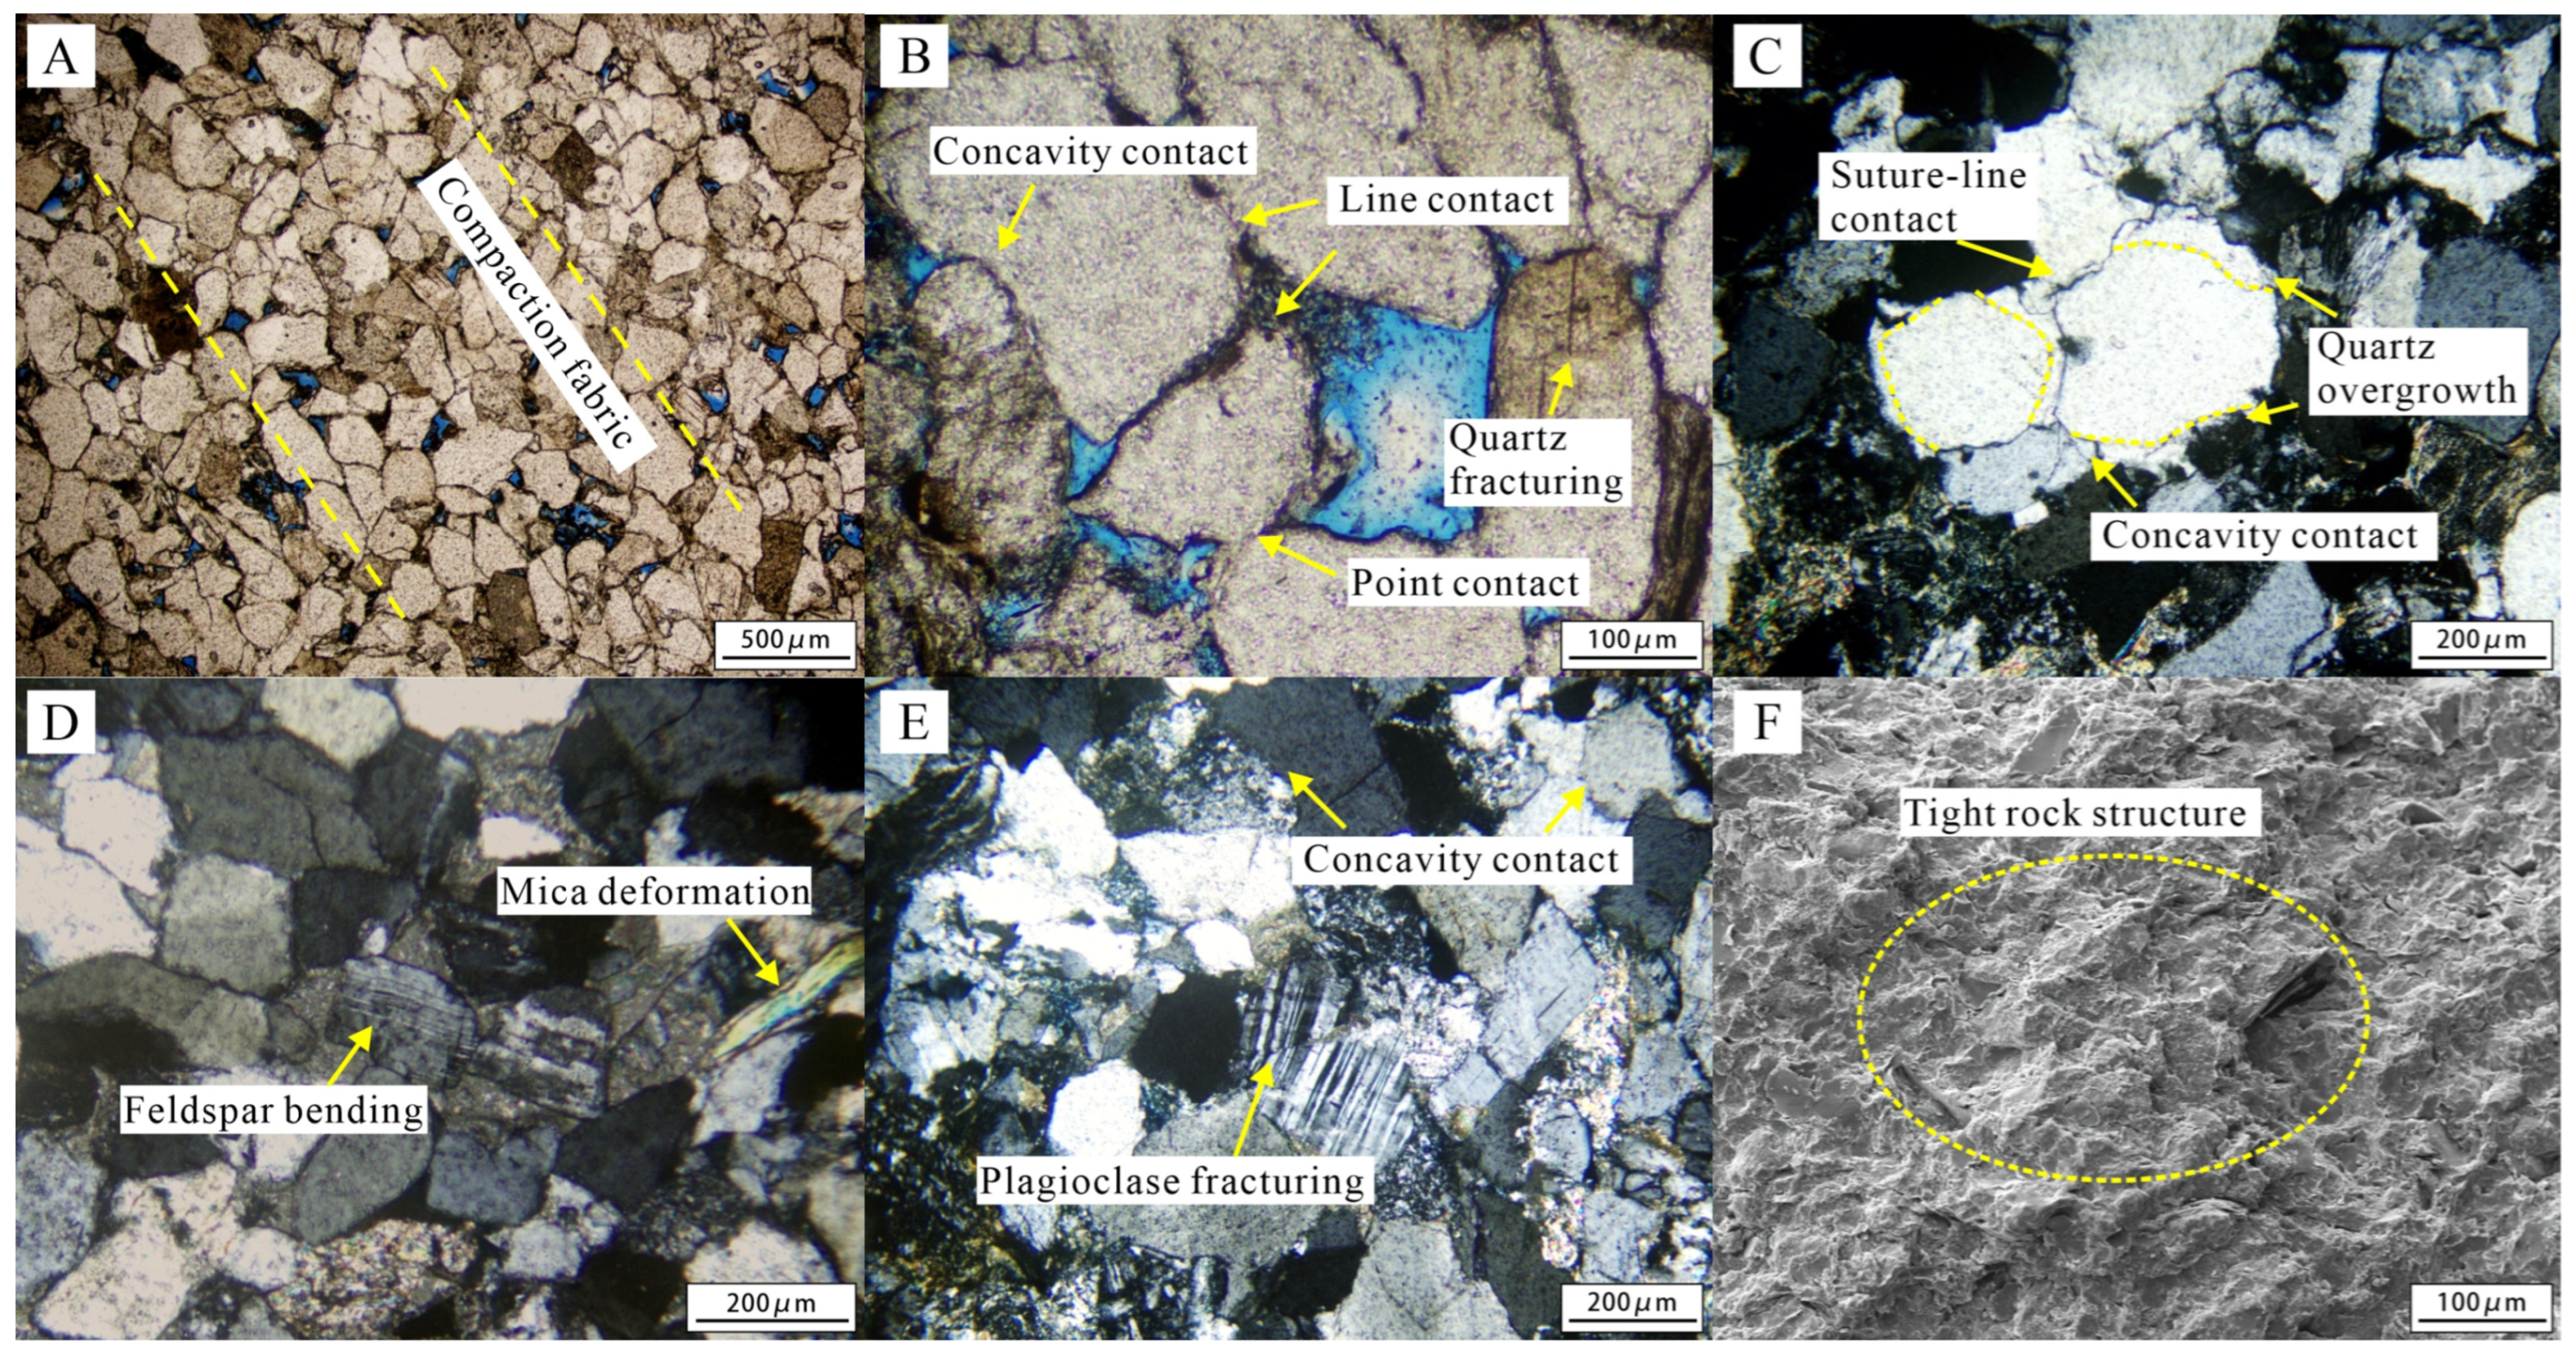
The reservoirs of the Huagang Formation in the Central Anticlinal Belt have experienced strong compaction. Under the pressure of the overlying strata, grain reorientation leads to a directional arrangement, and the grain arrangement is tight (Figure 7A). The compaction effect in the FN area is relatively stronger at similar depths. Under a microscope, numerous granules are observed to have line-concavity contact and suture–line contact, SiO2 precipitated from pressure dissolution reprecipitates and crystallizes on the surface of quartz grains, resulting in bright secondary overgrowths (Figure 7C). Under extreme mechanical compaction, quartz grains rupture, plastic grains, such as mica and feldspar, bend and deform, and plagioclase cracks and dislocates (Figure 7B,D,E). In the FS area, compaction at the same depth is relatively weak. Under a microscope, many grains are in point-line contact, and many residual primary intergranular pores are preserved. As depth increases, the reservoir becomes essentially compacted for well FS3 at 4326.23 m (H12 sublayer) (Figure 7C). These observations indicate that mechanical compaction significantly affects sandstone quality.

4.4.2. Cementation

Cementation refers to the important process of crystallization of authigenic minerals from pore fluids and consolidation of sediments from a loose state into rocks [54]. Studies have shown that the authigenic cements in the Huagang Formation reservoir can be divided into three types of clay cements, carbonate cements, and siliceous cements.
Clay Cements
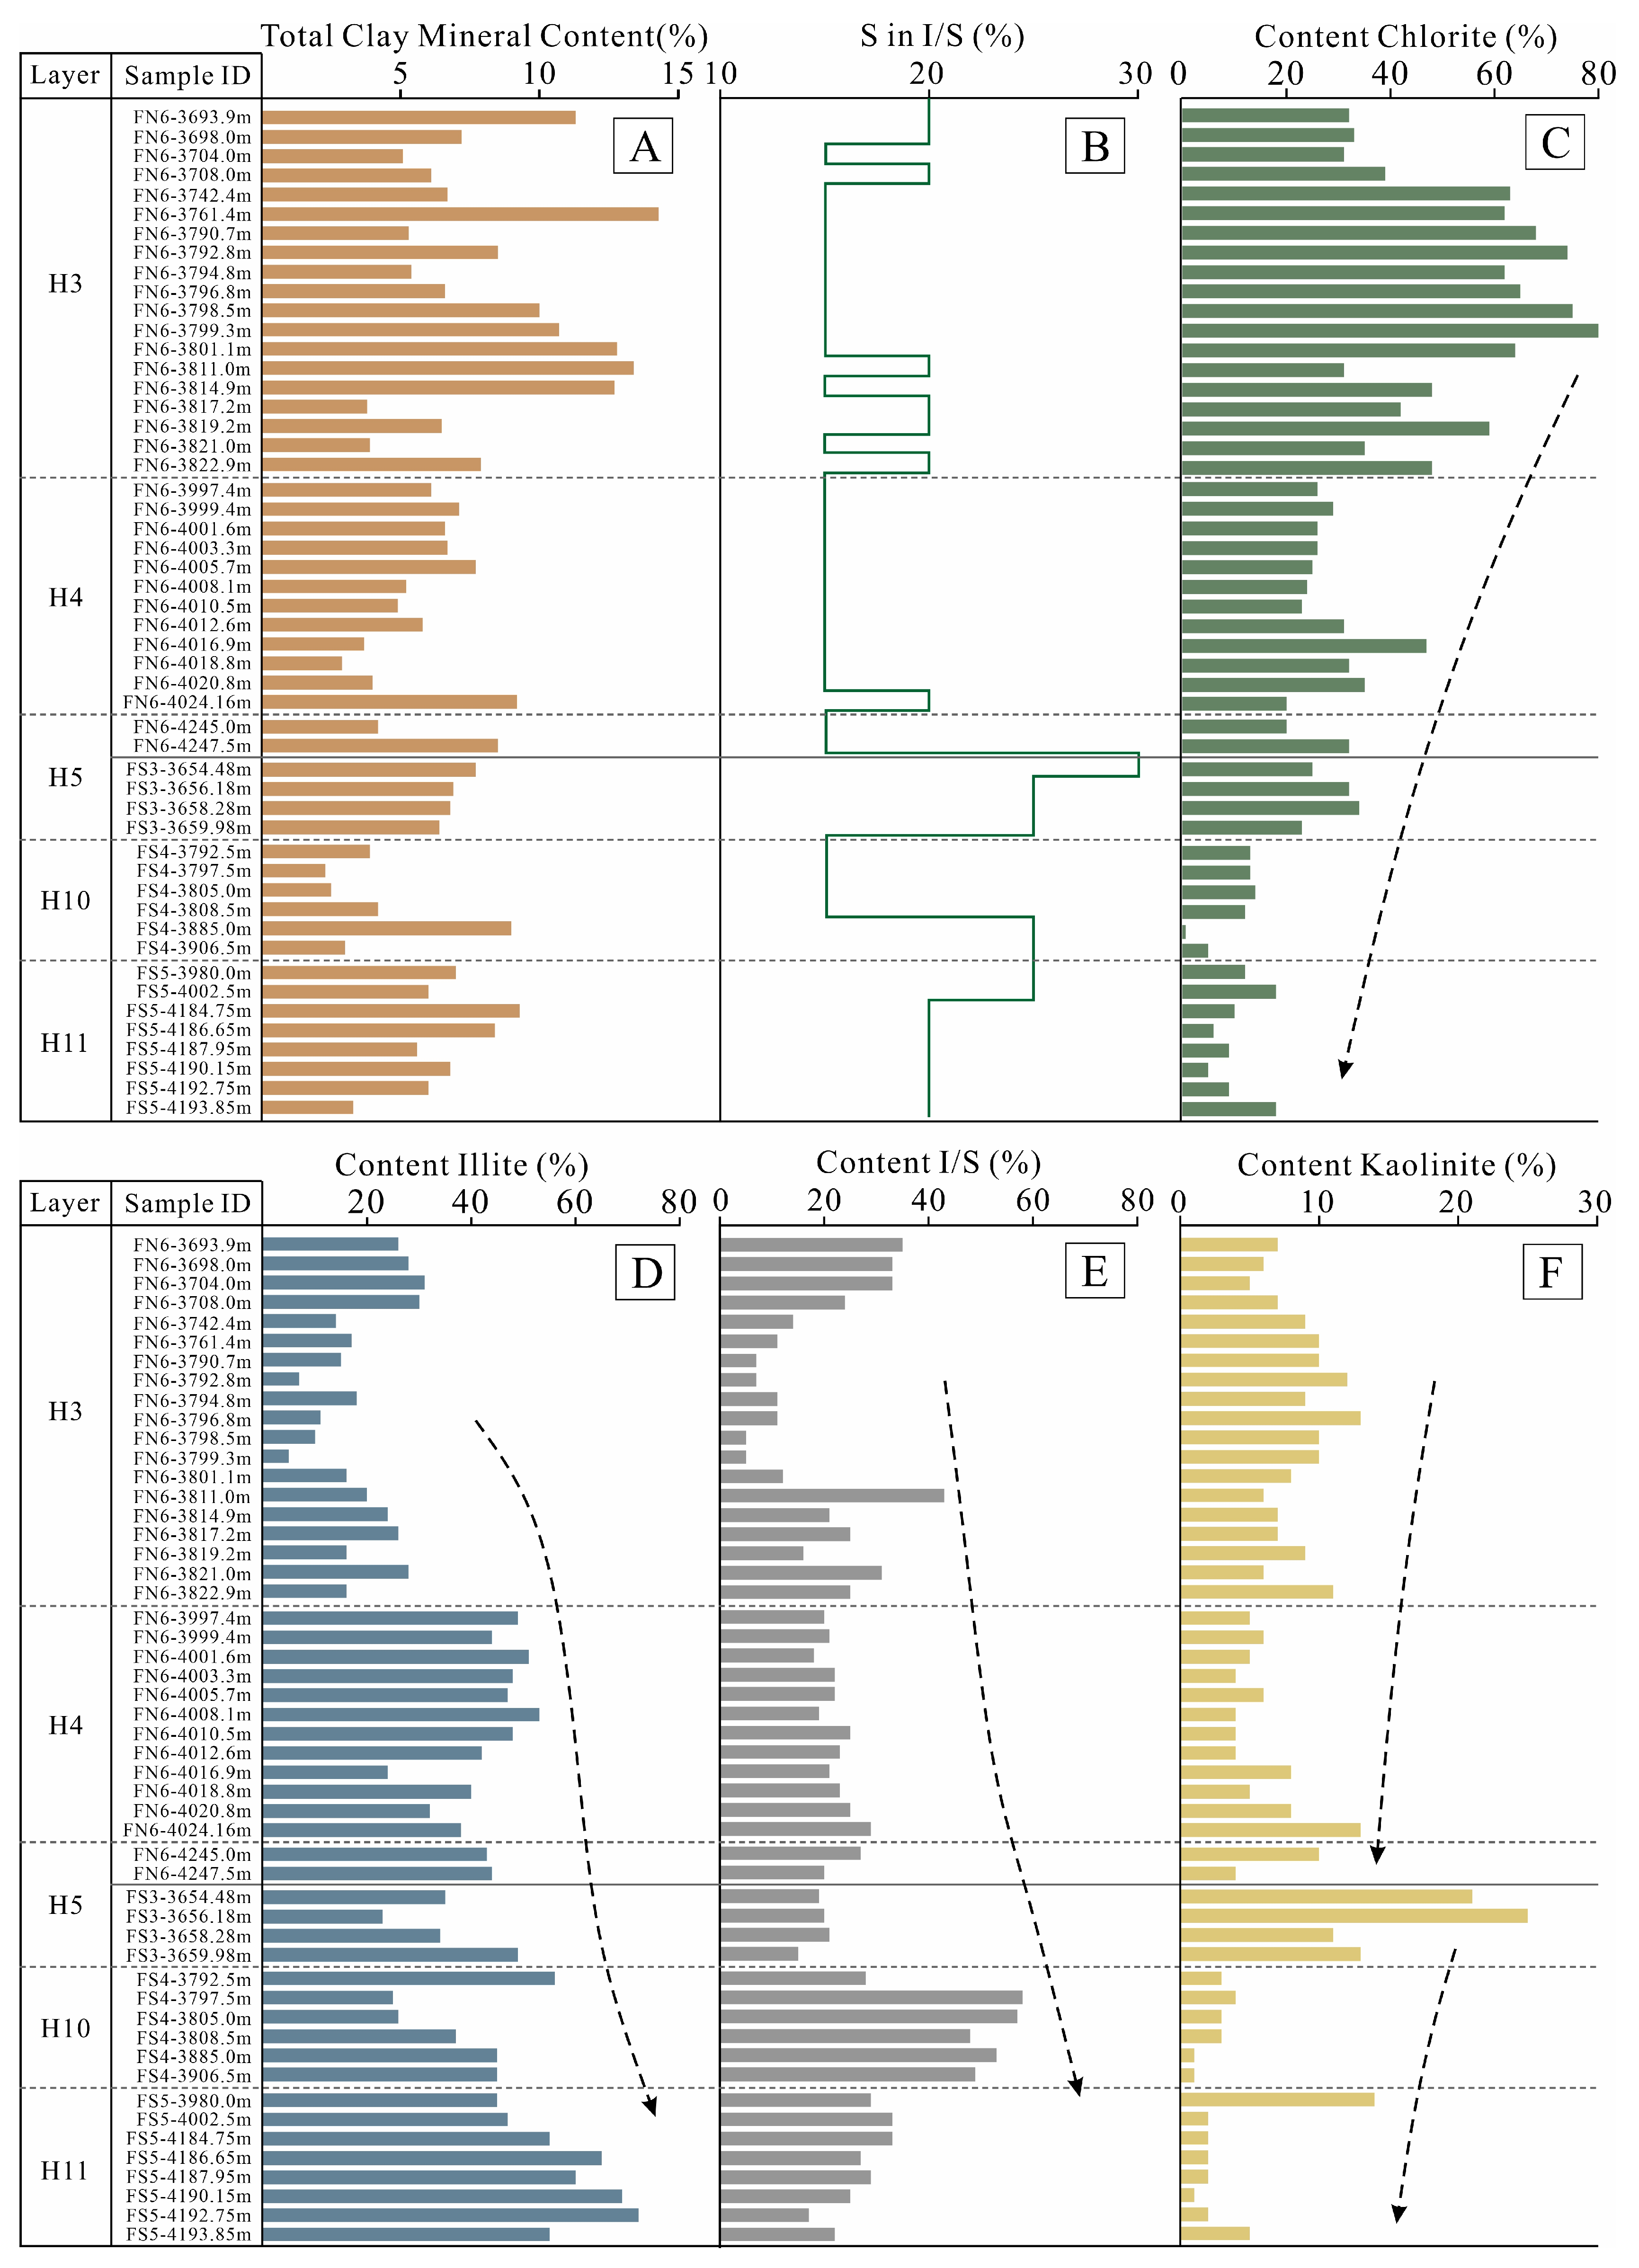
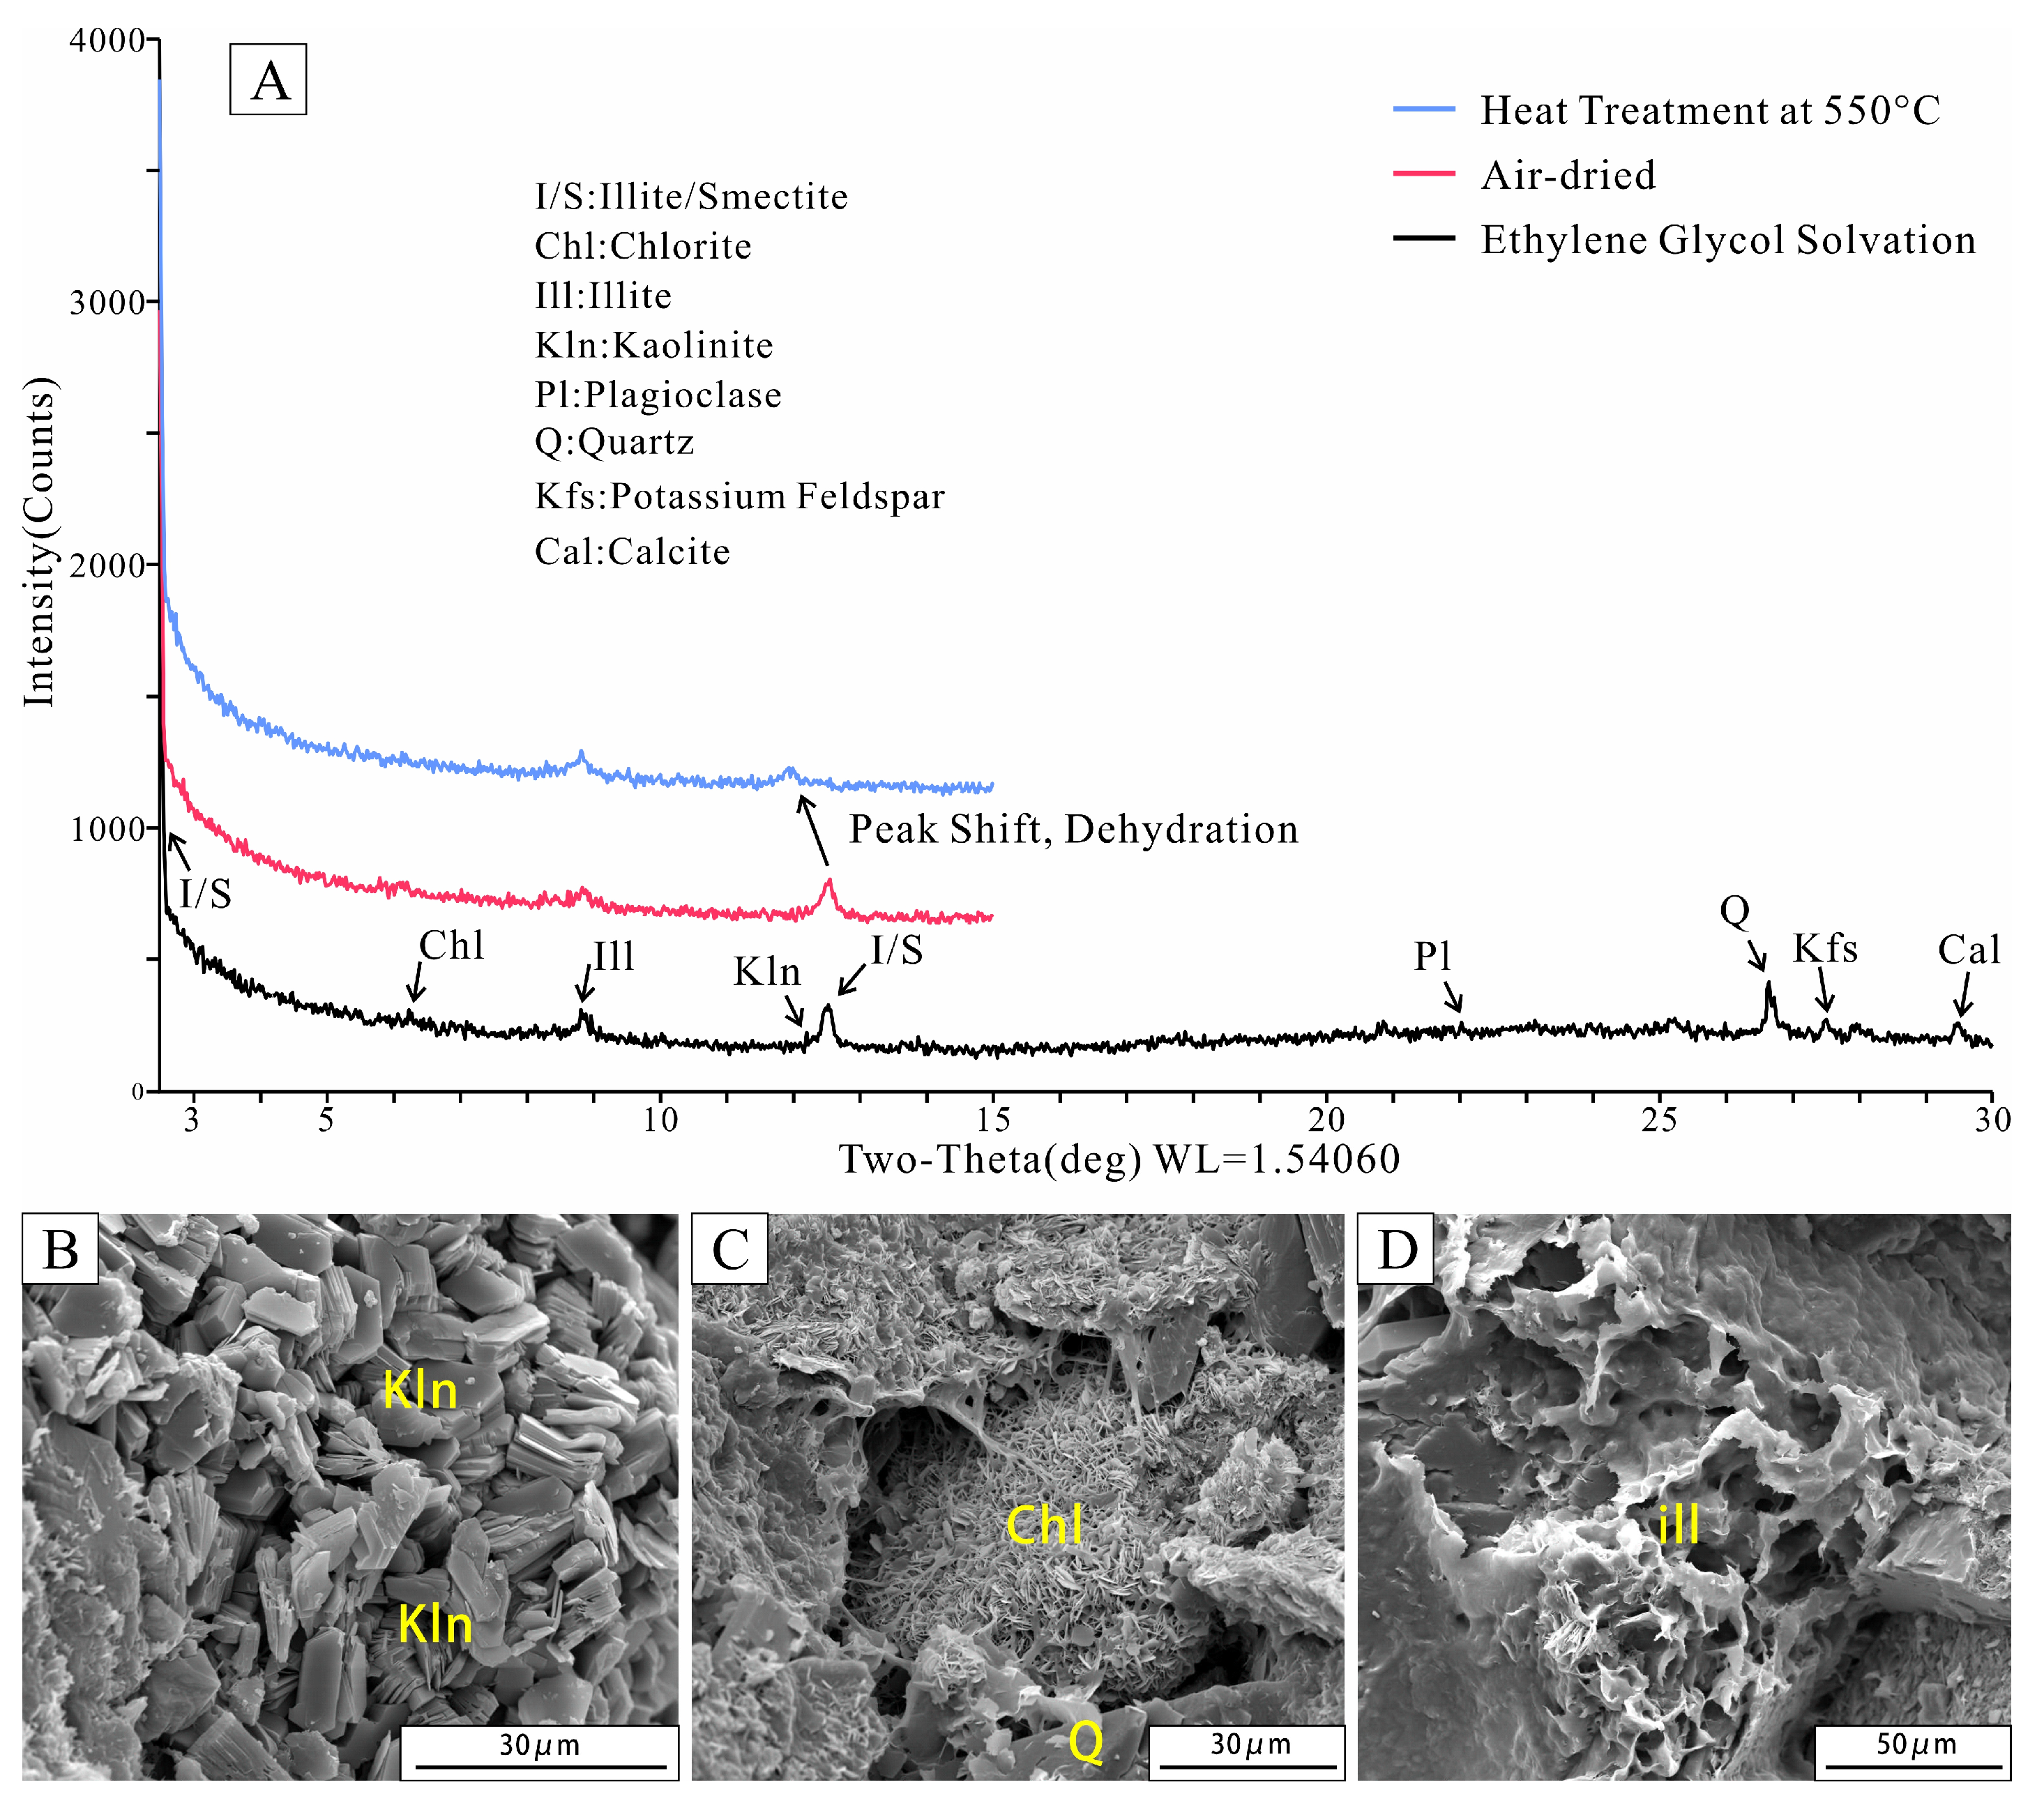
XRD analysis reveals that the total proportion of clay cements in the Huagang Formation (sublayers H3–H11) of the Central Anticlinal Belt ranges from 2.3 to 14.3%, with an average of 6.78%. Vertically, there is a slight decrease in content with increasing depth (Figure 8A), with montmorillonite accounting for 15–30% in the illite/smectite (I/S) mixed-layer clay (Figure 8B). The clay cements in the Huagang Formation (H3–H5 sublayers) in the FN area are dominated by chlorite, which accounts for 20–80% of the total clay cements, with an average of 42.64%. The chlorite content in the Huagang Formation (H5–H11 sublayers) in the FS area ranges from 1 to 34%, with an average of 14.39%. Overall, the chlorite cement content shows a gradual decrease with increasing burial depth (Figure 8C). The illite content in the FN area ranges from 5 to 53%, with an average of 29.12%, and in the FS area, the illite content ranges from 23 to 72%, with an average of 46.83%. Overall, the content of illite cementation increases gradually with increasing burial depth (Figure 8D). The XRD pattern of the clay component reveals that after heating to 550 °C, the diffraction peak at approximately 12.5° 2θ in the naturally air-dried samples shifts to a lower angle of 11.8° 2θ, with a corresponding decrease in intensity (Figure 9A). This diffraction peak is the second-order reflection of the I/S mixed-layer, and its change indicates that the heating and dehydration of the ordered I/S mixed-layer cause the collapse of the montmorillonite crystal layer within the mixed-layer structure, leading to systematic peak position shifts, which allows the complete differentiation from chlorite and kaolinite. The content of I/S mixed-layer in the FN area ranges from 5 to 43%, with an average of 20.72%, and in the FS area, it ranges from 15 to 58%, with an average of 32.39%. Vertically, the content of the I/S mixed-layer increases with burial depth, reaching a peak at approximately 3800 m (Figure 8E). The content of kaolinite cements is generally low at depths below 3700 m. The kaolinite content in the FN area ranges from 4 to 13%, with an average of 7.52%. In the FS area, kaolinite content ranges from 1 to 25%, averaging 6.39%. At a depth of 4100 m, the kaolinite cement content is extremely low (Figure 8F).
Acidic fluids can dissolve aluminosilicate minerals such as feldspar (KAlSi3O8) and form kaolinite (Al2Si2O5(OH)4). In shallow reservoirs at depths less than 3600 m, kaolinite dominates and fills intergranular pores and coexists with dissolution pores. The resulting worm-like and foliated kaolinite aggregates provide intergranular pores and form bundle throats that enhance petrophysical characteristics (Figure 9B). In reservoirs with a burial depth of greater than 3600 m, the acidic fluids are depleted, the pH increases, the formation of kaolinite cements decreases, and the pores are only occasionally filled.
The formation of chlorite ((Mg, Fe2+)5Al(AlSi3O10)(OH)8) requires an alkaline-reducing environment rich in Mg2+ and Fe2+. Especially in sandstones rich in rock fragments, the alteration of mafic dark minerals, such as biotite and amphibole, serves as the primary source of Mg2+ and Fe2+ in chlorite. There are two growth patterns of authigenic chlorite cements, i.e., grain coating and pore filling. According to the arrangement and contact relationship with the particles, the chlorite coating can be divided into particle-coated chlorite and pore-lining chlorite. Chlorite coatings can grow indiscriminately in any direction on the grain surface of quartz, K-feldspar, plagioclase and rock fragments. However, crystals typically exhibit plate-like extensions along the 001 direction perpendicular to the grains, with individual crystal lengths generally not exceeding 10 µm. The aggregates are disorderly arranged in a rose or fluffy shape [55,56]. As the depth and temperature increase, the openness of the diagenetic environment decreases, the alkalinity of the pore fluid increases, early chlorite coatings with unstable chemical compositions undergo recrystallization and rapidly transform to pore-lining chlorite, and the content exhibits a pattern of first increasing and then decreasing. In the depth range of 3600–4000 m, the highest chlorite content can reach 80% of the total clay cement. The particles coated with chlorite resist compaction and excessive cement growth (Figure 9C) and retain the primary pores.
The contents of autogenous illite cement (KAl2(AlSi3O10)(OH)2) and I/S mixed-layer increase with burial depth, exhibiting a consistent upward trend. In reservoirs deeper than 3600 m, the rise in illite content originates from two sources, the transformation of kaolinite and illite I/S mixed-layer, and the direct precipitation of pore fluids. The illitization of kaolinite is the main pathway. In a relatively closed system, when the dissolution rate of feldspar is greater than the migration rate of the medium, the continuous consumption of H+ and the gradual accumulation of alkaline ions, such as K+ and Na+, lead to the transformation of the porous medium into an alkaline environment, causing the stability of the naturally occurring kaolinite cement to deteriorate [57]. With the continuous dissolution of K-feldspar, the K+/H+ activity ratio gradually increases to the two-phase boundary of illite and kaolinite, and rapid illitization of kaolinite occurs. The formed autogenous illite primarily appears as tuft-like, fibrous, and bridging aggregates, filling intergranular pores and altering the reservoir’s pore structure (Figure 9D).
Carbonate Cements
Carbonate cements are among the most important cement types in the reservoir sandstones of the Huagang Formation of the Xihu Sag. Combining thin-section observations and cathodoluminescence analysis, the stages of cements can be distinguished. The cathodoluminescence of carbonate minerals is controlled by the mass fraction of Fe2+ and Mn2+ in the lattice. Mn2+ is an important activator, and Fe2+ is a quencher. Different Mn2+/Fe2+ ratios within the calcite cement result in different intensities of cathodoluminescence under the microscope. In the early-formed calcite cements, the Mn2+/Fe2+ ratio is relatively low, and the quenching results in weak cathodoluminescence; thus, the cathodoluminescence is dark red in color. Late-formed calcite cement exhibits stronger luminescence, with a relatively high Mn2+/Fe2+ ratio, appearing bright red to orange-red. The cathodoluminescence of the Huagang Formation samples in the study area is mainly dark red and bright red; thus, carbonate cements can be divided into early and late stages, corresponding to different burial diagenetic stages.
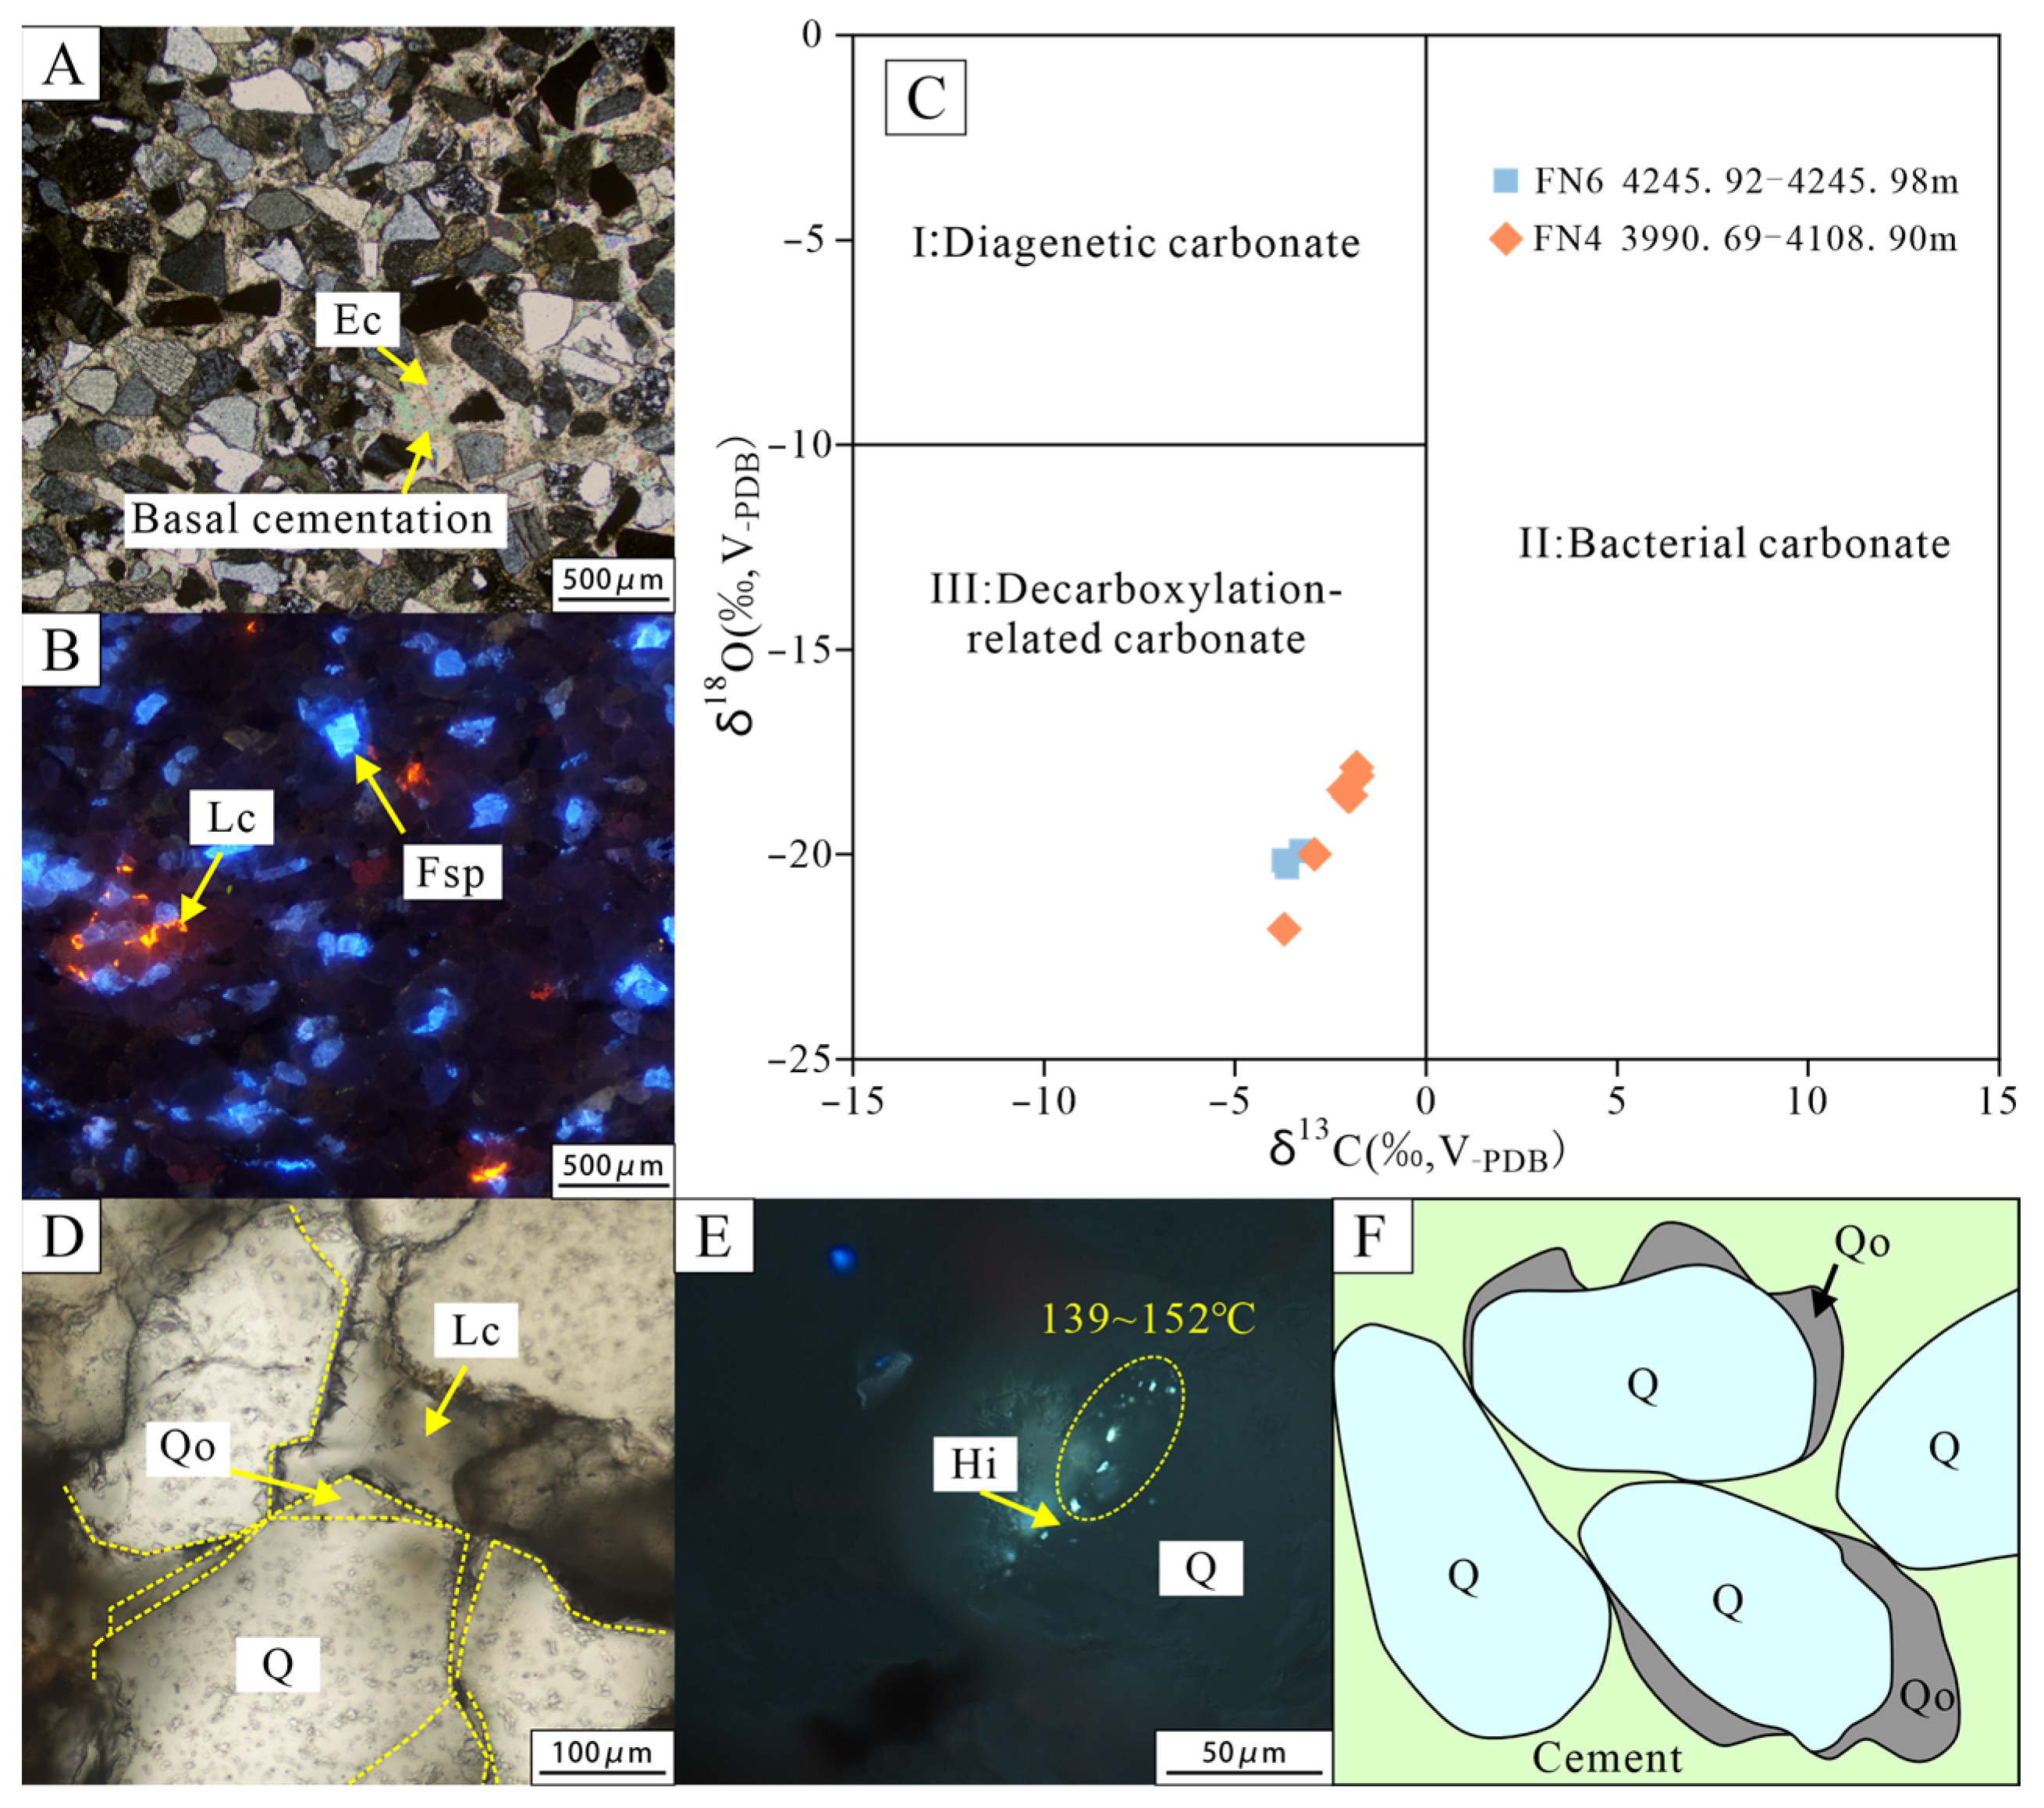
The early cements consist mainly of iron-free calcite and a small amount of siderite. This stage of cementation usually occurs after early mechanical compaction and before early diagenetic stage B, and the clastic grains are in point–line contact. Calcite accounts for the greatest proportion of carbonate cements, can reach 30% locally, can even constitute compact calcareous strata, and is usually intergrown and basal-cemented. Especially near mudstone interlayers, calcite is wrapped with clastic particles in a “floating” state, with point contact or no contact (Figure 10A). Siderite is intraclastic and is present in low amounts. Siderite is usually distributed between clastic grains in the form of micritic crystals and microcrystals, and a few occur as aggregates, most forming during the paragenesis or synogenesis stage.
Late cements are formed mainly during the meso-diagenetic stage, when the grain–grain contact changes to a line–concavity contact. Microscopic observation reveals that there are more late calcites than early calcites (Figure 10B). The C–O isotope analysis of 10 samples indicates that the formation of late calcite is related mainly to the fluid mixing of meteoric water and deep hydrothermal fluid and the decarboxylation of organic acids (Figure 10C). In addition to calcite, carbonate cements also include iron-rich calcites and iron dolomite, and both occur in relatively low concentrations, typically as dispersed subhedral to euhedral crystals within residual intergranular pores or metasomatized rock fragments, such as feldspar and clastic particles. During this period, calcite cementation occurs after significant compaction and mainly blocks pore throats or metasomatized clastic particles; thus, it is among the key diagenetic processes leading to deterioration of reservoir quality (Figure 10D).
Silica Cements
Early quartz overgrowth occurs mainly in the acidic diagenetic environment during the shallow to middle burial stage. The SiO2 in the pore water originates from the early dissolution of soluble silicate minerals, such as feldspar and rock fragments. At this stage, the reservoir remains untight and retains residual primary intergranular pores. Following SiO2 supersaturation, clastic quartz grains serve as crystallization nuclei, with secondary growth occurring around their peripheries to form highly euhedral early-stage overgrowths (Figure 10D). Late-stage quartz overgrowth typically develops during deep burial stages, with SiO2 primarily originating from more intense pressure dissolution. Under immense stress at grain contact points, quartz grains undergo self-dissolution, releasing SiO2 that migrates with pore fluids to adjacent pore spaces before being redeposited. This process occurs after intense compaction, when pore space is significantly reduced. Consequently, late-stage overgrowth is typically constrained, exhibiting poor euhedral degree, and often competes with late-stage cements such as iron carbonates for the remaining pore space [58]. Taking the identification results of 56 thin sections from well FN6 at 3691–3803 m as an example, the quartz cement content ranges from 0 to 7.00% (average: 2.97%).
During the growth process, the secondary overgrowth of quartz captures and seals formation fluid during the diagenesis period to form fluid inclusions, which can provide information on the temperature, pressure conditions and fluid properties at the time of capture. By measuring the homogenized temperature of these inclusions, it is possible to effectively determine the stage at which the quartz secondary overgrowths are formed. Fluorescence observation of inclusions reveals blue gas–liquid hydrocarbons between the secondary overgrowth of sandstone and the original quartz grains, and the fluorescence is distributed in banded form. The homogenized temperatures of gas–liquid hydrocarbon inclusions in well FN4 are concentrated mainly between 100–119 °C and 139–152 °C, indicating that there are two secondary quartz overgrowth stages (Figure 10E). Quartz overgrowths of the Huagang Formation exhibit semi-circumferential growth along the edges of primary grains, with uneven widths and visible harbor-like dissolution features, which represents a circumferential secondary overgrowth (Figure 10F).

4.4.3. Dissolution

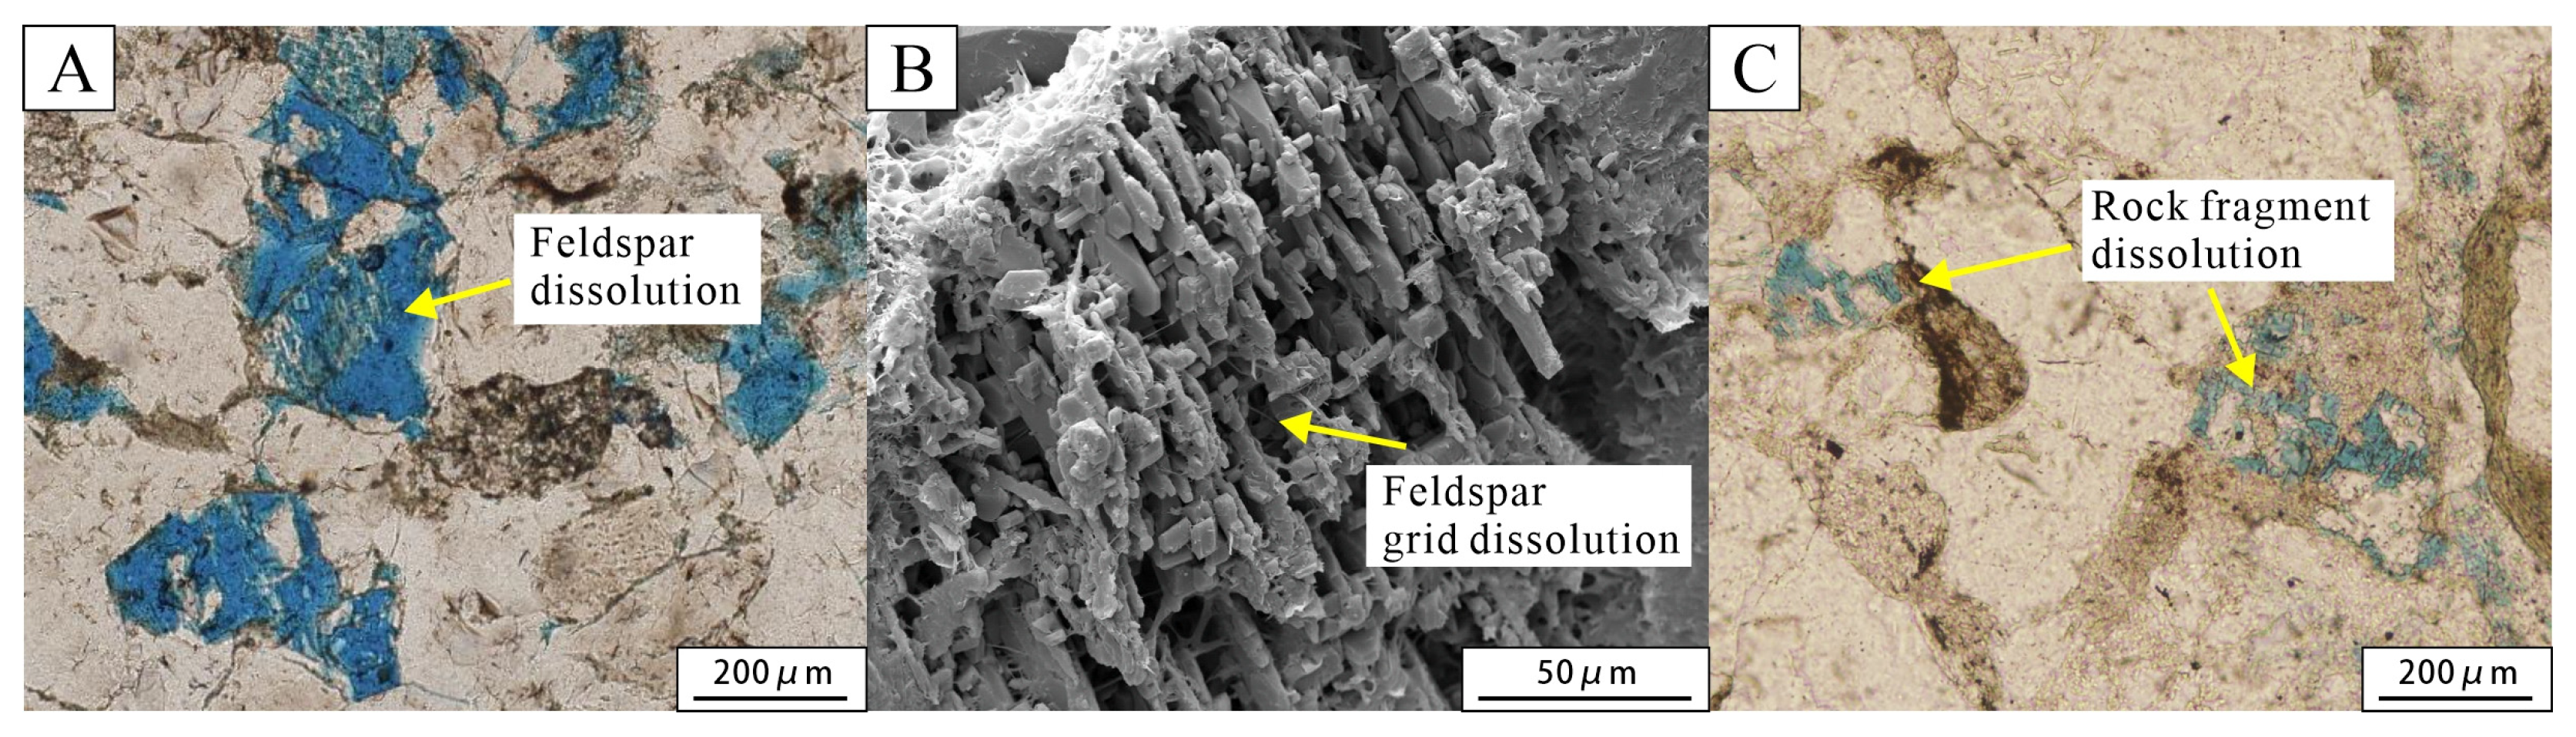
Any components in the clastic reservoir, including clastic skeleton grains, matrix and authigenic minerals, can undergo varying degrees of dissolution in a specific diagenetic environment [59]. Both thin-section analysis and SEM reveal distinct dissolution features in the Huagang Formation sandstones. According to the acidity and alkalinity of the dissolution medium and the types of dissolved minerals, the dissolution of reservoirs can be divided into two types of acidic dissolution and alkaline dissolution. During the diagenetic process, the pyrolysis of organic matter generates hydrocarbons and produces a large amount of organic acids. The feldspar and rock fragments in the reservoirs are easily dissolved, resulting in the formation of secondary dissolution pores. The dissolution of feldspar mainly occurs along feldspar grain boundaries, cleavage surfaces, and dual crystal seams, forming intergranular dissolution pores and intragranular dissolution pores, as well as MCPs after the complete dissolution. Some partially dissolved feldspar grains remain in the pores as grid-like or lattice-like structures (Figure 11A,B). For some rock fragments, there are pitted or honeycomb-like grains after dissolution (Figure 11C). Quartz is relatively stable and generally difficult to dissolve. Dissolution of quartz is observed only in some samples. Early calcite in an open environment is prone to dissolution, and calcite residues are occasionally observed. Alkaline dissolution is relatively undeveloped and is distributed only sporadically in reservoirs with local burial depths greater than 4000 m. The area of secondary dissolution pores in the sandstones of the Huagang Formation usually accounts for more than 33% of the total plane porosity.

5. Discussion

5.1. Influence of Provenance on Reservoir Quality

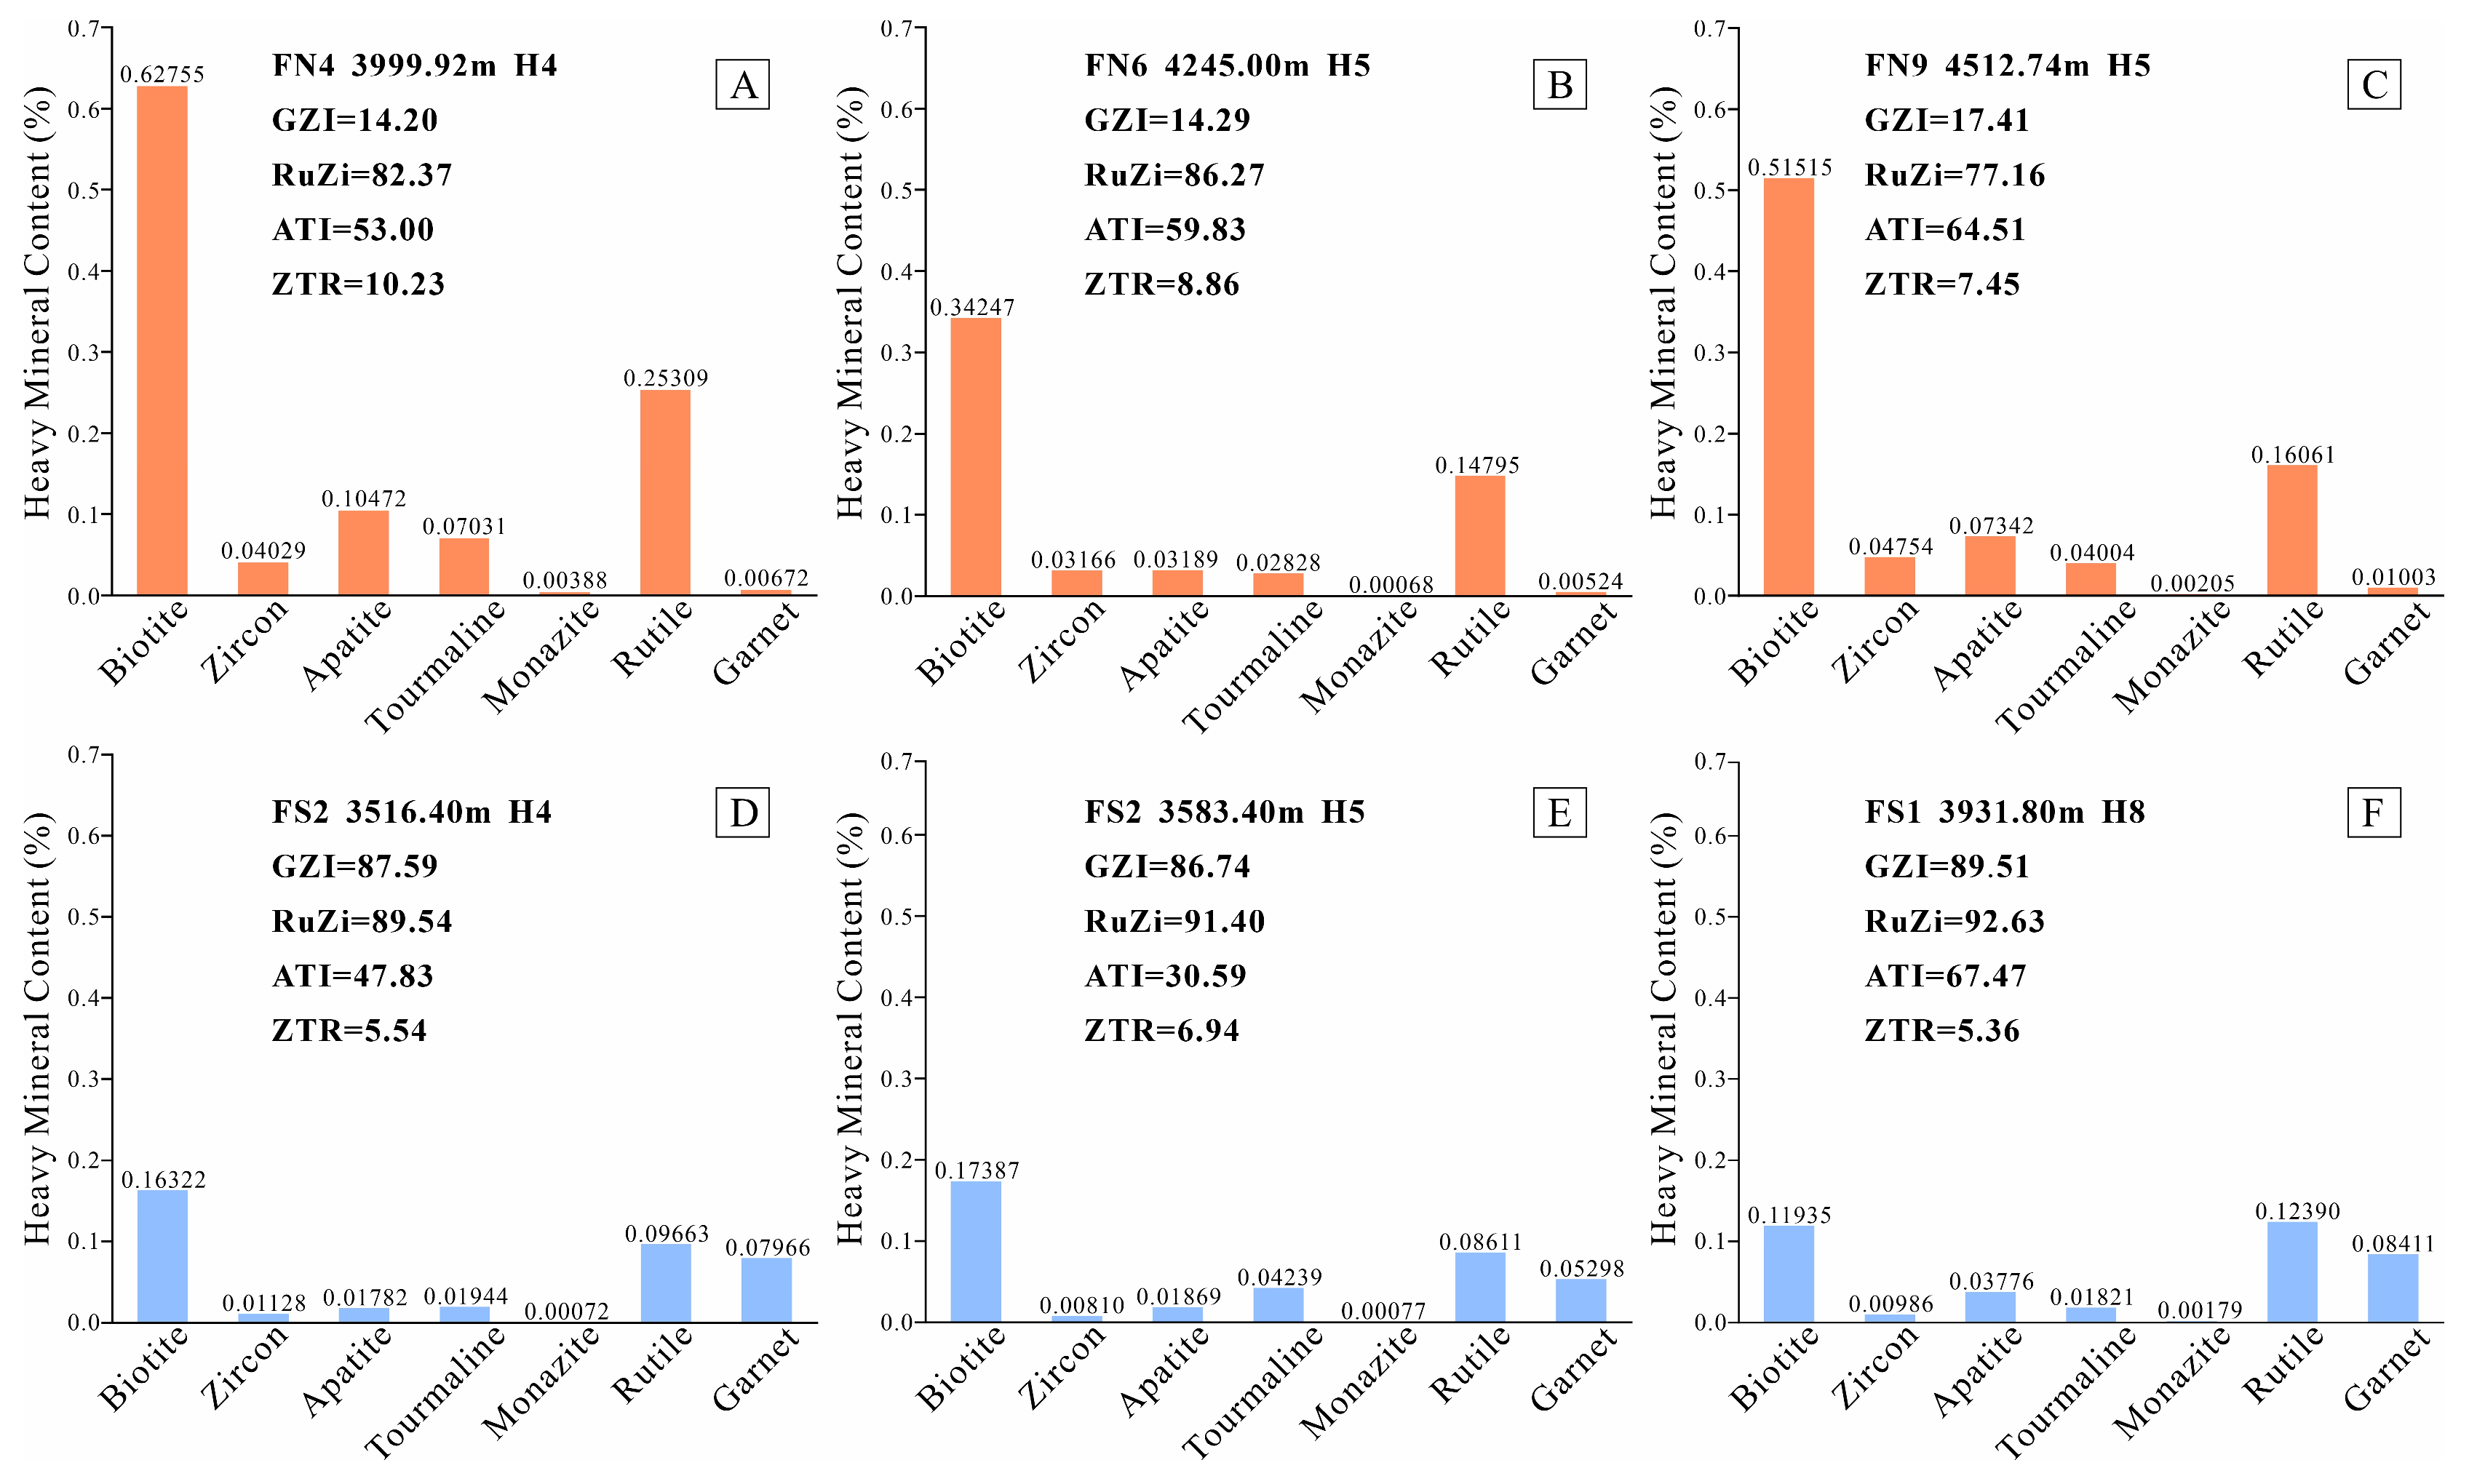
Analysis of the quantitative TIMA measurement results of rock minerals for 10 sandstone samples from the FN area and 6 sandstone samples from the FS area reveals that there is a relatively significant difference in the heavy mineral content of the Huagang Formation between the two areas. A total of 16 major heavy minerals are identified in the core samples, i.e., biotite, rutile, magnetite, tourmaline, apatite, garnet, pyrite, zircon, monazite, spinel, chalcopyrite, baryte, florencite ore, xenotime, and chlorite. In this study, a total of seven heavy minerals, namely, biotite, zircon, apatite, tourmaline, monazite, rutile and garnet, are used to compare the contents of heavy minerals in samples, and the characteristic indexes, such as the garnet–zircon index (GZI), rutile–zircon index (RuZi), apatite–tourmaline index (ATI), and stable heavy mineral index (ZTR), are calculated to trace the lithology of source rocks in the FN and FS areas (Figure 12).
The GZI can be calculated as GZI = [Garnet/(Garnet + Zircon)] × 100, which is an important index for distinguishing the provenance regions of metamorphic and magmatic rocks. Garnet is commonly found in intermediate- and high-grade metamorphic rocks, whereas zircon is extremely resistant to weathering, is prone to enrichment during sedimentary and recycling processes, and is particularly abundant in felsic igneous rocks [60]. Therefore, a high GZI value usually indicates a provenance dominated by metamorphic rocks, whereas a low GZI value implies that the provenance mainly comes from igneous rocks (especially granite). The GZI index in the H4 and H5 sublayers of the Upper Member of the Huagang Formation in the FN area ranges from 14.20–7.41, the GZI index in the H4 and H5 sublayers in the Upper Member of the Huagang Formation in the FS area ranges from 86.74 to 87.59, and the GZI index in the H8 sublayer in the Lower Member of Huagang Formation is 89.51. The GZI value of the Upper Member of the Huagang Formation is lower than that of the Lower Member of Huagang Formation. The GZI value of the Huagang Formation in the FS area is much greater than that in the FN area.
The RuZi can be calculated using the following equation: RuZi = [Rutile/(Rutile + Zircon)] × 100, which can provide additional information on the lithology of the provenance. Rutile (TiO2) is a stable mineral that is derived mainly from high-grade metamorphic rocks (such as granulite and eclogite) and from acidic magmatic rocks, and its high density and stability make it a reliable indicator mineral for the provenance of metamorphic rocks [61]. Notably, the coexistence of rutile with typical metamorphic minerals such as garnet strongly indicates the presence of medium- and high-grade metamorphic rocks in the provenance area. When rutile occurs in association with minerals such as zircon and tourmaline, and its own content is not high, it may indicate a provenance composed of both igneous and metamorphic rocks [62]. The difference between the rutile and garnet contents is relatively small in the FS area and relatively large in the FN area. The RuZi values in the FS area range from 86.74–89.51 and are slightly higher than those in the FN area. A high RuZi value indicates that rutile is more enriched than zircon is, which further proves that the proportion of metamorphic source rocks is greater in the FS area. The RuZi values of the Huagang Formation in the study area are generally greater than 70, indicating that the sediments are near-source sediments. The sediments have not undergone long-distance transport or strong weathering. As a result, the less stable rutile has not been largely eliminated and is thus relatively enriched.
The ATI is calculated using the following formula: ATI = [Apatite/(Apatite + Tourmaline)] × 100. Apatite is a common accessory mineral in a variety of igneous rocks but is relatively unstable during sedimentation, transport, and diagenesis. Tourmaline (especially black tourmaline) is very stable, is often associated with granitic pegmatites and hydrothermal veins, and is a characteristic mineral of high-grade metamorphic rocks (such as schists and gneiss) [63,64]. The ATI value in the study area is between 30 and 70—the sediments are between mature and immature. The ATI values of the H4 and H5 sublayers in the FN area range from 53.00–59.87, which are higher than those (30.59–47.83) in the H4 and H5 sublayers of the FS area.
The stable heavy mineral index is calculated as follows: ZTR = [(Zircon + Tourmaline + Rutile)/Σ(All Heavy Minerals)] × 100, which indicates maturity and recycling degree [65]. The ZTR index in the study area ranges from 5.36 to 10.23, which is generally low. The ZTR index in the FN area is slightly greater than that in the FS area. The integration of the GZI, RuZi, ATI, and ZTR indices shows that relatively significant differences in the provenance systems of Huagang Formation exist between the northern and southern areas in the study area. The FN area is characterized by low GZI, low RuZi, and high ATI values, which, combined with the moderate ZTR value and high biotite content, consistently indicate that the provenance is dominated by acidic magmatic rocks, and the deposits have undergone a certain degree of transformation. In contrast, the FS area is characterized by extremely high GZI, high RuZi, and high ATI values but a low ZTR value and biotite content, revealing that the provenance is mainly high-grade metamorphic rocks rich in garnet and rutile, with the rapid, near-source deposition as the characteristics.
The parent rock of magmatic rocks is rich in mafic unstable minerals and unstable plagioclase, which are prone to alteration during diagenesis, thus reducing the permeability of reservoirs. In contrast, metamorphic source rocks provide a greater abundance of stable minerals, such as quartz, and exhibit strong resistance to compaction and dissolution, which facilitates the preservation of primary and secondary pores, thereby enabling the formation of highly permeable reservoirs [66]. Therefore, the reservoir in the Upper Member of the Huagang Formation in the FN area has relatively poor resistance to compaction because of the contribution of more magmatic rocks from the parent source. The H8 sublayer in the Upper and Lower Members of the Huagang Formation in the FS area possesses relatively higher metamorphic source material and exhibits stronger reservoir resistance to compaction; however, the post-depositional dissolution modification capacity is inferior to that of the Upper Member of the Huagang Formation in the FN area. Differences in provenance constitute a key factor contributing to the disparate diagenetic evolution of reservoirs between the northern and southern areas.

5.2. Influence of Diagenesis on Reservoir Quality

The main effect of compaction is to reduce the intergranular pores of sediments, whereas the main effect of cementation is to fill the pores and occupy space. These two diagenetic processes occur simultaneously but mutually restrict each other. When compaction develops, intergranular pores decrease rapidly, interlayer fluid movement is restricted, and cementation develops relatively weakly. Conversely, if cementation is developed and the fluid is highly mobile, overpressure is generated, and compaction is hindered. As diagenesis progresses, the temperature and pressure remain stable at certain stages, and the fluid and strata form a relatively closed equilibrium system. Once the equilibrium relationship in this system is disrupted, cementation could terminate, the cements could be dissolved, and secondary pores are generated [67]. In summary, because cementation directly reduces the size of pore throats, the main effect of cementation on reservoir performance is reduced permeability.
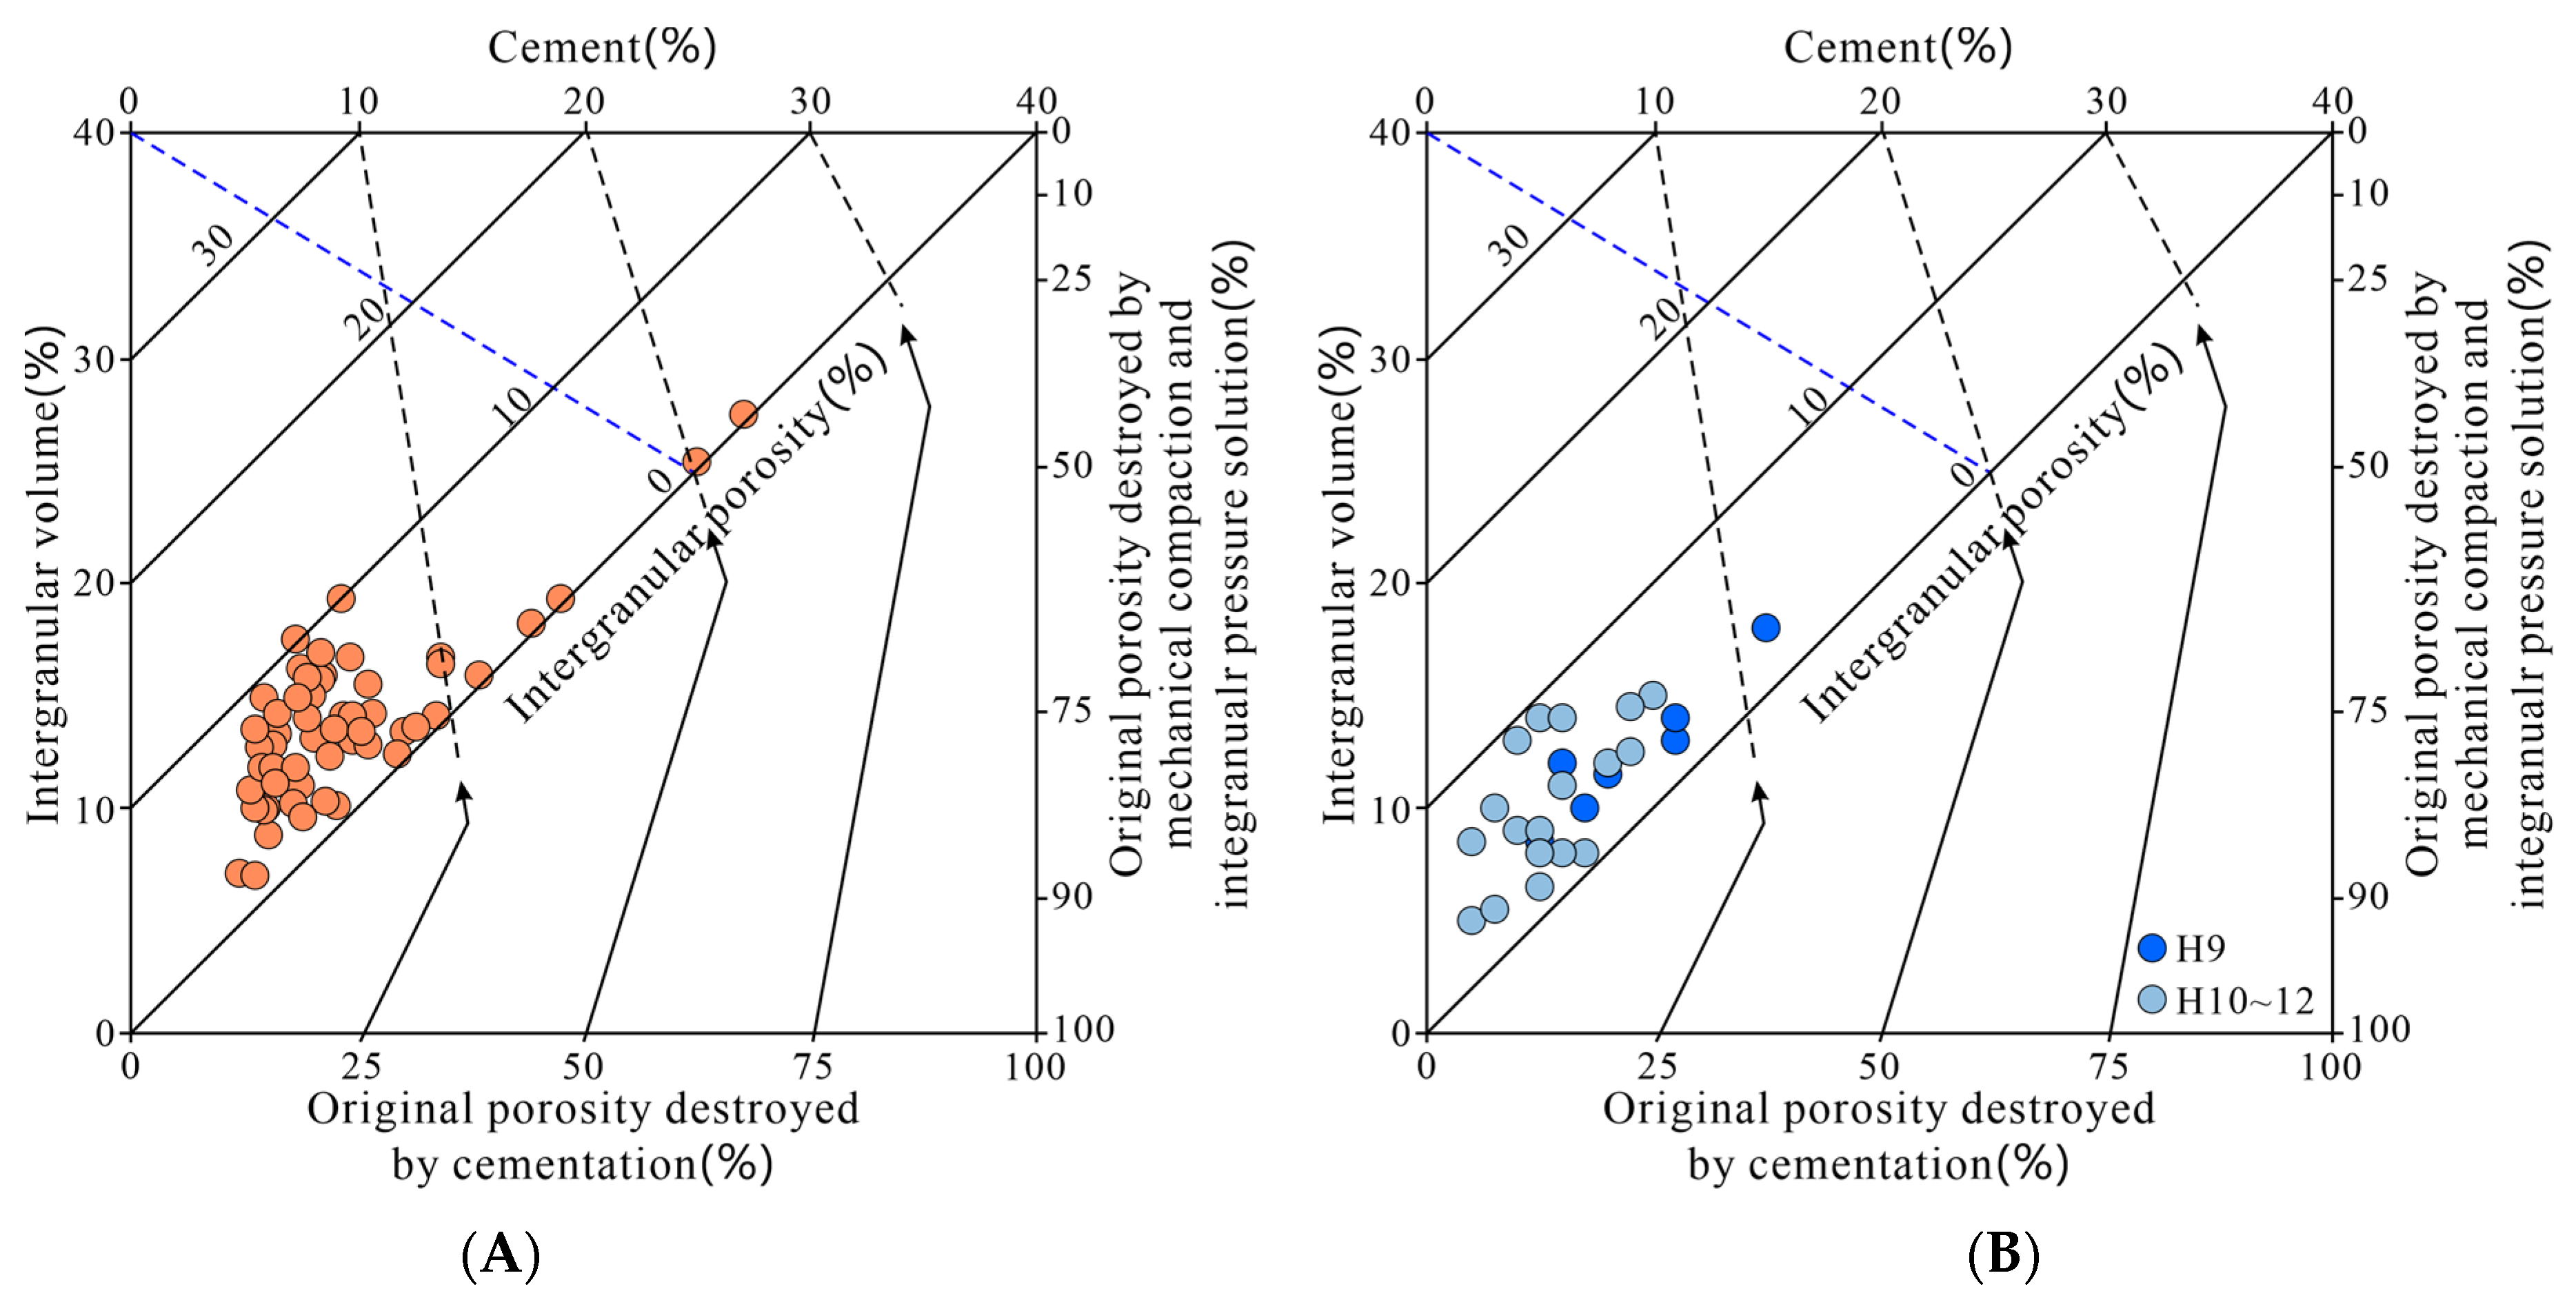
To compare the intensity of compaction versus cementation on the Huagang Formation sandstone reservoirs, a crossplot of cement content versus intergranular pore volume is presented in Figure 13A. Samples from the H3 sublayer (well FN6) are primarily in the moderate–strong compaction range, with a minor subset showing strong carbonate cementation. For this sublayer, compaction reduces primary porosity by approximately 43–88% (avg. ~76%), whereas cementation (cement volume: 4.8–27.3%) accounts for a loss of about 7–57% (avg. ~18%). In contrast, most samples from the H9–H12 sublayers (well FS5) undergo strong compaction, causing a primary porosity loss of 68–92% (avg. ~81%); here, cementation (cement volume: 2.0–15.0%) results in a lower loss of 4–30% (avg. ~12%). The H3 sublayer (Upper Member, FN area) is buried at 3691–3802.8 m, similar to the H9 sublayer (Lower Member, FS area) at 3790.6–3864.2 m. The slightly greater porosity loss due to compaction in the H3 sublayer indicates that at comparable depths, the FN area experiences more severe compaction than the FS area (Figure 13B). In summary, within the study area, compaction exerts a greater control on reservoir porosity than cementation, leading to more substantial porosity reduction. Consequently, compaction is identified as the predominant destructive process for reservoir quality, while cementation plays a secondary, albeit significant, role.
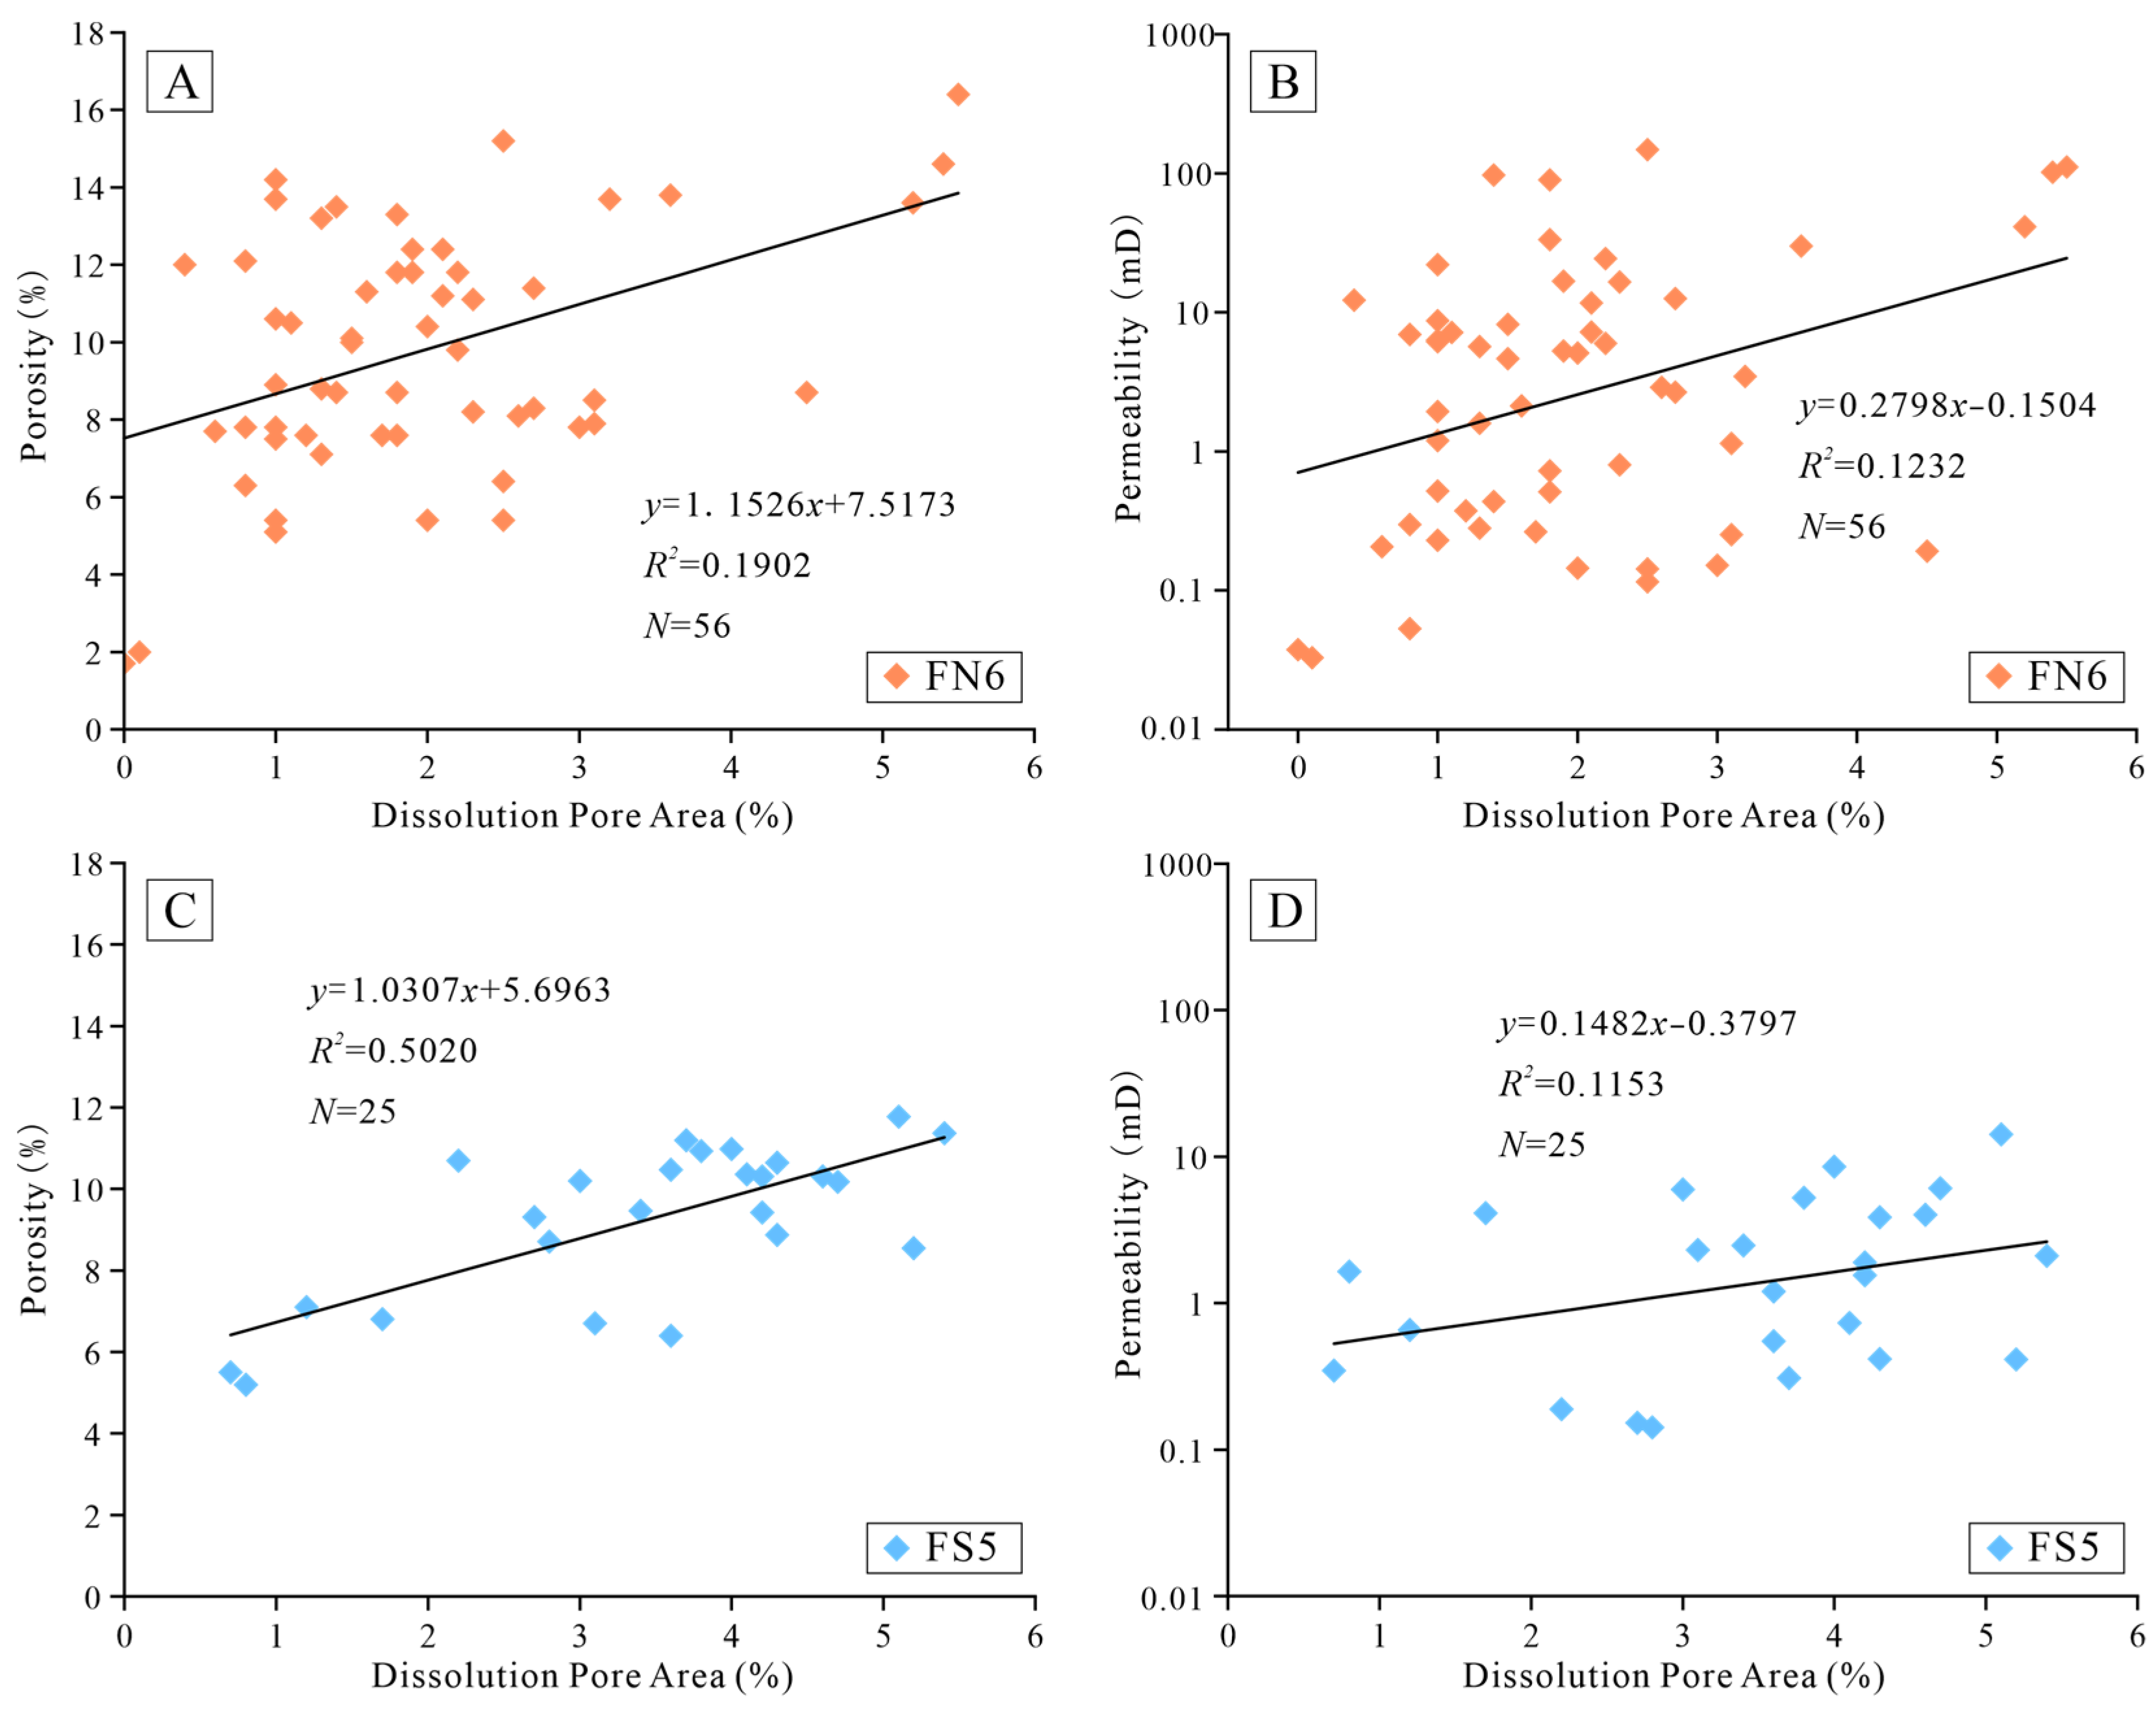
Compaction and cementation are the primary destructive diagenetic processes, whereas dissolution is the main constructive process. In reservoirs subjected to strong acidic fluid dissolution, both intergranular and intragranular dissolution pores are developed. Thin-section observations and statistical analysis reveal a strong positive correlation between the plane porosity of dissolution pores and total porosity in the FS5 well reservoir, confirming dissolution as the dominant constructive process (Figure 14A). This indicates that dissolution effectively enhances reservoir storage capacity in this area. In contrast, the FN6 well reservoir, affected by the coupling of multiple diagenetic processes, shows a weaker positive correlation between dissolution pore plane porosity and total porosity (Figure 14C). This suggests that while dissolution increases porosity, a portion of the newly formed pores are subsequently eliminated or occluded by compaction and cementation. The plane porosity of dissolution pores also shows a positive, but weaker, correlation with reservoir permeability (Figure 14B,D). This key observation implies that dissolution in the Huagang Formation tends to generate numerous isolated or poorly connected pores, and/or that authigenic clay minerals within pores clog the effective throats, thereby limiting the improvement in permeability and reducing overall seepage capacity. Consequently, although dissolution contributes positively to reservoir quality by increasing porosity, its effectiveness in enhancing permeability is constrained.

5.3. Diagenetic Environment and Diagenetic Sequence

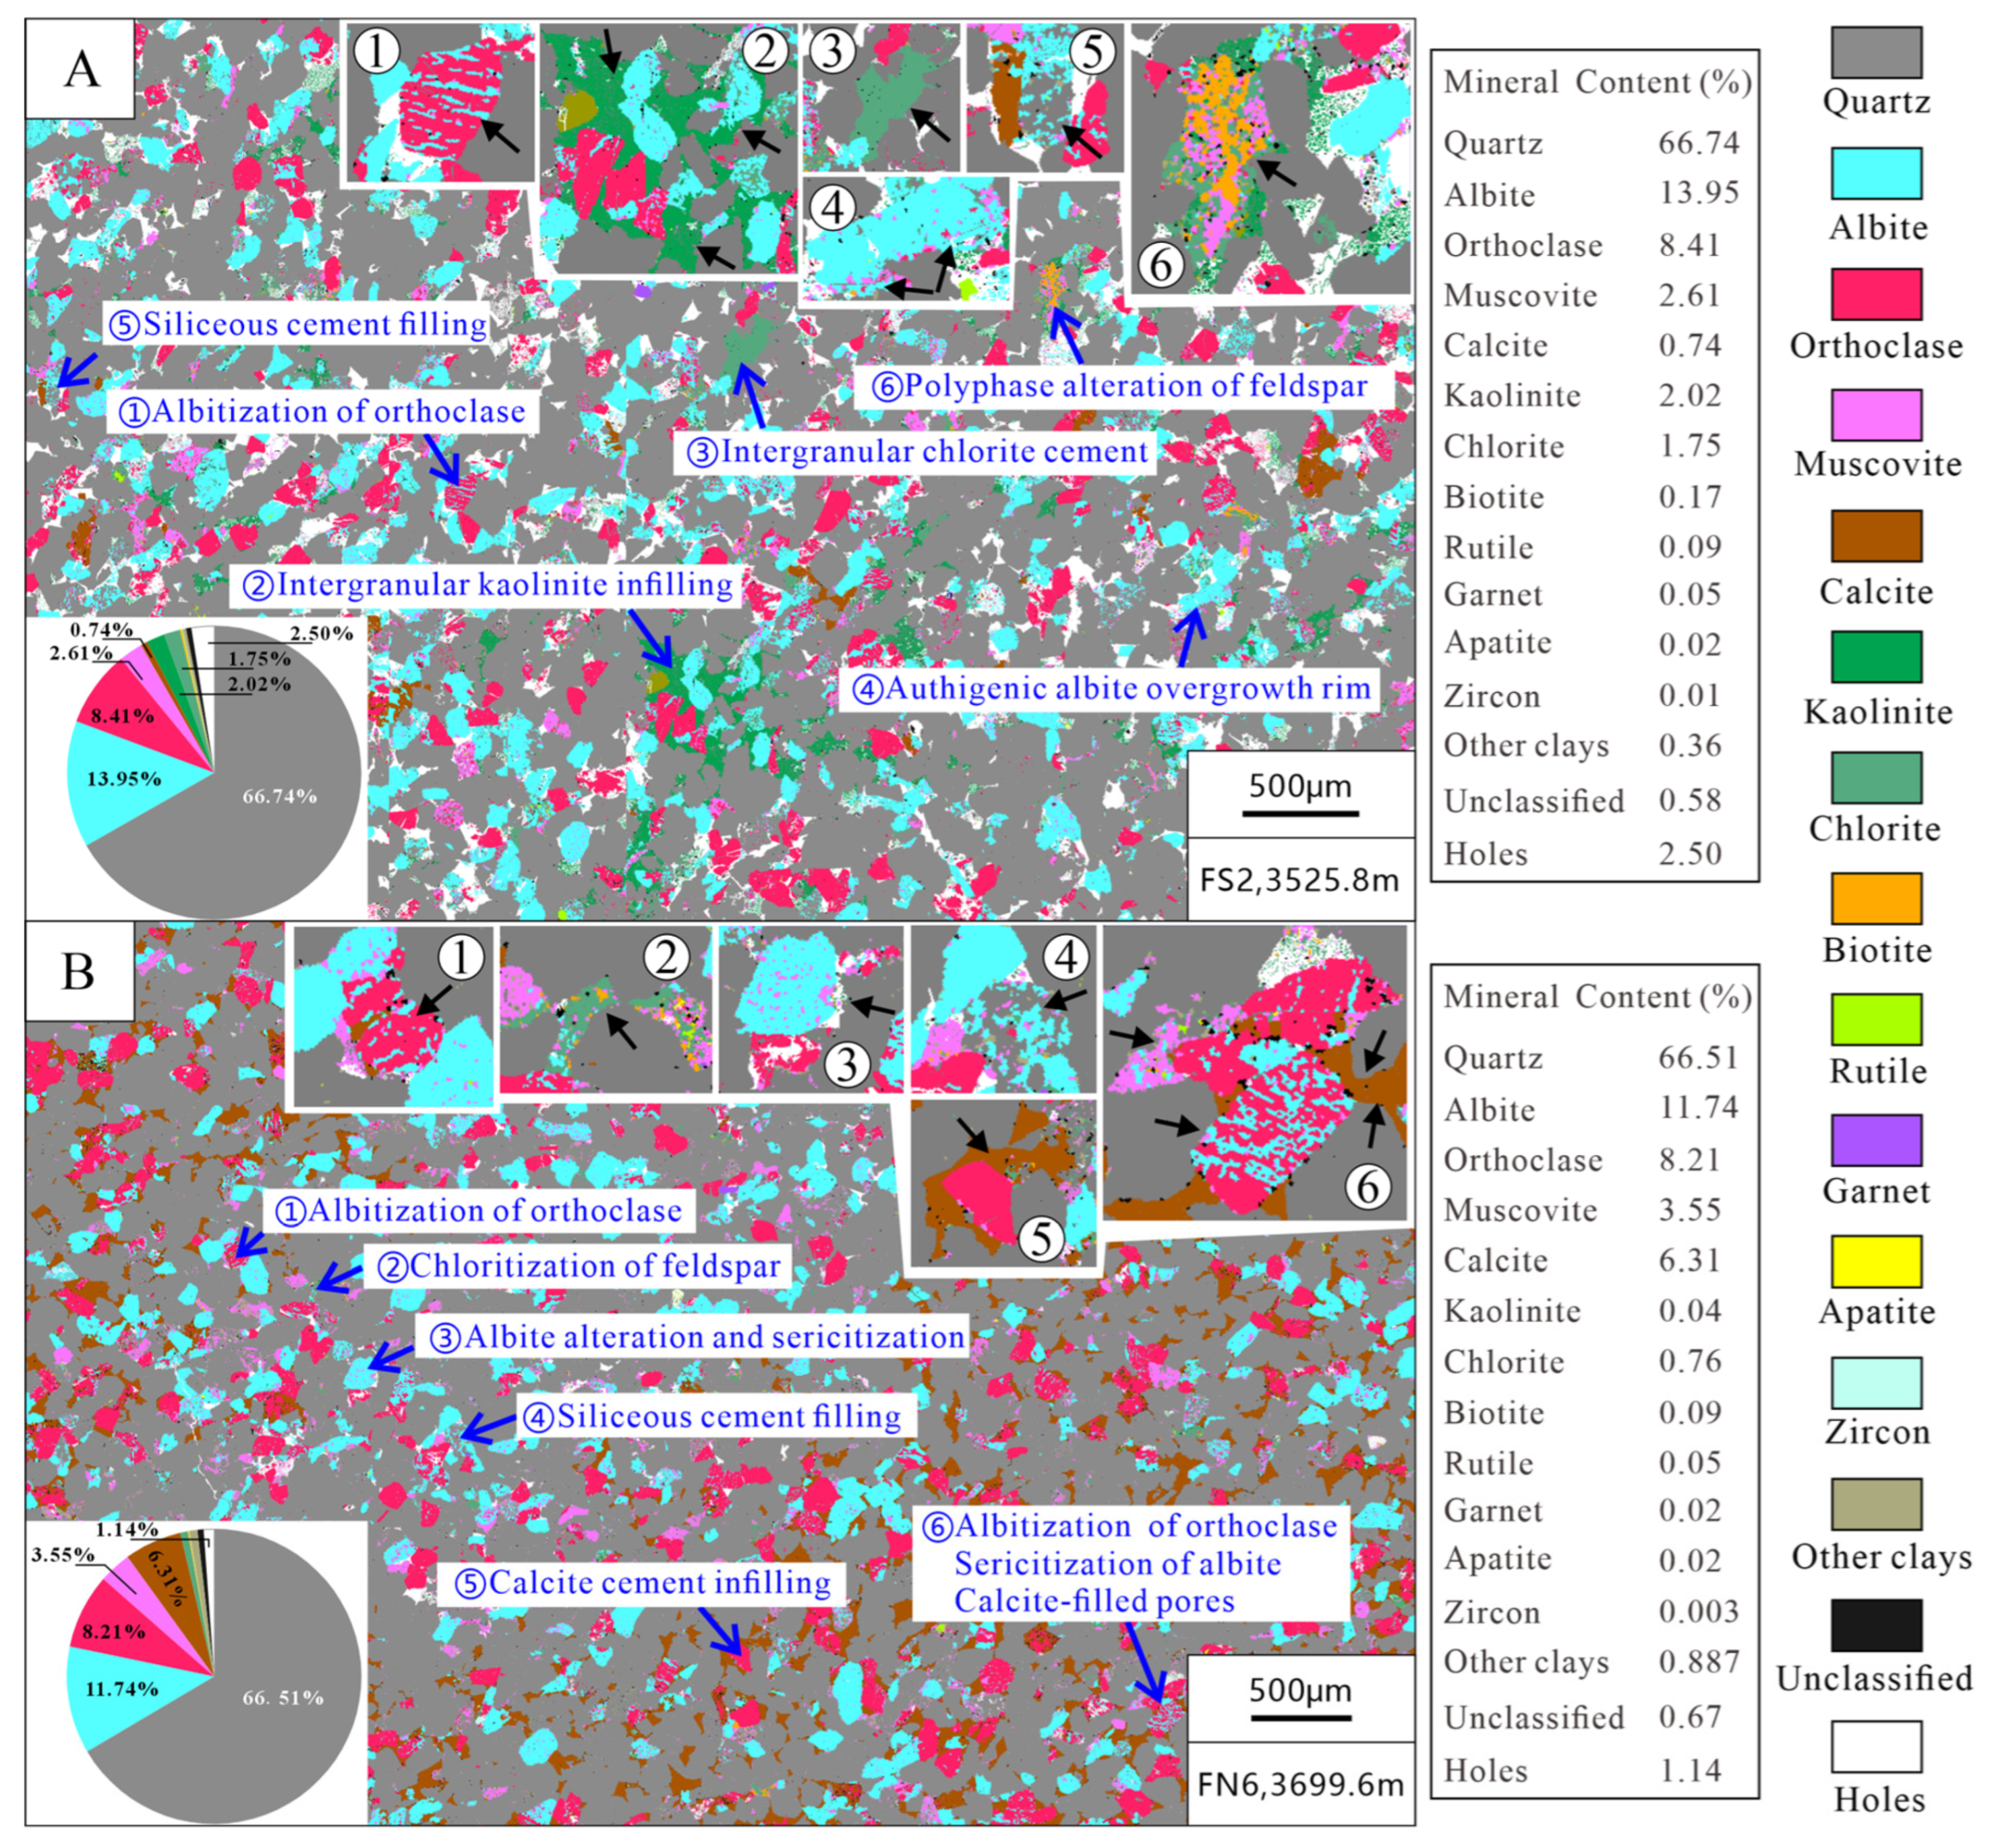
According to the TIMA measurements, the specific distribution of minerals and the symbiotic relationship between minerals can be clarified. The observations of the “sweet spot” in well FS2 and the “nonsweet spot” in well FN6 reveal multiple typical diagenetic phenomena. In the FS2 samples, albitization of K-feldspar, intergranular kaolinite filling, intergranular chlorite lining filling, authigenic albite feldspar overgrowth, siliceous cement filling, and multistage alteration of feldspar (including feldspar-kaolinization, albitization, sericitization, and chloritization) (Figure 15A) are observed. In the FN6 samples, albitization of potassium feldspar, intergranular chlorite lining filling, albite alteration and sericitization, filling of siliceous cements, and filling of carbonate cements (Figure 15B) are observed, and the cements primarily filling the pores in the non-sweet-spot section are mainly calcite; overall, it is in the meso-diagenetic stage when the acidic environment is transformed to an alkaline environment.
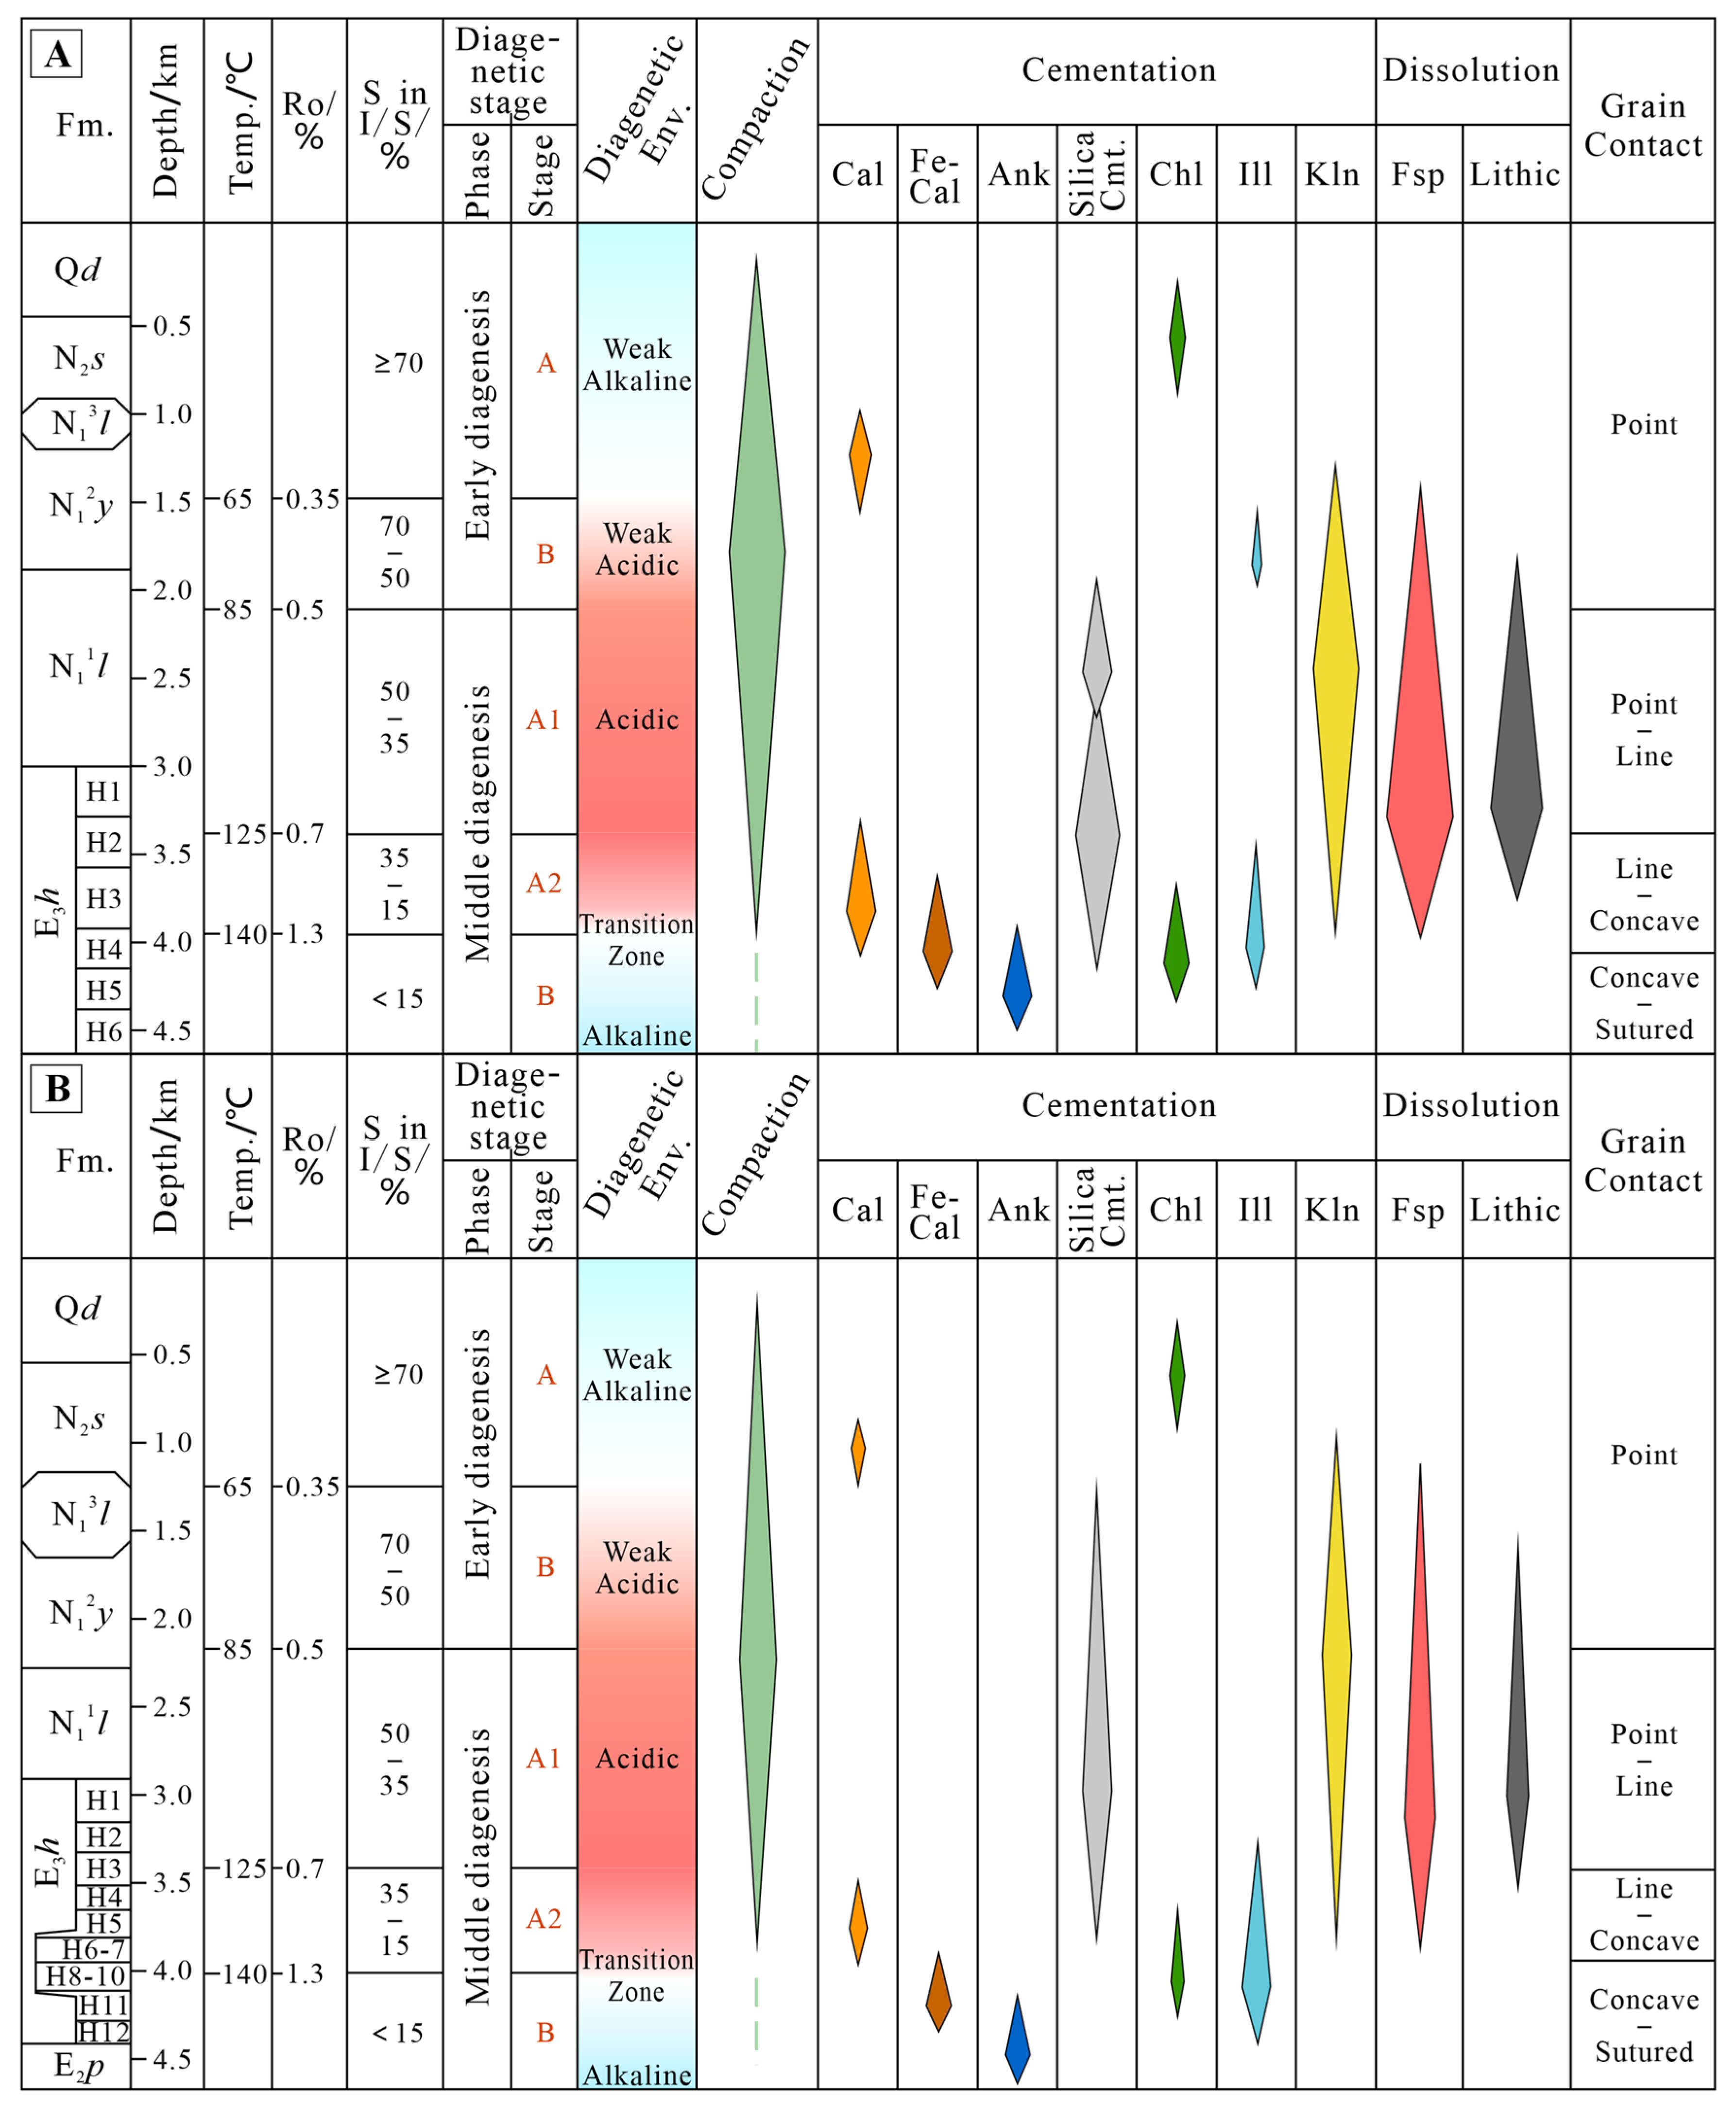
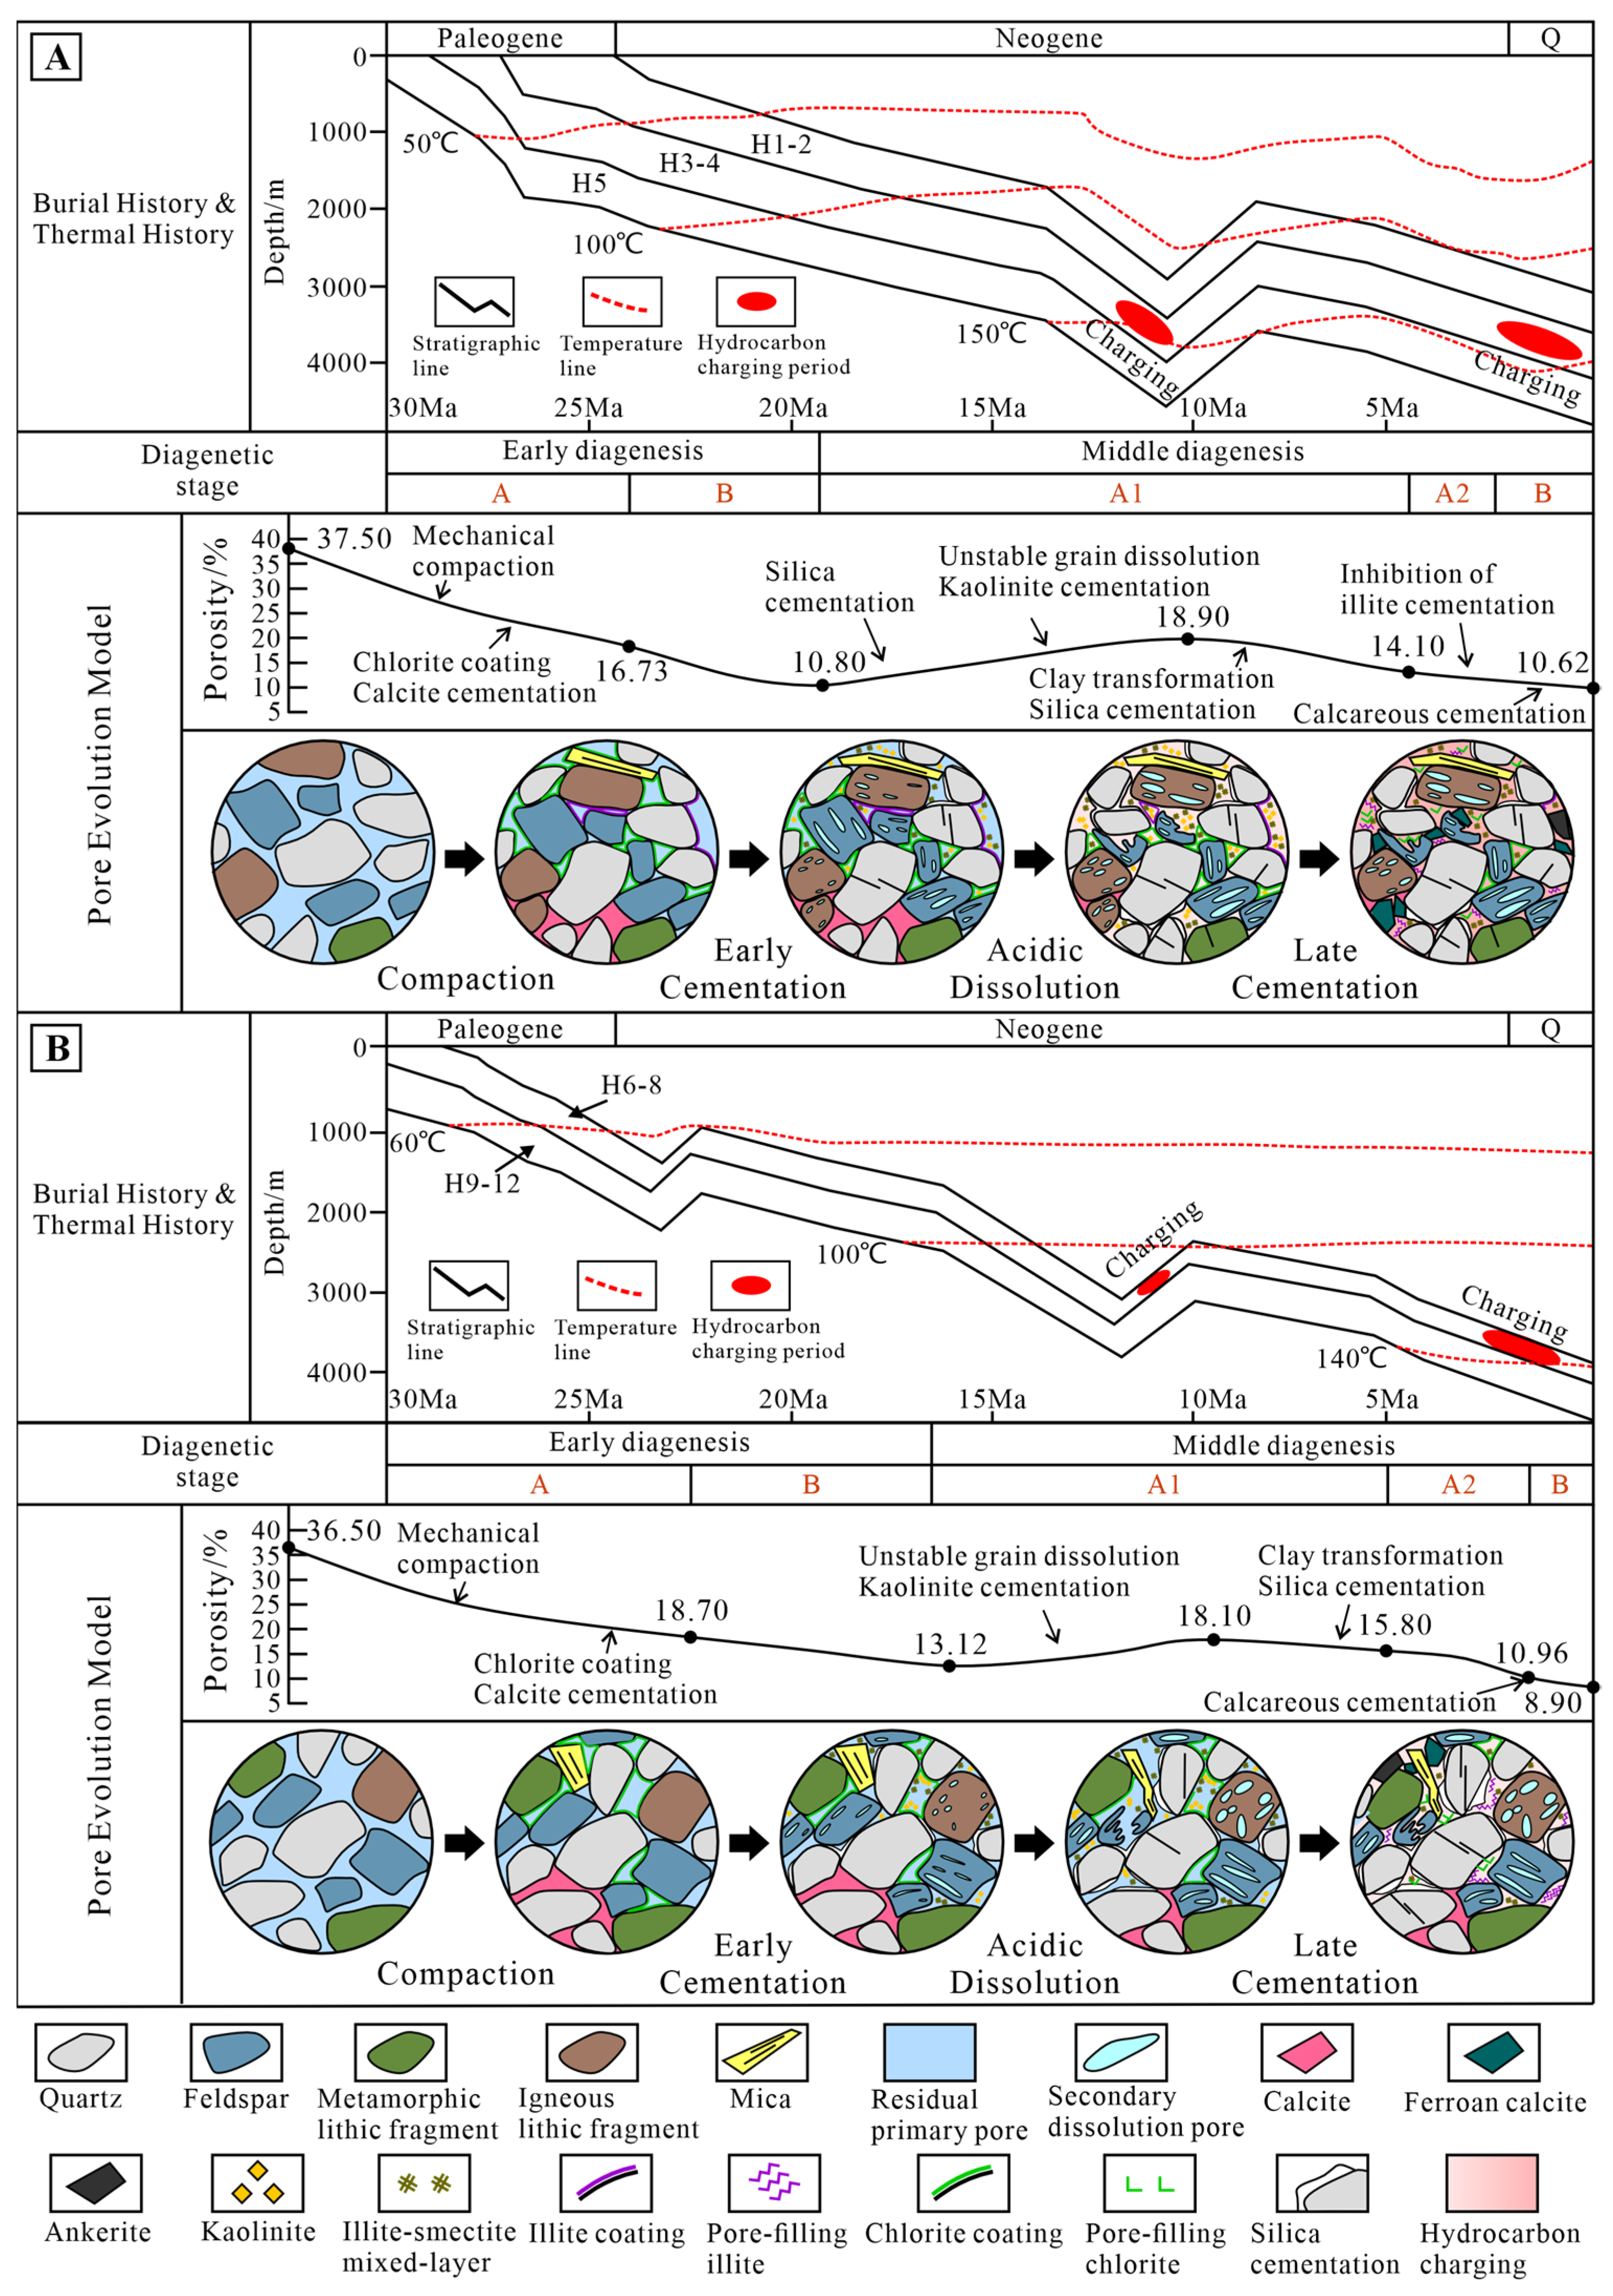
The diagenetic environments of the reservoirs are divided based on the clay mineral composition and the petrophysical characteristics of the reservoirs. The reservoirs of the Huagang Formation in the FN area can be divided from shallow to deep into three diagenetic belts, i.e., the acidic diagenetic environment, the acid-alkaline transition zone, and the alkaline diagenetic environment. For reservoirs shallower than 3600 m, the temperature is low, dissolution pores develop, the main clay mineral type consists of authigenic kaolinite, feldspar and rock fragments are strongly affected by dissolution, the reservoir petrophysical characteristics are generally, the reservoir is not tight, and it is the acidic diagenetic environment. For reservoirs at depths of 3600–3900 m, the acidic diagenetic environment is gradually weakened, the authigenic chlorite and authigenic illite start to develop. In particular, more authigenic chlorite is present compared to the FS area, and the highest content of clay minerals can be over 80%. Illite coatings transformed from early-filtration montmorillonites can also be observed under a microscope, which grow as bands on the edges of some particles to protect the pores. As iron-rich calcite develops, some reservoirs are severely cemented, and the compaction effect in the FN area is more effective at reducing porosity; as a result, it gradually becomes tight, resulting in the coexistence of high-quality and tight reservoirs. When the burial depth is greater than 3900 m, the diagenetic environment gradually changes from the acid-alkaline transition zone to the alkaline zone, the formation temperature is generally higher than 140 °C, the reservoir compaction is further strengthened, the carbonate minerals continue to develop in the late stage, the reservoir is generally tight, and it is a closed alkaline diagenetic environment (Figure 16A). The diagenetic sequence corresponding to the Upper Member of the Huagang Formation in the FN area is as follows: early mechanical compaction → a small amount of chlorite around the edge, early calcite cementation (early diagenesis stage A) → early quartz secondary overgrowth, early illite coating (early diagenesis stage B) → leaching of meteoric water, coal-bearing strata and early source rocks entering the oil generation threshold and producing acidic fluid → dissolution of unstable components, such as feldspar and rock fragments → evolution of organic matter in the hydrocarbon source rock into the low-maturity-mature stage, with enhanced dissolution effect, feldspar undergoing significant dissolution, and clay minerals altering to kaolinite (meso-diagenetic A1 stage) → late quartz overgrowth, formation of calcite cements, transformation of clay minerals, chlorite and illite cementation (meso-diagenetic A2 stage) → filled chlorite, iron-rich calcite cements and precipitates, and gradual formation of late iron-rich dolomite (ankerite) (meso-diagenetic B stage).
In contrast, compared with the FN area, the Huagang Formation in the FS area experiences relatively weaker compaction and porosity reduction effects and weaker dissolution and porosity increase effects, and the scale of the sweet spots is relatively small. The acid-alkaline transition zone is relatively indistinct. Using the burial depth of 4000 m, the diagenetic environment of reservoirs can be divided into an acidic diagenetic environment and a partially alkaline diagenetic environment. The reservoirs in the Upper Member of the Huagang Formation with a burial depth of less than 4000 m are in an acidic diagenetic environment, the dissolution enhances petrophysical characteristics, and the development of autogenous kaolinite is the primary characteristic. Below a burial depth of 4000 m, a slightly alkaline diagenetic environment exists, with intense compaction and enhanced late-stage cementation, and autogenous illite predominates as the primary clay cement type, resulting in generally tight reservoirs. The diagenetic sequence corresponding to the Huagang Formation in the FS area is as follows: early mechanical compaction → a small amount of chlorite and calcite cementation (early diagenesis stage A) → secondary quartz overgrowth (early diagenesis stage B) → organic matter maturation and organic acid filling → dissolution of unstable components, such as feldspar and rock fragments, kaolinite cementation (meso-diagenetic A1 stage) → transformation of clay minerals, chlorite and illite cementation (meso-diagenetic A2 stage) → iron-dolomite (ankerite) and ferrocalcite cementation (meso-diagenetic B stage) (Figure 16B).

5.4. Pore Evolution Process

This study reconstructed the porosity evolution history for the H3–H4 sublayers (Upper Huagang Formation) in the FN area and the H6–H8 sublayers (Lower Huagang Formation) in the FS area. The reconstruction was based on petrophysical data and porosity statistics from cast thin sections, constrained by the initial porosity, current porosity, and the established diagenetic sequence.
First, the original porosity is reconstructed based on the sandstone sorting coefficient using Equation (1) [69]. The calculation results reveal that the average original porosity of the H3–H4 sublayers in the FN area is 37.5% (56 samples, Trask sorting coefficient Sd = 1.38), and the average original porosity of the H6–H8 sublayers in the FS area is 36.5% (20 samples, Trask sorting coefficient Sd = 1.47).
Φ1 = 20.91 + 22.90/Sd
Here Φ1 is the original porosity (%), and Sd is the sorting coefficient.
Pore evolution process of the H3–H4 sublayer reservoirs in the FN area: At approximately 27 Ma, the Upper Member of the Huagang Formation starts to deposit, and the initial porosity is approximately 37.5%. In the early diagenetic stage A, the reservoir burial depth progressively increases to 1500 m. Under a weakly alkaline diagenetic environment, early mechanical compaction and early calcite cementation reduce porosity to approximately 16.73%. The early chlorite coating exhibits weak resistance to compaction, with pores primarily consisting of residual primary intergranular spaces. In the early diagenesis stage B, with increasing burial depth, it is a weakly acidic environment, ongoing compaction and early calcite cementation result in line contacts between some grains, reducing porosity to approximately 10.80%. In the meso-diagenetic A1 stage, compaction and early quartz secondary overgrowth cumulatively reduce porosity by approximately 7.6%, and extensive organic acid dissolution of unstable mineral components creates dissolution pores, increasing porosity by approximately 15.7%. Subsequently, dehydration and condensation of clay minerals, formation of autogenous clays, late-stage siliceous cementation, and late-stage calcite cementation collectively control the porosity to decrease by 4.8%. In the meso-diagenetic A2 stage, porosity remains at approximately 14.10%. This stage is the primary injection stage, during which illite cementation is suppressed. However, as temperatures rose, the acidic environment shifts toward alkalinity, triggering the formation of ferruginous carbonate cement. Compaction continued to intensify, resulting in the current porosity of 10.62%. According to Equation (2), the multistage diagenesis in the H3–H4 sublayers of the Upper Member of the Huagang Formation of the FN area causes a cumulative decrease of 26.88% in reservoir porosity (Figure 17A).
Φcompaction = Φ1 + ΦdissolutionΦcementationΦpresent
In Equation (2), Φcompaction is the reduction in reservoir porosity due to compaction, %; Φdissolution is the increase in reservoir porosity due to dissolution, %; and Φcement is the reduction in reservoir porosity due to cementation, %; Φpresent is the present porosity, %.
Pore evolution process of the H6–H8 sublayer reservoirs in the FS area: At approximately 31 Ma, the Lower Member of the Huagang Formation starts to deposit, and the initial porosity is approximately 36.5%. In the early diagenetic stage A, the reservoir burial depth progressively increases to 1200 m. Under a weakly alkaline diagenetic environment, early mechanical compaction and early calcite cementation reduce porosity to approximately 18.70%. At this stage, the pores consist of residual primary intergranular pores. In the early diagenetic stage B, the reservoir burial depth reaches 2200 m. Under a weakly acidic diagenetic environment, secondary overgrowth of quartz grains begins to form, with cumulative porosity decreasing to approximately 13.12%. In the meso-diagenetic A1 stage, compaction and secondary quartz overgrowth reduce porosity by approximately 8.8%. Organic acids generated in the Pinghu and Huagang coal-bearing strata dissolve feldspar and rock fragments, resulting in a porosity increase of approximately 4.98% due to secondary dissolution pores. Subsequently, as I/S mixed-layer and illite-dominated clay minerals fill the pores, reservoir porosity decreases by approximately 2.3%. In the meso-diagenetic A2 stage, pores are filled with chlorite and illite cementation, along with late-stage calcite. Although hydrocarbon injection provides some protection to the pores, the intensity is weaker than that in the FN area [70], resulting in a decrease in total porosity to approximately 10.96%. In the meso-diagenetic B stage, the temperature reaches 140 °C, halting the quartz overgrowth. Localized dissolution occurs, with iron calcite and iron dolomite filling residual pores, reducing the reservoir porosity to its current level of 8.90%. According to Equation (2), the multistage diagenesis in the H6–H8 sublayers of the Lower Member of the Huagang Formation of the FS area causes a cumulative decrease of 27.60% in reservoir porosity (Figure 17B).
Figure 17. (A) Evolution pattern of the pores in the H3–H4 sublayers of the Upper Member of the Huagang Formation in the FN area; (B) evolution pattern of the pores in the H6–H8 sublayers of the Lower Member of the Huagang Formation in the FS area (buried historical records in [22,71]). Note: Subfigure labels (A, B, etc.) are bolded and boxed for clarity. The letters “A”, “A1”, “A2”, and “B” within the images refer to eogenetic and mesogenetic diagenetic stages.
Energies 19 00238 g017
The evolution results reveal that mechanical compaction causes the loss of approximately 80% in the porosity of the reservoirs in the Huagang Formation, which is the main factor causing tight reservoir formation. Moreover, cementation causes a loss of approximately 10% to 20% in reservoir porosity, representing a significant factor in the reduction in reservoir pores, and dissolution is the fundamental reason for the massive development of pores in the deep reservoirs of the Upper Member of the Huagang Formation.

6. Conclusions

(1)
The reservoir sandstones of the Huagang Formation in the Central Anticlinal Belt are dominated by feldspar-lithic quartz sandstones. The grain size proportion of silty sand-class grains is relatively greater in the south (FS area) than in the north (FN area), and the sorting is better. The comprehensive analysis of the GZI, RuZi, ATI and ZTR shows that the Huagang Formation is a near-source sedimentary system, with sediments ranging from mature to immature. The reservoirs in the FN area are characterized by a high biotite content and low GZI, low RuZi, high ATI, and moderate ZTR values, indicating that the provenance consists primarily of acidic igneous rocks, with relatively weak resistance to compaction and favorable prospects for dissolution modification. Reservoirs in the FS area are characterized by a low biotite content and very high GZI, high RuZi, high ATI, and low ZTR values, indicating that the provenance primarily consists of high-grade metamorphic rocks rich in garnet and rutile, and the resistance to compaction is relatively strong, but prospects for dissolution modification are less promising compared to the FN area.
(2)
The Huagang Formation at a burial depth of 3500–4400 m is a low-porosity and low-permeability reservoir, and the sandstone reservoirs with a burial depth of ≥4400 m are tight reservoirs. Vertically, the petrological characteristics of the reservoir in the FN area decrease faster than those in the FS area with increasing burial depth. However, within the burial depth range of 3600–3900 m, there is a strong dissolution zone with relatively better petrological characteristics in the FN area. The pattern of deep sandstone T2 NMR curves is classified into three types, i.e., mesopores are most developed, macropores are least developed, and pore throat radius gradually decreases with increasing burial depth. Compaction in the FN and FS areas results in average relative pore losses of 76% and 81%, respectively, constituting the primary destructive factor affecting reservoir petrological characteristics; cementation causes average relative pore losses of 18% and 12%, respectively, representing a secondary destructive factor. In the FN area, dissolution is the primary constructive diagenetic process.
(3)
The content of authigenic clay cements in the Huagang Formation reservoirs exhibits significant vertical variation: chlorite and kaolinite cement contents gradually decrease with increasing burial depth, whereas those of I/S mixed-layer and illite cements increase. The diagenetic regimes differ between the two areas. In the FN area, which currently has higher geothermal temperatures, diagenesis is characterized by two stages of quartz secondary overgrowths and two stages of calcite cementation. Vertically, its Upper Member is divided into an acidic diagenetic environment and an acid-alkaline transition zone at a burial depth of approximately 3900 m. In contrast, the FS area experiences lower present-day temperatures and features one stage of quartz secondary overgrowths alongside two stages of calcite cementation. Here, the formation is similarly divided at around 4000 m depth. Consequently, multistage diagenesis has cumulatively reduced reservoir porosity by 26.88% in the H3–H4 sublayers of the FN area and by 27.60% in the H6–H8 sublayers of the FS area.

Author Contributions

Conceptualization, X.Z.; software, Q.Y.; validation, W.Z. and G.X.; formal analysis, X.Z. and G.X.; investigation, W.Z.; data curation, Q.Y.; writing—original draft, X.Z.; writing—review and editing, F.X., J.L. and X.Z.; supervision, F.X.; funding acquisition, F.X. All authors have read and agreed to the published version of the manuscript.

Funding

This research was funded by the National Natural Science Foundation Youth Foundation Project of China (funder Fanghao Xu; grant number 42302186) and the National Natural Science Foundation of China (funder Changgui Xu; grant number U25B6026).

Data Availability Statement

The original contributions presented in the study are included in the article, further inquiries can be directed to the corresponding author.

Acknowledgments

We are grateful to the Shanghai Branch of CNOOC (China National Offshore Oil Corporation) for providing the deep sandstone samples and basic geological data, which have greatly supported our research.

Conflicts of Interest

Authors Jinshui Liu, Wu Zhang, and Qing Yu were employed by the Shanghai Branch of CNOOC (China National Offshore Oil Corporation). The remaining authors declare that the research was conducted in the absence of any commercial or financial relationships that could be construed as a potential conflict of interest.

References

  1. Zou, C.; Yang, Z.; He, D.; Wei, Y.; Li, J.; Jia, A.; Chen, J.; Zhao, Q.; Li, Y.; Li, J.; et al. Theory, Technology and Prospects of Conventional and Unconventional Natural Gas. Pet. Explor. Dev. 2018, 45, 604–618. [Google Scholar] [CrossRef]
  2. Wang, J.; Wang, B.; Hu, Z.; Shang, F.; Liu, D.; Li, Z.; Qiu, Q.; Song, Z.; Hu, Z. Genetic Mechanisms of High-Quality Deep to Ultra-Deep Clastic Reservoirs: A Case Study of the Permian-Triassic Strata in the Hinterland of the Junggar Basin. Oil Gas Geol. 2025, 46, 151–166. [Google Scholar] [CrossRef]
  3. Cao, Y.; Yuan, G.; Yang, H.; Wang, Y.; Liu, K.; Zan, N.; Xi, K.; Wang, J. Current Situation of Oil and Gas Exploration and Research Progress of the Origin of High-Quality Reservoirs in Deep-Ultra-Deep Clastic Reservoirs of Petroliferous Basins. Acta Pet. Sin. 2022, 43, 112. [Google Scholar] [CrossRef]
  4. Dai, J.; Ni, Y.; Dong, D.; Qin, S.; Zhu, G.; Huang, S.; Yu, C.; Gong, D.; Hong, F.; Zhang, Y.; et al. 2021–2025 Is a Period of Great Development of China’s Natural Gas Industry: Suggestions on the Exploration and Development of Natural Gas during the 14th Five-Year Plan in China. Nat. Gas Geosci. 2021, 32, 183–197. [Google Scholar] [CrossRef]
  5. He, D.; Ma, Y.; Liu, B.; Cai, X.; Zhang, Y.; Zhang, J. Main Advances and Key Issues for Deep-Seated Exploration in Petroliferous Basins in China. Earth Sci. Front. 2019, 26, 1–12. [Google Scholar] [CrossRef]
  6. Jia, C.; Pang, X. Research Processes and Main Development Directions of Deep Hydrocarbon Geological Theories. Acta Pet. Sin. 2015, 36, 1457. [Google Scholar] [CrossRef]
  7. Xu, C.; Zou, W.; Yang, Y.; Duan, Y.; Shen, Y.; Luo, B.; Ni, C.; Fu, X.; Zhang, J. Status and prospects of exploration and exploitation of the deep oil & gas resources onshore China. Nat. Gas Geosci. 2017, 28, 1139–1153. Available online: http://www.nggs.ac.cn/EN/10.11764/j.issn.1672-1926.2017.07.014 (accessed on 24 December 2025).
  8. Zhu, G.; Sun, C.; Zhao, B.; Li, T.; Chen, Z.; Yang, H.; Gao, L.; Huang, J. Formation, Evaluation Technology and Preservation Lower Limit of Ultra-Deep Ancient Fracture-Cavity Carbonate Reservoirs below 7000 m. Nat. Gas Geosci. 2020, 31, 587–601. [Google Scholar] [CrossRef]
  9. Ma, B.; Cao, Y.; Eriksson, K.A.; Jia, Y.; Gill, B.C. Depositional and Diagenetic Controls on Deeply-Buried Eocene Sublacustrine Fan Reservoirs in the Dongying Depression, Bohai Bay Basin, China. Mar. Pet. Geol. 2017, 82, 297–317. [Google Scholar] [CrossRef]
  10. Morad, S.; Ketzer, J.M.; De Ros, L.F. Spatial and Temporal Distribution of Diagenetic Alterations in Siliciclastic Rocks: Implications for Mass Transfer in Sedimentary Basins. Sedimentology 2000, 47, 95–120. [Google Scholar] [CrossRef]
  11. Wang, J.; Cao, Y.; Liu, K.; Liu, J.; Kashif, M. Identification of Sedimentary-Diagenetic Facies and Reservoir Porosity and Permeability Prediction: An Example from the Eocene Beach-Bar Sandstone in the Dongying Depression, China. Mar. Pet. Geol. 2017, 82, 69–84. [Google Scholar] [CrossRef]
  12. Higgs, K.E.; Zwingmann, H.; Reyes, A.G.; Funnell, R.H. Diagenesis, Porosity Evolution, and Petroleum Emplacement in Tight Gas Reservoirs, Taranaki Basin, New Zealand. J. Sediment. Res. 2007, 77, 1003–1025. [Google Scholar] [CrossRef]
  13. Morad, S.; Al-Ramadan, K.; Ketzer, J.M.; Ros, L.F.D. The Impact of Diagenesis on the Heterogeneity of Sandstone Reservoirs: A Review of the Role of Depositional Facies and Sequence Stratigraphy. AAPG Bull. 2010, 94, 1267–1309. [Google Scholar] [CrossRef]
  14. Qian, W.; Yin, T.; Zhang, C.; Tang, H.; Hou, G. Diagenetic Evolution of the Oligocene Huagang Formation in Xihu Sag, the East China Sea Shelf Basin. Sci. Rep. 2020, 10, 19402. [Google Scholar] [CrossRef]
  15. Wang, W.; Yue, D.; Zhao, J.; Li, W.; Wang, B.; Wu, S.; Li, S. Diagenetic Alteration and Its Control on Reservoir Quality of Tight Sandstones in Lacustrine Deep-Water Gravity-FLow Deposits: A Case Study of the Yanchang Formation, Southern Ordos Basin, China. Mar. Pet. Geol. 2019, 110, 676–694. [Google Scholar] [CrossRef]
  16. Zhang, Y.; Pe-Piper, G.; Piper, D.J.W. How Sandstone Porosity and Permeability Vary with Diagenetic Minerals in the Scotian Basin, Offshore Eastern Canada: Implications for Reservoir Quality. Mar. Pet. Geol. 2015, 63, 28–45. [Google Scholar] [CrossRef]
  17. Radwan, A.E.; Husinec, A.; Benjumea, B.; Kassem, A.A.; El Aal, A.A.; Hakimi, M.H.; Thanh, H.V.; Abdel-Fattah, M.I.; Shehata, A.A. Diagenetic Overprint on Porosity and Permeability of a Combined Conventional-Unconventional Reservoir: Insights from the Eocene Pelagic Limestones, Gulf of Suez, Egypt. Mar. Pet. Geol. 2022, 146, 105967. [Google Scholar] [CrossRef]
  18. Xi, K.; Cao, Y.; Liu, K.; Wu, S.; Yuan, G.; Zhu, R.; Kashif, M.; Zhao, Y. Diagenesis of Tight Sandstone Reservoirs in the Upper Triassic Yanchang Formation, Southwestern Ordos Basin, China. Mar. Pet. Geol. 2019, 99, 548–562. [Google Scholar] [CrossRef]
  19. Zhang, X.; Cai, Q.; Wang, W.; Hu, Q.; Ren, L.; Su, A.; Hu, M.; Hu, Z.; Deng, Q. Differential Development Characteristics and Main Controlling Factors of High-Quality Clastic Reservoirs in the Middle-Deep Strata: A Case Study on the Paleogene Yacheng Formation and Neogene Sanya Formation around Ya’nan Area, Qiongdongnan Basin. Oil Gas Geol. 2025, 46, 876–893. [Google Scholar] [CrossRef]
  20. Zhong, D.; Zhu, X.; Zhang, Z.; Cai, J.A.X.Z. Controlling Factors of Sandstone Reservoir of the Paleogene in Dongying Sag. Pet. Explor. Dev. 2003, 30, 376. Available online: https://www.sciengine.com/PED/doi/10.0000/1000-0747-30-376 (accessed on 24 December 2025).
  21. Huang, D.; Zhu, Y.; Yan, Z.; He, X.; Li, C.; Liu, C.; Liu, B. Diagenetic Controls on Reservoir Quality in Deep Ultra-Thick Sandstones: A Case Study from the Huagang Formation, Xihu Depression, East China Sea. Energy Geosci. 2025, 100474. [Google Scholar] [CrossRef]
  22. Huang, X.; Lin, C.; Huang, D.; Duan, D.; Lin, J.; He, X.; Liu, B. Diagenetic Differential Evolution of Huagang Formation Sandstone Reservoir in North-Central Part of Central Reversal Structural Belt in Xihu Sag. Pet. Geol. Recovery Effic. 2022, 29, 1–14. [Google Scholar] [CrossRef]
  23. Su, A.; Chen, H.; Wang, C.; Li, Q.; Li, P. Densification Mechanism and Diagenesis Fluid Evolution of Low-Porosity and Low-Permeability Tight Sandstone Reservoir: An Example from Huagang Formation in the Northern of the Central Anticlinal Zone in Xihu Depression, East China Sea. J. China Univ. Min. Technol. 2016, 45, 972–981. [Google Scholar] [CrossRef]
  24. Wang, W.; Lin, C.; Zhang, X.; Dong, C.; Ren, L.; Lin, J. Provenance, Clastic Composition and Their Impact on Diagenesis: A Case Study of the Oligocene Sandstone in the Xihu Sag, East China Sea Basin. Mar. Pet. Geol. 2021, 126, 104890. [Google Scholar] [CrossRef]
  25. Xu, F.; Xu, G.; Liu, Y.; Zhang, W.; Cui, H.; Wang, Y. Factors Controlling the Development of Tight Sandstone Reservoirs in the Huagang Formation of the Central Inverted Structural Belt in Xihu Sag, East China Sea Basin. Pet. Explor. Dev. 2020, 47, 101–113. [Google Scholar] [CrossRef]
  26. Bjørlykke, K.; Jahren, J. Open or Closed Geochemical Systems during Diagenesis in Sedimentary Basins: Constraints on Mass Transfer during Diagenesis and the Prediction of Porosity in Sandstone and Carbonate Reservoirs Geohorizon. AAPG Bull. 2012, 96, 2193–2214. [Google Scholar] [CrossRef]
  27. Bjørlykke, K. Relationships between Depositional Environments, Burial History and Rock Properties. Some Principal Aspects of Diagenetic Process in Sedimentary Basins. Sediment. Geol. 2014, 301, 1–14. [Google Scholar] [CrossRef]
  28. Yuan, G.; Cao, Y.; Gluyas, J.; Li, X.; Xi, K.; Wang, Y.; Jia, Z.; Sun, P.; Oxtoby, N.H. Feldspar Dissolution, Authigenic Clays, and Quartz Cements in Open and Closed Sandstone Geochemical Systems during Diagenesis: Typical Examples from Two Sags in Bohai Bay Basin, East China. AAPG Bull. 2015, 99, 2121–2154. [Google Scholar] [CrossRef]
  29. Clark, S. Constraining Diagenetic Timings, Processes and Reservoir Quality in Igneous-Affected Basins. Ph.D. Thesis, Durham University, Durham, UK, 2014. Available online: https://etheses.dur.ac.uk/10827/ (accessed on 24 December 2025).
  30. Gluyas, J.; Garland, C.; Oxtoby, N.H.; Hogg, A.J.C. Quartz Cement: The Miller’s Tale. In Quartz Cementation in Sandstones; John Wiley & Sons, Ltd.: Hoboken, NJ, USA, 2000; pp. 199–218. ISBN 978-1-4443-0423-7. Available online: https://onlinelibrary.wiley.com/doi/abs/10.1002/9781444304237.ch14 (accessed on 24 December 2025).
  31. Luo, L.; Meng, W.; Gluyas, J.; Tan, X.; Gao, X.; Feng, M.; Kong, X.; Shao, H. Diagenetic Characteristics, Evolution, Controlling Factors of Diagenetic System and Their Impacts on Reservoir Quality in Tight Deltaic Sandstones: Typical Example from the Xujiahe Formation in Western Sichuan Foreland Basin, SW China. Mar. Pet. Geol. 2019, 103, 231–254. [Google Scholar] [CrossRef]
  32. Zhang, J.; Pas, D.; Krijgsman, W.; Wei, W.; Du, X.; Zhang, C.; Liu, J.; Lu, Y. Astronomical Forcing of the Paleogene Coal-Bearing Hydrocarbon Source Rocks of the East China Sea Shelf Basin. Sediment. Geol. 2020, 406, 105715. [Google Scholar] [CrossRef]
  33. Zhu, W.; Zhong, K.; Fu, X.; Chen, C.; Zhang, M.; Gao, S. The Formation and Evolution of the East China Sea Shelf Basin: A New View. Earth-Sci. Rev. 2019, 190, 89–111. [Google Scholar] [CrossRef]
  34. Cai, H.; Zhang, J.; Tang, X. Characteristics of the Fault Systems and Their Control on Hydrocarbon Accumulation in the Xihu Sag, East China Sea Shelf Basin. Nat. Gas Ind. 2014, 34, 18–26. [Google Scholar] [CrossRef]
  35. Zhang, G.; Zhang, J. A Discussion on the Tectonic Inversion and Its Genetic Mechanism in the East China Sea Shelf Basin. Earth Sci. Front. 2015, 22, 260. [Google Scholar] [CrossRef]
  36. Wang, W.; Lin, C.; Zhang, X.; Dong, C.; Ren, L.; Lin, J. Effect of Burial History on Diagenetic and Reservoir-Forming Process of the Oligocene Sandstone in Xihu Sag, East China Sea Basin. Mar. Pet. Geol. 2020, 112, 104034. [Google Scholar] [CrossRef]
  37. Yang, Y.; Huang, Z.; Pan, Y.; Liu, C.; Qu, T.; Li, Z. Hydrocarbon Accumulation Process and Reservoir-Forming Models of Structure A in the Central Inversion Tectonic Belt of the Xihu Depression, East China Sea Basin. Nat. Gas Ind. B 2024, 11, 341–356. [Google Scholar] [CrossRef]
  38. Zhang, J.; Lu, Y.; Krijgsman, W.; Liu, J.; Li, X.; Du, X.; Wang, C.; Liu, X.; Feng, L.; Wei, W.; et al. Source to Sink Transport in the Oligocene Huagang Formation of the Xihu Depression, East China Sea Shelf Basin. Mar. Pet. Geol. 2018, 98, 733–745. [Google Scholar] [CrossRef]
  39. Lin, C.; Sun, X.; Ma, C.; Zhang, X.; Zhao, Z. Physical Property Evolution of Huagang Formation in Central Inversion Tectonic Belt in Xihu Depression. J. China Univ. Min. Technol. 2017, 46, 700–709. [Google Scholar] [CrossRef]
  40. Quan, Y.; Chen, Z.; Jiang, Y.; Diao, H.; Xie, X.; Lu, Y.; Du, X.; Liu, X. Hydrocarbon Generation Potential, Geochemical Characteristics, and Accumulation Contribution of Coal-Bearing Source Rocks in the Xihu Sag, East China Sea Shelf Basin. Mar. Pet. Geol. 2022, 136, 105465. [Google Scholar] [CrossRef]
  41. Sun, X.; Lin, C.; Dong, C.; Zhang, X.; Ma, C.; Lin, J.; Xie, J. Influence of Chlorite on Siliceous Cement under Control of Reservoir Lithology. Earth Sci. 2017, 42, 1599–1607. [Google Scholar] [CrossRef]
  42. Wang, W.; Lin, C.; Zhang, X.; Dong, C.; Ren, L.; Lin, J. Structural Controls on Sandstone Compaction within the Anticline Crest and Flank: An Example from the Xihu Sag, East China Sea Basin. J. Pet. Sci. Eng. 2022, 211, 110157. [Google Scholar] [CrossRef]
  43. Li, H.; Yang, X.; Zhu, H.; Wang, W. Depositional and Diagenetic Controls on the Evolution of Abnormally High Porosity in Braided River Deltaic Sandstones (Oligocene), Xihu Depression, East China Sea. Geoenergy Sci. Eng. 2023, 226, 211751. [Google Scholar] [CrossRef]
  44. International Commission on Stratigraphy. International Chronostratigraphic Chart (v2024/12). Available online: https://stratigraphy.org/chart (accessed on 24 December 2025).
  45. Haq, B.U.; Hardenbol, J.; Vail, P.R. Chronology of Fluctuating Sea Levels since the Triassic. Science 1987, 235, 1156–1167. [Google Scholar] [CrossRef] [PubMed]
  46. Zhu, H.; Lu, Y.; Pan, Y.; Qiao, P.; Raza, A.; Liu, W. Nanoscale Mineralogy and Organic Structure Characterization of Shales: Insights via AFM-IR Spectroscopy. Adv. Geo-Energy Res. 2024, 13, 231–236. [Google Scholar] [CrossRef]
  47. Yang, R.; He, S.; Yi, J.; Hu, Q. Nano-Scale Pore Structure and Fractal Dimension of Organic-Rich Wufeng-Longmaxi Shale from Jiaoshiba Area, Sichuan Basin: Investigations Using FE-SEM, Gas Adsorption and Helium Pycnometry. Mar. Pet. Geol. 2016, 70, 27–45. [Google Scholar] [CrossRef]
  48. Fang, L.; Xu, F.; Xu, G.; Liu, J.; Liang, H.; Gong, X.; Fang, L.; Xu, F.; Xu, G.; Liu, J.; et al. Quantitative Classification of Shale Lithofacies and Gas Enrichment in Deep-Marine Shale of the Late Ordovician Wufeng Formation and Early Silurian Longyi1 Submember, Sichuan Basin, China. Energies 2025, 18, 1835. [Google Scholar] [CrossRef]
  49. Huo, H.-L.; Liu, C.-L.; Huang, D.-W.; Tian, A.-Q.; Awan, R.S.; Gao, H.-Y.; Liu, C.-X.; Chen, X.-Y.; Tian, Z.-Y.; Yang, T.-Z.; et al. Diagenesis and Burial History Controls on Oligocene Huagang Sandstones, Southern Xihu Sag (East China Sea Basin): Implications for the Formation of Effective Reservoirs. Mar. Pet. Geol. 2025, 182, 107592. [Google Scholar] [CrossRef]
  50. Folk, R.L.; Andrews, P.B.; Lewis, D.W. Detrital Sedimentary Rock Classification and Nomenclature for Use in New Zealand. N. Z. J. Geol. Geophys. 1970, 13, 937–968. [Google Scholar] [CrossRef]
  51. Liu, Y.; Xu, G.; Zeng, B.; Xu, F.; Zhang, W.; Gao, Y.; Yuan, H. Relationship between porosity evolution and hydrocarbon charging in tight sandstone reservoirs in Oligocene Huagang Formation, Xihu Sag, East China Sea Basin. Pet. Geol. Exp. 2018, 40, 168–176. [Google Scholar] [CrossRef]
  52. Liu, J.; Li, S.; Qin, L.; Yi, Q.; Chen, X.; Kang, S.; Shen, W.; Shao, L. Hydrocarbon Generation Kinetics of Paleogene Coal in Xihu Sag, East China Sea Basin. Acta Pet. Sin. 2020, 41, 1174. [Google Scholar] [CrossRef]
  53. Liu, Y.; Lin, C.; Lin, J.; Huang, X.; Liu, B. Pore Structure Characteristics and Genesis Analysis of Deep Tight Sandstone in Xihu Depression, East China Sea Basin. Nat. Gas Geosci. 2024, 35, 405–422. Available online: http://www.nggs.ac.cn/EN/10.11764/j.issn.1672-1926.2023.07.006 (accessed on 24 December 2025).
  54. Sun, J.; You, X.; Zhang, Q.; Xue, J.; Chang, Q. Development Characteristics and Genesis of Deep Tight Conglomerate Reservoirs of Mahu Area in Junggar Basin, China. J. Nat. Gas Geosci. 2023, 8, 201–212. [Google Scholar] [CrossRef]
  55. Zhang, X.; Lin, C.; Chen, Z. The Characteristics of Chlorite Minerals from Upper Triassic Yanchang Formation in Zhenjing Area, Ordos Basin. Acta Geol. Sin. 2011, 85, 1659–1671. Available online: http://geo.ijournals.cn/dzxbe/dzxbe/article/abstract/2010358 (accessed on 24 December 2025).
  56. Yan, Q.; Lei, H.; Xian, B.; Wang, J.; Luo, Z.; Yang, Z.; He, J.; Niu, J.; Pu, Q.; Tian, R. Influence of Source Rock Properties on the Development of Authigenic Chlorite in Conglomerate Reservoirs and Its Significance for Oil and Gas Reservoirs: A case study from the Lower Urhe Formation in the Mahu Depression, Junggar Basin. Acta Sedimentol. Sin. 2020, 38, 367–378. [Google Scholar] [CrossRef]
  57. Cai, L.; Yang, T.; Tian, J.; Yi, J.; Ren, Q. Advances in Studies of Development and Growth Mechanisms of Clay Minerals in Tight Sandstone Reservoirs. Acta Sedimentol. Sin. 2023, 41, 1859–1889. [Google Scholar] [CrossRef]
  58. Zhao, W.; He, S.; Guo, X.; Wang, Y.; Hao, X.; Xiong, W. Characteristics of Quartz Overgrowth in Sandstones from Es3 Interval Central Anticlinal Belt in Dongying Depression and Its Significance. Earth Sci. Online 2020, 45, 3487–3501. [Google Scholar] [CrossRef]
  59. Liu, K.; Wang, J.; Yin, G.; Chen, J.; Wu, Y.; Li, Y.; Dai, Z.; Yao, W.; Jiang, Z.; Xu, J. Quartz Dissolution and Its Mechanisms in the Pinghu Formation, Baowu Area, Xihu Sag, East China Sea Shelf Basin. Oil Gas Geol. 2025, 46, 1349–1366. Available online: https://www.sciopen.com/article/10.11743/ogg20250421 (accessed on 24 December 2025).
  60. Hansley, P.L. Petrologic and Experimental Evidence for the Etching of Garnets by Organic Acids in the Upper Jurassic Morrison Formation, Northwestern New Mexico. J. Sediment. Res. 1987, 57, 666–681. [Google Scholar] [CrossRef]
  61. Morton, A.; Mundy, D.; Bingham, G. High-Frequency Fluctuations in Heavy Mineral Assemblages from Upper Jurassic Sandstones of the Piper Formation, UK North Sea: Relationships with Sea-Level Change and Floodplain Residence. In Mineralogical and Geochemical Approaches to Provenance; Rasbury, E.T., Hemming, S.R., Riggs, N.R., Eds.; Geological Society of America: Boulder, CO, USA, 2012; ISBN 978-0-8137-2487-4. [Google Scholar] [CrossRef]
  62. Xu, M.; Wei, X.; Yang, R.; Wang, P.; Cheng, X. Research Progress of Provenance Tracing Method for Heavy Mineral Analysis. Adv. Earth Sci. 2021, 36, 154. [Google Scholar] [CrossRef]
  63. Morton, A.; McGill, P.; Morton, A.; McGill, P. Correlation of Hydrocarbon Reservoir Sandstones Using Heavy Mineral Provenance Signatures: Examples from the North Sea and Adjacent Areas. Minerals 2018, 8, 564. [Google Scholar] [CrossRef]
  64. Lewin, A.; Meinhold, G.; Hinderer, M.; Dawit, E.L.; Bussert, R.; Lünsdorf, N.K. Heavy Minerals as Provenance Indicator in Glaciogenic Successions: An Example from the Palaeozoic of Ethiopia. J. Afr. Earth Sci. 2020, 165, 103813. [Google Scholar] [CrossRef]
  65. Hubert, J.F. A Zircon-Tourmaline-Rutile Maturity Index and the Interdependence of the Composition of Heavy Mineral Assemblages with the Gross Composition and Texture of Sandstones. J. Sediment. Res. 1962, 32, 440–450. [Google Scholar] [CrossRef]
  66. Liu, C.; Gao, H.; Liu, B.; Li, W.; Huang, Z.; Qu, T.; Yang, Y.; Xia, Y.; Shan, L. Analysis on the Difference of Diagenetic Evolution and Its Influencing Factors between North and South of Huagang Formation Reservoir in Central Inversion Zone of Xihu Sag. Geol. Rev. 2024, 70, 1353–1365. [Google Scholar] [CrossRef]
  67. Wang, Z.; Qiu, J. Effects of Compaction and Cementation on the Chang 8 Member Reservoir in the Ordos Basin. J. Southwest Univ. 2018, 40, 56–68. Available online: https://www.sciengine.com/JSUST/doi/10.11885/j.issn.1674-5086.2017.07.28.01 (accessed on 24 December 2025).
  68. Houseknecht, D.W. Assessing the Relative Importance of Compaction Processes and Cementation to Reduction of Porosity in Sandstones1. AAPG Bull. 1987, 71, 633–642. [Google Scholar] [CrossRef]
  69. Qu, T.; Huang, Z.; Chen, J.; Li, T.; Dong, J.; Li, Z.; Wang, B.; Yang, Y.; Guo, X. Pore Structure Characteristics and Their Diagenetic Influence: A Case Study of Paleogene Sandstones from the Pinghu and Huagang Formations in the Xihu Depression, East China Sea Basin. Math. Geosci. 2022, 54, 1371–1412. [Google Scholar] [CrossRef]
  70. Wang, F.; Chen, D.; Wang, Q.; Du, W.; Chang, S.; Wang, C.; Tian, Z.; Cheng, M.; Yao, D. Quantitative Evaluation of Caprock Sealing Controlled by Fault Activity and Hydrocarbon Accumulation Response: K Gasfield in the Xihu Depression, East China Sea Basin. Mar. Pet. Geol. 2021, 134, 105352. [Google Scholar] [CrossRef]
  71. Zhao, X.; Dai, M.; Liu, S.; Ge, J.; Zhao, T. Diagenetic-pore Quantitative Evolution of the Reservoir from LowerHuagang Formation in the South-central Xihu Sag. J. Southwest Pet. Univ. 2024, 46, 21–34. [Google Scholar] [CrossRef]
Figure 3. (A) Triangular diagram for the classification of sandstone clastics in the Upper Member of the Huagang Formation (N = 231); (B) triangular diagram for the classification of sandstone clastics in the Lower Member of Huagang Formation in the study area (N = 175); (C) histogram of sandstone grain size in the Upper Member of the Huagang Formation; and (D) histogram of sandstone grain size in the Lower Member of the Huagang Formation.
Energies 19 00238 g003
Figure 4. (A) Well FN4, 3512.0 m, PPL view showing reservoir pore types; (B) well FN4, 3512.0 m, XPL view showing pore peripheral minerals; and (C) well FS5, 3767.7 m, SEM view showing intergranular dissolution pores and clay minerals. (D) The energy spectrum of clay minerals in C shows kaolinite. (E) Backscattering (BSE) view of the sweet spot section in FS2 and the main pore and pore throat types. RIP, residual primary intergranular pores; MCP, mold cavity pores; IGP, intergranular pores; IDP, intragranular dissolution pores; ICP, intercrystalline pores; Q, quartz; Qo, quartz overgrowths; Pl, plagioclase; Kfs, potassium feldspar; Pyr, pyroclastic fragments; Ill, illite; Kln, kaolinite; Ab, albite; Or, orthoclase; Chl, chlorite; Ms, muscovite; PCT, pore-contracted throat; NTT, neck-type throat; and SLT, sheet-like throat. Color scheme in (E): gray, quartz (Q); pink, orthoclase (Or); blue, albite (Ab). Light blue shades represent various pores and throats (see abbreviations above).
Energies 19 00238 g004
Figure 5. (A) Histogram of porosity frequency distribution (N = 529); (B) histogram of permeability frequency distribution (N = 529); (C) crossplot of reservoir porosity and permeability; (D) relationship between porosity and depth; and (E) relationship between permeability and depth.
Energies 19 00238 g005
Figure 6. (A) T2 spectrum curve of type I pores; (B) T2 spectrum curve of type II pores; (C) T2 spectrum curve of type III pores; and (D) pore–throat ratio bar graph.
Energies 19 00238 g006
Figure 7. Microscopic photographs demonstrating compaction in the Huagang Formation. (A) Directional arrangement of clastic grains, 3839.26 m, well FN2; (B) point contact, line–concavity contact, 3931.7 m, well FS1; (C) concavity contact, suture–line contact, quartz overgrowths, 3910.4 m, well FN4; (D) feldspar and mica bending, 3812.5 m, well FN6; (E) concavity contact, plagioclase fracture, 3910.4, well FN4; and (F) tight rock structure, 4326.23 m, well FS3.
Energies 19 00238 g007
Figure 8. Percentage distribution of clay minerals in the H3–H11 sublayers of the Huagang Formation in the Central Anticlinal Belt. (A) Total clay mineral content in whole rock (%); (B) smectite proportion in I/S mixed-layer clay (%); (C) chlorite content in clay fraction (%); (D) illite content in clay fraction (%); (E) I/S mixed-layer clay content (%); (F) kaolinite content in clay fraction (%). Dashed arrows indicate the general trend of clay mineral content variation with stratigraphic horizon (from H3 to H11).
Energies 19 00238 g008
Figure 9. (A) XRD patterns of clay components under different treatment conditions, well FN6, 4245.0 m; (B) book-page-like kaolinite, well FS3, 3654.48 m; (C) chlorite on the surface of the particles, well FN6, 3799.3 m; and (D) bridge-like illite, well FS3, 3654.48 m.
Energies 19 00238 g009
Figure 10. (A) Basal cements of early calcite, well FS2, 3526.61 m; (B) cathodoluminescence characteristics of late calcite, well FN4, 3999.92 m (Quartz and lithic fragments appear dark, feldspar is indigo blue, calcite cement shows orange to dark red luminescence, while intergranular pores are non-luminescent.); (C) diagram of the formation of calcite cement (N = 10); (D) concavity–line contact of calcite and siliceous cements in the late stage, well FN6, 4024.16 m (Yellow dashed lines demarcate the boundaries between primary quartz grains and quartz overgrowths.); (E) fluorescence illumination of gas–liquid hydrocarbon inclusions in siliceous cements, well FN4, 3999.92 m; and (F) major types of quartz secondary overgrowths of the Huagang Formation. Ec: early calcite cement; Lc: late calcite cement; Fsp: feldspar; Q, quartz; Qo: quartz overgrowth; and Hi: hydrocarbon inclusion.
Energies 19 00238 g010
Figure 11. (A) Large-scale feldspar dissolution, well FS1, 3592.4 m; (B) feldspar grid dissolution, well FS3, 3790.15 m; and (C) honeycomb-like dissolution of rock fragments, well FN6, 4158.2 m.
Energies 19 00238 g011
Figure 12. Histogram of typical heavy mineral contents and characteristic indices of Huagang Formation samples. (A) Well FN4, 3999.92 m, H4 sublayer; (B) well FN6 sublayer, 4545.00 m, H5 sublayer; (C) well FN9, 4512.74 m, H5 sublayer; (D) well FS2, 3516.40 m, H4 sublayer; (E) well FS2, 3583.40 m, H5 sublayer; and (F) well FS1, 3931.80 m, H8 sublayer.
Energies 19 00238 g012
Figure 13. Analysis of the strength of sandstone compaction and cementation in the Huagang Formation. (A) Well FN6, H3 sublayer, N = 56; (B) well FS5, H9–H12 sublayers, N = 25 (modified from [68]). The area above the blue dashed line represents zones with greater porosity reduction by cementation, while the area below indicates zones where compaction is the dominant mechanism for porosity loss. The black dashed lines and arrows delineate the range of “Original porosity destroyed by cementation (%)”. The slanted black solid line is the scale for “Intergranular porosity (%)”.
Energies 19 00238 g013
Figure 14. Relationships between the plane porosity and petrophysical characteristics of the dissolved pores in the Huagang Formation samples. (A) Relationship between the plane porosity and porosity of the dissolved pores in well FN6, 3691–3802.8 m; (B) relationship between the plane porosity and permeability of the dissolved pores in well FN6 well; (C) relationship between the plane porosity and porosity of the dissolution pores in well FS5 well (3790.6–4076.8 m); and (D) relationship between the plane porosity and permeability of the dissolution pores in well FS5 (3790.6–4076.8 m).
Energies 19 00238 g014
Figure 15. TIMA mineral distribution. (A) Well FS2, 3525.8 m, mineral content and diagenesis; (B) well FN6, 3699.6 m, mineral content and diagenesis.
Energies 19 00238 g015
Figure 16. Diagenetic environment and diagenetic sequence of the Huagang Formation in the study area (A) Diagenetic environment and diagenetic sequence diagram of the Upper Member of the Huagang Formation in the FN area; (B) diagenetic environment and diagenetic sequence diagram of the Huagang Formation in the FS area. Note: Subfigure labels (A, B, etc.) are bolded and boxed for clarity. The letters “A”, “A1”, “A2”, and “B” within the images refer to eogenetic and mesogenetic diagenetic stages. Diagenetic environment: red (acidic), blue (alkaline), color gradient (transition zone). Process intensity: diamonds (strongest at core, diminishing outwards), dashed lines (weak but still present).
Energies 19 00238 g016
Table 1. Summary of analytical methods and sample distribution.
Analytical MethodTotal SamplesFN Area SamplesFS Area SamplesPrimary Purpose
(Relevant Section)
Thin-section petrography406231 (FN2, FN4, FN6, FN9)175
(FS1, FS2, FS3, FS4, FS5)
Petrography and pore type statistics (4.1, 4.2)
Petrophysical analysis529256 (FN2, FN4, FN6, FN9)273
(FS1, FS2, FS3, FS4, FS5)
Reservoir porosity and permeability characteristics (4.2)
HPMI and NMR analysis123 (FN6)9 (FS1, FS2, FS5)Micropore and throat characteristics (4.3)
Scanning electron microscopy (SEM)3211 (FN6)21 (FS3, FS5)Diagenetic mineralogy and texture (4.4.2)
Automated mineralogy (TIMA)1610 (FN4, FN6, FN9)6 (FS1, FS2, FS5)Heavy mineral provenance tracing (5.1)
X-ray diffraction (XRD)5133 (FN6)18 (FN3, FN4, FN5)Clay mineralogy and cement content (4.4.2)
Carbon-Oxygen isotope analysis1010 (FN4, FN6)-Origin of carbonate cements (4.4.2)
Fluid inclusion microthermometry22
(FN4: 3990.69 m, 3999.92 m)
-Timing of silica cementation (4.4.2)
Table 2. The pore structure parameters of the samples measured by high-pressure mercury injection (HPMI) and NMR.
Sample NumberDepth/mHPMINMR
Displacement Pressure/MPaMedian Pressure/MPaMedian Radius/μmAverage Throat Radius/μmMaximum Mercury Injection Saturation %Mercury Withdrawal Efficiency %Movable Fluid Saturation %Bound Fluid Saturation, %Porosity of Movable Fluid, %
FS2-13521.20.190.840.890.9390.0323.8855.5144.4914.57
FS2-23522.50.050.282.722.5896.8517.7764.6335.3714.58
FS2-33527.80.050.401.852.3391.4420.3367.3732.6314.08
FS5-13875.40.070.711.032.34989.909.8046.0953.9111.57
FS5-23890.90.170.810.911.19287.7714.8137.5362.479.49
FS5-339300.121.000.741.78587.8915.8766.1833.828.90
FS1-13932.20.672.450.310.214787.1518.9955.0544.959.20
FS1-239350.703.290.230.185490.3526.6243.0556.9511.54
FS1-33939.60.783.820.200.166685.5220.7260.6939.3110.97
FN6-14000.61.005.320.140.292.2037.3943.8356.177.20
FN6-24247.20.3010.100.070.3377.5537.2243.0456.967.40
FN6-34248.40.305.530.130.3378.9830.9141.7958.217.10
Disclaimer/Publisher’s Note: The statements, opinions and data contained in all publications are solely those of the individual author(s) and contributor(s) and not of MDPI and/or the editor(s). MDPI and/or the editor(s) disclaim responsibility for any injury to people or property resulting from any ideas, methods, instructions or products referred to in the content.