Article

Battery Health Diagnosis via Neural Surrogate Model: From Lab to Field

by
Hojin Cheon
1,
Jihun Jeon
1,
Byungil Jung
2 and
Hongseok Kim
1,*
1
Department of Electronic Engineering, Sogang University, Seoul 04107, Republic of Korea
2
Doosan Enerbility, Seongnam 13557, Republic of Korea
*
Author to whom correspondence should be addressed.
Energies 2025, 18(9), 2405; https://doi.org/10.3390/en18092405
Submission received: 27 March 2025 / Revised: 1 May 2025 / Accepted: 6 May 2025 / Published: 7 May 2025
(This article belongs to the Section D: Energy Storage and Application)

Abstract

:
Batteries degrade over time. Such degradation leads to performance loss, but more importantly, safety issues arise. To evaluate the battery degradation, traditional diagnostic techniques rely on model-based or data-driven approaches; however, those methods often require controlled conditions or specific tests, which may not be applicable in real fields. In this regard, we propose a deep learning-based method addressing these limitations by accurately modeling batteries using real-world operational data from photovoltaic (PV)-integrated battery energy storage system (BESSs), where charging currents vary dynamically and SOC is capped at 70% by regulation. The proposed method is based on a neural surrogate model for batteries, employing a sequence-to-sequence architecture, which directly captures the dynamic behavior of batteries from operational data, eliminating the need for specialized characterization tests or feature extraction. The proposed model synthesizes the terminal voltage with a mean absolute error of 6.4 mV for lithium–iron–phosphate (LFP) cells and 49 mV for nickel–cobalt–manganese (NCM) battery modules, respectively, which is only 0.4% and 0.29% of the voltage swing. As a health indicator, we also propose the concept of voltage deviation (VD), defined as the deviation between the synthesized and actual terminal voltages. We demonstrate that VD can be evaluated not only in laboratory data but also in field data.

1. Introduction

To reduce greenhouse gas emissions, renewable energy and electric vehicles are increasing. Renewable energy sources such as photovoltaic (PV) and wind turbines require energy storage systems (ESSs) due to the uncertainty that can weaken the stability of power systems. Because of its high energy density, power density and long lifetime, lithium-ion batteries are being adopted as the main energy source in ESSs and electric vehicles (EVs).
However, lithium-ion batteries degrade over time due to various degradation mechanisms, resulting in the loss of lithium-ion inventory (LLI), loss of active material (LAM), increase in internal resistance (IR), and the continual relationship change between state of charge (SOC) and open circuit voltage (OCV) [1,2,3]. Such degradation not only reduces the value of assets by limiting the performance of battery packs but also increases the risk of accidents such as fire. Therefore, monitoring and predicting the life and failures of batteries have become an essential task of advanced battery management systems (BMSs).
Battery diagnostic methods can be categorized by two types: model-driven and data-driven [4,5]. Among model-driven approaches, the equivalent circuit model (ECM) and electrochemical models are widely used [6,7]. In ECM, a battery cell consists of a voltage source, a resistor, and resistor–capacitor (RC) pairs, representing OCV, ohmic resistance, polarization resistance, and capacitance, respectively. As a battery degrades, its electrical characteristics change, leading to variations in the ECM parameters as demonstrated in [8,9,10]. In ECM, the state of health (SOH) can be estimated by fitting the model parameters to data; parameter identification can be performed by nonlinear regression [11,12,13], filtering methods [14,15,16,17,18,19], Bayesian estimation [10,20], etc. Battery characterization tests such as the hybrid pulse power characterization (HPPC) [6,12,21,22] and electrochemical impedance spectroscopy (EIS) [9,23,24] are also useful for parameter identification.
Other model-driven methods are based on electrochemical models that describe lithium concentration and potential inside the cell. These electrochemical models include the Doyle–Fuller–Newman (DFN) model (also known as the pseudo-two-dimensional (P2D) model [25]) and the single-particle model with electrolyte (SPMe), a simpler version of the DFN model [26]. These models can provide detailed information about the states and characteristics of batteries. For instance, Gao et al. estimated SOH and SOC using the simplified P2D model and the discrete extended Kalman filter [27], and Sadabadi et al. predicted the remaining useful life (RUL) of batteries based on the estimated parameters of the SPMe [28]. However, applying these models to large-scale applications is challenging due to high computation cost [29].
In addition to model-driven methods, data-driven approaches have also been widely explored. While model-driven methods provide physical insights into battery behavior, data-driven methods can handle more diverse tasks due to its flexibility. Some of them utilize experimental methods for feature extraction, which provide theoretical information about battery health. For example, features from EIS can be used to estimate SOH with Gaussian process regression [30], support vector regression [31], or deep learning [32]. Incremental capacity analysis (ICA) is another widely used method for feature extraction [33,34,35]. Although these techniques provide useful information, it is not suitable for monitoring batteries in field operation as they require controlled experiments. As a result, deep learning approaches have been developed since its superiority in feature extraction. Recent studies have shown that deep learning can predict SOH and RUL with high accuracy, without specific experiments for feature extraction [36,37,38,39,40].
However, most existing deep learning methods are limited to controlled conditions, on which the deep learning models had been trained and evaluated. For example, the dataset used in [36,37,39] was collected at room temperature using a constant-current–constant-voltage (CCCV) charging protocol and a constant-current (CC) discharging protocol, until the lower and upper cut-off voltages are reached. However, it may not reflect practical battery usage in many real-world applications; the features extracted under such conditions are not likely to be available in field operation, thereby making these methods less practical.
To overcome these constraints, recent studies have attempted to address the challenges posed by dynamic operational conditions, such as fluctuating current and partial charge and discharge. For instance, Oka et al. proposed an emulator of battery cells based on LSTM networks, capable of synthesizing voltage responses under randomly generated galvanostatic charge–discharge schedules, and validated it using simulated data [41]. Liu et al. introduced a deep learning framework that efficiently estimates SOH using historical voltage, current, and temperature data obtained from EVs [42]. In another study, Tang et al. proposed attention-based neural networks trained with a Kepler optimization algorithm to estimate SOH under dynamic ship navigation conditions from predefined health factors [43]. In this context, we developed a deep learning method that can be constructed with field data only. Specifically, the proposed method identifies short-life battery modules using operational data from PV-integrated battery energy storage system (BESSs).
However, there are several challenges in developing data-driven methods with field data only. First, capacity cannot be directly observed since the BESS is never fully charged or discharged during operation. Second, given the relatively short observation period, no modules have yet reached their end of life, making it difficult to observe long-term degradation trends. Moreover, the fluctuating operating conditions of the PV-integrated BESS, coupled with cell-to-cell imbalance, introduce significant variations in voltage and current, which complicate consistent feature extraction. In particular, the charging current exhibits dynamic variations depending on solar irradiation, preventing reliable extraction of charging-phase features. Furthermore, since the Korean government enforced the SOC of BESSs by at most 70% at the time when data were collected, potentially informative features at higher SOC levels are not available.
Due to these challenges, we propose voltage deviation (VD) as a new battery health indicator. VD is defined as the deviation between the actual terminal voltage and the synthesized voltage, where the synthesis is performed by a neural surrogate model. Since the voltage response of batteries is affected by degradation, the proposed framework uses VD to estimate battery health. The neural surrogate model is trained to mimic the voltage response of fresh batteries so that the voltage response of fresh and degraded batteries can be compared. Unlike traditional battery models, the proposed neural surrogate model captures the dynamics of batteries directly from data, allowing the model to adapt without explicit characterization. This instant characterization is the key property of the neural surrogate model, which makes the proposed framework practical and scalable enough to be run on the cloud-based ESS monitoring system. To achieve this property, the proposed neural surrogate model employs sequence-to-sequence (Seq2Seq) architecture, where the encoder performs characterization, and the decoder performs voltage synthesis.
One may wonder how the proposed model can be compared against established model-based or data-driven methods under similar operational conditions. However, a direct performance comparison with established model-based or data-driven methods could not be conducted in this study. For model-based methods, the performance is highly dependent on the accurate identification of battery model parameters, which is time-consuming. Given the large number of battery modules used in our study, it is infeasible to identify those parameters and their changes in each module. For data-driven methods, performance is highly dependent on the dataset. However, to the best of our knowledge, there are few available datasets or methods that reflect operational conditions similar to the PV-integrated ESS environment in this study.
The contributions of our work are summarized as follows:
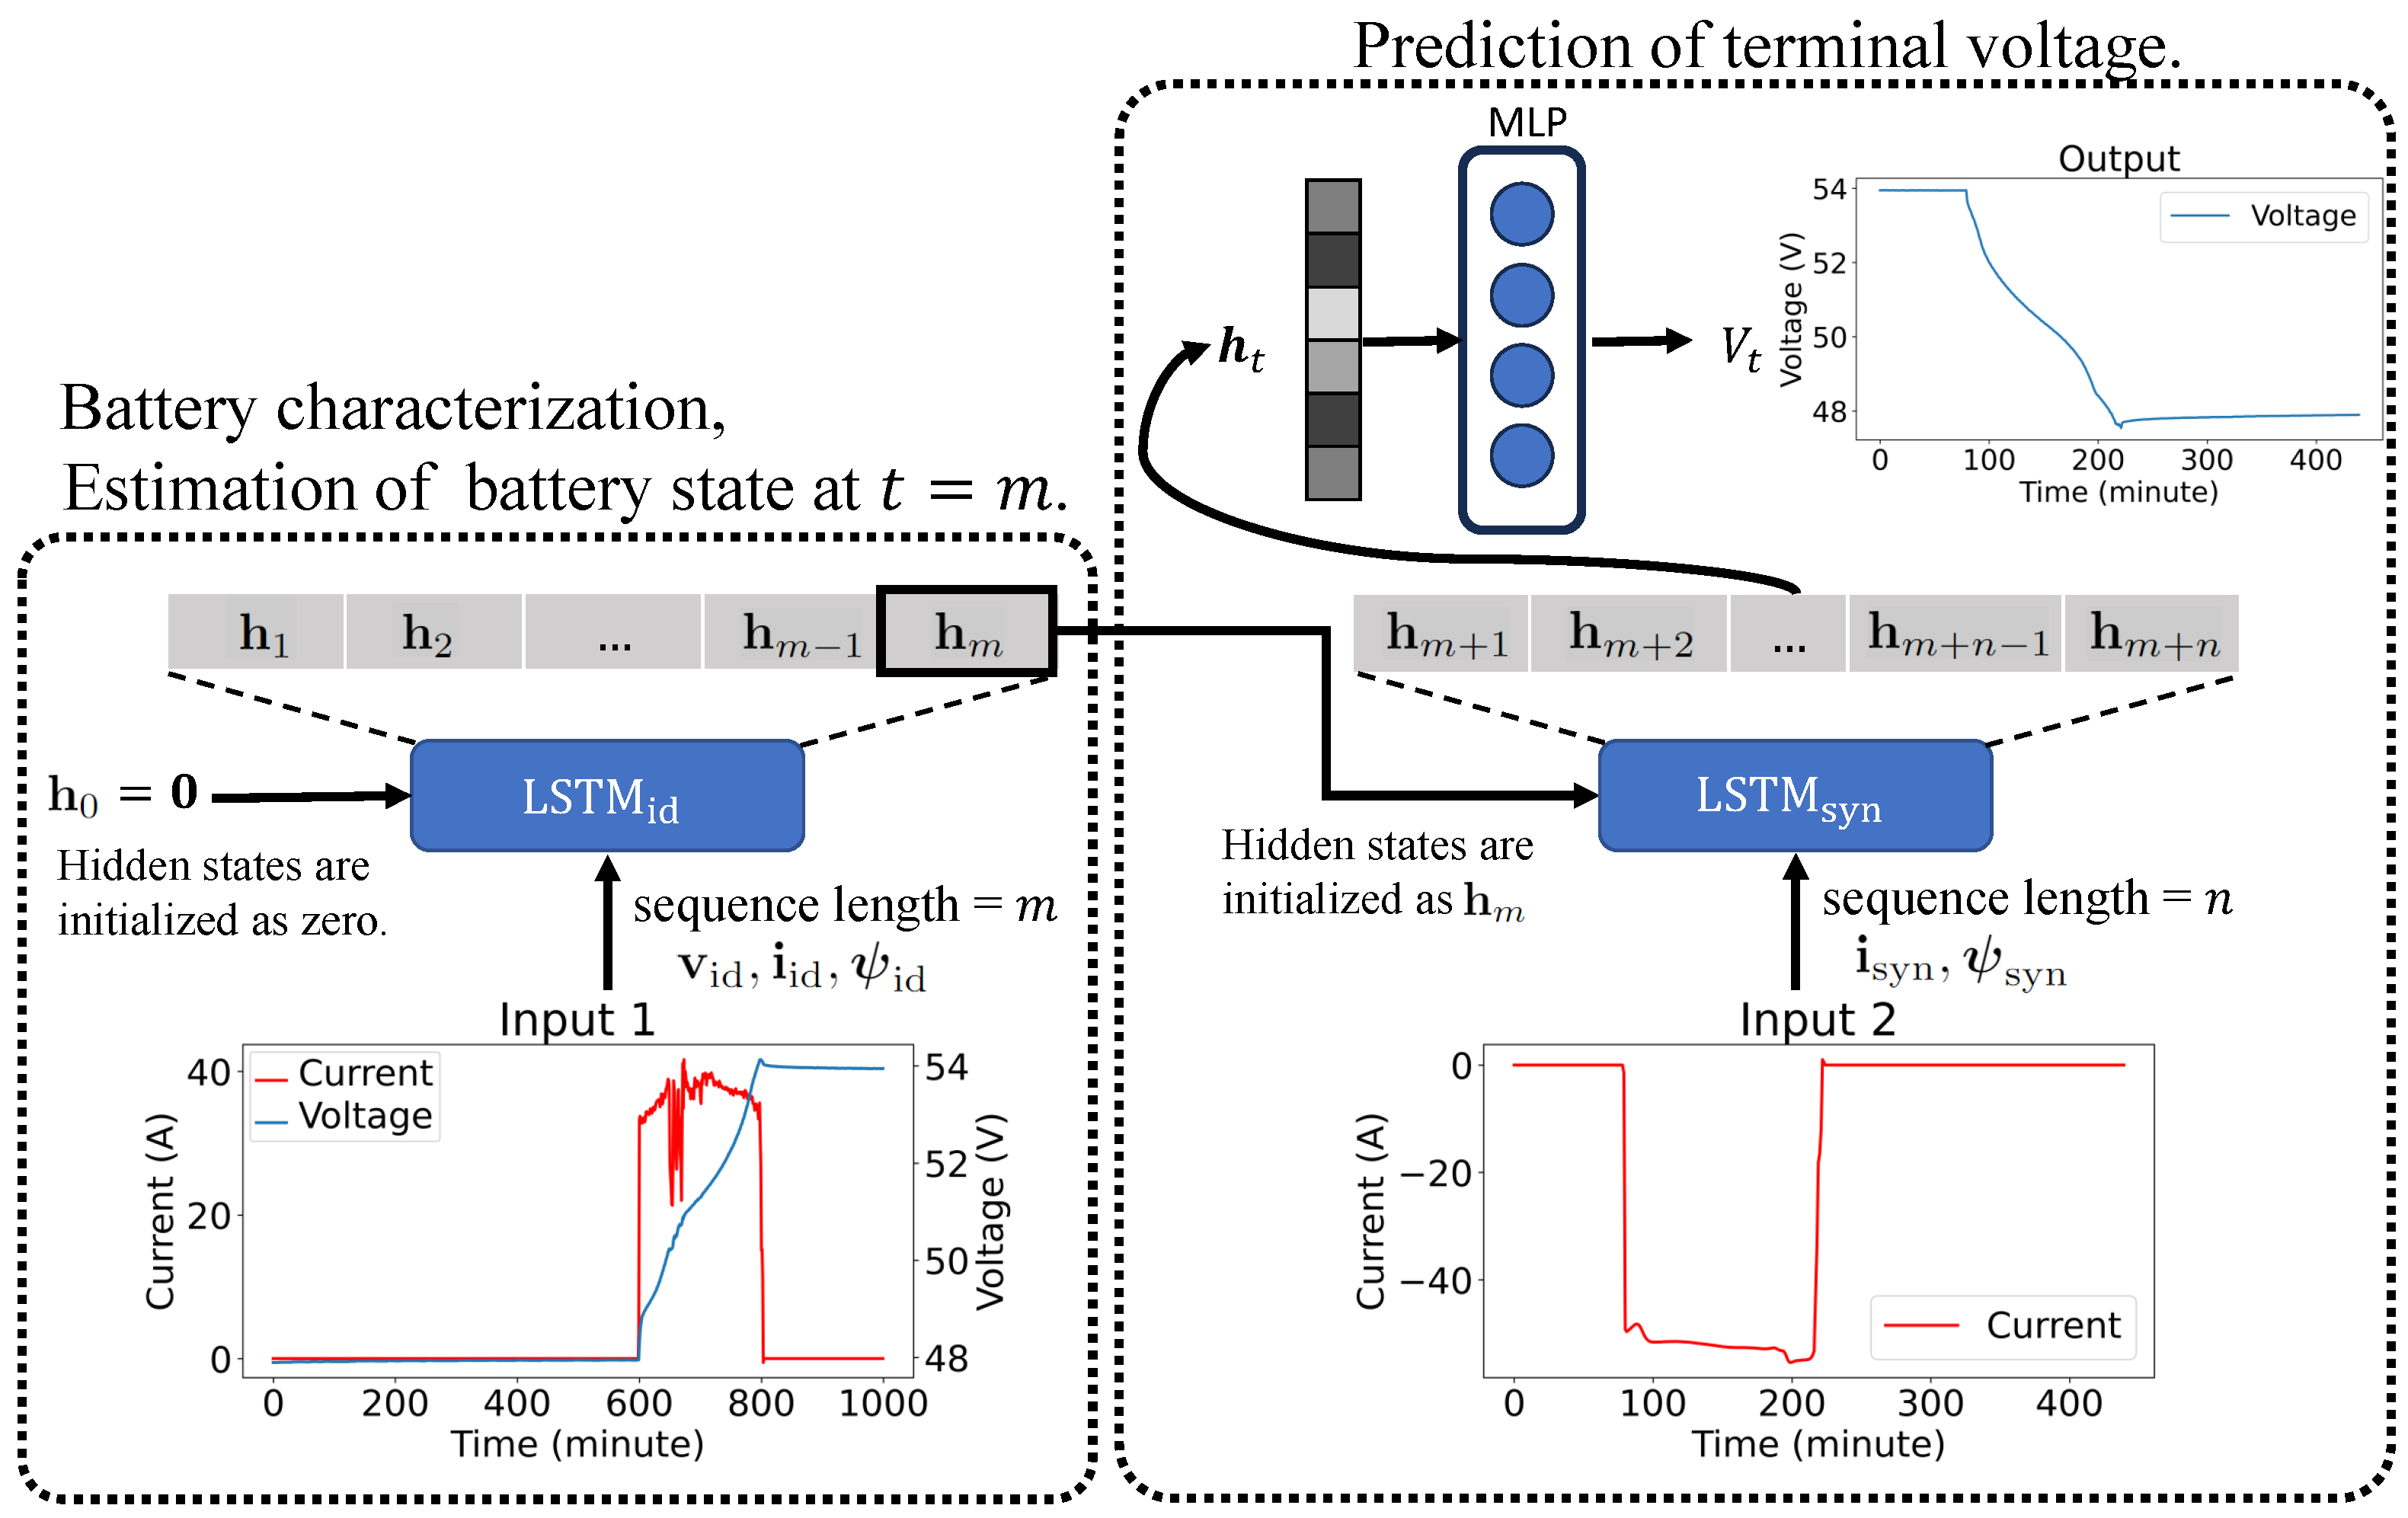
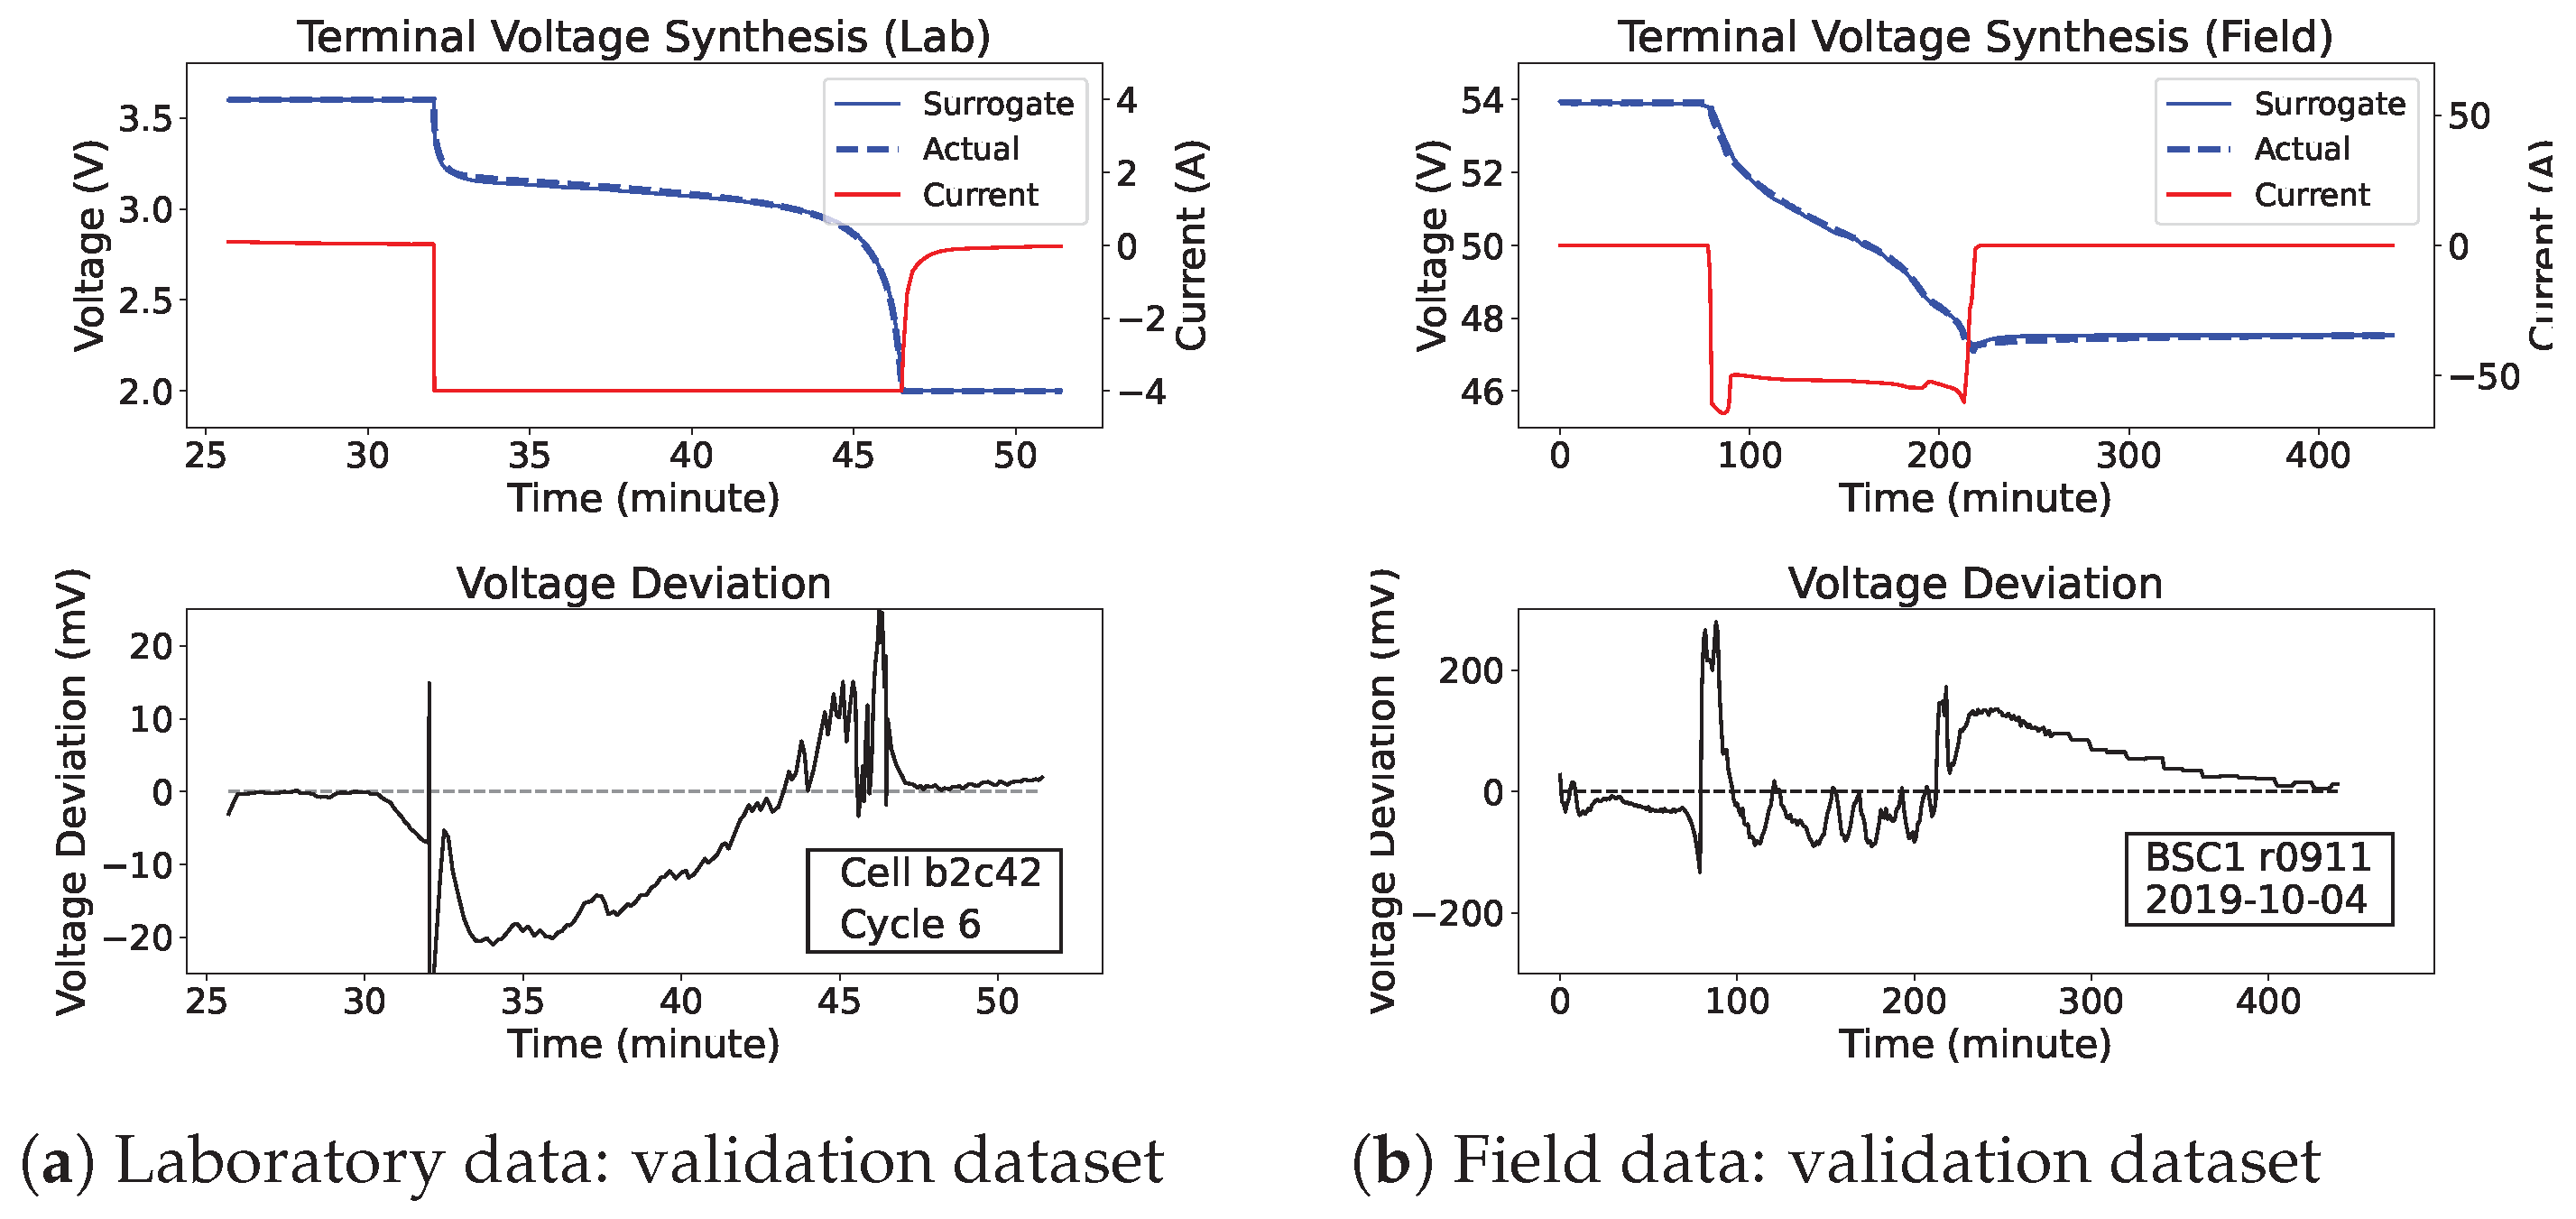
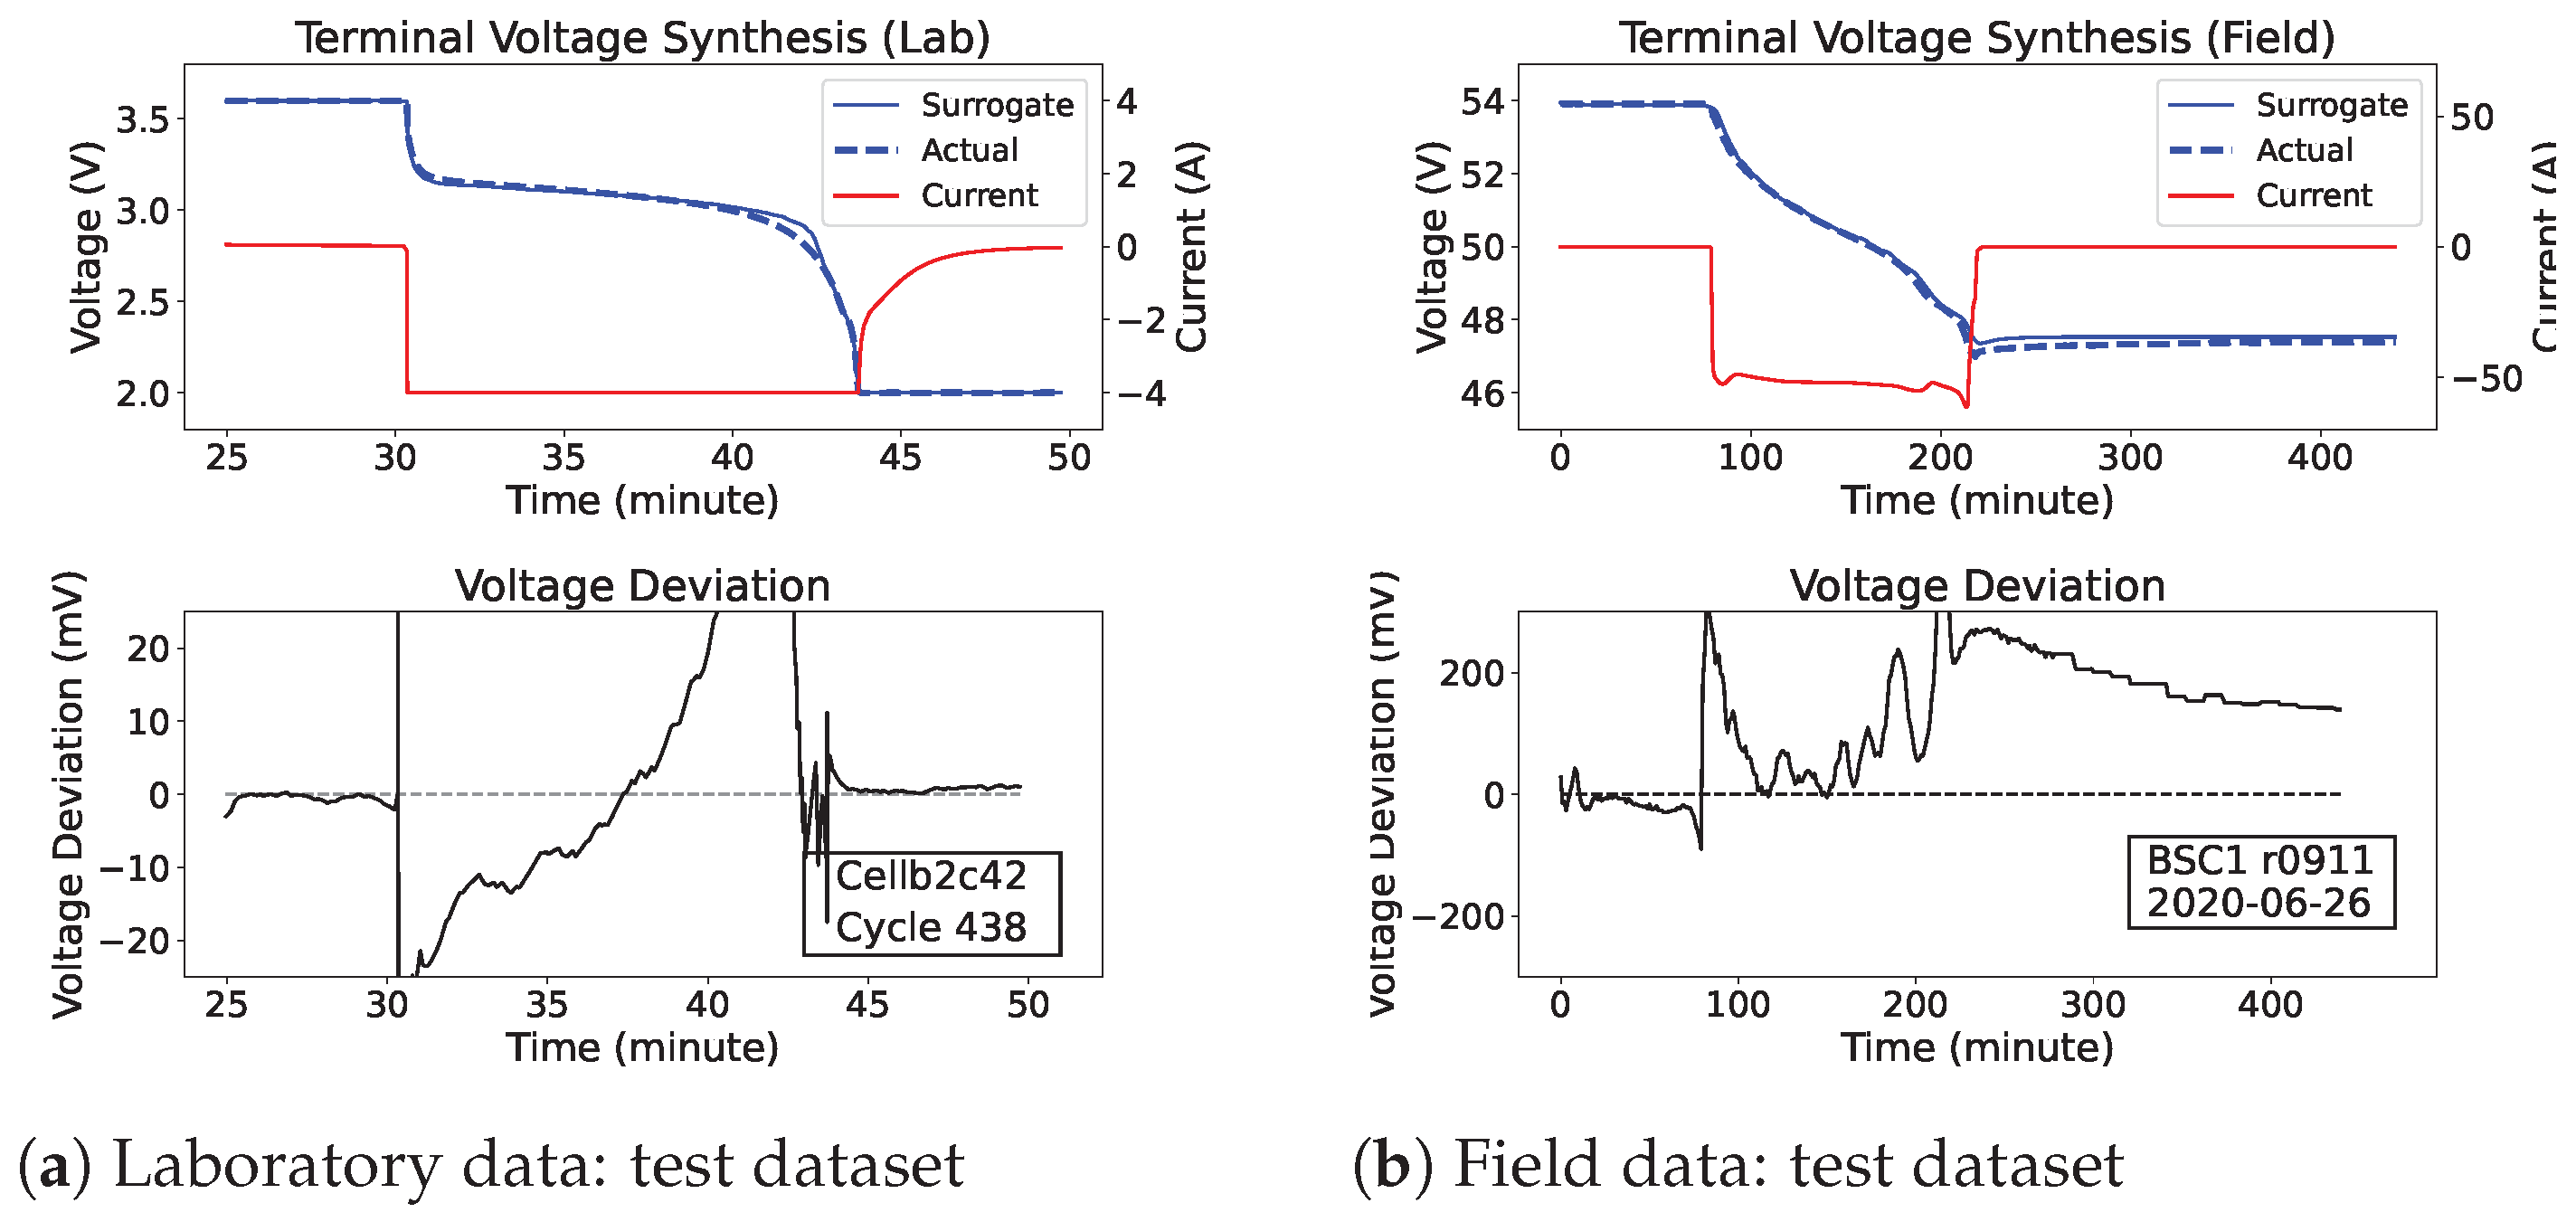
  • We propose a neural surrogate model for battery modeling with instant characterization. The model synthesizes terminal voltage with mean absolute errors (MAEs) of 6.4 mV and 49 mV for laboratory and field data, respectively, which are only 0.4% and 0.29% of the voltage swing.
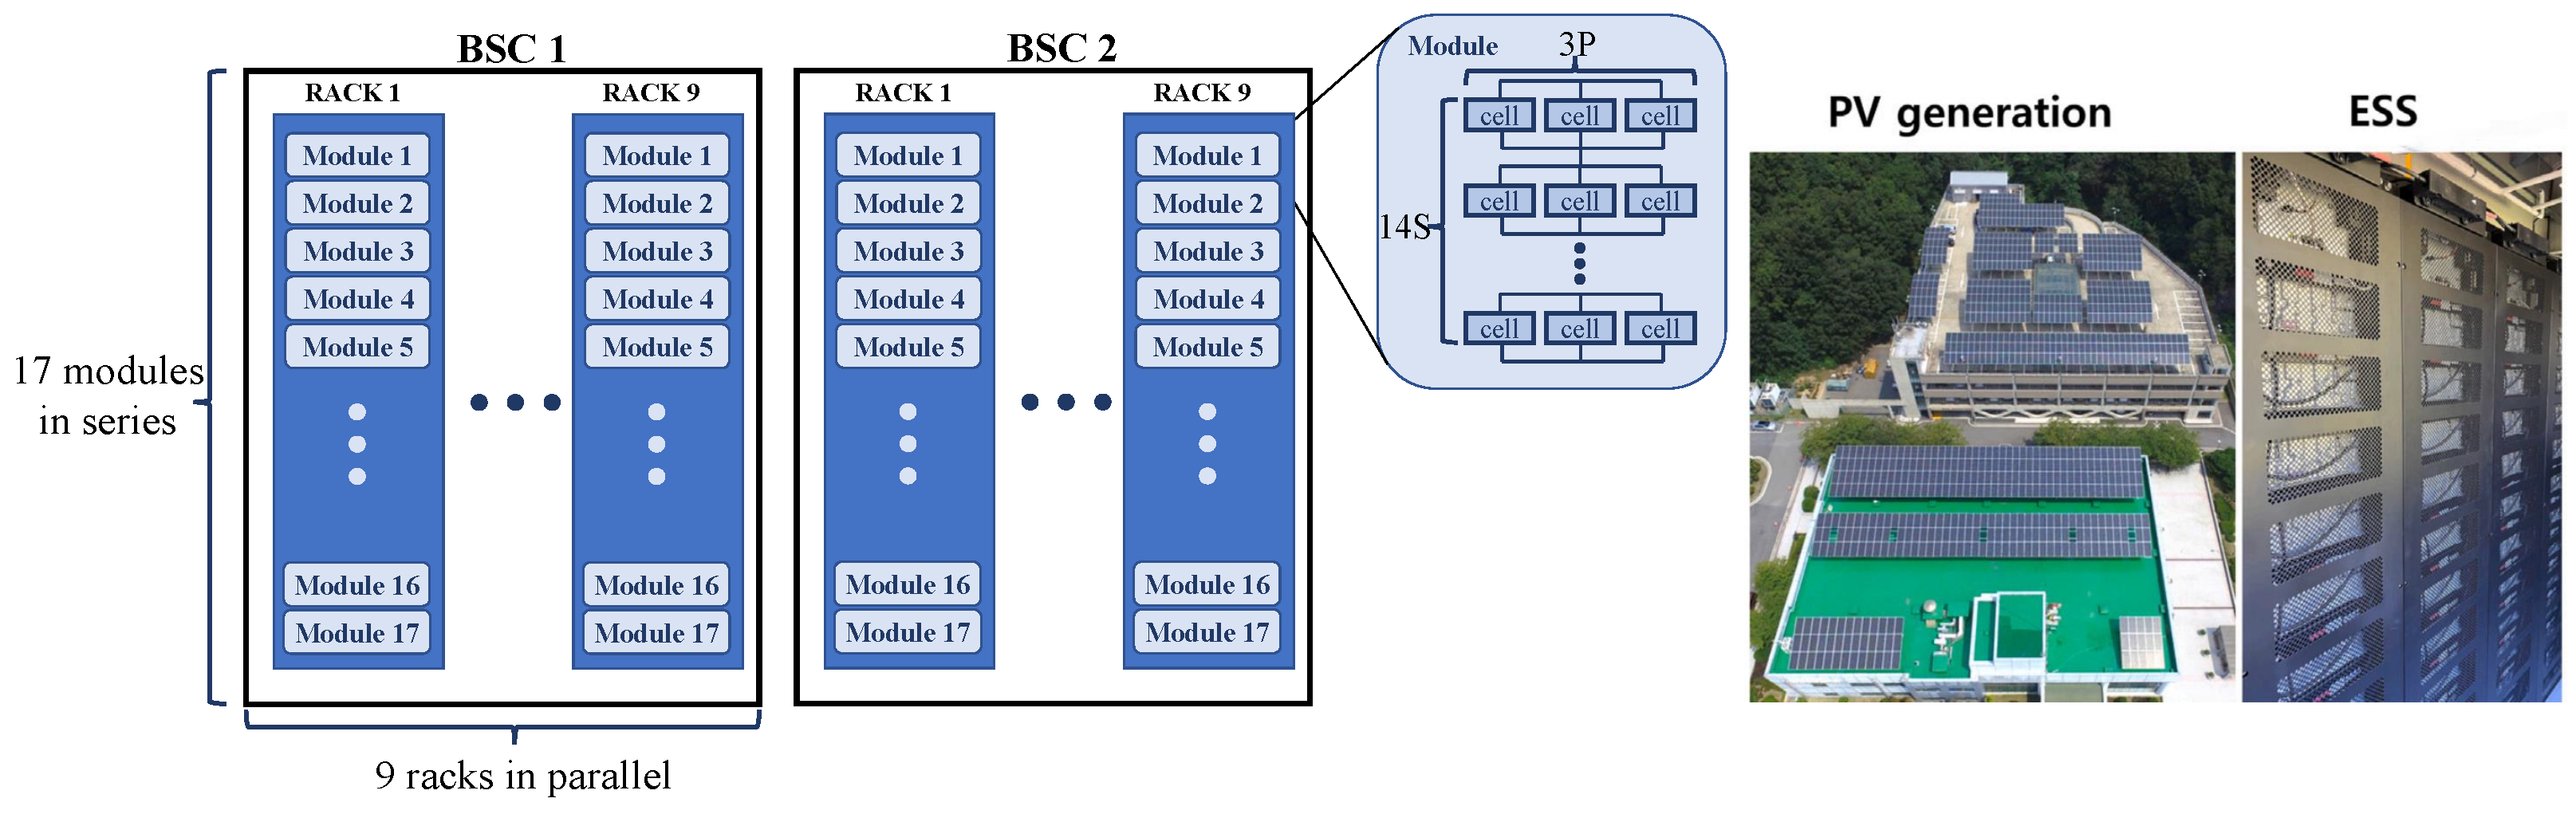
  • The proposed model is applicable to various materials and configurations. We validate the model using two datasets: a field dataset from a PV-integrated BESS with 306 nickel–cobalt–manganese (NCM) modules (over 12,000 cells), and a laboratory dataset with 124 lithium–iron–phosphate (LFP) cells. By learning battery characteristics directly from the data, the model enables accurate modeling without battery characterization tests.
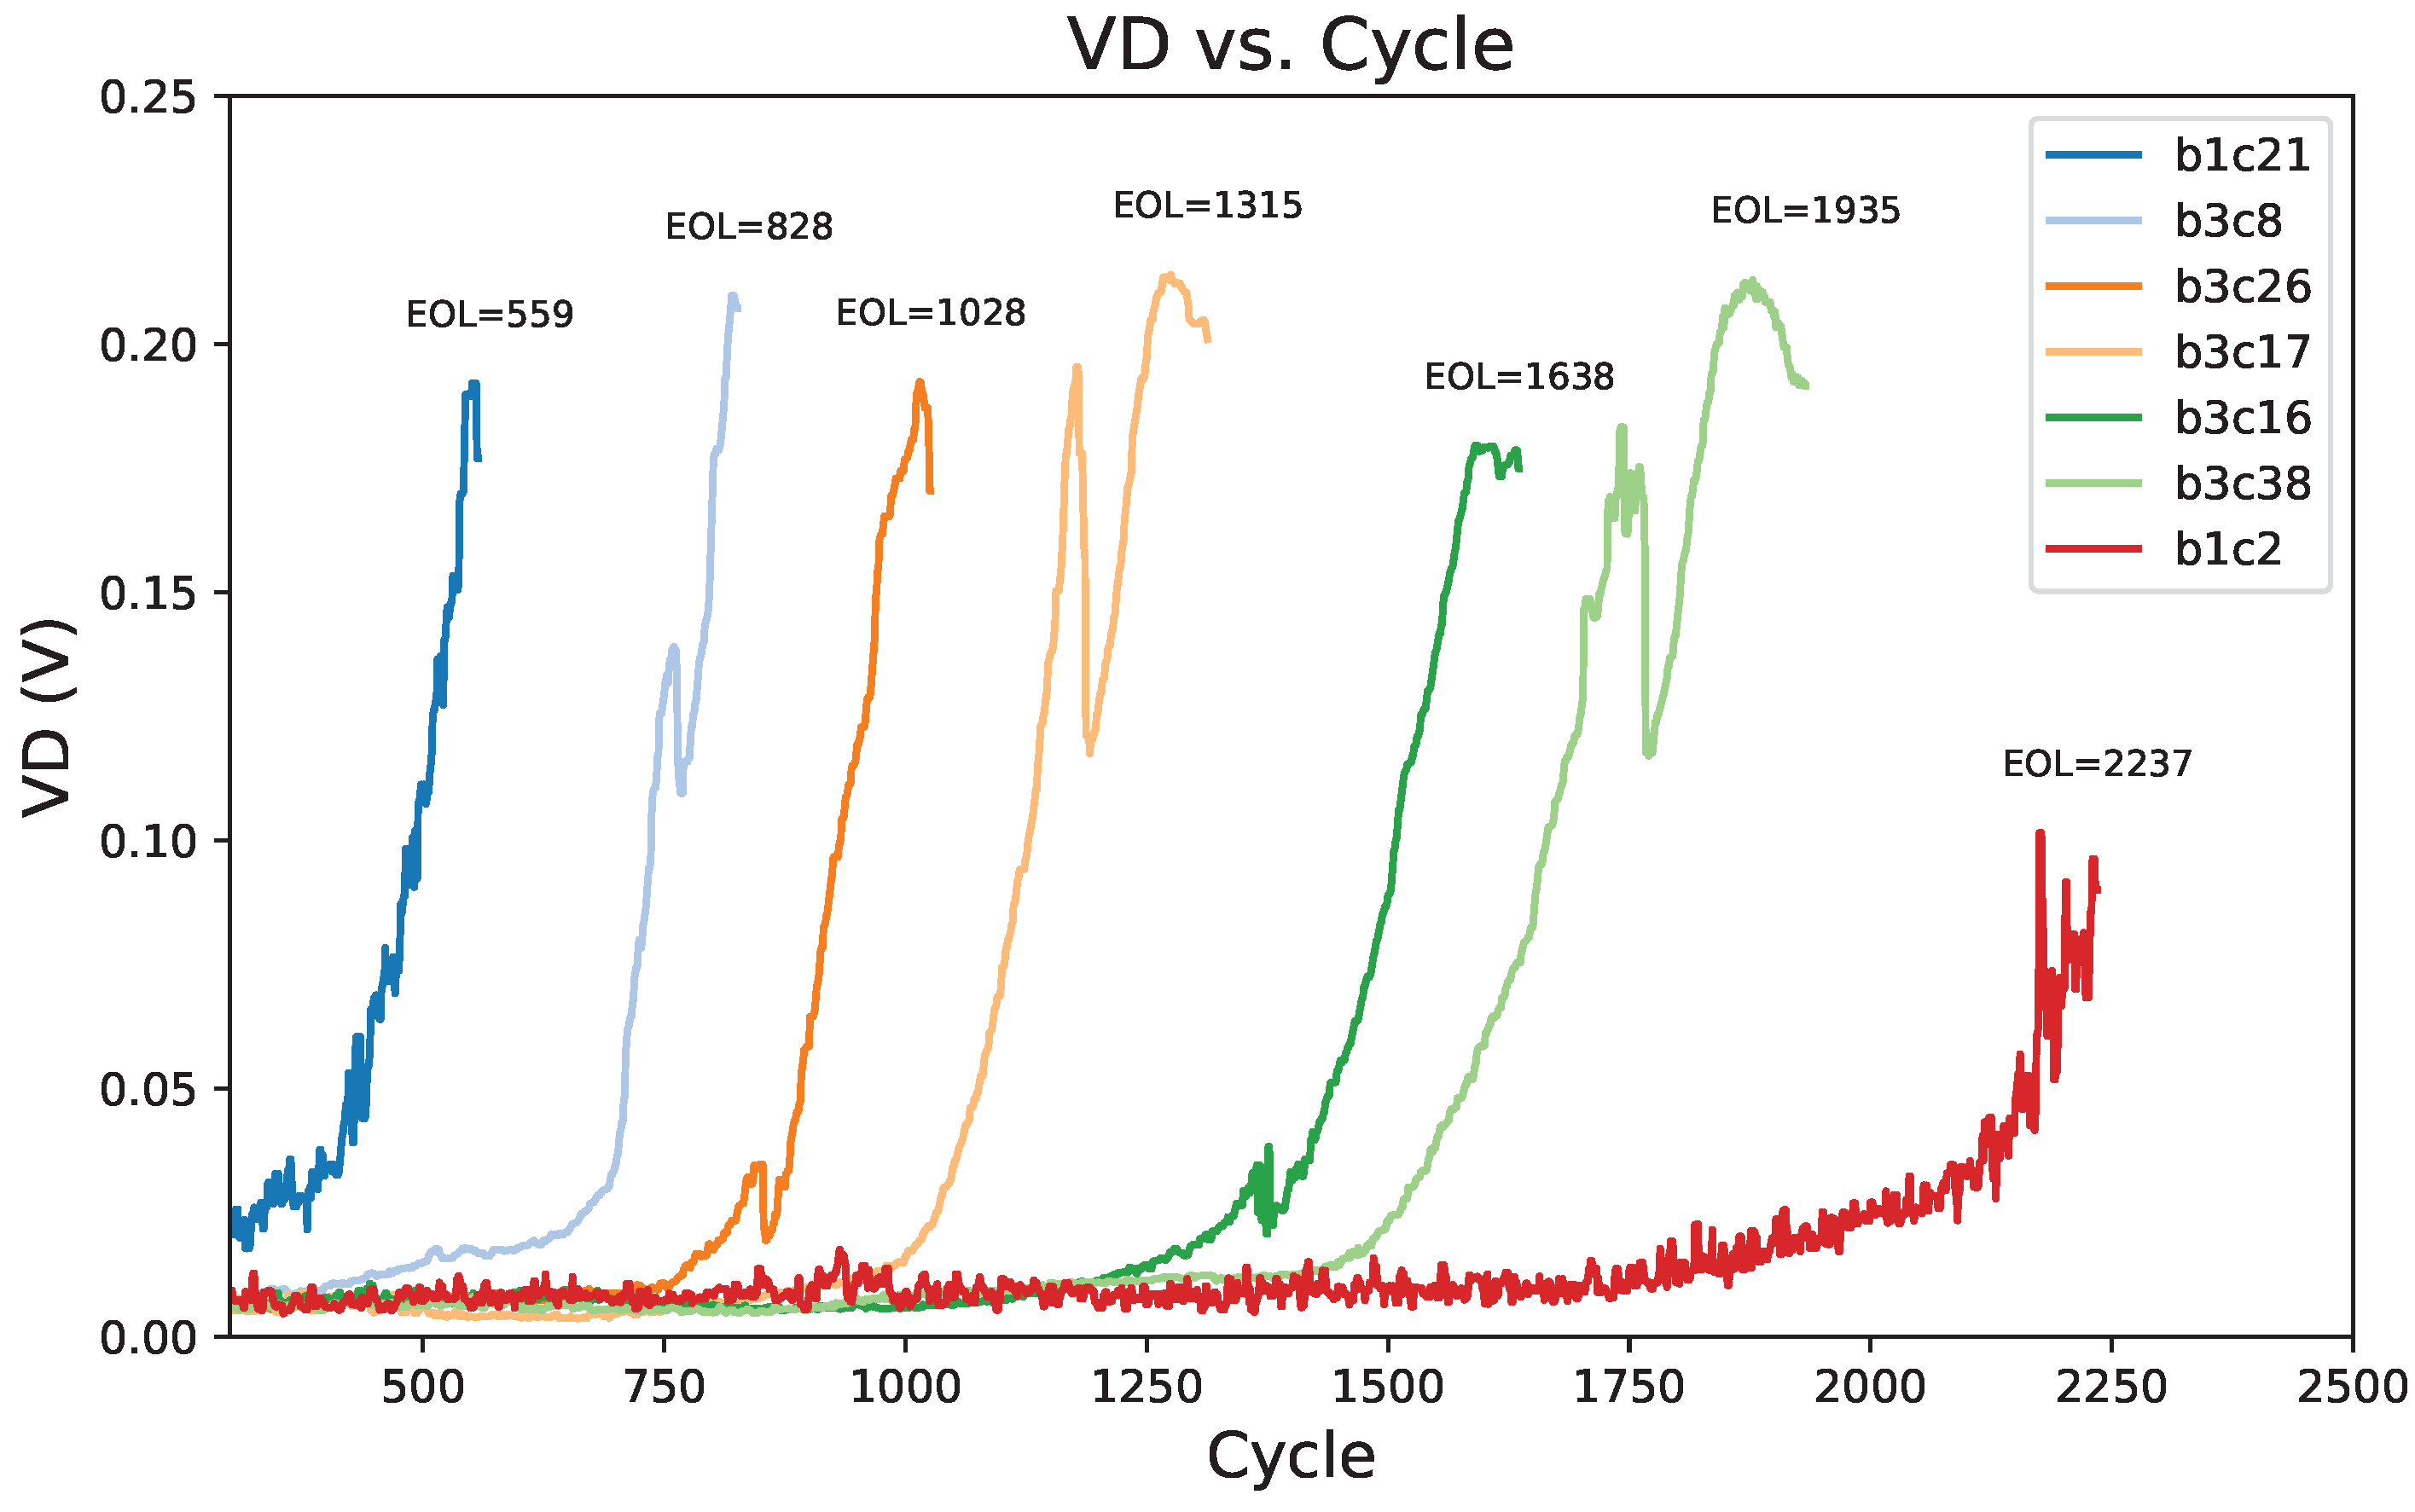
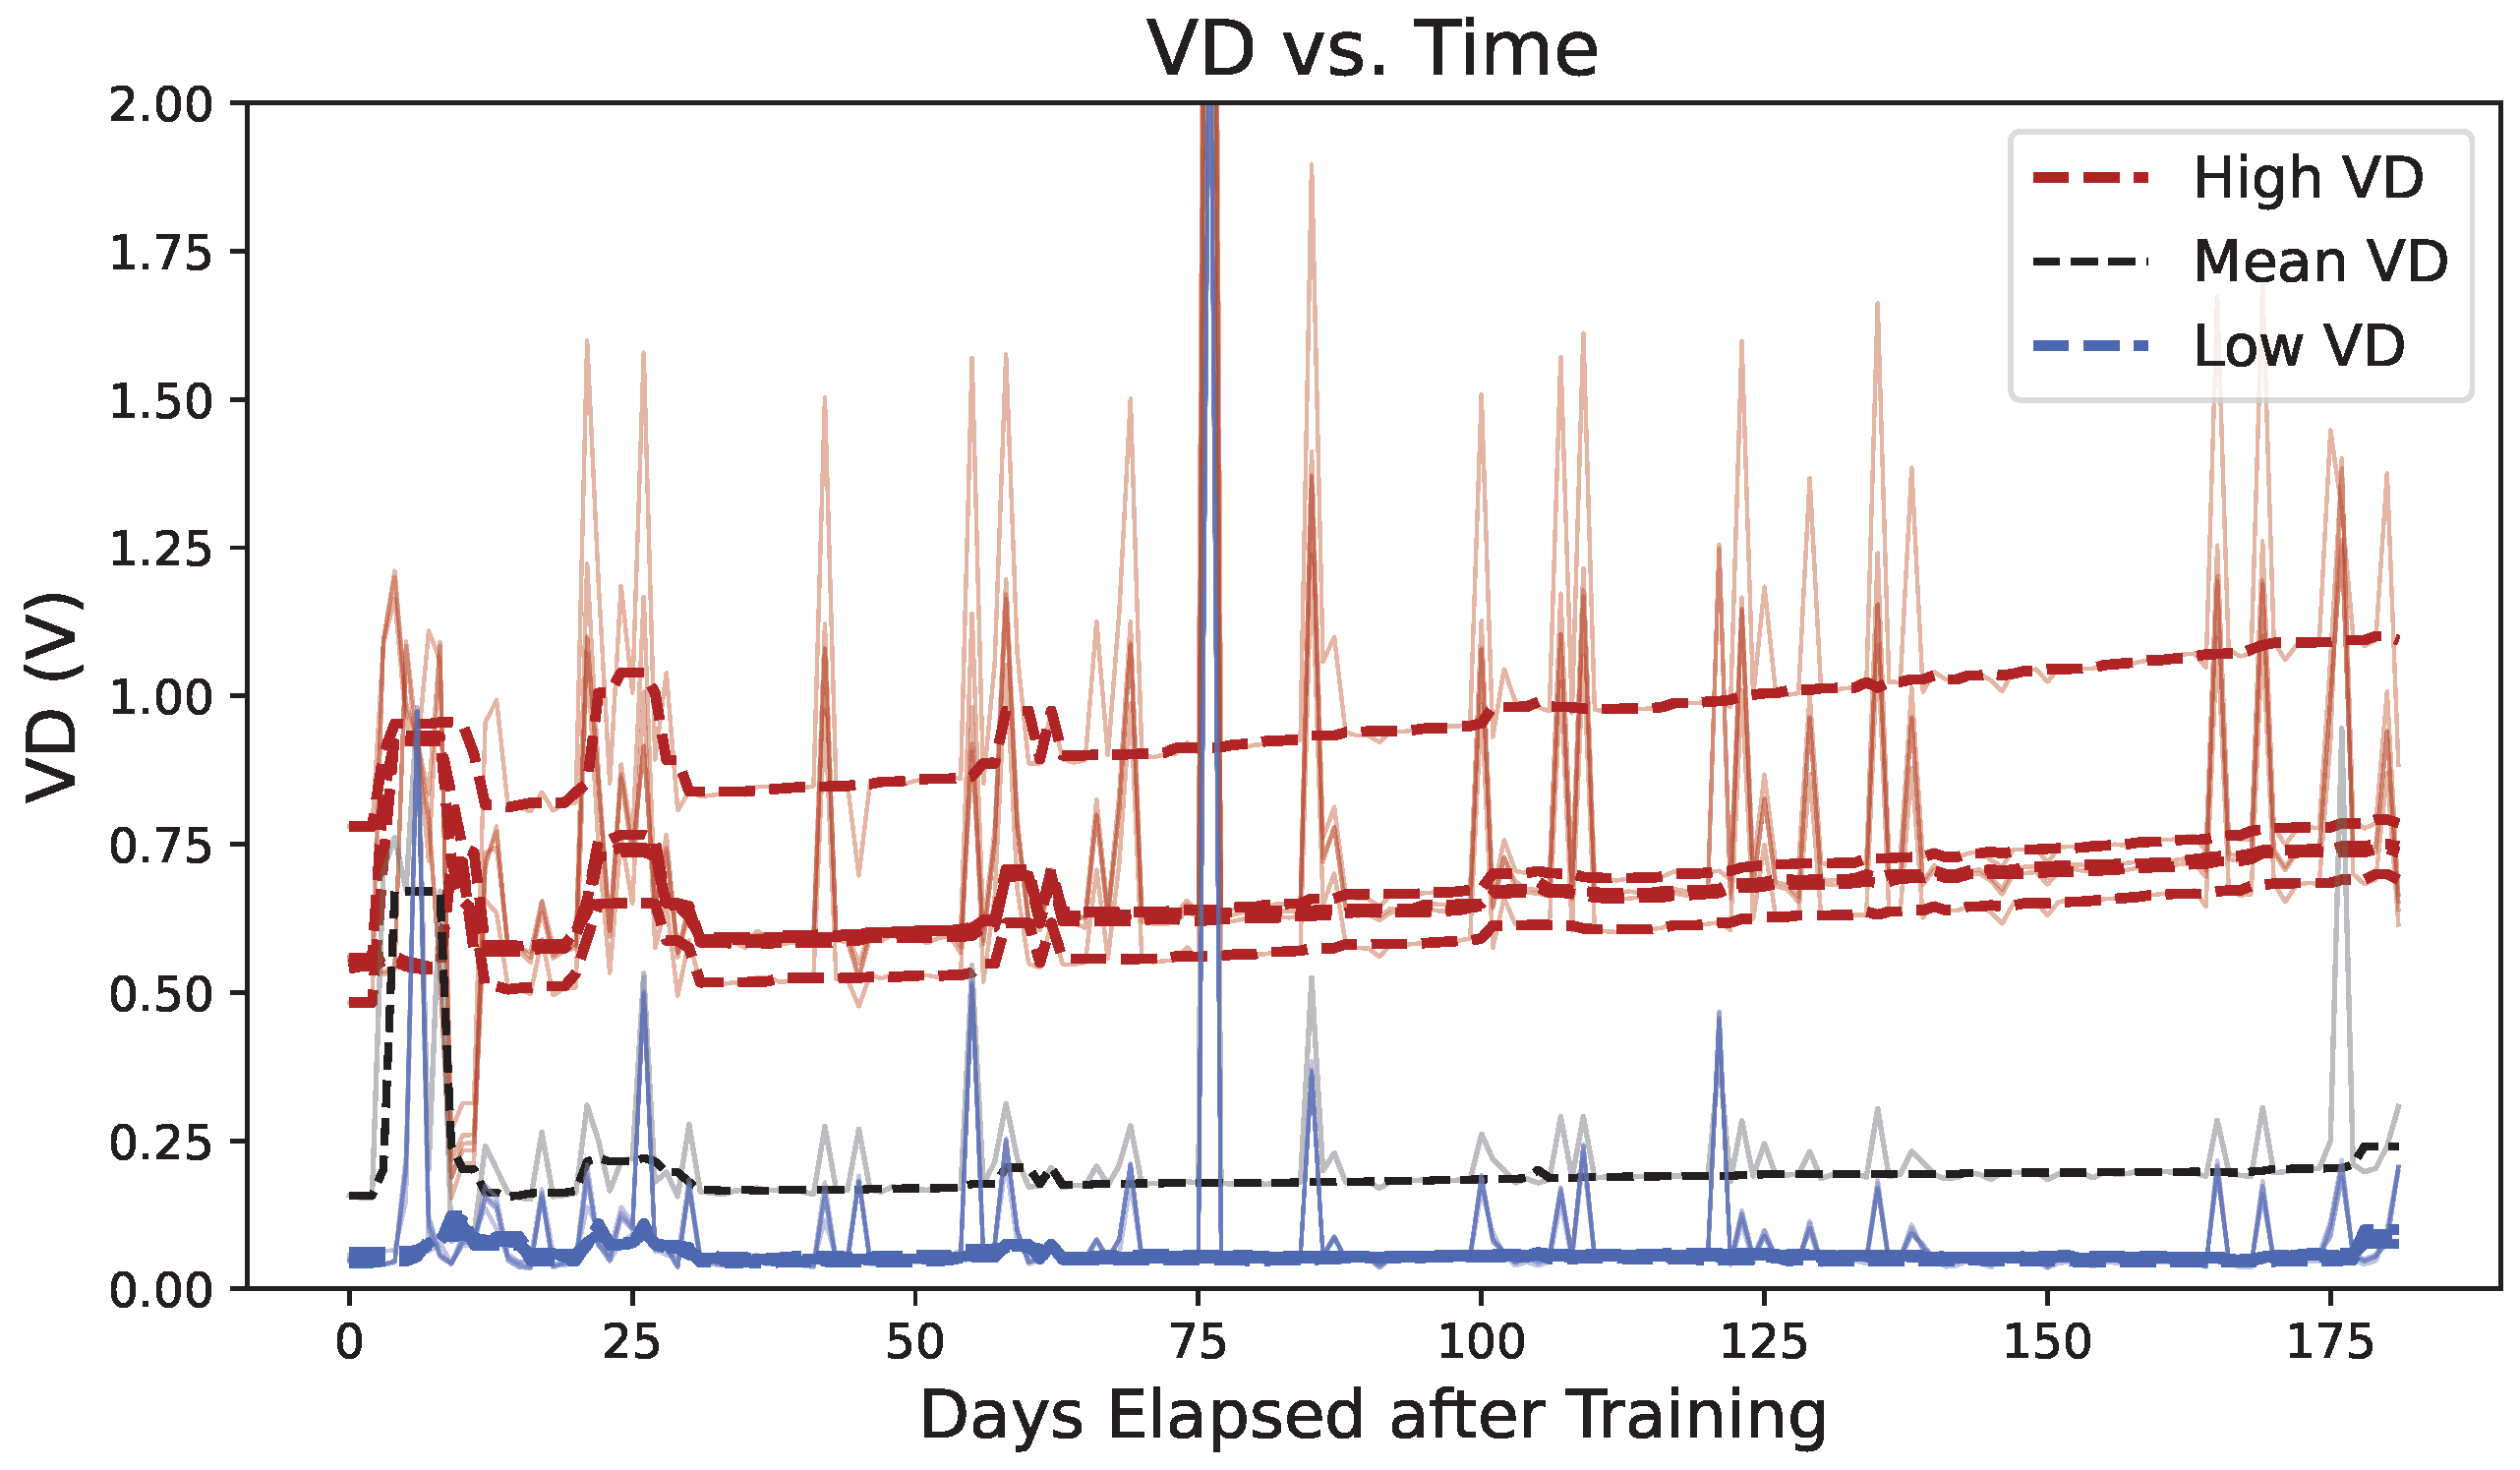
  • We propose a new battery health indicator, termed voltage deviation (VD), defined as the difference between the actual terminal voltage and the voltage synthesized by the surrogate model. This allows the measurement of changes in the battery’s dynamic behavior without requiring predefined feature extraction or controlled experiments; and thus, it is possible to estimate battery health directly from operational data.
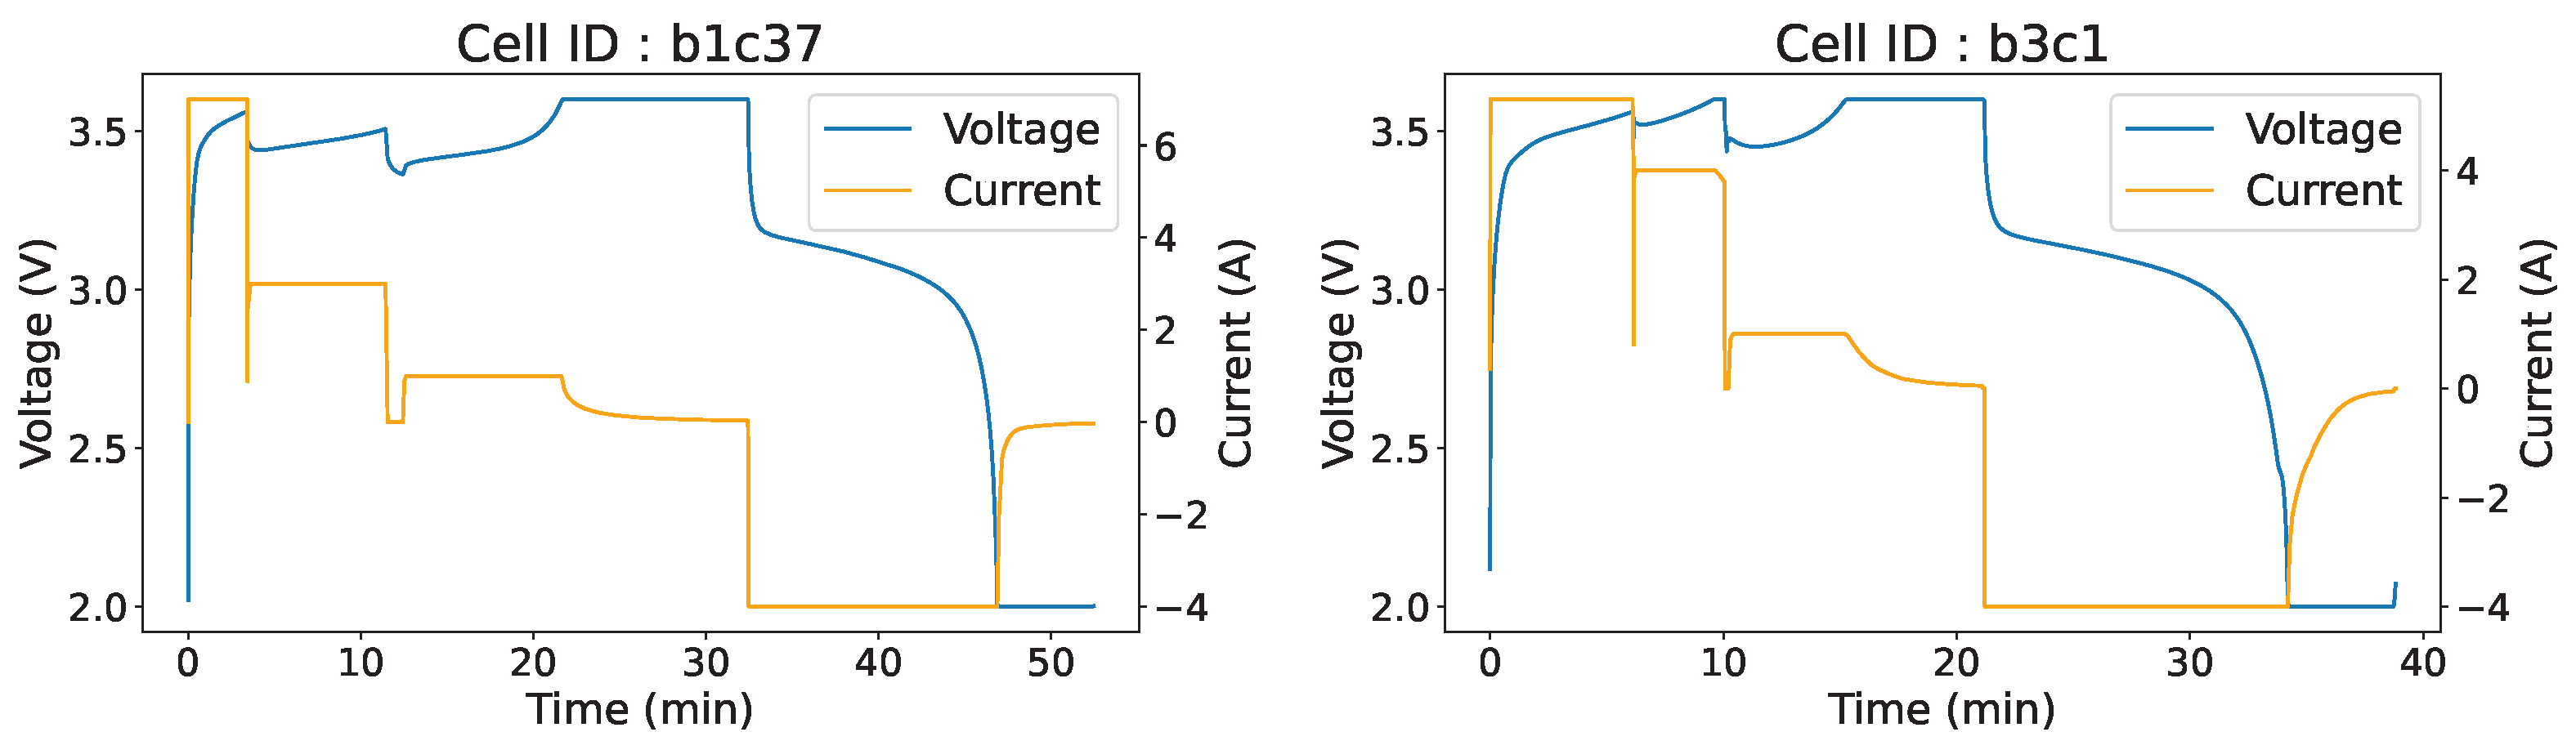
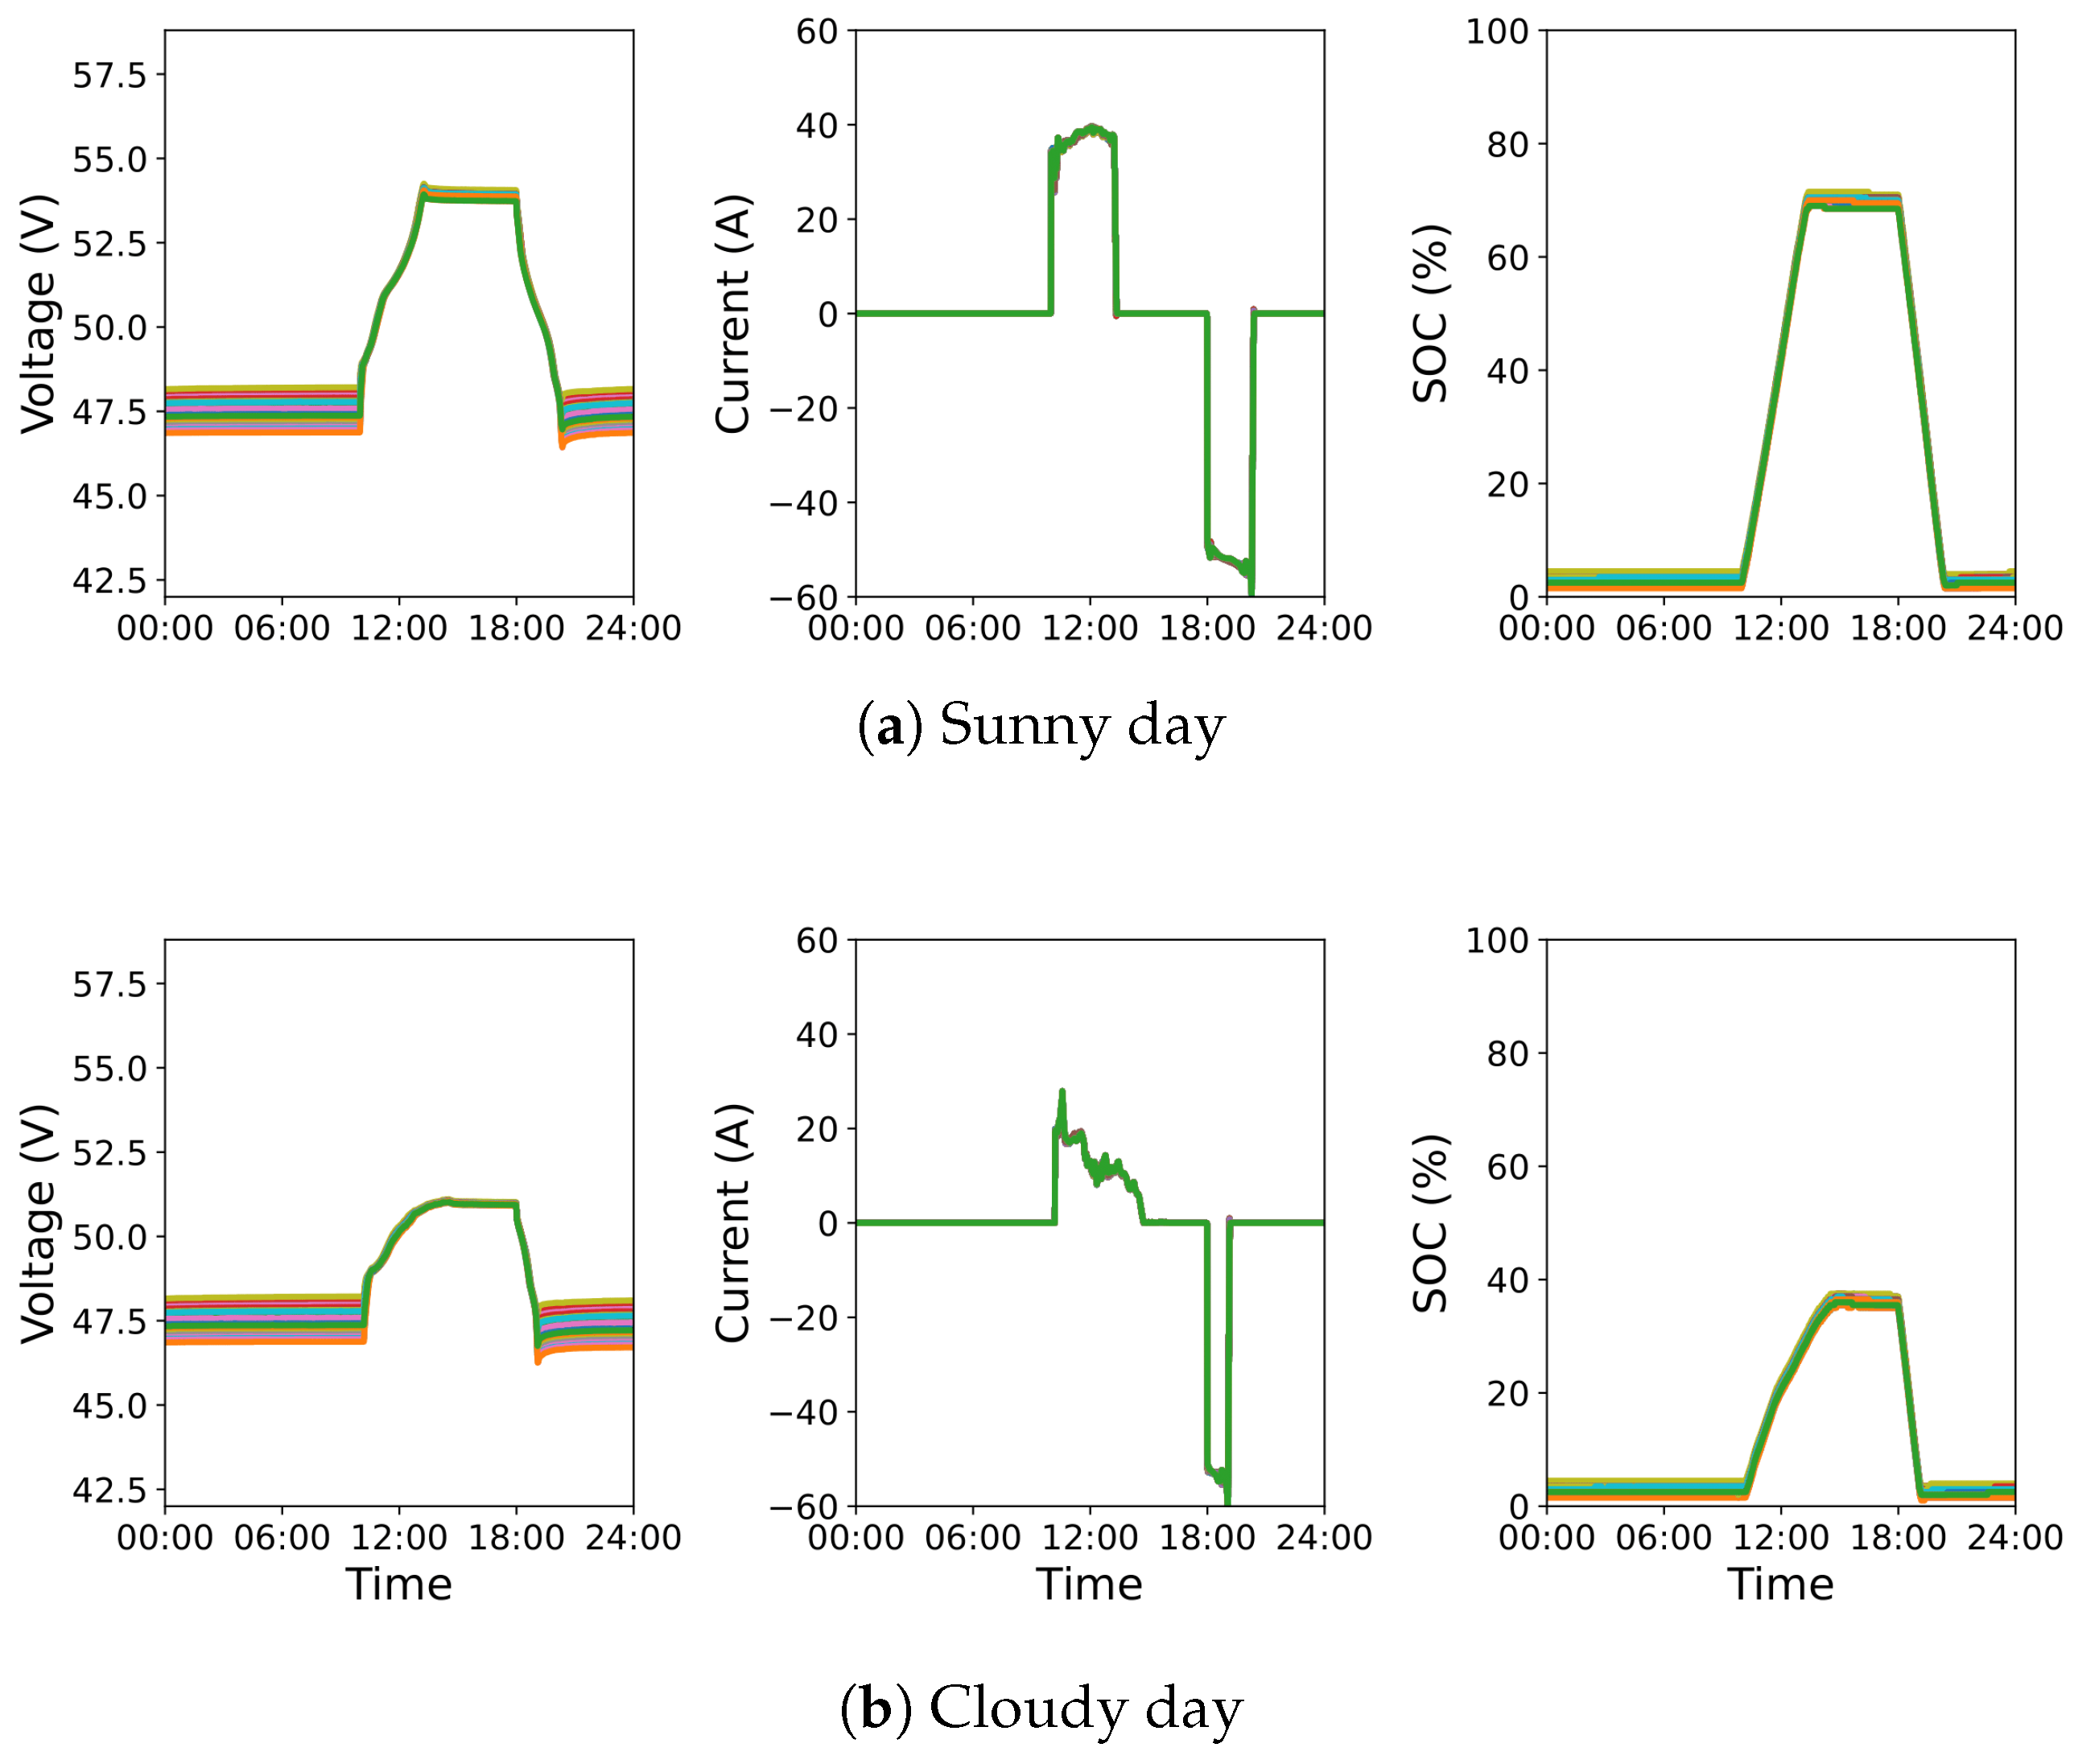
  • The proposed method is not restricted to specific charging or discharging protocols. We demonstrate the method with a laboratory dataset with multi-step CC charging protocols, and a field dataset with fluctuating PV-generated currents.

2. Methodology

The scope of this study is to design a neural surrogate model that characterizes battery behavior without requiring battery characterization tests, and to quantify VD as a health indicator based on the synthesized voltage in both laboratory and field datasets. This section describes the data used in this study, its preprocessing, the input/output data structure, and the proposed neural surrogate model architecture.

2.1. Data

2.1.1. Laboratory Data

We first describe the dataset generated from a laboratory experiment, which is publicly available [44]. It consists of voltage, current, temperature, capacity, incremental capacity, and internal resistance data for 124 LFP Li-ion battery cells with a nominal capacity of 1.1 Ah and a nominal voltage of 3.3 V. Each cell is charged using a two-stage fast charge policy until 80% SOC is reached, followed by 1C CCCV charging. Each cell follows a different fast charge policy, in which each policy consists of one or two CC stages at specified C-rates. If the charge cut-off voltage is reached before achieving 80% SOC, the protocol switches to CV charging at 3.6 V. Once fully charged, the cell is discharged at a rate of 4C until the voltage reaches 2.0 V. The cells are cycled until the capacity reaches 80% of their nominal capacity (0.88 Ah). The average cycle life is 801 cycles, with a standard deviation of 378 cycles. The longest cycle life is 2237 cycles, while the shortest cycle life is 148 cycles. For model training, we used voltage, current, and timestamp data from this dataset. Since internal resistance and temperature measurements are not available in the field dataset introduced later, these additional data are not used. More detailed information about the dataset can be found in [44].
Figure 1 shows two examples of voltage and current data from the laboratory dataset, illustrating different charging policies across cells and a consistent 4C CC discharge protocol.

2.1.2. Field Data

The field dataset is from a PV-integrated BESS located in South Korea. The BESS consists of two battery system controllers (BSCs), each of which contains 9 racks connected in parallel. Each rack consists of 17 modules connected in series, while each module consists of 42 battery cells with a configuration of 3 parallels by 14 series (3P14S). In total, the BESS consists of 306 battery modules and 12,854 cells. In this study, we focus on the module level rather than individual cell level. According to the manufacturer’s specifications, the modules have a nominal voltage of 51.8 V, an end-of-discharge voltage of 42.0 V, an end-of-charge voltage of 58.8 V, and a nominal capacity of 189 Ah. The configuration of the BESS is summarized in Figure 2.
The BESS was charged by PV generation throughout one single day and discharged from 6 p.m. at a constant power rate. The SOC range was set from 5% to 70% for safety purposes, following government regulations enforced in response to a series of BESS fire incidents in Korea. Figure 3a shows the voltage, current, and SOC on a day with high solar irradiation, so the BESS is fully charged. On the contrary, on a day with low solar irradiation, the BESS is partially charged, as shown in Figure 3b. Furthermore, due to the regulations for BESS safety, the SOC range and charging/discharging patterns had been changed several times over the past few years, so our choice of an 11-month period (335 days) for operating patterns remained unchanged.
From the field dataset, voltage and current data were used for model training. All data measurements were sampled every minute, allowing the timestamps to be excluded from the input features for simplicity. The voltage was obtained from the module while the current was measured from the rack since only one current sensor was installed per rack. We assume that the same current flows through all modules within each rack, as they are connected in series. Although temperature affects battery degradation, we excluded temperature data because the available measurements represent inflow and outflow air temperatures with low sensor resolution and minimal variation across modules. To simplify the input feature space and avoid introducing noise, temperature is not used in the model.

2.1.3. Data Preprocessing

For each dataset, voltage and current measurements were normalized using min–max scaling to enhance training stability, as follows:
z t = x t min ( x ) max ( x ) min ( x )
where x denotes a terminal voltage or current sequence and z denotes its normalized version. Specifically, we set min ( v ) = 2.0 V, max ( v ) = 3.6 V, min ( i ) = 4.4 A, and max ( i ) = 10 A for the laboratory dataset, and min ( v ) = 42.0 V, max ( v ) = 58.8 V, min ( i ) = 75 A, and max ( i ) = 75 A for the field dataset. The timestamps in the laboratory dataset are not normalized.
After normalization, each sequence is divided into two parts: one for battery identification, denoted by the subscript   id , and the other for voltage synthesis, denoted by the subscript   syn . For instance, in the case of voltage sequence, v = [ v id , v syn ] , where
v id = [ v 1 , v 2 , . . . , v m ] , v syn = [ v m + 1 , v m + 2 , . . . , v m + n ] .
Similarly, let i = [ i id , i syn ] denote the current sequence, where
i id = [ i 1 , i 2 , . . . , i m ] , i syn = [ i m + 1 , i m + 2 , . . . , i m + n ] ,
and let ψ = [ ψ id , ψ syn ] denote the timestamp sequence, where
ψ id = [ ψ 1 , ψ 2 , . . . , ψ m ] , ψ syn = [ ψ m + 1 , ψ m + 2 , . . . , ψ m + n ] , and ψ = [ ψ id , ψ syn ] .
Here, m and n denote the sequence length of battery identification sequences and voltage synthesis sequences, respectively.
The battery identification sequences provided information on battery characteristics and states at t = m to the proposed neural surrogate model, while the voltage synthesis sequences were processed by the proposed model to synthesize terminal voltage for t [ m + 1 , m + n ] . The architecture of the proposed model is explained in Section 2.2.
For the laboratory dataset, we resampled the data to a length of 500 to enhance computational efficiency by using larger time steps, since the original sampling interval was in the order of seconds, which is significantly shorter than that of the field dataset.

2.2. Proposed Battery Neural Surrogate Model Architecture

In this section, we describe the proposed battery neural surrogate model based on the state-space model as follows:
x t = f ( x t 1 , u t 1 ) y t = g ( x t , u t )
Here, x t represents a state, u t represents an input, and y t represents an output at time step t. In this study, we modeled the battery that takes current as the input and terminal voltage as the output, i.e., u t = [ i t , ψ t ] and y t = v t .
To learn this state-space model, a long short-term memory (LSTM) [45]-based neural network was designed. Specifically, we chose LSTM to approximate the state transition function f and multi-layer perceptron (MLP) to approximate the output function g . For time step t [ m + 1 , m + n ] , the LSTM computed its hidden states at time step t, h t , using its last hidden states h t 1 and input [ i t , ψ t ] , and the MLP transformed h t to the predicted terminal voltage v ^ t . To predict the terminal voltage at t [ m + 1 , m + n ] , a consistent initial state h m was required, so we used another LSTM to estimate the initial state from v i d and i i d . As a result, the architecture of the neural surrogate model followed the sequence-to-sequence (Seq2Seq) architecture, which is well known in natural language processing [46]. Then, the proposed neural surrogate model is
h m = LSTM id ( v id , i id , ψ id ; θ id )
h t = LSTM syn ( h t 1 , i t , ψ t ; θ syn ) , t [ m + 1 , m + n ]
v ^ t = MLP ( h t ; θ MLP )
where LSTM id denotes an initial state estimator, θ id denotes the parameter of LSTM id , LSTM syn denotes an approximation of the state transition function, θ syn denotes the parameters of LSTM syn , and θ MLP denotes the parameter of MLP. Figure 4 shows the proposed two-stage model architecture.
This two-stage model architecture is the core part of the proposed model. The Seq2Seq-based architecture is more suitable than the single LSTM for the neural surrogate model because the LSTM id enables the model to learn the relationship between the current and voltage from scratch aside from estimating the initial state h m . This allows the model to adapt to numerous battery cells or modules in various conditions automatically, so that the model can predict the voltage of batteries accurately without any prior feature extraction about the battery characteristics. Due to this advantage, the proposed neural surrogate model can predict the terminal voltage of hundreds of batteries with single neural networks, which makes the proposed framework scalable and practical for real-world applications.

3. Model Selection

In this section, we describe how to determine the hyperparameters of the proposed model. First, we train the model to evaluate its accuracy, using 70% of the available data as training data, 15% as validation data, and the remaining 15% as test data, all selected through random sampling. We set m = 250 and n = 250 for the laboratory dataset, and m = 1000 and n = 440 for the field dataset, where m and n represent the number of time steps used in LSTM id and LSTM syn , respectively. These settings were chosen so that the battery identification part ( LSTM id ) corresponds to the charging period and the voltage synthesis part ( LSTM syn ) corresponds to the discharging period. This gives an advantage in state estimation since charging period contains more information about the impedance due to varying current.
We determine the hyperparameters by Bayesian optimization using the tree-structured Parzen estimator (TPE) [47] sampler in Optuna [48]. The hyperparameters include the number of nodes in hidden layers of MLP (fc_dim), the number of layers in MLP (fc_layers), the dimension of hidden states in LSTM (hidden_size), and the number of LSTM layers (lstm_layers). The hyperparameters are sampled 50 times for each dataset. The top five performing hyperparameters along with their losses, root mean square error (RMSE), and coefficient of determination ( R 2 ) of the synthesized voltages are presented in Table 1 and Table 2.
We then trained the model with the best performing hyperparameters, using the early part of the data, to observe the increase in voltage deviation (VD). For laboratory data, we used the first 300 cycles of data for model selection. From these data, 20% of the data were randomly sampled for validation, and the remaining 80% of the data were used for training. For field data, the first 150 days of data were used for model selection. Randomly sampled 30 days of data were used for validation and the remaining 120 days of data were used for training.

4. Results and Discussion

In this section, we describe the experimental results. We trained the proposed neural surrogate models with 300 cycles in the case of laboratory data and 150 days in the case of field data, as described in Section 3, respectively. Then, the mean absolute error (MAE) of voltage was evaluated on validation datasets. The proposed surrogate models achieve MAEs of 6.4 mV and 49 mV for laboratory and field data, respectively. Considering that the voltage range of the cells is from 2.0 V to 3.6 V and that of battery modules is from 42.0 V to 58.8 V, the MAEs correspond to 0.4% and 0.29% of their voltage ranges, which shows the high accuracy of the proposed model. Figure 5 shows a comparison between the synthesized and actual voltages for both laboratory and field validation datasets. The figure shows that the proposed neural surrogate model effectively synthesizes the terminal voltage of an LFP cell under a 4C CC discharge condition (Figure 5a) and the 3P14S NCM module under a constant power discharge condition (Figure 5b).
Then, we evaluated the voltage deviation on the test dataset to illustrate the effect of battery degradation captured by the proposed surrogate model. Figure 6 shows the synthesized and the actual voltage on the test dataset. The cell and the module presented in Figure 6 are identical with those in Figure 5, but after more extensive usage. The cell/module index and the cycle number/date are presented in the aforementioned figures. As the figures illustrate, the deviation is higher in the test dataset, since the actual voltages decline faster due to the degradation.
We tracked VD over the test period with the model trained only on the data when the batteries were fresh. We observe that the deviation increases as the batteries degrade. Figure 7 shows the VD curves for seven typical cells with various cycle lives. The end-of-life (EOL) for each cell is indicated next to its curve. From Figure 7, we observe that VD increases slowly in the beginning but then exhibits a steep rise as the cells approach their EOL.
To identify the point at which VD begins to rapidly increase, we divide the VD–cycle curve of each cell into two sections and perform linear regression on each section. The cycle number that divides the VD curve is determined by minimizing the sum of squared errors of the two linear regressions. The intersection of the two fitted lines is regarded as the onset of the rapid VD increase. The mean of these points, or threshold, is 15.9 mV, with a standard deviation of 0.11 mV. When the VD reaches the threshold, the remaining useful life of the cell is 23.8% of its cycle life on average. And at the EOL, typical VD values are between 0.15 V and 0.2 V, which is 10 times larger than the threshold. These results imply that the VD can be used as a health indicator for batteries. Figure 8 shows the cycle-by-cycle deviation for all 124 cells along with the threshold. Each cell is assigned a unique color, while a black circle marker denotes the EOL. Interestingly, the cells whose cycle life is around 500 exhibit a smaller VD than others. This is because the cells with a short cycle life have already degraded before the 300th cycle, and the model has been trained with data until this point already. Hence, their VDs are relatively low.
Similar results are also observed in the field data. The daily VD of 10 modules are shown in Figure 9. The red lines represent the raw VD for the five modules with the highest VD, the blue lines are for the five modules with the lowest VD, and the gray line is for the mean VD of a total of 306 modules. The VD curves have some spikes because VD is high on cloudy days, which are relatively few in the dataset. To remove these peaks, we filtered the raw VD with a median filter with a window size of 10. The filtered VDs are illustrated as dotted lines in Figure 9. After filtering, it is noticeable that the VD of some modules are higher and also increase faster than others. Considering the results in the laboratory data, we can infer that modules with higher deviation in the field are likely to have shorter lifetimes.
Finally, we analyzed the relationship between the features and capacity to verify if the proposed model was able to characterize the batteries effectively. We visualize the relationship between the features and the capacities in Figure 10. The features in Figure 10 are h m , which are the characteristics and states of the batteries identified by LSTM id , where each point represents h m of each cycle. Figure 10 presents that some features, such as Feature 9, are highly related to capacity. This result shows that the proposed model captures and utilizes the physical characteristics of batteries to synthesize the terminal voltage, rather than simply memorizing the averaged discharge curves.

5. Conclusions

In this paper, we propose a battery diagnostic method for large-scale applications based on a neural surrogate model for batteries. The proposed neural surrogate model accurately synthesizes the terminal voltage of batteries with instant characterization, which makes the proposed method scalable. The MAE of the synthesized voltages is 6.4 mV for 124 LFP cells, and 49 mV for 306 NCM battery modules, demonstrating the ability of the neural surrogate model to adapt to various electrode materials and configurations. The latent features of the neural surrogate model are analyzed, and a correlation to capacity is observed. This result highlights the effectiveness of the neural surrogate model in capturing the state and characteristics of batteries.
To quantify the degradation of batteries, VD is introduced as a health indicator, which is a deviation between the synthesized and the measured voltage. VD is evaluated over cycles in lab data, and its rapid increase is observed as a cell reaches its EOL. The result confirms the effectiveness of VD as a health indicator, as it rises rapidly before the EOL. Similarly, in field data, some modules exhibit higher VD, with a more pronounced rate of increase. This result implies that VD can be used to detect abnormal batteries in real-world applications, even before significant degradation occurs.

Author Contributions

Conceptualization, H.C.; methodology, H.C.; validation, H.C. and J.J.; data curation, J.J. and B.J.; writing—original draft preparation, H.C.; writing—review and editing, H.K.; supervision, H.K.; project administration, B.J.; funding acquisition, H.K. All authors have read and agreed to the published version of the manuscript.

Funding

This research was supported by Doosan Enerbility, Republic of Korea. This work was supported in part by the Korea Institute of Energy Technology Evaluation and Planning (KETEP), Republic of Korea, in part by the Ministry of Trade, Industry & Energy (MOTIE) of Korea under Grant 202300321745.

Institutional Review Board Statement

Not applicable.

Informed Consent Statement

Not applicable.

Data Availability Statement

The original data presented in this study are not publicly available due to the confidential agreements.

Acknowledgments

The data used in this work were provided by Doosan Enerbility.

Conflicts of Interest

Author Byungil Jung was employed by the company Doosan Enerbility. The remaining authors declare that the research was conducted in the absence of any commercial or financial relationships that could be construed as a potential conflict of interest.

References

  1. Edge, J.S.; O’Kane, S.; Prosser, R.; Kirkaldy, N.D.; Patel, A.N.; Hales, A.; Ghosh, A.; Ai, W.; Chen, J.; Yang, J.; et al. Lithium ion battery degradation: What you need to know. Phys. Chem. Chem. Phys. 2021, 23, 8200–8221. [Google Scholar] [CrossRef]
  2. Kabir, M.; Demirocak, D.E. Degradation mechanisms in Li-ion batteries: A state-of-the-art review. Int. J. Energy Res. 2017, 41, 1963–1986. [Google Scholar] [CrossRef]
  3. Birkl, C.R.; Roberts, M.R.; McTurk, E.; Bruce, P.G.; Howey, D.A. Degradation diagnostics for lithium ion cells. J. Power Sources 2017, 341, 373–386. [Google Scholar] [CrossRef]
  4. Semeraro, C.; Caggiano, M.; Olabi, A.G.; Dassisti, M. Battery monitoring and prognostics optimization techniques: Challenges and opportunities. Energy 2022, 255, 124538. [Google Scholar] [CrossRef]
  5. Hu, X.; Xu, L.; Lin, X.; Pecht, M. Battery lifetime prognostics. Joule 2020, 4, 310–346. [Google Scholar] [CrossRef]
  6. Hu, X.; Li, S.; Peng, H. A comparative study of equivalent circuit models for Li-ion batteries. J. Power Sources 2012, 198, 359–367. [Google Scholar] [CrossRef]
  7. Tran, M.K.; Fowler, M. A review of lithium-ion battery fault diagnostic algorithms: Current progress and future challenges. Algorithms 2020, 13, 62. [Google Scholar] [CrossRef]
  8. Tran, M.K.; Mathew, M.; Janhunen, S.; Panchal, S.; Raahemifar, K.; Fraser, R.; Fowler, M. A comprehensive equivalent circuit model for lithium-ion batteries, incorporating the effects of state of health, state of charge, and temperature on model parameters. J. Energy Storage 2021, 43, 103252. [Google Scholar] [CrossRef]
  9. Sihvo, J.; Roinila, T.; Stroe, D.I. SOH analysis of Li-ion battery based on ECM parameters and broadband impedance measurements. In Proceedings of the IECON 2020 the 46th Annual Conference of the IEEE Industrial Electronics Society, Singapore, 18–21 October 2020; pp. 1923–1928. [Google Scholar] [CrossRef]
  10. Miyake, T.; Suzuki, T.; Funabashi, S.; Saito, N.; Kamezaki, M.; Shoda, T.; Saigo, T.; Sugano, S. Bayesian Estimation of Model Parameters of Equivalent Circuit Model for Detecting Degradation Parts of Lithium-Ion Battery. IEEE Access 2021, 9, 159699–159713. [Google Scholar] [CrossRef]
  11. Amir, S.; Gulzar, M.; Tarar, M.O.; Naqvi, I.H.; Zaffar, N.A.; Pecht, M.G. Dynamic equivalent circuit model to estimate state-of-health of lithium-ion batteries. IEEE Access 2022, 10, 18279–18288. [Google Scholar] [CrossRef]
  12. Wang, J.; Jia, Y.; Yang, N.; Lu, Y.; Shi, M.; Ren, X.; Lu, D. Precise equivalent circuit model for Li-ion battery by experimental improvement and parameter optimization. J. Energy Storage 2022, 52, 104980. [Google Scholar] [CrossRef]
  13. Rukavina, F.; Leko, D.; Matijašić, M.; Bralić, I.; Ugalde, J.M.; Vašak, M. Identification of equivalent circuit model parameters for a Li-ion battery cell. In Proceedings of the 2023 IEEE 11th International Conference on Systems and Control (ICSC), Sousse, Tunisia, 18–20 December 2023; IEEE: New York, NY, USA, 2023; pp. 671–676. [Google Scholar]
  14. Xu, W.; Wang, S.; Jiang, C.; Fernandez, C.; Yu, C.; Fan, Y.; Cao, W. A novel adaptive dual extended Kalman filtering algorithm for the Li-ion battery state of charge and state of health co-estimation. Int. J. Energy Res. 2021, 45, 14592–14602. [Google Scholar] [CrossRef]
  15. Ling, L.; Wei, Y. State-of-charge and state-of-health estimation for lithium-ion batteries based on dual fractional-order extended Kalman filter and online parameter identification. IEEE Access 2021, 9, 47588–47602. [Google Scholar] [CrossRef]
  16. Fan, Y.; Shi, H.; Wang, S.; Fernandez, C.; Cao, W.; Huang, J. A Novel Adaptive Function—Dual Kalman Filtering Strategy for Online Battery Model Parameters and State of Charge Co-Estimation. Energies 2021, 14, 2268. [Google Scholar] [CrossRef]
  17. Li, X.; Yuan, C.; Wang, Z.; He, J.; Yu, S. Lithium battery state-of-health estimation and remaining useful lifetime prediction based on non-parametric aging model and particle filter algorithm. Etransportation 2022, 11, 100156. [Google Scholar] [CrossRef]
  18. Xu, Y.; Chen, X.; Zhang, H.; Yang, F.; Tong, L.; Yang, Y.; Yan, D.; Yang, A.; Yu, M.; Liu, Z.; et al. Online identification of battery model parameters and joint state of charge and state of health estimation using dual particle filter algorithms. Int. J. Energy Res. 2022, 46, 19615–19652. [Google Scholar] [CrossRef]
  19. Qiao, J.; Wang, S.; Yu, C.; Yang, X.; Fernandez, C. A chaotic firefly-Particle filtering method of dynamic migration modeling for the state-of-charge and state-of-health co-estimation of a lithium-ion battery performance. Energy 2023, 263, 126164. [Google Scholar] [CrossRef]
  20. Abdelhafiz, S.M.; Fouda, M.E.; Radwan, A.G. Parameter identification of li-ion batteries: A comparative study. Electronics 2023, 12, 1478. [Google Scholar] [CrossRef]
  21. Hossain, M.; Saha, S.; Haque, M.E.; Arif, M.T.; Oo, A.M.T. A parameter extraction method for the Thevenin equivalent circuit model of Li-ion batteries. In Proceedings of the 2019 IEEE Industry Applications Society Annual Meeting, Baltimore, MD, USA, 29 September–3 October 2019; IEEE: New York, NY, USA, 2019; pp. 1–7. [Google Scholar]
  22. Sun, J.; Kainz, J. Optimization of hybrid pulse power characterization profile for equivalent circuit model parameter identification of Li-ion battery based on Taguchi method. J. Energy Storage 2023, 70, 108034. [Google Scholar] [CrossRef]
  23. Vyroubal, P.; Kazda, T. Equivalent circuit model parameters extraction for lithium ion batteries using electrochemical impedance spectroscopy. J. Energy Storage 2018, 15, 23–31. [Google Scholar] [CrossRef]
  24. Li, D.; Yang, D.; Li, L.; Wang, L.; Wang, K. Electrochemical impedance spectroscopy based on the state of health estimation for lithium-ion batteries. Energies 2022, 15, 6665. [Google Scholar] [CrossRef]
  25. Doyle, M.; Fuller, T.F.; Newman, J. Modeling of galvanostatic charge and discharge of the lithium/polymer/insertion cell. J. Electrochem. Soc. 1993, 140, 1526. [Google Scholar] [CrossRef]
  26. Atlung, S.; West, K.; Jacobsen, T. Dynamic aspects of solid solution cathodes for electrochemical power sources. J. Electrochem. Soc. 1979, 126, 1311. [Google Scholar] [CrossRef]
  27. Gao, Y.; Liu, K.; Zhu, C.; Zhang, X.; Zhang, D. Co-Estimation of State-of-Charge and State-of- Health for Lithium-Ion Batteries Using an Enhanced Electrochemical Model. IEEE Trans. Ind. Electron. 2022, 69, 2684–2696. [Google Scholar] [CrossRef]
  28. Sadabadi, K.K.; Jin, X.; Rizzoni, G. Prediction of remaining useful life for a composite electrode lithium ion battery cell using an electrochemical model to estimate the state of health. J. Power Sources 2021, 481, 228861. [Google Scholar] [CrossRef]
  29. Li, Y.; Liu, G.; Deng, W.; Li, Z. Comparative study on parameter identification of an electrochemical model for lithium-ion batteries via meta-heuristic methods. Appl. Energy 2024, 367, 123437. [Google Scholar] [CrossRef]
  30. Jiang, B.; Zhu, J.; Wang, X.; Wei, X.; Shang, W.; Dai, H. A comparative study of different features extracted from electrochemical impedance spectroscopy in state of health estimation for lithium-ion batteries. Appl. Energy 2022, 322, 119502. [Google Scholar] [CrossRef]
  31. Fan, M.; Geng, M.; Yang, K.; Zhang, M.; Liu, H. State of health estimation of lithium-ion battery based on electrochemical impedance spectroscopy. Energies 2023, 16, 3393. [Google Scholar] [CrossRef]
  32. Li, Y.; Maleki, M.; Banitaan, S. State of health estimation of lithium-ion batteries using EIS measurement and transfer learning. J. Energy Storage 2023, 73, 109185. [Google Scholar] [CrossRef]
  33. Li, X.; Yuan, C.; Li, X.; Wang, Z. State of health estimation for Li-Ion battery using incremental capacity analysis and Gaussian process regression. Energy 2020, 190, 116467. [Google Scholar] [CrossRef]
  34. Wang, C.; Sun, Y.; Gao, Y.; Yan, P. The incremental capacity curves and frequency response characteristic evolution of lithium titanate battery during ultra-high-rate discharging cycles. Energies 2023, 16, 3434. [Google Scholar] [CrossRef]
  35. Wei, M.; Balaya, P.; Ye, M.; Song, Z. Remaining useful life prediction for 18650 sodium-ion batteries based on incremental capacity analysis. Energy 2022, 261, 125151. [Google Scholar] [CrossRef]
  36. Choi, Y.; Ryu, S.; Park, K.; Kim, H. Machine learning-based lithium-ion battery capacity estimation exploiting multi-channel charging profiles. IEEE Access 2019, 7, 75143–75152. [Google Scholar] [CrossRef]
  37. Park, K.; Choi, Y.; Choi, W.J.; Ryu, H.Y.; Kim, H. LSTM-Based Battery Remaining Useful Life Prediction With Multi-Channel Charging Profiles. IEEE Access 2020, 8, 20786–20798. [Google Scholar] [CrossRef]
  38. Kim, S.W.; Oh, K.Y.; Lee, S. Novel informed deep learning-based prognostics framework for on-board health monitoring of lithium-ion batteries. Appl. Energy 2022, 315, 119011. [Google Scholar] [CrossRef]
  39. Chen, D.; Zhou, X. AttMoE: Attention with Mixture of Experts for remaining useful life prediction of lithium-ion batteries. J. Energy Storage 2024, 84, 110780. [Google Scholar] [CrossRef]
  40. Reza, M.; Mannan, M.; Mansor, M.; Ker, P.J.; Mahlia, T.I.; Hannan, M. Recent advancement of remaining useful life prediction of lithium-ion battery in electric vehicle applications: A review of modelling mechanisms, network configurations, factors, and outstanding issues. Energy Rep. 2024, 11, 4824–4848. [Google Scholar] [CrossRef]
  41. Oka, K.; Tanibata, N.; Takeda, H.; Nakayama, M.; Noguchi, S.; Karasuyama, M.; Fujiwara, Y.; Miyuki, T. Deep learning based emulator for predicting voltage behaviour in lithium ion batteries. Sci. Rep. 2024, 14, 28905. [Google Scholar] [CrossRef]
  42. Liu, H.; Li, C.; Hu, X.; Li, J.; Zhang, K.; Xie, Y.; Wu, R.; Song, Z. Multi-modal framework for battery state of health evaluation using open-source electric vehicle data. Nat. Commun. 2025, 16, 1137. [Google Scholar] [CrossRef]
  43. Tang, T.; Yang, X.; Li, M.; Li, X.; Huang, H.; Guan, C.; Huang, J.; Wang, Y.; Zhou, C. Deep learning model-based real-time state-of-health estimation of lithium-ion batteries under dynamic operating conditions. Energy 2025, 317, 134697. [Google Scholar] [CrossRef]
  44. Severson, K.A.; Attia, P.M.; Jin, N.; Perkins, N.; Jiang, B.; Yang, Z.; Chen, M.H.; Aykol, M.; Herring, P.K.; Fraggedakis, D.; et al. Data-driven prediction of battery cycle life before capacity degradation. Nat. Energy 2019, 4, 383–391. [Google Scholar] [CrossRef]
  45. Hochreiter, S.; Schmidhuber, J. Long short-term memory. Neural Comput. 1997, 9, 1735–1780. [Google Scholar] [CrossRef] [PubMed]
  46. Sutskever, I.; Vinyals, O.; Le, Q.V. Sequence to sequence learning with neural networks. Adv. Neural Inf. Process. Syst. 2014, 27, 3104–3112. [Google Scholar]
  47. Bergstra, J.; Bardenet, R.; Bengio, Y.; Kégl, B. Algorithms for hyper-parameter optimization. Adv. Neural Inf. Process. Syst. 2011, 24, 2546–2554. [Google Scholar]
  48. Akiba, T.; Sano, S.; Yanase, T.; Ohta, T.; Koyama, M. Optuna: A Next-generation Hyperparameter Optimization Framework. In Proceedings of the 25th ACM SIGKDD International Conference on Knowledge Discovery and Data Mining, Anchorage, AK, USA, 4–8 August 2019. [Google Scholar]
Figure 1. Voltage and current data sampled from laboratory dataset.
Energies 18 02405 g001
Figure 2. The configuration of commercial BESS.
Energies 18 02405 g002
Figure 3. Voltage, current, and SOC of 153 modules in BSC1. Each line represents one battery module.
Energies 18 02405 g003
Figure 4. The architecture of battery neural surrogate model.
Energies 18 02405 g004
Figure 5. Voltage synthesis results for validation datasets. (a): laboratory data. (b): field data.
Energies 18 02405 g005
Figure 6. Voltage synthesis results for test datasets. (a): laboratory data. (b): field data.
Energies 18 02405 g006
Figure 7. Voltage deviation vs. cycle (laboratory data).
Energies 18 02405 g007
Figure 8. Voltage deviation vs. cycle (laboratory data).
Energies 18 02405 g008
Figure 9. Voltage deviation vs. days elapsed (field data). The solid line indicates the raw voltage deviation, and the dashed line indicates the filtered voltage deviation.
Energies 18 02405 g009
Figure 10. The relationship between the features h m and the capacity of the batteries.
Energies 18 02405 g010aEnergies 18 02405 g010b
Table 1. The top 5 performing hyperparameters for laboratory data. The model was trained with 70% of laboratory data.
fc_dimfc_LayersHidden_Sizelstm_LayersLoss (MSE)RMSE (mV) R 2
126118837.89 × 10 5 10.970.9871
153117229.41 × 10 5 12.410.9867
103117449.72 × 10 5 12.880.9869
159117251.01 × 10 4 12.910.9866
103117231.08 × 10 4 13.330.9868
Table 2. The top 5 performing hyperparameters for field data. The model was trained with 70% of field data.
fc_dimfc_LayersHidden_Sizelstm_LayersLoss (MSE)RMSE (mV) R 2
17129021.78 × 10 5 59.420.9948
185310931.90 × 10 5 68.960.9957
192111021.99 × 10 5 64.100.9938
13726022.01 × 10 5 65.060.9940
155312722.11 × 10 5 68.500.9941
Disclaimer/Publisher’s Note: The statements, opinions and data contained in all publications are solely those of the individual author(s) and contributor(s) and not of MDPI and/or the editor(s). MDPI and/or the editor(s) disclaim responsibility for any injury to people or property resulting from any ideas, methods, instructions or products referred to in the content.

