Article

An Analysis of the Factors Influencing Energy Consumption Based on the STIRPAT Model: A Case Study of the Western Regions of China

1
Faculty of Humanities and Social Sciences, Macao Polytechnic University, Macao 999078, China
2
Department of Economic Management, CPC Guizhou Provincial Party School, Guiyang 550025, China
3
School of Economics and Management, Jiangxi Agricultural University, Nanchang 330045, China
*
Author to whom correspondence should be addressed.
Energies 2025, 18(9), 2379; https://doi.org/10.3390/en18092379
Submission received: 28 February 2025 / Revised: 9 April 2025 / Accepted: 13 April 2025 / Published: 7 May 2025
(This article belongs to the Special Issue Policy and Economic Analysis of Energy Systems)

Abstract

:
Understanding the factors influencing energy consumption is crucial for sustainable development. This study quantitatively analyzes the factors influencing energy consumption in China’s western regions from 2000 to 2022, employing the STIRPAT model, cointegration analysis, and ridge regression. Focusing on population size, economic development, industrial structure, urbanization, and technological progress, the results reveal significant heterogeneity in their impacts. Urbanization exhibits the strongest positive effect, with a 1% increase leading to a 0.483% rise in energy consumption, followed by economic development and industrial structure. Population growth has a modest positive influence, while technological progress demonstrates a mitigating effect, reducing energy demand. The findings underscore the critical role of urbanization and industrial restructuring in shaping energy consumption patterns. Policy recommendations emphasize optimizing urban layouts, accelerating industrial upgrades, and promoting technological innovation to achieve sustainable energy development in the region. These insights provide a foundation for targeted policies to balance economic growth with energy efficiency in Western China.

1. Introduction

Energy serves as the cornerstone of modern economic and social development. Its total consumption and utilization efficiency are not only crucial for the sustainability of economic growth but also closely linked to national security, environmental protection, and global climate change issues [1]. In the case of China, while the continued increase in energy consumption has sustained economic development, it has also highlighted energy security concerns and exacerbated environmental problems [2]. Energy is both the driving force behind economic growth and a key pillar for sustainable social and economic development. Efficient and clean energy utilization, coupled with secure and reliable energy supply, is essential for ensuring long-term economic prosperity. Consequently, energy consumption influences not only the speed and quality of national economic development but also the standard of living and ecological environment. Among all energy-related challenges, energy consumption remains the most significant. The rationality of energy consumption not only reflects China’s economic development status but also determines the feasibility of sustainable economic growth.
Notably, due to regional resource endowments and economic foundations, China exhibits a stepwise economic development pattern, with higher growth in the east, followed by the central region, and relatively lower development in the west [3]. Western China, characterized by vast territories and abundant natural resources, possesses significant reserves of coal, oil, and natural gas, along with substantial potential for renewable energy development, including wind and solar energy [4]. However, the region’s energy consumption model has long been characterized by high energy intensity and low efficiency due to weak economic foundations and a relatively simple industrial structure. Compared with the eastern region, significant structural differences persist. Under the dual drivers of the Western Development Strategy and the Belt and Road Initiative, the western region has experienced rapid economic growth and surging energy demand. However, it also faces severe challenges related to environmental pollution and ecological degradation [5,6]. Scholars worldwide have employed various methods to examine the determinants of energy consumption, with research generally falling into three main categories:
Studies at different scales: Scholars have analyzed the impact of energy consumption on global, cross-national, and national levels. For instance, Bilgen S. [7] provided insights into global energy consumption by fuel type and sector, as well as its environmental impacts. York [8] examined the impact of population growth on energy consumption across 14 EU countries from 1960 to 2000, predicting that a projected population decline in Europe by 2025 would help curb energy demand growth. Ahmed et al. [9] investigated the dynamic relationship between economic growth, financial development, trade, globalization, and energy consumption in China, finding that globalization reduces energy consumption in the short term but increases it in the long term, whereas financial development has the opposite effect. Domestically, Wang Yongzhe et al. [10] employed the GFI M-R spatial decomposition method to analyze spatiotemporal variations in per capita energy consumption in the Beijing–Tianjin–Hebei region. In addition to macro-level research, scholars have conducted in-depth studies on energy consumption in individual provinces [11] and urban–rural disparities [12] in China.
Studies from different perspectives: The determinants of energy consumption are multifaceted, leading to diverse research perspectives. Some studies have focused on single influencing factors. For example, Sheng Pengfei et al. [13] analyzed data from 78 countries between 1995 and 2012 and found that urbanization significantly increased both actual and optimal energy consumption. Other studies have examined individual factors such as economic development [14], industrial structure [15], and technological progress [16]. As research has advanced, scholars have increasingly integrated multiple influencing factors into energy consumption studies. For instance, Robi and Shunsuke [17] constructed an ARDL model using data from 1970 to 2015 to analyze how economic development, urbanization, industrialization, and trade openness impact coal consumption in Indonesia, revealing long-term cointegration relationships among variables. Empirical findings indicate that economic growth, urbanization, and trade openness drive coal consumption, while a decline in the share of the secondary sector reduces coal demand. Subsequently, numerous scholars have adopted a multi-factor approach to studying energy consumption.
Studies employing different methodologies: Some researchers have used factor decomposition methods for analysis. For example, Liao H. et al. [18] decomposed China’s industrial energy intensity changes between 1997 and 2002 into sectoral structural effects and efficiency effects using the Törnqvist and Sato–Vartia index methods. Chunbo Ma [19] applied the Logarithmic Mean Divisia Index (LMDI) approach to analyze energy intensity decomposition from 1994 to 2003, concluding that technological progress was the primary driver of reduced energy intensity in China. Other studies have employed IPAT and related models to investigate the determinants of energy consumption. For instance, Nie Rui [20] utilized the IPAT model to analyze energy consumption factors and future scenarios in Jiangsu Province, while Liu Yansui et al. [21] applied an extended STIRPAT model to quantify the impact of population size, GDP per capita, industrialization, and technological progress on energy consumption and pollutant emissions across 30 Chinese provinces. Additional methods such as linear regression, system dynamics, and ARIMA models have also been widely applied [22,23,24].
This study aims to make three key contributions: First, it isolates Western China as a distinct research subject, systematically identifying the primary drivers of energy consumption from 2000 to 2022 and elucidating their underlying mechanisms. Second, it integrates population size, economic growth, industrial structure, urbanization, and technological progress into a comprehensive model to explore their collective impact on energy consumption—an approach that has been relatively underexplored, particularly regarding the simultaneous inclusion of industrial structure and technological progress. Finally, the empirical findings confirm that population size, economic growth, and urbanization positively impact energy consumption, whereas industrial structure and technological progress exert negative effects. These insights provide valuable guidance for policymakers in formulating more effective and sustainable development policies.
The remainder of this study is structured as follows: Section 2 presents a literature review. Section 3 outlines the methodological framework, empirical model, and data sources. Section 4 discusses empirical results. Section 5 provides an in-depth discussion. Finally, Section 6 concludes the study, offering policy implications, limitations, and directions for future research.

2. Literature Review and Research Hypotheses Formulation

As discussed in the introduction, prior studies have extensively examined the drivers of energy consumption at various scales, perspectives, and methodological frameworks. To further clarify the research background and theoretical foundation, this section conducts a comprehensive review of the factors influencing energy consumption, with a particular focus on population size, economic development, industrial structure, urbanization, and technological progress.

2.1. Impact of Population Size on Energy Consumption

Numerous studies have identified population growth as a critical driver of increased energy consumption [25]. The expansion of population size leads to higher demand for housing, transportation, industrial development, and agricultural infrastructure, all of which are energy-intensive activities. International scholars have argued that population growth is significantly associated with resource depletion and environmental degradation [26]. Similarly, Chinese scholars have reported a positive relationship between population growth and energy use. For instance, Liu [27], using provincial panel data from 2000 to 2013 and an extended STIRPAT model, found that a 1% increase in total population led to a 0.408% increase in urban residential energy consumption. This effect is particularly pronounced in regions experiencing rapid economic development. Yang [28] found that population growth in Western China between 1990 and 2010 had a significant impact on both energy consumption and carbon emissions, highlighting the need to control population size and improve energy efficiency during economic growth.

2.2. Impact of Economic Development on Energy Consumption

Keynes’ consumption function laid the theoretical foundation for investigating consumption behaviors, including energy use. Economic development has long been one of the most extensively studied factors affecting energy consumption. As early as 1978, Kraft and Kraft [29] identified a unidirectional causal relationship from GNP to energy consumption in the United States, implying that energy-saving policies had limited impact on economic growth in energy-independent economies. In China, the study of energy consumption began in the late 20th century. Zhao and Wei [30], applying the Cobb–Douglas production function, found a strong positive correlation between energy consumption and economic growth. However, improvements in energy technology, industrial upgrading, and efficiency have gradually reduced energy intensity per unit of output [31]. For example, Chen and Zeng [32] analyzed the dynamic equilibrium relationship between energy consumption and economic growth in Sichuan Province from 2000 to 2021, revealing a weak decoupling state between 2007 and 2021, indicating partial success in local policy implementation but also room for improvement. Overall, while economic growth typically drives higher energy demand, the magnitude and direction of this influence vary depending on the study region, time frame, policy environment, economic stability, and energy infrastructure [33].

2.3. Impact of Industrial Structure on Energy Consumption

Donella [34] was among the first to highlight the relationship between industrial structure and energy consumption. Narayanan and Santosh [35] further confirmed that shifts in industrial structure significantly affect energy use. During early industrialization, energy-intensive industries dominate, increasing overall demand [36]. Lü and Wu [37] found that the proportion of high-energy-consuming industries directly affects both carbon emissions and energy consumption in Eastern China. As economies transition from agriculture to manufacturing and eventually to service sectors, there is a gradual move toward resource-efficient and knowledge-intensive industries, fostering inter-sectoral linkages that can help reduce overall energy demand [38]. In Yunnan Province, Hong and Zhu [39] used a Vector Autoregressive (VAR) model and found a long-run cointegration relationship between industrial structure and energy structure, with energy consumption changes lagging behind industrial adjustments. This indicates that while high-value manufacturing is still underdeveloped in Western China, efforts to upgrade the industrial structure are underway, aiming to reshape the energy consumption profile and reduce demand.

2.4. Impact of Urbanization on Energy Consumption

Urbanization is a key factor influencing energy demand. The urbanization process not only increases household energy use but also drives energy demand through construction, transportation, and infrastructure development, thereby stimulating energy-intensive sectors such as power and chemicals. Early political economy research by Schnaiberg [40] emphasized that urban expansion inevitably leads to increased energy consumption, regardless of social structure. Jones [41], using cross-sectional data from 59 developing countries in 1980, found that higher urbanization levels correlate with increased energy consumption. Dhakal [42] reported that in 2006, urban areas accounted for 75% of China’s total energy consumption, highlighting the significance of urbanization. Nevertheless, urbanization can also reduce energy consumption per unit output by optimizing resource allocation and improving infrastructure efficiency [43]. Song and Chen [44], using panel data from 11 provinces in Western China from 2002 to 2017, found a nonlinear inverted U-shaped relationship between urbanization and energy consumption, suggesting that the region is still in the early phase of this curve. In Western China, rapid urbanization is characterized by intense infrastructure construction and industrial expansion, leading to a marked increase in energy demand.

2.5. Impact of Technological Progress on Energy Consumption

The relationship between technological progress and energy consumption remains debated. On one hand, advanced technologies improve energy efficiency and reduce energy use per unit of output [45]. Liu and Sun [46] argued that technological progress, as indicated by the number of patents granted, plays a pivotal role in reducing energy consumption. In regions with strong innovation ecosystems, sustained reductions in energy use can be achieved. Chen et al. [47] showed that since 2000, technological progress has significantly contributed to lower energy-related carbon intensity in Western China. On the other hand, the “rebound effect” suggests that greater energy efficiency may reduce energy prices and increase accessibility, thereby leading to higher total energy consumption [48]. Zhou et al. [49] warned that relying solely on technological advancement may, paradoxically, increase overall energy demand. This duality implies that the net effect of technological progress on energy consumption can be either positive or negative. In Western China, where innovation capacity remains relatively weak and energy-saving technologies are not widely adopted, the mitigating impact of technology on energy consumption may be less pronounced than in the more developed eastern regions.

2.6. Research Hypotheses

A synthesis of the literature review indicates extensive research on the effects of population size, economic development, industrial structure, urbanization, and technological progress on energy consumption at the global, national, and regional levels. However, few studies have systematically examined these drivers in the context of Western China, particularly when considering industrial structure and technological progress jointly. Furthermore, the heterogeneous impacts of these drivers in resource-rich but economically transitional regions remain underexplored.
This study therefore seeks to answer the following research questions: (1) What are the causal relationships between population size, economic development, industrial structure, urbanization, technological progress, and energy consumption in Western China? (2) How do population size, economic development, and urbanization influence energy consumption? (3) Do industrial structure and technological progress enhance or mitigate energy consumption? (4) What policy measures can support sustainable energy development in Western China?
To address these questions, we empirically test the following hypotheses using panel data techniques:
 Hypothesis 1:
Energy consumption in Western China is significantly influenced by population size, economic development, industrial structure, urbanization, and technological progress.
 Hypothesis 2:
Population size, economic development, and urbanization are positively correlated with energy consumption in Western China.
 Hypothesis 3:
Industrial structure adjustments and technological progress are negatively correlated with energy consumption in Western China.

3. Materials and Methods

3.1. Study Area and Data Sources
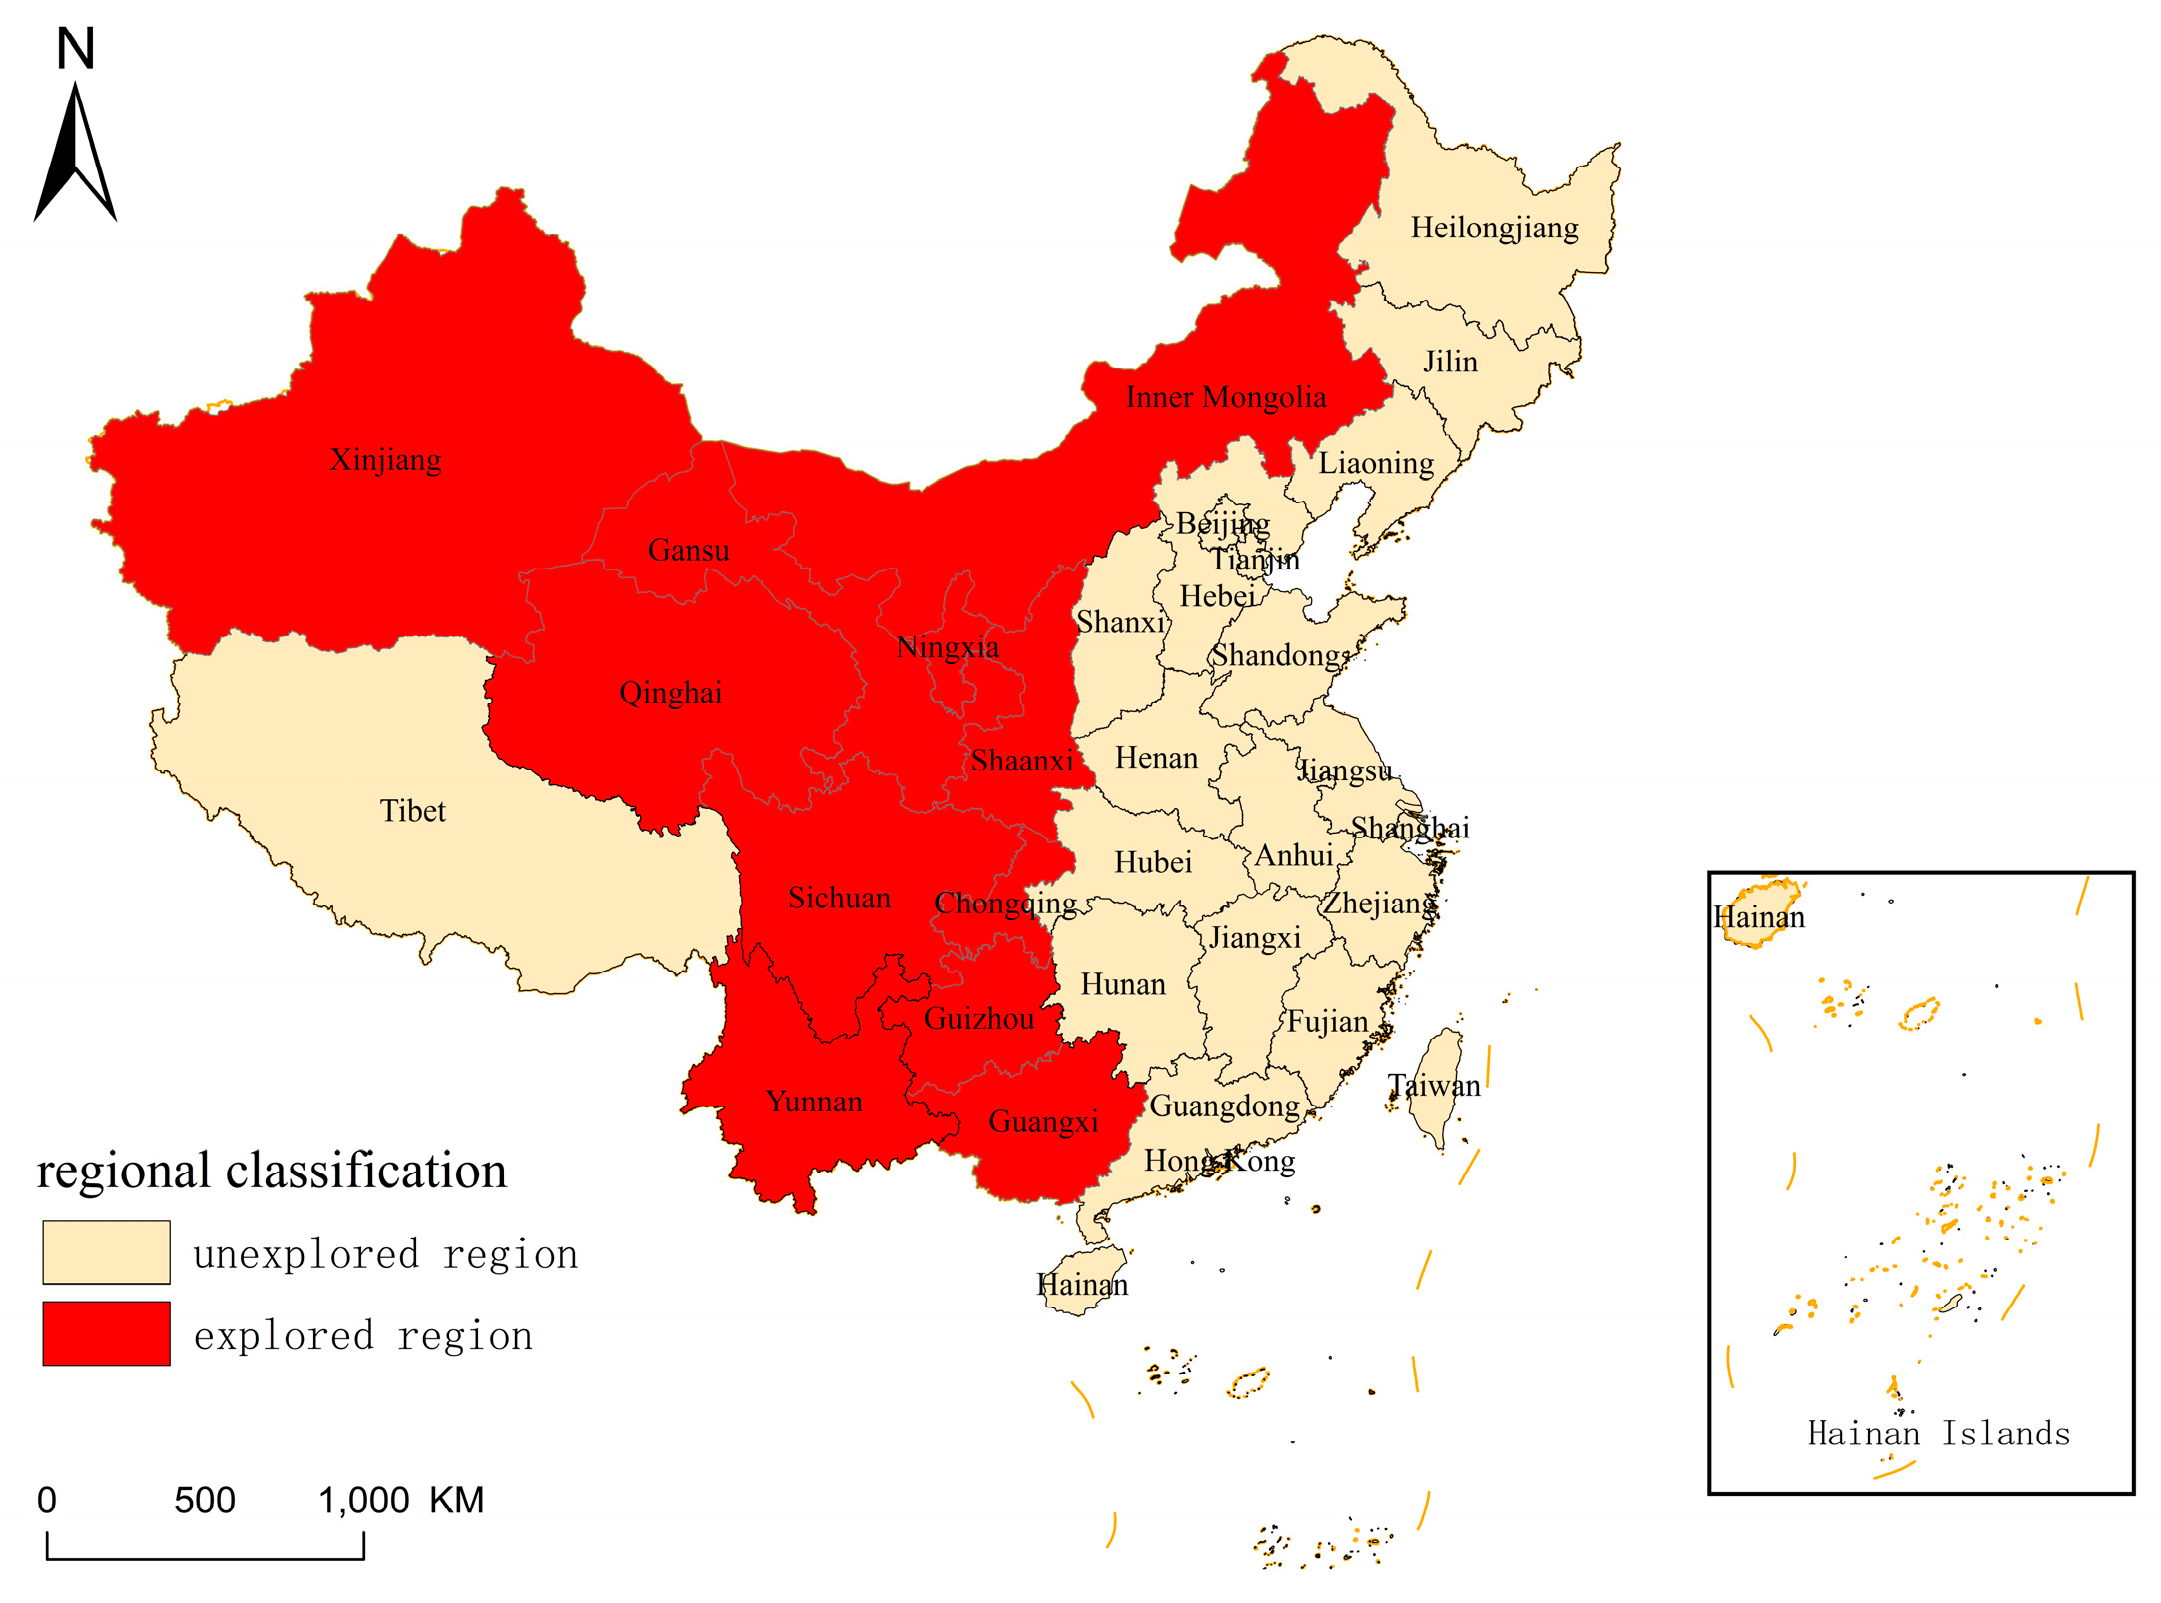
3.1.1. Study Area

The Western Development Strategy includes six provinces: Sichuan, Shaanxi, Yunnan, Guizhou, Gansu, and Qinghai; five autonomous regions: Guangxi Zhuang Autonomous Region, Ningxia Hui Autonomous Region, Tibet Autonomous Region, Xinjiang Uygur Autonomous Region, and Inner Mongolia Autonomous Region; and one municipality directly under the central government: Chongqing. The total land area of these regions is 6.86 million square kilometers, accounting for 72% of the national total. This study focuses on the 12 regions involved in the Western Development Strategy. Given the severe data gaps in Tibet Autonomous Region, it was excluded from the analysis, leaving 11 provinces, autonomous regions, and municipalities as the study regions, as shown in Figure 1.

3.1.2. Data Sources

The sample period selected for this study spans from 2000 to 2022. The data on energy consumption is sourced from the China Energy Statistical Yearbook (2001–2023), while the GDP, year-end resident population, urban resident population, value added by the secondary and tertiary industries, and other relevant data are obtained from the statistical yearbooks of each province, autonomous region, and municipality (2001–2023). Research and development (R&D) expenditure data are sourced from the China Science and Technology Statistical Yearbook (2001–2023). Missing data were supplemented using values from neighboring provinces or nearby years.

3.1.3. Variable Description

The energy consumption indicator refers to the total consumption of primary energy within a specific region over a given period, measured in ten thousand tons of standard coal equivalent (tce). The population size variable is represented by the total population at year-end.
For the economic development indicator, given the bidirectional relationship between economic growth and energy consumption, this study follows the methodology of Fang et al. [50] and Wang et al. [51], employing gross domestic product (GDP) as a proxy. To mitigate the effects of inflation and ensure consistency in real economic growth measurement, all GDP data have been converted to constant prices.
The industrial structure variable is based on the premise that the tertiary sector is generally considered a low-energy-intensity sector, while the secondary sector tends to be energy-intensive. Following the approach of Guo et al. [52], this study measures industrial structure by calculating the ratio of the added value of the tertiary sector to that of the secondary sector. This ratio effectively captures the impact of industrial upgrading on energy consumption.
Urbanization, as an intensive mode of production and living, significantly influences residential energy demand. Higher urbanization levels are typically associated with increased energy consumption due to rising living standards and infrastructure expansion. Consistent with the methodology of Shi et al. [53], this study employs the urbanization rate—defined as the proportion of the urban resident population to the total resident population—as a measure of urbanization.
Technological progress is a critical determinant of energy consumption, as historical shifts in energy structures have always been closely linked to advancements in technology. Given the diverse methods available for quantifying technological progress, scholars generally consider R&D investment, patent counts, research publications, and scientific human resources as independent indicators of technological capability. Among these, R&D expenditure is widely regarded as the most direct driver of technological advancement. Following the methodology of Xiao and Wei [54], this study adopts the ratio of R&D expenditure to GDP as a measure of technological progress. A detailed summary of variable definitions is provided in Table 1.

3.2. Research Methods

3.2.1. STIRPAT Model

This study adopts the STIRPAT model proposed by York et al. [55], which addresses the limitations of the traditional Kaya identity and the IPAT model, specifically the assumption that “all factors impact the environmental situation in equal proportions”. The STIRPAT model allows for appropriate decomposition of various human factors, serving as a revision and extension of the IPAT model. Compared to the IPAT model, the STIRPAT model offers superior flexibility and thus has broader applicability [56]. The model is expressed as follows:
I = a P b A c T d e
In the model, I, P, A, and T represent the carbon emissions or environmental pressure of a region, population size, economic development, and technological progress, respectively. a is the model coefficient, while b, c, and d are the exponents of P, A, and T, respectively. e represents the random error term. The general calculation process converts the model into a logarithmic form, expressed as follows:
ln I = ln a + b ln P + c ln A + d ln T + ln e
Due to variations in research perspectives and focal points, scholars often make corresponding modifications to the STIRPAT model expression to facilitate empirical studies. In this study, industrial structure and technological progress are incorporated into the STIRPAT model, while urbanization level is also considered as a factor. The resulting expression is as follows:
ln E N Y = α + β ln P O P i t + γ ln G D P i t + δ ln S T R i t + λ ln U R B i t + μ ln R D i t + ε i t
Among them, α, β, γ, δ, λ, and μ are the coefficients of the variables, where subscript i represents each province, t denotes the year, and ε varepsilonε is the random disturbance term. This model takes total energy consumption as the dependent variable, allowing an examination of the effects of factors such as population size, economic development, industrial structure, urbanization, and technological progress.

3.2.2. Cointegration and Cointegration Testing

Cointegration theory, proposed by British econometrician Clive W. J. Granger in the 1970s, provides a theoretical framework for analyzing cointegration among time series variables. This theory overcomes the strict assumption limitations of traditional econometric models, making it one of the core areas of modern econometrics research and application [57]. Stationarity, which is a prerequisite for traditional regression analysis, is often difficult to meet in the time series of real economic variables, significantly limiting the applicability of classical regression methods. Directly applying classical regression analysis to non-stationary time series variables may result in “spurious regression”, leading to misleading conclusions.
The introduction and refinement of cointegration theory effectively addressed this issue. The theory posits that if a group of non-stationary variable sequences can form a stable linear combination, these variables are considered cointegrated. The linear combination is referred to as the cointegration equation, reflecting the long-term equilibrium relationship [58], and thus, a classical regression model can be used to construct the regression equation. The specific steps for applying cointegration theory are as follows:
The first step is the unit root test. Since only variables that are integrated of the same order may exhibit a cointegration relationship, a unit root test must be conducted on the variables prior to cointegration analysis to assess their stationarity and determine the lag order. The Augmented Dickey–Fuller (ADF) test is one of the most commonly used methods for unit root testing [59]. The ADF model is specified as follows:
Δ x t = a + b t + ( p 1 ) x t 1 + i = 1 k θ i Δ x t 1 + e t
In Equation (4), xt represents the time series to be tested, a is the constant term, t is the time trend, p is the lag order, and et denotes the random error term, with Δ representing the first difference of the variable. The null hypothesis H0 is defined as r = 0. If H0 is accepted, it indicates that the series xt contains a unit root, meaning it is non-stationary. Conversely, if H0 is rejected, it suggests that the series xt is stationary. If the series xt becomes stationary after d differencing operations, it is referred to as a d-th order integrated series, denoted as I(d).
To ensure the reliability of the panel unit root test results, this study applies both the Phillips–Perron (PP) and Levin–Lin–Chu (LLC) tests in addition to the Augmented Dickey–Fuller (ADF) test. The PP test employs a non-parametric approach to correct for heteroskedasticity and serial correlation in error terms, making it particularly suitable for datasets with unknown autocorrelation structures. The LLC test, on the other hand, assumes a common unit root process across cross-sectional units and exhibits higher statistical power for panels with relatively short time dimensions. Together, these tests complement the ADF method, helping mitigate the limitations of any single approach and enhancing the robustness of the empirical conclusions.
The next step is cointegration testing. The cointegration test determines whether a set of non-stationary variables exhibit a long-term equilibrium relationship. Among the widely used approaches, the Engle–Granger (E-G) method and the Johansen trace test are the most common. As the objective of this study is to investigate the presence of long-run equilibrium relationships between energy consumption and other explanatory variables rather than to identify the precise number of cointegrating vectors [60], the E-G method is preferred. Compared to the Johansen trace test, which may suffer from reduced power in small samples [61], the E-G method remains robust even with limited sample sizes.
The procedure of the E-G cointegration test involves two main steps. First, ordinary least squares (OLS) regression is employed to estimate the long-run relationship between the variables. Second, the stationarity of the regression residuals is tested using the Dickey–Fuller (DF) test. If the residuals are found to be stationary, it suggests the presence of a cointegrating relationship between the variables; otherwise, no such relationship exists.

4. Empirical Analysis

4.1. Summary Statistics

Table 2 presents the descriptive statistics of the variables for Western China from 2000 to 2022. The mean energy consumption is 8.870, with a standard deviation of 0.689, while the mean economic development level is 8.602, with a standard deviation of 1.164. These values indicate significant variability, reflecting the heterogeneity in regional energy demand and economic growth. Urbanization exhibits a mean value of −0.823 (standard deviation: 0.261), and industrial structure has a mean of 0.096 (standard deviation: 0.197), suggesting both commonalities and disparities in developmental trajectories across provinces.

4.2. Correlation Analysis

To ensure the quality and reliability of the dataset before conducting regression analysis, we performed a correlation analysis as a diagnostic step. The correlation matrix (Table 3) was constructed to examine the preliminary relationships among variables, assess theoretical consistency, and identify potential multicollinearity or anomalies. For example, energy consumption (ENY) shows a strong positive correlation with GDP (r = 0.900, p < 0.01), which is consistent with established economic theory and supports the validity of the dataset. Similarly, urbanization (URB) is positively correlated with ENY (r = 0.524, p < 0.01), reflecting the energy-intensive nature of urban development. Meanwhile, the correlation between GDP and URB (r = 0.582, p < 0.01) raises concerns of potential multicollinearity, which is further examined through variance inflation factor (VIF) tests in Section 4.5. Some weaker correlations, such as that between industrial structure (STR) and ENY (r = 0.111, p < 0.1), suggest that their influence may be indirect or masked by other variables, requiring regression analysis to further investigate their roles. Notably, the negative correlation between technological progress (RD) and STR (r = −0.160, p < 0.05) indicates RD’s role in promoting structural transformation. These findings confirm that the data generally align with theoretical expectations and provide a sound basis for regression modeling. It is important to emphasize that this correlation analysis is used solely for data validation and multicollinearity screening, not for drawing causal inferences, which are addressed in the regression sections that follow.

4.3. Stationarity Test

This study applies a logarithmic transformation to all variables in order to mitigate potential heteroscedasticity issues in the model’s regression analysis. Additionally, this transformation allows for a more intuitive understanding of the elasticity coefficients of energy consumption relative to the influencing factors. According to the principles of classical econometric regression estimation, the variables involved must satisfy the stationarity condition. However, in practice, when faced with non-stationary time series data, researchers typically apply detrending or differencing techniques to convert the series into stationary form.
It is important to note that in cases involving multiple non-stationary time series, a special phenomenon can occur: the linear combination of these non-stationary series may result in a stationary variable. This is an example of cointegration. The cointegration equation represents this stationary linear combination, revealing the existence of a long-term and stable equilibrium relationship between the variables. It is crucial to emphasize that the establishment of a cointegration relationship requires that the analyzed variables are non-stationary.
Therefore, prior to conducting cointegration tests, the first step is to perform unit root tests on the variables to verify their stationarity. If a variable is indeed non-stationary, it is suitable for cointegration analysis. On the other hand, if some or all variables are stationary, the premise for conducting cointegration analysis is not met, and such an analysis should not be undertaken. In this study, Eviews 13 is used to perform the Augmented Dickey–Fuller (ADF) unit root test on all variables, including the dependent variable. The test results are presented in Table 4.
From the results presented in Table 4, it can be observed that the ADF test statistics for the variables at their level values—ln ENY, ln POP, ln GDP, ln STR, ln URB, and ln RD—are all smaller than the critical values set for the test, and the corresponding p-values are all greater than 0.1. This indicates that the null hypothesis of the presence of a unit root cannot be rejected. Therefore, the original series for all variables are non-stationary. After applying first-order differencing, the first differences of the variables—Δln ENY, Δln POP, Δln GDP, Δln STR, Δln URB, and Δln RD—reject the null hypothesis of a unit root. Thus, the first-differenced series for these variables are stationary, confirming that the variables exhibit a first-order unit root, i.e., they are first-order integrated series, denoted as I(1). To further ensure the stationarity of the time series data, this study also employs the Phillips–Perron (PP) test and the Levin–Lin–Chu (LLC) test. As shown in Table 5, both tests confirm that the variables meet the necessary conditions for conducting a cointegration analysis.
The determination of an appropriate lag length plays a crucial role in ensuring the accuracy and reliability of cointegration tests. To enhance the robustness of the empirical results, this study follows standard econometric practices [62] and employs multiple lag selection criteria, including the Akaike Information Criterion (AIC), Schwarz Criterion (SC), Hannan–Quinn Criterion (HQ), and the Final Prediction Error (FPE).
We processed the panel data using EViews 13 and computed the corresponding values for each information criterion across various lag orders, as presented in Table 6. The results show that both AIC and FPE reach their minimum values at lag order 2 (AIC = 28.732; FPE = 3.008 × 10¹²), while SC and HQ suggest lag order 1 (SC = 29.403; HQ = 29.051). Given the discrepancy among these criteria, this study adopts the common econometric approach of prioritizing AIC and FPE in the context of limited sample sizes [63], as these two indicators generally provide better model fit and reduce the risk of excessive differencing, which could obscure long-run relationships among variables.
To strike a balance between model goodness-of-fit and parsimony [64], and in line with several panel cointegration studies [65], we ultimately select a lag length of 2. This choice not only ensures an adequate representation of the dynamic relationships in the model but also effectively controls for overfitting, thereby providing a solid and reliable foundation for the subsequent empirical analysis.

4.4. Cointegration Analysis

To ensure the validity of the subsequent regression analysis results, this study employs the Engle–Granger two-step method to test for cointegration relationships between the variables. First, OLS regression is performed on the variables using Eviews 13. Then, the residual series obtained from the regression are subjected to the ADF test. The results are presented in Table 7. At the 1% significance level, the absolute value of the ADF statistic for the residual series exceeds the corresponding critical value, indicating the presence of a long-term equilibrium relationship between the variables. Therefore, cointegration exists, and the study can proceed with the subsequent regression analysis.

4.5. Ridge Regression Analysis

Given the potential for multicollinearity among the variables, this study first employs ordinary least squares (OLS) regression using SPSS 20.0 to analyze the dependent variable lnENY and the independent variables lnENY, lnPOP, lnGDP, lnSTR, lnURB, and lnRD. The variance inflation factor (VIF) is then used to assess whether multicollinearity exists among variables. As shown in Table 8, the VIF values for lnPOP and lnGDP are greater than 10, while the VIF value for lnURB is close to 10, indicating the presence of multicollinearity among variables. Consequently, the unbiased estimates obtained through OLS may not provide reliable results. To address this issue, ridge regression is applied to re-estimate the model.
Ridge regression analysis is a biased estimation regression method specifically used for analyzing collinear data, offering greater tolerance to ill-conditioned data [66]. The ridge parameter k typically lies within the interval (0, 1), with smaller values of k leading to a reduced loss of original information. In practice, determining a reasonable value for k and selecting appropriate variables requires the use of ridge trace plots to observe changes in the shape of the curve. In this study, ridge regression is performed on the variables in model (3). The first regression analysis sets the ridge parameter k within the interval (0, 1), with a step size of 0.01. By examining the ridge trace plot, it is determined that the regression coefficients of the independent variables change significantly when k is in the range (0, 0.1), which helps to preliminarily establish the target range for k. The second regression is then conducted by adjusting k within the (0, 0.1) interval, with a step size of 0.002. The ridge trace plot indicates that when k increases from 0 to 0.05, the regression coefficients of the independent variables experience substantial changes. After k exceeds 0.05, the coefficients stabilize. Since the ridge parameter k should be as small as possible to ensure higher fitting accuracy, the final value of k is determined to be 0.05. The results of the ridge regression are shown in Table 9.
The results from ridge regression indicate that the ridge regression coefficients for all independent variables have passed the 1% significance level test, suggesting that ridge regression effectively addresses the multicollinearity issue. This demonstrates that the model is highly robust, with an excellent overall fit. Therefore, model (5) provides a strong explanation of the relationship between energy consumption in the western regions of China and its influencing factors, with the specific form as follows:
ln E N Y = 4.435 + 0.127 ln P O P + 0.448 ln G D P 0.521 ln S T R + 0.486 ln U R B 0.174 ln R D
Based on the ridge regression results, population size, GDP, industrial structure, urbanization, and technological progress exhibit significant correlations with energy consumption in Western China. Specifically, population size, GDP, and urbanization are positively associated with energy consumption, whereas industrial structure and technological progress demonstrate a negative correlation. These findings empirically validate the three hypotheses proposed earlier in this study.

4.6. Robustness Test

To ensure the reliability of the empirical results, this study conducted robustness checks from two dimensions: model selection and fixed effects control. The relevant results are presented in Table 10.
First, we compared the estimation results of the pooled ordinary least squares (POLS), fixed effects (FE), and random effects (RE) models. The Hausman test result (χ2 = 34.041, p = 0.000) supports the use of the fixed effects model. In the FE model, urbanization exhibits a significantly positive effect on energy consumption (coefficient = 0.904, p < 0.01), while industrial structure shows a significant negative relationship (coefficient = −0.343, p < 0.01). Economic development and population size also display significantly positive effects, all with strong statistical significance.
To further address potential endogeneity issues, both time-fixed effects and two-way fixed effects models were introduced. The results indicate that, under the two-way fixed effects specification, the directions of the impacts of urbanization and industrial structure remain consistent with the baseline model and are still statistically significant. Economic development also maintains a positive relationship (coefficient = 0.233, p < 0.05), while population size has a coefficient of 1.488 (p < 0.01). Notably, the variation in the coefficient for economic development between the FE model (0.732) and the two-way fixed effects model (0.233) may reflect the spatial and temporal heterogeneity in the relationship between economic growth and energy consumption, providing a meaningful direction for further investigation. Overall, the signs and significance levels of the core explanatory variables remain consistent with those in the benchmark model, indicating strong robustness of the findings.
Although the coefficient for technological progress becomes statistically insignificant in the two-way fixed effects model, its long-term negative influence is still supported by other model specifications—such as the FE model (−0.001) and the POLS model (−0.200, p < 0.01). This may be due to the two-way fixed effects model absorbing part of the explanatory power of certain variables by simultaneously controlling for unobservable region-specific and time-specific effects [67]. Additionally, the insignificance may stem from regional technology diffusion lags or the limitations of data frequency [68,69]. These issues suggest a promising avenue for future research but do not undermine the overall robustness of the model.
The comparative analysis of model specifications shows that the RE model yields estimation results for urbanization (0.952, p < 0.01) and industrial structure (−0.313, p < 0.01) that are highly consistent with those of the FE model. Furthermore, the significantly negative effect of technological progress in the POLS model (−0.200, p < 0.01) is partially confirmed in the FE model, where the coefficient decreases in magnitude but retains the same sign—supporting the robustness of the empirical conclusions. Moreover, the within-R2 of the FE model reaches 0.923, which is substantially higher than in other model specifications, further validating its suitability as the benchmark model.

5. Discussion

The empirical analysis conducted in this study has yielded several statistically significant findings.
First, urbanization exerts a positive influence on energy consumption in Western China. Specifically, a 1% increase in urbanization leads to a 0.486% rise in energy consumption. This is the strongest positive effect among all the explanatory variables, highlighting the substantial role of resource concentration and diffusion during urbanization in driving energy demand. This finding aligns with Dong and Wang [70], who suggested that due to relatively lagging urban development in Western China compared to the eastern and central regions, the sensitivity of energy consumption to urbanization is more pronounced. This is consistent with our results: by 2022, the urbanization rate in Western China had increased to 57.3%, with an average annual growth of 1.3 percentage points during the study period—0.3 percentage points higher than that of the eastern region. Such rapid urban development inevitably leads to an increase in energy consumption, at a relatively high intensity. In contrast, Tan et al. [71] found a negative relationship between urbanization and energy consumption in Western China. However, their study used time series data from 1980 to 2012—a period when urbanization progressed slowly in the region—explaining the differing outcomes.
Second, economic development also significantly increases energy consumption in Western China. Our findings indicate that a 1% increase in GDP results in a 0.448% increase in energy consumption, second only to the effect of urbanization. This result confirms the tight link between economic growth and energy demand. As a key economic indicator, GDP acts as a powerful driver of energy consumption. Similarly, Rahman and Sultana [72] found that real GDP per capita is a crucial long-term determinant of energy consumption, underscoring the influence of economic development on energy demand. In Western China, GDP rose from CNY 1.73 trillion in 2000 to CNY 25.62 trillion in 2022, with its share of national GDP increasing from 17.2% to 21.4%. This rapid growth has been underpinned by large-scale investments in transportation, energy, and communication infrastructure, which have significantly boosted energy demand. However, this finding contrasts with Li [73], who, based on panel data from 1996 to 2008, found that due to the prevalence of high-energy-consuming industries in the eastern region, energy consumption there exhibits stronger inertia and path dependence. In contrast, the western region has a relatively lighter industrial structure and less infrastructure investment, resulting in weaker consumption inertia. Although the findings differ, the underlying mechanisms are similar.
Third, population size also shows a positive correlation with energy consumption in Western China. A 1% increase in population leads to a 0.127% increase in energy consumption. Compared to other variables, the impact of population growth is relatively modest. This is consistent with Chang [74], who argued that although population growth inevitably increases energy and resource consumption, “the impact of population size on carbon emissions is not only determined by the size of the population, but also affected by other factors, such as the speed of regional economic development and residents’ consumption levels.” In Western China, the population density is lower than that of the eastern and central regions, and population outflows have exacerbated this uneven distribution [75]. Furthermore, Li and Yin [76] found that residents in Western China tend to be more conservative in their consumption habits, with relatively low demand for energy-intensive products, which limits the effect of population growth on energy consumption.
On the other hand, industrial structure plays a suppressive role in energy consumption. A 1% improvement in the industrial structure index (measured as the ratio of tertiary to secondary industry value added) leads to a 0.521% decrease in energy consumption. This inhibitory effect is even greater than the positive influence of urbanization, underscoring the critical role of industrial upgrading. As found by Tong and Guo [77], shifting from resource- and labor-intensive industries to knowledge-intensive and high-value-added sectors can significantly reduce coal consumption. In Western China, the industrial structure has been optimized from a value-added ratio of 21.44:38.97:39.59 (primary:secondary:tertiary) in 2000 to 11.42:39.93:48.66 in 2022. Furthermore, Zhang [78] reported that the elasticity coefficient of industrial structure is significantly negative across all regions in China, indicating that increasing the share of the tertiary sector suppresses energy consumption growth, with the effect being stronger in the eastern region than in the central and western regions.
Technological progress also has a significant negative impact on energy consumption in Western China. A 1% increase in technological advancement results in a 0.174% decrease in energy consumption. This reflects the crucial role of technological innovation in improving energy efficiency. R&D expenditure is typically seen as a comprehensive system that enhances technological capabilities through introduction, absorption, and diffusion—including in the energy sector [79]. Between 2000 and 2022, Western China’s R&D expenditure as a percentage of GDP rose from approximately 0.5% to around 2%. This improvement has greatly boosted technological capacity and energy efficiency, thereby reducing the growth in energy consumption. This conclusion is consistent with the findings of Chen [80] and Yan [81]. Moreover, technological progress has promoted industrial upgrading and structural adjustment, reducing the share of energy-intensive industries. Technology-driven structural transformation is thus key to improving energy efficiency.
Finally, our study shows that these factors interact with each other to shape the trajectory of energy consumption in Western China. Urbanization and economic development are the main drivers of increasing energy demand. Urbanization leads to infrastructure expansion, transportation development, and changes in lifestyle—all of which drive up energy usage. Economic growth, often reliant on industrial production and investment, is inherently linked to rising energy consumption. Although population growth has a statistically significant effect, its magnitude is relatively small, indicating that its impact is mediated by economic conditions, industrial structure, and consumption patterns. Notably, the inhibitory effect of industrial structure on energy consumption exceeds the stimulative effect of urbanization, suggesting that promoting industrial transformation is essential for managing energy demand. In recent years, the rising share of the tertiary sector in Western China has reduced dependence on energy-intensive manufacturing, effectively curbing energy consumption growth. Furthermore, technological progress enhances energy efficiency by driving energy-saving practices, facilitating renewable energy development, and improving production processes. In the short term, urbanization and economic growth will likely continue to elevate energy demand. However, in the long term, industrial upgrading and technological advancement are expected to exert a stronger mitigating effect, gradually slowing the growth of energy consumption.

6. Conclusions

Over the past two decades, energy consumption in Western China has undergone significant transformations. As a crucial energy and resource supply base for the country, this region has long relied on traditional energy sources such as coal and oil to support economic growth. However, under the impetus of the “dual carbon” targets and sustainable development policies, the regional energy consumption structure is undergoing a profound transition. This study employs ridge regression analysis to systematically investigate the impact of population size, economic development, industrial structure, urbanization, and technological progress on energy consumption. The key findings are summarized as follows:
  • Economic development and urbanization are the primary drivers of increasing energy consumption, with urbanization playing a more pronounced role. The regression coefficient of urbanization is 0.486, slightly exceeding the 0.448 coefficient of economic growth, indicating that the acceleration of urbanization has led to a substantial increase in energy consumption. Meanwhile, GDP growth remains heavily dependent on energy-intensive manufacturing and infrastructure investment, reinforcing the significant impact of economic expansion on energy consumption.
  • Industrial structure upgrading has emerged as the most crucial factor in reducing energy consumption in Western China, surpassing the positive effect of urbanization on energy demand. This suggests that the expansion of the tertiary sector, the upgrading of traditional manufacturing industries, and the rise in high-value-added industries have effectively contributed to a decline in energy consumption.
  • The influence of technological progress on energy consumption reduction is becoming increasingly evident, albeit weaker than that of industrial restructuring. This indicates that investment in new energy technologies in Western China remains insufficient, and the reliance on green technologies in the industrial transition has yet to achieve a systemic breakthrough.
  • The impact of population size on energy consumption is relatively minor but still noteworthy. The regression coefficient for population size is 0.127, significantly lower than that for urbanization and economic growth, suggesting that population growth exerts a weaker direct influence on energy consumption.
Based on these findings, we propose the following policy recommendations for Western China to promote sustainable energy consumption:
  • Optimize urban energy structures and enhance energy utilization efficiency. Integrating green and low-carbon concepts into the urbanization process is essential to improving urban energy systems. Efforts should focus on promoting smart transportation and green building initiatives in alignment with China’s “New-Type Urbanization” strategy. Given the geographic characteristics of Western China, pilot projects for zero-carbon community transformation should be prioritized in the Chengdu–Chongqing Twin City Economic Circle. Additionally, Guizhou Province can leverage its abundant hydropower resources to deploy distributed renewable energy systems within urban energy infrastructures, thereby enhancing the overall efficiency and sustainability of urban energy consumption.
  • Accelerate industrial restructuring and reduce the share of energy-intensive sectors. Guided by favorable national policies, Western China should promote the transition of energy-intensive industries toward high-end service sectors (e.g., big data, cultural tourism) and clean manufacturing. Local governments are encouraged to design differentiated industrial policies and establish dedicated funds to support industrial upgrading. Furthermore, by capitalizing on local resource endowments—such as solar energy in Qinghai and wind energy in Inner Mongolia—regions can foster circular economy development and reduce dependence on high-emission sectors.
  • Strengthen technological innovation and promote renewable energy adoption. Governments in Western China should intensify investments in research and development of renewable energy technologies, including wind and solar power, to increase the share of renewables in the regional energy consumption mix. At the same time, accelerating the deployment of smart grids can enhance the efficiency of energy management. To maximize innovation spillovers, it is crucial to establish effective linkages with technology hubs in Eastern China (e.g., Beijing–Tianjin–Hebei, Yangtze River Delta), thereby contributing to national targets regarding the proportion of non-fossil energy in total consumption.
  • Establish regional energy cooperation mechanisms to promote resource sharing and complementarity. Western China should actively leverage national strategies such as the “Belt and Road Initiative”, the “Chengdu–Chongqing Twin City Economic Circle”, and the “New Development Pattern of Western China in the New Era” to establish robust regional energy cooperation mechanisms. For example, pilot programs can be launched in the Shaanxi–Gansu–Ningxia region for joint development of wind and solar resources and cross-border electricity transmission in collaboration with Central Asian countries, paving the way for the creation of a transnational clean energy corridor. Additionally, efforts should be made to foster low-carbon cooperation among urban agglomerations such as Chengdu–Chongqing, Central Yunnan, and the Guanzhong Plain. This includes building integrated electricity dispatch platforms and regional energy trading markets to optimize the allocation of energy resources across regions.
This study has several limitations. Firstly, due to data availability constraints, the research does not break down the specific composition of energy consumption (such as the share of coal, electricity, natural gas, etc.). Future studies could further analyze consumption patterns of different energy types and their influencing factors. Secondly, although the short-term significance of lnRD is insufficient, its theoretical mechanisms and policy implications still warrant further exploration. Future research could extend the observation period, optimize variable measurements, and incorporate industry–region interaction analysis to better clarify the complex relationship between technological progress and energy consumption. Lastly, the ridge regression method used in this study primarily focuses on long-term effects. Future research could integrate dynamic panel models and spatial econometric analysis to examine the spatial spillover effects of energy consumption between regions in more depth.

Author Contributions

Y.Z., C.F. and X.L. contributed equally to this work and should be considered as co-first authors. Conceptualization, C.F. and Y.Z.; methodology, C.F. and Y.Z.; software, X.L. and Y.Z.; validation, X.L. and C.F.; formal analysis, X.L. and Y.Z.; investigation, X.L. and Y.Z.; resources, Y.Z. and C.F.; data curation, C.F. and Y.Z.; writing—original draft preparation, X.L. and Y.Z.; writing—review and editing, X.L. and C.F.; visualization, X.L. and Y.Z.; supervision, X.W. and T.Z.; project administration, X.W. and T.Z. All authors have read and agreed to the published version of the manuscript.

Funding

This work is supported by the Special Project for Studying and Interpreting the Spirit of the Third Plenary Session of the 20th CPC Central Committee, Party School of the CPC Guizhou Provincial Committee, under Grant No. [2024SWDXXJKYZX08].

Data Availability Statement

The data supporting this study’s findings are available on request from the corresponding author, upon reasonable request.

Acknowledgments

The authors are grateful to the editor and the anonymous reviewers of this paper.

Conflicts of Interest

The authors declare no conflict of interest.

References

  1. Wang, G.F.; Liu, H.; Wang, D.D.; Pang, Y.H.; Wu, L.X. High-quality Energy Development and Energy Security under the New Situation for China. Bull. Chin. Acad. Sci. 2023, 38, 23–37. [Google Scholar]
  2. Mi, Z.; Zheng, J.; Meng, J.; Shan, Y.; Zheng, H.; Ou, J.; Guan, D.; Wei, Y. China’s energy consumption in the new normal. Earth’s Future 2018, 6, 1007–1016. [Google Scholar] [CrossRef]
  3. Li, L.B.; Chen, J.L. Research on the Spatiotemporal Differences and Influencing Factors of Regional Economic Development in China. Urban Probl. 2024, 6, 4–14. [Google Scholar]
  4. Zhang, F.; Sarker, M.N.I.; Lv, Y. Coupling coordination of the regional economy, tourism industry, and the ecological environment: Evidence from western China. Sustain 2022, 14, 1654. [Google Scholar] [CrossRef]
  5. Bai, Y.X.; Chen, X. 25 Years of Western Development: Review, Characteristics, Changes, and New Patterns. J. Humanit. 2024, 11, 58–71. [Google Scholar]
  6. Ma, Q.Q.; Chen, S.Y. Economic Convergence and Environmental Imbalance: A Study Based on the Western Development Strategy. J. World Econ. 2023, 46, 108–133. [Google Scholar]
  7. Bilgen, S. Structure and environmental impact of global energy consumption. Renew. Sustain. Energy Rev. 2014, 38, 890–902. [Google Scholar] [CrossRef]
  8. York, R. Demographic trends and energy consumption in European Union Nations, 1960–2025. Soc. Sci. Res. 2007, 36, 855–872. [Google Scholar] [CrossRef]
  9. Ahmed, K.; Bhattacharya, M.; Qazi, A.Q.; Long, W. Globalisation and energy consumption in China: Impact of economic, social and political globalisation. Renew. Sustain. Energy Rev. 2016, 64, 734–749. [Google Scholar]
  10. Wang, Y.Z.; Yu, R.; Li, J.H. Spatiotemporal Differences in Factors Influencing Energy Consumption in the Beijing-Tianjin-Hebei Region. Stat. Decis. 2022, 38, 76–80. [Google Scholar]
  11. Wang, X.T.; Jiao, W.X.; Chen, X.P.; Zhang, Z.L. Characteristics and Influencing Factors of Energy Consumption in Henan Province. Areal Res. Dev. 2016, 35, 144–149. [Google Scholar]
  12. Zhang, M.; Song, Y.; Li, P.; Li, H. Study on affecting factors of residential energy consumption in urban and rural Jiangsu. Renew. Sustain. Energy Rev. 2016, 53, 330–337. [Google Scholar] [CrossRef]
  13. Sheng, P.; He, Y.; Guo, X. The impact of urbanization on energy consumption and efficiency. Energy Environ. 2017, 28, 673–686. [Google Scholar] [CrossRef]
  14. Guo, K.; Wang, L.Q.; Tong, W.M.; Yang, Z.H.; Gao, D.J. Empirical Analysis of the Relationship Between Energy Consumption and Economic Growth in Hebei Province—From the Perspective of Beijing-Tianjin-Hebei Coordinated Development. Resour. Dev. Mark. 2015, 31, 1063–1068. [Google Scholar]
  15. Jacobsen, H.K. Energy Demand, Structural Change and Trade: A Decomposition Analysis of the Danish Manufacturing Industry. Econ. Syst. Res. 2000, 12, 319–344. [Google Scholar] [CrossRef]
  16. Khazzoom, J.D. An econometric model of the regulated emissions for fuel-efficient new vehicles. J. Environ. Econ. Manag. 1995, 28, 190–204. [Google Scholar] [CrossRef]
  17. Kurniawan, R.; Managi, S. Coal Consumption, Urbanization, and Trade Openness Linkage in Indonesia. Energy Policy 2018, 121, 576–583. [Google Scholar] [CrossRef]
  18. Liao, H.; Fan, Y.; Wei, Y.M. What induced China’s energy intensity to fluctuate: 1997–2006? Energy Policy 2007, 35, 4640–4649. [Google Scholar] [CrossRef]
  19. Ma, C.; Stern, D.I. China’s changing energy intensity trend: A decomposition analysis. Energy Econ. 2008, 30, 1037–1053. [Google Scholar] [CrossRef]
  20. Nie, R.; Zhang, T.; Wang, D. Scenario Analysis of Energy Consumption and Carbon Emissions in Jiangsu Province Based on the IPAT Model. J. Nat. Resour. 2010, 9, 1557–1564. [Google Scholar]
  21. Liu, Y.; Zhou, Y.; Wu, W. Assessing the impact of population, income and technology on energy consumption and industrial pollutant emissions in China. Appl. Energy 2015, 155, 904–917. [Google Scholar] [CrossRef]
  22. Chi, Q.S. Analysis of China’s Oil Consumption Growth Trend—Forecasting and Analysis Based on ARIMA Model. Resour. Sci. 2007, 5, 69–73. [Google Scholar]
  23. Mirzaei, M.; Bekri, M. Energy consumption and CO2 emissions in Iran, 2025. Environ. Res. 2017, 154, 345–351. [Google Scholar] [CrossRef]
  24. Wang, R.; Jiang, Z. Energy consumption in China’s rural areas: A study based on the village energy survey. J. Clean. Prod. 2017, 143, 452–461. [Google Scholar] [CrossRef]
  25. Jorgenson, A.K.; Clark, B. Assessing the temporal stability of the population/environment relationship in comparative perspective: A cross-national panel study of carbon dioxide emissions, 1960–2005. Popul. Environ. 2010, 32, 27–41. [Google Scholar] [CrossRef]
  26. Mishalani, R.G.; Goel, P.K.; Westra, A.M.; Landgraf, A.J. Modeling the relationships among urban passenger travel carbon dioxide emissions, transportation demand and supply, population density, and proxy policy variables. Transp. Res. Part D Transp. Environ. 2014, 33, 146–154. [Google Scholar] [CrossRef]
  27. Liu, M.Z.; Liu, X.X. Research on Influencing Factors of Urban Residential Energy Consumption in China Based on STIRPAT Model. Resour. Environ. Yangtze Basin 2017, 8, 1111–1122. [Google Scholar]
  28. Yang, J. Research on the Relationship Between Energy Consumption, Economic Growth and Carbon Emissions Based on Econometric Models. Master’s Thesis, Northwest Normal University, Lanzhou, China, 2013. [Google Scholar]
  29. Kraft, J.; Kraft, A. On the Relationship between Energy and GNP. J. Energy Dev. 1978, 3, 401–403. [Google Scholar]
  30. Zhao, L.X.; Wei, W.X. Research on Energy and Economic Growth Models. Forecast 1998, 17, 32–49. [Google Scholar]
  31. Ma, L.; Ye, Q.Q. Empirical Research on the Relationship Between Energy Consumption and Economic Growth—A Case Study of Shaanxi Province. Econ. Geogr. 2016, 36, 130–135. [Google Scholar]
  32. Chen, J.H.; Zeng, Q.H. Decoupling Effect Analysis of Carbon Emissions, Energy Consumption and Economic Development in Sichuan Province. Environ. Sci. Technol. 2024, 47, 198–209. [Google Scholar]
  33. Asif, M.; Li, J.-Q.; Zia, M.A.; Hashim, M.; Bhatti, U.A.; Bhatti, M.A.; Hasnain, A. Environmental sustainability in BRICS economies: The nexus of technology innovation, economic growth, financial development, and renewable energy consumption. Sustainability 2024, 16, 6934. [Google Scholar] [CrossRef]
  34. Meadows, D.; Randers, J.; Meadows, D. The Limits to Growth. Econ. Aff. 1992, 12, 35–45. [Google Scholar]
  35. Narayanan, K.; Sahu, S.K. Energy Consumption Response to Climate Change: Policy Options for India. IIM Kozhikode Soc. Manag. Rev. 2014, 3, 123–133. [Google Scholar] [CrossRef]
  36. Zhang, L.; Huang, Y.X. Analysis of Energy-Saving Potential in China’s Industrial Structure. China Soft Sci. 2008, 5, 27–34. [Google Scholar]
  37. Lv, J.; Wu, J. Factors Influencing Energy Consumption and Carbon Emissions in Eastern China. Stat. Consult. 2023, 4, 2–5. [Google Scholar]
  38. Wang, Q.; Yin, X.B. Research on the Impact of Technological Innovation and Industrial Structure Upgrading on Energy Consumption—A Case Study of the Yangtze River Delta. Ind. Technol. Econ. 2022, 41, 107–112. [Google Scholar]
  39. Hong, Y.B.; Zhu, B.W. Dynamic Analysis of the Relationship Between Industrial Structure and Energy Consumption in Yunnan Driven by New Quality Productivity—An Empirical Study Based on VAR Model. Inq. Econ. Issues 2024, 6, 124–135. [Google Scholar]
  40. Schnaiberg, A. The Environment: From Surplus to Scarcity; Oxford University Press: New York, NY, USA, 1980. [Google Scholar]
  41. Jones, D.W. How urbanization affects energy-use in developing countries. Energy Policy 1991, 19, 621–630. [Google Scholar] [CrossRef]
  42. Dhakal, S. Urban energy use and carbon emissions from cities in China and policy implications. Energy Policy 2009, 37, 4208–4219. [Google Scholar] [CrossRef]
  43. Xiao, H.W. Research on the Impact of New Urbanization Development on Energy Consumption—Empirical Test and Effect Decomposition Based on Spatial Econometric Model. Contemp. Econ. Manag. 2014, 36, 12–18. [Google Scholar]
  44. Song, X.R.; Chen, S.J. Threshold Effect of Urbanization on Energy Consumption in Western China. J. Qinghai Norm. Univ. (Soc. Sci.) 2021, 43, 56–63. [Google Scholar]
  45. Popp, D.C. The effect of new technology on energy consumption. Resour. Energy Econ. 2001, 23, 215–239. [Google Scholar] [CrossRef]
  46. Liu, F.C.; Liu, Y.Y. Rebound Effect of China’s Energy Consumption Based on Technological Progress—Empirical Test Using Provincial Panel Data. Resour. Sci. 2008, 30, 1300–1306. [Google Scholar]
  47. Chen, Y.; Sun, H.; Liu, Y.Y.; Huang, T. Analysis of Carbon Emissions from Energy Consumption and Its Influencing Factors in Western China. Resour. Ind. 2013, 15, 63–68. [Google Scholar]
  48. Feng, F.; Ye, A.Z. Does the Rebound Effect Exacerbate the Rise in China’s Total Energy Consumption? J. Quant. Tech. Econ. 2015, 8, 104–119. [Google Scholar]
  49. Zhou, J.G.; Zhang, J.G.; Yan, J.Y.; Du, Q.J. Is Technological Progress a Panacea for Energy-Environmental Constraints? Observations on Jevons Paradox. J. Hebei GEO Univ. 2017, 40, 31–43. [Google Scholar]
  50. Fang, D.B.; Shi, S.S.; Yang, J.P. Research on Energy Demand Prediction and Early Warning in China under the New Normal. Resour. Dev. Mark. 2017, 33, 8–13. [Google Scholar]
  51. Wang, F.; Li, J.X.; Chen, J.G.; Liu, J.; Wu, C.X. Population Density, Energy Consumption and Green Economic Development—Empirical Analysis Based on Provincial Panel Data. J. Arid Land Resour. Environ. 2017, 31, 6–12. [Google Scholar]
  52. Guo, Y.H.; Xie, D.Y. Econometric Analysis of Industrial Structure, Economic Growth and Energy Consumption. Stat. Decis. 2013, 16, 102–105. [Google Scholar]
  53. Shi, H.J. Research on the Impact of Urbanization on Residential Energy Consumption in Fujian Province. Ecol. Econ. 2018, 34, 55–60. [Google Scholar]
  54. Xiao, D.; Wei, W.W. Nonlinear Effects of Economic Growth, Urbanization and Technological Progress on Energy Consumption. Econ. Surv. 2015, 32, 126–131. [Google Scholar]
  55. York, R.; Rosa, E.A.; Dietz, T. STIRPAT, IPAT and Impact: Analytic Tools for Unpacking the Driving Forces of Environmental Impacts. Ecol. Econ. 2003, 46, 351–365. [Google Scholar] [CrossRef]
  56. Dietz, T.; Rosa, E.A. Effects of population and affluence on CO2 emissions. Proc. Natl. Acad. Sci. USA 1997, 94, 175–179. [Google Scholar] [CrossRef]
  57. MA, W. Cointegration Theory and Applications; Nankai University Press: Tianjin, China, 2004. [Google Scholar]
  58. Luo, Z.F.; Zhang, R.X.; Liang, B.W.; He, S.; Zhang, J. Research on the Relationship Between Urban Infrastructure and Urban Spatial Growth Based on Cointegration Analysis—A Case Study of Lanzhou City. J. Arid Land Resour. Environ. 2015, 29, 55–60. [Google Scholar]
  59. Said, S.; Dickey, D. Testing for unit roots in autoregressive-moving average models of unknown order. Biometrika 1984, 71, 599–607. [Google Scholar] [CrossRef]
  60. Hu, Y.; Lin, J.H.; Wang, M.X.; Deng, Y. EG Two-Step Method for Panel Data. Syst. Eng. Theory Pract. 2013, 33, 3112–3119. [Google Scholar]
  61. Zhang, X.; Cheng, X.; Yuan, J.; Gao, X. Total-factor energy efficiency in developing countries. Energy Policy 2011, 39, 644–650. [Google Scholar] [CrossRef]
  62. Lütkepohl, H. New Introduction to Multiple Time Series Analysis; Springer: Berlin, Germany, 2005. [Google Scholar]
  63. Morales, M. Lag order selection for long-run variance estimation in econometrics. Econ. Rev. 2024, 43, 774–795. [Google Scholar] [CrossRef]
  64. Brooks, C. Introductory Econometrics for Finance, 4th ed.; Cambridge University Press: Cambridge, UK, 2019. [Google Scholar]
  65. Alkunain, B.; Elzaki, R.M.; Al-Mahish, M. Impact of the total expenditure shocks on food security: VAR model. Agric. Resour. Econ. Int. Sci. E-J. 2024, 10, 290–315. [Google Scholar] [CrossRef]
  66. Xiao, P. Empirical Research on the Relationship Between Energy Consumption, Industrial Structure and Economic Growth. Master’s Thesis, Hunan University, Changsha, China, 2012. [Google Scholar]
  67. Bell, A.; Jones, K. Explaining Fixed Effects: Random Effects Modeling of Time-Series Cross-Sectional and Panel Data. Polit. Sci. Res. Methods 2015, 3, 133–153. [Google Scholar] [CrossRef]
  68. Bai, J.; Li, K. Theory and Methods of Panel Data Models with Interactive Effects. Ann. Stat. 2014, 42, 142–170. [Google Scholar] [CrossRef]
  69. Fernández-Val, I.; Weidner, M. Individual and Time Effects in Nonlinear Panel Models with Large N, T. J. Econom. 2016, 192, 291–312. [Google Scholar] [CrossRef]
  70. Dong, C.S.; Wang, J. Research on Influencing Factors of Energy Consumption in China—Panel Data Analysis Based on Eastern, Central and Western Regions. J. Xi’an Shiyou Univ. (Soc. Sci.) 2020, 29, 6–20+36. [Google Scholar]
  71. Tan, J.T.; Zhang, P.Y.; Li, J.; Liu, S.W. Research on the Impact of Urbanization on Energy Consumption in China Based on Cointegration Theory and STIRPAT Model. J. Arid Land Resour. Environ. 2016, 30, 1–6. [Google Scholar]
  72. Rahman, M.M.; Sultana, N. Impact of institutional quality, economic growth and exports on renewable energy: Emerging country perspective. Renew. Energy 2022, 189, 938–951. [Google Scholar] [CrossRef]
  73. Li, G.Z. Differences in Energy Consumption and Its Relationship with Economic Development Level—Dynamic Panel Data Analysis Based on Eastern, Central and Western Regions. Lingnan J. 2012, 1, 64–69. [Google Scholar]
  74. Chang, K.L.; Du, Z.F.; Chen, G.J.; Zhang, Y.X.; Sui, L.L. Panel estimation for the impact factors on carbon dioxide emissions: A new regional classification perspective in China. J. Clean. Prod. 2021, 279, 12367. [Google Scholar] [CrossRef]
  75. Liu, T. Research on the Impact of Population Density and Industrial Agglomeration on Carbon Emissions. Master’s Thesis, Lanzhou University of Finance and Economics, Lanzhou, China, 2022. [Google Scholar]
  76. Li, A.; Yin, X.Z. Analysis of Influencing Factors of Carbon Emissions from Rural Residential Energy Consumption in China. Shandong Soc. Sci. 2024, 2, 169–176. [Google Scholar]
  77. Lu, J.; Guo, M.X. Energy Consumption, Industrial Structure and Differences in China’s Carbon Emission Patterns. J. Chongqing Univ. Technol. (Soc. Sci.) 2023, 37, 29–39. [Google Scholar]
  78. Zhang, H.M. Research on Regional Energy Consumption Differences and Influencing Factors. Master’s Thesis, Chongqing University, Chongqing, China, 2017. [Google Scholar]
  79. Wang, F.Z. Research on China’s Energy Intensity from the Perspective of Technological Progress. J. Tech. Econ. Manag. 2023, 11, 18–22. [Google Scholar]
  80. Chen, X.Y. Analysis of Influencing Factors and Spatiotemporal Heterogeneity of Carbon Emissions from Energy Consumption in China. Master’s Thesis, Jiangxi University of Finance and Economics, Nanchang, China, 2024. [Google Scholar]
  81. Jin, Y.Q.; Lu, X.Y. FDI, R&D Investment and Energy Consumption—Empirical Analysis Based on Provincial Panel Data. Sci. Manag. Res. 2013, 31, 113–116. [Google Scholar]
Figure 1. Map of the study area.
Energies 18 02379 g001
Table 1. Description of Variables.
VariableSymbolMeaningUnit
Energy ConsumptionENYFinal energy consumption10,000 tons of standard coal
Total PopulationPOPTotal population at year-end10,000 people
Economic DevelopmentGDPGross Domestic Product10,000 yuan
Industrial StructureSTRRatio of tertiary industry value added to secondary industry value%
UrbanizationURBProportion of Urban Resident Population to Total Resident Population%
Technological ProgressRDProportion of R&D Expenditure to GDP%
Table 2. Descriptive statistics.
VariableObservationsMeanStd. Dev.MaxMin
ln ENY2538.8700.6896.79910.228
ln POP2537.8650.7796.2489.033
ln GDP2538.6021.1645.57510.944
ln STR2530.0960.197−0.3780.568
ln URB253−0.8230.261−1.381−0.343
ln RD253−0.1800.589−1.6051.009
Table 3. Pairwise correlations.
ENYPOPGDPSTRURBRD
ENY1
POP0.466369 ***1
GDP0.899513 ***0.594187 ***1
STR0.110506 *−0.0191430.199313 ***1
URB0.524033 ***−0.184402 ***0.581954 ***0.310163 ***1
RD0.303889 ***0.280176 ***0.445085 ***−0.160206 **0.370214 ***1
Note: ***, **, and * indicate statistical significance at the 1%, 5%, and 10% levels, respectively.
Table 4. ADF unit root test results for the variables.
ObsCheck TypeADFp-ValueResult
(c, t, q)
ln ENY(c, 0, 0)0.0396830.697324Non-stationary
Δln ENY(c, 0, 1)−15.7733640.000000stationary
ln POP(c, 0, 0)−1.9883870.607745Non-stationary
Δln POP(c, 0, 0)−9.4235570.000000stationary
ln GDP(c, 1, 0)−0.2624260.590474Non-stationary
Δln GDP(c, 0, 0)−4.0663010.001100stationary
ln STR(c, 1, 0)−1.2642270.7124Non-stationary
Δln STR(c, 0, 1)−5.2266950.000008stationary
ln URB(c, 1, 0)−1.4505310.137264Non-stationary
Δln URB(c, 0, 1)−4.6789930.000758stationary
ln RD(c, 1, 0)−1.7345230.675332Non-stationary
Δln RD(c, 0, 1)−3.7048830.022038stationary
Note: “Δ” indicates the first-order difference series; (c, t, q) refers to the test type: c (intercept), t (trend), q (lag order, zero indicates no lag).
Table 5. Results of the PP and LLC unit root tests.
ObsCheck TypePPResultLLCResult
(c, t, q)
ln ENY(c, 0, 0)0.8502Non-stationary0.7401Non-stationary
Δln ENY(c, 0, 1)−16.2245 ***stationary0.0765 ***stationary
ln POP(c, 0, 0)−2.1054Non-stationary0.8588Non-stationary
Δln POP(c, 0, 0)−9.8761 ***stationary0.4225 ***stationary
ln GDP(c, 1, 0)−0.3187Non-stationary0.7987Non-stationary
Δln GDP(c, 0, 0)−4.5327 ***stationary0.3858 ***stationary
ln STR(c, 1, 0)−1.4098Non-stationary0.7827Non-stationary
Δln STR(c, 0, 1)−5.7012 ***stationary0.1629 ***stationary
ln URB(c, 1, 0)−1.6039Non-stationary0.7331Non-stationary
Δln URB(c, 0, 1)−5.1438 ***stationary0.3003 ***stationary
ln RD(c, 1, 0)−1.8926Non-stationary0.4430 ***stationary
Δln RD(c, 0, 1)−4.1594 **stationary0.0284 ***stationary
Note: ** p < 0.01, *** p < 0.001; “Δ” indicates the first-order difference series; (c, t, q) refers to the test type: c (intercept), t (trend), and q (lag order, zero indicates no lag).
Table 6. Comparison of different lag orders.
Lag OrderslogLAICSCHQFPE
0−7114.28439.2639.34339.293112,257,420,210,939.550
1−5734.06928.81529.403 *29.051 *3,266,177,910,649.808
2−5664.76528.732 *29.82729.1733,008,242,402,737.163 *
3−5607.89428.74830.35429.3943,060,657,120,625.783
4−5565.78228.88331.00229.7363,510,240,758,448.066
5−5533.29129.09631.73130.1574,361,960,061,108.039
6−5495.46229.26832.42230.5385,210,022,224,023.852
7−5468.57929.5333.20731.0116,827,985,145,040.805
8−5438.51729.76933.9731.4618,763,224,857,814.164
9−5402.63829.96234.69131.86610,781,285,735,184.105
10−5368.58330.17135.43232.2913,540,887,181,902.49
11−5318.49330.2536.04532.58414,992,241,787,782.727
Note: * indicates the best value for each corresponding criterion.
Table 7. ADF test results for residual series.
ADFpIs Cointegration Present
−3.187470.0007Yes
Table 8. Ordinary least squares (OLS) regression results.
CoefficientStd. ErrortpVIF
Constant4.0074430.19674420.3688180.000000 ***-
ln POP−0.1397950.071735−1.9487650.052456 *11.387960
ln GDP0.6783350.05557212.2063650.000000 ***15.234911
ln STR−0.5955320.091398−6.5158340.000000 ***1.179929
ln URB−0.1798450.192521−0.9341570.3511359.194917
ln RD−0.2004550.033205−6.0368170.000000 ***1.392801
Note: * p < 0.1, *** p < 0.001; R2 = 0.857359, Adj.R2 = 0.854472, F(5,247) = 296.924405, p = 0.000000, D-W = 0.223329.
Table 9. Ridge regression estimation results (ridge parameter k = 0.05).
CoefficientStd. ErrortpVIF
Constant4.4348710.18490323.9848960.000000 ***-
ln POP0.1269570.0307834.1242220.000051 ***1.952799
ln GDP0.4481870.02292819.5475990.000000 ***2.414928
ln STR−0.5214120.088542−5.8888470.000000 ***1.031182
ln URB0.4860870.0883755.5002970.000000 ***1.804251
ln RD−0.1737730.031654−5.4898300.000000 ***1.178598
Note: *** p < 0.001; R2 = 0.846822, Adj.R2 = 0.843722, F(5,247) = 273.101252, p = 0.000000.
Table 10. Robustness test results.
ModelPooled OLSFixed Effects (FE)Random Effects (RE)Time Fixed EffectsTwo-Way Fixed Effects
Intercept4.007443 ***
(20.368818)
−7.599795 ***
(−4.192236)
1.935007 **
(2.316865)
4.321500 ***
(14.347258)
−1.226211
(−0.712617)
ln POP−0.139795 *
(−1.948765)
1.203258 ***
(4.707426)
−0.066004
(−0.480929)
0.099231
(0.536163)
1.487685 ***
(6.613991)
ln GDP0.678335 ***
(12.206365)
0.731802 ***
(11.054130)
0.779636 ***
(11.610193)
0.453983 ***
(2.681547)
0.233417 **
(1.078130)
ln STR−0.595532 ***
(−6.515834)
−0.343041 ***
(−4.389700)
−0.312634 ***
(−3.871091)
−0.697527 ***
(−5.172345)
−0.292832 ***
(−3.946640)
ln URB−0.179845
(−0.934157)
0.904419 ***
(3.484332)
0.952106 ***
(3.589194)
0.133550
(0.445220)
0.522493 **
(2.162686)
ln RD−0.200455 ***
(−6.036817)
−0.001101
(−0.030317)
−0.032516
(−0.876827)
−0.220555 ***
(−5.847207)
−0.011319
(−0.305284)
R20.857359−1.9691870.7323210.819959−1.325717
R2 (within)0.8854600.9233680.9143370.811771−1.396580
Sample Size253253253253253
Statistical TestsF(5,247) = 296.924405,
p = 0.000000
F(5,237) = 571.143535,
p = 0.000000
χ2(5) = 2509.756813,
p = 0.000000
F(5,225) = 129.859120,
p = 0.000000
F(5,215) = 26.308860,
p = 0.000000
Note: * p < 0.1, ** p < 0.05, *** p < 0.01. T-values are reported in parentheses.
Disclaimer/Publisher’s Note: The statements, opinions and data contained in all publications are solely those of the individual author(s) and contributor(s) and not of MDPI and/or the editor(s). MDPI and/or the editor(s) disclaim responsibility for any injury to people or property resulting from any ideas, methods, instructions or products referred to in the content.

