A Systematic Review of Sensitivity Analysis in Building Energy Modeling: Key Factors Influencing Building Thermal Energy Performance


Abstract
1. Introduction
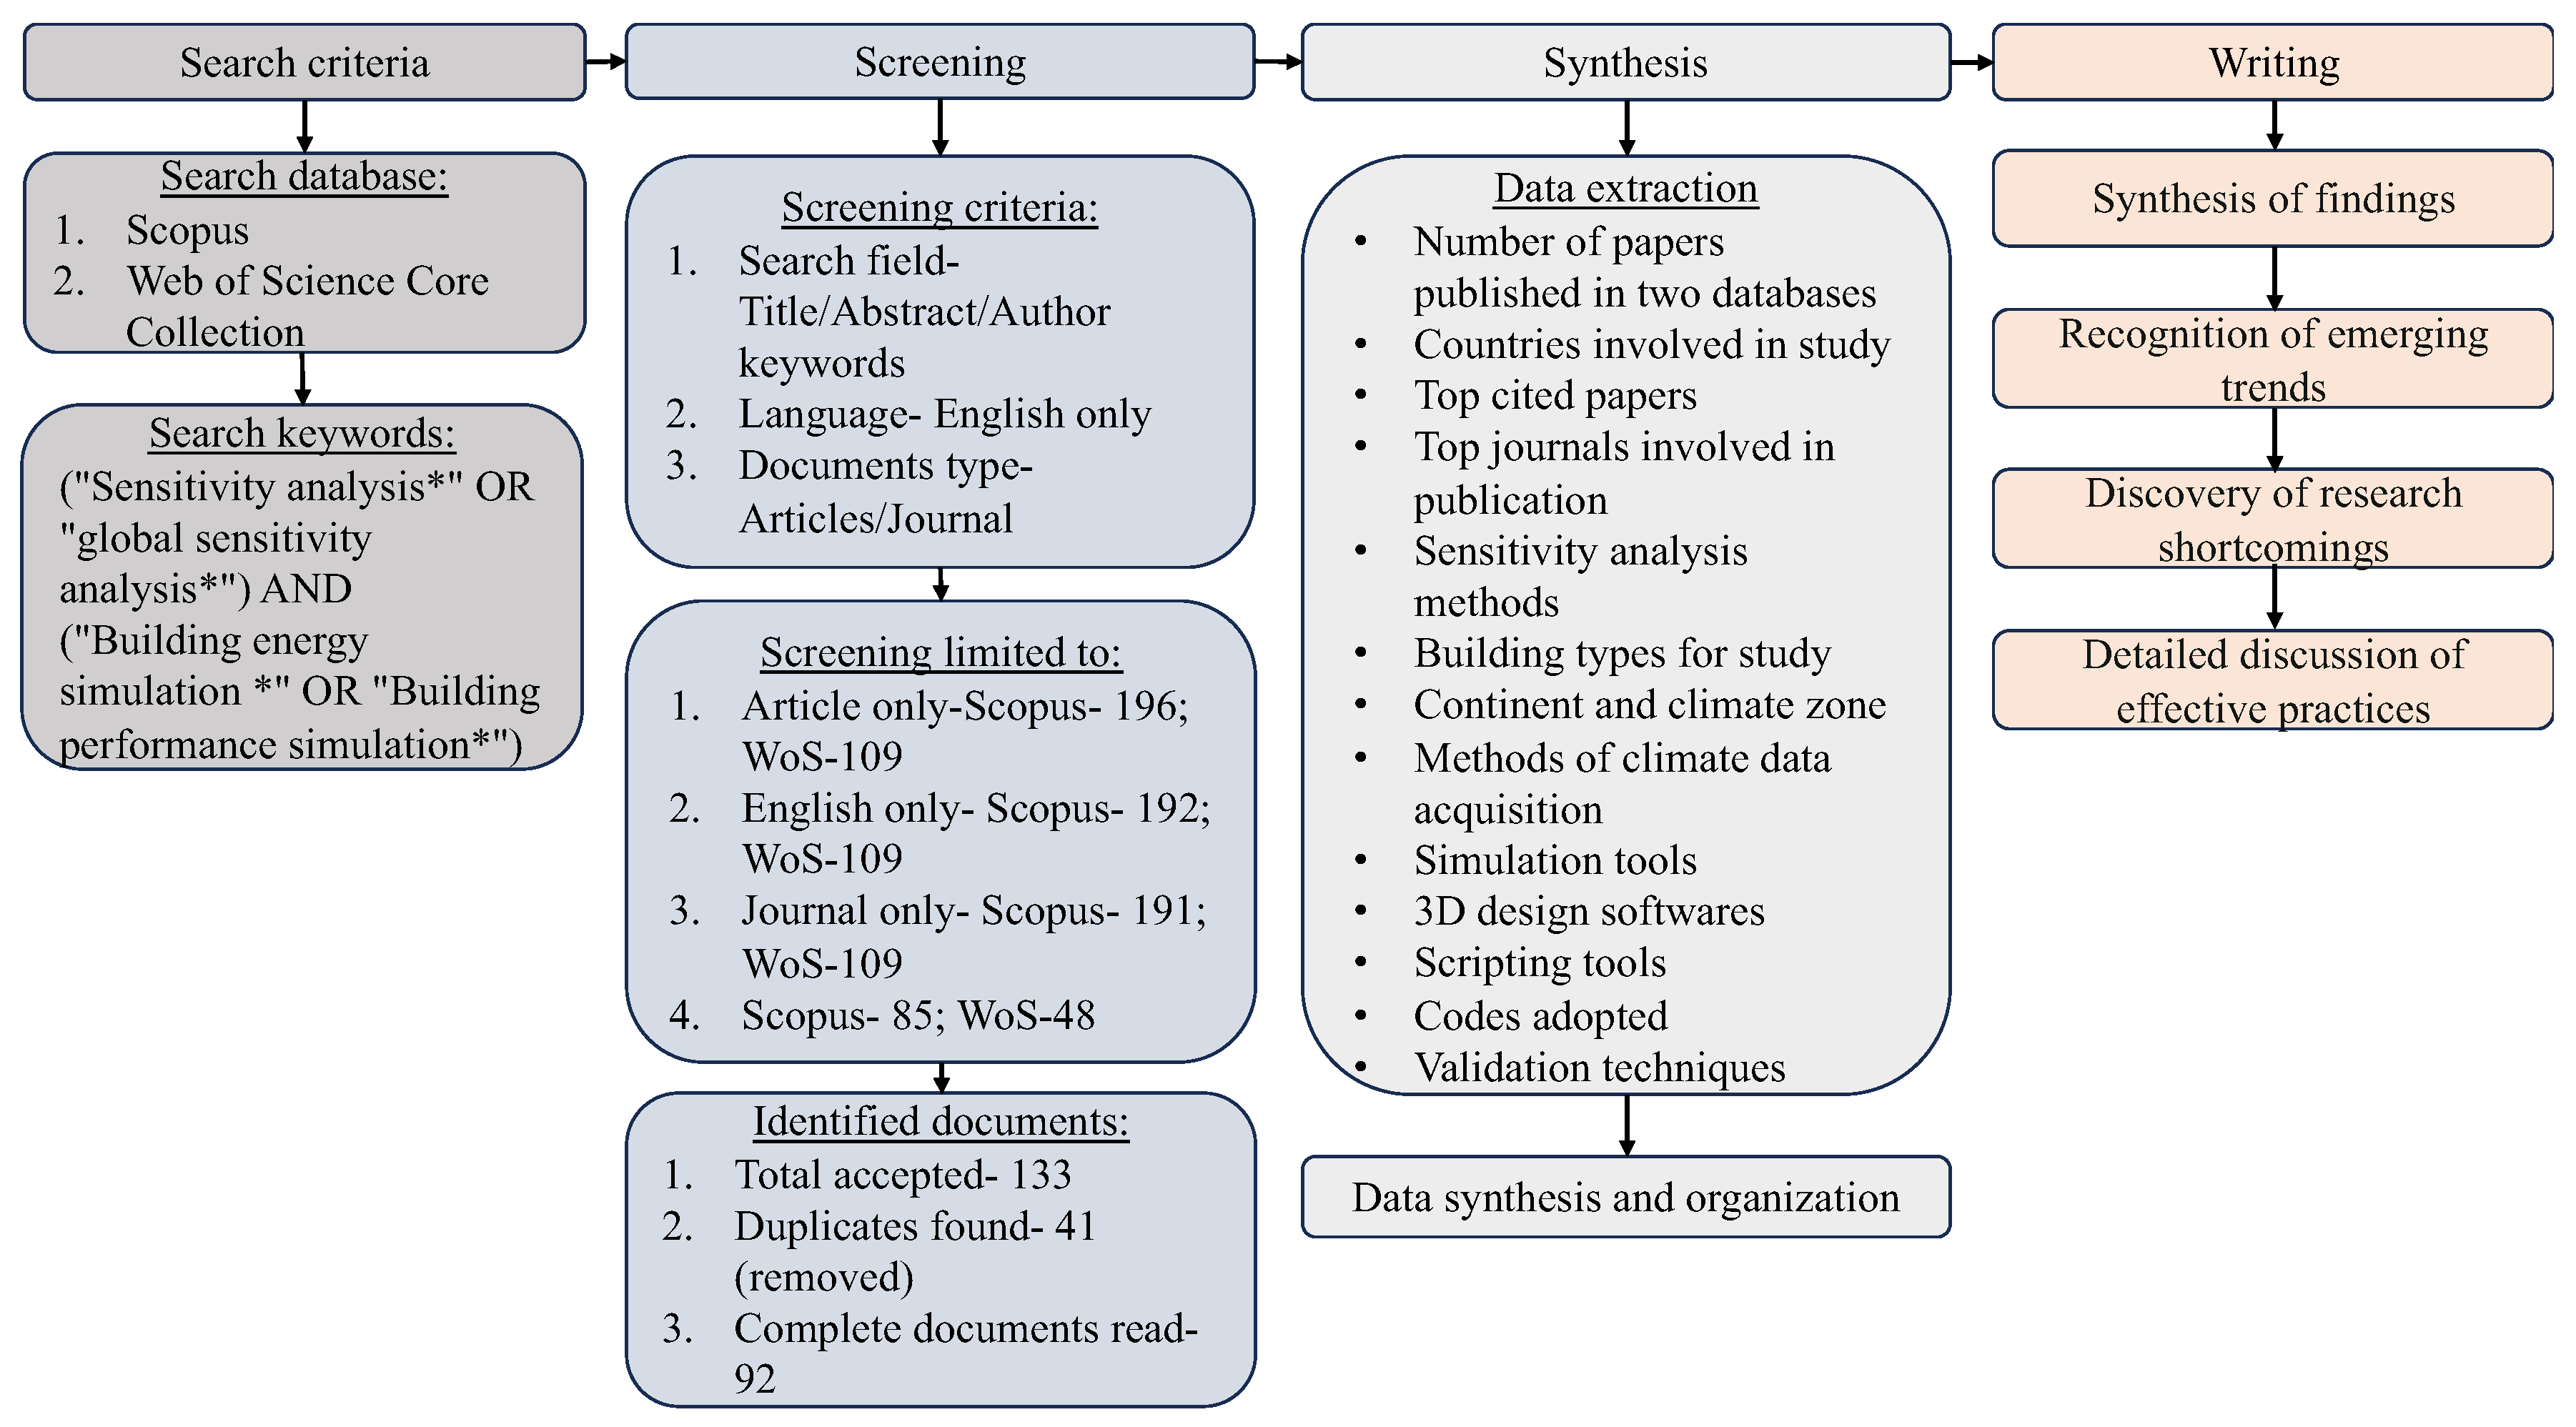
2. Literature Search Methodology
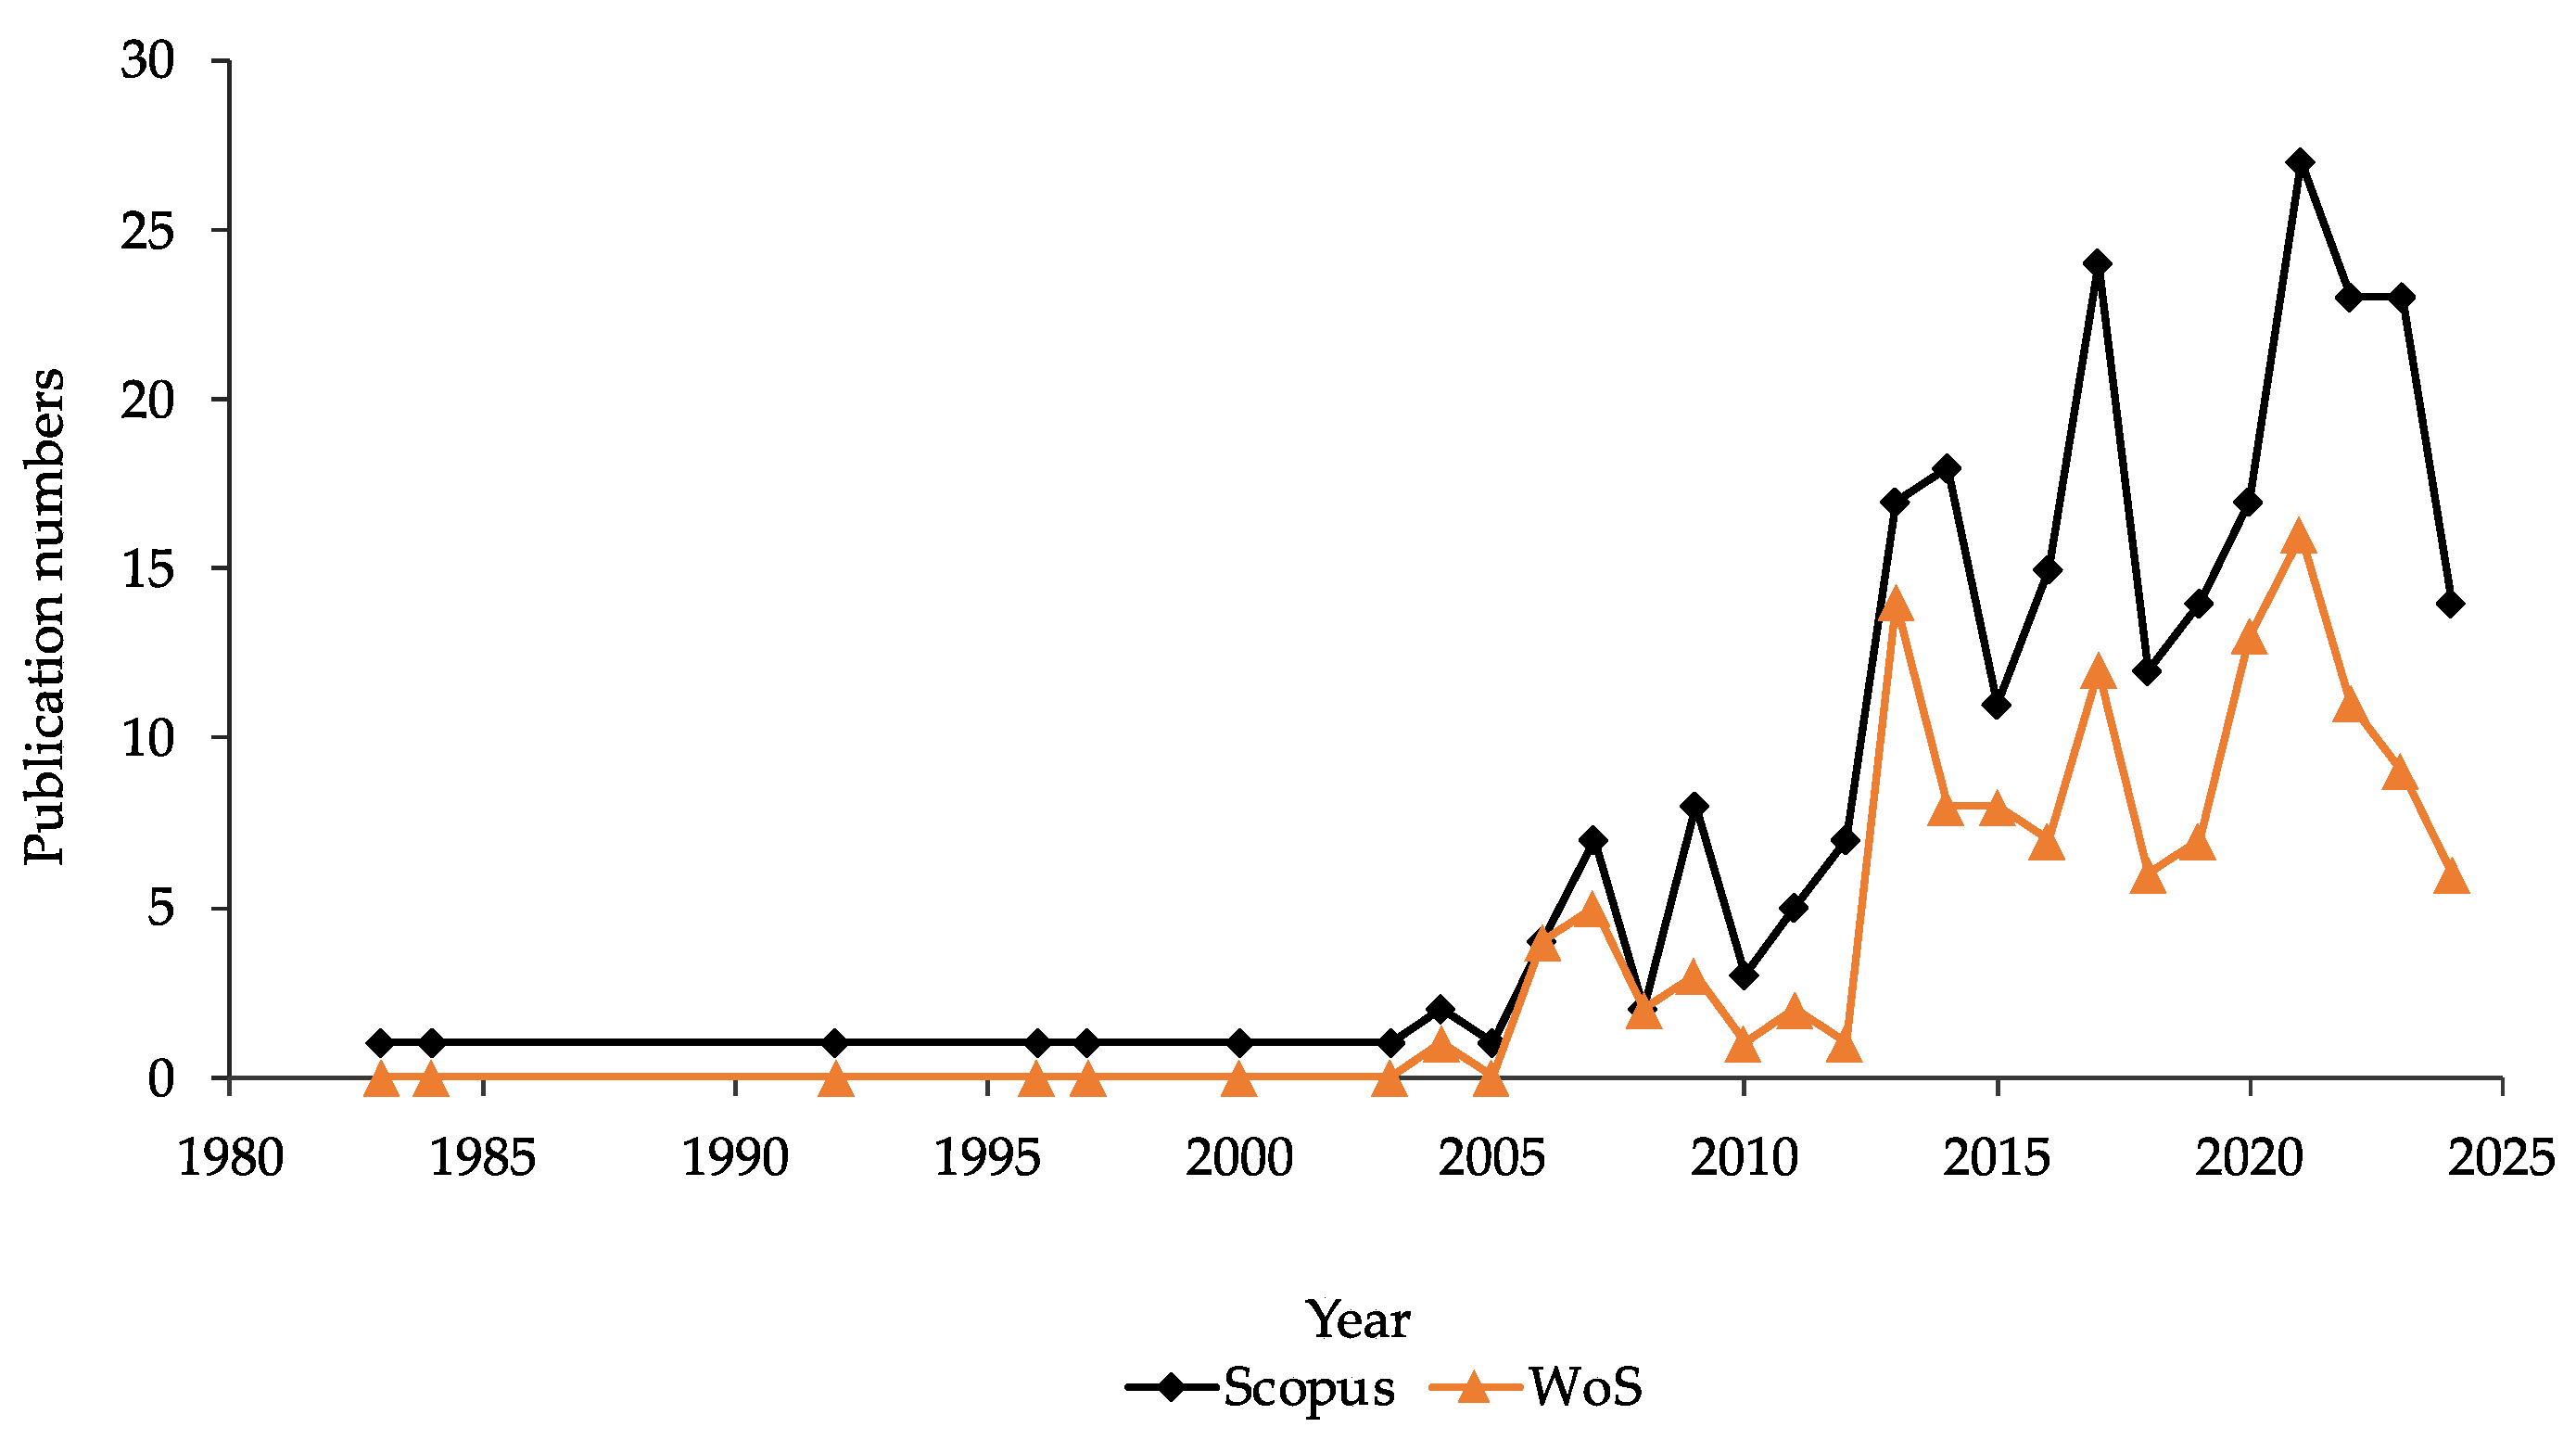
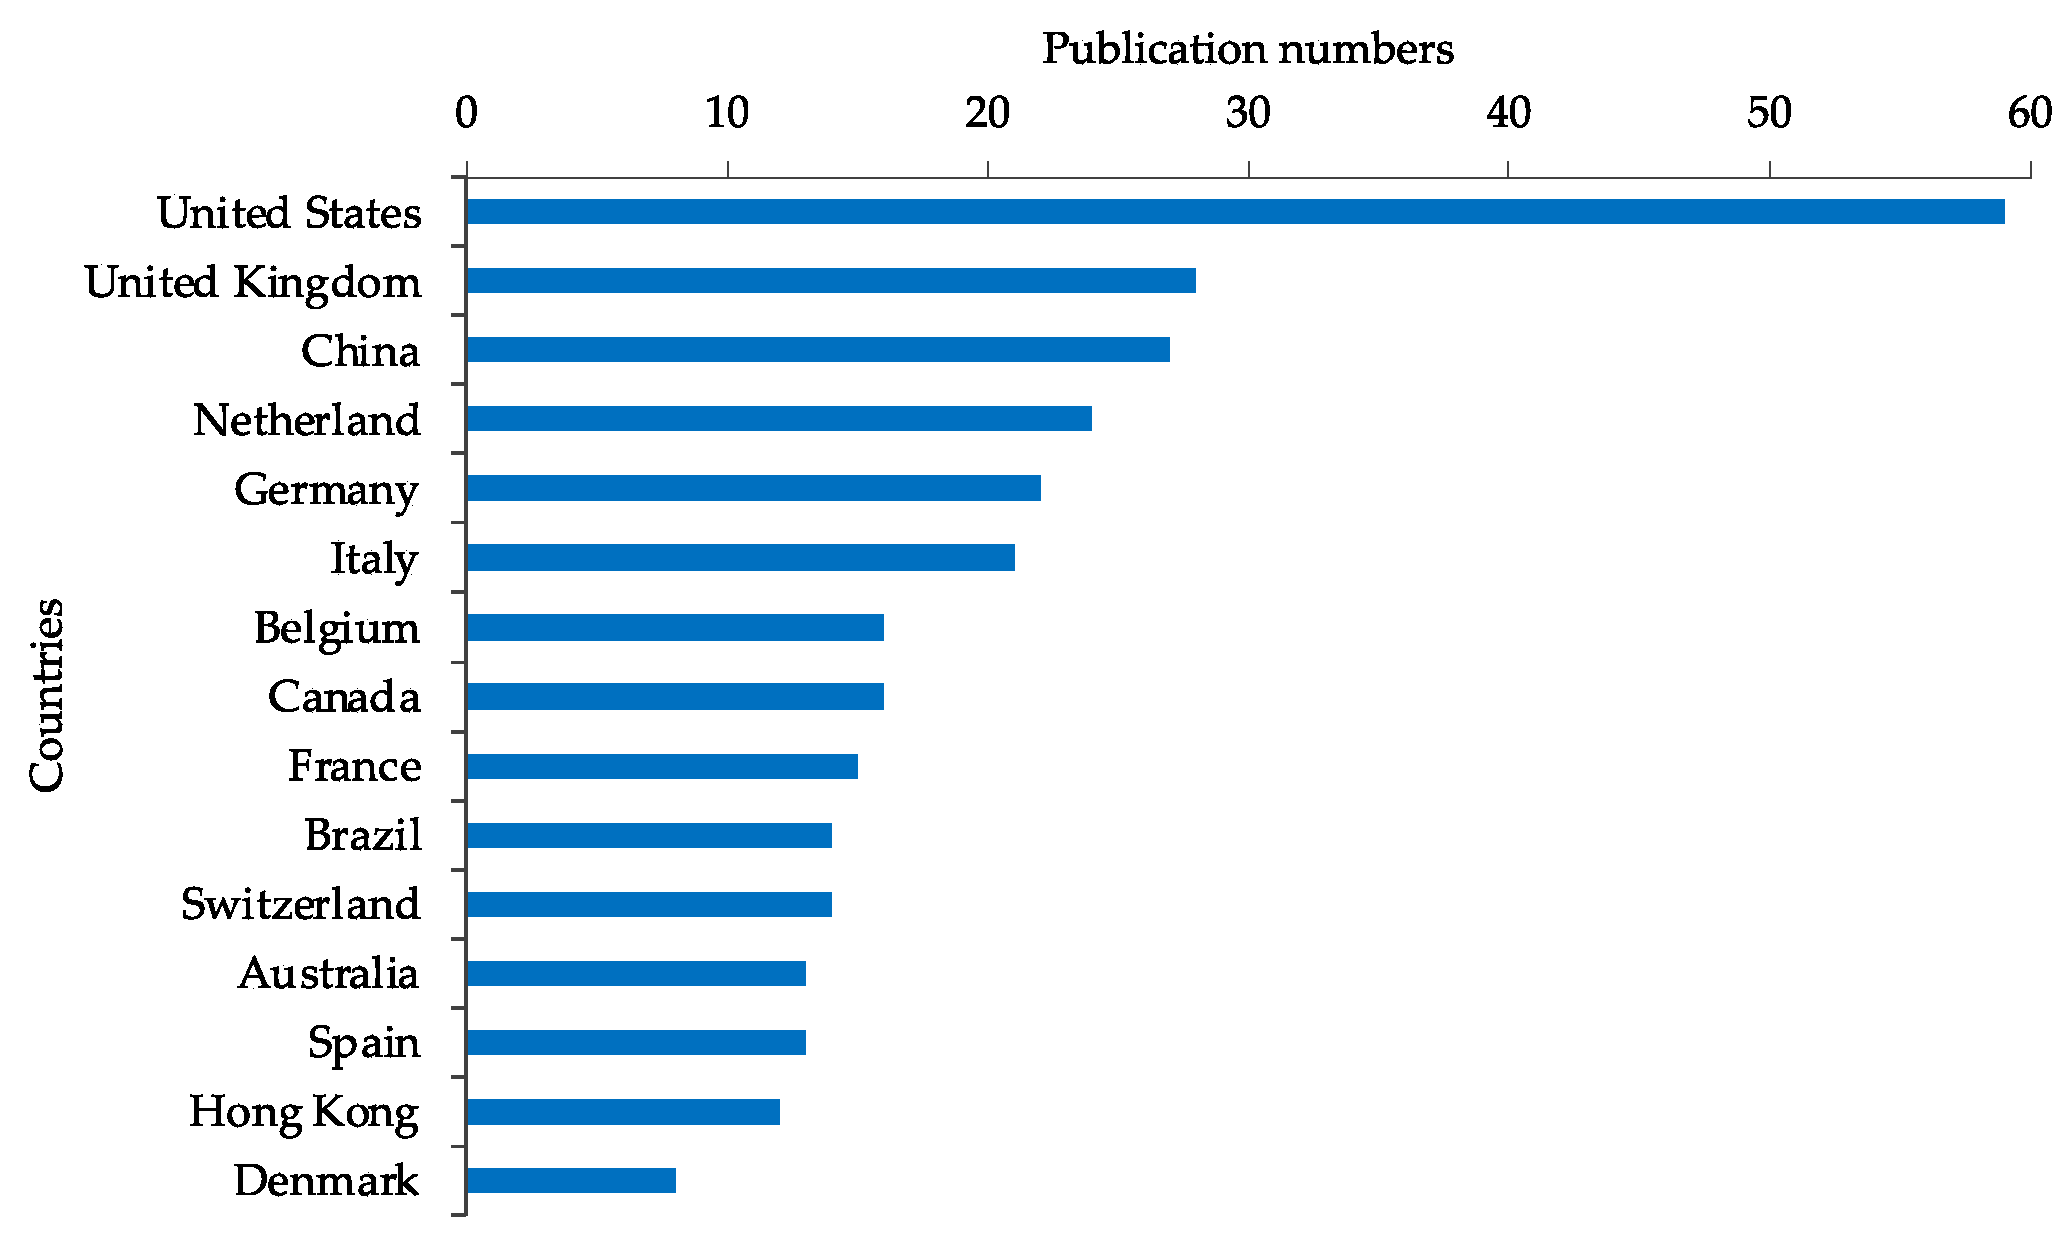
3. Overview of the Publications in Scopus and WoS
4. SA Techniques Used in Building Thermal Energy Performance

| Nos | References | Journal Name | IF |
|---|---|---|---|
| 1 | [14] | Renewable and sustainable energy reviews | 15.9 |
| 2 | [26,36,37] | Applied energy | 11.2 |
| 3 | [31] | Automation in construction | 10.3 |
| 4 | [24] | Energy | 8.9 |
| 5 | [38] | Sustainable energy technologies and assessments | 8.0 |
| 6 | [19,28,39,40,41,42] | Building and environment | 7.4 |
| 7 | [18,43] | Solar energy | 6.7 |
| 8 | [20,21,23,29,30,44,45,46,47,48,49,50,51] | Energy and buildings | 6.7 |
| 9 | [15,32,33,52,53,54,55,56,57] | Journal of building engineering | 6.4 |
| 10 | [33,58] | Energy for sustainable development | 5.5 |
4.1. Local Sensitivity Analysis (LSA) vs. Global Sensitivity Analysis (GSA)

4.2. Sampling Methods for SA
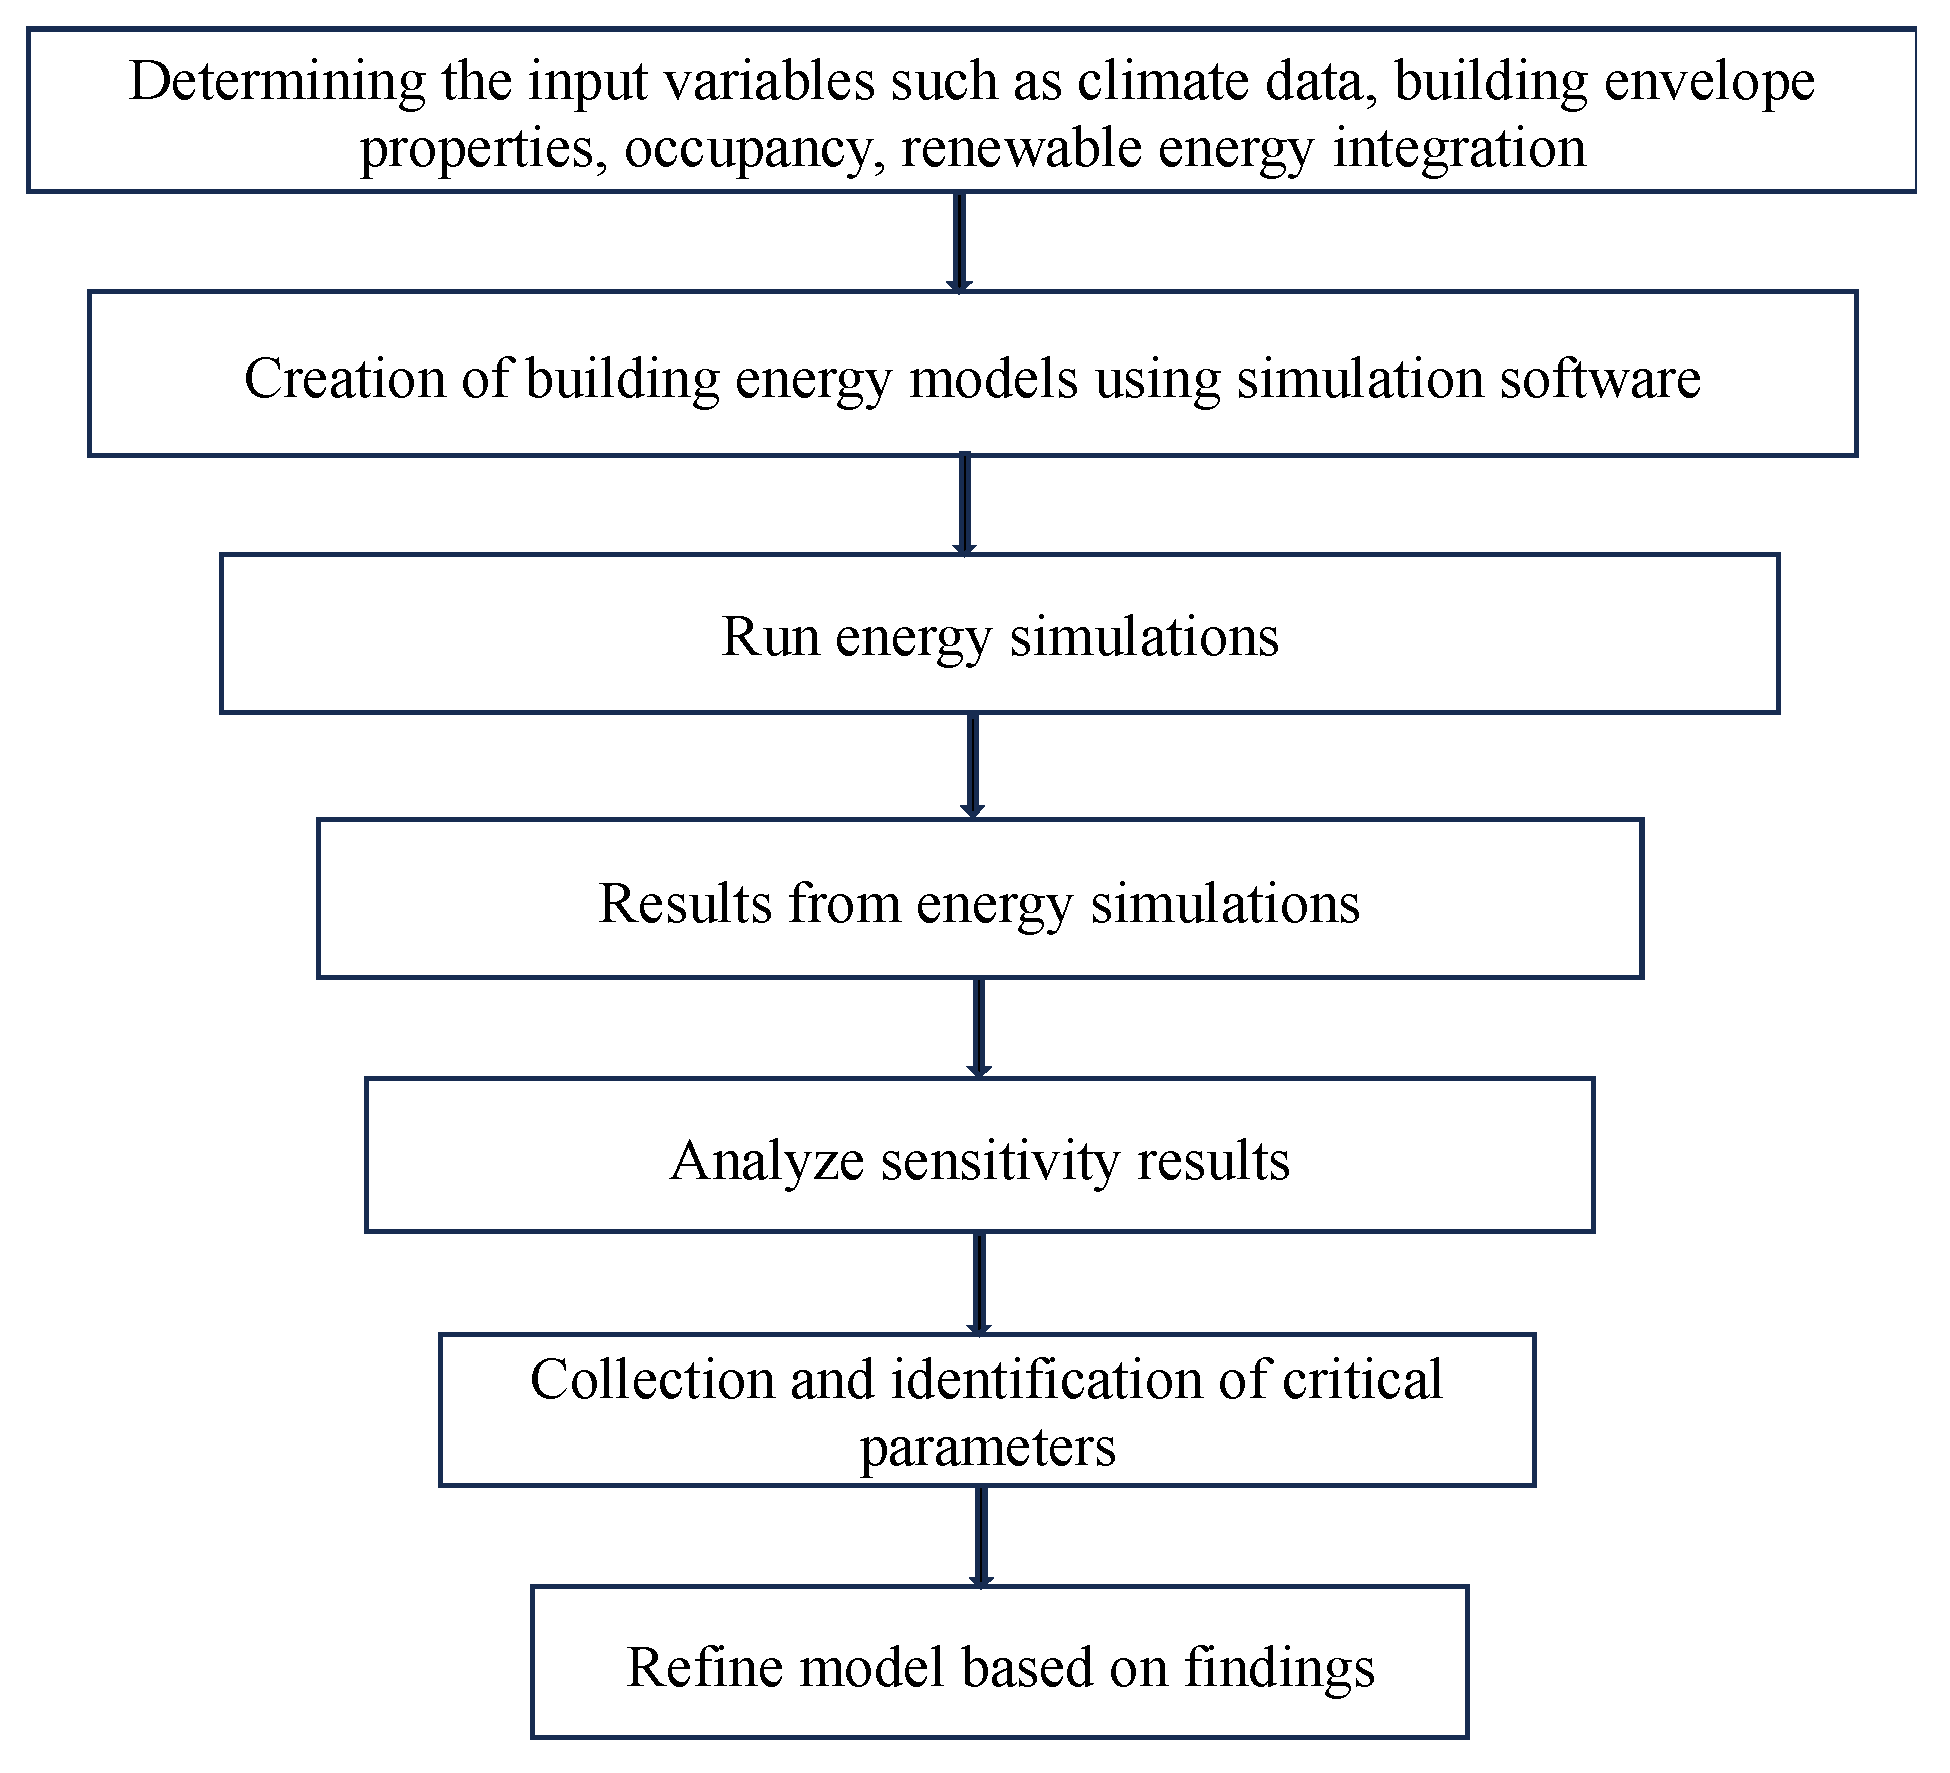
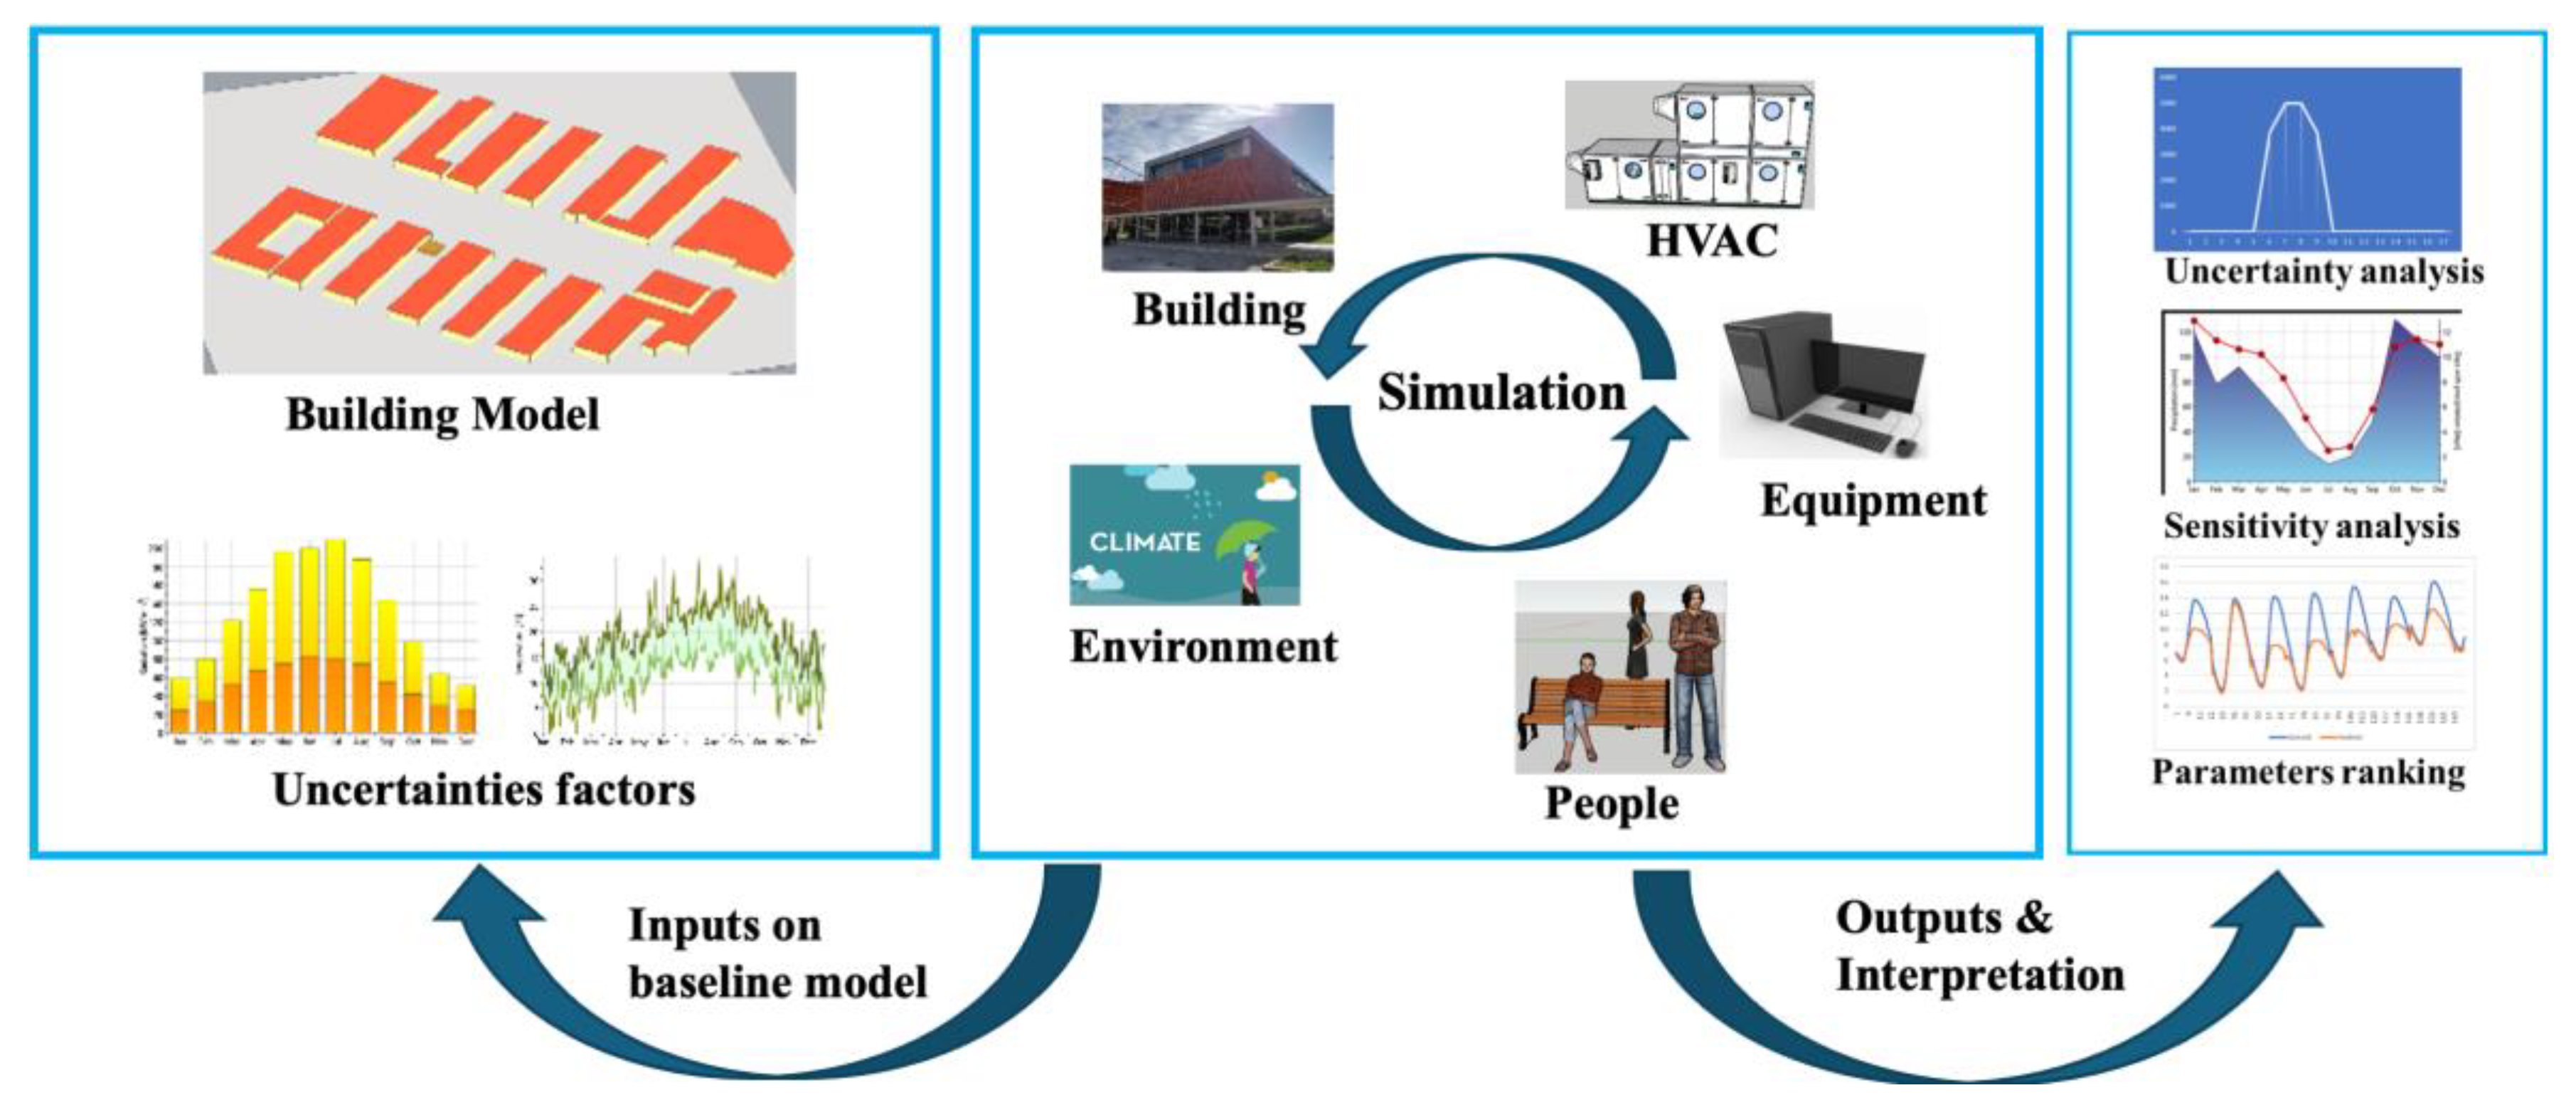
4.3. Steps of SA for Building Energy Simulation
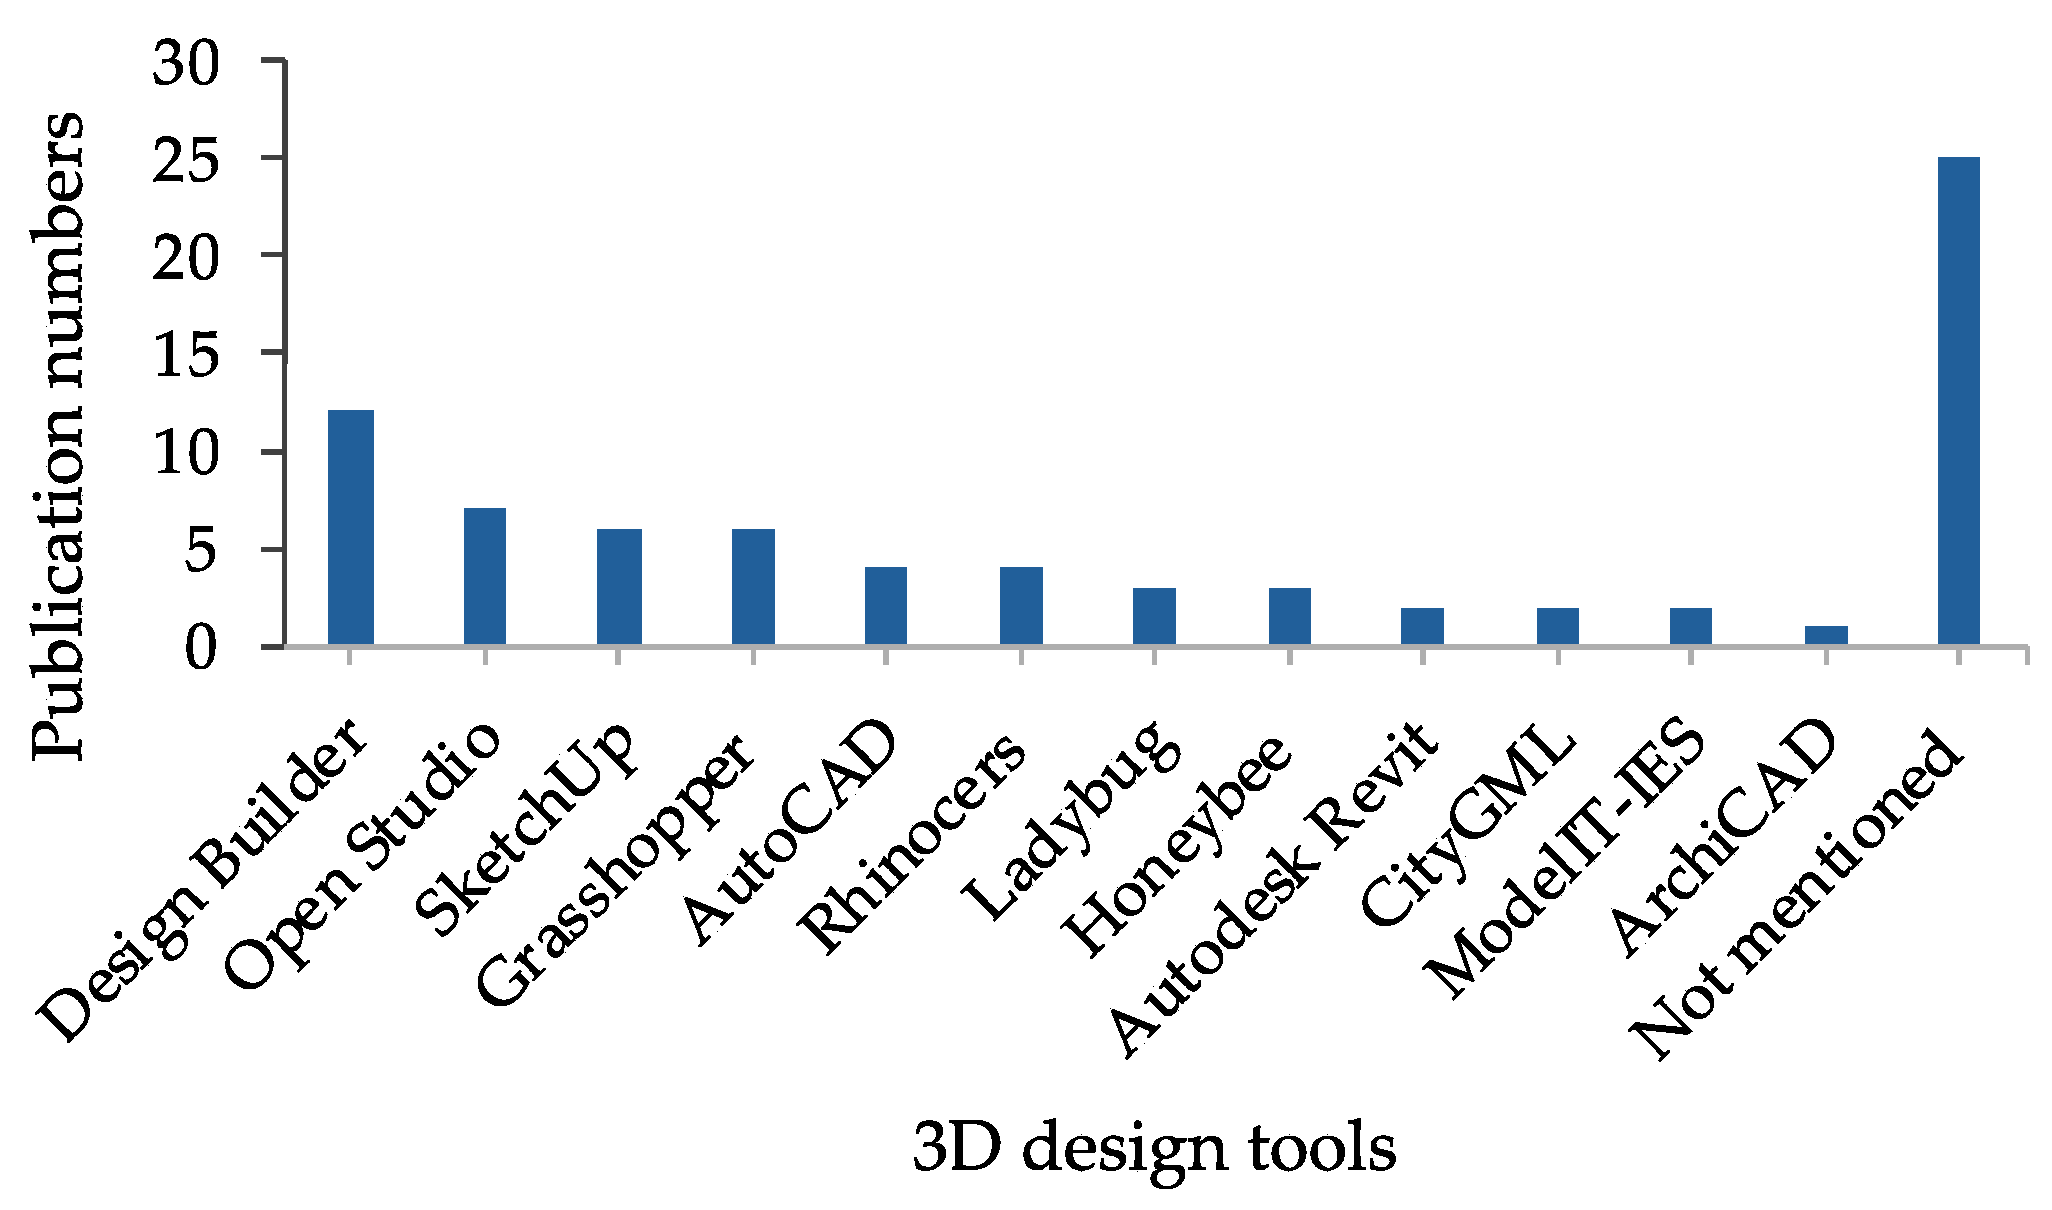
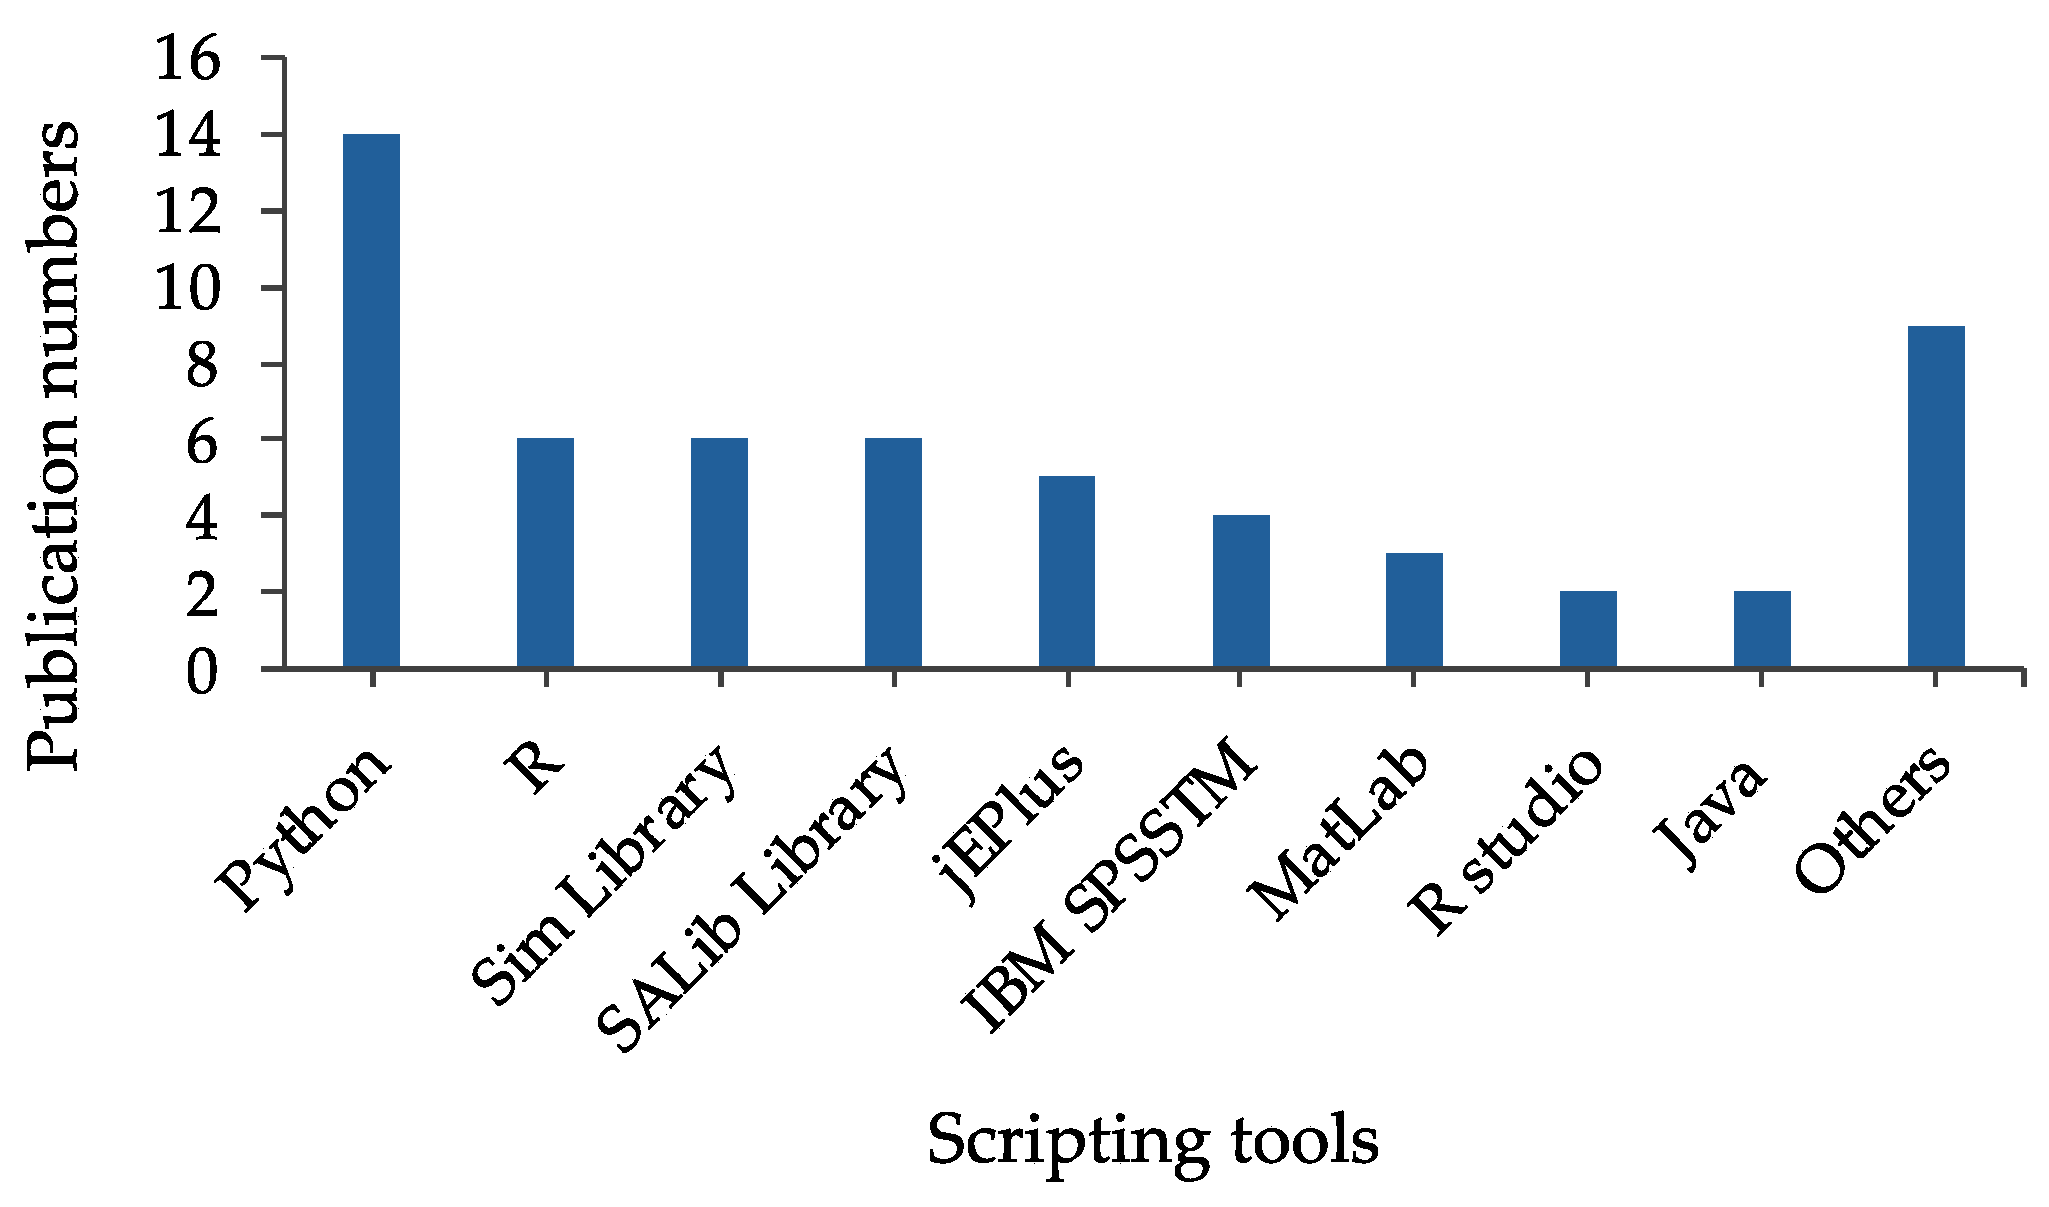
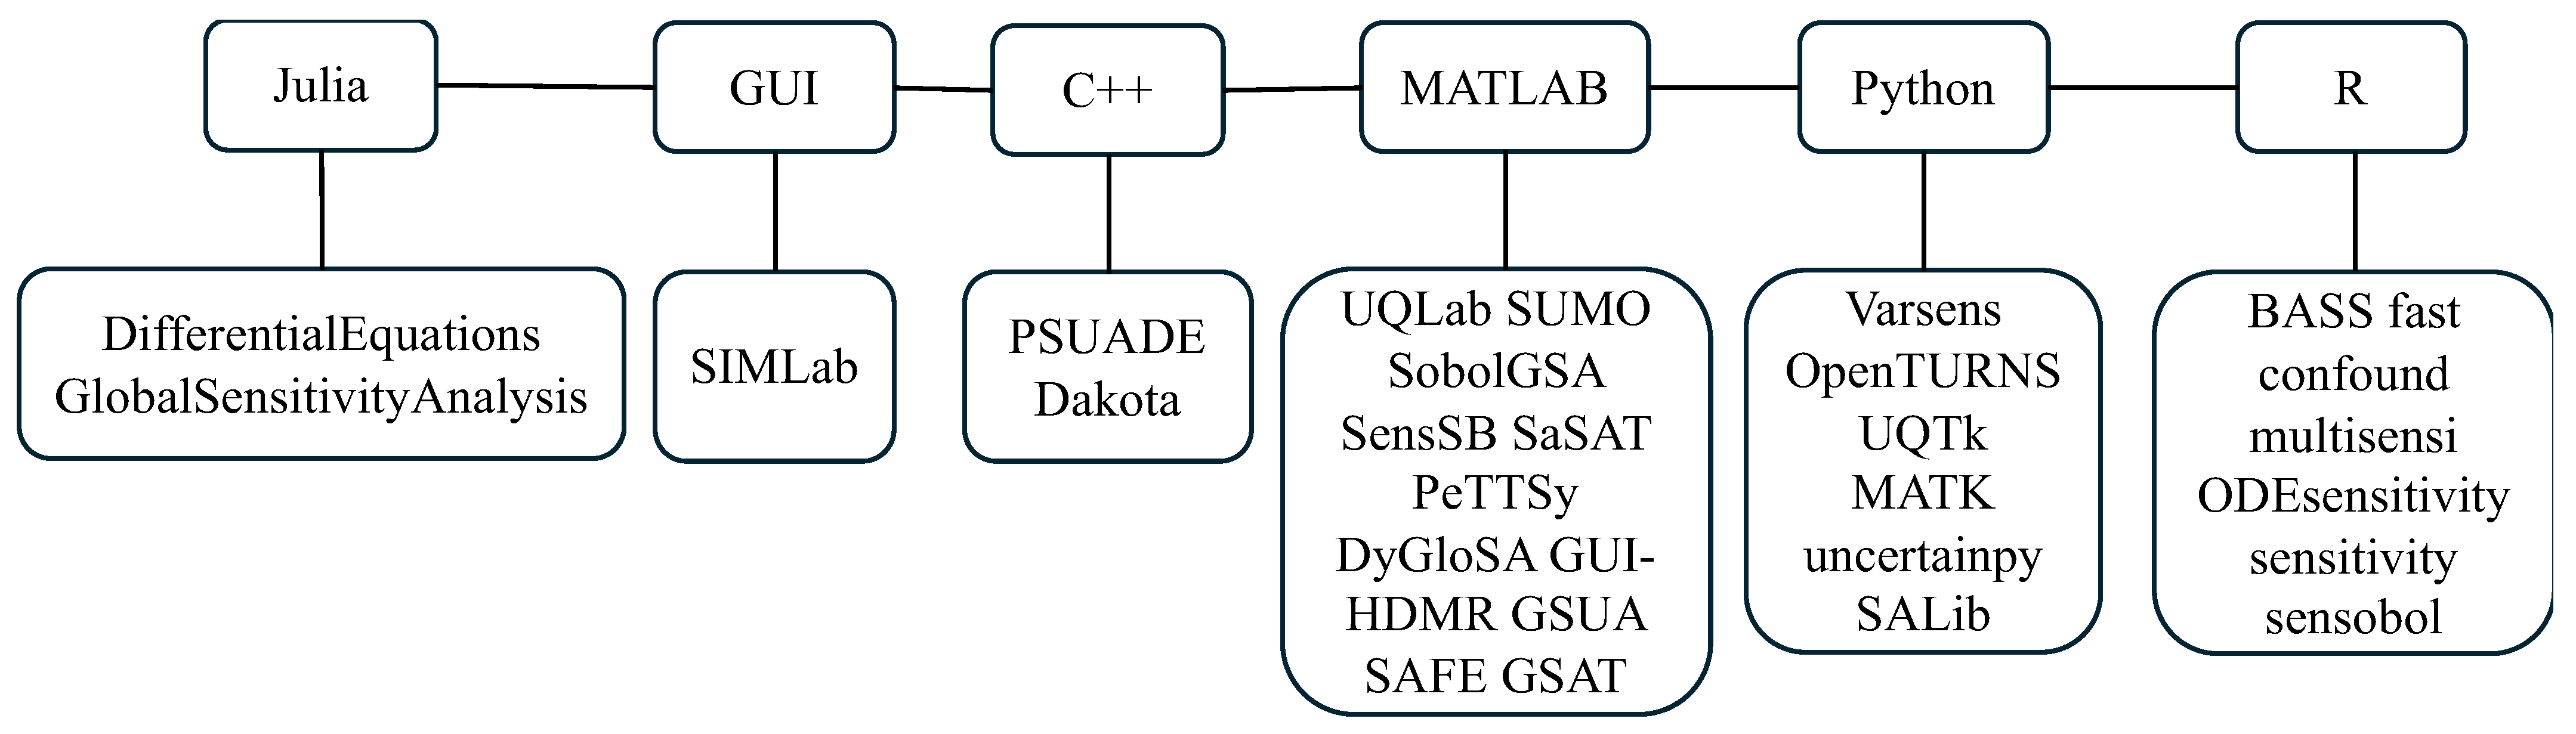
4.4. Energy Simulation and Post-Processing Tools in SA
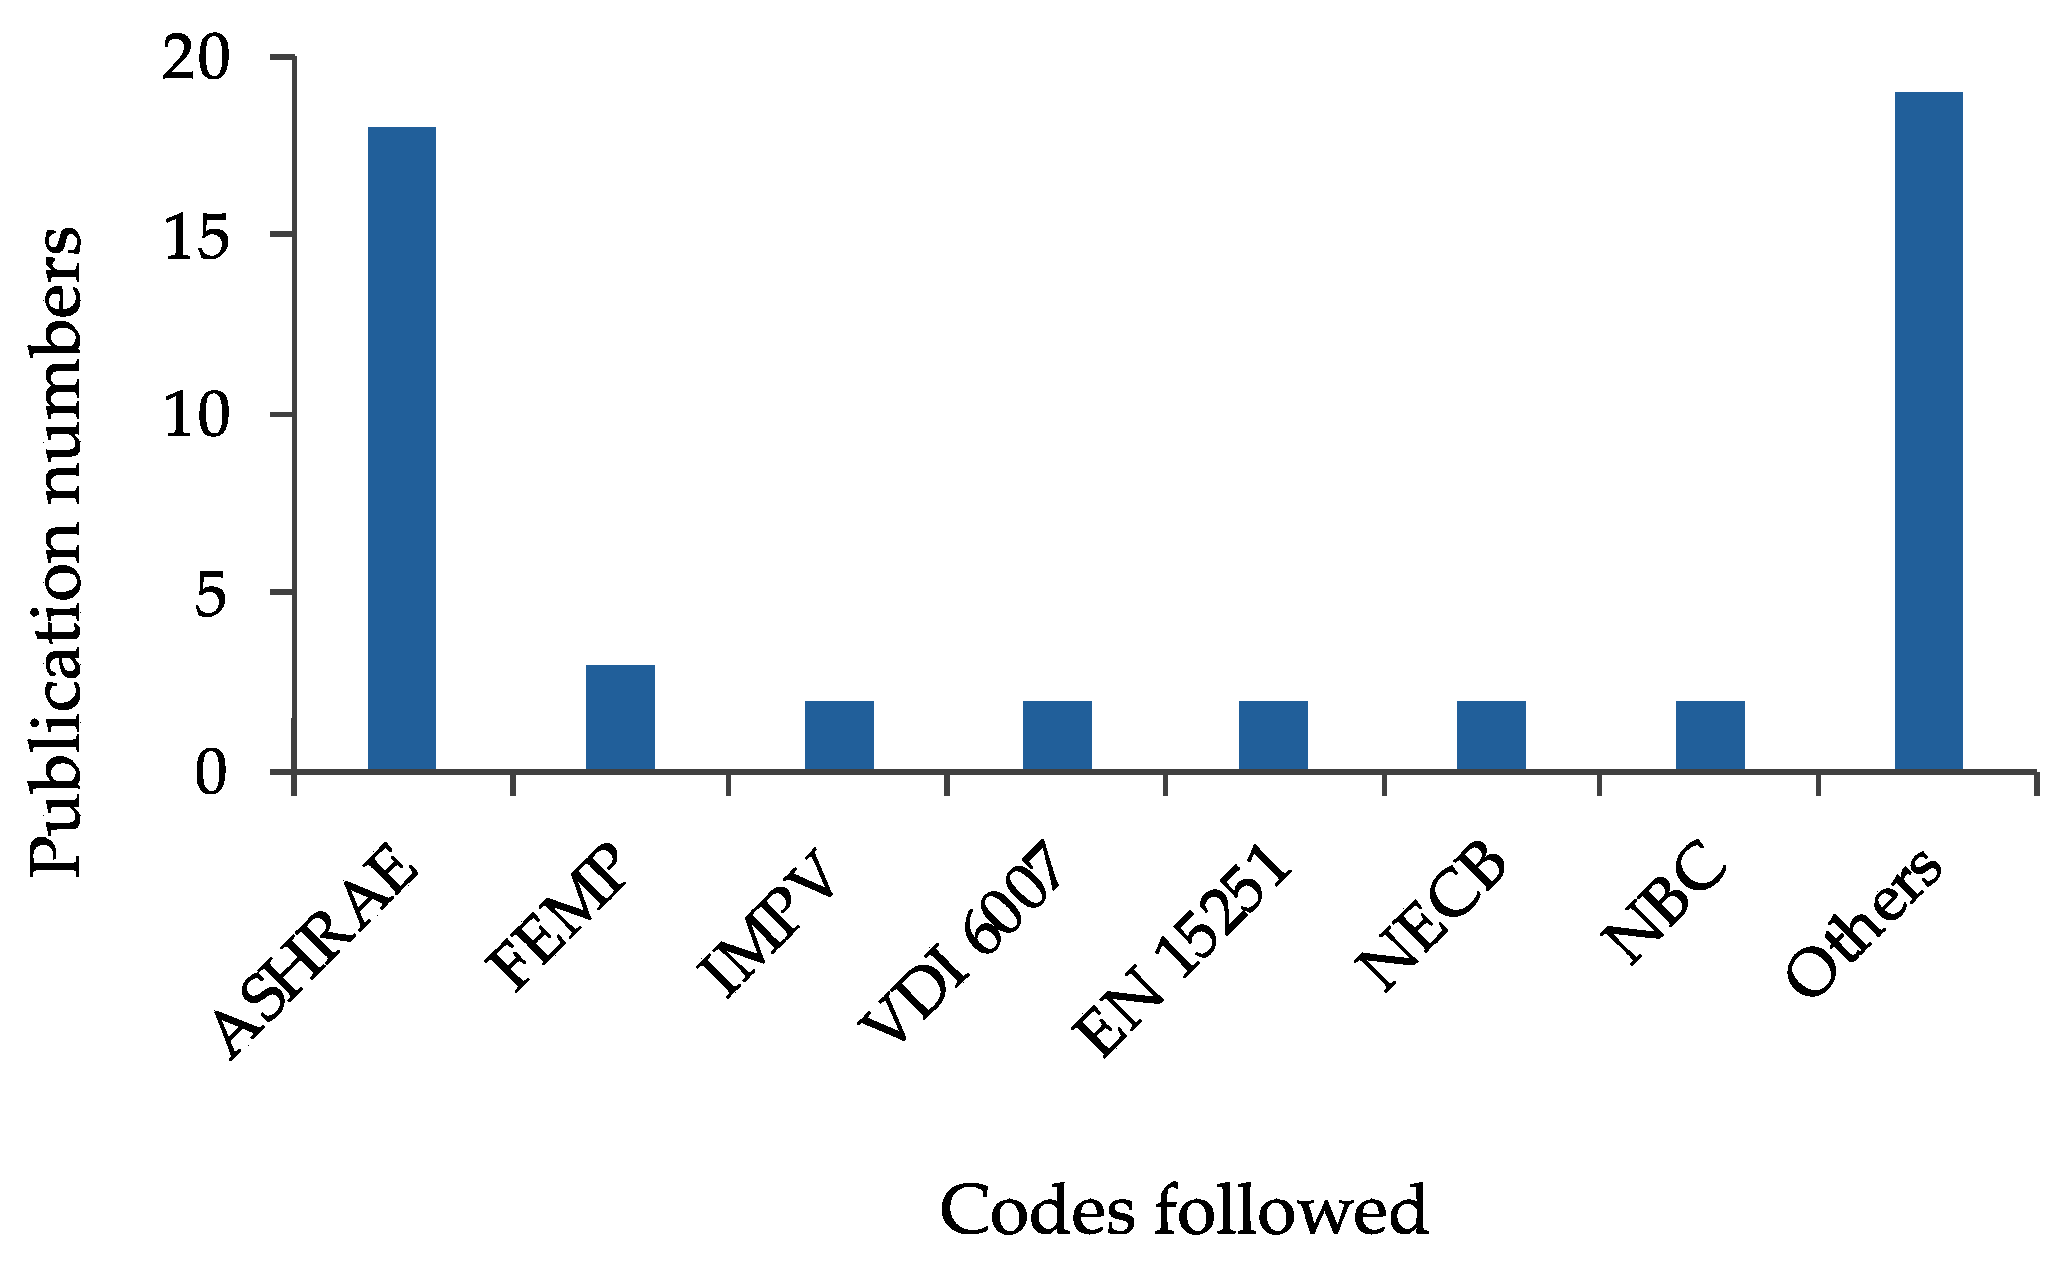
4.5. SA and Codes/Standards Adopted
5. Analysis of Sensitivity Patterns Across Building Typologies, Climate Zones, and SA Methodology to Identify Key Parameters
5.1. Methodology
5.1.1. Building Typologies
5.1.2. Integration of Climate Zones
5.1.3. SA Methods
5.2. Key Influential Factors
| Nos | Descriptions | References |
|---|---|---|
| 1 | Glazing thermal properties (particularly SHGC) is an influential input factor in terms of cooling energy efficiency compared to other building envelope materials. | [56] |
| 2 | The combination of wall insulation, basement ceiling insulation, and a secondary window application is the most sensitive in building energy efficiency. Changing the base case with the above-mentioned combination helps to reduce the total energy consumption by 8.53%. | [20] |
| 3 | The most influential input factor in the energy demand calculation is the temperature set point, the external wall area, and the U-value of the opaque surfaces. The deviation in the energy needs calculation drops from 18% to 10%. | [22] |
| 4 | Cooling set point temperatures and roof insulation significantly reduce energy consumption by 43.7% and 41.0%, respectively. | [25] |
| 5 | Temperature set point is much more sensitive to the building’s energy efficiency. Such as, if the temperature set points increased from 20 °C to 22 °C, for instance, the energy consumption for space heating increases by 11.5%. | [101] |
| 6 | The most influential parameters on energy consumption were insulation and cooling set point played a key role with the contribution of 33% and 31%, respectively. | [28] |
| 7 | The occupancy density and start/end time of working hours are highly sensitive due to their significant impact on average occupancy profiles. | [98] |
| 8 | The implementation of reflective paints on the outer wall would achieve the highest percentages of whole-building energy savings, up to 21%, for cooling demand. | [25] |
| 9 | The window-to-wall ratio and HVAC set point are the two most contributing factors for the energy savings of up to 4%. | [63] |
| 10 | The apartment’s floor area, equipment load, windows-to-floor ratio, mechanical ventilation airflow, and cooling temperature set point are the most critical design parameters for energy-efficient buildings. | [30] |
| 11 | Shading and SHGC values are the most effective parameters. | [97] |
| 12 | The window-to-wall ratio is the section of passive solar design that is the most influential to energy performance. | [18] |
| 13 | The most influential component is the floor area ratio and building coverage ratio for the energy performance of residential communities. | [17] |
| 14 | The windows’ U-factor, SHGC, and a set point temperature for heating are the most critical factors for heating energy demand in cold climates. | [102] |
| 15 | The solar protection strategies are still the highly sensitive strategies for building energy performance in hot climate regions. | [16] |
| 16 | The window-to-wall ratio, aspect ratio, glazing type, absorptance of the wall, and shade transmittance are major influencing parameters. However, each parameter has an impact on different proportions depending on the building orientation and performance parameters. | [62] |
| 17 | The window’s SHGC, wall painted color, wall U-value, and length of roof eaves are the most effective parameters and could reduce energy consumption by up to 19%. | [42] |
| 18 | The occupant heating set point, infiltration rates, occupant density, and building thermo-physical properties have a greater impact on energy consumption. | [81] |
6. Temperature Adaptability
7. Conclusions and Future Works
- Since 2005, there has been a significant rise in research using SA techniques in BTEM.
- The USA is the most involved country in studying BTEM using the SA technique, followed by China and various European countries.
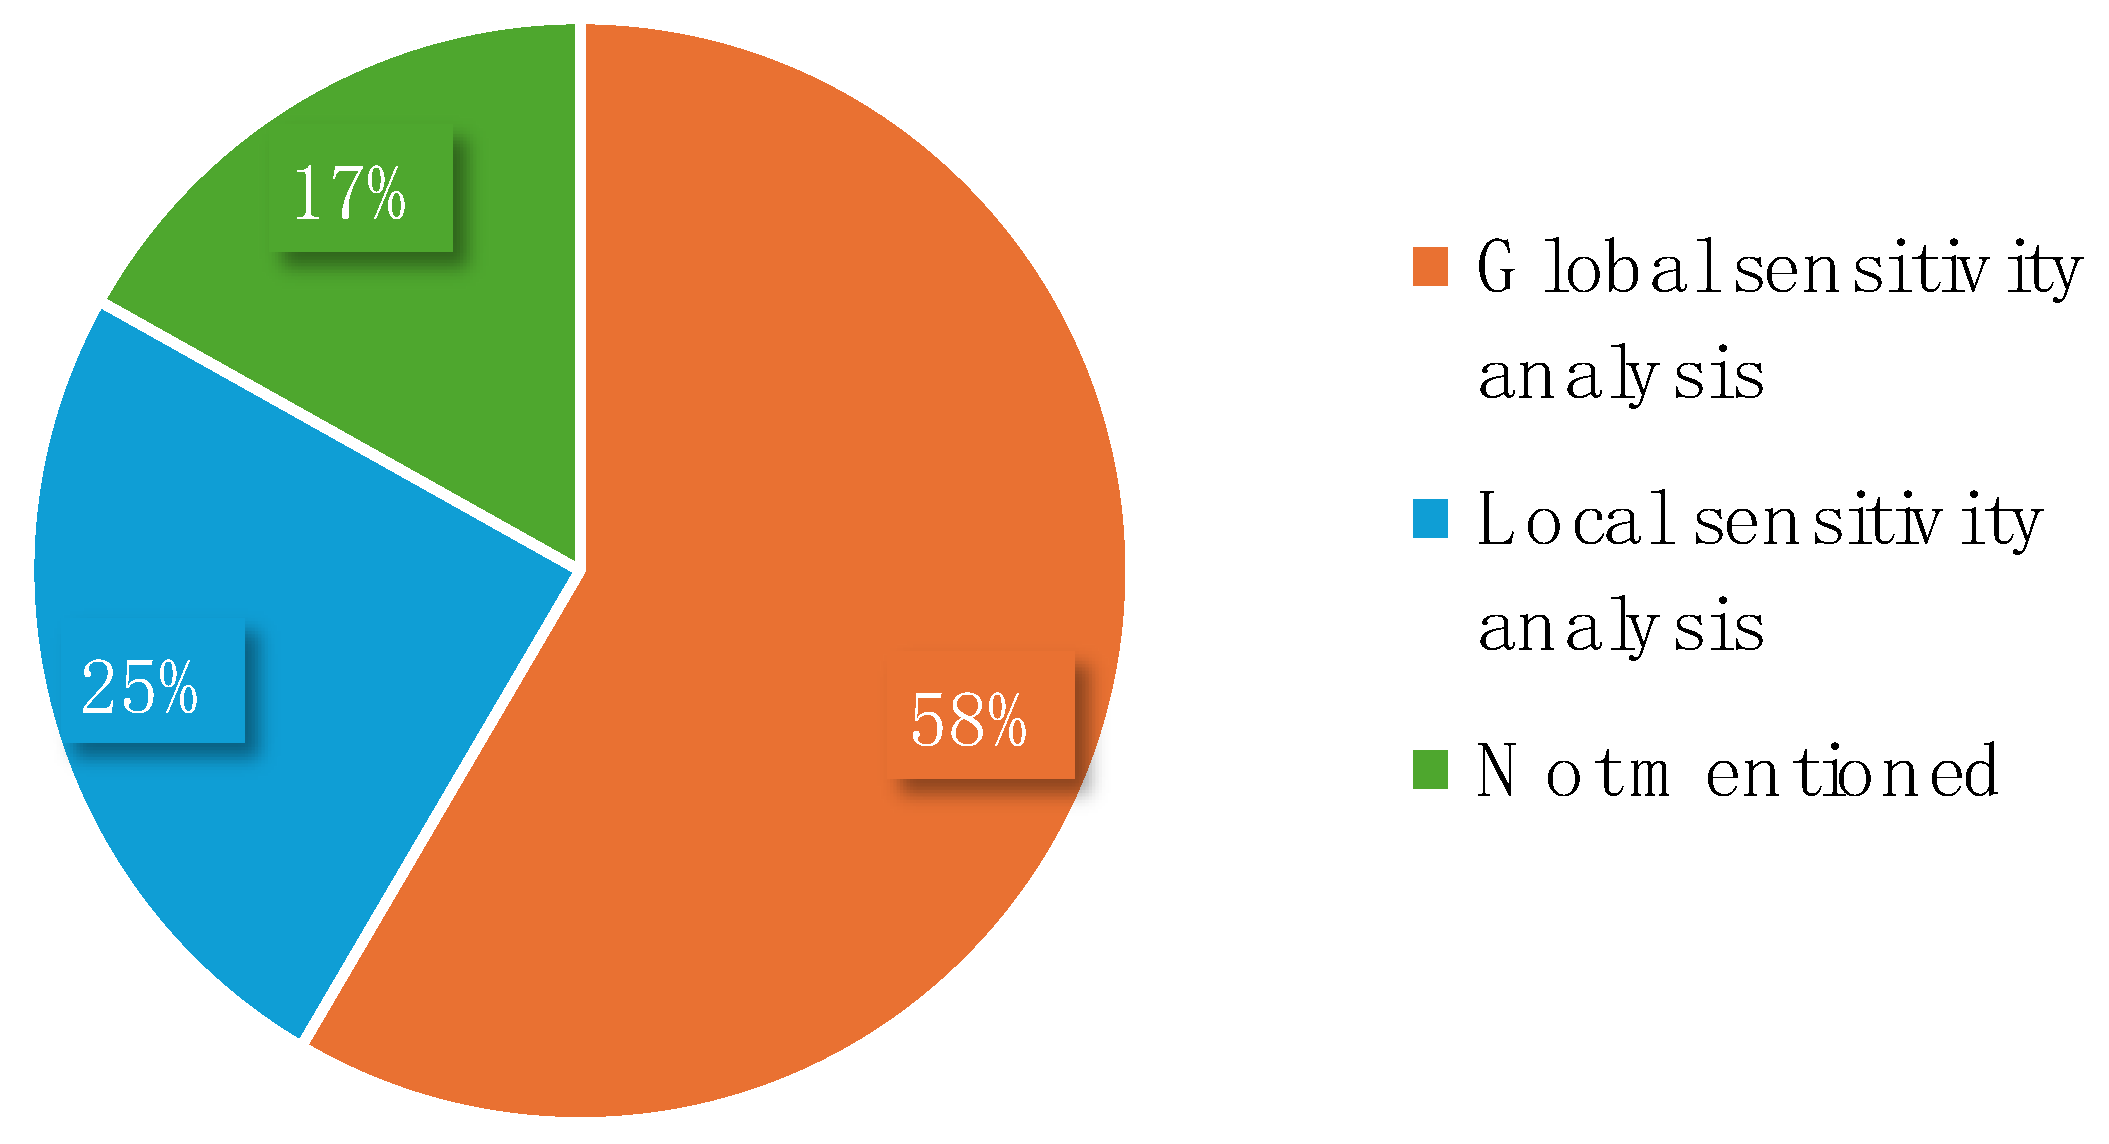
- GSA is the most widely used method, surpassing LSA in analyzing building energy performance.
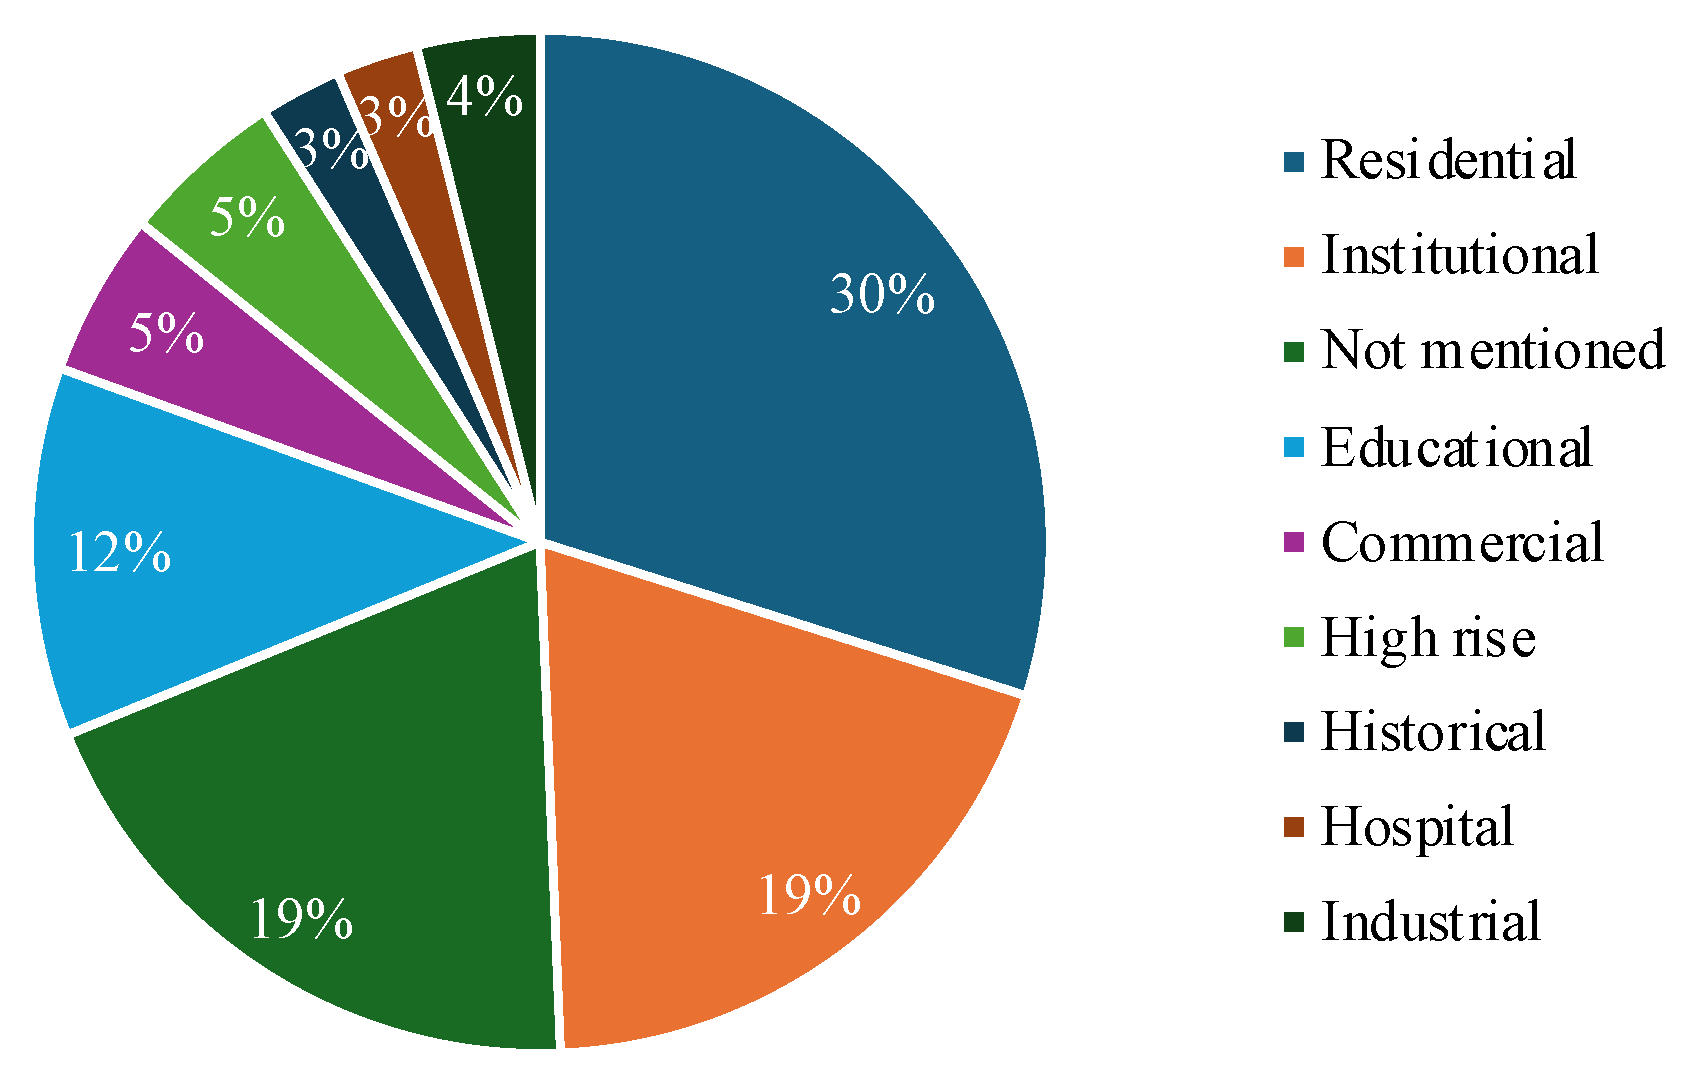
- The case studies of residential buildings dominate the other types of buildings, followed by institutional and educational buildings.
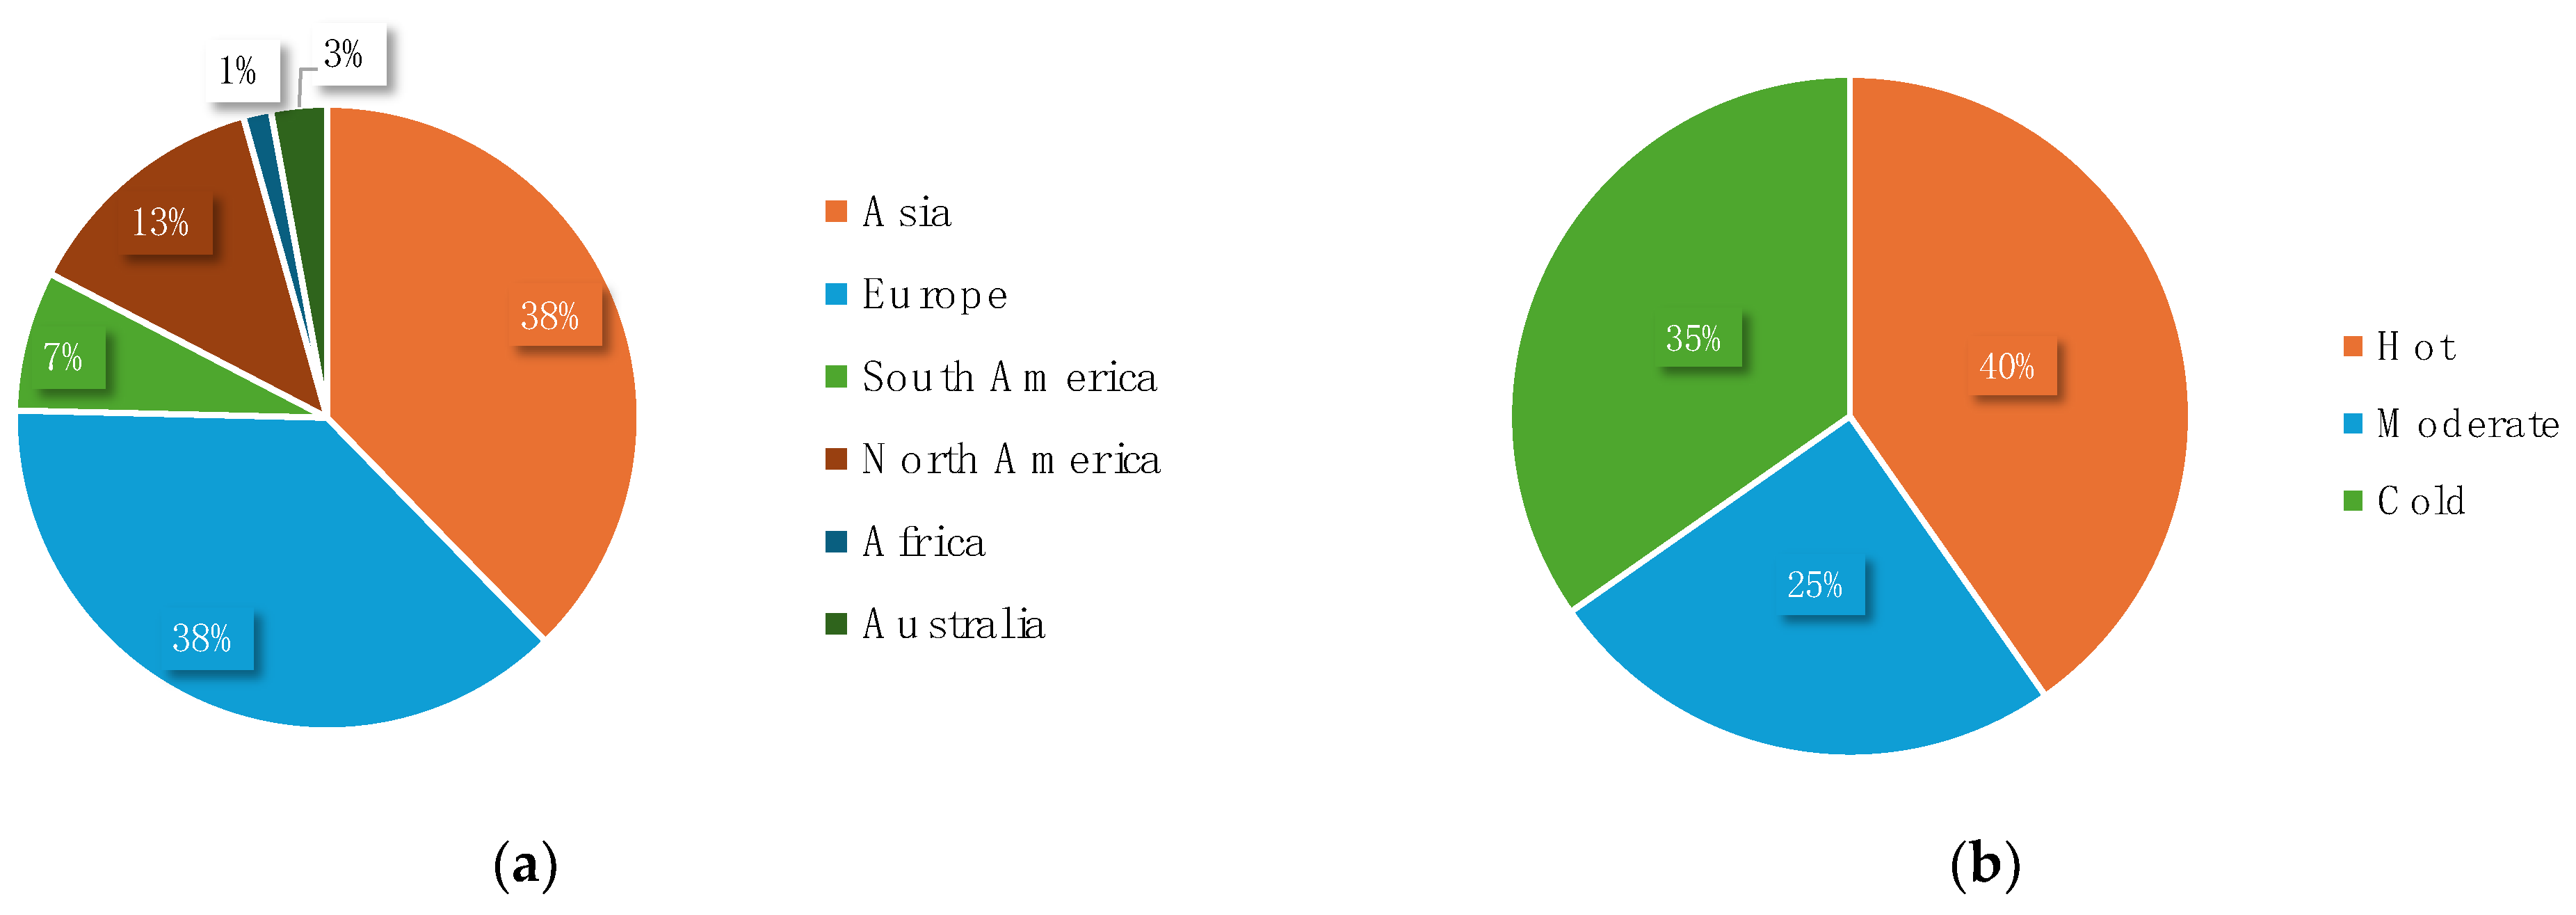
- Most studies focus on cases in Europe and Asia, particularly in hot climate regions.
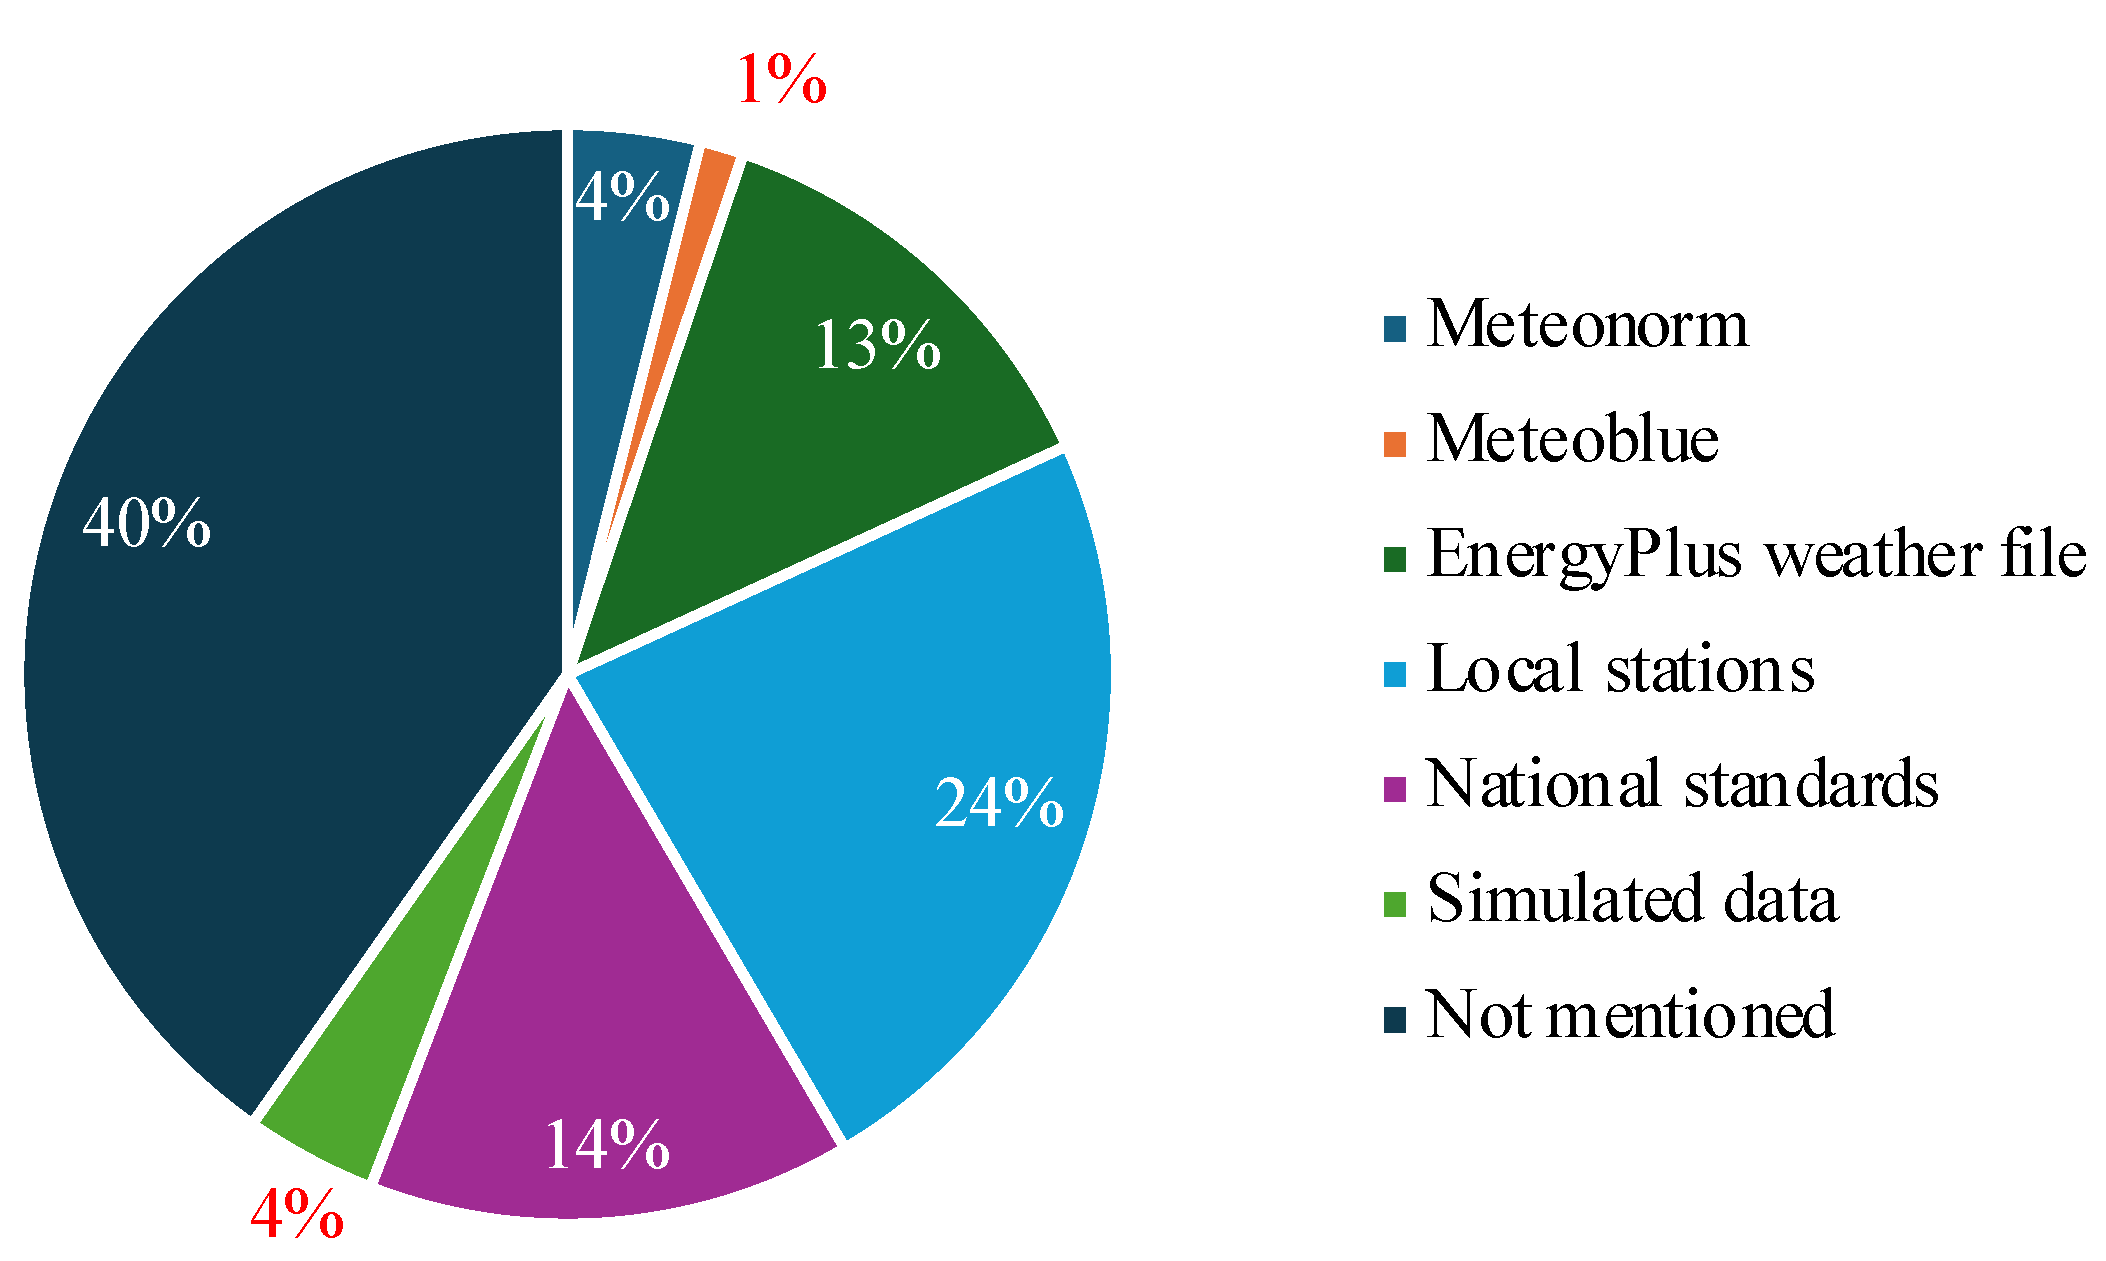
- Climate data for BTEM is mainly extracted from local meteorological stations. However, Meteonorm software is a widely used tool, as it provides reliable data from several meteorological sources in a designated format.
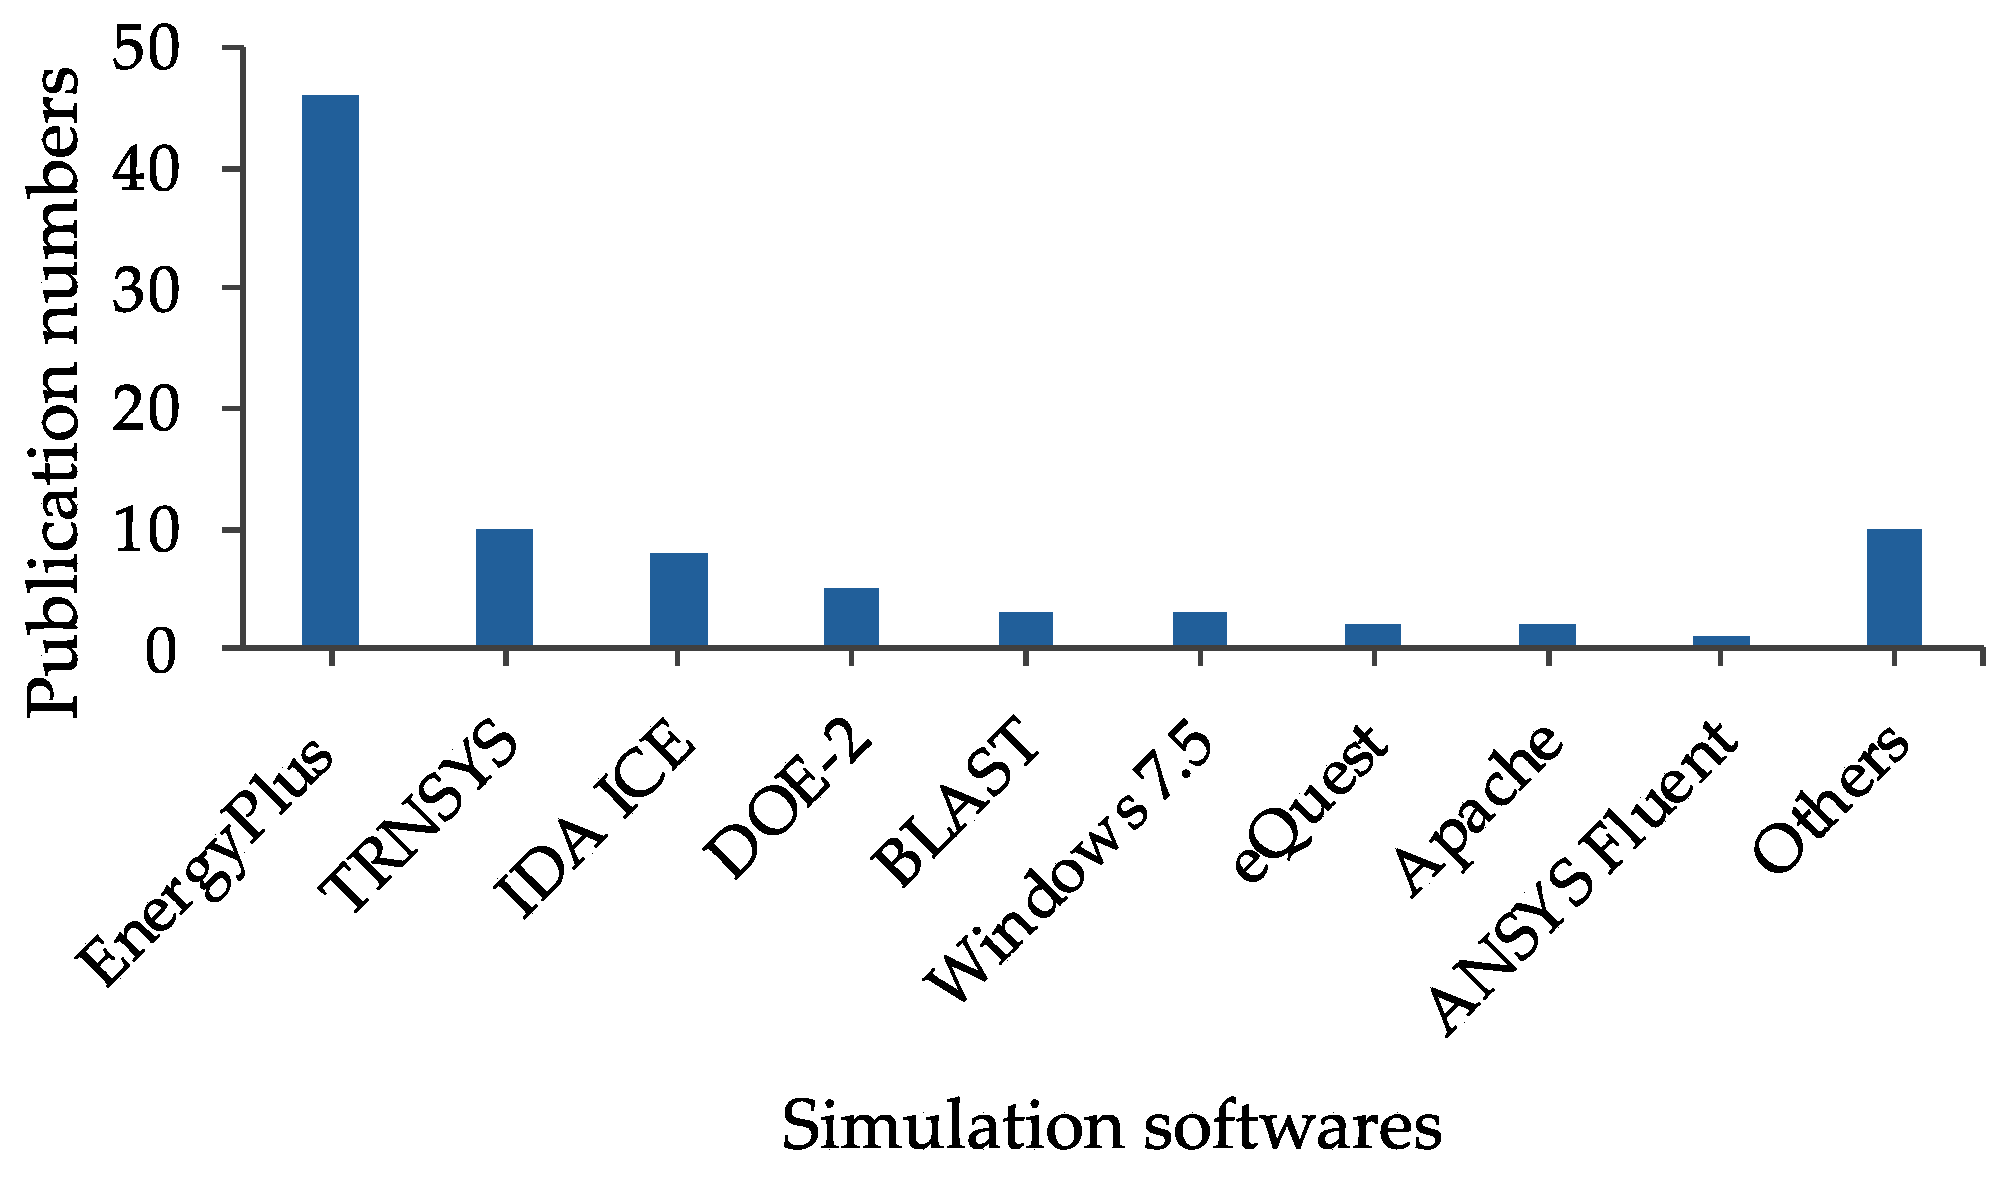
- EnergyPlus and DesignBuilder are the most commonly used and popular simulation tools for BTEM.
- Python and its library, called the SALib library, are the most used scripting tools for SA.
- ASHRAE standards are the most frequently referenced codes in the studies.
- Temperature set point is the most influential input parameter, as concluded by researchers in both heating- and cooling-dominant climate zones.
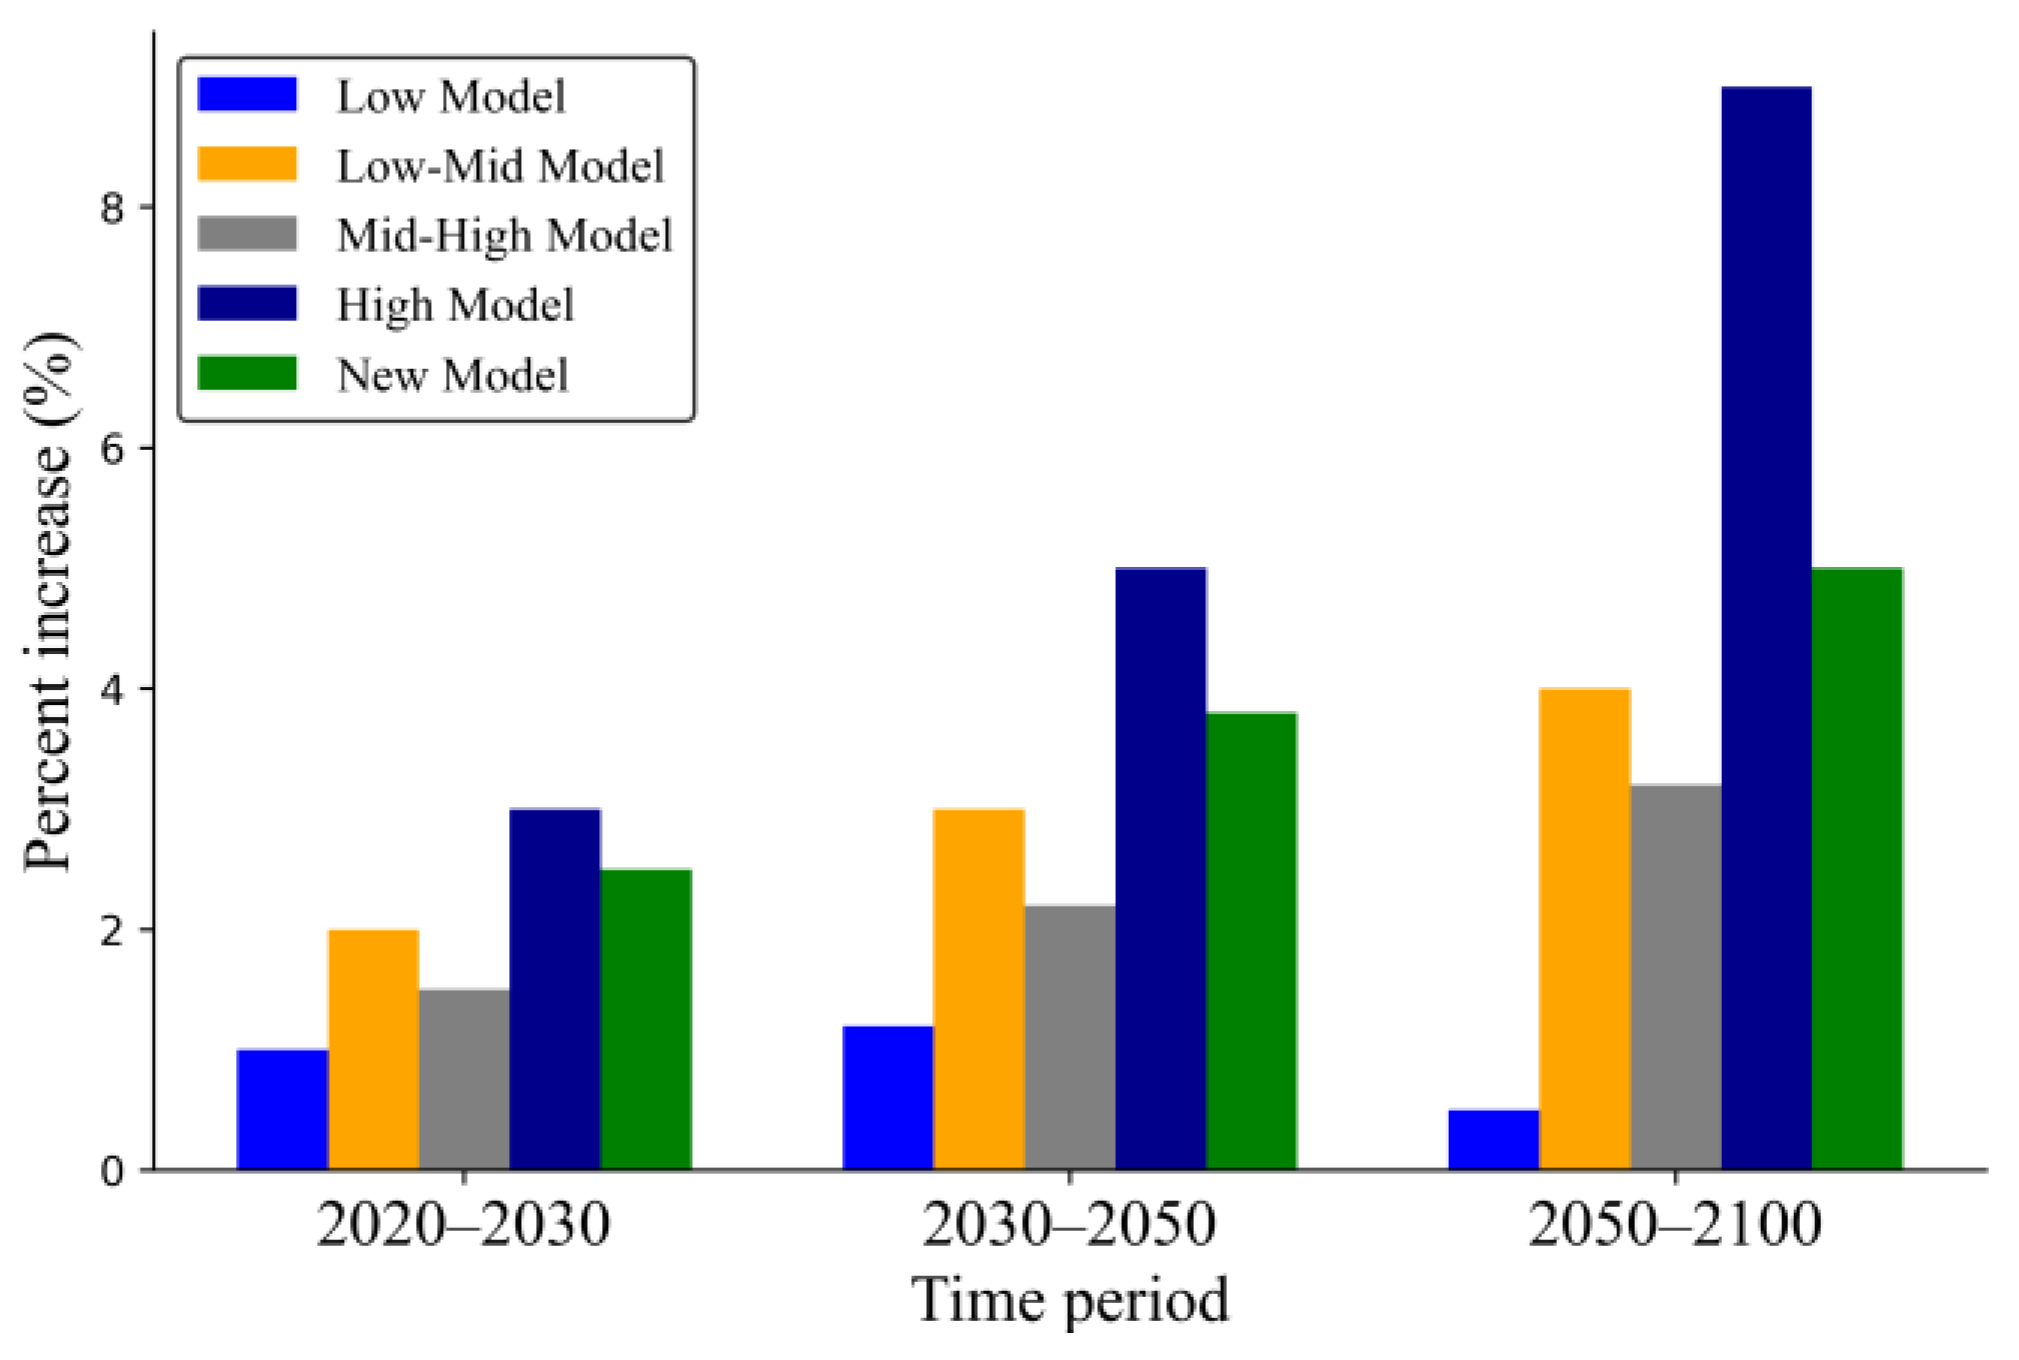
- Adaptive strategies, such as dynamic shading, reflective coatings, and optimized HVAC set points, are crucial in addressing climate change effects.
Author Contributions
Funding
Data Availability Statement
Acknowledgments
Conflicts of Interest
Appendix A
| Sampling Types | Method | Description | Advantages | Limitations | References |
|---|---|---|---|---|---|
| Screening method | Morris Method | Evaluates the effect of small perturbations in input factors to identify the most impactful factors. | Computationally efficient, suited for preliminary sensitivity analysis. | Generates only qualitative sensitivity rankings instead of precise quantitative measures. | [46,109] |
| Random sampling | Monte Carlo sampling (MCS) | Sampling from probability distributions assigned to input factors to generate multiple model simulations. | Easy to implement, provides reliable predictions when many samples are used. | Computationally expensive, needing numerous simulations for precise results. | [110] |
| Stratified sampling | Latin hypercube sampling (LHS) | Divides the input factor range into equal probability intervals and ensures that each interval is sampled once. | More efficient than MCS, leading to better coverage of input variability. | Computationally demanding, however, reduces variance compared to pure random sampling. | [111] |
| Quasi-random Sampling | Sobol’ sequences | Uses low-discrepancy sequences to assign sample points that are more evenly distributed than solely random methods. | Improves convergence rates compared to MCS, using fewer samples to provide more accurate sensitivity estimates. | Need careful observation to ensure proper distribution of sample points. | [112] |
| Variance-based method | Sobol’ sensitivity analysis | GSA method that decomposes the output variance to estimate contributions from each input and their interactions. | Provides detailed sensitivity indices, recording both first-order and higher-order effects. | Computationally intensive with a large number of simulations required. | [66] |
| Deterministic sampling | FAST (Fourier amplitude sensitivity test) | Uses Fourier transformations to quantify sensitivity indices based on spectral decomposition of model output variations. | Lower computational cost compared to Sobol’ analysis to achieve similar GS insights. | Less user-friendly for interpreting interaction effects compared to variance-based methods. | [113] |
| Plot Name | Description | Plots | Taken from |
|---|---|---|---|
| Scatter plots | Identify correlations and trends and conduct a preliminary analysis of input and output relationships. | 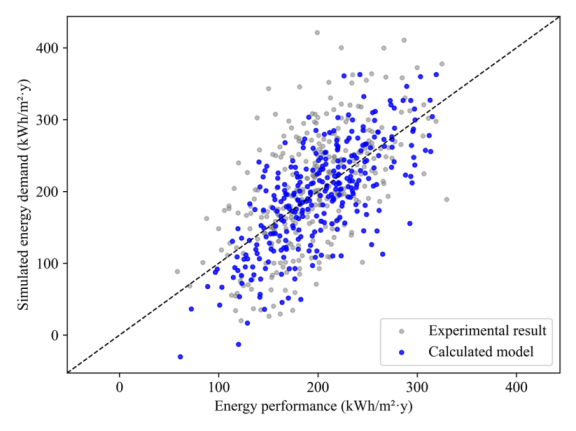 | [114] |
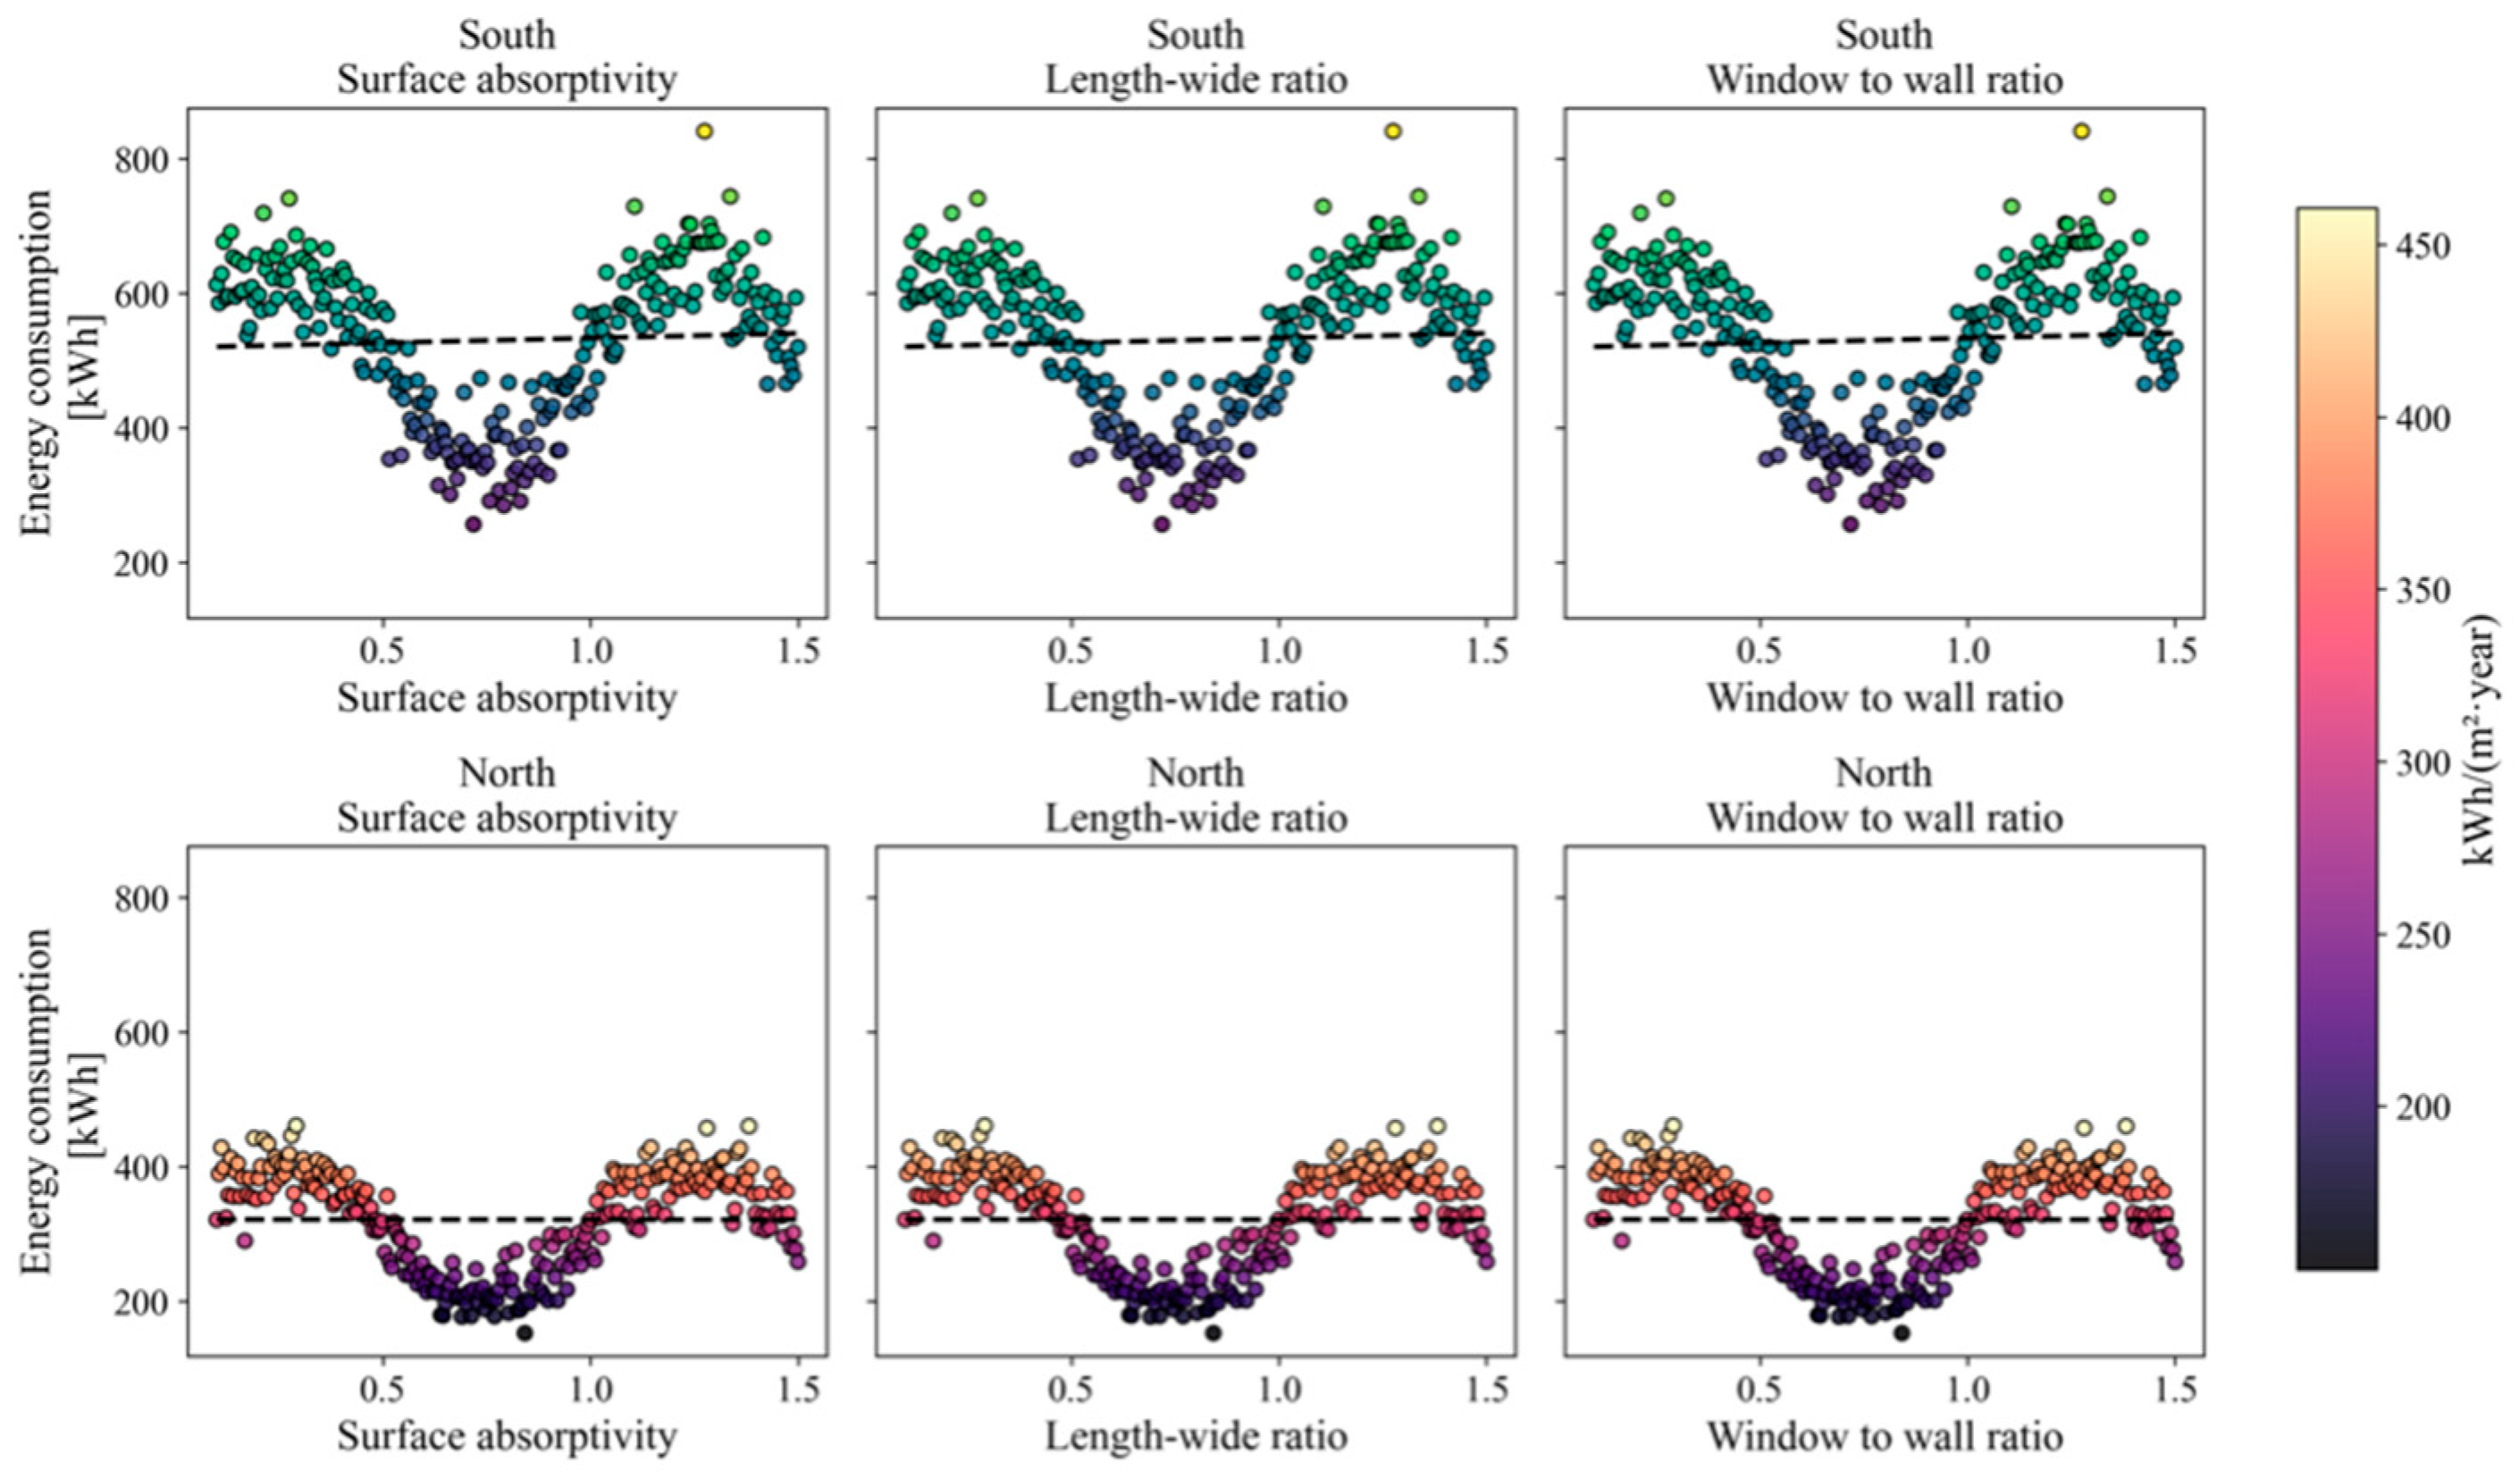
| Colored scatter plots | Visualize combined effects and interactions between parameters. |  | [115] |
| Bar plot | Presenting sensitivity indices with comparing relative importance of factors. | 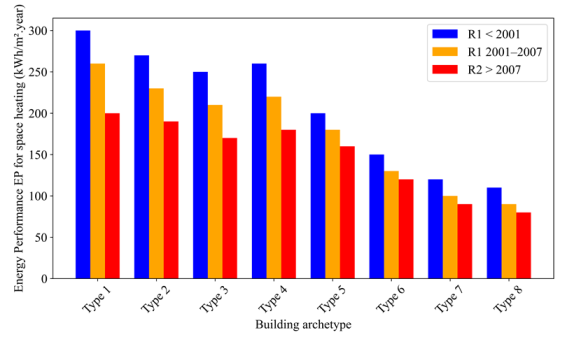 | [116] |
| Box plot | Helps to understand variability and uncertainty. | 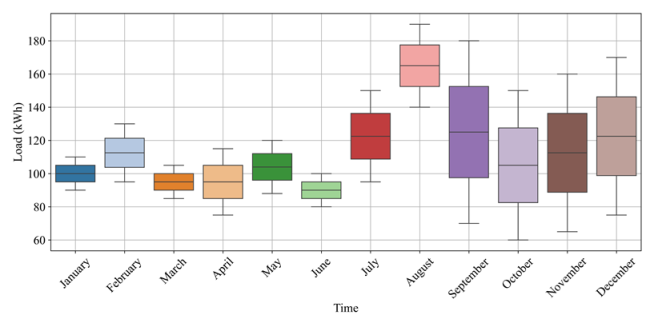 | [117] |
| Convergence plot | Ensures robustness of SA by assessing stability of sensitivity indices with sample size. |  | [118] |
| Radial convergence plot | Presents and compares sensitivity indices in a compact format. |  | [119] |
| Circos | Illustrates complex interactions in high-dimensional data. |  | [120] |
| Pattern plot | Identify patterns by summarizing multi-scenario analysis. |  | [86] |
References
- Saltelli, A.; Aleksankina, K.; Becker, W.; Fennell, P.; Ferretti, F.; Holst, N.; Li, S.; Wu, Q. Why so many published sensitivity analyses are false: A systematic review of sensitivity analysis practices. Environ. Model. Softw. 2019, 114, 29–39. [Google Scholar] [CrossRef]
- Figueiredo, A.; Silva, T.; Gonçalves, M.; Samagaio, A. Application of Novel Phase Change Material Constructive Solution for Thermal Regulation of Passive Solar Buildings. Buildings 2024, 14, 493. [Google Scholar] [CrossRef]
- Razavi, S.; Jakeman, A.; Saltelli, A.; Prieur, C.; Iooss, B.; Borgonovo, E.; Plischke, E.; Piano, S.L.; Iwanaga, T.; Becker, W.; et al. The Future of Sensitivity Analysis: An essential discipline for systems modeling and policy support. Environ. Model. Softw. 2021, 137, 104954. [Google Scholar] [CrossRef]
- Rabitz, H. Systems Analysis at the Molecular Scale. Science 1989, 246, 221–226. [Google Scholar] [CrossRef] [PubMed]
- Figueiredo, A.; Vicente, R.; Oliveira, R.; Rodrigues, F.; Samagaio, A. Multiscale Modelling Approach Targeting Optimisation of PCM into Constructive Solutions for Overheating Mitigation in Buildings. Appl. Sci. 2020, 10, 8009. [Google Scholar] [CrossRef]
- Ratto, M.; Tarantola, S.; Saltelli, A. Sensitivity Analysis in Model Calibration: GSA-GLUE Approach. Comput. Phys. Commun. 2001, 136, 212–224. [Google Scholar] [CrossRef]
- Hopfe, C.J.; Hensen, J.L.M. Uncertainty analysis in building performance simulation for design support. Energy Build. 2011, 43, 2798–2805. [Google Scholar] [CrossRef]
- Tian, W.; De Wilde, P. Uncertainty and sensitivity analysis of building performance using probabilistic climate projections: A UK case study. Autom. Constr. 2011, 20, 1096–1109. [Google Scholar] [CrossRef]
- Manke, J.M.; Hittle, D.C.; Hancock, C.E. Calibrating Building Energy Analysis Models Using Short Term Test Data; American Society of Mechanical Engineers: New York, NY, USA, 1996; Volume 536. [Google Scholar]
- Saltelli, A.; Tarantola, S.; Chan, K.P.S. A quantitative model-independent method for global sensitivity analysis of model output. Technometrics 1999, 41, 39–56. [Google Scholar] [CrossRef]
- Wei, T. A review of sensitivity analysis methods in building energy analysis. Renew. Sustain. Energy Rev. 2013, 20, 411–419. [Google Scholar]
- Pang, Z.; O’Neill, Z.; Li, Y.; Niu, F. The role of sensitivity analysis in the building performance analysis: A critical review. Energy Build. 2020, 209, 109659. [Google Scholar] [CrossRef]
- Mendes, V.F.; Cruz, A.S.; Gomes, A.P.; Mendes, J.C. A systematic review of methods for evaluating the thermal performance of buildings through energy simulations. Renew. Sustain. Energy Rev. 2024, 189, 113875. [Google Scholar] [CrossRef]
- Berardi, U.; Jafarpur, P. Assessing the impact of climate change on building heating and cooling energy demand in Canada. Renew. Sustain. Energy Rev. 2020, 121, 109681. [Google Scholar] [CrossRef]
- Bac, U.; Alaloosi, K.A.M.S.; Turhan, C. A comprehensive evaluation of the most suitable HVAC system for an industrial building by using a hybrid building energy simulation and multi criteria decision making framework. J. Build. Eng. 2021, 37, 102153. [Google Scholar] [CrossRef]
- Liu, S.; Kwok, Y.T.; Lau, K.K.L.; Ouyang, W.; Ng, E. Effectiveness of passive design strategies in responding to future climate change for residential buildings in hot and humid Hong Kong. Energy Build. 2020, 228. [Google Scholar] [CrossRef]
- Alghamdi, S.; Tang, W.; Kanjanabootra, S.; Alterman, D. Effect of Architectural Building Design Parameters on Thermal Comfort and Energy Consumption in Higher Education Buildings. Buildings 2022, 12, 329. [Google Scholar] [CrossRef]
- Vukadinović, A.; Radosavljević, J.; Đorđević, A.; Protić, M.; Petrović, N. Multi-objective optimization of energy performance for a detached residential building with a sunspace using the NSGA-II genetic algorithm. Solar Energy 2021, 224, 1426–1444. [Google Scholar] [CrossRef]
- Rupp, R.F.; Parkinson, T.; Kim, J.; Toftum, J.; de Dear, R. The impact of occupant’s thermal sensitivity on adaptive thermal comfort model. Build. Environ. 2022, 207, 108517. [Google Scholar] [CrossRef]
- Bravo Dias, J.; Carrilho da Graça, G.; Soares, P.M.M. Comparison of methodologies for generation of future weather data for building thermal energy simulation. Energy Build. 2020, 206, 109556. [Google Scholar] [CrossRef]
- Eriksson, M.; Akander, J.; Moshfegh, B. Development and validation of energy signature method—Case study on a multi-family building in Sweden before and after deep renovation. Energy Build. 2020, 210, 109756. [Google Scholar] [CrossRef]
- Prataviera, E.; Vivian, J.; Lombardo, G.; Zarrella, A. Evaluation of the impact of input uncertainty on urban building energy simulations using uncertainty and sensitivity analysis. Appl. Energy 2022, 311, 118691. [Google Scholar] [CrossRef]
- Gelesz, A.; Catto Lucchino, E.; Goia, F.; Serra, V.; Reith, A. Characteristics that matter in a climate façade: A sensitivity analysis with building energy simulation tools. Energy Build. 2020, 229, 110467. [Google Scholar] [CrossRef]
- Mukhamet, T.; Kobeyev, S.; Nadeem, A.; Memon, S.A. Ranking PCMs for building façade applications using multi-criteria decision-making tools combined with energy simulations. Energy 2021, 215, 119102. [Google Scholar] [CrossRef]
- William, M.A.; Suárez-López, M.J.; Soutullo, S.; Hanafy, A.A. Building envelopes toward energy-efficient buildings: A balanced multi-approach decision making. Int. J. Energy Res. 2021, 45, 21096–21113. [Google Scholar] [CrossRef]
- Westermann, P.; Welzel, M.; Evins, R. Using a deep temporal convolutional network as a building energy surrogate model that spans multiple climate zones. Appl. Energy 2020, 278, 115563. [Google Scholar] [CrossRef]
- Wang, S.; Yi, Y.K.; Liu, N. The ANN Architecture Analysis: A Case Study on Daylight, Visual, and Outdoor Thermal Metrics of Residential Buildings in China. Buildings 2023, 13, 2795. [Google Scholar] [CrossRef]
- Saryazdi, S.m.E.; Etemad, A.; Shafaat, A.; Bahman, A.M. Data-driven performance analysis of a residential building applying artificial neural network (ANN) and multi-objective genetic algorithm (GA). Build. Environ. 2022, 225, 109633. [Google Scholar] [CrossRef]
- Carlucci, S.; Causone, F.; Biandrate, S.; Ferrando, M.; Moazami, A.; Erba, S. On the impact of stochastic modeling of occupant behavior on the energy use of office buildings. Energy Build. 2021, 246, 111049. [Google Scholar] [CrossRef]
- Yu, H.; Wang, M.; Lin, X.; Guo, H.; Liu, H.; Zhao, Y.; Wang, H.; Li, C.; Jing, R. Prioritizing urban planning factors on community energy performance based on GIS-informed building energy modeling. Energy Build. 2021, 249, 111191. [Google Scholar] [CrossRef]
- Singh, M.M.; Deb, C.; Geyer, P. Early-stage design support combining machine learning and building information modelling. Autom. Constr. 2022, 136, 104147. [Google Scholar] [CrossRef]
- Zhu, L.; Zhang, J.; Gao, Y.; Tian, W.; Yan, Z.; Ye, X.; Sun, Y.; Wu, C. Uncertainty and sensitivity analysis of cooling and heating loads for building energy planning. J. Build. Eng. 2022, 45, 103440. [Google Scholar] [CrossRef]
- Maučec, D.; Premrov, M.; Leskovar, V.Ž. Use of sensitivity analysis for a determination of dominant design parameters affecting energy efficiency of timber buildings in different climates. Energy Sustain. Dev. 2021, 63, 86–102. [Google Scholar] [CrossRef]
- Pianosi, F.; Beven, K.; Freer, J.; Hall, J.W.; Rougier, J.; Stephenson, D.B.; Wagener, T. Sensitivity analysis of environmental models: A systematic review with practical workflow. Environ. Model. Softw. 2016, 79, 214–232. [Google Scholar] [CrossRef]
- Edwards, N.R.; Cameron, D.; Rougier, J. Precalibrating an intermediate complexity climate model. Clim. Dyn. 2011, 37, 1469–1482. [Google Scholar] [CrossRef]
- Yue, N.; Caini, M.; Li, L.; Zhao, Y.; Li, Y. A comparison of six metamodeling techniques applied to multi building performance vectors prediction on gymnasiums under multiple climate conditions. Appl. Energy 2023, 332, 120481. [Google Scholar] [CrossRef]
- Abokersh, M.H.; Spiekman, M.; Vijlbrief, O.; van Goch, T.A.J.; Vallès, M.; Boer, D. A real-time diagnostic tool for evaluating the thermal performance of nearly zero energy buildings. Appl. Energy 2021, 281, 116091. [Google Scholar] [CrossRef]
- Himmetoğlu, S.; Delice, Y.; Kızılkaya Aydoğan, E.; Uzal, B. Green building envelope designs in different climate and seismic zones: Multi-objective ANN-based genetic algorithm. Sustain. Energy Technol. Assess. 2022, 53, 102505. [Google Scholar] [CrossRef]
- Shi, D.; Gao, Y.; Zeng, P.; Li, B.; Shen, P.; Zhuang, C. Climate adaptive optimization of green roofs and natural night ventilation for lifespan energy performance improvement in office buildings. Build. Environ. 2022, 223, 109505. [Google Scholar] [CrossRef]
- Salimi, S.; Hammad, A. Sensitivity analysis of probabilistic occupancy prediction model using big data. Build. Environ. 2020, 172, 106729. [Google Scholar] [CrossRef]
- Zhao, C.; Zhang, L.; Zhang, Y. Exploring the effect of longwave radiation exchange on the energy balance of building façades in subtropical regions. Build. Environ. 2023, 233, 110096. [Google Scholar] [CrossRef]
- Olinger, M.S.; Melo, A.P.; Lamberts, R. Developing a surrogate model for naturally ventilated cellular offices in Brazil. Build. Environ. 2023, 233, 110075. [Google Scholar] [CrossRef]
- Amorim, R.P.L.; Melo, A.P.; Mantelli Neto, S.L.; Lamberts, R. Sky emissivity model calibration with data from Brazil and building simulation sensitivity analysis. Solar Energy 2023, 263, 111963. [Google Scholar] [CrossRef]
- Liu, X.; Polsky, Y.; Qian, D.; Mcdonald, J. An Analysis on Cost Reduction Potential of Vertical Bore Ground Heat Exchangers Used for Ground Source Heat Pump Systems. Proceedings 2019, 1, 1–15. [Google Scholar]
- Østergård, T.; Jensen, R.L.; Mikkelsen, F.S. The best way to perform building simulations? One-at-a-time optimization vs. Monte Carlo sampling. Energy Build. 2020, 208, 109628. [Google Scholar] [CrossRef]
- Benz, A.; Taraben, J.; Debus, P.; Habte, B.; Oppermann, L.; Hallermann, N.; Voelker, C.; Rodehorst, V.; Morgenthal, G. Framework for a UAS-based assessment of energy performance of buildings. Energy Build. 2021, 250, 111266. [Google Scholar] [CrossRef]
- Ozbalta, T.G.; Yildiz, Y.; Bayram, I.; Yilmaz, O.C. Energy performance analysis of a historical building using cost-optimal assessment. Energy Build. 2021, 250, 111301. [Google Scholar] [CrossRef]
- Zhong, F.; Chaudhry, H.N.; Calautit, J.K. Effect of roof cooling and air curtain gates on thermal and wind conditions in stadiums for hot climates. Energies 2021, 14, 3941. [Google Scholar] [CrossRef]
- Magni, M.; Ochs, F.; Streicher, W. Comprehensive analysis of the influence of different building modelling approaches on the results and computational time using a cross-compared model as a reference. Energy Build. 2022, 259, 111859. [Google Scholar] [CrossRef]
- Im, P.; Jackson, R.; Bae, Y.; Dong, J.; Cui, B. Probabilistic reliability assessment and case studies for predicted energy savings in residential buildings. Energy Build. 2020, 209, 109658. [Google Scholar] [CrossRef]
- Satola, D.; Houlihan-Wiberg, A.; Gustavsen, A. Global sensitivity analysis and optimisation of design parameters for low GHG emission lifecycle of multifamily buildings in India. Energy Build. 2022, 277, 112596. [Google Scholar] [CrossRef]
- Geraldi, M.S.; Gnecco, V.M.; Barzan Neto, A.; Martins, B.A.d.M.; Ghisi, E.; Fossati, M.; Melo, A.P.; Lamberts, R. Evaluating the impact of the shape of school reference buildings on bottom-up energy benchmarking. J. Build. Eng. 2021, 43, 103142. [Google Scholar] [CrossRef]
- Bugenings, L.A.; Schaffer, M.; Larsen, O.K.; Zhang, C. A novel solution for school renovations: Combining diffuse ceiling ventilation with double skin facade. J. Build. Eng. 2022, 49, 104026. [Google Scholar] [CrossRef]
- Goffart, J.; Woloszyn, M. EASI RBD-FAST: An efficient method of global sensitivity analysis for present and future challenges in building performance simulation. J. Build. Eng. 2021, 43, 103129. [Google Scholar] [CrossRef]
- Nik-Bakht, M.; Panizza, R.O.; Hudon, P.; Chassain, P.Y.; Bashari, M. Economy-energy trade off automation—A decision support system for building design development. J. Build. Eng. 2020, 30, 101222. [Google Scholar] [CrossRef]
- Alyakoob, A.; Hartono, S.; Johnson, T.; Middel, A. Estimating cooling loads of Arizona State University buildings using microclimate data and machine learning. J. Build. Eng. 2023, 64, 105705. [Google Scholar] [CrossRef]
- Zhan, J.; He, W.; Huang, J. Dual-objective building retrofit optimization under competing priorities using Artificial Neural Network. J. Build. Eng. 2023, 70, 106376. [Google Scholar] [CrossRef]
- Chaturvedi, S.; Rajasekar, E. Application of a probabilistic LHS-PAWN approach to assess building cooling energy demand uncertainties. Build. Simul. 2022, 15, 373–387. [Google Scholar] [CrossRef]
- Panizza, R.O.; Nik-Bakht, M. On the invariance of energy influential design parameters in a cold climate–a meta-level sensitivity analysis based on the energy, economy, and building characteristics. Adv. Build. Energy Res. 2022, 16, 466–488. [Google Scholar] [CrossRef]
- Kadir, K.; Mehdi Salehi Dezfouli, M.; Gabrielli, L.; Greta Ruggeri, A.; Scarpa, M. Roadmap to a Sustainable Energy System: Is Uncertainty a Major Barrier to Investments for Building Energy Retrofit Projects in Wide City Compartments? Energies 2023, 16, 4261. [Google Scholar] [CrossRef]
- Ibraheem, Y.; Piroozfar, P.; Farr, E.R.P.; Ravenscroft, N. Energy Production Analysis of Photovoltaic Shading Devices (PVSD) in Integrated Façade Systems (IFS). Front. Built Environ. 2020, 6, 81. [Google Scholar] [CrossRef]
- Saltelli, A.; Annoni, P.; Azzini, I.; Campolongo, F.; Ratto, M.; Tarantola, S. Variance based sensitivity analysis of model output. Design and estimator for the total sensitivity index. Comput. Phys. Commun. 2010, 181, 259–270. [Google Scholar] [CrossRef]
- Elhadad, S.; Orban, Z. A Sensitivity Analysis for Thermal Performance of Building Envelope Design Parameters. Sustainability 2021, 13, 14018. [Google Scholar] [CrossRef]
- Hamm, N.A.S.; Hall, J.W.; Anderson, M.G. Variance-based sensitivity analysis of the probability of hydrologically induced slope instability. Comput. Geosci. 2006, 32, 803–817. [Google Scholar] [CrossRef]
- Singh, R.; Buddhi, D.; Thapa, S.; Prakash, C.; Singh, R.; Sharma, A.; Sheoran, S.; Saxena, K.K. Sensitivity Analysis for Decisive Design Parameters for Energy and Indoor Visual Performances of a Glazed Façade Office Building. Sustainability 2022, 14, 14163. [Google Scholar] [CrossRef]
- Nouri, A.; van Treeck, C.; Frisch, J. Sensitivity Assessment of Building Energy Performance Simulations Using MARS Meta-Modeling in Combination with Sobol’ Method. Energies 2024, 17, 695. [Google Scholar] [CrossRef]
- Jans-Singh, M.; Ward, R.; Choudhary, R. Co-simulating a greenhouse in a building to quantify co-benefits of different coupled configurations. J. Build. Perform. Simul. 2021, 14, 247–276. [Google Scholar] [CrossRef]
- Prada, A.; Pernigotto, G.; Baggio, P.; Gasparella, A. Uncertainty propagation of material properties in energy simulation of existing residential buildings: The role of buildings features. Build. Simul. 2018, 11, 449–464. [Google Scholar] [CrossRef]
- Ibraheem, Y.; Piroozfar, P.A.E.; Farr, E.R.P.; Ravenscroft, N. Methodological evaluation of Integrated Façade Systems: Sensitivity analysis of net energy in a base-case model. Int. J. Build. Pathol. Adapt. 2020, 38, 107–126. [Google Scholar] [CrossRef]
- Hosamo, H.; Mazzetto, S. Performance Evaluation of Machine Learning Models for Predicting Energy Consumption and Occupant Dissatisfaction in Buildings. Buildings 2025, 15, 39. [Google Scholar] [CrossRef]
- Hopfe, C.J.; McLeod, R.S. Enhancing resilient community decision-making using building performance simulation. Build. Environ. 2021, 188, 107398. [Google Scholar] [CrossRef]
- Mejia-Solis, E.; Arias, J.; Palm, B. Simple solutions for improving thermal comfort in huts in the highlands of Peru. Heliyon 2023, 9, e19709. [Google Scholar] [CrossRef]
- Cozza, S.; Patel, M.K.; Chambers, J. Uncertainty in potential savings from improving energy label: A Monte Carlo study of the Swiss residential buildings. Energy Build. 2022, 271, 112333. [Google Scholar] [CrossRef]
- Pannier, M.L.; Recht, T.; Robillart, M.; Schalbart, P.; Peuportier, B.; Mora, L. Identifying optimal renovation schedules for building portfolios: Application in a social housing context under multi-year funding constraints. Energy Build. 2021, 250, 111290. [Google Scholar] [CrossRef]
- Alsharif, R.; Arashpour, M.; Golafshani, E.M.; Hosseini, M.R.; Chang, V.; Zhou, J. Machine learning-based analysis of occupant-centric aspects: Critical elements in the energy consumption of residential buildings. J. Build. Eng. 2022, 46, 103846. [Google Scholar] [CrossRef]
- Yang, S.; Tian, W.; Cubi, E.; Meng, Q.; Liu, Y.; Wei, L. Comparison of Sensitivity Analysis Methods in Building Energy Assessment. Procedia Eng. 2016, 146, 174–181. [Google Scholar] [CrossRef]
- Asadi, S.; Amiri, S.S.; Mottahedi, M. On the development of multi-linear regression analysis to assess energy consumption in the early stages of building design. Energy Build. 2014, 85, 246–255. [Google Scholar] [CrossRef]
- Kelleher, C.; Wagener, T. Ten guidelines for effective data visualization in scientific publications. Environ. Model. Softw. 2011, 26, 822–827. [Google Scholar] [CrossRef]
- Zhu, D.; Hong, T.; Yan, D.; Wang, C. A detailed loads comparison of three building energy modeling programs: EnergyPlus, DeST and DOE-2.1E. Build. Simul. 2013, 6, 323–335. [Google Scholar] [CrossRef]
- Crawley, D.B.; Lawrie, L.K.; Winkelmann, F.C.; Buhl, W.F.; Huang, Y.J.; Pedersen, C.O.; Strand, R.K.; Liesen, R.J.; Fisher, D.E.; Witte, M.J.; et al. EnergyPlus: Creating a new-generation building energy simulation program. Energy Build. 2001, 33, 319–331. [Google Scholar] [CrossRef]
- Wijesuriya, S.; Kishore, R.A.; Mitchell, M.; Booten, C. Enhancing EnergyPlus capabilities to model dynamic building envelopes using python plugin. Energy Build. 2025, 339, 115776. [Google Scholar] [CrossRef]
- Meiers, J.; Frey, G. Interfacing TRNSYS with MATLAB for Building Energy System Optimization. Energies 2025, 18, 255. [Google Scholar] [CrossRef]
- Del Ama Gonzalo, F.; Moreno Santamaría, B.; Montero Burgos, M.J. Assessment of Building Energy Simulation Tools to Predict Heating and Cooling Energy Consumption at Early Design Stages. Sustainability 2023, 15, 1920. [Google Scholar] [CrossRef]
- Vera-Piazzini, O.; Scarpa, M.; Peron, F. Building Energy Simulation and Monitoring: A Review of Graphical Data Representation. Energies 2023, 16, 390. [Google Scholar] [CrossRef]
- Villano, F.; Mauro, G.M.; Pedace, A. A Review on Machine/Deep Learning Techniques Applied to Building Energy Simulation, Optimization and Management. Thermo 2024, 4, 100–139. [Google Scholar] [CrossRef]
- Xuanyuan, P.; Zhang, Y.; Yao, J.; Zheng, R. Sensitivity Analysis and Optimization of Energy-Saving Measures for Office Building in Hot Summer and Cold Winter Regions. Energies 2024, 17, 1675. [Google Scholar] [CrossRef]
- Bourdeau, M. Assessment of the Performances of Building Energy Retrofit Using Sensor Networks for the Monitoring of Energy Consumption and Usages. Ph.D. Thesis, Université Gustave Eiffel, Champs-sur-Marne, France, 2022. [Google Scholar]
- Delgarm, N.; Sajadi, B.; Azarbad, K.; Delgarm, S. Sensitivity analysis of building energy performance: A simulation-based approach using OFAT and variance-based sensitivity analysis methods. J. Build. Eng. 2018, 15, 181–193. [Google Scholar] [CrossRef]
- Coakley, D.; Raftery, P.; Keane, M. A review of methods to match building energy simulation models to measured data. Renew. Sustain. Energy Rev. 2014, 37, 123–141. [Google Scholar] [CrossRef]
- Figueiredo, A.; Kämpf, J.; Vicente, R.; Oliveira, R.; Silva, T. Comparison between monitored and simulated data using evolutionary algorithms: Reducing the performance gap in dynamic building simulation. J. Build. Eng. 2018, 17, 96–106. [Google Scholar] [CrossRef]
- Segarra, E.L.; Ruiz, G.R.; González, V.G.; Peppas, A.; Bandera, C.F. Impact assessment for building energy models using observed vs. third-party weather data sets. Sustainability 2020, 12, 6788. [Google Scholar] [CrossRef]
- ANSI/ASHRAE Standard 90.1-2019; Energy Standard for Buildings Except Low-Rise Residential Buildings. American Society of Heating, Refrigerating and Air-Conditioning Engineers: Atlanta, GA, USA, 2019.
- Gorzalka, P.; Schmiedt, J.E.; Schorn, C.; Hoffschmidt, B. Automated Generation of an Energy Simulation Model for an Existing Building from UAV Imagery. Buildings 2021, 11, 380. [Google Scholar] [CrossRef]
- Carratt, A.; Kokogiannakis, G.; Daly, D. Development and performance evaluation of a minimum input model calibration methodology for residential buildings. J. Build. Perform. Simul. 2023, 16, 680–704. [Google Scholar] [CrossRef]
- Roka, R.B.; de Figueiredo, A.J.P.; Vieira, A.M.C.P.; Cardoso, J.C. de P. A systematic review on shallow geothermal energy system: A light into six major barriers. Soils Rocks 2023, 46, e2023007622. [Google Scholar] [CrossRef]
- ANSI/ASHRAE Standard 169-2020; Climatic Data For Building Design Standards. ASHRAE Standing Standard Project Committee: Atlanta, GA, USA, 2021.
- Inprom, N.; Jareemit, D. Efficient envelope designs to maximize cooling energy savings in housing complexes in Bangkok neighborhoods. Nakhara: J. Environ. Des. Plan. 2021, 20, 103. [Google Scholar]
- Ren, H.; Wang, S. GPPre: A Python-Based Tool in Grasshopper for Office Building Performance Optimization. J. Harbin Inst. Technol. 2021, 28, 47–60. [Google Scholar]
- Akkose, G.; Meral Akgul, C.; Dino, I.G. Educational building retrofit under climate change and urban heat island effect. J. Build. Eng. 2021, 40. [Google Scholar] [CrossRef]
- Liu, C.; Ma, W.; Hao, J.; Luo, D.; Zuo, J.; Zhang, C. Energy Retrofitting Assessment of Public Building Envelopes in China’s Hot Summer and Cold Winter Climate Region. Buildings 2022, 12, 1866. [Google Scholar] [CrossRef]
- Ahn, J.; Haberl, J.S.; And, Ã. Origins of whole-building energy simulations for high-performance commercial buildings: Contributions of the 1968 and 1971 ASHRAE algorithms for weighting factor-based hourly heating and cooling load calculations. Sci. Technol. Built Environ. 2025, 31, 312–326. [Google Scholar] [CrossRef]
- Schünemann, C.; Schiela, D.; Ortlepp, R. Guidelines to calibrate a multi-residential building simulation model addressing overheating evaluation and residents’ influence. Buildings 2021, 11, 242. [Google Scholar] [CrossRef]
- Ono, E.; Tekler, Z.D.; Lam, K.P.; Jin, Y.; Yan, D.; Chong, A. Evaluating the sensitivity and robustness of occupancy models for building energy simulation during design. Build. Environ. 2024, 261, 111739. [Google Scholar] [CrossRef]
- Lu, W. Dynamic Shading and Glazing Technologies: Improve Energy, Visual, and Thermal Performance. Energy Built Environ. 2024, 5, 211–229. [Google Scholar] [CrossRef]
- Yuan, J.; Jiao, Z.; Chai, J.; Farnham, C.; Emura, K. Reflective coatings: Enhancing building performance and sustainability. Nano-Struct. Nano-Objects 2024, 39, 101296. [Google Scholar] [CrossRef]
- Zhai, Z.J.; Helman, J.M. Implications of climate changes to building energy and design. Sustain. Cities Soc. 2019, 44, 511–519. [Google Scholar] [CrossRef]
- Ecevit, A.; Akinoglu, B.G.; Aksoy, B. Generation of a typical meteorological year using sunshine duration data. Energy 2002, 27, 947–954. [Google Scholar] [CrossRef]
- Rady, M.; Muhammad, M.K.I.; Shahid, S. Evolving typical meteorological year (TMY) data for building energy simulation: A comprehensive review of methods, challenges, and future directions. Adv. Build. Energy Res. 2025, 19, 1–31. [Google Scholar] [CrossRef]
- Tajuddeen, I.; Rodrigues, E. A Morris sensitivity analysis of an office building’s thermal design parameters under climate change in sub-Saharan Africa. Build. Environ. 2024, 262, 111771. [Google Scholar] [CrossRef]
- Tahmasebinia, F.; Jiang, R.; Sepasgozar, S.; Wei, J.; Ding, Y.; Ma, H. Implementation of BIM Energy Analysis and Monte Carlo Simulation for Estimating Building Energy Performance Based on Regression Approach: A Case Study. Buildings 2022, 12, 449. [Google Scholar] [CrossRef]
- Choi, Y.; Song, D.; Yoon, S.; Koo, J. Comparison of Factorial and Latin Hypercube Sampling Designs for Meta-Models of Building Heating and Cooling Loads. Energies 2021, 14, 512. [Google Scholar] [CrossRef]
- Praks, P.; Brkić, D. Approximate Flow Friction Factor: Estimation of the Accuracy Using Sobol’s Quasi-Random Sampling. Axioms 2022, 11, 36. [Google Scholar] [CrossRef]
- Chen, C.; Wang, M.Y.; Shen, C.; Huang, Y.; Zhu, M.; Wang, H.; He, L.; Julien, D.B. Sensitivity Analysis of Factors Influencing Rural Housing Energy Consumption in Different Household Patterns in the Zhejiang Province. Buildings 2023, 13, 463. [Google Scholar] [CrossRef]
- Kureshi, R.R.; Mishra, B.K.; Thakker, D.; John, R.; Walker, A.; Simpson, S.; Thakkar, N.; Wante, A.K. Data-Driven Techniques for Low-Cost Sensor Selection and Calibration for the Use Case of Air Quality Monitoring. Sensors 2022, 22, 1093. [Google Scholar] [CrossRef]
- Zhu, S.; Ma, C.; Wu, Z.; Huang, Y.; Liu, X. Exploring the Impact of Urban Morphology on Building Energy Consumption and Outdoor Comfort: A Comparative Study in Hot-Humid Climates. Buildings 2024, 14, 1381. [Google Scholar] [CrossRef]
- Mauro, M.; Mach, A.; Parra, M.; Teamah, H. Post-Occupancy Evaluation of a Passive Multi-Unit Residential Building and a Single-Family Passive House. Sustainability 2025, 17, 3799. [Google Scholar] [CrossRef]
- Xie, Z.; Wang, X.; Zheng, L.; Chang, H.; Wang, F. A Period-Based Neural Network Algorithm for Predicting Building Energy Consumption of District Heating. Energies 2022, 15, 6338. [Google Scholar] [CrossRef]
- Wang, H.; Wen, W.; Zhang, Z.; Gao, N. Construction of Building Energy Consumption Prediction Model Based on Multi-Optimization Model. Buildings 2023, 13, 1677. [Google Scholar] [CrossRef]
- Sobol, I.M. Global sensitivity indices for nonlinear mathematical models and their Monte Carlo estimates. Math. Comput. Simul. 2001, 55, 271–280. [Google Scholar] [CrossRef]
- Sorooshnia, E.; Rahnamayiezekavat, P.; Rashidi, M.; Sadeghi, M.; Samali, B. Passive Intelligent Kinetic External Dynamic Shade Design for Improving Indoor Comfort and Minimizing Energy Consumption. Buildings 2023, 13, 1090. [Google Scholar] [CrossRef]
| Pos | References | Year of Publication | Number of Citations | Pos | References | Year of Publication | Number of Citations | ||
|---|---|---|---|---|---|---|---|---|---|
| Scopus | WoS | Scopus | WoS | ||||||
| 1 | [14] | 2020 | 195 | 171 | 11 | [15] | 2021 | 36 | 34 |
| 2 | [16] | 2020 | 91 | 82 | 12 | [17] | 2022 | 35 | 29 |
| 3 | [18] | 2021 | 87 | 41 | 13 | [19] | 2022 | 34 | 27 |
| 4 | [20] | 2020 | 48 | 43 | 14 | [21] | 2020 | 28 | 23 |
| 5 | [22] | 2022 | 47 | 37 | 15 | [23] | 2020 | 27 | 23 |
| 6 | [24] | 2021 | 45 | 43 | 16 | [25] | 2021 | 26 | 25 |
| 7 | [26] | 2020 | 44 | 35 | 17 | [27] | 2023 | 25 | 23 |
| 8 | [28] | 2022 | 40 | 33 | 18 | [29] | 2021 | 24 | 19 |
| 9 | [30] | 2021 | 38 | 36 | 19 | [31] | 2022 | 21 | 19 |
| 10 | [32] | 2022 | 37 | 34 | 20 | [33] | 2021 | 20 | 17 |
| Nos | Climate Databases and Simulated Data | References |
|---|---|---|
| 1 | Copenhagen IWEC (International Weather for Energy Calculations) | [29] |
| 2 | Chinese standard weather data (CSWD) | [32] |
| 3 | The climate data are based on the international weather measurements for energy calculations (IWEC2.0) maintained by the National Climatic Data Centre. | [36,51,61] |
| 4 | French building energy regulation (RT2012), created from observed data over the period 1994–2008. | [74] |
| 5 | The first is the CWEC, which is developed using statistical criteriafrom the Canadian Weather Energy and Engineering Datasets (CWEEDS). | [14] |
| 6 | Local to regional database with the experience of 30 years of measurements. | [97] |
| 7 | Weather file obtained from the database for the city of São Paulo, from years 1988–2021. | [42] |
| 8 | Generated according to “Climate Design Data 2009 ASHRAE Handbook” from a period of 30 years of historical data. | [55] |
| 9 | Bangkok weather data | [97] |
| 10 | Simulated deterministically using TMY weather data, the Indian Meteorological Department to develop yearly simulation weather files. | [58] |
| 11 | A microclimate model ENVI-met generated the input micro-scale weather data. | [56] |
| 12 | The information on the weather and the climate data is included in the CDWN weather file. | [98] |
| Input Parameters | Common Input Factors |
|---|---|
| Building envelope | Wall and roof insulation, window type, and glazing, including its U-value and solar heat gain coefficient (SHGC), and window-to-wall ratio (WWR) |
| Building orientation | Orientation, shape, and size |
| Internal loads | Occupancy density, lightening loads, and appliance and equipment loads |
| HVAC systems | Systems’ efficiency, set point temperatures, and ventilation rates |
| Thermal mass | Building materials |
| Renewable energy | Photovoltaic panels, solar hot water systems, and shallow geothermal systems |
| Infiltration | Air leakage rates |
| Operational schedules | Occupancy schedules and systems schedules |
Disclaimer/Publisher’s Note: The statements, opinions and data contained in all publications are solely those of the individual author(s) and contributor(s) and not of MDPI and/or the editor(s). MDPI and/or the editor(s) disclaim responsibility for any injury to people or property resulting from any ideas, methods, instructions or products referred to in the content. |
© 2025 by the authors. Licensee MDPI, Basel, Switzerland. This article is an open access article distributed under the terms and conditions of the Creative Commons Attribution (CC BY) license (https://creativecommons.org/licenses/by/4.0/).
Share and Cite
Roka, R.; Figueiredo, A.; Vieira, A.; Cardoso, C. A Systematic Review of Sensitivity Analysis in Building Energy Modeling: Key Factors Influencing Building Thermal Energy Performance. Energies 2025, 18, 2375. https://doi.org/10.3390/en18092375
Roka R, Figueiredo A, Vieira A, Cardoso C. A Systematic Review of Sensitivity Analysis in Building Energy Modeling: Key Factors Influencing Building Thermal Energy Performance. Energies. 2025; 18(9):2375. https://doi.org/10.3390/en18092375
Chicago/Turabian StyleRoka, Rajendra, António Figueiredo, Ana Vieira, and Claudino Cardoso. 2025. "A Systematic Review of Sensitivity Analysis in Building Energy Modeling: Key Factors Influencing Building Thermal Energy Performance" Energies 18, no. 9: 2375. https://doi.org/10.3390/en18092375
APA StyleRoka, R., Figueiredo, A., Vieira, A., & Cardoso, C. (2025). A Systematic Review of Sensitivity Analysis in Building Energy Modeling: Key Factors Influencing Building Thermal Energy Performance. Energies, 18(9), 2375. https://doi.org/10.3390/en18092375