Article

Evaporative Condensation Air-Conditioning Unit with Microchannel Heat Exchanger: An Experimental Study

1
School of Urban Planning and Municipal Engineering, Xi’an Polytechnic University, Xi’an 710048, China
2
State Key Laboratory of Building Safety and Built Environment, Beijing 100013, China
3
College of Environment and Chemical Engineering, Yanshan University, Qinhuangdao 066004, China
4
LUE-ON (Jiangsu) Environmental System Co., Ltd., Taizhou 225400, China
*
Author to whom correspondence should be addressed.
Energies 2025, 18(9), 2356; https://doi.org/10.3390/en18092356
Submission received: 23 March 2025 / Revised: 1 May 2025 / Accepted: 2 May 2025 / Published: 5 May 2025
(This article belongs to the Special Issue Advanced Heating and Cooling Technologies for Sustainable Buildings)

Abstract

:
A new evaporative condensation refrigerant pump heat pipe air-conditioning unit based on a microchannel heat pipe heat exchanger is proposed. Performance experiments were conducted on the unit, and the experimental results show that the cooling capacity of the unit in the dry, wet, and mixed modes can reach 112.1, 105.8, and 115.4 kW, respectively, the optimal airflow ratio of the secondary/primary airflow is 2.2, 1.8, and 1.8, respectively, and the EER decreases with increasing airflow ratio. With increasing dry- and wet-bulb temperatures of the secondary-side inlet air, the cooling capacity and energy efficiency ratio of the unit decrease, and the energy efficiency ratio in the wet mode is higher than that in the dry mode, which can prolong the operating hours of the wet mode within the operating temperature range of the dry mode and improve the energy efficiency of the unit. A new calculation method for the refrigerant charge is proposed, and the optimal refrigerant charge is 32 kg based on the experimental results, which agrees with the theoretical calculation results.

1. Introduction

Over the past five years, China’s data center energy consumption has rapidly increased at a rate of more than 10% per year, and the power consumption of data centers in 2021 was approximately 94 billion kW-h [1], accounting for 2.7% of the total electricity consumption of society as a whole. IT equipment in data centers accounts for approximately 45% of the total energy consumption, refrigeration and air-conditioning systems account for approximately 40% of the total energy consumption, and other facilities account for approximately 15% of the total energy consumption. The use of refrigeration and air-conditioning systems is the main reason for the data center’s current high energy consumption, which can be resolved by reducing the energy consumption of air-conditioning systems in data centers and improving the overall efficiency of these systems. The temperature in data centers, after absorbing the heat produced by chips from the air, usually ranges from 35 ~ 38 °C, and during most of the year, the outdoor environment exhibits a temperature difference of 10~25 °C because the use of natural cold sources involves a large development space. In recent years, evaporative cooling technology, liquid-cooling technology, and refrigerant pump heat pipe technology have gradually been adopted. Heat pipe technology fully utilizes the principle of heat conduction, provides the advantages of rapid heat transfer and low heat loss [2], and can be combined with microchannel heat exchangers and evaporative condensation and other technologies to effectively improve the heat transfer efficiency of heat pipe systems to extend the use of natural cold sources over time.
Liu Chenpeng et al. [3] applied a large-area low-temperature loop heat pipe for the heat dissipation of an optical telescope, which demonstrated the practical feasibility of applying loop heat pipes on a large scale in engineering. By applying a heat pipe system in the field of data center engineering, GY Ma et al. [4] investigated the operational performance of a refrigerant pump-driven loop heat pipe at a small data center, and the results showed that the EER varied with the change in the outdoor temperature, while the refrigerant pump heat pipe system could satisfy the heat load at an outdoor temperature lower than 15 °C, realizing a minimum energy-saving effect of 36.57%. Jiankai Dong et al. [5] studied a refrigeration system combining a refrigerant pump two-phase delivery cycle and vapor compression, which significantly improved the energy efficiency relative to the traditional system but was greatly affected by the ambient outdoor temperature; at ambient temperatures of 3.2 and 12.0 °C, 80% and 50% of the design value, respectively, could be obtained. Yan Gang [6] coupled a vapor compression refrigeration system with a refrigerant pump system and investigated the effect of various switching temperature points between different operating conditions on the overall system energy efficiency, with a suitable changeover temperature of −5 °C. Shuailing Liu et al. [7] proposed a loop heat pipe heat recovery system driven by a refrigerant pump and investigated the effect of three operating modes in winter and summer, with suitable changeover temperatures of −4 and −5 °C, respectively. The heat transfer characteristics in the three operating modes in winter and summer were investigated. The results showed that the pump-driven loop heat pipe mode attained the highest efficiency under year-round conditions. F Chen [8] compared a refrigerant pump air conditioner, a chiller unit, and a gravity heat pipe dual-cycle air conditioner and found that the annual operating time of the gravity heat pipe dual-cycle air conditioner was 50.8% longer than that of the refrigerant pump air conditioner. The gravity heat pipe dual-cycle air conditioner could achieve energy savings of approximately 34% relative to the chiller unit.
Refrigerant pumps are used as power drive devices in separated heat pipe systems, which can overcome the limitations of heat pipe system arrangement sites and application scenarios. Shuailing Liu et al. proposed a loop heat pipe heat recovery system driven by refrigerant pumps and investigated the heat transfer characteristics under three operating modes in winter and summer. The results showed that the pump-driven loop heat pipe mode provided the highest temperature efficiency under year-round conditions [7]. The heat exchanger of the refrigeration system uses a microchannel heat exchanger, which provides the advantages of high heat transfer efficiency and low charge work mass. MM Ohadi et al. applied a new microchannel-powered heat pipe refrigeration system to a data center and evaluated its performance via a comparison with the traditional compressor system, and the experimental results showed that it could greatly reduce the power consumption of the system [9]. Aibo Wei et al. used ANSYS software to simulate the heat transfer process of an Ω-shaped microchannel heat exchanger used in gravity-separated heat pipe systems [10]. The use of a microchannel heat exchanger can facilitate large-distance heat transfer by the heat pipe system at the cost of a very small temperature difference [10]. A heat pipe system combined with evaporative condensation technology fully extends the utilization of natural cooling sources. Z Han proposed a combined air-conditioning system in which the air velocity of the condenser and the operating frequency of the refrigerant pump could be adjusted, and it was found that evaporative condensation effectively extended the operating range of the heat pipe mode and increased the upper limit of the outdoor temperature from 8 to 15 °C [11].
Ma Yuezheng [12] examined a refrigerant pump-driven evaporative condensation composite refrigeration system, and the results showed that the system energy efficiency ratio was highest at an outdoor temperature of 15 °C and an air velocity of 1 m/s, and the optimal temperature switching point between the two operating modes was experimentally obtained. Lin Yucong [13] designed and conducted experiments with a refrigerant pump pressurized air-conditioning system, and the results showed that the use of a refrigerant pump pressurized air-conditioning system could achieve 100% refrigeration at working temperatures ranging from −5 to 25 °C to meet the operating requirements of computer room air-conditioning. Xue Lianzheng [14] applied an air pump-driven refrigeration air-conditioning unit to a data center in Beijing. The experiment revealed that, with increasing indoor/outdoor temperature difference, the unit heat transfer volume increased, the air pump operating power decreased, and the annual energy saving rate reached 25.78%. BaiKaiyang et al. [15] coupled a plate heat exchanger with mechanical refrigeration, yielding a refrigerant pump-driven circuit heat pipe, which had three modes, and the highest energy-saving rate of up to 49.4% was attained in different regions of China. Liu Zhenyu [16] designed an experimental prototype by combining evaporative condensation, evaporative cooling, and mechanical refrigeration technologies and conducted experiments and energy consumption analysis tests of each functional section, proving that the annual power saving rate of this unit could reach 51.4%.
Summarizing the above literature, we can find that there have been explorations and engineering applications of refrigerant pump heat pipe air-conditioning systems in the field of data centers; however, there are still problems that must be solved, such as an excessive volume, low efficiency, and the determination of the optimal refrigerant charge.
For this reason, we proposed a new evaporative condensation and microchannel refrigerant pump heat pipe-coupled refrigeration system for data centers, which improved the heat transfer performance of the heat pipe through the use of a microchannel heat exchanger, and we combined it with high-efficiency evaporative condensation cooling technology to improve the heat transfer efficiency of the unit. This approach can not only extend the use of natural cooling sources but also reduce the system footprint space through the integration of these two systems.

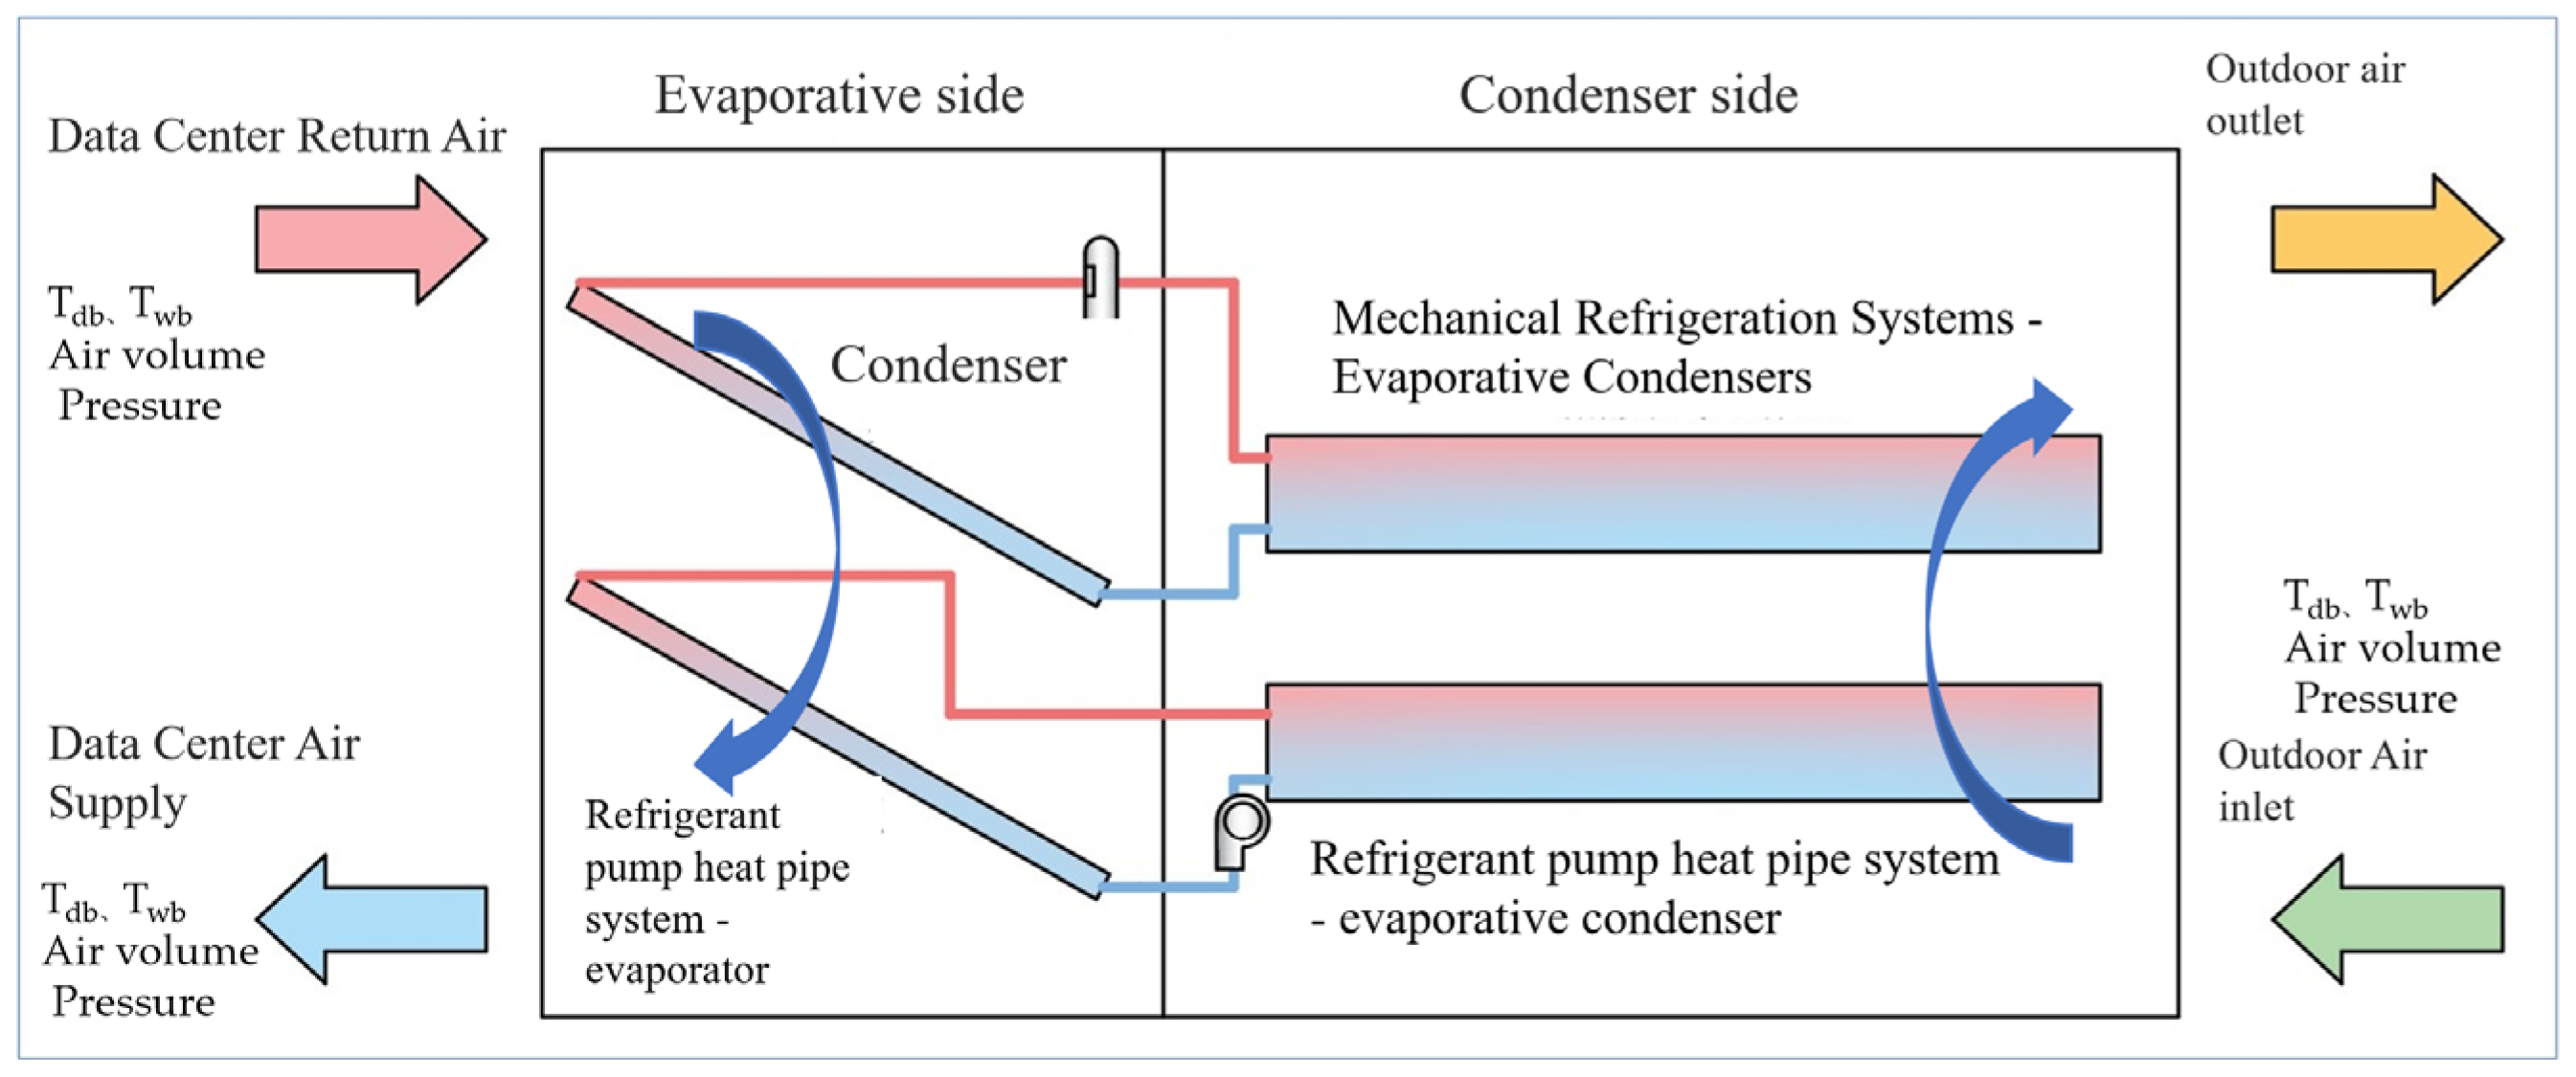
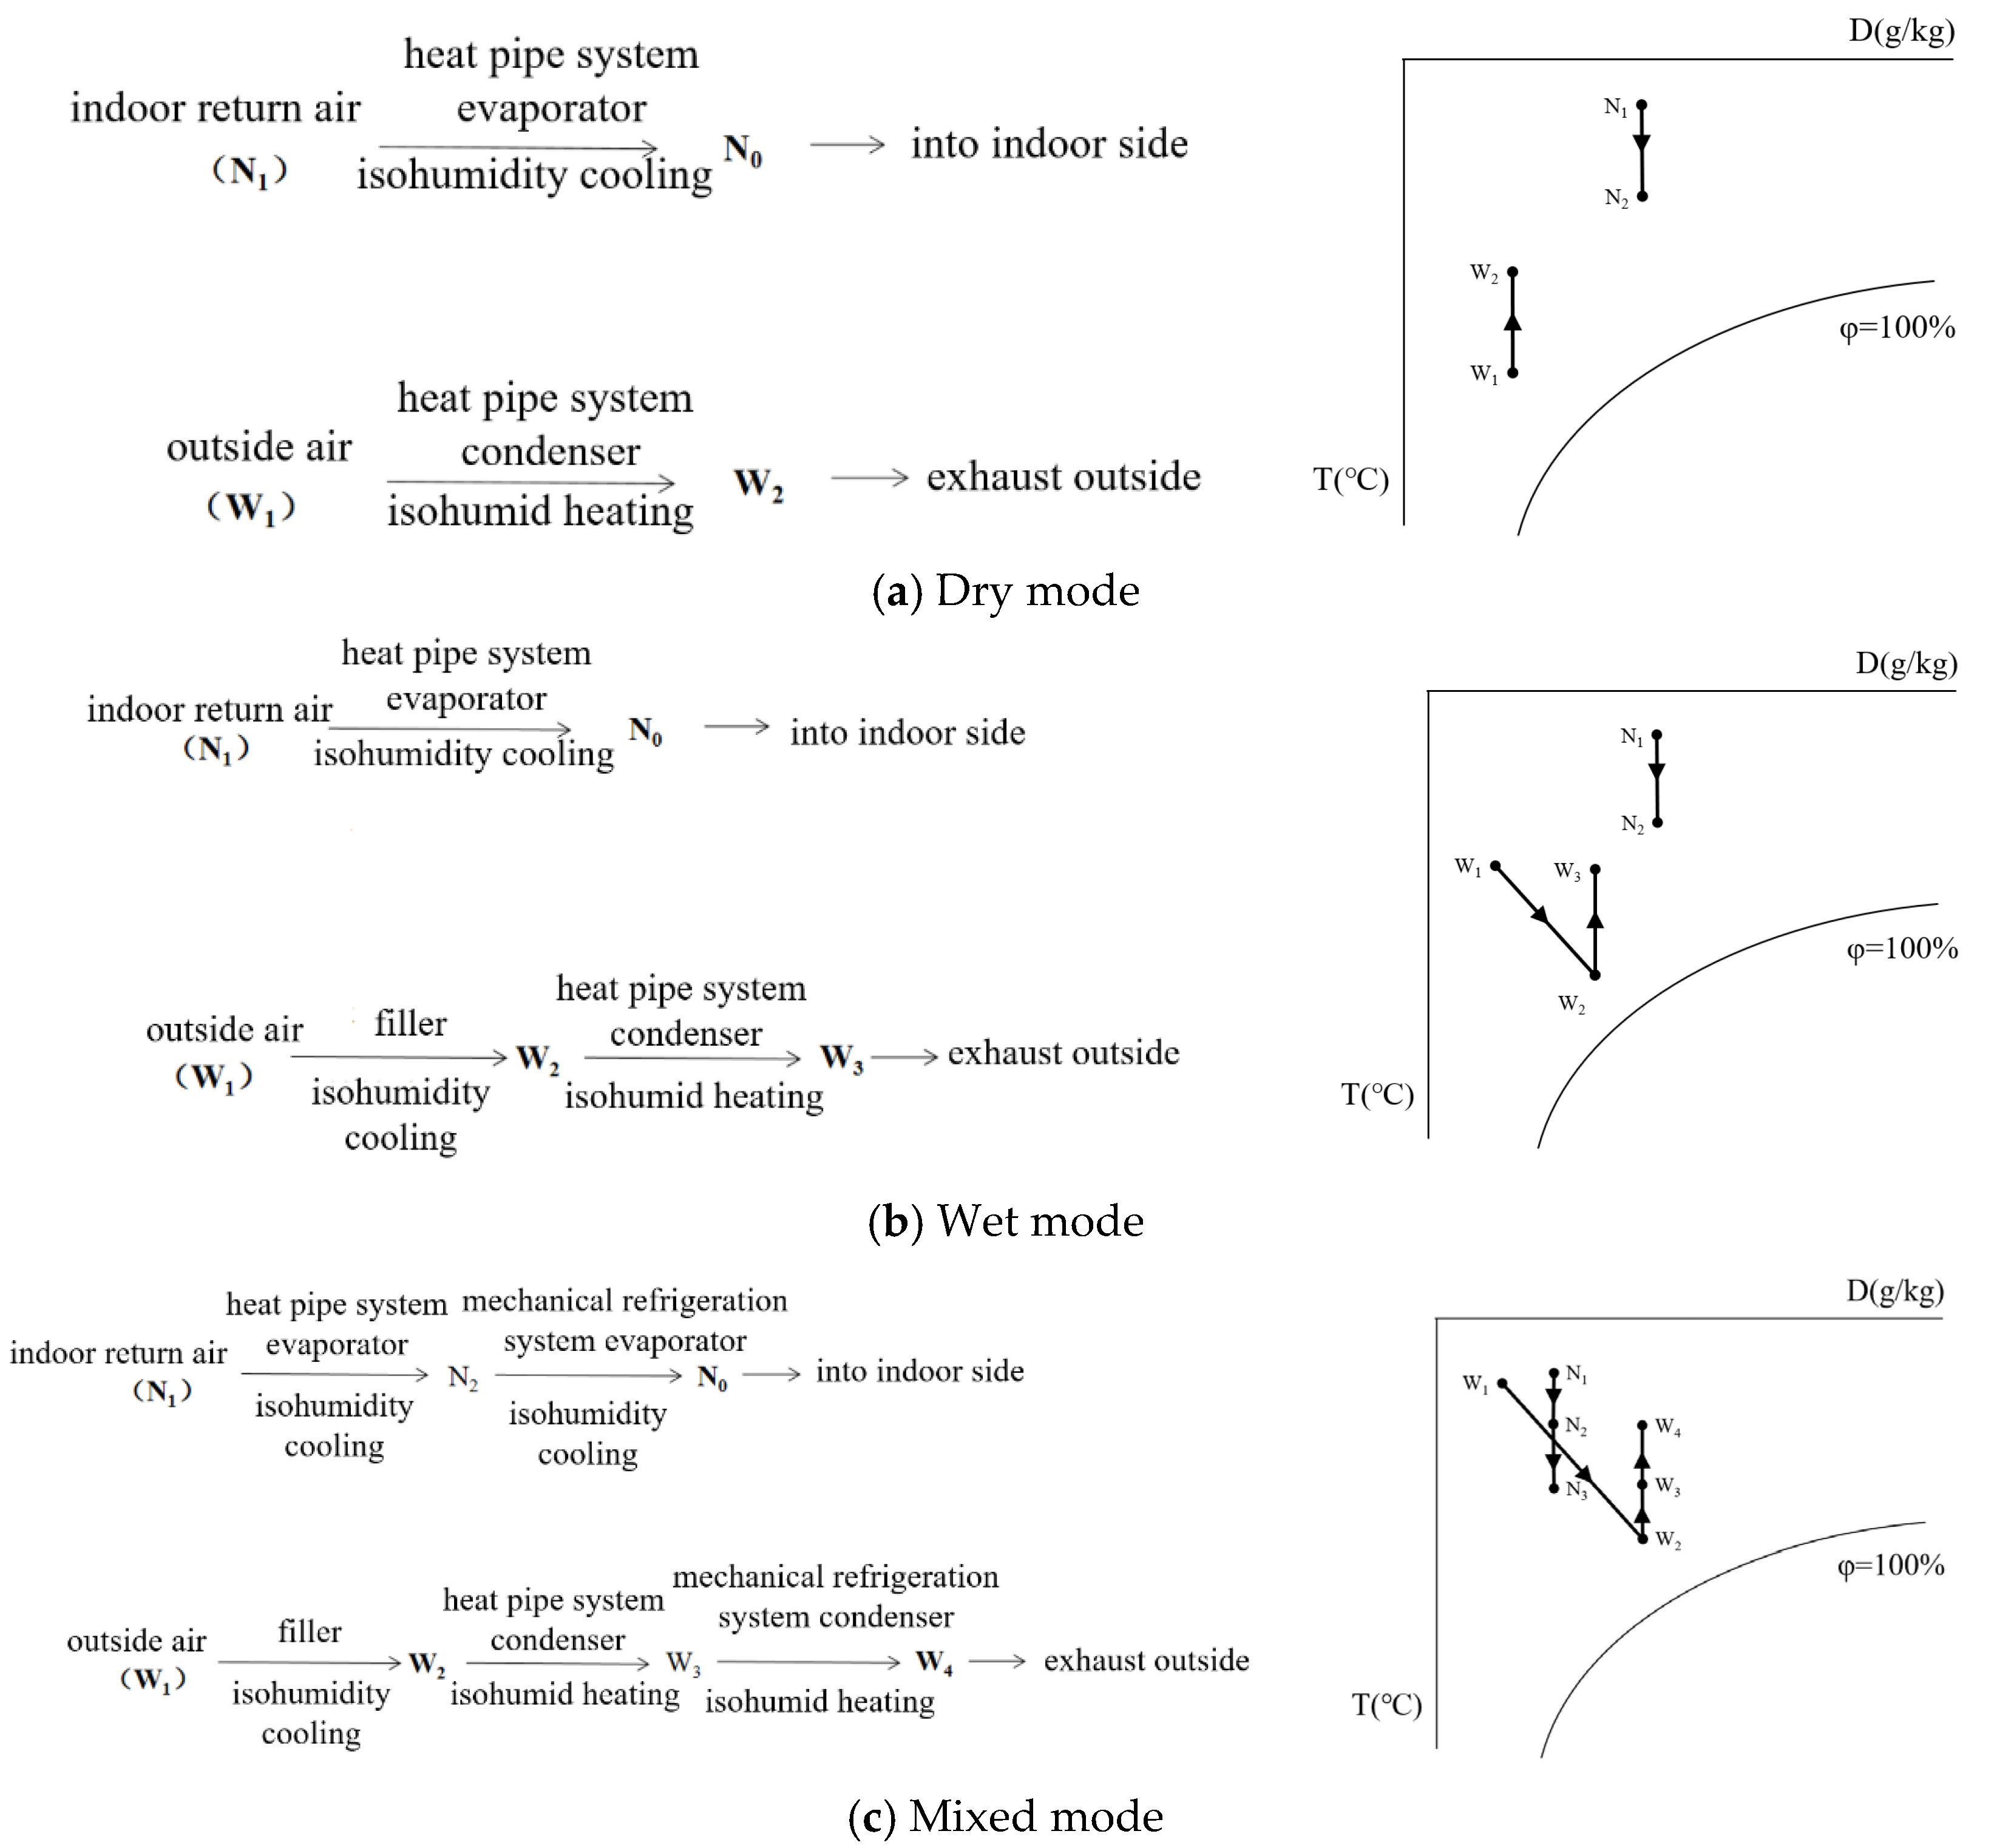
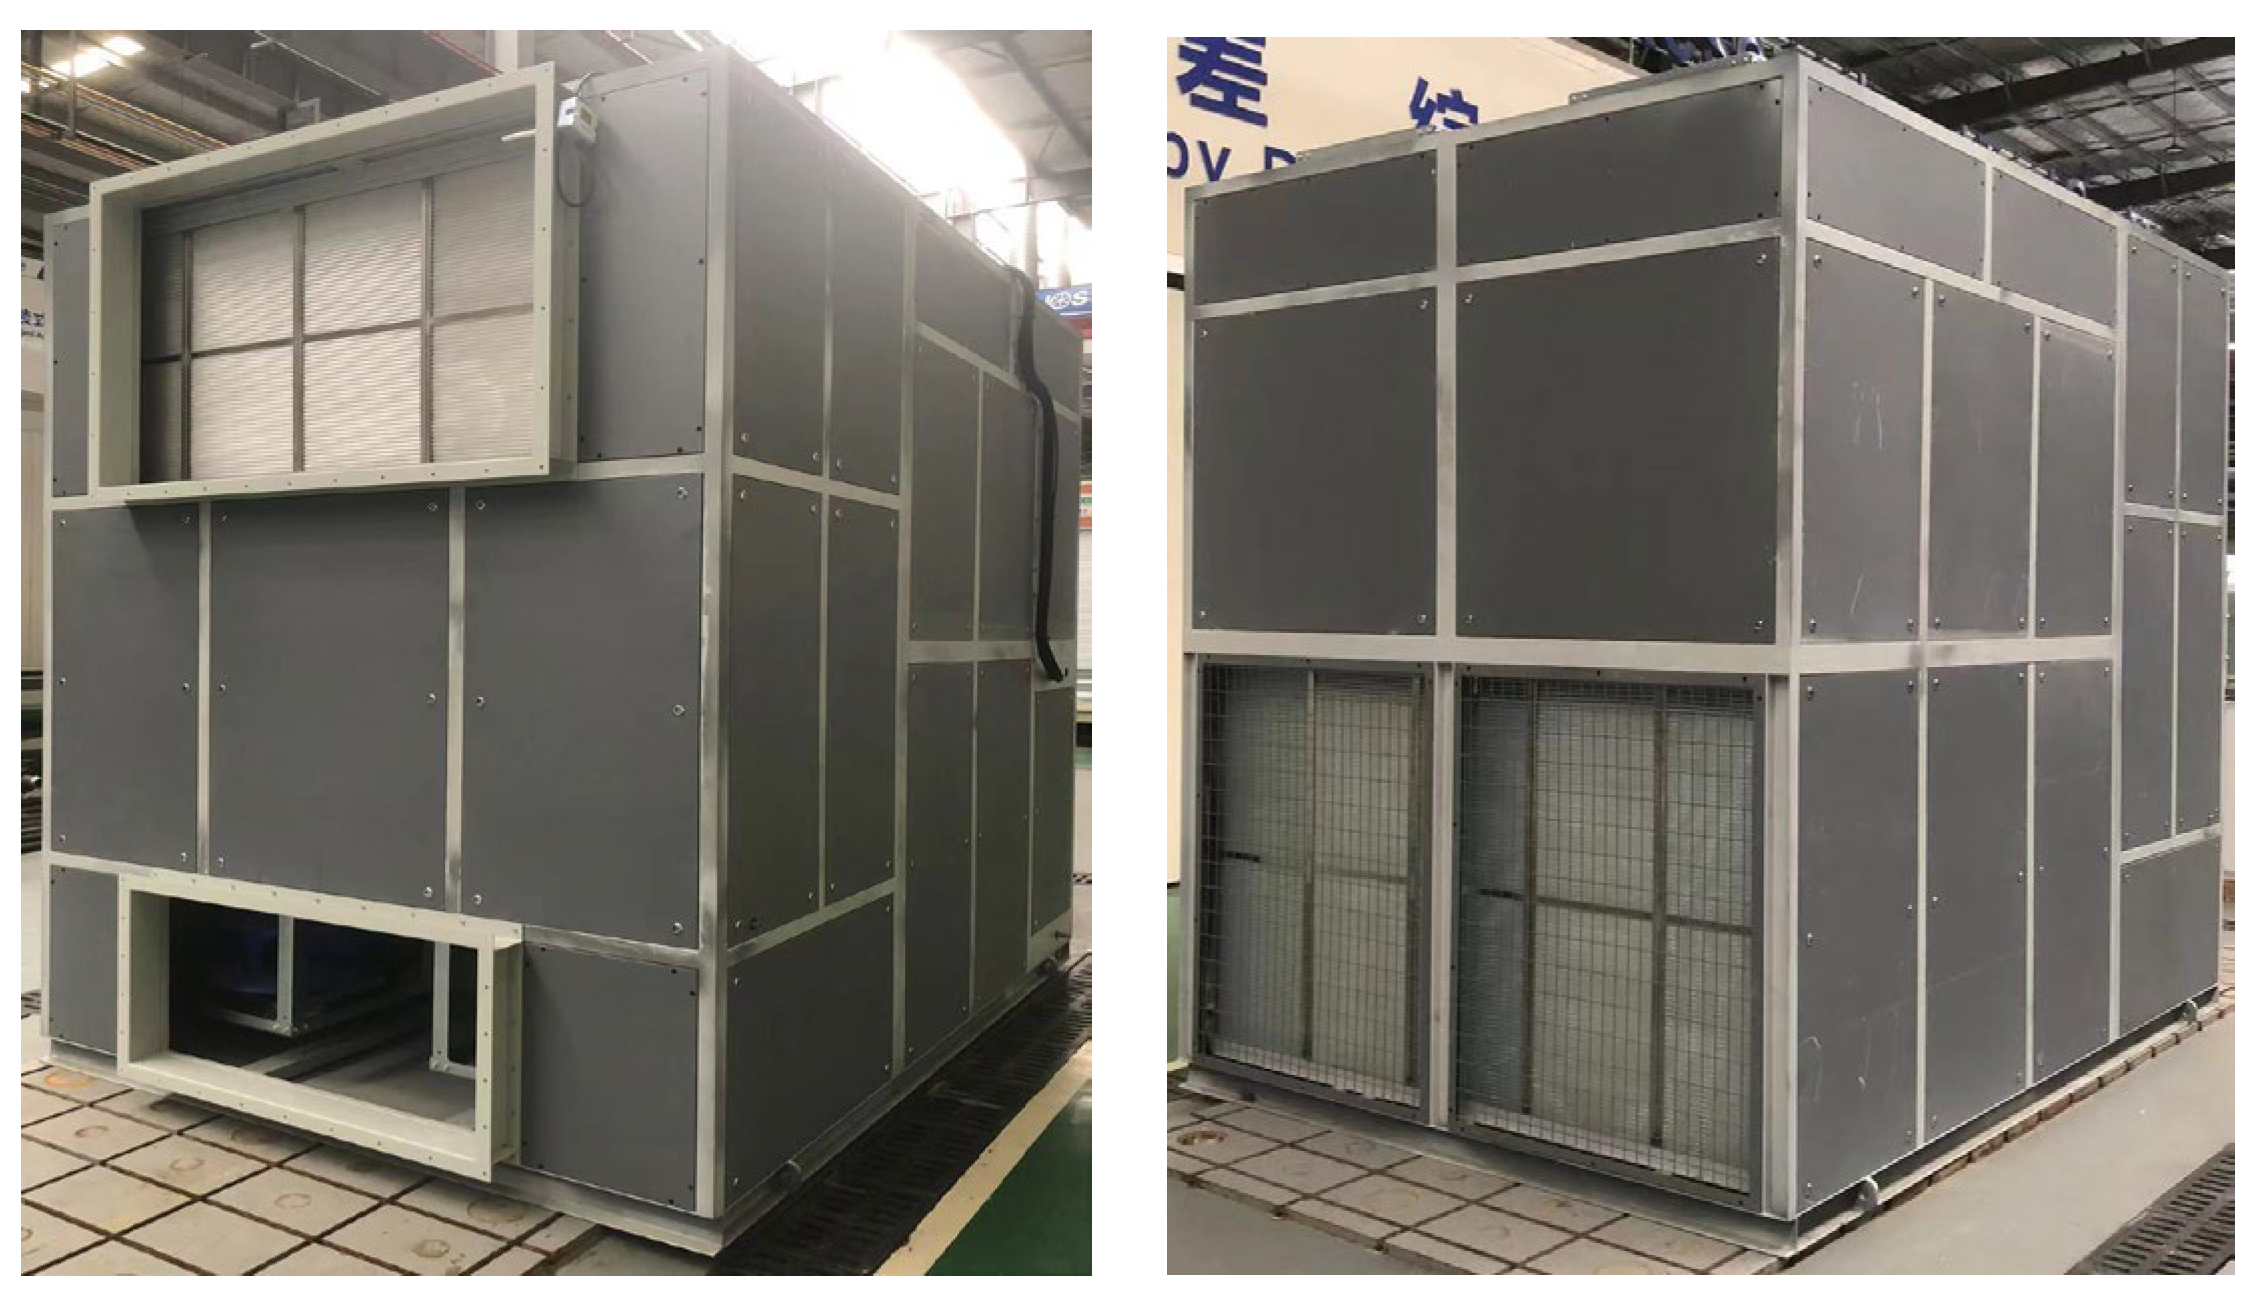
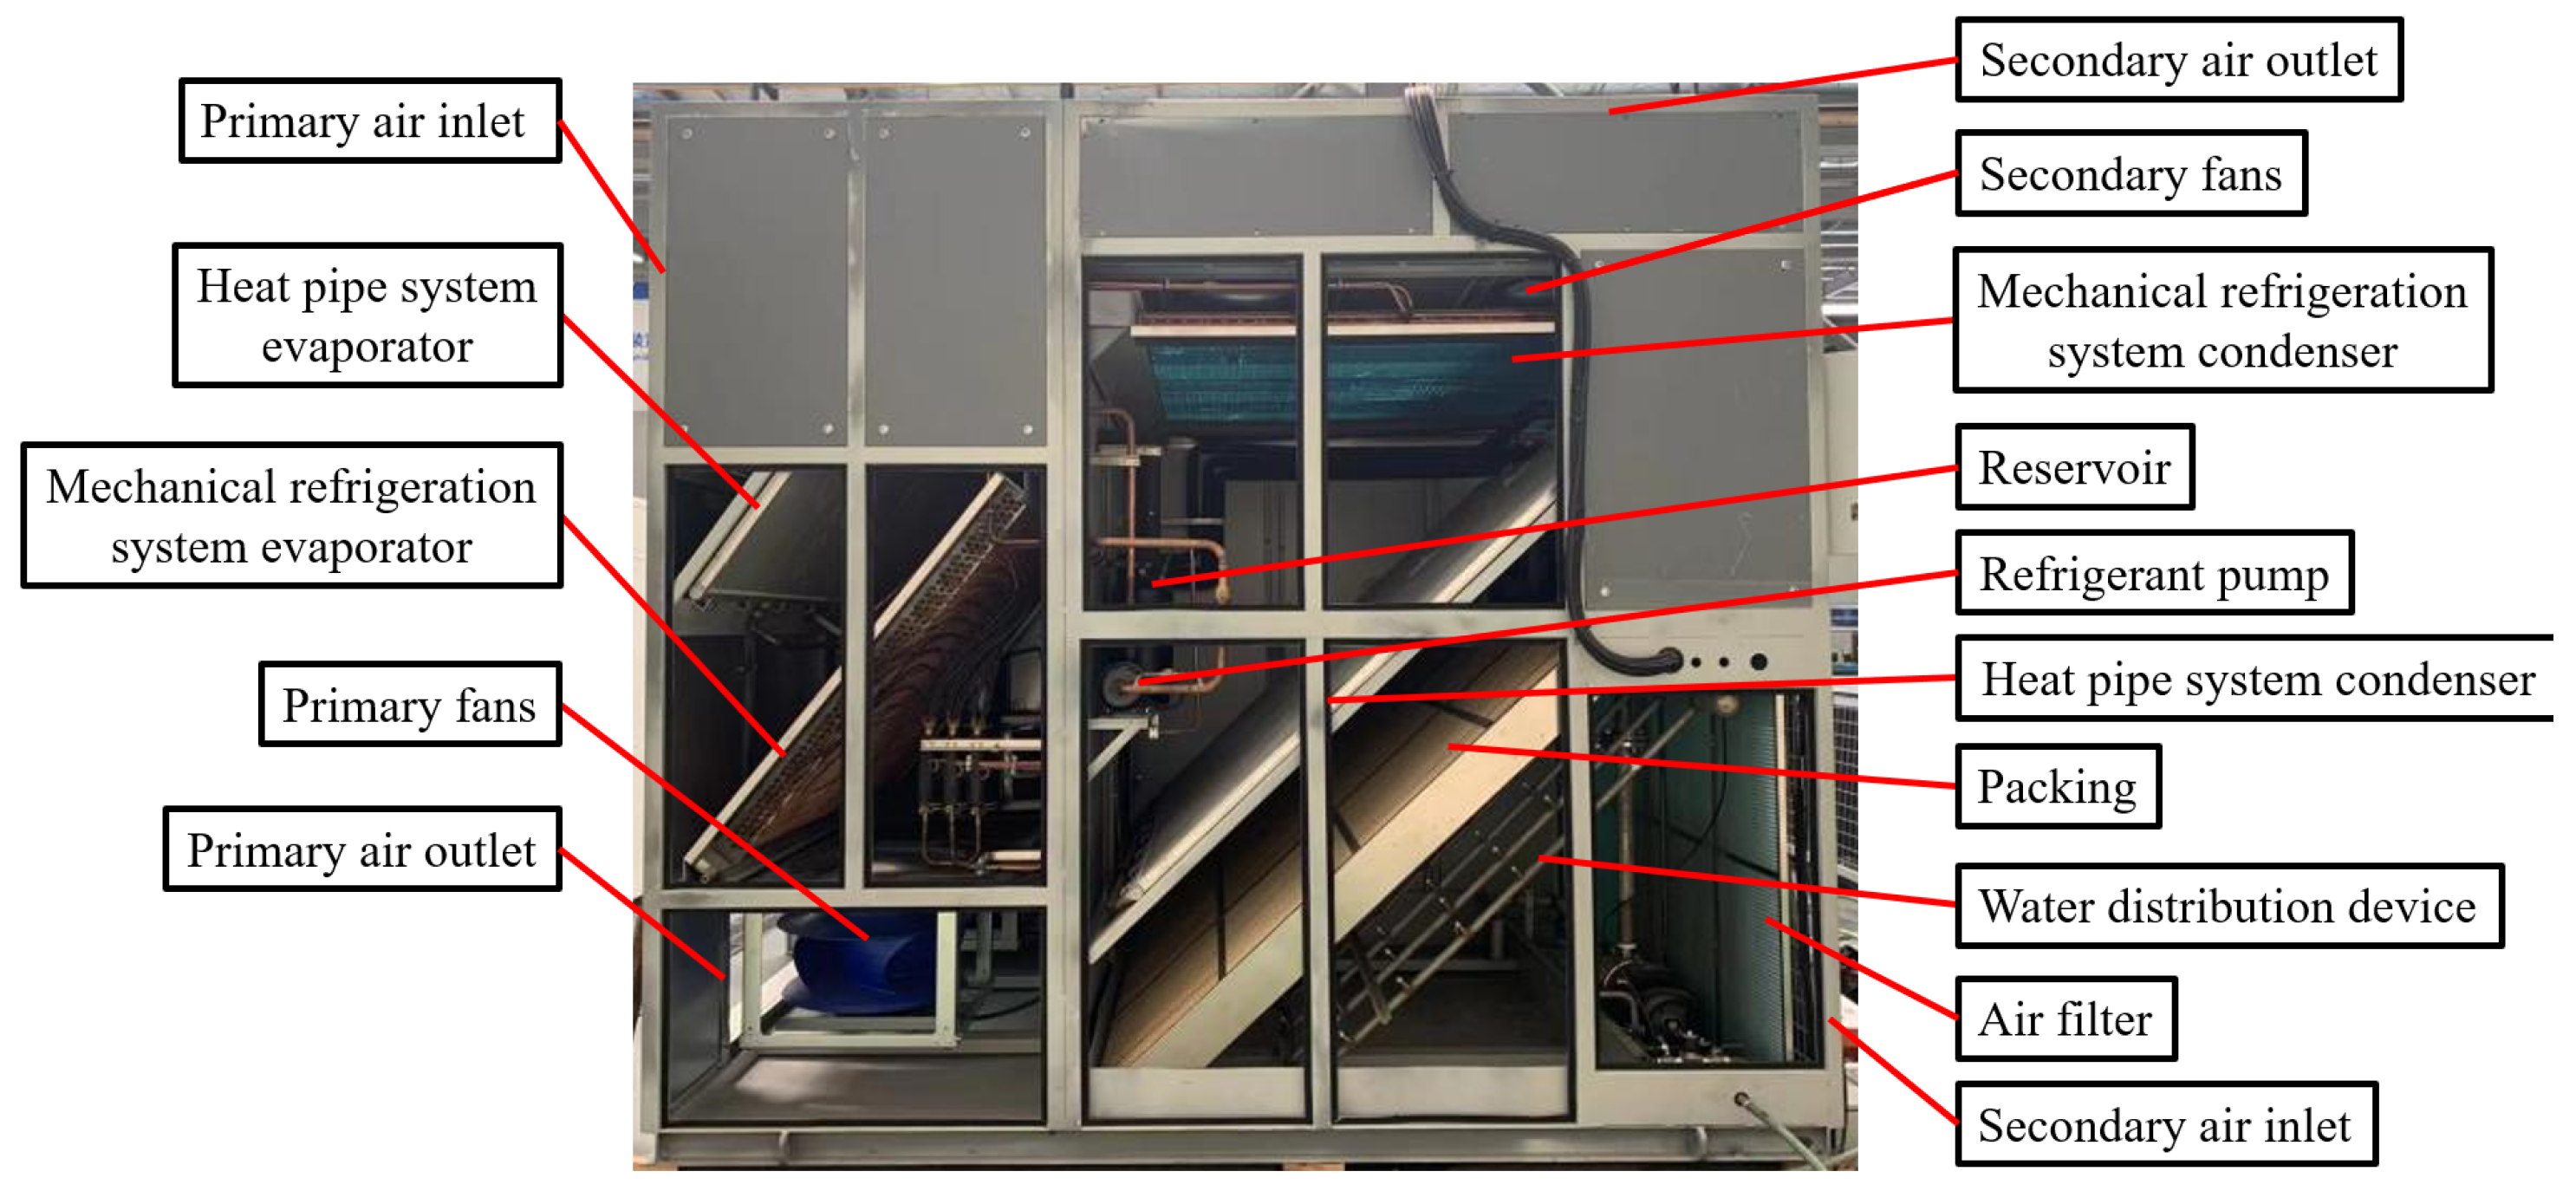
2. Introduction of the Unit

The unit is designed with a rated cooling capacity of 120 kW, of which the mechanical refrigeration system provides a make-up capacity of 60 kW. It adopts a one-piece design, including two parts: an indoor side and an outdoor side. The secondary air (working air) of the outdoor side is filtered through the air inlet before entry, and after enthalpy reduction in the wet film packing section, the air flows through the microchannel heat pipe condenser and the mechanical refrigeration condenser sequentially to remove heat. Finally, the air is discharged to the outdoors through the air outlet. The indoor-side primary air (output air) flows through the air inlet into the microchannel heat pipe evaporator, mechanical refrigeration evaporator, and other wet-cooling system sections and then through the air supply opening into the room to complete the cycle. Regarding the organic combination of the heat pipe refrigeration system, mechanical refrigeration system, and wet film packing system, the specific principle and structure of the unit are shown in Figure 1 and Figure 2.
When the dry-bulb temperature of the outdoor air (Tdb) is lower than 14 °C, the unit is operated in the dry mode, the refrigerant pump overcomes the resistance of the heat pipe refrigeration system network to ensure the continuous operation of the refrigeration system, the spraying system exhibits a closed state, the secondary air flows through the heat pipe condenser to remove heat from the data center, and the heat pipe refrigeration system bears the full load of the data center. At this time, the factor that directly affects the condensing effect of the unit is the dry-bulb temperature of the outdoor air.
When the outdoor air dry-bulb temperature (Tdb) is higher than 14 °C and the wet-bulb temperature (Twb) is lower than 14 °C, the unit is operated in the wet mode, the sprinkler system starts to work, the outdoor secondary air in the secondary channel first flows through the packing section and water to realize full heat and humidity exchange under enthalpic cooling, and the heat absorbed by the heat pipe condenser is discharged to the outdoors. At this time, the cooling effect of the unit is directly determined by the outdoor air wet-bulb temperature. When the outdoor air wet-bulb temperature (Twb) is higher than 14 °C, the heat pipe cooling system removes heat from the data center. When the wet-bulb temperature of the outdoor air (Twb) is higher than 14 °C, the use of a natural cold source cannot meet the cooling demand of the data center, and it is necessary to employ mechanical refrigeration to compensate for the cold source. The enthalpy and humidity diagram of the air treatment process is shown in Figure 3.
The starting and stopping conditions of the equipment corresponding to the three operating modes of the unit are listed in Table 1.

3. Discussion of the Experimental Results

3.1. Experimental Conditions and Test Contents

The proposed evaporative condensation refrigerant pump heat pipe air-conditioning unit was evaluated in an enthalpy difference laboratory in the Jiangsu Province, China. The refrigeration system of the unit consisted of a refrigerant pump heat pipe system and a mechanical refrigeration system, along with a spray system and a wet film packing section. The shape and internal structure of the experimental prototype are shown in Figure 4 and Figure 5, respectively. The system parameters are shown in Table 2 and Table 3.
Referring to the Data Center Design Code (GB 50174-2017) [17] and Data Center Evaporative Cooling Air-Conditioning Equipment (T/DZJN 27-2021) [18] standards for data center air-conditioning unit experimental working conditions, the experimental working conditions for each operating mode were determined, as listed in Table 4.
When the indoor and outdoor sides reach the set working conditions and the unit is stably operated, the experimental data are recorded by the experimental bench at 1 min intervals, each working condition is maintained for 30 min, and the arrangement of the primary and secondary sides in the field experiments is shown in Figure 6. The test instruments are shown in Table 5.

3.2. Uncertainty Analysis of the Experimental Data

The physical quantities used in the experiments included measured and calculated values. The measured and calculated values were obtained directly from the measuring instruments and relevant calculation equations, respectively. The uncertainty in the experimental data could be classified as absolute or relative. The directly measured uncertainty value x could be expressed as follows:
x = x m e a s ± δ x
It was assumed that the indirectly calculated quantity (R) was a function of several independent measurements, and the number of independent measurements was n. The function could be expressed as follows:
R = f x 1 , x 2 , , x n ± δ R
Equation (3) could be used to calculate the experimental uncertainty indirectly:
δ R R = i = 1 n R x 1 δ x 1 2
According to the calculations, the uncertainties in the unit’s cooling capacity and EER ranged from 1.198% to 1.353% and from 1.589% to 1.727%, respectively, under the given operating conditions.

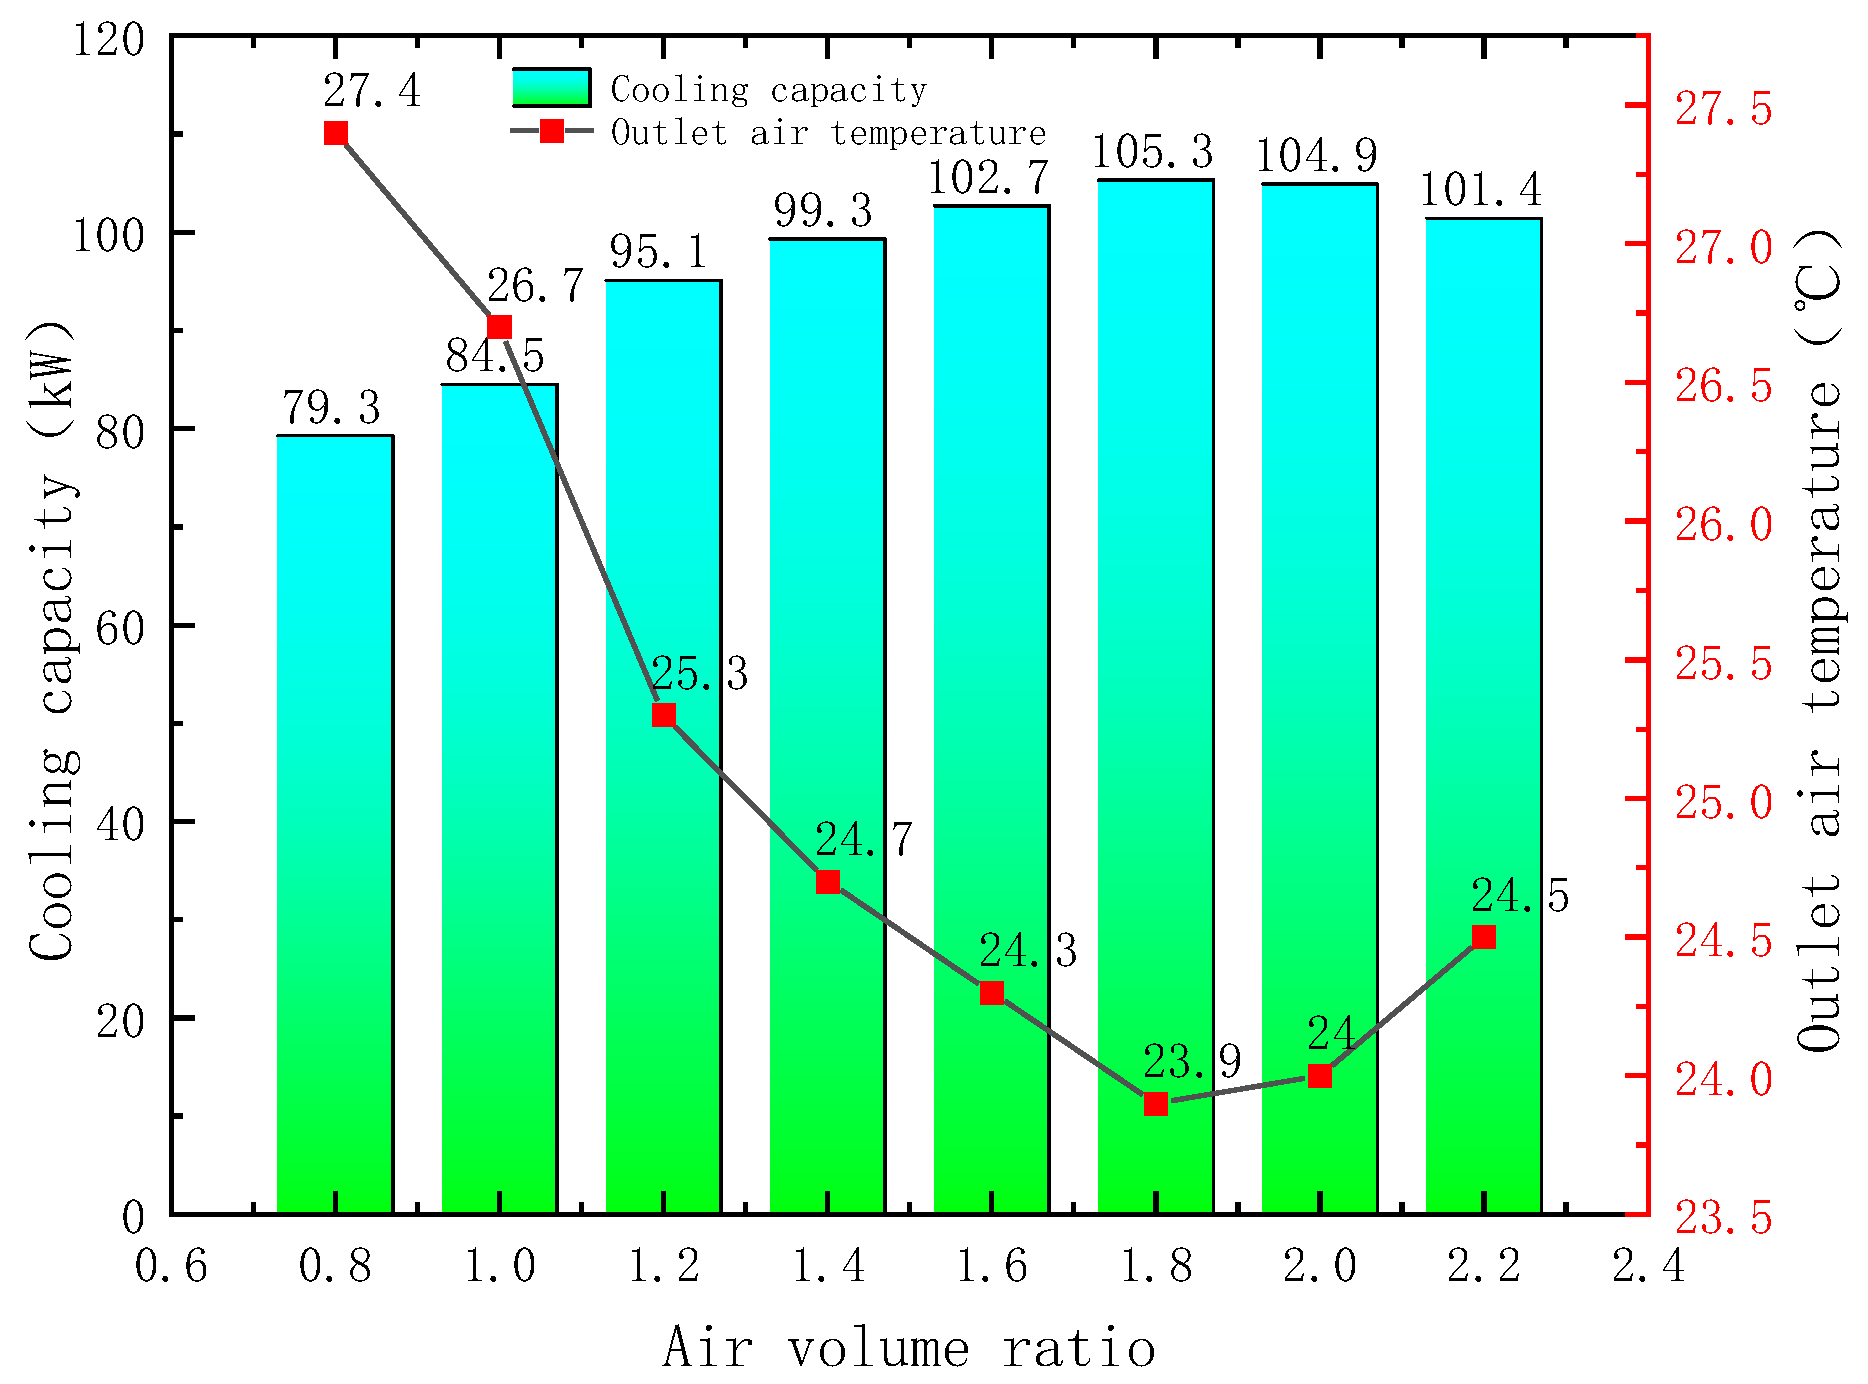
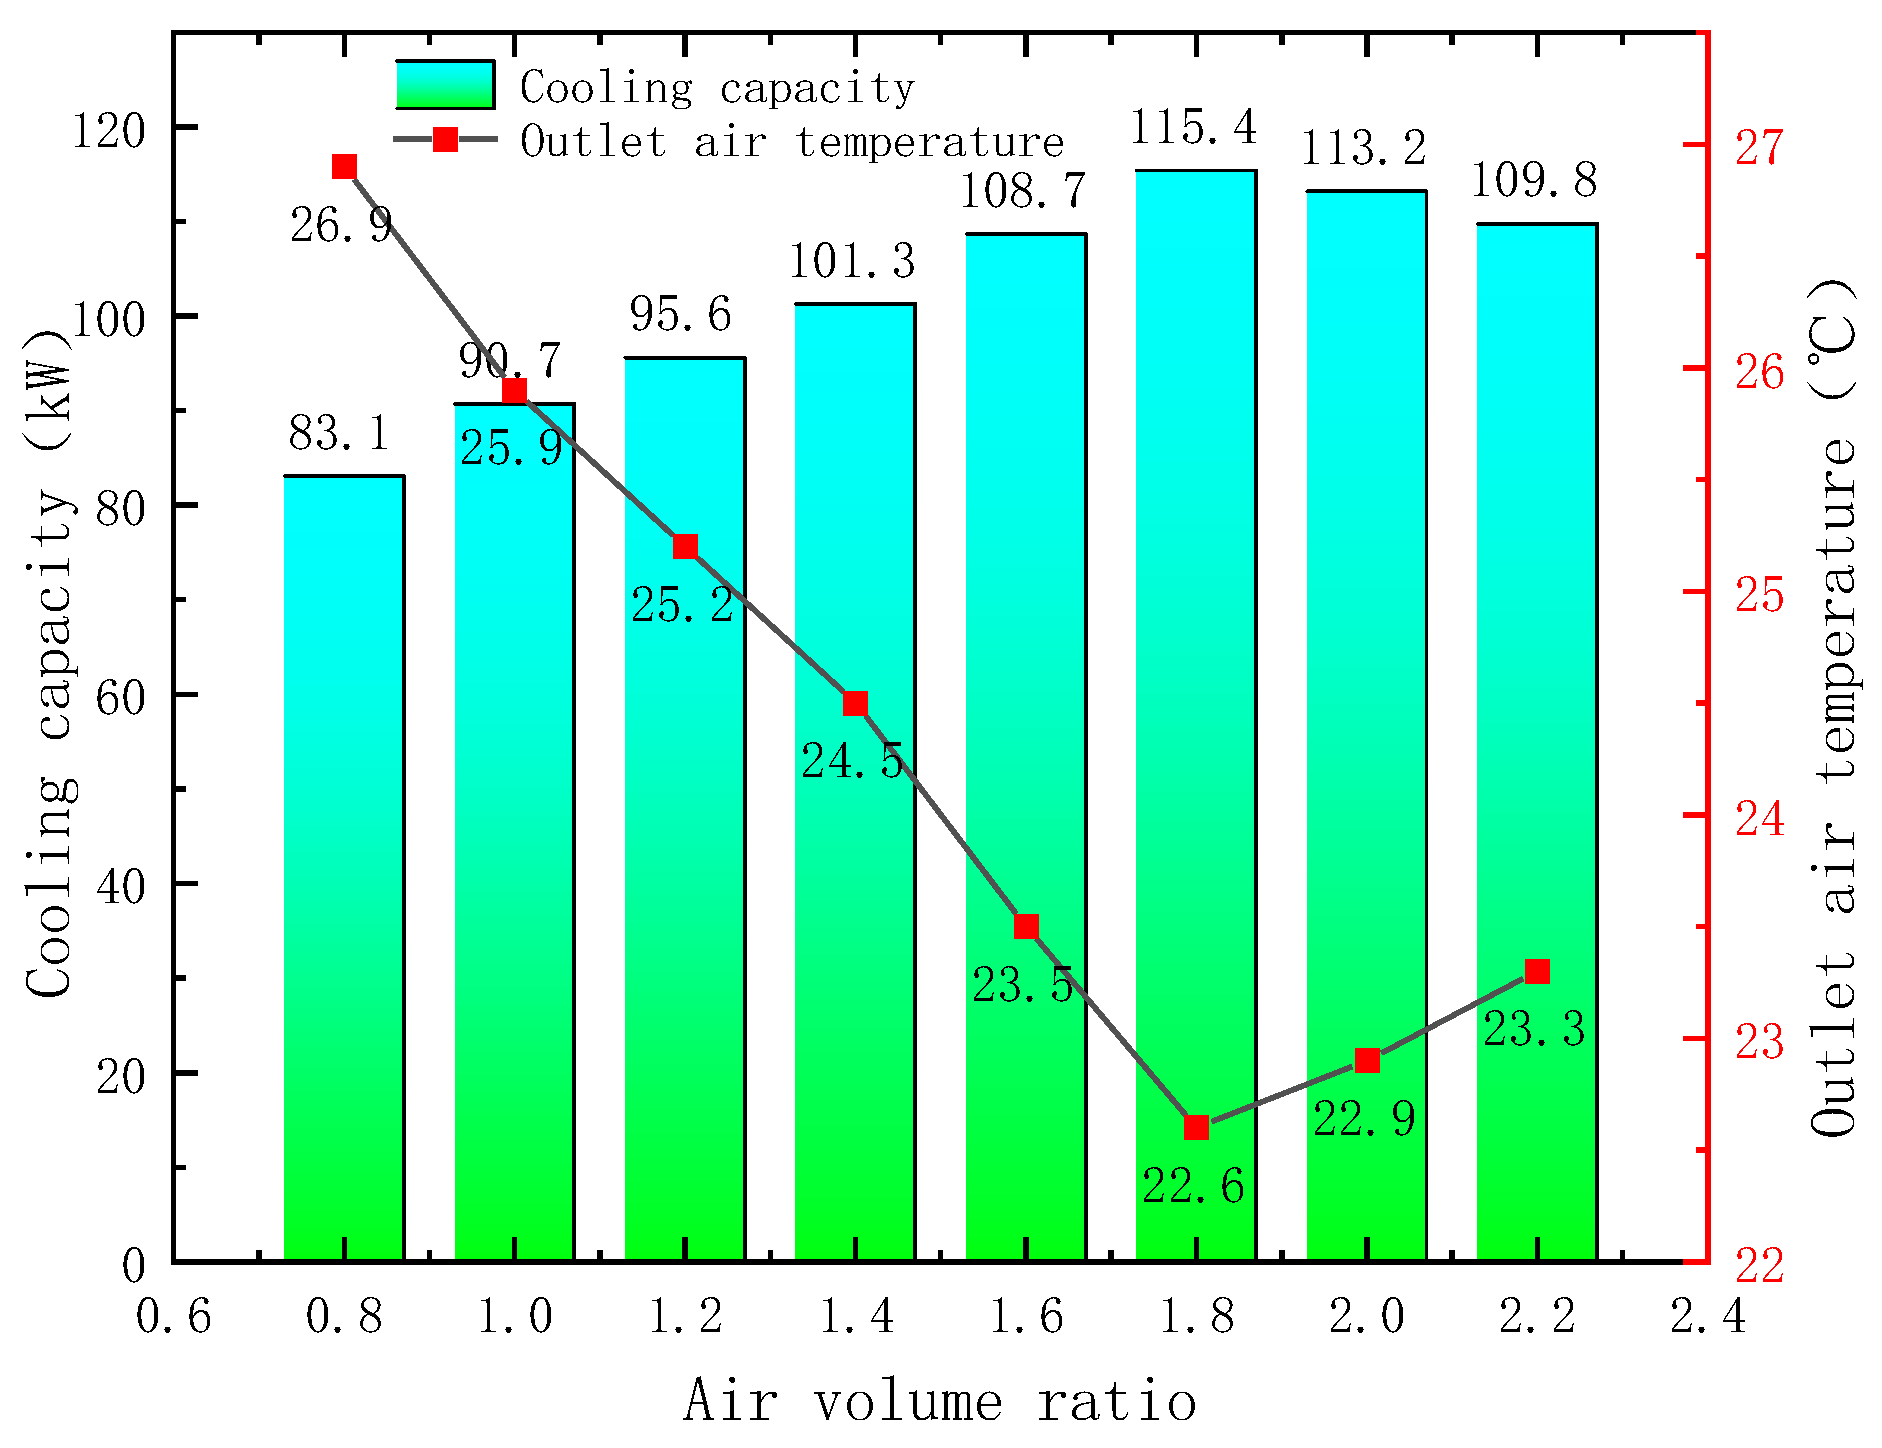
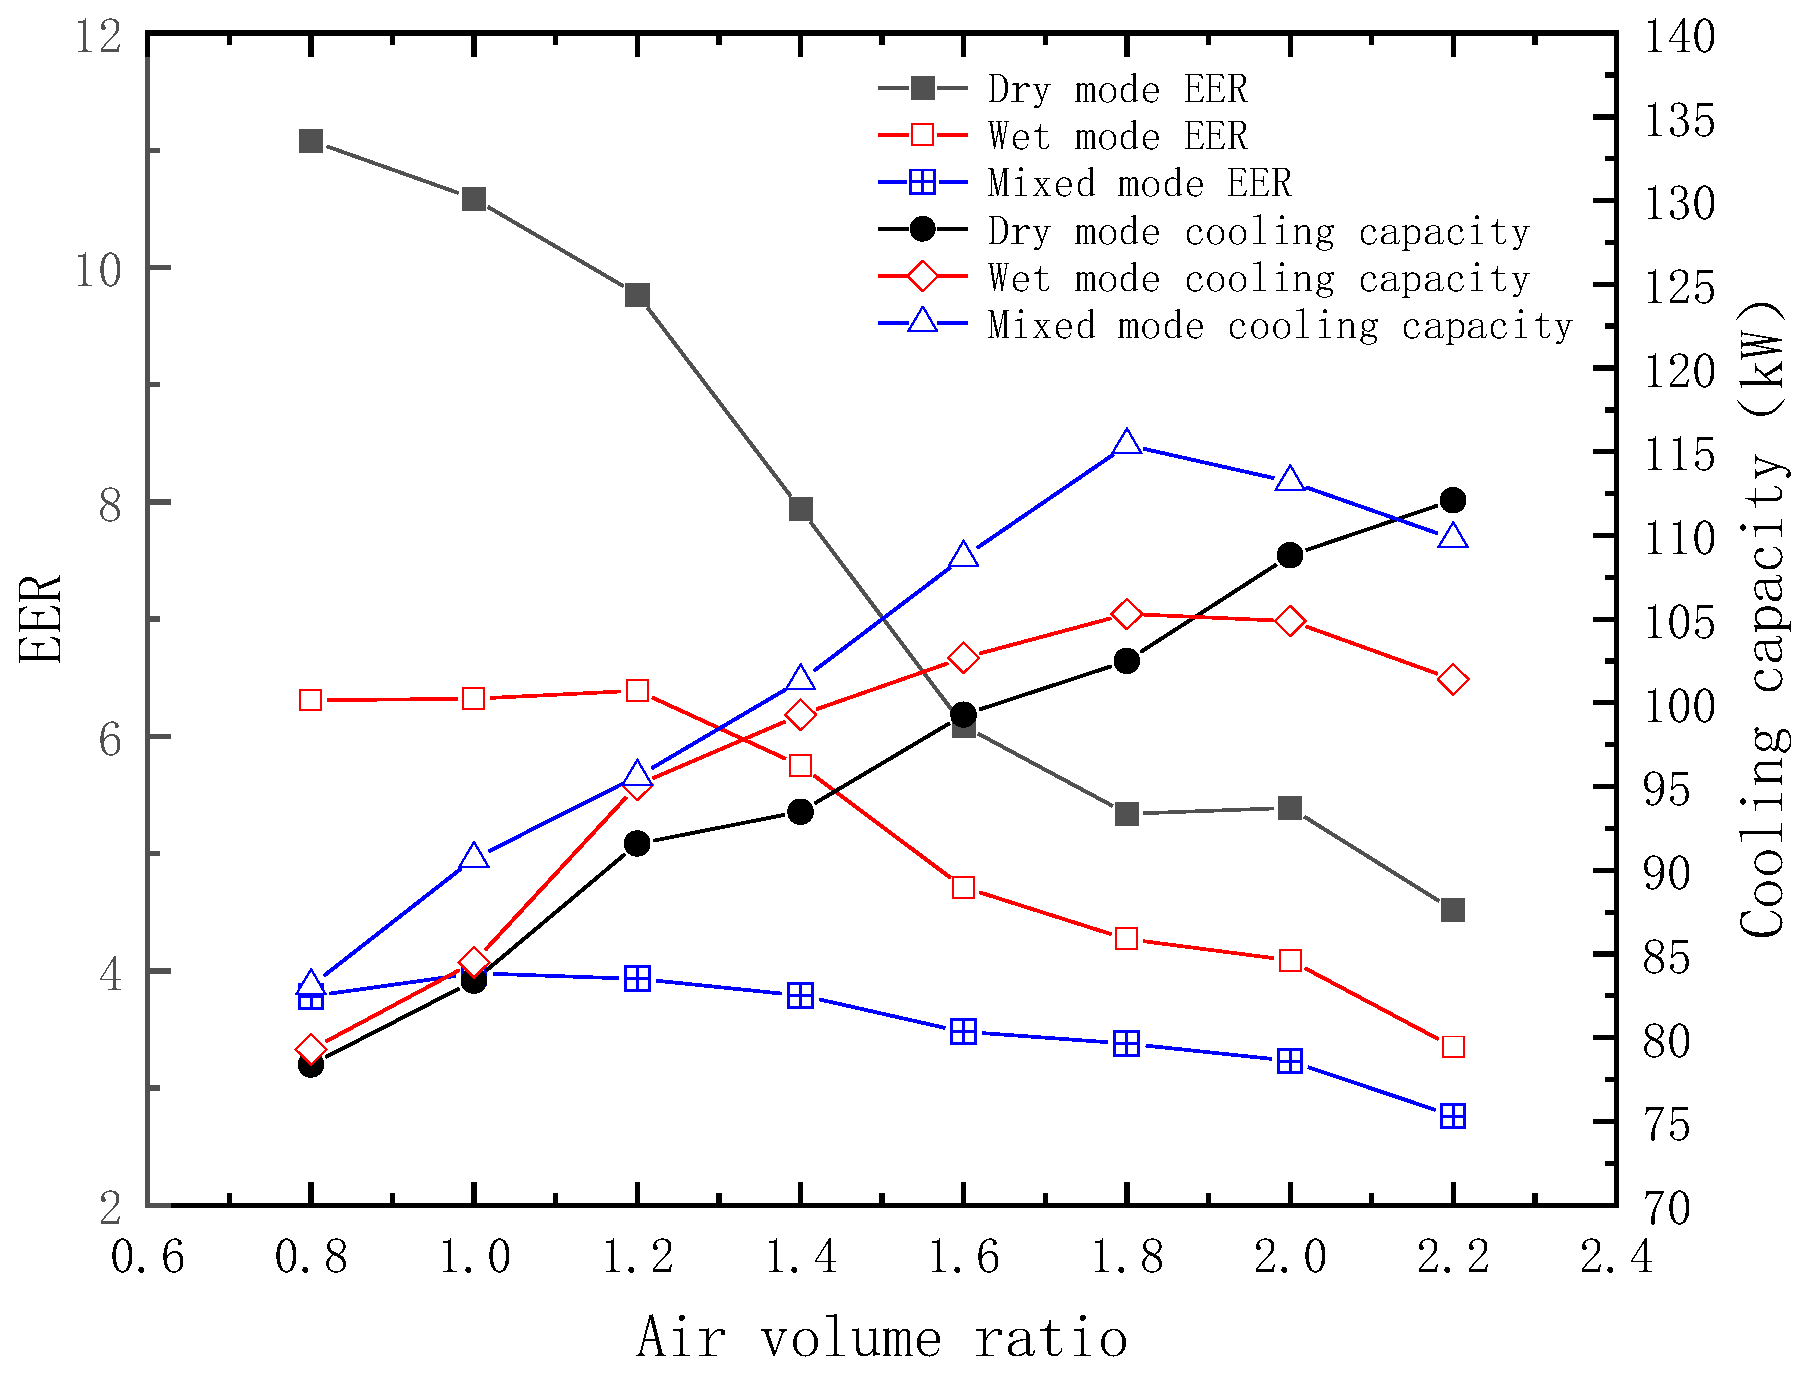
3.3. Experiment of the Optimal Airflow Ratio

The unit was run in the above three operating modes in the secondary/primary air volume ratio experiment. The primary side’s air volume remained unchanged, and the secondary-side air inlet air velocity was measured at 10 points (the secondary-side air inlet velocity was measured at each point, and the weighted average was calculated according to the cross-sectional area of the duct to obtain the secondary-side air inlet velocity). The arrangement of the measurement points is shown in Figure 7, and the corresponding air velocity and fan input percentage under the different air volume ratios are provided in Table 6.
The secondary/primary airflow ratio in the dry mode ranged from 0.8 to 2.2, and the results are shown in Figure 8, according to which the cooling capacity of the unit increased with the increasing airflow ratio, and the primary-side air outlet temperature decreased with the increasing airflow ratio. At a secondary/primary airflow ratio of 2.2, the cooling capacity reached the maximum value of 112.1 kW, and the air outlet temperature reached the minimum value of 22.3 °C. The refrigeration capacity of the unit in the dry mode was positively related to the secondary/primary airflow, the refrigeration capacity of the heat pipe system increased with increasing airflow on the secondary side, and the optimal airflow ratio in the dry mode was 2.2.
The airflow ratio experiment of the unit was conducted under the working conditions of the wet mode. The secondary/primary airflow ratio ranged from 0.8 to 2.2, and the results are shown in Figure 9. The airflow ratio increased from 0.8 to 1.8 in the wet mode, the cooling capacity gradually increased, the primary-side air outlet temperature gradually decreased, the cooling capacity reached the maximum value of 105.8 kW at a secondary/primary airflow ratio of 1.8, the air outlet temperature reached the minimum value of 23.9 °C, the cooling capacity increased from 1.8 to 2.2 at a secondary/primary airflow ratio of 1.8, and the air outlet temperature gradually decreased. When the secondary/primary airflow ratio increased from 1.8 to 2.2, the cooling capacity gradually decreased, the air temperature on the primary side gradually decreased, and the optimal airflow ratio was 1.8.
The airflow ratio experiment of the unit was conducted in the mixed mode, and the results are shown in Figure 10. When the secondary/primary airflow ratio was increased from 0.8 to 1.8, the cooling capacity gradually increased, the air outlet temperature gradually decreased, the cooling capacity reached the maximum value of 115.4 kW at a secondary/primary airflow ratio of 1.8, the air outlet temperature reached the minimum value of 22.6 °C, the cooling capacity gradually decreased at a secondary/primary airflow ratio ranging from 1.8 to 2.2, and the optimal airflow ratio was 1.8. When the secondary/first airflow ratio was increased from 1.8 to 2.2, the cooling capacity gradually decreased, the air temperature on the primary side gradually increased, and the optimal airflow ratio was 1.8.
In the three operating modes, the different secondary/primary air volume ratios resulted in unit energy efficiency ratio (EER) changes, as shown in Figure 11. The EER comparison results indicated the following order: dry mode > wet mode > mixed mode. The reason is that the wet mode started after the pump was activated, while the mixed mode started after the compressor was turned on. Moreover, the input power increased with increasing cooling capacity, but the input power increased more notably than the cooling capacity. Therefore, the unit’s EER decreased.
As the secondary/primary air volume ratio gradually increased, the unit’s EER decreased. The reason for this phenomenon was that the air on the secondary side of the unit needed to flow through the filter, wet film packing, heat pipe microchannel heat exchanger, and mechanical refrigeration condenser in sequence, the overall wind resistance was high, the fan input power increased, and the fan input power increased more notably than the cooling capacity. It could thus be concluded that the unit with the highest cooling capacity and EER did not necessarily provide the optimal energy efficiency ratio. The secondary side achieved a better energy efficiency-related performance in the low-airflow state than in the high-airflow state, ensuring that the secondary-side fan of the unit was operated in the low-airflow state when the data center load or the outdoor temperature was lower, thus ensuring a higher EER; at the same time, it was necessary to further optimize the structure of the secondary side of the unit to reduce the wind resistance and further enhance the EER.

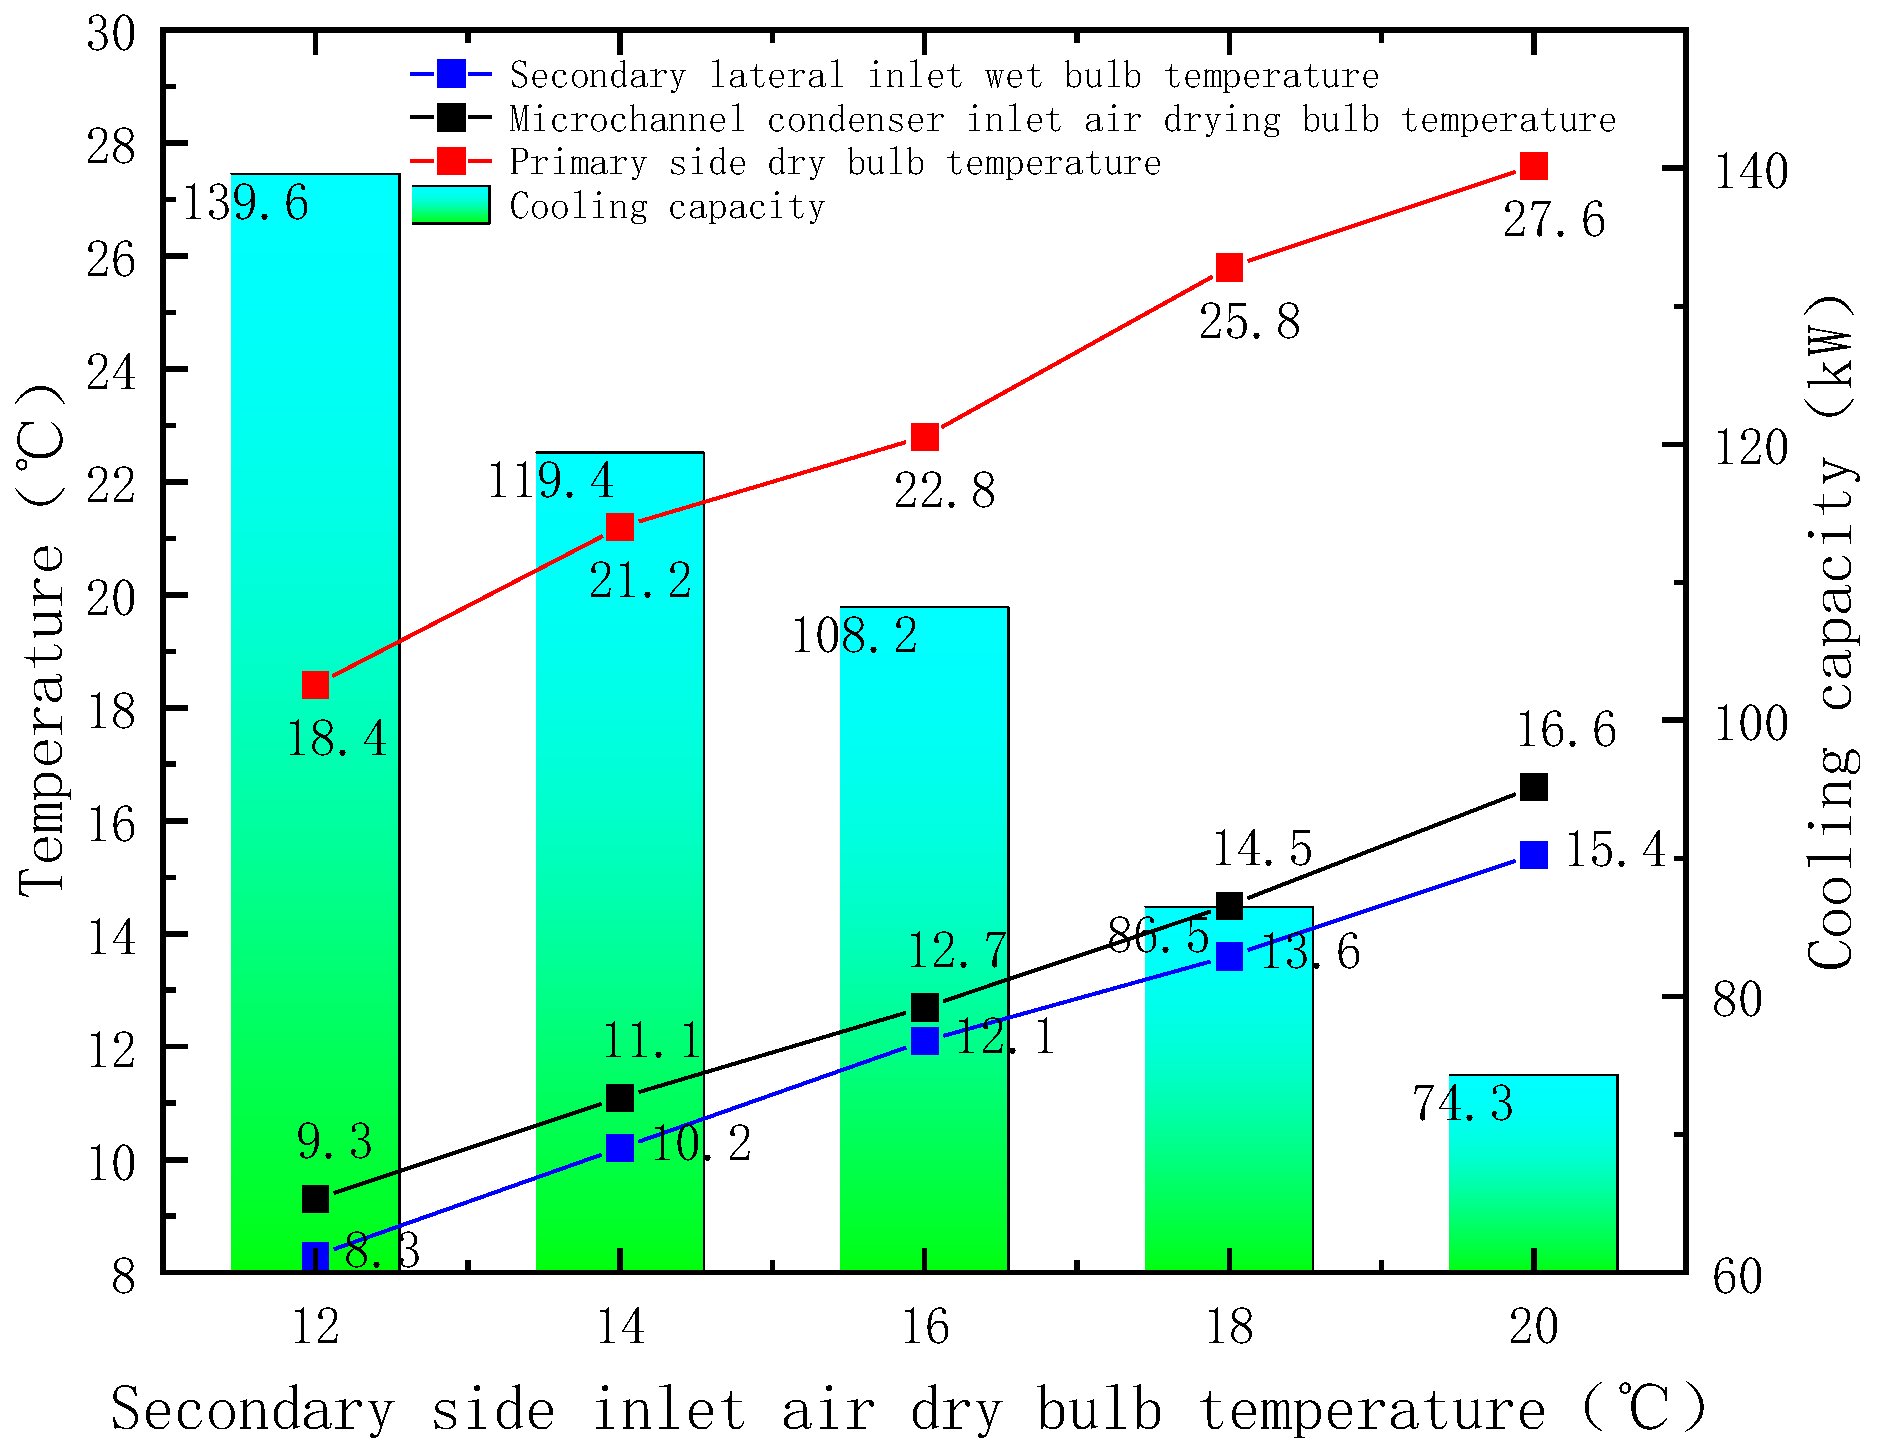
3.4. Inlet Air Temperature Test

At the optimal secondary/primary airflow ratios of 2.2 and 1.8 in the dry and wet modes, respectively, the effect of the secondary-side inlet air temperature on the cooling capacity of the unit was investigated. When the unit was operated in the dry mode, since only the refrigerant pump heat pipe system was turned on, the influence of the wet-bulb temperature of the incoming air on the secondary side on the cooling capacity could be ignored, and only the influence of the dry-bulb temperature change on the cooling capacity was considered. As shown in Figure 12, when the dry-bulb temperature increased from 12 to 20 °C, the cooling capacity of the unit decreased from 133.9 to 63.6 kW, and the primary-side air outlet temperature gradually increased from 19.2 to 29.1 °C. With the increasing secondary-side air inlet temperature, the cooling capacity of the unit decreased from 133.9 to 63.6 kW. As the air inlet temperature on the secondary side was increased, the cooling capacity of the unit gradually decreased, and the outlet temperature on the primary side gradually increased.
When the unit was operated in the wet mode, the pump was turned on, direct evaporative cooling was utilized to reduce the inlet air temperature on the secondary air side, and the effects of both the outdoor air dry- and wet-bulb temperatures needed to be accounted for. The experimental results are shown in Figure 13. When the outdoor air dry/wet-bulb temperature increased from 12.0 °C/8.3 °C to 20.0 °C/15.4 °C, the inlet air temperature in front of the microchannel heat exchanger on the secondary air side increased from 9.3 to 16.6 °C, the cooling capacity of the unit decreased from 139.6 to 76.3 kW, and the outlet air temperature on the primary air side gradually increased from 18.4 to 27.3 °C. As the dry-bulb/wet-bulb temperature on the secondary air side was increased, the cooling capacity of the unit gradually decreased, and the air outlet temperature on the primary side gradually increased.
It can be concluded that the main factor influencing the cooling capacity of the unit in the dry mode was the dry-bulb temperature of the air on the secondary side: the lower the dry-bulb temperature, the higher the cooling capacity. The main factor influencing the cooling capacity of the unit in the wet mode was the wet-bulb temperature of the air on the secondary side: the lower the wet-bulb temperature, the higher the cooling capacity of the unit. Under the same outdoor temperature change conditions, the cooling capacity in the wet mode was better than that in the dry mode, and under actual operation, it could be adjusted according to the different load conditions and the operating mode. In areas with a sufficient water supply, when the outdoor dry-bulb temperature is 10–14 °C, the operating hours of the wet mode could be extended to adapt to the load demand of the data center.
The dry and wet modes each yielded different optimal air volume ratios, the fan input power on the secondary side differed, the wet mode depended on the start of pump operation, and the input power also increased. Hence, we needed to explore the wet- and dry-mode energy efficiency ratio differences with the change in outdoor ambient temperature.
The dry-bulb temperature of the air on the secondary side ranged from 12 to 20 °C, the relative humidity of the air in the wet mode was maintained at 60%, and with the change in the outdoor temperature, the EER of the unit varied, as shown in Figure 14. When the dry-bulb temperature of the air on the secondary side was 12 °C, the dry-mode EER reached up to 5.7, and as the temperature of the secondary-side air gradually increased, the cooling capacity of the unit decreased, the input power remained unchanged, and the EER gradually decreased. At a dry-bulb temperature of the secondary-side air of 20 °C, the EER decreased to 2.6. In the wet mode, with the secondary-side air RH maintained at 60% and a dry-bulb temperature of 12 °C, the EER was 5.7. The EER decreased to 3 when the dry-bulb temperature increased to 20 °C. When the dry-bulb temperature increased to 20 °C, the EER decreased to 3. When the dry-bulb temperature of the air on the secondary side was ≤14 °C, the EER under the wet mode was higher than that under the dry mode, and the wet mode provided a better refrigeration performance than the dry mode. In areas with a sufficient water supply, when the outdoor air dry-bulb temperature is 10–14 °C, the operating hours of the wet mode could be extended, and the input power of the fan on the secondary air side could be adjusted according to the air temperature on the primary air side to improve the energy efficiency of the unit.

4. Exploration of the Refrigerant Charge

The refrigerant charge is one of the important influencing factors of the heat transfer performance of a power separated heat pipe. An excessive liquid charge can result in incomplete liquid refrigerant vaporization in the evaporator, and gas–liquid mixtures can easily be formed in the pipeline between the evaporator and condenser, which affects the refrigerant transfer speed and causes the introduction of liquid refrigerant into the condenser, thus reducing the heat transfer efficiency of the condenser and the efficiency of the refrigerant cycle. A very high liquid charge can result in the tube wall of the evaporator not being fully covered by the liquid film, thus affecting the heat transfer efficiency. Therefore, determining the optimal refrigerant charge of refrigerant pump heat pipe systems is an important issue to ensure efficient heat transfer. In this experiment, three methods were selected to calculate the refrigerant charge.

4.1. Method 1

Wang [19] proposed a method for calculating the liquid charge of a separated heat pipe, considering the refrigerant charge of each component and connecting piping in the entire loop of the heat pipe.
Liquid filling volume in the evaporation section
It is assumed that the dryness of the refrigerant mass linearly varies with the filling volume, as shown in Equation (4):
M 1 = A 1 L 1 ln c 1 x c 2 x + c 2 ln c 2 x ( c 1 c 2 )
x = outlet dryness;
A 1 = cross-sectional area of the evaporation section, (m2);
L 1 = length of the evaporation section, (m);
c 1 = specific heat capacity of the saturated vapor, (kJ/(kg∙K));
c 2 = specific heat capacity of the saturated liquid, (kJ/(kg∙K)).
The intratracheal fluid filling volume can be obtained by Equation (5):
M 2 = A 2 L 2 x m c 1 + c 2 x m c 2
A 2 = cross-sectional area of the vapor pipe, (m2);
L 2 = length of the vapor tube, (m);
x m = average dryness.
The condensing section charge can be determined by applying the Nusselt theory of condensation heat transfer, as expressed in Equation (6):
M 3 = 0.8 π D 3 L 3 ( 4 μ λ g ρ 2 h f g ) q c 0.943 u 1 L 3 g h f g ρ 2 λ 3 1 / 3 1 / 3
D 3 = diameter of the condensing section, (m);
L 3 = length of the condensing section, (m);
μ = dynamic viscosity of the saturated liquid, (Pa∙s);
λ = thermal conductivity of the saturated liquid, (W/(m2∙K));
ρ = density of the saturated liquid, (kg/m3);
h f g = latent heat of vaporization, (kJ/kg).
The fluid filling volume in the liquid tube is determined with Equation (7):
M 4 = A 4 L 4 ρ
A 4 = cross-sectional area of the liquid tube, (m2);
L 4 = length of the liquid tube, m.
Consider the partial liquid charge at the time of heat pipe startup and regeneration and multiply the value by a factor of 1.05 to determine the overall liquid charge of the separated heat pipe, as shown in Equation (8):
M = 1.05 × ( M 1 + M 2 + M 3 + M 4 )

4.2. Method 2

Hong Zhang [20] proposed a method for calculating the refrigerant charge of a separated heat pipe, also considering the refrigerant charge in the evaporating section, the condensing end and the connecting piping, which can be expressed as follows:
On the evaporation side, Equation (9) applies the following:
G 1 = i = 1 n [ ε i ρ v A + ( 1 ε i ) ρ l A ] δ z
ε i = gas content in the inner cross-section of the pipe;
ρ v = density of gas-phase materials, (kg/m3);
A = pipe cross-sectional area, (m2);
ρ l = liquid-phase mass density, (kg/m3);
δ = liquid film thickness, (m);
z = axial position, (m).
The amount of vapor in the rising tube can be obtained by Equation (10):
G 2 = V v N A s L s ρ v
V v N = vapor-phase fluid flow rate, (m/s);
A s = riser cross-section, (m2);
L s = riser tube length, (m).
On the condenser side, refer to Equation (11):
G 3 = 4 q c 7 h f g L c 2
q c = heat flow density in the condensing section, (W/m2);
h f g = latent heat of vaporization, (J/kg);
L c = length of the condenser section, (m).
The volume of the liquid in the drop tube can be calculated by Equation (12):
G 4 = ρ l A x L x
A x = drop tube cross-sectional area, (m2);
L x = drop tube length, (m).
The volume of liquid missing on the evaporation side is determined via Equation (13):
G 5 = ( L h Z B ) π r i 2 ρ l
L h = heating section pipe length, (m);
Z B = burnout location, (m);
r i = inside radius of the pipe, (m).
For the fluid charge needed for heat pipe startup,
G 6 is generally set to 5%.
The separate heat pipe system’s charging volume is determined with Equation (14):
G = G 1 + G 2 + G 3 + G 4 + G 5 + G 6

4.3. Method 3

There is currently an empirical algorithm for calculating the refrigerant charge of vapor compression refrigeration systems, as expressed in Equation (15):
M = ( V 1 × 75 % + V 2 × 85 % + V 3 × 15 % + V 4 + V 5 × 15 % ) × ρ l + V 6 × ρ g
V 1 = volume of the evaporator, (m3);
V 2 = volume of the reservoir, (m3);
V 3 = volume of the gas–liquid separator, (m3);
V 4 = volume of the tube, (m3);
V 5 = volume of the condenser, (m3);
V 6 = tracheal volume, (m3);
ρ l = density of the saturated liquid refrigerant at the evaporating temperature, (kg/m3);
ρ g = density of the saturated gaseous refrigerant at the condensing temperature, (kg/m3).
In our study, the refrigerant charge of the refrigerant pump heat pipe system was calculated using this method, and the results are shown in Table 7.
These three methods consider the refrigerant charge of each component of the entire separated heat pipe system, but in regard to the evaporative condensation refrigerant pump heat pipe unit in this experiment, since the refrigerant pump was used to provide power for the whole separated heat pipe system, the liquid reservoir was an important component to ensure the normal operation of the refrigerant pump. Notably, Methods 1 and 2 lacked the consideration of the refrigerant quantity in the liquid reservoir. The final refrigerant charge obtained by the three methods was as follows: Method 1, 34.65 kg; Method 2, 33.59 kg; and Method 3, 29.94 kg.
To study the influence of the different charging amounts on the heat transfer performance of the refrigerant pump heat pipe system, the charging amount was adjusted from 28 to 36 kg, and the unit was operated in the dry mode, thereby assessing the cooling capacity of the unit and the primary side air outlet temperature, and the results are shown in Figure 15. When the charging amount was 32 kg, the highest cooling capacity of the unit was 112.1 kW, and the lowest primary air outlet temperature was 22.3 °C, which showed that the optimal refrigerant charging amount of the refrigerant pump heat pipe system of this unit was 32 kg.
In addition, the pressure difference between the inlet and outlet of the refrigerant pump decreased with the decreasing refrigerant charge. Via the analysis, it was found that when the refrigerant charge was decreased, the liquid refrigerant in the reservoir decreased, so the refrigerant entering the refrigerant pump decreased, which led to a lower mass flow rate of refrigerant in the refrigerant pump. Therefore, we believed that there was still room for refrigerant charging in the reservoir. The refrigerant charge in the reservoir increased from 85% to 100%, i.e., 2.43 kg of refrigerant was added, and the refrigerant charge of the heat pipe system of the refrigerant pump was 32.37 kg, which was essentially the same as the experimental results. Since the suction force of the refrigerant pump was lower than that of the compressor, the amount of refrigerant in the reservoir was more important, and if there was too much gaseous refrigerant in the reservoir, this could easily result in the refrigerant pump not being able to suction the liquid, and the refrigeration capacity of the heat pipe system of the refrigerant pump could be reduced.
Therefore, an improved simple algorithm for refrigerant charging was proposed, as expressed in Equation (16):
M = ( V 1 × 75 % + V 2 + V 3 × 15 % + V 4 + V 5 × 15 % ) × ρ l + V 6 × ρ g
V 1 = volume of the evaporator, (m3);
V 2 = volume of the reservoir, (m3);
V 3 = volume of the gas–liquid separator, (m3);
V 4 = volume of the tube, (m3);
V 5 = volume of the condenser, (m3);
V 6 = tracheal volume, (m3);
ρ l = density of the saturated liquid refrigerant at the evaporating temperature, (kg/m3);
ρ g = density of the saturated gaseous refrigerant at the condensing temperature, (kg/m3).
The optimal charge of refrigerant in the refrigerant pump heat pipe system of this unit was 32 kg. At this time, the maximum cooling capacity of the unit was 112.1 kW, and the minimum outlet temperature of the primary side was 22.3 °C, which was 32.37 kg, calculated by the simple algorithm proposed, this is basically consistent with the experimental results.
For refrigerant pump heat pipe systems, the refrigerant charge in the reservoir should not be neglected, and the refrigerant charge in the reservoir of this unit accounted for 50% of the total refrigerant charge of the system. The improved calculation method provides a novel idea for the calculation of the refrigerant charge of the refrigerant pump heat pipe system, and the improved calculation method can be better applied to the design of a new unit.

5. Conclusions

In this paper, we describe the advantages of using a microchannel heat pipe evaporative condensation air-conditioning unit with a microchannel heat exchanger and evaporative condensation, introduce the working principle of the unit and three working modes, and conduct experimental tests of the unit heat pipe system and mechanical refrigeration system. The following conclusions can be obtained:
(1)
The maximum refrigeration capacity of the unit in the dry, wet, and mixed modes was 112.1, 105.8, and 115.4 kW, respectively, and the primary-side air outlet temperatures were 22.3, 23.9, and 22.6 °C, respectively. The optimal air volume ratios were 2.2, 1.8, and 1.8, respectively. The energy efficiency of the unit was assessed, yielding the order of dry mode > wet mode > mixed mode, and the energy efficiency of the unit gradually decreased with the increasing air volume ratio.
(2)
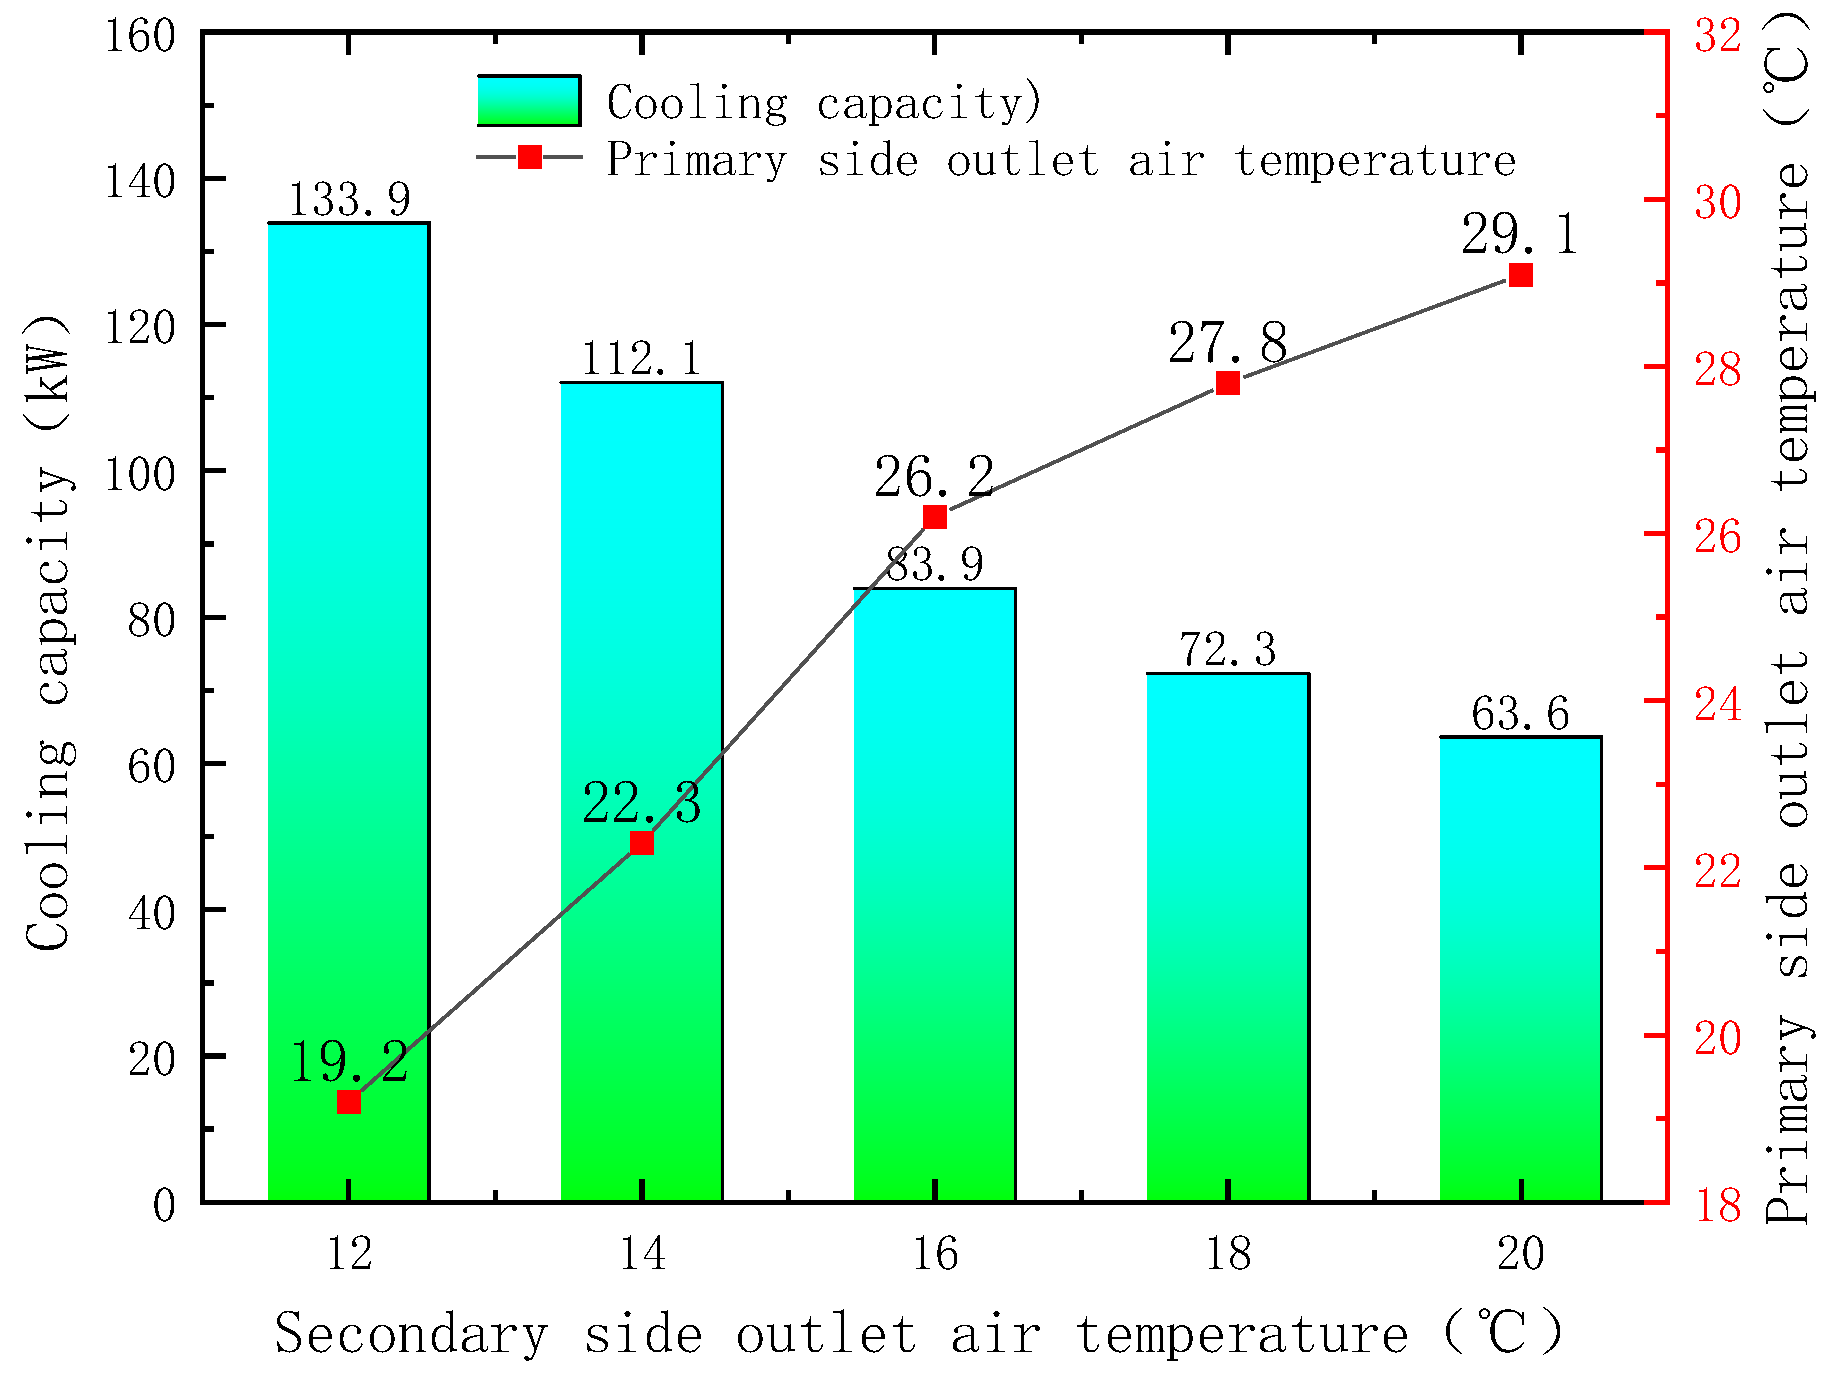
As the outdoor dry- and wet-bulb temperatures increased, the cooling capacity of the unit gradually decreased. The dry-bulb temperature of the air on the secondary side impacted the cooling capacity in the dry mode, and the wet-bulb temperature of the air on the secondary side influenced the cooling capacity in the wet mode. When the dry-bulb temperature of the air on the secondary side was 12~20 °C, the EER in the wet mode was better than that in the dry mode, and in areas with a sufficient water supply, the duration of the wet mode could be extended at temperatures ranging from 10 to around 14 °C to improve the energy efficiency of the unit.
(3)
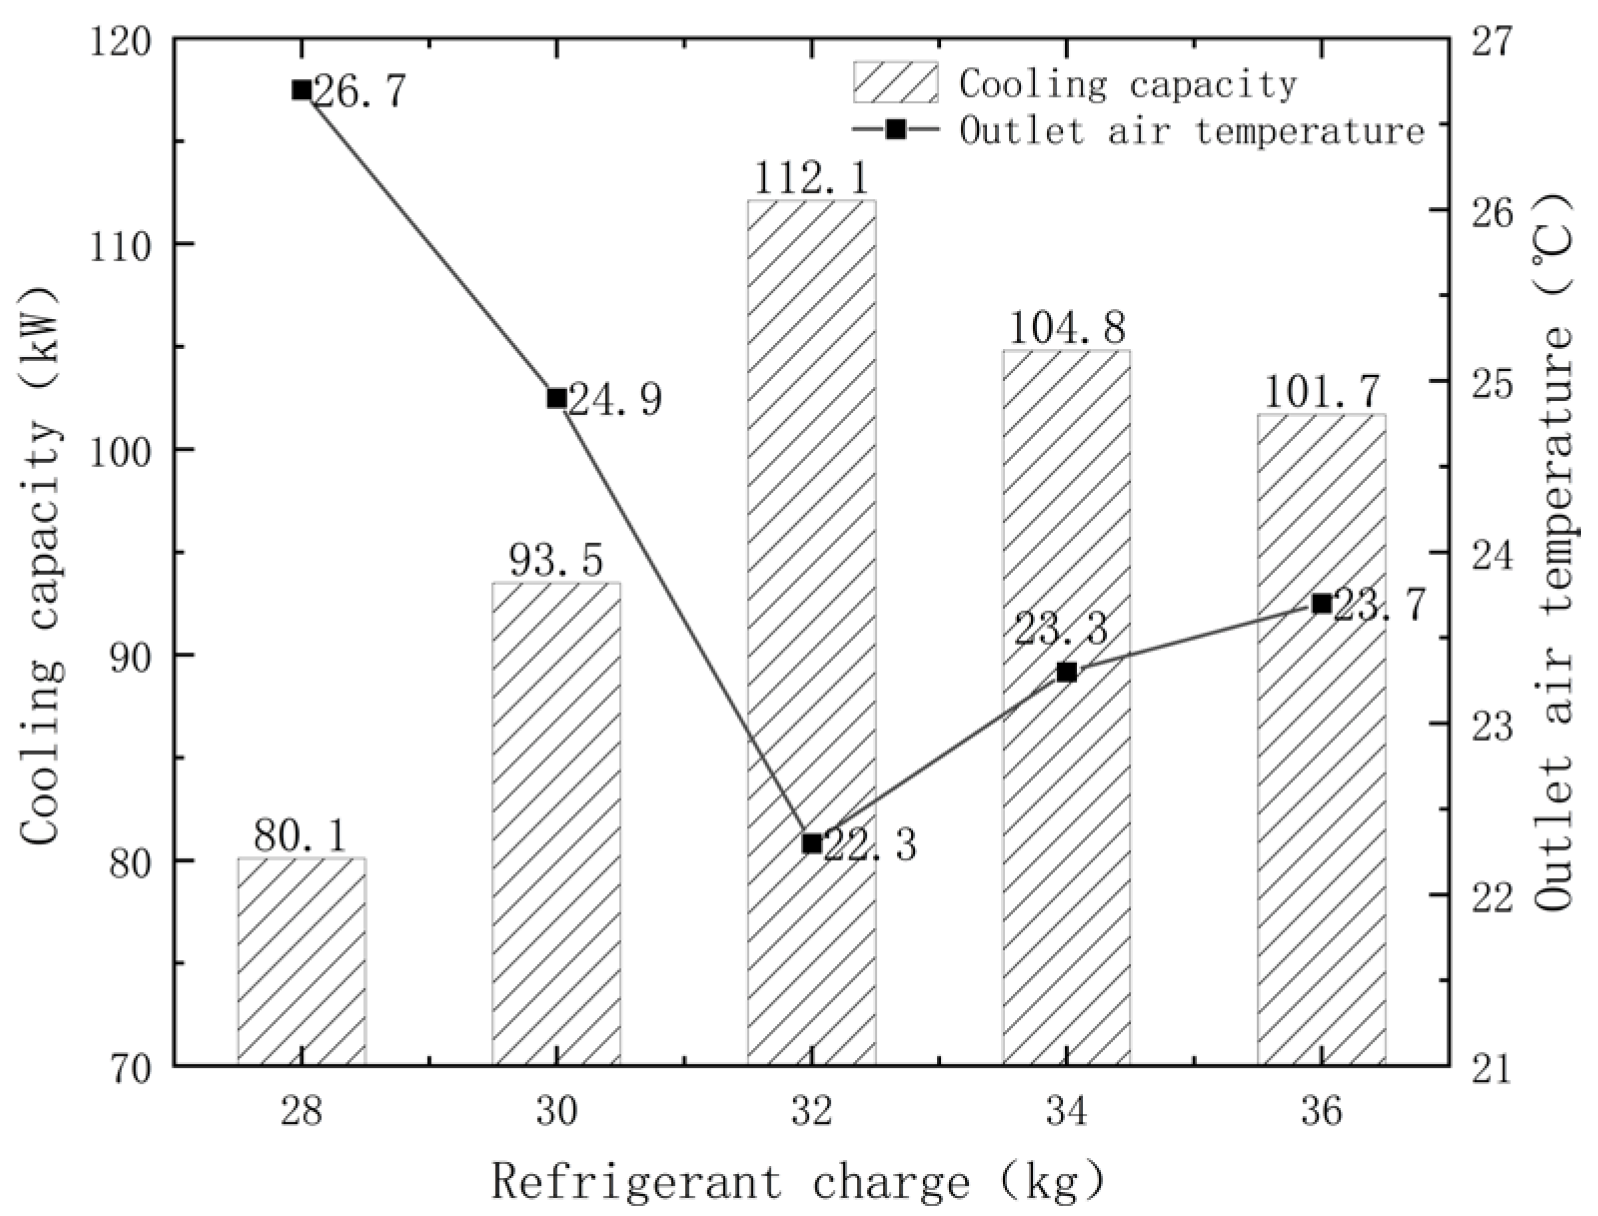
The optimal refrigerant charge of the refrigerant pump heat pipe system of the unit was 32 kg, at which point the cooling capacity of the unit was the highest, measuring 112.1 kW, and the primary-side air outlet temperature was the lowest, at 22.3 °C, which was essentially consistent with the value of 32.37 kg calculated by the proposed simple algorithm.

Author Contributions

Conceptualization, X.H.; methodology, J.C., L.Y. and J.T.; software, J.C., H.C., W.L., X.T. and J.T.; resources, X.T.; writing – original draft, J.C.; writing – review & editing, H.C., L.Y., W.L. and X.T.; funding acquisition, X.H. All authors have read and agreed to the published version of the manuscript.

Funding

This research was funded by (1) Opening Funds of State Key Laboratory of Building Safety and Built Environment (Grant No. BSBE-EET2024-04); (2) Key Project of Scientific Research Plan of Shaanxi Provincial Department of Education (No. 24JR069); and (3) Xizang Autonomous Region Technological Innovation Guidance Plan Project: Research and Application of Key Technologies for Intelligent Computing Integration (No. XZ202501JX0005).

Data Availability Statement

The data presented in this study are available on request from the corresponding author.

Conflicts of Interest

Author Xing Tang was employed by the company LUE-ON (Jiangsu) Environmental System Co., Ltd. The remaining authors declare that the research was conducted in the absence of any commercial or financial relationships that could be construed as a potential conflict of interest.

References

  1. Wang, Q. Competitive Landscape and Market Share of China’s Data Center Industry. Data Cent. Constr. 2021, 8, 4. [Google Scholar]
  2. Jiang, L.-L.; Tang, Y.; Zhou, W.; Jiang, L.-Z.; Xiao, T.; Li, Y.; Gao, J.-W. Design and fabrication of sintered wick for miniature cylindrical heat pipe. Trans. Nonferr. Met. Soc. China 2014, 24, 292–301. [Google Scholar] [CrossRef]
  3. Liu, C.; Chen, Y.; Feng, D.; Zhang, H.; Miao, J.; Feng, Y.; Yan, Y.; Zhang, X. Experimental study on temperature uniformity and heat transfer performance of nitrogen loop heat pipe with large area and multi-heat source. Appl. Therm. Eng. Des. Process. Equip. Econ. 2022, 210, 118344. [Google Scholar] [CrossRef]
  4. Ma, G.Y.; Wei, C.C.; Zhang, S.; Zhou, F. Application of a pumped loop heat pipe heat exchanger unit for a small data center. Beijing Gongye Daxue Xuebao/J. Beijing Univ. Technol. 2015, 41, 439–445. [Google Scholar]
  5. Dong, J.; Lin, Y.; Deng, S.; Shen, C.; Zhang, Z. Experimental investigation of an integrated cooling system driven by both liquid refrigerant pump and vapor compressor. Energy Build. 2017, 154, 560–568. [Google Scholar] [CrossRef]
  6. Yan, G.; Feng, Y.; Peng, L. Experimental analysis of a novel cooling system driven by liquid refrigerant pump and vapor compressor. Int. J. Refrig. 2015, 49, 11–18. [Google Scholar] [CrossRef]
  7. Liu, S.; Ma, G.; Jiao, X.; Xu, S.; Wu, G. Performance of a mechanically-driven loop heat pipe heat recovery system. Appl. Therm. Eng. 2022, 207, 118066. [Google Scholar]
  8. Chen, F.; Zhou, X.; Liao, S. Energy Saving Model and Calculation Example of Three Cooling Schemes for Data Center in Hot Summer and Cold Winter Area. J. Power Energy Eng. 2022, 9, 1–20. [Google Scholar]
  9. Ohadi, M.M.; Dessiatoun, S.V.; Choo, K.; Pecht, M.; Lawler, J.V. A comparison analysis of air, liquid, and two-phase cooling of data centers. In Proceedings of the 2012 28th Annual IEEE Semiconductor Thermal Measurement and Management Symposium (SEMI-THERM), San Jose, CA, USA, 18–22 March 2012; pp. 58–63. [Google Scholar]
  10. Wei, A.; Ren, X.; Lin, S.; Zhang, X. CFD analysis on flow and heat transfer mechanism of a microchannel Ω-shape heat pipe under zero gravity condition. Int. J. Heat Mass Transf. 2020, 163, 120448. [Google Scholar] [CrossRef]
  11. Han, Z.; Xue, D.; Wei, H.; Ji, Q.; Sun, X.; Li, X. Study on operation strategy of evaporative cooling composite air-conditioning system in data center. Renew. Energy 2021, 177, 1147–1160. [Google Scholar] [CrossRef]
  12. Yue, Z.; Shu, X.; Guo, Y.; Zhang, S. Characteristic Analysis and Experimental Study on a Hybrid System with Magnetic Pump-driven Two Phase Cooling System. J. Refrig. 2016, 37, 1–5. [Google Scholar]
  13. Lin, Y.; Liu, J.; Xu, X.; Liu, Z.; Li, G. Experimental Research on Air Conditioning System of a Computer Room Based on Refrigerant Pump Pressurization. J. Refrig. 2020, 41, 83–88. [Google Scholar]
  14. Xue, L.; Ma, G.; Zhou, F.; Li, F.; Yan, X.; Jiang, M. Performance Analysis of Gas-Pump-Driven Free-cooling Unit in a Small Data Center. J. Refrig. 2019, 40, 1–9. [Google Scholar]
  15. Bai, K.; Ma, G.; Zhou, F.; Zhang, S. Performance characteristics of pump-driven mechanical refrigeration and thermosyphon integrated system. Heat. Vent. Air Cond. 2016, 46, 109–115. [Google Scholar]
  16. Liu, Z.; Huang, X.; Chang, J.; Chang, J. Design and test analysis of evaporative cooling(condensation) air conditioning unit data center. Refrig. Air-Cond. 2020, 20, 6. (In Chinese) [Google Scholar]
  17. GB 50174-2017; Code for Design of Data Centers. China Planning Press: Beijing, China, 2017. (In Chinese)
  18. T/DZJN 27-2021; Evaporative Cooling Iir—Conditioning Equipment of Data Centers. China Planning Press: Beijing, China, 2021. (In Chinese)
  19. Wang, W.; Xiong, R.; Tu, C. Analysis of the Filling Quantity for Separated Type Heat Pipe. Power Eng. 1997, 03, 67–69 +73. (In Chinese) [Google Scholar]
  20. Zhang, H. Inverstigation on the optimized working status of separated type heat pipe heat exchangers. Petrochem. Equip. Technol. 1996, 3, 13–17+65. (In Chinese) [Google Scholar]
Figure 1. System diagram.
Energies 18 02356 g001
Figure 2. Principle and structure diagram of the evaporation and condensation microchannel separation heat pipe unit.
Energies 18 02356 g002
Figure 3. Working process of the secondary/primary air in three operating modes of the unit.
Energies 18 02356 g003
Figure 4. Outline drawing of the air-conditioning unit.
Energies 18 02356 g004
Figure 5. Physical diagram of the unit.
Energies 18 02356 g005
Figure 6. Unit test site.
Energies 18 02356 g006
Figure 7. Layout of the air volume measurement points.
Energies 18 02356 g007
Figure 8. Different air volume ratios under the unit’s dry mode.
Energies 18 02356 g008
Figure 9. Different air volume ratios under the unit’s wet mode.
Energies 18 02356 g009
Figure 10. Unit’s supplementary cooling mode for different air volume ratios.
Energies 18 02356 g010
Figure 11. EER and cooling capacity of the unit for the different air volume ratios.
Energies 18 02356 g011
Figure 12. Influence of the secondary-side inlet air temperature on the unit’s cooling capacity in the dry mode.
Energies 18 02356 g012
Figure 13. Influence of the secondary-side inlet air temperature on the unit’s cooling capacity in the wet mode.
Energies 18 02356 g013
Figure 14. EER changes in units at different temperatures.
Energies 18 02356 g014
Figure 15. Relationship between refrigerant charge, cooling capacity, and outlet air temperature.
Energies 18 02356 g015
Table 1. Unit operating modes and equipment startup and shutdown conditions.
ModeAmbient Air ParametersFanWater PumpRefrigerant PumpCompressor
Dry modeTdb ≤ 14 °CONOFFONOFF
Wet modeTdb > 14 °C, Twb ≤ 14 °CONONONOFF
Mixed modeTwb > 14 °CONONONON
Table 2. Heat pipe system parameters.
ParametersValueUnit
Cooling capacity120kW
Primary air volume30,000m3/h
Secondary air volume66,000m3/h
Primary air temperature25°C
Primary air return temperature38°C
Air velocity2.24m/s
Area3.72m2
Table 3. Mechanical refrigeration system parameters.
ValueUnit
RefrigerantR410a
Cooling capacity60kW
Primary air volume30,000m3/h
Secondary air volume66,000m3/h
Evaporation temperature17°C
Condensation temperature50°C
Table 4. Unit experimental conditions.
ModeOutdoor SideIndoor Side
Air Inlet StateAir Inlet State
Dry Bulb (°C)Wet Bulb (°C)Dew Point (°C)Air Volume (m3/h)Dry Bulb (°C)Wet Bulb (°C)Dew Point (°C)Air Volume (m3/h)
Dry mode35.019.510.630,00038.022Not lower than the tap water temperature66,000
Wet mode17131038.022Not lower than the tap water temperature
Mixed mode14//38.022/
Table 5. Test instruments.
EquipmentTest ContentMeasuring RangeAccuracy Requirement
Testo 174H Temperature and Humidity Recorder (Titisee-Neustadt, Germany)Dry-bulb temperature
Relative humidity
0~100 °C; 0~100%±0.5 °C/±3%
Testo 410-1 Impeller Anemometer (Titisee-Neustadt, Germany)Wind speed0.40~20.0 m/s±(0.2 m/s + 2% measured value)
Testo 869 Infrared Thermal Imager (Titisee-Neustadt, Germany)Infrared thermal imaging−20~ + 280 °CThermal sensitivity < 0.12 °C
Table 6. Wind speed and fan input ratio under different air volume ratios.
Air Volume RatioSecondary Air Volume (m3/h)Secondary Air Velocity (m/s)Percentage of Fan Input (%)
0.824,0002.240
130,0002.855
1.236,0003.363
1.442,0003.970
1.648,0004.482
1.854,0005.088
260,0005.590
2.266,0006.1100
Table 7. Refrigerant charge of each component.
ComponentVolume (m3)Refrigerant Charge (kg)
Evaporator0.012311.07
Condenser0.01673.01
Reservoir0.013513.77
Gas–liquid separator0.01061.908
Liquid lines0.0001470.18
Gas lines0.0001610.0066
Disclaimer/Publisher’s Note: The statements, opinions and data contained in all publications are solely those of the individual author(s) and contributor(s) and not of MDPI and/or the editor(s). MDPI and/or the editor(s) disclaim responsibility for any injury to people or property resulting from any ideas, methods, instructions or products referred to in the content.

