Article

Techno-Economic Comparison of a Large-Scale Nuclear Power Plant, Small Modular Reactors, and Wind and Solar Power Plant Deployment

by
Sanja Milivojevic
1,*,
Milan M. Petrovic
1,
Vladimir D. Stevanovic
1,
Jovica Riznic
2 and
Milos Lazarevic
1
1
Faculty of Mechanical Engineering, University of Belgrade, Kraljice Marije 16, 11120 Belgrade, Serbia
2
Department of Mechanical and Manufacturing Engineering, Ontario Tech University, 2000 Simcoe Street North, Oshawa, ON L1G 0C5, Canada
*
Author to whom correspondence should be addressed.
Energies 2025, 18(9), 2355; https://doi.org/10.3390/en18092355
Submission received: 11 April 2025 / Revised: 30 April 2025 / Accepted: 3 May 2025 / Published: 5 May 2025
(This article belongs to the Section C: Energy Economics and Policy)

Abstract

:
A comparison of the net present value, the payback period, and the levelized cost of electricity for three different projects of construction and exploitation of plants for electricity production with the aim of decarbonizing the energy sector is conducted. The first project is the building of a large-scale nuclear power plant with a light-water reactor, the second one is the deployment of several identical small modular reactors, and the third project is based on solar and wind power plants. Given that the sun and wind are intermittent renewable energy sources, it is inevitable to take into account the construction of an energy storage facility in the last project. The results show that the most profitable are the small modular reactors, while the investment into solar and wind power plants is burdened with the necessary electricity storage plant costs. Another drawback of an investment in solar and wind power plants is their shorter exploitation lifetime of 25 years compared to the long-term operation of nuclear power plants of 60 years or even more.

1. Introduction

The Republic of Serbia joined the Energy Community for Southeast Europe by signing the Energy Community Treaty in 2005. This Treaty was ratified in 2006 [1]. The Ministerial Council of the Energy Community defined the obligations of member states regarding the increase in the use of renewable energy sources and the reduction of carbon dioxide emissions and other greenhouse gases [2]. Serbia’s obligations are to increase the share of renewable energy in gross final energy consumption from 24.67% in 2022. [3] to 40.7% by 2030. This significant, nearly double increase in the share of renewable energy sources within a relatively short period of five years requires a substantial reduction in the consumption of fossil fuels, primarily coal, which accounted for 49.4% of total gross energy consumption in 2020 [4]. The Republic of Serbia is obligated to reduce its total anthropogenic carbon dioxide equivalent emissions, including emissions from agricultural activities, by 40.3% by 2030 compared to emissions in 1990, with the target emissions for 2030 set at 47.82 MtCO2eq. In addition to this, the European Union (EU) began the transitional phase of implementing the “Carbon Border Adjustment Mechanism (CBAM)” on October 1, 2023 [5]. This mechanism involves the payment of taxes within the EU for the import of certain goods produced outside the EU, whose production involves intensive carbon dioxide emissions. So far, the following products are subject to CBAM: cement, iron, steel, aluminum, fertilizers, electricity, and hydrogen. The transitional period for adjustment, monitoring, and development of the mechanism will last until 1 January 2026, after which the CBAM tax will be implemented. The application of the CBAM mechanism will have a significant impact on Serbia, as the EU is its largest foreign trade partner. Achieving the aforementioned goals of increasing the share of renewable energy, reducing greenhouse gas emissions, and adjusting to the restrictions imposed by the CBAM mechanism requires significant decarbonization of the energy sector.
This paper discusses the diversification of the energy mix of the Republic of Serbia, with the aim of reducing carbon dioxide emissions by using nuclear energy and also renewable energy sources, such as wind and solar. Three projects are taken into account: the building of a large-scale nuclear power plant (LS NPP) with a pressurized water reactor (PWR) with a net capacity of 1200 MWel, implementing four small modular reactors (SMR) as a new and modern technology, with a net capacity of 300 MWel each, and the construction of solar power plants with a total net capacity of 3033 MWel and wind power plants with a total net capacity of 1706 MWel, which will meet the needs of the electricity consumer in the same way as the previous two projects. Solar and wind are complementary sources during a yearly period. Solar availability is maximum during the summer period, while wind prevails during the winter. The proposed total solar and wind powers of 3033 MWel and 1706 MWel, respectively, would produce approximately the same amount of electricity.
The use of nuclear energy brings with it the issue of security and safety. However, modern nuclear power plants based on passive protection systems (III and III+ generation) significantly reduce the risk of nuclear accidents. Experience in the nuclear industry, based on 20,000 reactor years of operation, is a strong basis for developing both LS NPP and NPP with SMRs with convincing safety features. Also, previous experience shows that nuclear energy is stable in relation to disruptions in the energy market, given that the fuel costs and the possibility of fuel supply are more stable in relation to the supply and costs of natural gas and oil, where prices are very volatile and depend on geopolitical conditions.
The implementation of renewable energy sources in existing energy systems raises the issue of distributing electricity to end consumers. In [6], the authors propose a decentralized and hybrid-triggered control mechanism for secondary regulation in direct current (DC) microgrids. They demonstrate that this approach improves system stability, which is crucial for achieving efficient load sharing within the microgrid. With the implementation of renewable energy sources, the challenge of managing various forms of time-varying energy within microgrids and distributing them efficiently to end users arises. Unlike traditional approaches found in the literature, the paper [7] proposes the two-stage stochastic energy model, which is used to schedule and satisfy local energy demand in rural places. Rehmani et al. [8] evaluated the techno-economic and environmental benefits of repowering an isolated rural microgrid at its midlife stage. Through a simulation-based analysis, the authors showed that targeted upgrades can enhance energy efficiency, reduce emissions, and improve the economic viability of microgrid systems in isolated rural areas.
The sun and wind are intermittent renewable energy sources, so amounts of electricity produced from these sources must be accumulated to be available to consumers when they need it. Based on meteorological data (regional and local), it is possible to somewhat predict the time intervals in which solar power plants and wind power plants will produce electricity. The operation of solar power plants and wind power plants cannot be regulated except by reducing and interrupting production [9]. In such operating conditions of the power system, it is necessary to consider and select the appropriate technology for energy storage.
Figure 1 shows the available technologies for energy storage, depending on the level of development of storage technology on the one hand and capital costs and technological risk on the other [10]. The pumped hydroelectric energy storage (PHES) or reversible hydroelectric power plant is flexible because it works on the principle of pumping water from the lower reservoir or the river into the upper reservoir when electricity demand is lower, and it produces energy using water from the upper reservoir when the demand increases. PHES produces peak energy to cover maximum daily consumption, which is the most expensive energy on the electricity market. The PHES technology is mainly based on the application of existing equipment whose performance has been confirmed in engineering practice and has the lowest values of capital costs per unit of stored electricity and technological risk. PHES is considered an option for energy storage in the case example of the Republic of Serbia due to the certain construction of the reversible hydropower plant Bistrica in the near future. The other stand-out technologies that are in the implementation phase include plants with compressed air, various electrochemical batteries (NaS, Li-ion, …), flywheels, and plants for heat storage with molten salts. The problem with using Li-ion batteries is their flammability. In 2024, the largest number of incidents of 84 (appearance of smoke, fire, device overheating) was recorded in the past 10 years [11]. The risk of self-ignition depends on the condition of the batteries and increases due to shocks or during transport. In the energy sector, there would be a large number of batteries in the same place, which would significantly increase the risk of fire and danger to the environment.
Some recent accidents with fires on board (Holland America’s Nieuw Amsterdam ship) have shown that the use of Li-ion batteries should be accepted as a risk. This impact on the environment is local. Considering the size of the market, it is expected that future accidents will not affect the economics of their application. This is the topic of future research, which is out of the scope of the present paper.
Nowadays, energy storage technologies are being developed and polished, e.g., solid-state batteries and green hydrogen, but they are still under development, and it can be expected that their cost of storing energy is higher than the PHES [12].
In the Republic of Serbia, the reversible hydropower plant Bajina Basta, with an installed capacity of 2x310 MW, has a water storage capacity of 150 million m3. By emptying the upper lake, 194 GWh of net electricity can be produced. The construction of the reversible hydropower plant Bistrica, with an installed capacity of 4x164 MW, is planned in western Serbia, in the valley of the Uvac and Lim rivers, with a storage capacity of 70 million m3 in the upper Klak reservoir, which is 310 GWh, representing support for 1.5 GW of renewable energy sources. The expected time of completion of the works is 2032 [13].
In the present study, the net capacities of the solar and wind power plants are determined from the condition that they, together, produce the same amount of electricity for a given year as a large-scale nuclear power plant or a power plant with SMRs. The accepted value of the capacity factor, which is the ratio of the produced energy in a certain period to the maximum produced energy in that period for a solar power plant in Serbia, is 18% [14] and 32% for a wind power plant [9,15]. The reference [16] shows that the maximum capacity factor for solar power plants is 20%, while for wind power plants, it goes over 50%. Given that the capacity factor for offshore wind is usually higher, and Serbia is a landlocked country, it was, therefore, not considered. The capacity factor for LS NPP with PWR and NPP with SMR is 91%, although SMR vendors state that a capacity factor for their SMR is 95% or more [16,17]. The capacity factor changes from year to year depending on the annual production achieved, with expected changes, so there are data on the capacity factor that vary over a wide range. Figure 2 shows the range of capacity factors from the report that contains data for 243 plants in 24 countries [16].
Levelized cost of electricity (LCOE) is the production price of electricity from a certain source at which no profit is generated but also no losses are incurred. It represents an economic assessment of the costs of electricity production, which includes all the costs of the plant incurred during its operating lifetime, namely capital costs, operations and maintenance (O&M) costs, fuel costs, and decommissioning costs. Sometimes, LCOE calculation takes into account carbon costs [16].
The LCOE is a tool for comparing unit costs at the plant level for different base technologies of electricity production during their working life. It represents the economic costs of production technology, not the financial costs of a specific project in a specific market, and it is closer to the cost of electricity production in regulated markets with stable prices than in unregulated markets with variable prices.

2. Methods

The cost calculation and following analysis are performed based on the adopted value of the total overnight cost for considered technologies: USD 7777/kW for LS NPP with light-water nuclear reactor, USD 8349/kW for NPP with SMR, USD 1808/kW for a solar power plant, and USD 2098/kW for a wind power plant [18]. These construction prices are for a typical plant for each electricity-generating technology before adjusting for regional cost factors. Also, the total overnight cost excludes interest income during the period of plant construction and development. The total overnight costs for wind power plants are without energy storage, and for solar power plants, they take into account daily energy storage. The total investment for building an LS NPP with PWR is USD 9332 M, USD 2505 M for one SMR, USD 5484 M for a solar power plant, and USD 3579 M for a wind power plant. Energy from solar and wind power plants must be stored, which makes it difficult to increase the share in the consumption structure and creates technical, financial, and environmental problems. The increase in the share of energy from solar and wind power plants is associated with the costs of their integration into the electricity grid, which many times exceed the costs of building the power plants themselves [9]. For the capital costs for building the PHES, the lowest recommended value of USD 5/kWh, according to [19], was adopted. In order to cover the production of electricity from the sun and wind, a storage capacity of at least 620 GWh (or 3 GW) is required. Hence, the total investment cost in PHES is USD 3100 M.
The common economic and financial performance indicator is the net present value (NPV). It is calculated using the following expression:
N P V = t = T 1 T 2 D t 1 + d t t = 0 T 2 R t 1 + d t
where
  • D t —net operating income in year t (USD);
  • R t —investments and other expenses in year t (USD);
  • d —discount rate (-);
  • T 1 —construction period in years;
  • T 2 projected exploitation lifetime in years;
  • t —discrete time in years.
In Equation (1), annual incomes, revenues from the sale of electricity achieved during the operating life of the plant, are discounted to the present value; from the obtained value the discounted value of the investments and other expenses is subtracted, such as fuel and decommissioning and O&M costs, and the NPV is obtained. If NPV has a positive value, the investment is justified. The payback (PB) period is determined with the NPV equal to zero.
The LCOE calculation is based on the equality of the present value of the sum of discounted revenues on the lefthand side of Equation (2) and the present value of the sum of discounted costs on the righthand side of Equation (2) [16], as follows:
t = 1 n E t c e 1 + d t = t = 1 n I t + O M t + F t + C t + D t 1 + d t
where
  • E t —electricity generation in year t (MWh);
  • c e —electricity price (USD/MWh);
  • d —discount rate (-);
  • t —discrete time in years;
  • n —plant lifetime in years;
  • I t —investment (capital) costs in year t (USD);
  • O M t —operations and maintenance costs in year t (USD);
  • F t —fuel costs in year t (USD);
  • C t —carbon costs in year t (USD);
  • D t —decommissioning costs in year t (USD).
Taking into account the assumption that the electricity price has constant value over time, c e can be brought out of the sum sign and considered as LCOE:
L C O E = t = 1 n I t + O M t + F t + C t + D t 1 + d t t = 1 n E t 1 + d t .
The calculation was carried out using the following two assumptions:
-
The discount rate at which costs and benefits are discounted is stable and the same for all considered technologies and does not change its value during the lifetime of the project under consideration. Capital costs and the relevant discount rate may vary from technology to technology. Assuming that these costs are identical allows comparison of calculated LCOE values for different technologies and regions;
-
Electricity price is stable and does not change in time during the project’s lifetime. All electricity produced, with adopted capacity factors, was sold at this price.
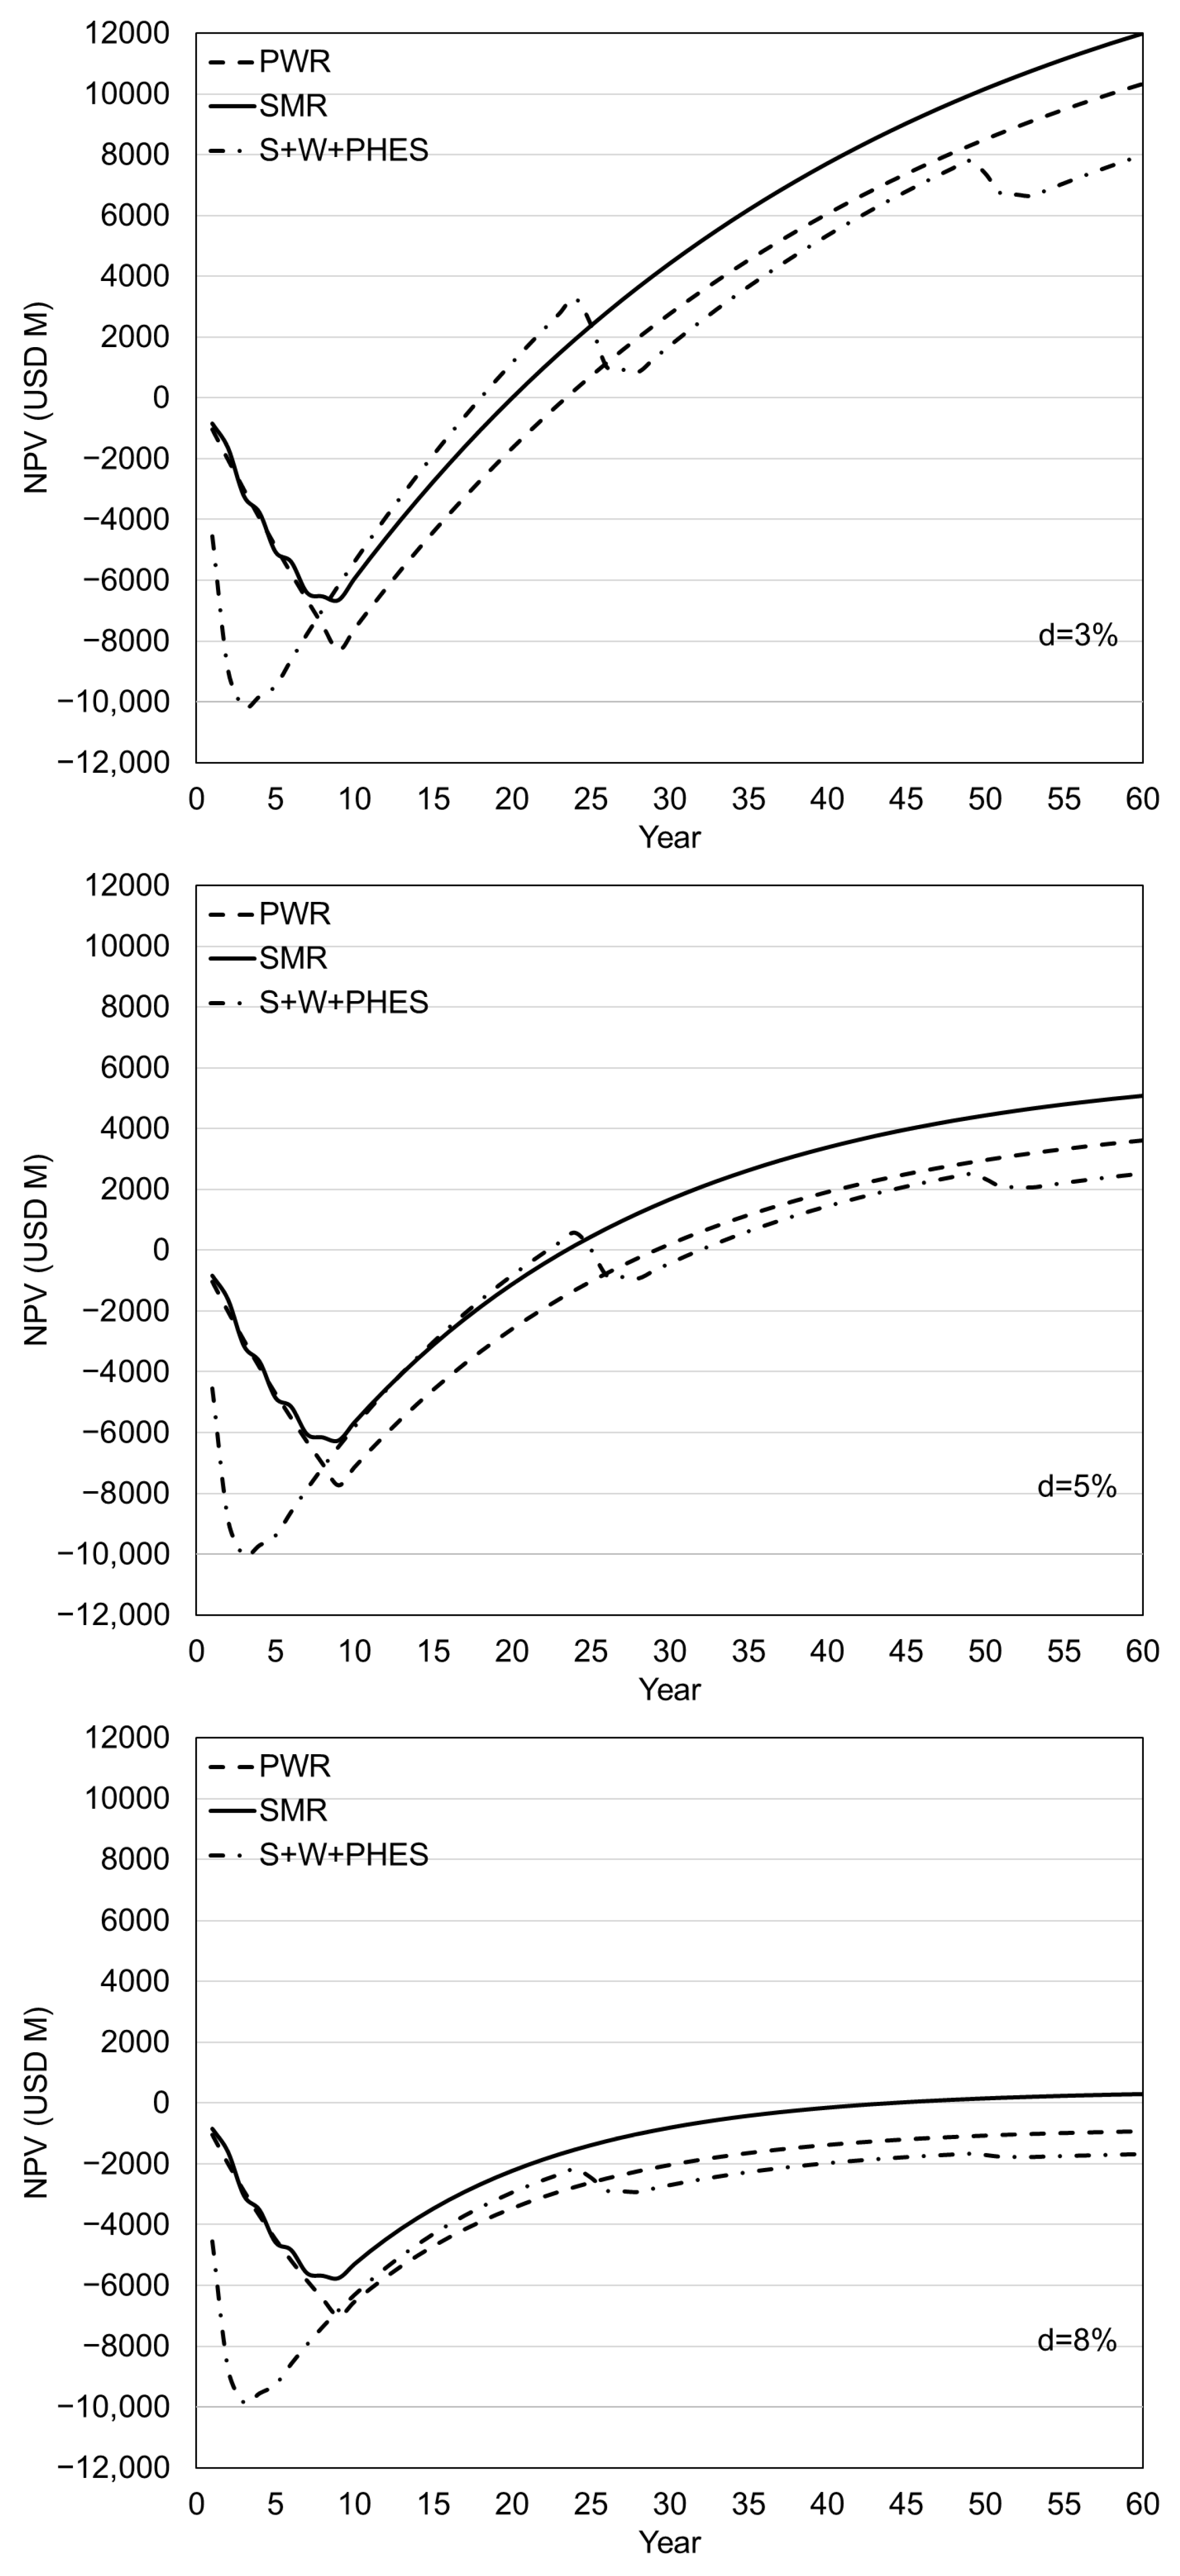
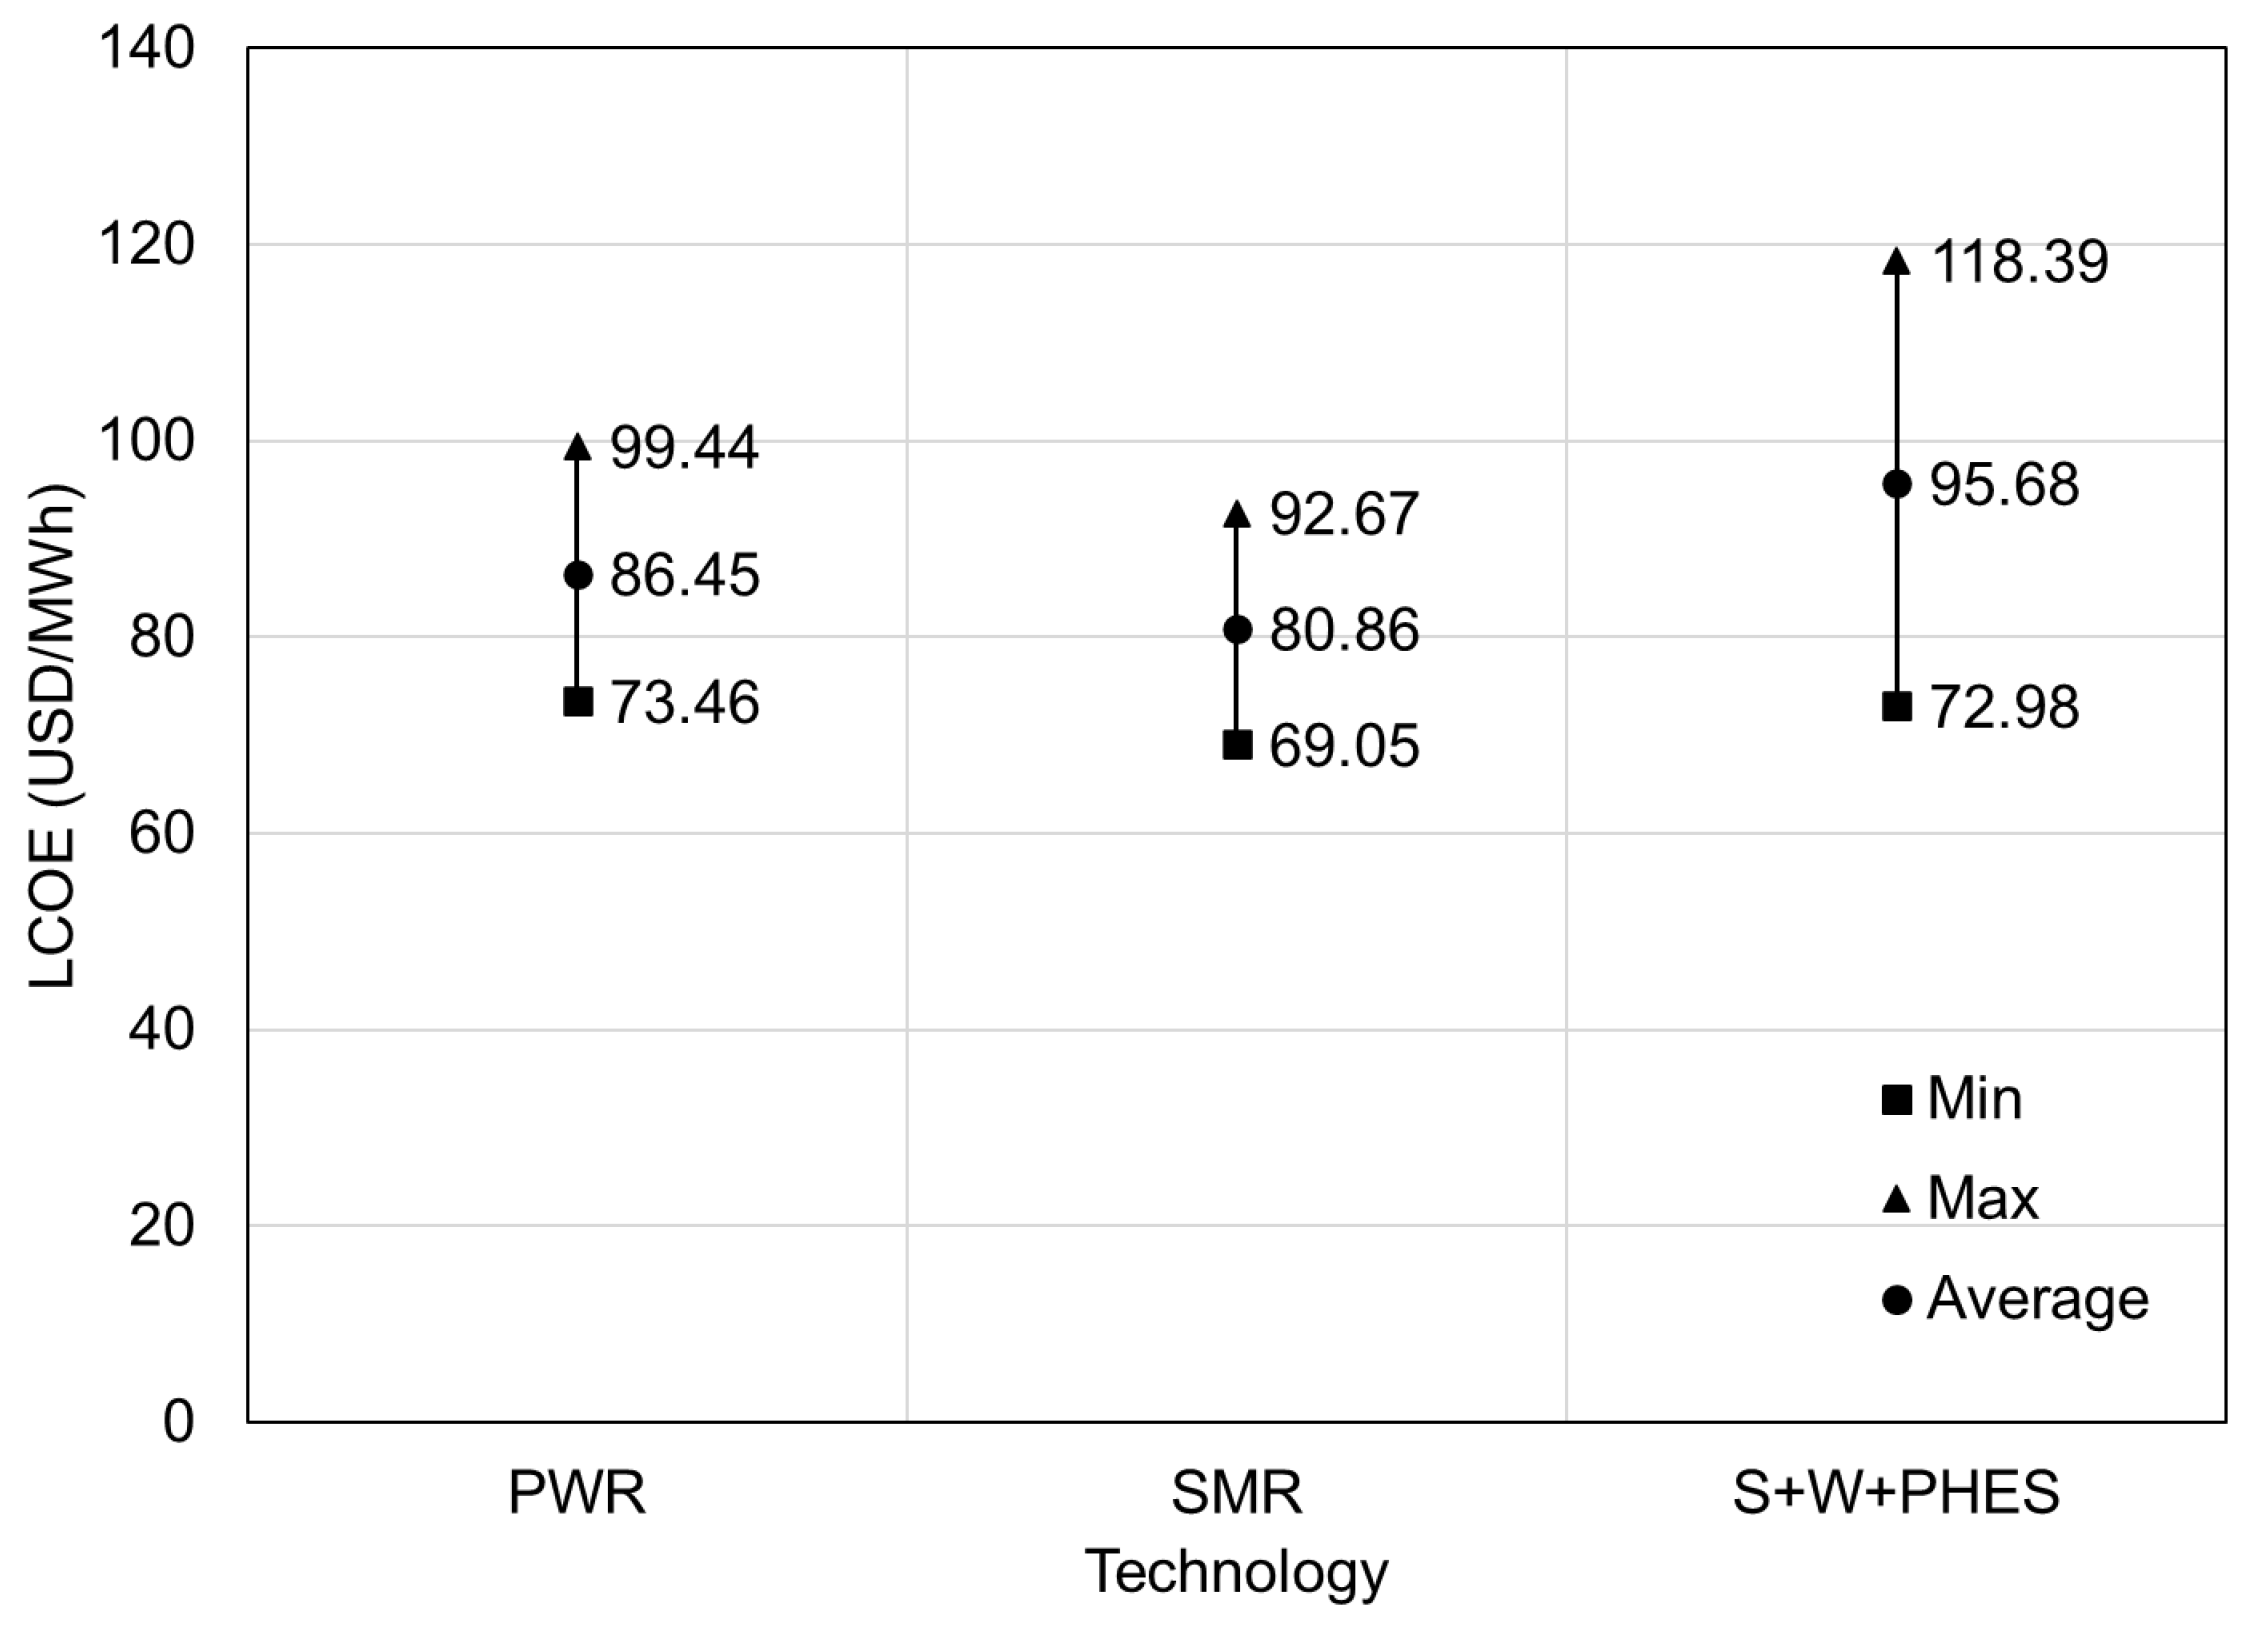
For a simpler approach, annual investments and net annual incomes are divided into equal annual installments.
The influence of the discount rate on the NPV, the PB period, and the LCOE is shown by performing calculations with 3%, 5%, and 8% of the discount rate. The discount rate of 3% corresponds approximately to the social cost of capital, the discount rate of 5% corresponds approximately to the cost of capital of a large utility in a deregulated or restructured market, and the discount rate of 8% corresponds approximately to the cost of capital in an environment with relatively higher risks [16]. Nominal discount rates would have a higher value due to taking inflation into account. In practice, capital costs and discount rates may vary across technologies, and assuming identical capital costs and interest rates for all technologies allows for cost comparisons across technologies and regions.
In the analysis, the NPV and the PB period are considered the electricity prices of 80/100/120 USD/MWh.
The expected period of exploitation of LS NPP and each SMR unit is 60 years, and for solar and wind power plants, it is 25 years [16,20]. For uniformity, the considered period in which the change in the NPV of these three projects was observed is 60 years from the 0 year, i.e., from the beginning of the construction of all plants. In that observed period, it is necessary to build new capacities of solar and wind power plants after the expiration of their period of exploitation (after 25 years of use).
The losses in the pump and turbine in PHES are not taken into account during calculation. The losses in renewable electricity transport will depend on the exact location of the solar and wind power plants, which is currently unknown. Also, the annual efficiency loss of 0.5%, i.e., the reduced output as their operational lifetime progresses, in solar photovoltaic (PV) assumed in [16] is not considered. Several studies have been conducted on efficiency losses in solar power plants during their operational lifetime. One such study indicates an average annual efficiency degradation of 0.75% [21]. Another paper [22] reports a slightly higher average annual degradation of 1.4%. When it comes to wind power plants, a 2020 study by Lawrence Berkeley National Laboratory revealed that the efficiency drop during the first 10 years of operation is around 0.17% annually. Additionally, in the study [23], it is shown that over a 19-year period, the average annual efficiency reduction for wind turbines is 1.6%, with a margin of error of ±0.2%. Furthermore, a study [24] based on data from 921 operational wind turbines indicates an annual efficiency drop of 0.63%. On the other hand, in the case of conventional nuclear power plants, numerous examples demonstrate that efficiency, production capacity, and safety can be significantly improved through plant retrofitting. Westinghouse has implemented over 150 power uprate programs based on measurement uncertainty recapture, stretch power uprate, and extended power uprate, resulting in an additional 5000 MWe capacity worldwide [25]. As seen in reference [26], the reference unit power for BWR-3000 in Oskarshamn 3 nuclear power plant in Sweden increased from 1055 MW in 1985 to 1400 MW in 2023.
It is evident from the above that the decrease in efficiency of solar and wind power plants would favor solutions involving SMRs and LS NPP. For this reason, these options were not considered in this study.
The subject analysis was made for a total construction period of 9 years for both the large-scale NPP and for all four SMRs. In the case of the project with the four SMRs, it means a successive construction of reactors with an assumed construction period of 3 years per SMR, while in the third year of the construction of one SMR, the construction of the next one starts. The average value for commissioning time for OECD and non-OECD countries for solar PV technology is 2 years, and for wind onshore, it is 3 years [27]. The construction period for PHES is 5 years. The construction timeline is shown in Figure 3.
The nuclear fuel costs per generated energy include costs for the front-end of the nuclear fuel cycle, which imply costs of mining, fuel enrichment, and conditioning of USD 7/MWh, and costs for the back-end of the nuclear fuel cycle, which include costs of spent fuel removal, disposal, and storage of USD 2.33/MWh [16]. The costs of recycling nuclear fuel are not considered here. In addition to fuel costs, it is necessary to include decommissioning costs in the analysis of the NPV of the projects. The decommissioning costs of an NPP depend on many factors, such as the type of the NPP, the equipment supplier, the age of the plant, the regulations of the country where it is located, the capacity of the plant, the location of the plant, etc., and they may vary from EUR 1 to 4 billion [28]. USD 1500 M was assumed for both the decommissioning of the large-scale NPP and the NPP with SMR with a total capacity of 1200 MW. The cost of the decommissioning of solar and wind power plants depends on whether the recycling of the equipment is foreseen at the end of the exploitation period or not. Currently, methods for recycling RES equipment are still under development. Gross costs of solar power plant decommission are estimated within a range of USD 0.03–0.20/W, which is around 3–20% of the initial installation costs [29]. Decommissioning costs for onshore wind farms can range from USD 0.1 to 0.4 M/MW of capacity [30]. However, it is expected that in the future, methods for recycling materials from wind turbines will improve, so for the sake of conservatism, a lower value of USD 0.15 M/MW has been adopted here, which would correspond to estimates for the Chippewa County Wind facility, as stated in [30,31].
During commercial operation of the plant, fixed and variable O&M costs occur on an annual basis [32]. Fixed O&M costs are those that do not change with electricity generation, and they generally include labor, materials, contract services, and general and administrative costs. O&M costs exclude property taxes and insurance. Routine labor refers to the basic maintenance of equipment recommended by the manufacturer and includes the maintenance of pumps, compressors, transformers, instruments, controls, and valves. The typical design of the power plant ensures that routine labor does not require a plant outage. Materials and contract services encompass the materials needed for routine labor, as well as contracted services, such as those covered by long-term service agreements that involve recurring monthly payments. General and administrative costs are operational costs, which include leases, management salaries, and office utilities. Variable O&M costs fluctuate depending on the amount of generated electricity. These costs include water consumption, waste and wastewater discharge, chemicals, and consumables. Fuel is not included.
There is not much information in the literature about O&M costs for an NPP with SMRs. It is suggested that they would be lower than the O&M costs for LS NPP [33,34]. The SMR technology is novel and is still under development, and there is no operational experience yet; hence, it can only be seen after a certain period of exploitation whether O&M costs will decrease [35,36]. It was assumed that the O&M costs for a large-scale nuclear power plant with PWR are the same as for an NPP with SMRs and that they are equal to USD 15/MWh. This value is close to the value for French technology EPR 1650 MWe [32] and also close to the optimistic O&M fixed and variable costs published in [33].
The key factors in the evaluation of SMRs’ competitiveness, such as modularization, learning-by-doing, and economy of scale, significantly affect the cost of SMR design [37]. These factors were not taken into account in this paper so as not to favor the project with SMRs.
Average O&M costs for a solar PV power plant in Europe in 2019 were reported at USD 10/kW per year [38,39].
The maintenance costs of wind power plants vary depending on a number of factors, including location, plant size, and contractual terms. According to available data, the total maintenance costs of wind farms can range between EUR 20 and 25/MWh [40]. These costs include turbine maintenance, plant operation, environmental monitoring, legal affairs, and insurance.
The maintenance costs of wind power plants, which are covered by the contract, in the region amount to around EUR 10/MWh, and other costs that include maintenance not covered by the contract, plant management, environmental protection, legal affairs, and insurance amount to EUR 10/MWh. These costs are added to the costs of the local self-government fee, which is approximately EUR 1.5/MWh, and also the fee for the use of state land ≈ EUR 1.5/MWh, which makes a total of EUR 23/MWh [40]. The O&M costs can be expressed as a share of LCOE. The share of O&M costs for onshore wind goes up to 30% of LCOE for this technology [41].
In 2023, onshore wind O&M costs ranged widely from USD 20/kW/year in Brazil to USD 100/kW/year in Japan, with Germany at USD 53.1/kW/year [41]. These differences reflect additional operational expenses not included in service contracts, such as insurance, land leases, taxes, and other local costs.
The price range of similar nuclear equipment technology is large [16], depending on the vendor and its country of origin. Different vendors provide a wide range of investment, decommissioning, fuel, and O&M costs; consequently, the LCOE has the same character. These challenges are faced by every country that introduces nuclear power plants into the energy system. For specific projects, detailed economic analyses are certainly made, depending on the current market conditions and the possibility of purchasing equipment in a certain region. When purchasing from more distant regions, transportation costs are significant.
The input data for calculating net present value and levelized cost of electricity are sorted out in Table 1 for clearer understanding.

3. Results

The obtained results are shown in Figure 4, Figure 5 and Figure 6 for different electricity prices. Figure 4 presents the NPV for the three projects considered for the electricity price of USD 80/MWh, USD 100/MWh for Figure 5, and USD 120/MWh for Figure 6. Each figure contains three diagrams of NPV changes with time for three different values of the discount rate: 3%, 5%, and 8%. There are three lines on each diagram, which represent the three projects: solid line for LS NPP with PWR, dashed line for NPP with four SMRs, and dotted line for solar and wind power plants in combination with PHES.
The lower the discount rate, the higher the net present value, according to Equation (1). For the electricity price of USD 80/MWh (Figure 4), the maximum NPV is for the project with four SMRs for a discount rate of 3%, with a PB period of 36 years. For the project with LS NPP, the PB period is 40 years (Figure 4), and for the project with solar and wind power and PHES, the NPV has always been negative. In Figure 5 and Figure 6, for the electricity prices of USD 100/120/MWh, the shortest PB period of 23/18 years is for the project that includes renewable energy sources for a discount rate of 3%, but it is not competitive due to the later decrease in NPV caused by the increase in investment after the end of the plant’s operating life of 25 years. The increase in the electricity price leads to the NPV increases and, consequently, shortens the PB period, so the PB periods for a 3% discount rate and the electricity price of USD 100/MWh goes from 25 and 29 years (Figure 5) for NPP with SMR and LS NPP, respectively, to 20 and 24 years for the price of USD 120/MWh (Figure 6).
In the case of a discount rate of 5% and the electricity price of USD 80/MWh, NPVs are never positive for all considered projects (Figure 4). The NPV has a very low value for a discount rate of 5% and the electricity price of USD 100/MWh in both projects with an NPP, with an SMR, or with a classic PWR. This results in significantly longer PB periods of 42 and 33 years (Figure 5), respectively, while for the discount rate of 8%, the NPV has negative values all the time for all three projects considered.
The NPV for NPP with SMR, in Figure 4, Figure 5 and Figure 6, reaches a positive value much earlier and has a greater value than in the case of the project with the LS NPP due to successive construction and earlier start of operation of SMRs, which leads to incomes from electricity production and, in this way, repayment of the investment is faster. The PB period in the case of investment in four SMRs is from 20 to 44 years, depending on the value of the discount rate and the electricity price. On the other hand, the PB period for the large-scale NPP ranges from 24 to 42 years. The project with four SMRs is the only one that has a positive NPV for a discount rate of 8% (Figure 6), which makes it the only project that is theoretically profitable for the highest discount rate considered, although the PB period of 44 years is too long.
Due to additional investments and the necessary construction of new facilities, in the observed period of 60 years, the NPV of a project, including renewable energy sources, becomes positive before 40 years, only for higher electricity prices and for the lowest discount rate.
Figure 7 shows the LCOE values for the three considered projects and for the range of discount rates from 3% to 8%. All LCOE values are calculated for the 60th year from the start of plants’ construction. When looking at the calculated LCOE values for a discount rate of 3%, it can be seen that the value is USD 66/MWh for the project with four SMRs and USD 67/MWh for LS NPP with PWR, while for the combination of solar power plant, wind power plant, and PHES, this value is significantly higher, approximately USD 88/MWh. In the literature [16], LCOE values for different plant types based on technologies from different countries are presented. For new build plants and a discount rate of 3%, the LCOE value for nuclear power plants ranges from approximately USD 27/MWh for a Russian VVER pressurized water reactor to approximately USD 61/MWh for a Japanese advanced light water reactor. The increased LCOE value presented in this paper is a consequence of the anticipated slightly higher investment costs of the facilities.
An analysis of the sensitivity of LCOE to total investment costs was performed. The total investment costs increased by 15% and also decreased by 15%, compared to the data given in Table 1, and the LCOE price is calculated. The results are shown in the diagram in Figure 8. The LCOE for LS NPP with PWR for total investment cost is given in Table 1, and for a discount rate of 5%, it is USD 89.70/MWh. For a 15% higher investment, the LCOE will increase by 10.86%, while for a 15% lower investment, the LCOE will decrease by 28.96%. This increase in LCOE due to higher investment costs is 10.57% for NPP with four SMRs and 12.87% for the combination of solar and wind power plants with PHES, while the decrease of LCOE is 28.18% and 43.29%, respectively.

4. Conclusions

A techno-economic analysis of the implementation of various electricity generation technologies that help decarbonize the energy sector of the Republic of Serbia has been conducted. The application of nuclear energy is envisaged in two ways: large-scale nuclear power plants with light water nuclear reactors or nuclear power plants with multiple modules of SMRs. As an alternative energy source to nuclear, solar and wind energy has been proposed. Due to the intermittence of renewable energy sources, their application is possible with the use of energy storage. Pumped hydroelectric energy storage was chosen because of its lowest capital cost and least technological risk.
The NPV for the earlier project with four SMRs becomes positive and is greater than the NPV for the project with the LS NPP due to the sequential construction of SMR and earlier revenue from the sale of the electricity, which makes the investment payback faster. The PB period for the project with four SMRs is from 18 to 37 years, depending on the value of the discount rate and the electricity price. The shortest PB period is for a 3% discount rate, and the electricity price is USD 120/MWh. However, the PB period for the LS NPP varies from 21 to 48 years.
Analysis for LCOE showed that the lowest value is in the case of the project with four SMRs for all considered ranges of discount rates. It can be seen that for the lowest discount rate, the LCOE for projects with SMR and with PWR have similar values of approximately USD 67/MWh. For the highest discount rate, the PWR project and the project with a combination of renewable energy sources and PHES have similar values of USD 135/MWh.
The most cost-effective project is the one with four SMRs due to the consecutive building of modules. The project with solar and wind power plants and PHES is not cost-effective due to the short projected exploitation lifetime of these plants, which is 25 years, and the need to build new units in the observed period of 60 years.

Author Contributions

S.M.: writing—original draft, methodology, investigation, conceptualization; M.M.P.: methodology, investigation, conceptualization; V.D.S.: supervision, methodology, investigation, conceptualization; J.R.: writing—review and editing, resources; M.L.: visualization, software, resources. All authors have read and agreed to the published version of the manuscript.

Funding

This research was funded by the Science Fund of the Republic of Serbia, #GRANT No 3434, Improving operational flexibility of decarbonized thermal power plants with energy storage toward increased renewable sources utilization—TPP-RSU.

Data Availability Statement

Data will be made available upon request.

Conflicts of Interest

The authors declare no conflicts of interest. The funders had no role in the design of the study; in the collection, analysis, or interpretation of data; in the writing of the manuscript; or in the decision to publish the results.

Nomenclature

c e electricity price (USD/MWh)
C t carbon costs in year t (USD)
d discount rate (-)
D t net operating income in year t (USD) in Equation (1)
decommissioning costs in year t (USD) in Equation (2)
E t electricity generation in year t (MWh)
F t fuel costs in year t (USD)
I t investment (capital) costs in year t (USD)
LCOElevelized cost of electricity (USD/MWh)
nplant lifetime (year)
NPVnet present value (USD)
O M t operations and maintenance costs in year t (USD)
R t investments and other expenses in year t (USD)
t discrete time (year)
T 1 construction period (year)
T 2 projected exploitation lifetime (year)

Abbreviations

The following abbreviations are used in this manuscript:
CBAMCarbon Border Adjustment Mechanism
DCdirect current
EPREuropean Pressurised Reactor
EUEuropean Union
LCOElevelized cost of electricity
LSlarge-scale
USD Mmillion dollars
NPPnuclear power plant
NPVnet present value
OECDOrganisation for Economic Co-operation and Development
O&Moperations and maintenance
PBpayback
PHESpumped hydroelectric energy storage
PVphotovoltaic
PWRpressurized water reactor
SMRsmall modular reactor
VVERIn Russian: Водо-Водяной Энергетический Реактор; romanized: Vodo-Vodyanoi Enyergeticheskiy Reaktor; in English: water–water power reactor

References

  1. Republic of Serbia. Law on the Ratification of the Energy Community Treaty Between the European Community and the Republic of Albania, the Republic of Bulgaria, Bosnia and Herzegovina, the Republic of Croatia, the Former Yugoslav Republic of Macedonia, the Republic of Montenegro, Romania, the Republic of Serbia and the United Nations Interim Administration Mission in Kosovo in Accordance with Security Council Resolution 1244 of the United Nations. Official Gazette of the Republic of Serbia. No. 62. 19 July 2006. Available online: https://reg.pravno-informacioni-sistem.rs/api/Attachment/prilozi/418158/Ugovor_o_osnivanju_Energetske_zajednice.htm (accessed on 11 April 2025).
  2. Decision of the Ministerial Council of the Energy Community No 2022/02/MC-EnC. Available online: https://www.energy-community.org/legal/acquis.html (accessed on 13 February 2025).
  3. Statistical Office of the Republic of Serbia, Renewable Energy Share in the Total Final Energy Consumption. Available online: https://data.stat.gov.rs/Home/Result/SDGUN070201?caller=SDGUN&languageCode=sr-Latn (accessed on 13 February 2025).
  4. Energy Balance of the Republic of Serbia for 2022. Available online: https://www.mre.gov.rs/extfile/sr/1144/energetski_bilans_rs_za_2022__0.pdf (accessed on 13 February 2025).
  5. European Parliament and Council. Regulation (EU) 2023/956 of the European Parliament and of the Council of 10 May 2023 Establishing a Carbon Border Adjustment Mechanism. Official Journal of the European Union. L 130, 16 May 2023, 52–104. Available online: https://eur-lex.europa.eu/legal-content/EN/TXT/?uri=CELEX%3A32023R0956 (accessed on 11 April 2025).
  6. Li, X.; Hu, C.; Luo, S.; Lu, H.; Piao, Z.; Jing, L. Distributed Hybrid-Triggered Observer-Based Secondary Control of Multi-Bus DC Microgrids Over Directed Networks. IEEE Trans. Circuits Syst. I Regul. Pap. 2025, 72, 1–14. [Google Scholar] [CrossRef]
  7. Li, W.; Zou, Y.; Yang, H.; Fu, X.; Xiang, S.; Li, Z. Two-Stage Stochastic Energy Scheduling for Multi-Energy Rural Microgrids With Irrigation Systems and Biomass Fermentation. IEEE Trans. Smart Grid 2024, 16, 1075–1087. [Google Scholar] [CrossRef]
  8. Rehmani, A.M.; Kazmi, S.A.A.; Altamimi, A.; Khan, Z.A.; Awais, M. Techno-Economic Environmental Assessment of an Isolated Rural Micro-Grid from a Mid-Career Repowering Perspective. Sustainability 2023, 15, 2137. [Google Scholar] [CrossRef]
  9. Development of the Electric Power Industry of the Republic of Serbia Up to the Year 2050, Serbian Academy of Sciences and Arts Department of Technical Sciences; Academy Board for Energy: Belgrade, Serbia, 2023. (In Serbian)
  10. Leading the Energy Transition Factbook—Electricity Storage; SBC Energy Institute: Gravenhage, TX, USA, 2013; Available online: https://wecanfigurethisout.org/ENERGY/Web_notes/Round_Pegs/Power_Cycles_and_Energy_Storage_Supporting_Files/Electricity%20Storage%20-%20SBC%20Energy%20Institute%202013.pdf (accessed on 13 February 2025).
  11. Federal Aviation Administration, Lithium Battery Incidents. Available online: https://www.faa.gov/hazmat/resources/lithium_batteries/incidents (accessed on 18 February 2025).
  12. Olabi, A.G.; Onumaegbu, C.; Wilberforce, T.; Ramadan, M. Mohammad Ali Abdelkareem, Abdul Hai Al -Alami, Critical review of energy storage systems. Energy 2021, 214, 118987. [Google Scholar] [CrossRef]
  13. Stanimirovic, A.; Djordjevic, V. JSC EPS—Overview & Serbian Nuclear Energy, Electric Power Industry of Serbia. In Proceedings of the Foundational Infrastructure for the Responsible Use of Small Modular Reactor Technology—FIRST, Belgrade, Serbia, 17–19 December 2024. [Google Scholar]
  14. Stevanovic, V. Program for the introduction of nuclear energy and the development of organizational, institutional and technical technological infrastructure, Nuclear Power Plants in Serbian Energy, Serbian Academy of Sciences and Arts, Belgrade, November 2022. (In Serbian). Available online: https://www.sanu.ac.rs/wp-content/uploads/2022/11/Nuklearna-energija.pdf (accessed on 11 April 2025).
  15. Đorđević, A.; Đurišić, Ž. Mathematical model for the optimal determination of voltage level and PCC for large wind farms connection to transmission network. IET Renew. Power Gener. 2019, 13, 2240–2250. [Google Scholar] [CrossRef]
  16. Projected Costs of Generating Electricity, 2020 ed.; International Energy Agency, Nuclear Energy Agency Organisation for Economic Co-operation and Development: Paris, France, 2020; Available online: https://iea.blob.core.windows.net/assets/ae17da3d-e8a5-4163-a3ec-2e6fb0b5677d/Projected-Costs-of-Generating-Electricity-2020.pdf (accessed on 13 February 2025).
  17. Small Modular Reactors, Catalogue 2024, International Atomic Energy Agency. 2024. Available online: https://aris.iaea.org/Publications/SMR_catalogue_2024.pdf (accessed on 13 February 2025).
  18. U.S. Energy Information Administration (EIA). Nuclear Explained-Nuclear Power Plants. Available online: www.eia.gov/outlooks/aeo/assumptions/pdf/elec_cost_perf.pdf (accessed on 2 December 2024).
  19. Ferreira, H.L.; Garde, R.; Fulli, G.; Kling, W.; Lopes, J.P. Characterisation of electrical energy storage technologies. Energy 2013, 53, 288–298. [Google Scholar] [CrossRef]
  20. Koivunen, T.; Hirvijoki, E. Effect of investment cost on technology preference in a flexible, low-carbon Finnish power system. Nucl. Energy Des. 2024, 417, 112854. [Google Scholar] [CrossRef]
  21. Deline, C.; Muller, M.; White, R.; Perry, K.; Springer, M.; Deceglie, M.; Jordan, D. Availability and Performance Loss Factors for U.S. PV Fleet Systems, National Renewable Energy Laboratory, Technical Report NREL/TP-5K00-88769. February 2024. Available online: https://www.nrel.gov/docs/fy24osti/88769.pdf (accessed on 28 April 2025).
  22. Lillo-Sánchez, L.; López-Lara, G.; Vera-Medina, J.; Pérez-Aparicio, E.; Lillo-Bravo, I. Degradation analysis of photovoltaic modules after operating for 22 years. A case study with comparisons. Sol. Energy 2021, 222, 84–94. [Google Scholar] [CrossRef]
  23. Staffell, I.; Green, R. How does wind farm performance decline with age? Renew. Energy 2014, 66, 775–786. [Google Scholar] [CrossRef]
  24. Astolfi, D.; Pandit, R. Wind Turbine Performance Decline with Age. Energies 2022, 15, 5225. [Google Scholar] [CrossRef]
  25. Westinghouse Electric Company LLC. Uprating Programs Technology. Available online: https://westinghousenuclear.com/media/rpolsxfb/uprating-programs-technology.pdf (accessed on 28 April 2025).
  26. International Atomic Energy Agency (IAEA). Power Reactor Information System (PRIS). Available online: https://pris.iaea.org/pris/CountryStatistics/ReactorDetails.aspx?current=531 (accessed on 28 April 2025).
  27. Gumber, A.; Riccardo, Z.; Steffen, B. A global analysis of renewable energy project commissioning timelines. Appl. Energy 2024, 358, 122563. [Google Scholar] [CrossRef]
  28. World Nuclear Association, Nuclear Fuel Cycle, Decommissioning Nuclear Facilities. Available online: https://world-nuclear.org/information-library/nuclear-fuel-cycle/nuclear-waste/decommissioning-nuclear-facilities (accessed on 19 February 2025).
  29. Thunder Said Energy, Solar Power: Decommissioning Costs. Available online: https://thundersaidenergy.com/downloads/solar-power-decommissioning-costs/ (accessed on 19 February 2025).
  30. The Institute for Energy Research, The Cost of Decommissioning Wind Turbines Is Huge. Available online: https://www.instituteforenergyresearch.org/renewable/wind/the-cost-of-decommissioning-wind-turbines-is-huge/ (accessed on 19 February 2025).
  31. Palmer’s Creek Wind Farm Site Permit Application Chippewa County, Minnesota. Available online: https://www.edockets.state.mn.us/documents/%7B29950B36-761E-4C68-B259-F0FBF90842F4%7D/download (accessed on 19 February 2025).
  32. U.S. Energy Information Administration (EIA). Capital Cost and Performance Characteristic Estimates for Utility Scale Electric Power Generating Technologies. Available online: https://www.eia.gov/analysis/studies/powerplants/capitalcost/pdf/capital_cost_aeo2020.pdf (accessed on 19 February 2025).
  33. Larsen, L.M.; Guaita, N.; Lantgios, I.; Zhou, J.; Abou-Jaoude, A.; Stauff, N. Nuclear Energy Cost Estimates for Net Zero World Initiative—2024 Update, Idaho National Laboratory, INL/RPT-24-80552. 2024. Available online: https://inldigitallibrary.inl.gov/sites/sti/sti/Sort_130016.pdf (accessed on 19 February 2025).
  34. Nøland, J.K.; Hjelmeland, M.; Korpås, M. Cost Projections of Small Modular Reactors: A Model-Based Analysis. IAEA-CN-123/45. Preprint 2024, 1–7. [Google Scholar] [CrossRef]
  35. Kindra, V.; Maksimov, I.; Zlyvko, O.; Rogalev, A.; Rogalev, N. Thermodynamic Analysis and Comparison of Power Cycles for Small Modular Reactors. Energies 2024, 17, 1650. [Google Scholar] [CrossRef]
  36. Rahmanta, M.A.; Harto, A.W.; Agung, A.; Ridwan, M.K. Nuclear Power Plant to Support Indonesia’s Net Zero Emissions: A Case Study of Small Modular Reactor Technology Selection Using Technology Readiness Level and Levelized Cost of Electricity Comparing Method. Energies 2023, 16, 3752. [Google Scholar] [CrossRef]
  37. Mignacca, B.; Locatelli, G. Economics and finance of Small Modular Reactors: A systematic review and research agenda. Renew. Sustain. Energy Rev. 2020, 118, 109519. [Google Scholar] [CrossRef]
  38. Steffen, B.; Beuse, M.; Tautorat, P.; Schmidt, T.S. Experience Curves for Operations and Maintenance Costs of Renewable Energy Technologies. Joule 2019, 4, 359–375. [Google Scholar] [CrossRef]
  39. Vartiainen, E.; Masson, G.; Breyer, C.; Moser, D.; Medina, E.R. Impact of weighted average cost of capital, capital expenditure, and other parameters on future utility-scale PV levelised cost of electricity. Prog. Photovolt. 2019, 28, 439–453. [Google Scholar] [CrossRef]
  40. Ivkovic, B. Wind Power Plants, Profitability of Investments in Distributed Sources of Electricity. 2014. Available online: https://www.ho-cired.hr/wp-content/uploads/2014/12/Ivkovic_-Vjetroelektrane_1.pdf (accessed on 19 February 2025). (In Croatian).
  41. International Renewable Energy Agency. Renewable Power Generation Costs in 2023. Available online: https://www.irena.org/-/media/Files/IRENA/Agency/Publication/2024/Sep/IRENA_Renewable_power_generation_costs_in_2023.pdf (accessed on 19 February 2025).
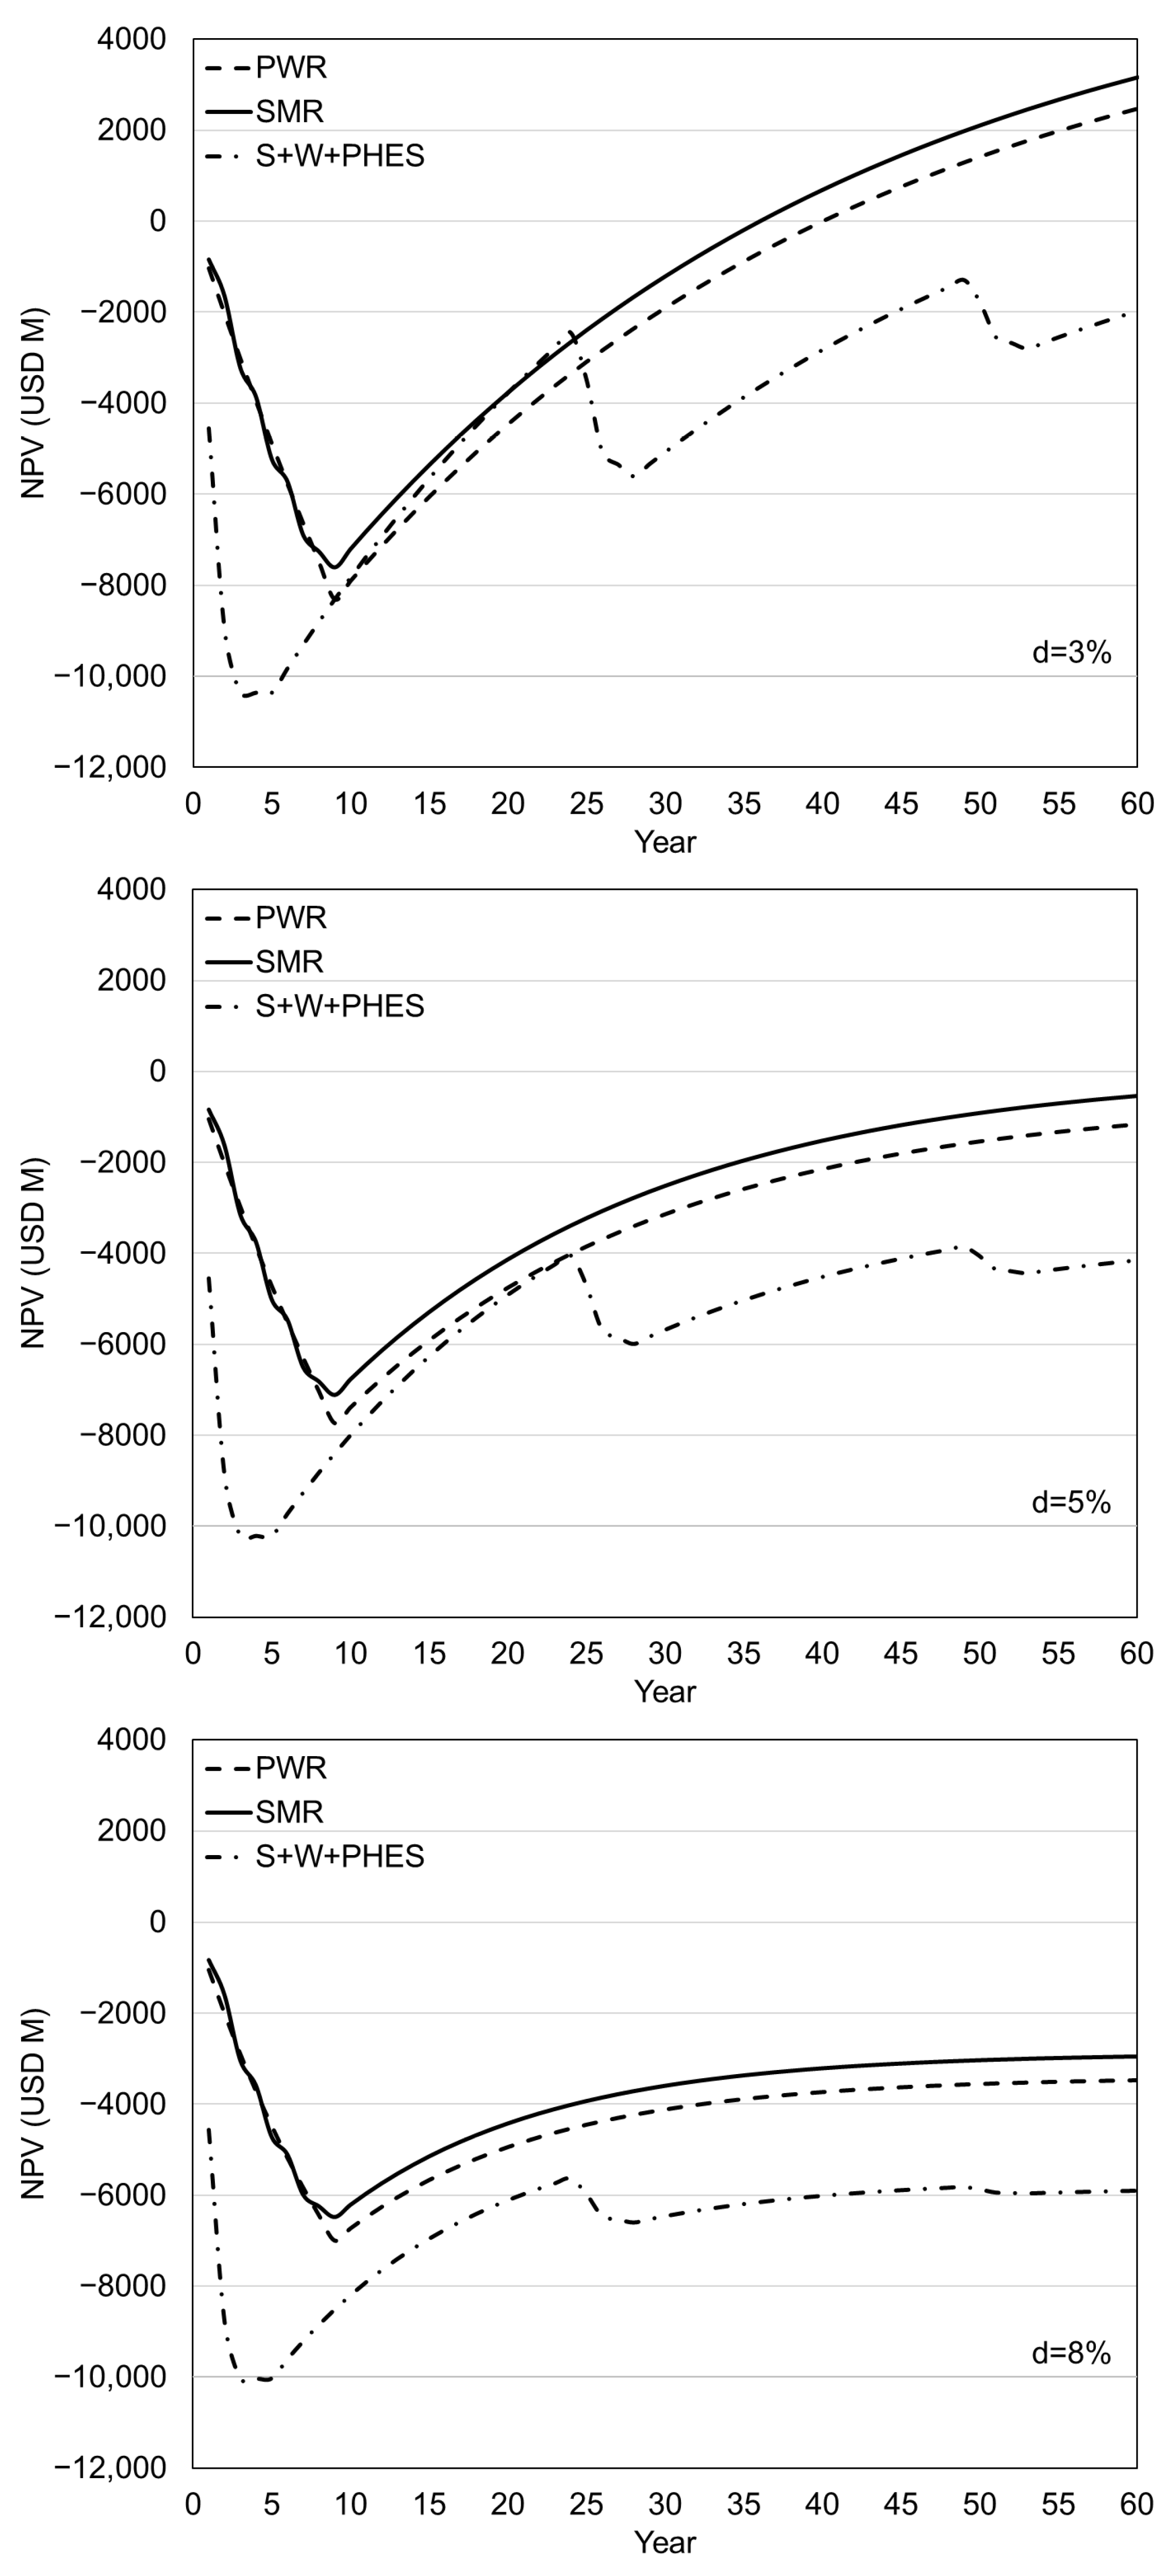
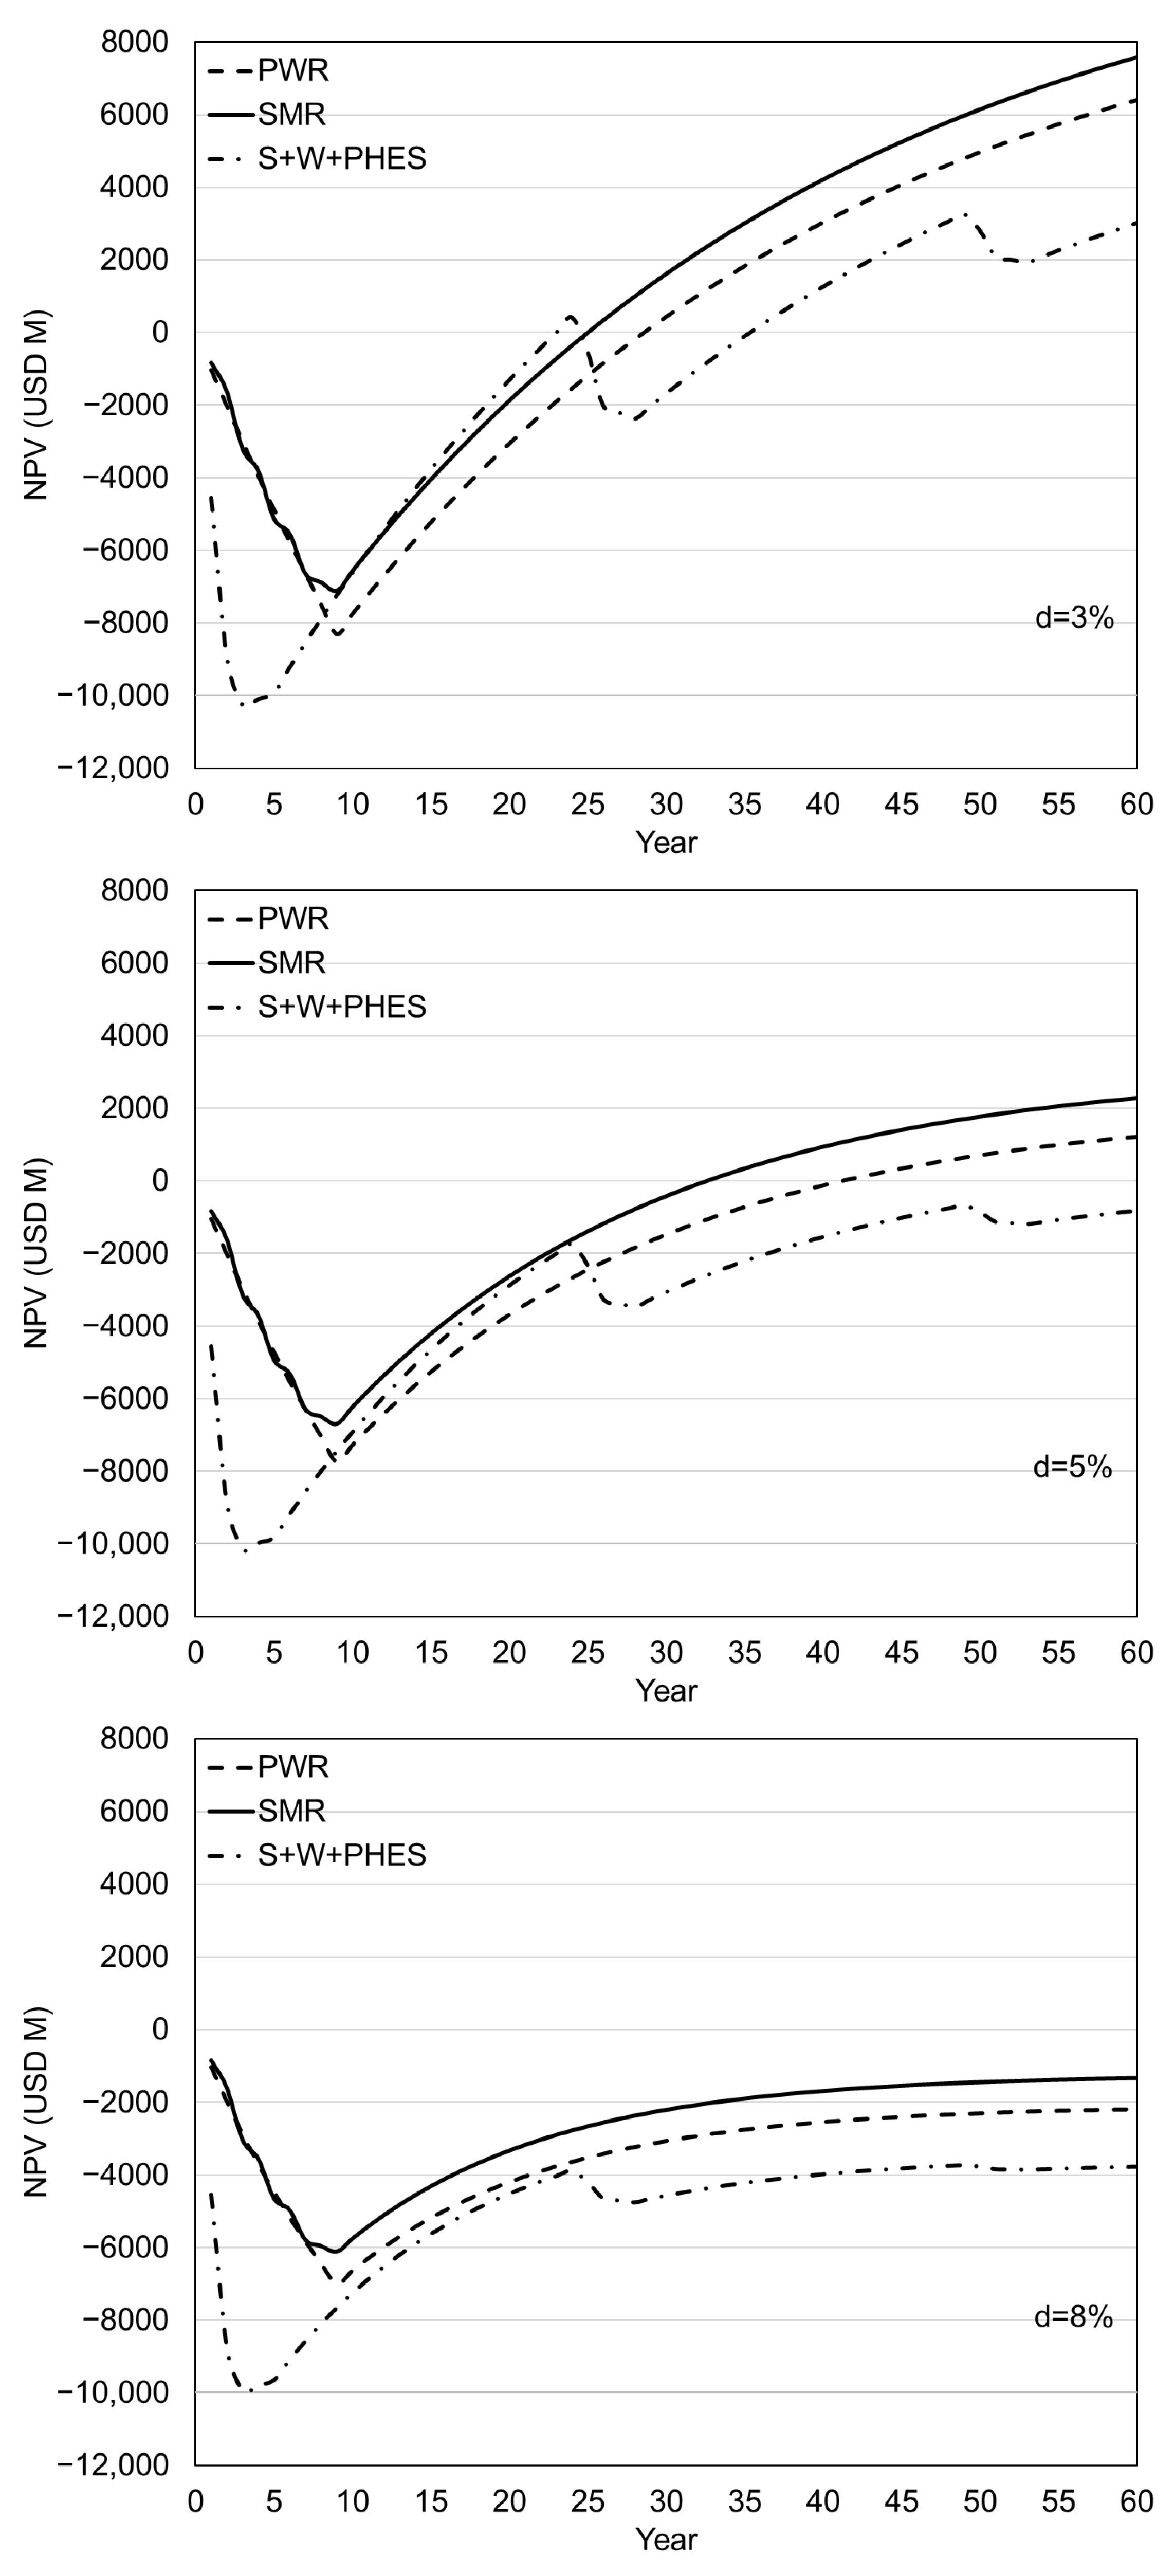
Figure 1. Dependence of the level of development of the energy storage technology on capital requirement and technological risk [10].
Energies 18 02355 g001
Figure 2. Range of assumed capacity factors. The report contains data for 243 plants in 24 countries, including 5 non-OECD countries: Brazil, People’s Republic of China, India, Romania, the Russian Federation, and South Africa [16].
Energies 18 02355 g002
Figure 3. The timeline of construction for one LS NPP with PWR, NPP with four SMRs, solar power plant, wind power plant, and pumped hydroelectric energy storage.
Energies 18 02355 g003
Figure 4. Net present value and payback period for the three investment projects: large-scale NPP with PWR, four modules of SMRs, and a combination of solar and wind power plants with pumped hydroelectric energy storage under three different discount rates. The electricity price is USD 80/MWh.
Energies 18 02355 g004
Figure 5. Net present value and payback period for the three investment projects: large-scale NPP with PWR, four modules of SMRs, and a combination of solar and wind power plants with pumped hydroelectric energy storage under three different discount rates. The electricity price is USD 100/MWh.
Energies 18 02355 g005
Figure 6. Net present value and payback period for the three investment projects: large-scale NPP with PWR, four modules of SMRs, and a combination of solar and wind power plants with pumped hydroelectric energy storage under three different discount rates. The electricity price is USD 120/MWh.
Energies 18 02355 g006
Figure 7. Levelized cost of electricity for the three investment projects: large-scale NPP with PWR, four modules of SMRs, and a combination of solar and wind power plant swith pumped hydroelectric energy storage calculated for three different discount rates, 3%, 5%, and 8%, for a period of 60 years.
Energies 18 02355 g007
Figure 8. The impact of total investment costs on LCOE. The total investment costs are increased by 15% (max) and decreased by 15% (min) compared to the data in Table 1. The discount rate is 5%.
Energies 18 02355 g008
Table 1. The input data for calculating net present value and levelized cost of electricity.
Large-Scale
NPP with PWR
Modular
NPP with
SMR
Solar and Wind Power Plants + PHES
SolarWindPHES
Net capacity (MWel)12004x30030331706-
Capacity factor (%)91911832-
Total overnight cost (USD/kW)7777834918082098-
Total investment cost (USD M)93324x2505548435793100
The period of
exploitation (year)
60602525-
The construction
period (year)
93 (per one module)235
The fuel costs (USD/MWh)9.339.33---
The decommissioning costs (USD M)15001500303256-
The O&M costs (USD/MWh)15156.3422-
Disclaimer/Publisher’s Note: The statements, opinions and data contained in all publications are solely those of the individual author(s) and contributor(s) and not of MDPI and/or the editor(s). MDPI and/or the editor(s) disclaim responsibility for any injury to people or property resulting from any ideas, methods, instructions or products referred to in the content.

