Article

Assessment of Greenhouse Gas Reduction and Sustainability Index in Waste-to-Energy Conversion Scenarios Using System Dynamics Modeling

by
Ali Shahbazi
1,2,
Mazaher Moeinaddini
1,
Rajib Sinha
2,*,
Mohammad Ali Abdoli
3,
Mahnaz Hosseinzadeh
4,
Neamatollah Jaafarzadeh Haghighi Fard
5 and
Shoaib Azizi
2
1
Department of Environmental Sciences, Faculty of Natural Resources, University of Tehran, Karaj, Iran
2
Department of Sustainable Development, Environmental Science and Engineering (SEED), KTH Royal Institute of Technology, SE-100 44 Stockholm, Sweden
3
Department of Environmental Engineering, Faculty of Environment, University of Tehran, Tehran, Iran
4
Sheffield University Management School, The University of Sheffield, Sheffield S10 2TN, UK
5
Environmental Technologies Research Center, Medical Basic Sciences Research Institute, Ahvaz Jundishapur University of Medical Sciences, Ahvaz, Iran
*
Author to whom correspondence should be addressed.
Energies 2025, 18(9), 2346; https://doi.org/10.3390/en18092346
Submission received: 26 March 2025 / Revised: 28 April 2025 / Accepted: 30 April 2025 / Published: 3 May 2025

Abstract

:
This study aims to evaluate various waste-to-energy conversion scenarios in terms of their potential to reduce greenhouse gas (GHG) emissions and improve sustainability based on economic and environmental outcomes. To achieve this, a comprehensive waste management model was developed using the system dynamics approach in the Vensim software to predict waste generation and composition and compare pyrolysis, incineration, gasification, and sanitary landfill scenarios with the baseline scenario over 25 years (2025–2050). The analysis of different waste management scenarios highlights the superior performance of pyrolysis in terms of energy recovery, economic profit, GHG emissions reduction, environmental outcomes, and long-term sustainability. Results show that the pyrolysis scenario generates the highest electricity, with a cumulative net electricity output of 10,469 GWh. Although pyrolysis has GHG emissions due to energy consumption and direct process emissions, it results in the largest net reduction in GHG emissions, primarily due to avoided emissions from increased electricity generation, leading to a 346% reduction compared to the baseline scenario. Furthermore, the pyrolysis scenario demonstrates the highest economic profit at 354 million USD and the highest sustainability index (SI) at 499 million USD. The cumulative SI from 2025 to 2050 shows a 503% increase compared to the business-as-usual scenario, highlighting its superior sustainability performance. This study highlights the importance of strategic waste-to-energy planning in reducing GHG emissions and promoting sustainability. It also offers valuable insights for policymakers and researchers, supporting the development of sustainable waste management strategies and effective efforts for climate change mitigation.

1. Introduction

The amount of municipal solid waste (MSW) is expected to rise from 2.1 billion tons in 2023 to 3.8 billion tons by 2050 [1], posing a significant global challenge. This rapid increase, driven by urban growth and population expansion, exacerbates environmental issues, particularly greenhouse gas (GHG) emissions such as methane (CH4) and carbon dioxide (CO2), which contribute to climate change [2,3]. Traditional waste disposal methods, such as landfilling, remain prevalent but are increasingly recognized for their environmental drawbacks, including air and water pollution and substantial GHG emissions [4].
In 2021, U.S. municipal solid waste (MSW) landfills emitted approximately 122.6 million metric tons of CO2 equivalent in methane, accounting for about 16.9% of total U.S. methane emissions. This underscores the critical need to adopt more sustainable waste management practices to mitigate climate change [5]. Inefficient waste management also contributes to biodiversity loss, water contamination, and public health risks, particularly in rapidly urbanizing regions with inadequate waste infrastructure [6,7,8]. To address these challenges, adopting an appropriate waste management approach is essential [9,10].
Moreover, to meet global climate targets, including net-zero emissions by 2050, shifting to sustainable waste-to-energy (WtE) solutions is crucial [11,12]. Utilizing MSW for energy generation offers dual benefits: reducing waste volume while increasing renewable energy supply [13,14]. International agreements such as the Paris Agreement and the United Nations Framework Convention on Climate Change emphasize the need for low-carbon energy alternatives, further underscoring the importance of WtE technologies [11].
Several WtE technologies facilitate energy recovery from waste, including incineration, pyrolysis, gasification, and landfilling with energy recovery [15,16]. Incineration, a widely used method, involves complete oxidation of waste at high temperatures (≥1600 °F) in excess oxygen, converting it into water vapor, CO2, and ash. This process reduces waste volume by 60–90% and generates heat and electricity, making it a cost-effective option, particularly for repurposing coal power plants [17]. Pyrolysis, by contrast, thermally decomposes waste in an oxygen-free environment at approximately 550 °C, producing solid char (35%), liquid biofuel (40%), and synthetic gas [17]. This method offers multiple energy outputs with lower emissions than combustion, enabling direct product utilization, such as converting plastic waste into oil or gas [17]. Gasification involves partial oxidation of biomass at around 1400 °C, generating a combustible syngas composed of CH4, CO, H2, and N2. It converts low-value waste into a high-energy gas suitable for large-scale heat and power production, offering both economic and environmental advantages [17]. Sanitary landfill with energy recovery captures methane produced during the anaerobic decomposition of waste. This method is economically viable, particularly for smaller municipalities, with studies indicating favorable contributions from rate-payers and high internal rates of return. However, effective methane capture infrastructure is required to minimize GHG emissions [18].
The imperative for sustainable waste management is underscored by the European Union’s “Fit for 55” package, aimed at reducing GHG emissions by at least 55% by 2030 and achieving climate neutrality by 2050 [19]. While various studies have examined the technical, economic, and environmental aspects of WtE technologies, there remains a need for comprehensive assessments that integrate these dimensions to support informed decision-making [20,21]. Specifically, evaluating the sustainability of different WtE scenarios, considering both GHG emission reductions and economic and environmental outcomes, is crucial for developing effective waste management strategies [22,23].
This study aims to address this gap by developing a system dynamics model to compare the performance of incineration, gasification, and sanitary landfilling against a baseline scenario over 25 years (2025–2050). By assessing long-term energy generation, GHG emissions, economic profit, environmental outcomes, and the sustainability index, this research provides valuable insights for policymakers and researchers seeking to advance sustainable waste management and climate change mitigation. The novelty of this study can be emphasized through its comparative assessment of major solid waste management strategies regarding key environmental and economic indicators.

2. Materials and Methods

The research design was developed to ensure a systematic comparison of waste management strategies over a 25-year horizon. It combines system dynamics modeling with environmental, economic, and sustainability assessments.

2.1. Model Structure

System dynamics (SD) is a simulation and analysis methodology for examining temporal behaviors, enabling the comprehensive investigation of complex system structures, interactions, and behavioral patterns. The SD approach has been extensively applied in the waste management sector [24,25,26].
Figure 1 illustrates the conceptual system dynamics model of a waste stream. The arrows in the figure exhibit the stream of information between the subsystems. The subsystems of waste flow are depicted using a system dynamics diagram model [27], where a rectangular box represents a state variable, an incoming arrow indicates the inflow to the state variable, and an outgoing arrow represents the outflow. The clouds at the beginning and end of the inflow and outflow signify sources and sinks, respectively. Additionally, each arrow represents a causal relationship. The proposed model initially follows an open-loop, unidirectional approach without significant feedback loops, a characteristic observed in other waste management models in the literature [28,29,30,31,32].
We utilized the system dynamics model in Vensim PLE (10.3.2, Ventana Systems lnc, Harvard, MA USA, 2020) to simulate waste management scenarios. The system dynamics model first estimates population growth and waste generation, followed by waste collection. The collected waste is then allocated to different management scenarios, such as incineration, pyrolysis, gasification, and landfill with gas recovery, where input materials (waste and energy) and outputs (energy and residual waste) are analyzed. Based on these factors, economic profit, environmental outcomes, and the sustainability index are calculated for each scenario. The default model represents the business-as-usual (BAU) scenario as a baseline against which alternative scenarios were compared. Four scenarios, including incineration (INC), pyrolysis (Py), gasification (GSF), and landfill with gas recovery (LFG), were designed based on commonly used waste management technologies to evaluate the impact of proposed programs. The features and specifications of each waste management technology (incineration, pyrolysis, gasification, and landfilling) are presented in Table S1 of Section S1 of the Supplementary Materials. The model was developed based on historical data from Alborz Province, Iran, including population growth rate, mortality rate, waste composition, and quantity for the years 2011 to 2020. After structural and behavioral validation, modeling was conducted for the period 2025 to 2050 in alignment with global net-zero emission goals. The findings can be representative of many regions in the Middle East and the developing countries, while the model is designed in a way that allows easy adaptation for other regions by simply replacing the input data. The selection of the four waste management scenarios was based on their widespread application in regional and global contexts and their relevance to sustainable waste management and energy recovery strategies. These scenarios were chosen to reflect common technological pathways that align with ongoing climate change mitigation efforts, particularly in rapidly urbanizing regions such as the Middle East. The modeling period from 2025 to 2050 was selected to align with global net-zero emission targets, ensuring the relevance of the findings for long-term strategic planning.

2.2. Model Validation and Sensitivity Analysis Overview

The system dynamics model was thoroughly validated using several standard methods as outlined by Sterman [27]. Verification confirmed that all model assumptions and variables were aligned with the study’s objectives. The validation procedures included dimensional consistency tests (using the Vensim software PLE 10.3.), structure-behavior tests, extreme condition tests, and integration error tests. These tests ensured the model’s robustness across varying time steps. Behavioral validation was also performed by comparing model outputs (population and total waste generation) with historical data from 2011 to 2020, using metrics such as MAE, MSE, RMSE, and MAPE. The results showed excellent predictive performance with MAPE values of 2.9% for population and 7.5% for total waste generation.
A sensitivity analysis was conducted to assess the response of key model outputs to changes in per capita waste generation. The analysis revealed numerical sensitivity in the amount of waste sent to landfills but did not show significant behavioral sensitivity.

2.3. Electrical Energy Production and Consumption

The potential of electrical energy generated from pyrolysis, gasification, incineration, and sanitary landfill, measured in kWh, can be calculated using Equations (1)–(4), respectively [33]. In addition, the energy consumption in different scenarios was calculated using Equation (5). Finally, the net electricity output was determined by subtracting consumption from production, as described in Equation (6). The parameters used to calculate the available electrical energy for all technologies are presented in the Abbreviations.
E L P P y = ε P y × λ × σ P y × K ( V D P y × H V K )
E L P G S F = ε G S F × λ × σ G S F × K ( V D G S F × H V K )
E L P I N C = ε I N C × λ × σ I N C × K ( V D I N C × H V K )
E P L F E = ε C H 4 t o E l × H V C H 4 λ × i = 1 Y j = 0.1 1 ( K L F E × L 0 × ( V D L F E 10 ) × e K L F E × t i j
E L C T e c h = V D T e c h × δ T e c h
n e t E L T e c h = E L P T e c h E L C T e c h
To calculate the amount of waste sent to landfills, the amount of residual waste in each process in the model was determined. In the created model, based on the amount of input waste in each process and the waste reduction coefficient, the amount of residual waste at the end of the process for incineration and gasification processes was determined according to Equations (7)–(9), respectively.
P W P y = ( 1 ω P y ) × K V K P y
P W I N C = ( 1 ω I N C ) × K V D I N C
P W G S F = ( 1 ω G S F ) × K V D G S F

2.4. GHG Emissions

The data on GHG emissions across different waste management scenarios reveal the environmental outcomes of both direct GHG emissions and avoided emissions. The net GHGs in each scenario are calculated by considering both the direct emissions from processes and input materials, as well as the avoided GHGs from the production of different products and savings from input materials. Direct greenhouse gas emissions are calculated using the respective coefficients in the processes of pyrolysis and incineration [33], gasification [34], and landfilling [29], through Equations (10)–(13), respectively. All parameters in the relations are listed in the Abbreviations section.
G D E M P y = ( V D P y × E F C H 4 P y × G W P C H 4 ) + ( V D P y × E F C O 2 P y )
G H G D E M G S F = ( V D G S F × E F C H 4 G S F × G W P C H 4 ) + ( V D G S F × E F C O 2 G S F )
G H G D E M I N C = ( M W × V D I N C × C C W × F C F × C E ) + ( V D I N C × EF N 2 O INC × G W P N 2 O )
G H G D E M L F , L E F = ( V D L F , L E F × E E F C H 4 , D L F , L E F ) G W P C H 4
Based on the amount of electricity produced, the avoided GHGs are calculated using the respective coefficients in the processes of pyrolysis and incineration [33], gasification [35], and landfilling [33], through Equations (14)–(17).
G H G A V P y =   ( EL P R P y × C F C O 2 E L )
G H G A V L F E =   ( EL P L F E × C F C O 2 E L )
G H G A V G S F =   ( EL P P y × C F C O 2 E L )
Indirect GHG emissions due to raw material consumption and avoided greenhouse gases due to waste diversion from landfilling, considering the fuel and electricity consumption coefficients in the processes of incineration [36], pyrolysis and gasification [35], and landfilling [37], as well as the GHG emission coefficients due to electricity consumption [38], gasoline [39], and diesel [40], were determined. Considering the energy and fuel consumption in different methods, the amount of GHG emissions due to input material consumption was calculated using Equations (18)–(21).
G H G I E M P y = ( F U R Q P y × C F C O 2 P y ) + ( F U R Q P y × C F C H 4 F U × G W P C H 4 ) + ( E L R Q P y × C F C O 2 E L )
G H G I E M I N C = ( E L C I N C × C F C O 2 E L )
G H G I E M L F , L F E = ( F U C L F , L F E × C F C O 2 F U ) + ( F U C L F , L F E × C F C H 4 F U × G W P C H 4 ) + ( E L C L F , L F E × C F C O 2 E L )
G H G I E M G S F = ( F U R Q G S F × C F C O 2 G S F ) + ( F U R Q G S F × C F C H 4 G S F × G W P C H 4 ) + ( E L R Q P y × C F C O 2 E L )
Avoided GHGs due to waste diversion from landfills and the non-use of raw materials, compared to the baseline scenario, were calculated using Equations (22) and (24).
G H G I A V P y = ( F U S V P y × C F C O 2 F U ) + ( F U S V P y × C F C H 4 F U × G W P C H 4 ) + ( E L S V P y × C F C O 2 E L )
G H G I A V I N C = ( F U S V I N C × C F C O 2 F U ) + ( F U S V I N C × C F C H 4 F U × G W P C H 4 ) + ( E L S V I N C × C F C O 2 E L )
G H G I A V G S F = ( F U S V G S F × C F C O 2 F U ) + ( F U S V G S F × C F C H 4 F U × G W P C H 4 ) + ( E L S V G S F × C F C O 2 E L )
Finally, the net amount of GHG emissions was calculated using Equation (25) by the difference between the total GHG emissions of the different methods and consumed input materials and the total avoided GHGs through product production and waste diversion from landfills [26].
n e t   G H G T e c h = ( G H G D E M T e c h + G H G I E M T e c h ) ( G H G A V T e c h + G H G I A V T e c h )

2.5. Economic Profit

The economic profit of different waste management scenarios highlights their financial viability based on electricity sales income, residual waste landfill costs, and overall economic efficiency. The economic profit is calculated for various waste management scenarios by Equations (26)–(28).
E C I = E L T e c h P × P R E L
E C C = ( W L F × P R L F )
E C B T e c h = E C I E C C

2.6. Environmental Outcomes

The environmental outcomes across different waste management scenarios are calculated by considering both the environmental income from carbon credits (for GHG savings) and the environmental costs, which include the cost of carbon emissions and the environmental cost of waste landfilling (based on USD/ton waste), as defined by Equations (29)–(31) [41].
E N I = ( G H G A V T e c h + G H G I A V T e c h ) × C C
E N C = [ ( G H G D E M T e c h + G H G I E M T e c h ) × C C ] + ( V L F × P L F )
E N B = E N I E N C

2.7. Sustainability Index

The environmental effect is monetized to facilitate its comparison with the economic effect. This enables the development of a novel index that integrates both economic and environmental impacts. We refer to this index as the sustainability index, capturing environmental and economic dimensions of sustainability, to provide a more comprehensive measure for the performance of waste management scenarios and technologies. The sustainability index across various waste management scenarios reflects both environmental and economic profit, revealing the overall viability of each method in terms of long-term sustainability, as defined by Equation (32).
S I T e c h = E C B + E N B

3. Results

3.1. Projected Waste Generation and Landfill Disposal

Table 1 shows the amount of waste generated, as well as the amount of organic and dry waste, both in 2025 and 2050, along with their cumulative values over the simulation period. In 2025, the total waste generated is 720,337 tons, slightly increasing to 726,198 tons by 2050. The cumulative amount of total waste generated from 2025 to 2050 is projected to be 18,720,336 tons. Organic waste, comprising biodegradable materials like food scraps, yard waste, and other organic matter, represents 71% of the total waste generated. In 2025, organic waste is 509,926 tons, which will increase to 514,076 tons by 2050. The cumulative amount of organic waste over the entire period is 13,252,126 tons. Dry waste, which includes non-biodegradable materials such as paper, plastic, glass, and metals, makes up 29% of the total waste generated. In 2025, dry waste will be 210,410.4 tons, increasing slightly to 212,122.9 tons by 2050, with a cumulative amount of 5,468,209 tons over the simulation period. This dry waste sector is the focus of this study as it is directly related to waste management and energy production strategies.
The amount of landfilling waste (direct dry waste and residual of different scenarios) for different scenarios is presented in Table 1. In the baseline (BAU) and sanitary landfill scenarios, 78% of the total dry waste is sent to the landfill, as some waste is separated at the source or collected for recycling. In both scenarios, landfill waste amounts to 166,670 tons in 2025 and 165,919 tons in 2050, with a cumulative total of 4,255,938 tons. Under the GSF scenario, 32% of dry waste is disposed of in landfills, totaling 67,817.6 tons in 2025 and slightly decreasing to 67,428.6 tons by 2050, with a cumulative amount of 1,730,746 tons. Similarly, under the Py scenario, 19% of dry waste is disposed of in landfills, totaling 39,670 tons in 2025 and slightly decreasing to 39,384 tons by 2050, with a cumulative amount of 1,011,719 tons. In the INC scenario, incineration reduces landfill waste to 18% of dry waste, with 37,535.6 tons in 2025 and 37,257.5 tons in 2050, leading to a cumulative total of 957,190 tons. Since incineration produces less residual waste than pyrolysis and gasification, the amount of landfill waste in the INC scenario is lower than in other scenarios.

3.2. Waste Composition Prediction

The forecasted results for the waste composition are presented in Table 2. Organic materials constitute the largest share of the waste composition at 70.8%. The amount of organic waste is projected to increase from 494,705 tons in 2020 to 527,186 tons in 2050. After organic materials, plastics represent the next largest component, accounting for 12.1% of the waste. Wood, with only 0.3%, constitutes the smallest fraction of municipal waste. Overall, valuable dry waste (comprising plastics, metals, and paper) makes up approximately 19.9% of the total waste, while non-valuable dry waste (comprising textiles, wood, and other materials) accounts for about 9.3%.

3.3. Electricity Balance of Waste Management Scenarios

Figure 2A illustrates the cumulative change in net electricity output, measured from 2025 to 2050. The data reveal that Py exhibits the highest net electricity output, demonstrated by a steep and consistent upward trend. This indicates a substantial increase in net electricity output over the 25 years that increases sharply, and by 2050, its cumulative total over the entire simulation period will exceed 10,469 GWh. The consistent upward trend in electricity generation under this scenario underscores its role as a highly efficient method for recovering energy from municipal solid waste. Conversely, the BAU scenario demonstrates a continuous decline in net electricity output, reaching approximately −2 GWh by 2050. This negative trajectory represents ongoing energy losses due to unmanaged waste accumulation, environmental degradation, and missed opportunities for resource recovery.
The consumption, production, and net electricity output in different scenarios are presented in Figure 2B. Among these scenarios, pyrolysis is the most efficient waste-to-energy solution, with a total electricity consumption of 1569 GWh and a generation of 12,038 GWh, leading to a net output of 10,469 GWh. This substantial energy yield underscores the effectiveness of pyrolysis in converting waste into electricity. Incineration follows as a highly efficient solution, with a total electricity consumption of 186 GWh and a generation of 5418 GWh, leading to a net output of 5232 GWh. This demonstrates the effectiveness of incineration in converting waste into electricity through direct combustion. Gasification, despite its high electricity consumption of 2803 GWh, generates 3486 GWh of electricity, resulting in a net output of 683 GWh. The process of gasification is highly energy-intensive, requiring significant external energy input for heating, gas cleaning, and syngas conditioning, as waste is converted into syngas under controlled conditions with limited oxygen at high temperatures (typically 700–1500 °C). The landfill gas (LFG) scenario demonstrates a low electricity consumption of 2 GWh and a generation of 389 GWh, leading to a net output of 387 GWh. In contrast, the BAU (Business As Usual) scenario demonstrates a negative net electricity output, with 2 GWh of energy consumed and no electricity generated, resulting in a net loss of −2 GWh. This highlights the inefficiency of traditional waste management practices that do not incorporate energy recovery technologies.

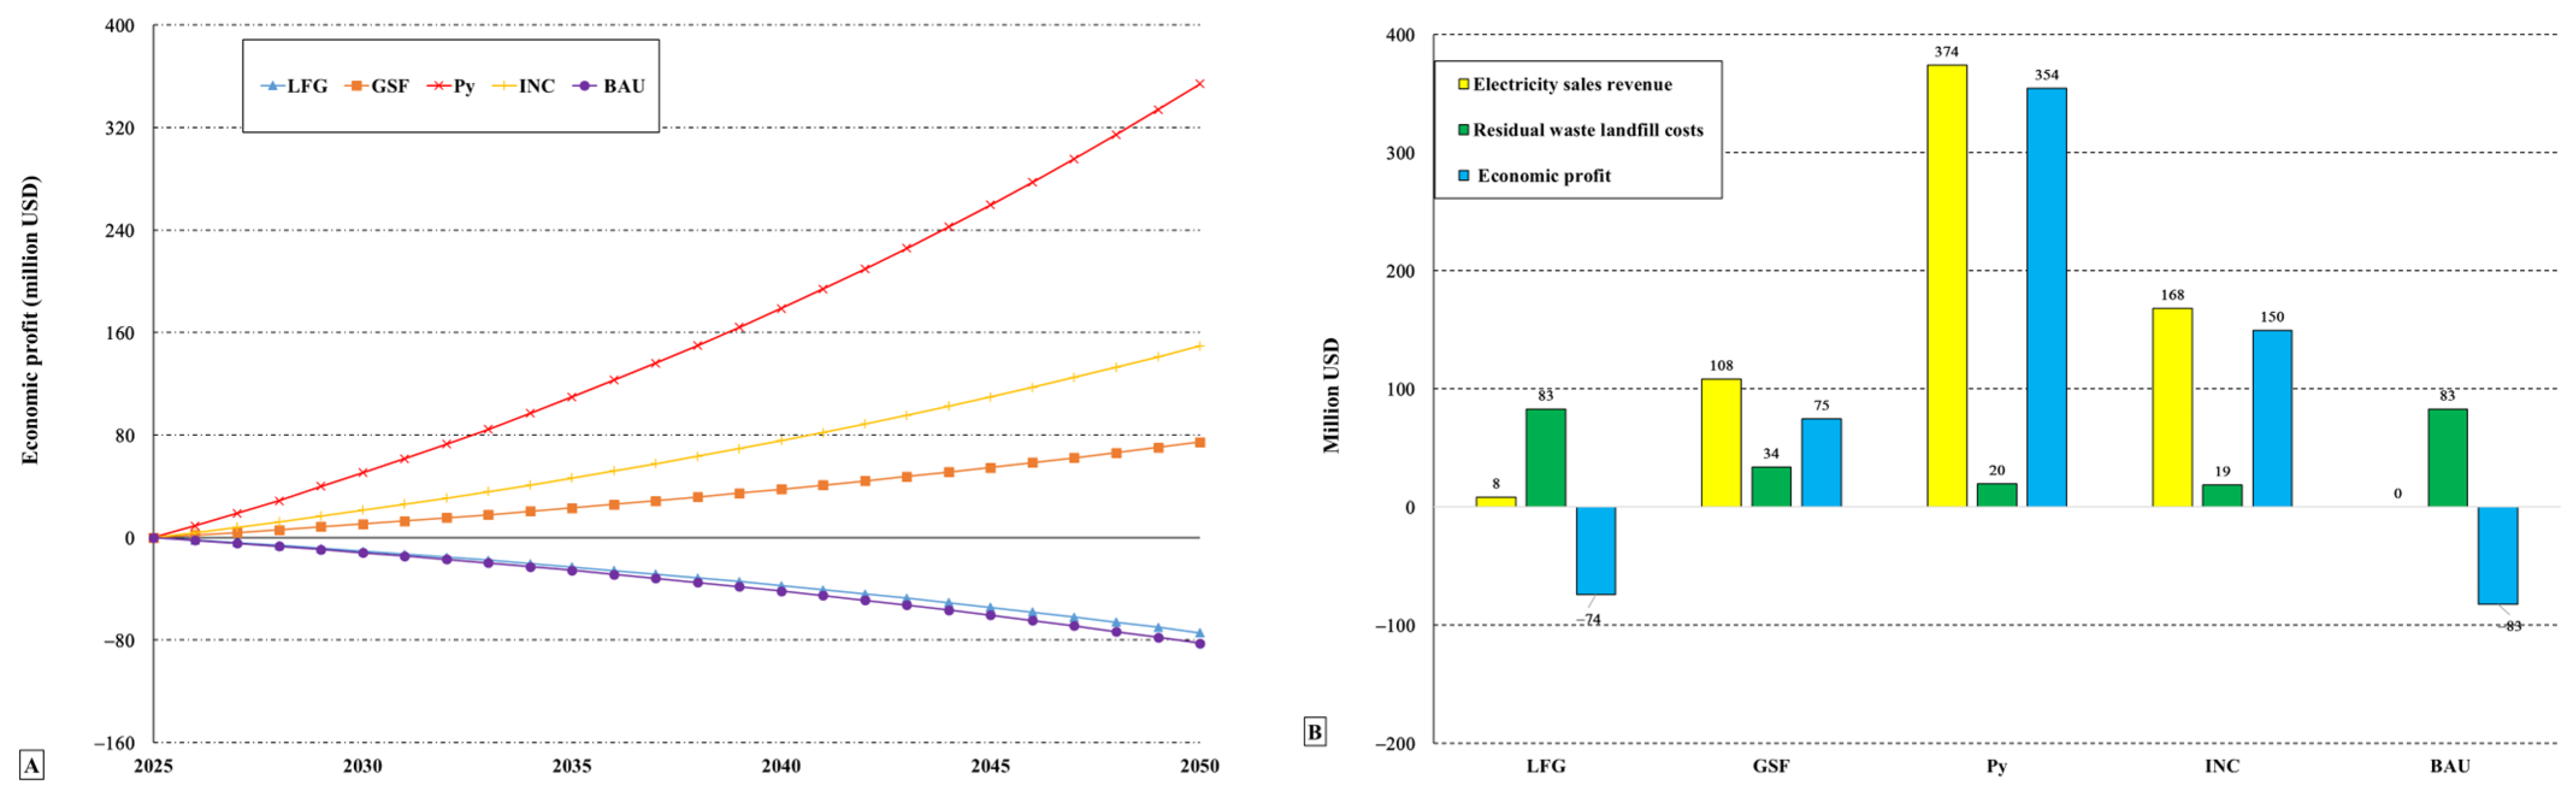
3.4. Net Economic Profit of Waste Management Scenarios

Among all scenarios, Py emerges as the most economically advantageous option. The net economic profit increases sharply during the simulation period (2025–2050), reaching USD 354 million by 2050. Compared to the BAU scenario, INC provides a financial gain of USD 437 million, which translates to a 529% improvement. The rapid increase in net economic profit highlights the efficiency of pyrolysis in maximizing energy recovery while keeping waste disposal costs low.
INC and GSF present a positive and continuous upward trend. The net economic profit rose consistently during the simulation period and reached USD 150 and USD 75 million by 2050, respectively. This represents an economic improvement of USD 232 million (281%) and USD 156 million (189%) compared to the BAU scenario, respectively, demonstrating the long-term financial viability (Figure 3A).
In contrast, the LFG scenario shows a continuous decline in net economic profit, deteriorating further to USD −74 million by 2050. However, compared to the BAU scenario in 2050 (USD −83 million), LFG performs USD 8 million better, reflecting a 10% reduction in economic losses. Despite this relative improvement, LFG remains financially unsustainable over the long term. The BAU scenario follows a trend similar to LFG but with even greater economic losses. The net economic profit declines steadily, reaching USD −83 million by 2050. The persistent financial losses reflect the inefficiencies of unmanaged waste disposal, where high landfill costs and missed energy recovery opportunities lead to worsening economic performance over time (Figure 3A).
The cumulative amount of electricity sales revenue, residual waste landfill costs, and overall net economic profit in the simulation period is depicted in Figure 3B. Among these, Py emerges as the most economically beneficial solution, generating USD 374 million in electricity sales revenue while incurring only USD 20 million in landfill costs, resulting in the highest net economic profit at USD 354 million. The combination of lower waste disposal costs and substantial revenue from electricity generation makes pyrolysis the most financially attractive waste-to-energy option. INC also demonstrates strong economic performance, generating USD 168 million in electricity sales revenue against landfill costs of USD 19 million, yielding a positive net economic profit of USD 150 million. This suggests that incineration is a financially viable approach, offering high-energy recovery with a favorable cost–benefit balance, further enhanced by its rapid and direct conversion of waste into electricity. GSF shows a moderate net economic profit, with USD 108 million in electricity sales revenue against landfill costs of USD 34 million, resulting in a net economic profit of USD 75 million. This indicates that gasification is a financially viable approach, offering high-energy recovery with a favorable cost–benefit balance. In contrast, LFG generates USD 8 million in electricity sales revenue but incurs high landfill costs of USD 83 million, leading to a negative net economic profit of USD −74 million. Despite its potential for electricity generation, the high costs associated with landfill maintenance outweigh its financial benefits, while its reliance on slow methane production further limits its economic competitiveness. The BAU scenario is the least efficient, as it generates no electricity sales revenue while still incurring USD 83 million in landfill costs, resulting in a negative net economic profit of USD −83 million. This reflects the financial burden of traditional waste disposal methods, where costs continue to rise without any economic return.

3.5. GHG Emissions in Waste Management Scenarios

The data on net GHG emissions from 2025 to 2050 across different waste management scenarios are presented in Figure 4A. The cumulative net GHG emissions for each scenario show varying trends, highlighting the impact of different waste management practices on reducing or increasing emissions over the simulation period. The graph for Py and INC shows a steady decrease in emissions, with values decreasing over time, culminating in cumulative GHG savings of 4.7 and 2.7 million tons by 2050. This reduction highlights incineration as the most effective scenario for reducing emissions, respectively, with avoided GHGs far outweighing the direct emissions from the process. This represents a 346% and 243% decrease for Py and INC compared to the BAU scenario, respectively.
Cumulative amounts of GHG emissions, avoided GHGs, and net GHG emissions during the simulation period, as depicted in Figure 4B, reveal significant differences across waste management scenarios. Notably, Py emerges as the most environmentally beneficial, demonstrating 3.6 million tons of GHG emissions offset by 9.9 million tons of avoided GHGs, resulting in a substantial net GHG emission saving of −4.7 million tons. Therefore, this highlights its impactful role in reducing the environmental footprint through significantly outweighing direct emissions with avoided ones. Emissions from converting pyrolysis products into electricity are carbon-neutral due to the renewable nature of the process [42]. Similarly, INC also contributes to a notable reduction, with 1.6 million tons of GHG emissions countered by 4.4 million tons of avoided GHGs, leading to a net saving of −2.7 million tons, further emphasizing the effectiveness of this method in minimizing environmental impact. In contrast, GSF, while showing 2.4 million tons of GHG emissions and 2.9 million tons of avoided GHGs, results in a net emission of 1.3 million tons, indicating a reduction compared to the BAU scenario but still contributing to net emissions. Likewise, LFG, with 0.8 million tons of GHG emissions and 0.5 million tons of avoided GHGs, leads to a net emission of 0.3 million tons, showing some reduction but ultimately adding to net emissions. However, in stark contrast, the BAU scenario, representing traditional waste management practices, contributes 1.9 million tons of GHG emissions without any avoided emissions, resulting in a net emission of 1.9 million tons, thus underscoring its failure to offset emissions through energy recovery or waste reduction and consequently maintaining a higher environmental footprint.

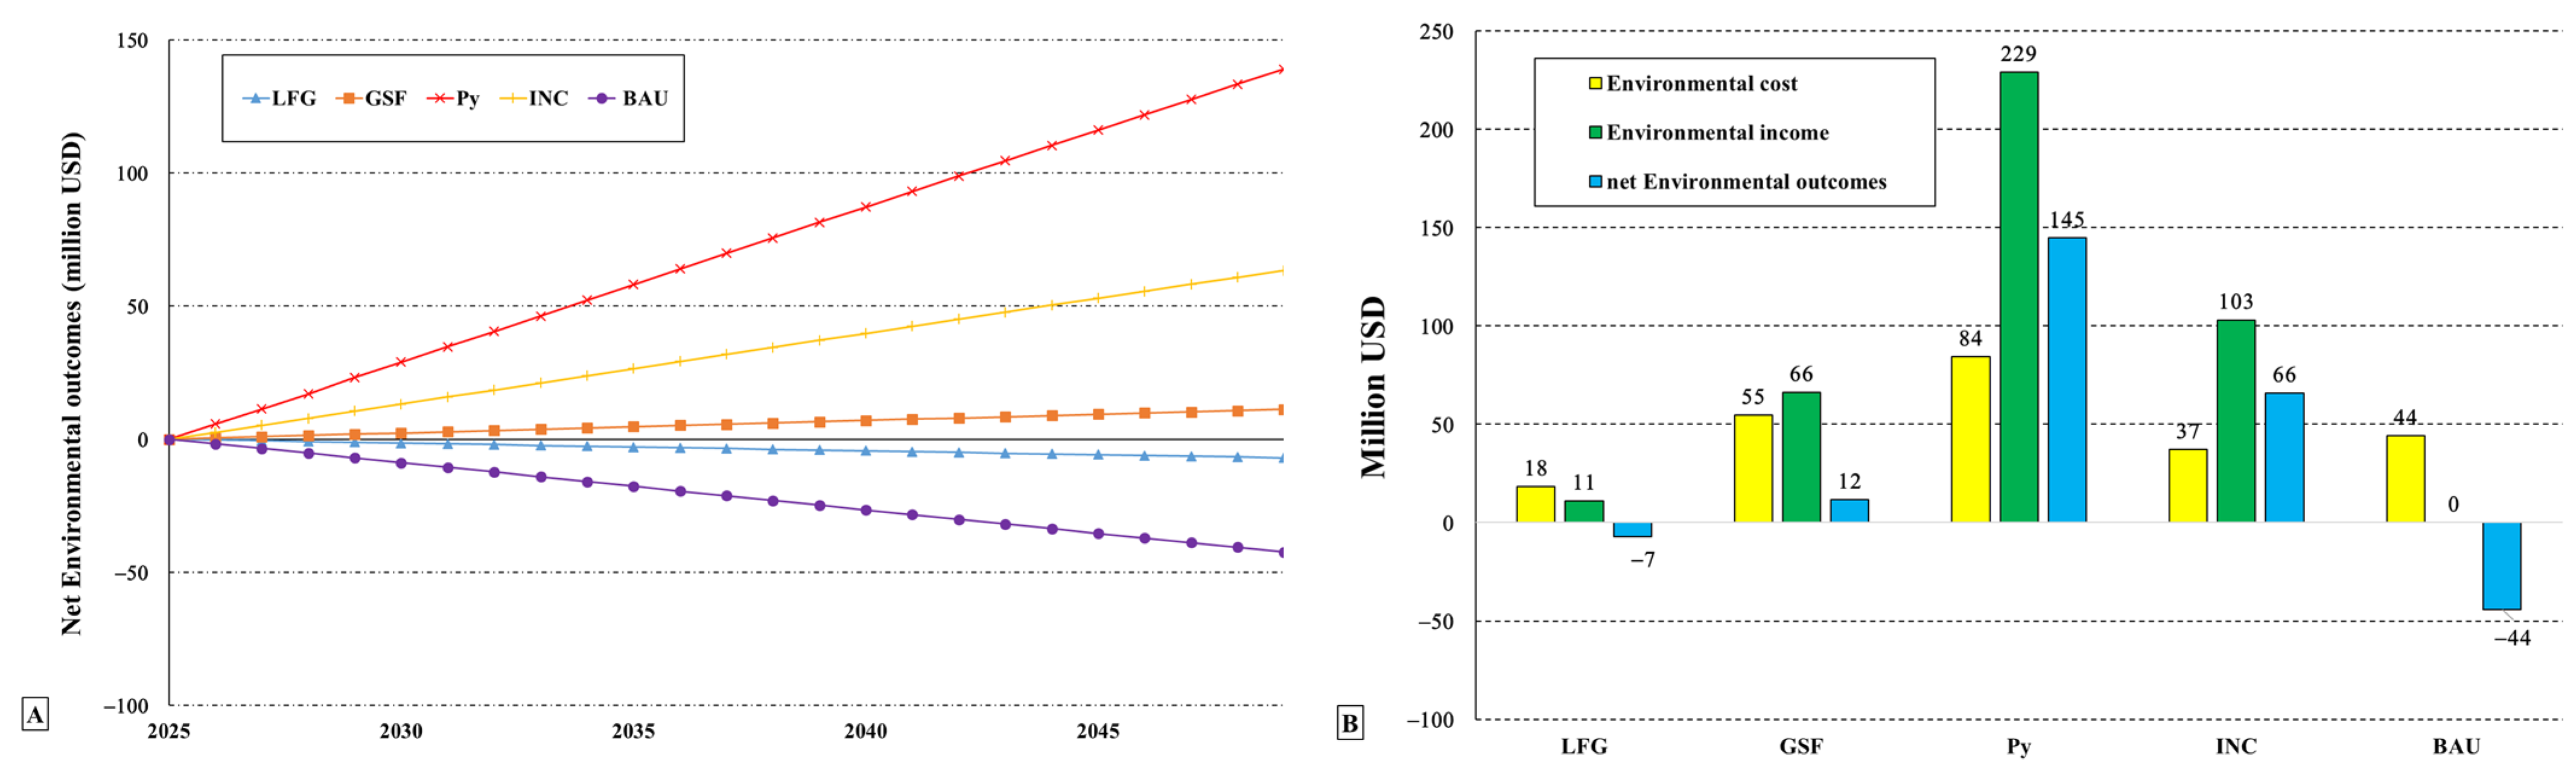
3.6. Net Environmental Outcomes in Waste Management Scenarios

The net environmental outcomes of different waste management methods vary over the period from 2025 to 2050 (Figure 5A). Py emerges as the most beneficial option, achieving a total environmental outcome of USD 145 million by 2050, which represents a 429% improvement compared to the BAU scenario and highlights its effectiveness in reducing greenhouse gas emissions and generating significant income from carbon credits. INC follows, providing substantial environmental outcomes of USD 66 million by 2050, demonstrating a 250% improvement over BAU and indicating its strong potential for emissions reduction and financial returns from carbon credits. GSF also results in a positive cumulative environmental outcome of USD 12 million, reflecting a net positive financial impact as the income from carbon savings outweighs the costs of emissions and waste management, leading to a 126% improvement compared to BAU. In contrast, the LFG scenario results in negative cumulative environmental outcomes of USD −7 million by 2050, indicating that carbon emissions and landfill operation costs exceed the potential savings from carbon credits, yet it still performs 38% better than BAU. Finally, the BAU scenario has the highest negative cumulative environmental impact, amounting to USD −44 million by 2050, reflecting the high costs of carbon emissions and waste management, which significantly outweigh any potential financial outcomes.
Figure 5B highlights the environmental cost, income, and net outcomes of each scenario, with Py exhibiting the highest environmental outcomes, as its environmental cost of USD 84 million is outweighed by an environmental income of USD 229 million from carbon savings, resulting in a net positive environmental outcome of USD 145 million, making it the most environmentally advantageous option. INC follows, with an environmental cost of USD 37 million and an environmental income of USD 103 million, yielding net environmental outcomes of USD 66 million, demonstrating that incineration effectively offsets its environmental costs while providing substantial environmental gains. The GSF scenario, with an environmental cost of USD 55 million and an environmental income of USD 66 million, achieves net positive environmental outcomes of USD 12 million, indicating that gasification is a viable, environmentally beneficial alternative, as carbon savings exceed emissions and associated costs. In contrast, the LFG scenario, with an environmental cost of USD 18 million and an environmental income of USD 11 million, results in negative environmental outcomes of USD −7 million, signifying that the environmental costs from greenhouse gas emissions and landfill operations surpass the carbon savings, making LFG an economically inefficient option. Finally, the BAU scenario, representing traditional waste management practices, incurs an environmental cost of USD 44 million without any environmental income from carbon savings, leading to a negative environmental outcome of USD −44 million and underscoring the high environmental burden of conventional waste management due to the absence of carbon reduction strategies.

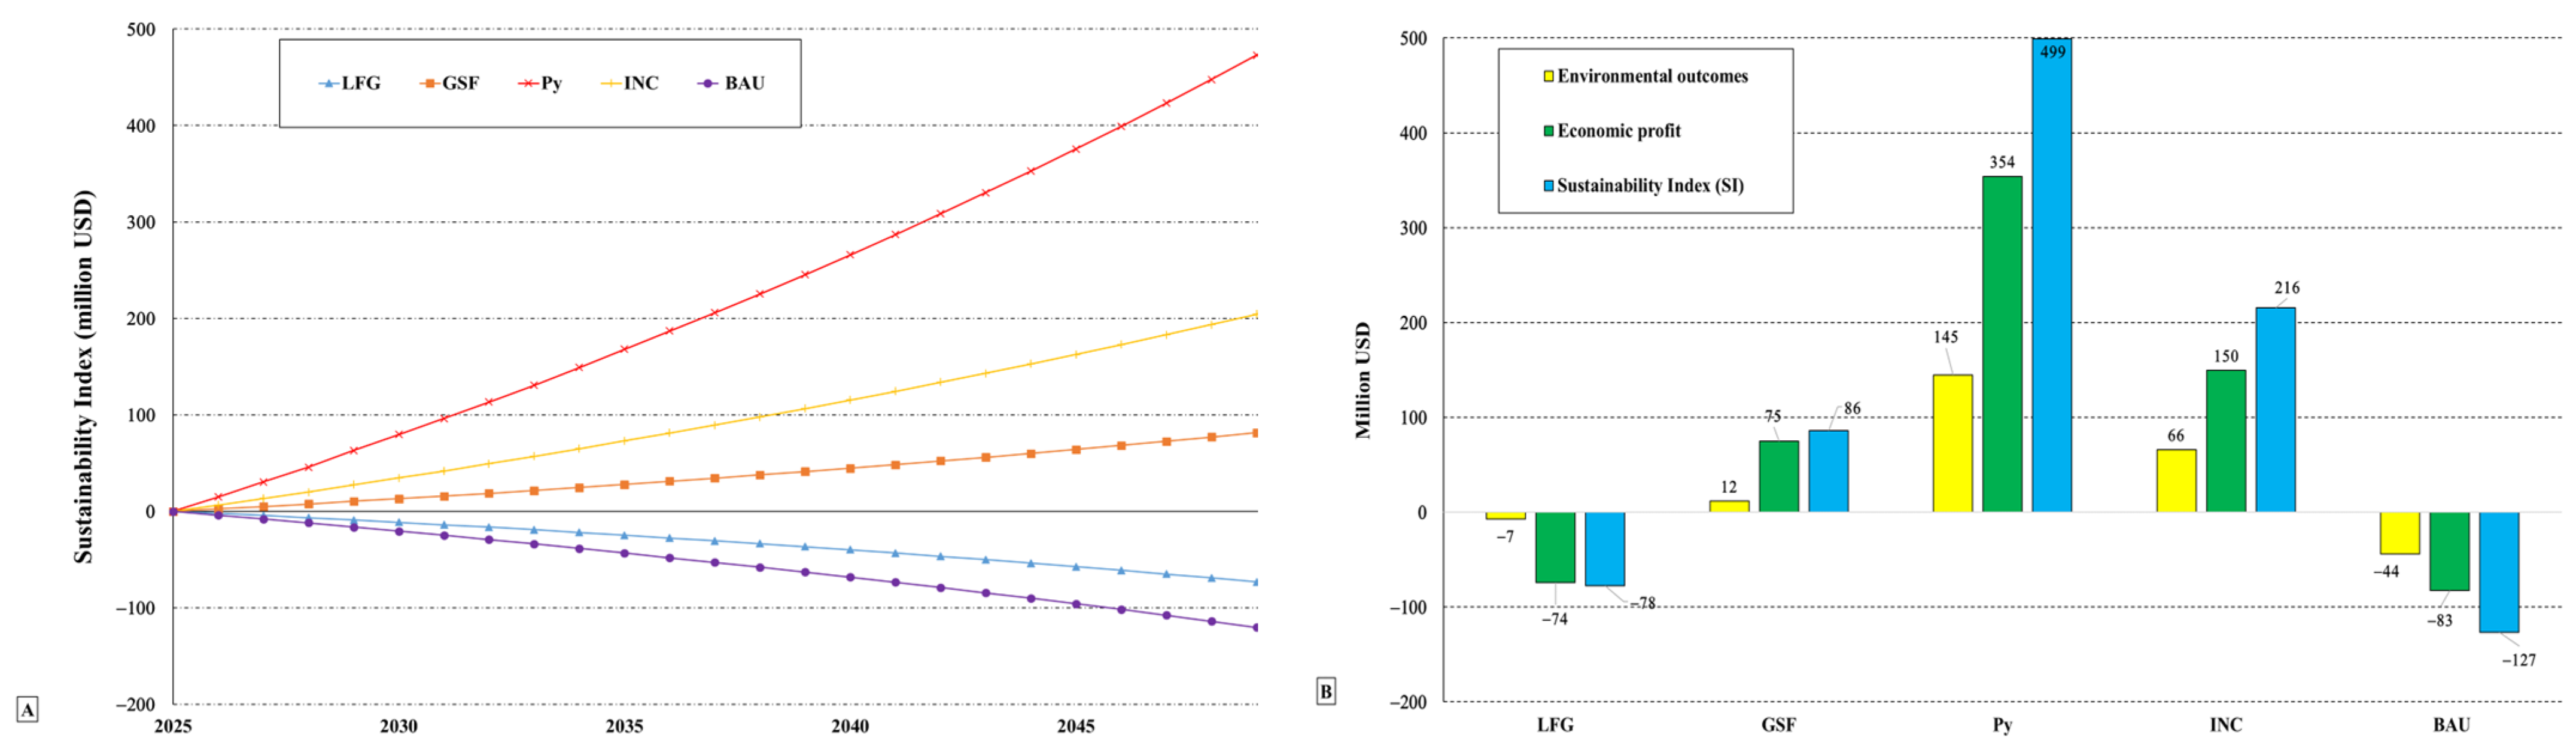
3.7. Sustainability Index in Waste Management Scenarios

The accumulated sustainability index (SI) for the LFG scenario is USD −78 million, reflecting a significant negative value that indicates an unsustainable trajectory in both environmental and economic profits. Over the simulation period from 2025 to 2050, LFG shows a consistently negative trend, improving by 39% compared to the BAU scenario, yet remaining unsustainable due to its steadily worsening sustainability. In contrast, the GSF scenario demonstrates a positive trend, with a sustainability index of USD 86 million by 2050, indicating consistent growth in environmental and economic profits. This scenario shows a 168% improvement over BAU in 2050, reflecting its superior sustainability. The INC scenario achieves a sustainability index of USD 216 million by 2050, maintaining a continual upward trajectory with significant increases in both environmental and economic profits, culminating in a 271% improvement over BAU by 2050. However, the pyrolysis (Py) scenario reaches the highest sustainability index of USD 499 million by 2050, with a 296% improvement over the BAU scenario, making it the most sustainable option over the simulation period, showcasing exceptional environmental and economic profits throughout (Figure 6A).
The data presented in Figure 6B reveal the environmental outcomes, economic profit, and sustainability index (SI) for each waste management scenario, providing a comprehensive measure of sustainability. The pyrolysis (Py) scenario stands out with the highest performance, showing an environmental outcome of USD 145 million, an economic profit of USD 354 million, and a sustainability index of USD 499 million. This makes pyrolysis the most sustainable option overall, as it offers the highest environmental and economic value, making it the most favorable choice among all scenarios. The INC (incineration) scenario follows closely, exhibiting an environmental outcome of USD 66 million and an economic profit of USD 150 million, resulting in a sustainability index of USD 216 million. This positions INC as a highly sustainable option, with both significant environmental outcomes and strong economic returns. The GSF (gasification) scenario demonstrates an environmental outcome of USD 12 million, an economic profit of USD 75 million, and a sustainability index of USD 86 million. This indicates that GSF is both environmentally and economically advantageous, offering a more sustainable option than both the LFG and BAU scenarios, though it is not as favorable as pyrolysis or INC. For the LFG (landfill gas) scenario, the environmental outcomes amount to USD −7 million, and the economic profit is USD −74 million, resulting in a negative sustainability index of −77. This highlights that LFG leads to a net loss in both environmental and economic terms, remaining unsustainable despite slight improvements compared to the BAU scenario. Finally, the BAU (Business As Usual) scenario demonstrates the least favorable outcomes, with an environmental outcome of USD −44 million, an economic profit of USD −83 million, and the lowest sustainability index of USD −127 million. BAU remains highly unsustainable, serving as the baseline for comparison in terms of both environmental and economic performance.

4. Discussion

This study aims to investigate the reduction of greenhouse gas (GHG) emissions and assess the sustainability index based on economic and environmental efficiency across different waste-to-energy conversion scenarios. To achieve this, a comprehensive waste management model was developed using the system dynamics approach in the Vensim software to predict waste generation and to compare incineration, gasification, and sanitary landfill scenarios with the baseline scenario over 25 years (2025–2050).
Results indicate that pyrolysis demonstrates the highest net electricity output, exhibiting a continuous upward trend and highlighting its efficiency in energy recovery from municipal solid waste. Studies have confirmed that pyrolysis is the most effective waste-to-energy solution, significantly outperforming other technologies in terms of electricity generation. It shows the highest energy recovery potential, making it a highly efficient method for converting waste into electricity [43]. These findings align with studies emphasizing the superior efficiency of pyrolysis in waste-to-energy systems [44,45]. Waste incineration, also effective, continues to be a reliable method for electricity generation [46]. Gasification, while capable of electricity production, requires substantial external energy input for heating, gas cleaning, and syngas conditioning due to its high-temperature operation, making it less efficient in net energy recovery. Research indicates that gasification’s high-energy demand reduces its overall effectiveness compared to direct combustion methods [47]. In contrast, traditional waste management without energy recovery results in ongoing energy losses and missed resource recovery opportunities [48]. Previous analyses have shown that such conventional approaches not only fail to generate electricity but also contribute to environmental degradation, reinforcing the need for advanced waste-to-energy strategies [49,50].
The net economic profit of various waste management scenarios reveals significant differences in financial performance, driven by electricity sales revenue, landfill costs, and overall economic efficiency. Pyrolysis is the most economically advantageous option, demonstrating the highest net economic profit and substantial revenue from electricity sales while keeping waste disposal costs low. This makes it the best option, surpassing other methods in both energy recovery and financial returns [51]. Incineration also shows a strong upward trend in net economic profit, maximizing energy recovery while minimizing waste disposal costs. Previous studies have confirmed the strong financial viability of pyrolysis and incineration, emphasizing their ability to generate substantial revenue from electricity sales while reducing landfill expenses [52]. Gasification also exhibits a consistent upward trend in net economic profit, underscoring its potential as a financially viable waste-to-energy option. However, research suggests that gasification, despite its favorable cost–benefit balance, remains less economically efficient than pyrolysis and incineration due to its high operational costs and energy demands [53]. In contrast, landfill gas recovery shows a continuous decline in net economic profit, with financial losses persisting over time. Although it performs slightly better than conventional waste disposal, studies indicate that its high landfill maintenance costs and slow methane production make it an unsustainable long-term solution [54]. The business-as-usual scenario results in the greatest financial losses, reflecting the inefficiencies of unmanaged waste disposal, where rising landfill costs and the absence of energy recovery contribute to worsening economic performance [55]. Recent research further supports the financial viability of advanced waste-to-energy technologies, advocating for their adoption to mitigate economic and environmental losses [56,57,58].
GHG emissions vary significantly across different waste management scenarios, reflecting their environmental impact in terms of both direct emissions and avoided emissions. Pyrolysis demonstrates the highest reduction in net emissions, with avoided GHGs far exceeding the emissions generated, making it the most effective method for minimizing environmental impact. Studies confirm that pyrolysis significantly reduces net GHG emissions by offsetting fossil fuel-based electricity production and reducing methane emissions from landfills [59]. This makes pyrolysis the most environmentally beneficial waste-to-energy option, outperforming other methods in its ability to reduce emissions. Incineration also shows a significant reduction in net emissions, with avoided GHGs outweighing the emissions produced, but it is less effective than pyrolysis in terms of overall environmental outcomes [60]. Landfill gas recovery shows some reduction in emissions compared to traditional waste disposal, yet it still results in net positive emissions due to the slow and incomplete capture of methane. Research indicates that while LFG reduces overall emissions, its long-term effectiveness is limited by landfill gas capture efficiency [54]. Gasification presents a mixed outcome, with high direct emissions but substantial avoided emissions, leading to a moderate net reduction. Previous studies highlight that gasification can achieve net GHG reductions when integrated with efficient energy recovery and syngas utilization, although its overall impact is sensitive to process optimization [61]. In contrast, the business-as-usual scenario results in a continuous rise in emissions due to the lack of energy recovery or waste treatment measures, reinforcing its status as the least sustainable option. Evidence suggests that unmanaged waste disposal contributes significantly to long-term environmental degradation, further emphasizing the need for advanced waste management solutions. Recent research further supports the adoption of advanced waste-to-energy technologies to mitigate GHG emissions and enhance environmental sustainability [62].
The net environmental outcomes of various waste management scenarios are determined by assessing both the environmental income from carbon credits due to GHG savings and the associated environmental costs, which include carbon emissions and landfill operations. Pyrolysis stands out as the most environmentally beneficial method, achieving the highest net environmental outcomes of USD 145 million by 2050. This is driven by significant carbon savings, which outweigh the environmental costs, making it the most advantageous option for reducing greenhouse gas emissions and generating income from carbon credits. Studies confirm that pyrolysis is highly effective in reducing emissions and producing substantial environmental returns [51]. Incineration also provides significant net environmental outcomes, with carbon credit savings exceeding its carbon emissions, yielding a cumulative environmental outcome of USD 66 million by 2050. Research supports the role of incineration in reducing GHG emissions and generating financial returns from carbon savings [62]. Gasification provides a positive net environmental outcome, with carbon savings exceeding its environmental costs, though it is less efficient than incineration in terms of environmental returns [58]. Landfill gas recovery, while offering some GHG reductions, results in negative environmental outcomes, as the costs of carbon emissions and landfill operations exceed the savings from carbon credits. Research has shown that LFG is less effective in reducing net emissions due to its relatively low capture efficiency and the ongoing emissions from landfill operations [63]. The BAU scenario demonstrates the lowest environmental outcomes, underscoring the inefficiency of traditional waste management practices. Studies emphasize that conventional waste management, which lacks energy recovery or emission reduction measures, leads to substantial environmental costs and missed opportunities for carbon savings [58]. These findings align with studies emphasizing the environmental advantages of incineration and gasification [64] and the inefficiencies of landfill-based approaches [65].
The sustainability index across various waste management scenarios highlights the overall viability of each method. Pyrolysis stands out as the most sustainable option, offering the highest environmental and economic outcomes, making it the most favorable choice for long-term sustainability. Its exceptional performance stems from its ability to significantly reduce environmental harm while generating substantial economic returns. Incineration also demonstrates strong sustainability, showing continuous improvement in both environmental and economic profit, though it remains less impactful than pyrolysis. Gasification follows, offering positive environmental and economic advantages, but its sustainability remains lower than both pyrolysis and incineration. In contrast, landfill gas recovery (LFG), while slightly improving over traditional methods, remains unsustainable due to the high costs of carbon emissions and landfill operations. The BAU scenario, with no energy recovery or emission reduction strategies, shows the least favorable sustainability outcomes, emphasizing the inefficiencies of conventional waste management practices. This scenario continues to be inefficient, as the costs of carbon emissions and landfill management outweigh the benefits of carbon savings, similar to previous findings that point to the inefficiencies of LFG in achieving significant sustainability [47,66]. Recent research further supports the adoption of advanced waste-to-energy technologies to enhance sustainability [67,68,69]. Luo et al. (2024) [70] presented that incinerating one ton of waste in a Chinese plant recovers energy and reduces greenhouse gas emissions by 30% compared to landfilling. Despite some toxicity impacts, the process offers overall environmental benefits, with improvement to further sustainability. The BAU scenario, representing traditional waste management practices, shows the worst sustainability outcomes, with a negative sustainability index of USD −127 million, emphasizing its lack of effective environmental or economic strategies. Kasiński et al. (2024) [71] demonstrated that traditional waste disposal methods like landfilling and incineration pose notable environmental challenges. However, emerging waste-to-energy (WtE) technologies, such as pyrolysis, gasification, and improved incineration, present promising alternatives for recovering energy and utilizing resources more effectively.
Although waste management practices have advanced considerably, addressing social dimensions remains crucial. A major obstacle is the limited public awareness and participation in source separation, which is essential for enhancing recycling and recovery processes [72]. Furthermore, while waste-to-energy (WtE) technologies are recognized as more sustainable than landfill disposal, public perceptions often remain skeptical. It is important to promote WtE solutions without compromising efforts to improve separate collection systems and to strengthen more virtuous and sustainable waste management behaviors [73]. In the context of integrated waste management, it is essential to consider the waste management hierarchy, which prioritizes waste prevention, reuse, and recycling before energy recovery and final disposal [74]. While WtE technologies, such as pyrolysis and incineration, offer advantages over landfilling by reducing greenhouse gas emissions and recovering energy [46], they should not undermine efforts to enhance separate collection and recycling practices [75]. Achieving a balance between promoting WtE and maintaining high recycling rates is crucial for sustainable waste management. Positioning WtE technologies pragmatically within the waste hierarchy can also enhance public acceptance by showing alignment with broader environmental and sustainability goals [76].

5. Conclusions

The comparative analysis of different waste management scenarios highlights the advantages of pyrolysis in terms of energy recovery, economic profits, GHG emissions reduction, environmental outcomes, and long-term sustainability. Pyrolysis emerges as relatively more efficient for both electricity generation and minimizing environmental impact, achieving the highest net electricity output and substantial financial returns through carbon credit savings. Incineration also shows strong performance in terms of both energy recovery and GHG emissions reduction, although it is slightly less effective than pyrolysis in overall environmental and economic profits. Although gasification provides energy recovery and offers positive environmental and economic outcomes, it is less efficient than incineration due to its high operational energy demands and operational costs. Nonetheless, its performance improves over the BAU scenario, indicating its potential as a viable waste-to-energy technology. Both the LFG and BAU scenarios are shown to be relatively less sustainable. LFG, despite some improvements over traditional waste disposal (BAU), remains inefficient due to low methane capture rates and the ongoing emissions from landfill operations, leading to negative environmental and economic profit.
The BAU scenario continues to show negative environmental and economic outcomes, restating it as the least sustainable option. Thus, the study highlights the importance of adopting advanced waste-to-energy technologies, such as pyrolysis and incineration, to enhance both environmental and economic outcomes. Moreover, the inefficiencies of the conventional method miss the opportunities for resource recovery, leading to environmental degradation. The findings of this study provide valuable insights for policymakers and researchers, emphasizing the critical need for strategic waste-to-energy (WtE) planning to reduce greenhouse gas (GHG) emissions and promote long-term sustainability.
Limitations of the current analysis include the lack of consideration of social factors, such as public acceptance of WtE technologies across different regions. Future research should address these social dimensions, as public concerns regarding emissions and environmental risks can significantly affect the feasibility and successful implementation of WtE projects. Additionally, it is important to position WtE technologies properly within the established waste management hierarchy, prioritizing waste prevention, reuse, and recycling before considering energy recovery options, thereby supporting a pragmatic and widely accepted vision of sustainability.
In addition, the technical, economic, and operational feasibility of advanced technologies, particularly pyrolysis, must be critically evaluated. Although pyrolysis demonstrated superior environmental performance, practical barriers such as regulatory constraints, technological risks (e.g., operational instability, toxic by-product formation), and economic uncertainties related to market fluctuations must be carefully addressed to enable realistic project development. Another limitation of this study lies in the modeling assumptions, particularly the reliance on historical waste composition data. Potential rapid societal or technological changes, such as new recycling policies or shifts in consumption patterns, could alter future waste characteristics, thereby affecting the performance of WtE technologies. Future studies should account for these dynamic factors to improve the robustness of modeling approaches.
Future research should also prioritize the development of hybrid WtE systems and optimization of waste composition management as key areas for innovation. For example, combining pyrolysis with gasification or anaerobic digestion could maximize energy recovery while minimizing emissions. Furthermore, the exploration of advanced pyrolysis techniques, such as catalytic pyrolysis for higher oil yields or plasma-assisted pyrolysis for cleaner syngas production, could reduce operational costs and enhance process scalability. Additionally, the role of pre-treatment methods (e.g., mechanical sorting, drying) should be examined to determine their effects on energy recovery rates and emission reductions.

Supplementary Materials

The following supporting information can be downloaded at https://www.mdpi.com/article/10.3390/en18092346/s1, Figure S1: Result of the dimensional consistency test; Figure S2: Behavior of population, GDP, and waste generation; Figure S3: Behavior of the capacity of different waste management methods in the BAU Scenario; Figure S4: Changes for incineration under extreme conditions test the incineration rate Figure S5: Changes for waste to landfill under extreme conditions test the incineration rate; Figure S6: Integration error test for the variable “amount of waste to landfill”; Figure S7: Integration error test for the variable “amount of net GHG emission”; Figure S8: Sensitivity analysis of the amount of waste sent to landfills concerning per capita waste generation; Figure S9: Stocks and flows of waste generation subsection; Figure S10: Stocks and flows of waste collection subsection; Figure S11: Stocks and flows of the incineration treatment subsection; Figure S12: Stocks and flows of the pyrolysis treatment subsection; Figure S13: Stocks and flows of the gasification treatment subsection; Figure S14. Stocks and flows of the landfill subsection; Table S1: Comparison of waste management technologies; Table S2: Validity test for the total population and total waste generated; Table S3: Model validation results; and Table S4: Assumptions, variables, and coefficients used in the model.

Author Contributions

Conceptualization, A.S. and M.H.; methodology, A.S., M.M., M.A.A., M.H. and N.J.H.F.; software, A.S. and M.H.; validation, A.S. and R.S.; formal analysis, A.S., M.M., S.A. and R.S.; investigation, A.S., M.M., M.A.A., S.A., M.H. and N.J.H.F.; resources, A.S. and M.M.; data curation, A.S. and M.M.; writing—original draft preparation, A.S. and M.M.; writing—review and editing, A.S., M.M., M.A.A., M.H., N.J.H.F., S.A. and R.S.; visualization, A.S. and R.S.; supervision, M.M.; project administration, A.S.; funding acquisition, R.S. All authors have read and agreed to the published version of the manuscript.

Funding

This research received no external funding.

Data Availability Statement

Data are contained within the article.

Acknowledgments

We thank the Municipality and Waste Management Organization of Karaj for helping with the data collection.

Conflicts of Interest

The authors declare no conflicts of interest.

Abbreviations

Nomenclature
Indexes
T e c h Different technologies (LFE, LF, INC, GSF) Y Types of emissions (DEM, IEM, AV, IAV)
L F E Landfill with gas recovery I E M GHG emissions from input material
L F Conventional landfill without gas recovery A V Avoided GHGs from using tech
I N C Incineration I A V Avoided GHGs from input material savings
G S F Gasification D E M Direct emission of GHGs from tech
PyPyrolysis M t Million tons
D Dry waste X Types of GHGs (CO2, CH4, N2O)
G W P Global warming potential F U Fuel
Parameters
C C Carbon credit (USD/ton) H V K Heat value of waste type K (MJ/ton)
σ T e c h Mechanical treatment efficiency for Py, GSF, and INC (%) H V C H 4 Heat value of methane (MJ/M3)
ε T e c h Efficiency of technologies (%) ε C H 4 t o E l The efficiency of methane to electricity (%)
ω T e c h Expected landfill diversion (%) κ L F Methane generation rate (1/year)
F C F The fraction of fossil carbon in waste L 0 Methane potential generation capacity (M3/ton)
C C V The ratio of carbon in household waste δ T e c h Electricity consumption coefficient by different technologies (kWh/ton)
C E The combustion efficiency of the waste incinerator λ The conversion factor of heat ratio (MJ to kWh)
C F C O 2 E L The coefficient of CO2 emission from electricity consumption in tech M V The molecular weight proportion of CO2/C
C F C O 2 F U The coefficient of CO2 emission from fuel consumption in tech P R L F Waste disposal costs (USD/ton)
P R E L Price of produced energy (USD/kWh) W L F The volume of waste to landfill (ton)
E F X T e c h The estimated factor of X emission by different technologies V D T e c h The volume of dry waste type K used in tech (ton)
E E F X T e c h The estimated X emission factor by different technologies F U S V T e c h The savings in fuel from using different tech
F U C T e c h The fuel consumption by different tech
Calculated variables
E L P T e c h Produced energy by different technologies (kWh) P W Y T e c h Produced waste in technologies (ton)
E L C T e c h Electricity consumption by different technologies (USD/year) E N I T e c h Environmental income by different technologies (USD/year)
E C I T e c h Economic income by different technologies (USD/year) E L S V T e c h The savings in fuel by different technologies
E C C T e c h Economic cost by different technologies (USD/year) E N C T e c h Environmental cost by different technologies (USD/year)
E C b T e c h Economic profit by different technologies (USD/year) n e t E L T e c h Net electricity output by different technologies (kWh)
G H G Y T e c h The GHG emissions of Y in tech E N B T e c h Environmental outcomes by different technologies (USD/year)
n e t G H G T e c h The net GHG emissions Y in tech S I T e c h Sustainability index by different technologies (USD/year)

References

  1. UNEP. Global Waste Management Outlook 2024: Beyond an Age of Waste, Turning Rubbish into a Resource. 2024. Available online: https://www.unep.org/resources/global-waste-management-outlook-2024 (accessed on 1 May 2024).
  2. Siddiqua, A.; Hahladakis, J.N.; Al-Attiya, W.A.K.A. An overview of the environmental pollution and health effects associated with waste landfilling and open dumping. Environ. Sci. Pollut. Res. 2022, 29, 58514–58536. [Google Scholar] [CrossRef]
  3. Gupta, J.; Ghosh, P.; Kumari, M.; Thakur, I.S.; Swati. Chapter 14—Solid waste landfill sites for the mitigation of greenhouse gases. In Biomass, Biofuels, Biochemicals; Thakur, I.S., Pandey, A., Ngo, H.H., Soccol, C.R., Larroche, C., Eds.; Elsevier: Rio de Janeiro, Brazil, 2022; pp. 315–340. [Google Scholar]
  4. Pegg, K.; Wilson, G.; Al-Duri, B. Exploring Trigeneration in MSW Gasification: An Energy Recovery Potential Study Using Monte Carlo Simulation. Energies 2025, 18, 1034. [Google Scholar] [CrossRef]
  5. Stark, B.M.; Tian, K.; Krause, M.J. Investigation of U.S. landfill GHG reporting program methane emission models. Waste Manag. 2024, 186, 86–93. [Google Scholar] [CrossRef] [PubMed]
  6. Keskin, T.; Yilmaz, E.; Kasap, T.; Sari, M.; Cao, S. Toward Viable Industrial Solid Residual Waste Recycling: A Review of Its Innovative Applications and Future Perspectives. Minerals 2024, 14, 943. [Google Scholar] [CrossRef]
  7. Agboola, S.O.; Inetabor, G.M.; Bello, O.O.; Bello, O.S. Waste Pollution and Management: Current Challenges and Future Perspectives. In Smart Waste and Wastewater Management by Biotechnological Approaches; Springer: Berlin/Heidelberg, Germany, 2025; pp. 3–20. [Google Scholar]
  8. Abubakar, I.R.; Maniruzzaman, K.M.; Dano, U.L.; AlShihri, F.S.; AlShammari, M.S.; Ahmed, S.M.S.; Al-Gehlani, W.A.G.; Alrawaf, T.I. Environmental Sustainability Impacts of Solid Waste Management Practices in the Global South. Int. J. Environ. Res. Public Health 2022, 19, 12717. [Google Scholar] [CrossRef]
  9. Marciniuk-Kluska, A.; Kluska, M. Energy Recovery from Municipal Biodegradable Waste in a Circular Economy. Energies 2025, 18, 2210. [Google Scholar] [CrossRef]
  10. Sharma, H.B.; Vanapalli, K.R.; Samal, B.; Cheela, V.R.S.; Dubey, B.K.; Bhattacharya, J. Circular economy approach in solid waste management system to achieve UN-SDGs: Solutions for post-COVID recovery. Sci. Total Environ. 2021, 800, 149605. [Google Scholar] [CrossRef]
  11. Jiang, T.; He, X.; Su, B.; Havea, P.H.; Wei, K.; Kundzewicz, Z.W.; Liu, D. COP 28: Challenge of coping with climate crisis. Innovation 2024, 5, 100559. [Google Scholar] [CrossRef]
  12. Molitor, M.R. The United Nations climate change agreements. In The Global Environment; Routledge: Oxfordshire, UK, 2023; pp. 210–235. [Google Scholar]
  13. Haraguchi, M.; Siddiqi, A.; Narayanamurti, V. Stochastic cost-benefit analysis of urban waste-to-energy systems. J. Clean. Prod. 2019, 224, 751–765. [Google Scholar] [CrossRef]
  14. Siddiqi, A.; Haraguchi, M.; Narayanamurti, V. Urban waste to energy recovery assessment simulations for developing countries. World Dev. 2020, 131, 104949. [Google Scholar] [CrossRef]
  15. Kaza, S.; Yao, L.; Bhada-Tata, P.; Van Woerden, F. What a Waste 2.0: A Global Snapshot of Solid Waste Management to 2050; World Bank Publications: Washington, DC, USA, 2018. [Google Scholar]
  16. Neuwahl, F.; Cusano, G.; GÓMEZ, B.J.; Holbrook, S.; Roudier, S. Best available techniques (BAT) reference document for waste incineration: Industrial emissions directive 2010/75/EU (Integrated Pollution Prevention and Control). 2019. Available online: https://eippcb.jrc.ec.europa.eu/sites/default/files/2020-01/JRC118637_WI_Bref_2019_published_0.pdf (accessed on 7 January 2020).
  17. Khan, S.; Anjum, R.; Raza, S.T.; Ahmed Bazai, N.; Ihtisham, M. Technologies for municipal solid waste management: Current status, challenges, and future perspectives. Chemosphere 2022, 288, 132403. [Google Scholar] [CrossRef] [PubMed]
  18. Elmnifi, M.; Habeeb, L.J.; Majdi, H.S.; Oleksandr, T. Chapter 24—Energy recovery from municipal solid waste incineration: Case study—Libya. In Advances in Energy from Waste; Vambol, V., Vambol, S., Khan, N.A., Mozaffari, N., Mozaffari, N., Eds.; Woodhead Publishing: Cambridgeshire, UK, 2024; pp. 773–809. [Google Scholar]
  19. EU. Directive (EU) 2023/1791 of the European Parliament and of the Council of 13 September 2023 on Energy Efficiency and Amending Regulation (EU) 2023/955 (Recast). 2023. Available online: https://eur-lex.europa.eu/legal-content/EN/TXT/PDF/?uri=CELEX:32023L1791 (accessed on 17 February 2024).
  20. Samarasinghe, K.; Wijayatunga, P.D.C. Techno-economic feasibility and environmental sustainability of waste-to-energy in a circular economy: Sri Lanka case study. Energy Sustain. Dev. 2022, 68, 308–317. [Google Scholar] [CrossRef]
  21. Chen, Y.; Pinegar, L.; Immonen, J.; Powell, K.M. Conversion of food waste to renewable energy: A techno-economic and environmental assessment. J. Clean. Prod. 2023, 385, 135741. [Google Scholar] [CrossRef]
  22. Oliveira, J.P.; Pessoa, F.L.P.; Mehl, A.; Alves, F.C.; Secchi, A.R. Sustainability Indicators to MSW Treatment Assessment: The Rio de Janeiro Case Study. Sustainability 2024, 16, 7445. [Google Scholar] [CrossRef]
  23. Dastjerdi, B.H.; Strezov, V.; Kumar, R.; Behnia, M. Economic Feasibility and Sustainability Assessment of Residual Municipal Solid Waste Management Scenarios in NSW, Australia. Sustainability 2021, 13, 8972. [Google Scholar] [CrossRef]
  24. Eslami, S.; Kabir, G.; Ng, K.T.W. Waste Generation Modeling Using System Dynamics with Seasonal and Educational Considerations. Sustainability 2023, 15, 9995. [Google Scholar] [CrossRef]
  25. Rafew, S.M.; Rafizul, I.M. Application of system dynamics for municipal solid waste to electric energy generation potential of Khulna city in Bangladesh. Energy Rep. 2023, 9, 4085–4110. [Google Scholar] [CrossRef]
  26. Shahbazi, A.; Moeinaddini, M.; Abdoli, M.A.; Hosseinzadeh, M.; Jaafarzadeh, N.; Sinha, R. Environmental Damage of Different Waste Treatment Scenarios by Considering Avoided Emissions Based on System Dynamics Modeling. Sustainability 2023, 15, 16158. [Google Scholar] [CrossRef]
  27. Sterman, J. System Dynamics: Systems Thinking and Modeling for a Complex World; Massachusetts Institute of Technology: Cambridge, MA, USA, 2002. [Google Scholar]
  28. Wang, W.-J.; You, X.-Y. Benefits analysis of classification of municipal solid waste based on system dynamics. J. Clean. Prod. 2021, 279, 123686. [Google Scholar] [CrossRef]
  29. Dianati, K.; Schäfer, L.; Milner, J.; Gómez-Sanabria, A.; Gitau, H.; Hale, J.; Langmaack, H.; Kiesewetter, G.; Muindi, K.; Mberu, B.; et al. A system dynamics-based scenario analysis of residential solid waste management in Kisumu, Kenya. Sci. Total Environ. 2021, 777, 146200. [Google Scholar] [CrossRef]
  30. Xiao, S.; Dong, H.; Geng, Y.; Tian, X. Low carbon potential of urban symbiosis under different municipal solid waste sorting modes based on a system dynamic method. Resour. Conserv. Recycl. 2022, 179, 106108. [Google Scholar] [CrossRef]
  31. Hosseinalizadeh, R.; Shakouri, G.H.; Izadbakhsh, H. Planning for energy production from municipal solid waste: An optimal technology mix via a hybrid closed-loop system dynamics-optimization approach. Expert Syst. Appl. 2022, 199, 116929. [Google Scholar] [CrossRef]
  32. Di Nola, M.F.; Escapa, M.; Ansah, J.P. Modelling solid waste management solutions: The case of Campania, Italy. Waste Manag. 2018, 78, 717–729. [Google Scholar] [CrossRef]
  33. Hosseinalizadeh, R.; Izadbakhsh, H.; Shakouri, G.H. A planning model for using municipal solid waste management technologies- considering Energy, Economic, and Environmental Impacts in Tehran-Iran. Sustain. Cities Soc. 2021, 65, 102566. [Google Scholar] [CrossRef]
  34. van der Hulst, M.K.; Ottenbros, A.B.; van der Drift, B.; Ferjan, Š.; van Harmelen, T.; Schwarz, A.E.; Worrell, E.; van Zelm, R.; Huijbregts, M.A.J.; Hauck, M. Greenhouse gas benefits from direct chemical recycling of mixed plastic waste. Resour. Conserv. Recycl. 2022, 186, 106582. [Google Scholar] [CrossRef]
  35. Xayachak, T.; Haque, N.; Lau, D.; Parthasarathy, R.; Pramanik, B.K. Assessing the environmental footprint of plastic pyrolysis and gasification: A life cycle inventory study. Process Saf. Environ. Prot. 2023, 173, 592–603. [Google Scholar] [CrossRef]
  36. Damgaard, A.; Riber, C.; Fruergaard, T.; Hulgaard, T.; Christensen, T.H. Life-cycle-assessment of the historical development of air pollution control and energy recovery in waste incineration. Waste Manag. 2010, 30, 1244–1250. [Google Scholar] [CrossRef]
  37. Hong, J.; Li, X.; Zhaojie, C. Life cycle assessment of four municipal solid waste management scenarios in China. Waste Manag. 2010, 30, 2362–2369. [Google Scholar] [CrossRef]
  38. Shahbazi, A.L.I.; Moeinaddini, M.; Abdoli, M.; Hosseinzadeh, M.; Jaafarzadeh Haghighi Fard, N. Application of system dynamics modeling and life cycle impact assessment method based on endpoint in examining different waste management scenarios. J. Nat. Environ. 2025, 78, 153–167. [Google Scholar] [CrossRef]
  39. McDougall, F.R.; White, P.R.; Franke, M.; Hindle, P. Integrated Solid Waste Management: A Life Cycle Inventory; John Wiley & Sons: Hoboken, NJ, USA, 2008. [Google Scholar]
  40. Haight, M. Integrated Solid Waste Management Model; Technical Report; University of Waterloo, School of Planning: Waterloo, ON, Canada, 2004. [Google Scholar]
  41. Rashid, M.I.; Shahzad, K. Food waste recycling for compost production and its economic and environmental assessment as circular economy indicators of solid waste management. J. Clean. Prod. 2021, 317, 128467. [Google Scholar] [CrossRef]
  42. Yang, Q.; Han, F.; Chen, Y.; Yang, H.; Chen, H. Greenhouse gas emissions of a biomass-based pyrolysis plant in China. Renew. Sustain. Energy Rev. 2016, 53, 1580–1590. [Google Scholar] [CrossRef]
  43. Samer, M. Pyrolysis; IntechOpen: London, UK, 2017; p. 350. [Google Scholar]
  44. Dong, J.; Tang, Y.; Nzihou, A.; Chi, Y.; Weiss-Hortala, E.; Ni, M. Life cycle assessment of pyrolysis, gasification and incineration waste-to-energy technologies: Theoretical analysis and case study of commercial plants. Sci. Total Environ. 2018, 626, 744–753. [Google Scholar] [CrossRef] [PubMed]
  45. Faisal, F.; Rasul, M.G.; Jahirul, M.I.; Schaller, D. Pyrolytic conversion of waste plastics to energy products: A review on yields, properties, and production costs. Sci Total Environ. 2023, 861, 160721. [Google Scholar] [CrossRef]
  46. Astrup, T.F.; Tonini, D.; Turconi, R.; Boldrin, A. Life cycle assessment of thermal Waste-to-Energy technologies: Review and recommendations. Waste Manag. 2015, 37, 104–115. [Google Scholar] [CrossRef] [PubMed]
  47. Arena, U. Process and technological aspects of municipal solid waste gasification. A review. Waste Manag. 2012, 32, 625–639. [Google Scholar] [CrossRef]
  48. Cherubini, F.; Bargigli, S.; Ulgiati, S. Life cycle assessment of urban waste management: Energy performances and environmental impacts. The case of Rome, Italy. Waste Manag. 2008, 28, 2552–2564. [Google Scholar] [CrossRef]
  49. Singh, R.; Prasad, V.; Vaish, B. Advances in Waste-to-Energy Technologies; CRC Press: Boca Raton, FL, USA, 2019. [Google Scholar]
  50. Milutinović, B.; Stefanović, G.; Đekić, P.S.; Mijailović, I.; Tomić, M. Environmental assessment of waste management scenarios with energy recovery using life cycle assessment and multi-criteria analysis. Energy 2017, 137, 917–926. [Google Scholar] [CrossRef]
  51. Oliveira Neto, G.C.d.; Chaves, L.E.C.; Pinto, L.F.R.; Santana, J.C.C.; Amorim, M.P.C.; Rodrigues, M.J.F. Economic, Environmental and Social Benefits of Adoption of Pyrolysis Process of Tires: A Feasible and Ecofriendly Mode to Reduce the Impacts of Scrap Tires in Brazil. Sustainability 2019, 11, 2076. [Google Scholar] [CrossRef]
  52. Fernández-González, J.M.; Grindlay, A.L.; Serrano-Bernardo, F.; Rodríguez-Rojas, M.I.; Zamorano, M. Economic and environmental review of Waste-to-Energy systems for municipal solid waste management in medium and small municipalities. Waste Manag. 2017, 67, 360–374. [Google Scholar] [CrossRef]
  53. Lin, Y.; Wang, H.; Wang, Y.; Huo, R.; Huang, Z.; Liu, M.; Wei, G.; Zhao, Z.; Li, H.; Fang, Y. Review of Biomass Chemical Looping Gasification in China. Energy Fuels 2020, 34, 7847–7862. [Google Scholar] [CrossRef]
  54. Amini, E.; Nematollahi, H.; Moradi Banestani, N. Estimation and Modeling of Biogas Production in Rural Small Landfills (Case Study: Chaharmahaal and Bakhtiari and Yazd Rural Areas). Environ. Energy Econ. Res. 2017, 1, 383–392. [Google Scholar]
  55. Breukelman, H.; Krikke, H.; Löhr, A. Failing services on urban waste management in developing countries: A review on symptoms, diagnoses, and interventions. Sustainability 2019, 11, 6977. [Google Scholar] [CrossRef]
  56. Farooq, A.; Haputta, P.; Gheewala, S.H. Economic feasibility assessment of waste to energy technologies for the development of a sustainable municipal solid waste management system in Thailand. Renew. Energy 2024, 233, 121155. [Google Scholar] [CrossRef]
  57. Tan, S.T.; Ho, W.S.; Hashim, H.; Lee, C.T.; Taib, M.R.; Ho, C.S. Energy, economic and environmental (3E) analysis of waste-to-energy (WTE) strategies for municipal solid waste (MSW) management in Malaysia. Energy Convers. Manag. 2015, 102, 111–120. [Google Scholar] [CrossRef]
  58. Khwamman, S.; Chaiyat, N. Energy, economic, and environmental analysis of a waste-to-energy-to-zero system. Clean. Chem. Eng. 2025, 11, 100142. [Google Scholar] [CrossRef]
  59. Stewart, C.E.; Zheng, J.; Botte, J.; Cotrufo, M.F. Co-generated fast pyrolysis biochar mitigates green-house gas emissions and increases carbon sequestration in temperate soils. GCB Bioenergy 2013, 5, 153–164. [Google Scholar] [CrossRef]
  60. Eriksson, M.; Strid, I.; Hansson, P.-A. Carbon footprint of food waste management options in the waste hierarchy—A Swedish case study. J. Clean. Prod. 2015, 93, 115–125. [Google Scholar] [CrossRef]
  61. Yazaki, M.; Fushimi, C. Estimation of CO2 Reduction Potential and Cost of Solid Biomass Fuel Production Process Integrated with a Waste Gasification and Direct Melting System. Energy Fuels 2020, 34, 9632–9642. [Google Scholar] [CrossRef]
  62. Kumar, A.; Samadder, S.R. Assessment of energy recovery potential and analysis of environmental impacts of waste to energy options using life cycle assessment. J. Clean. Prod. 2022, 365, 132854. [Google Scholar] [CrossRef]
  63. Terwilliger, J. The new environmental economics: Sustainability and justice. Environ. Politics 2023, 32, 561–563. [Google Scholar] [CrossRef]
  64. Dong, J.; Tang, Y.; Nzihou, A.; Chi, Y. Key factors influencing the environmental performance of pyrolysis, gasification and incineration Waste-to-Energy technologies. Energy Convers. Manag. 2019, 196, 497–512. [Google Scholar] [CrossRef]
  65. Hoornweg, D.; Bhada-Tata, P. What a waste: A global review of solid waste management. Urban Dev. Ser. Knowl. Pap. 2012, 1, 68135. [Google Scholar]
  66. Palafox-Alcantar, P.G.; Hunt, D.V.L.; Rogers, C.D.F. The complementary use of game theory for the circular economy: A review of waste management decision-making methods in civil engineering. Waste Manag. 2020, 102, 598–612. [Google Scholar] [CrossRef] [PubMed]
  67. Hsu, H.-W.; Binyet, E.; Nugroho, R.A.A.; Wang, W.-C.; Srinophakun, P.; Chein, R.-Y.; Demafelis, R.; Chiarasumran, N.; Saputro, H.; Alhikami, A.F.; et al. Toward sustainability of Waste-to-Energy: An overview. Energy Convers. Manag. 2024, 321, 119063. [Google Scholar] [CrossRef]
  68. Chong, Y.T.; Teo, K.M.; Tang, L.C. A lifecycle-based sustainability indicator framework for waste-to-energy systems and a proposed metric of sustainability. Renew. Sustain. Energy Rev. 2016, 56, 797–809. [Google Scholar] [CrossRef]
  69. Stehlík, P. Contribution to advances in waste-to-energy technologies. J. Clean. Prod. 2009, 17, 919–931. [Google Scholar] [CrossRef]
  70. Luo, Y.; Ye, M.; Zhou, Y.; Su, R.; Huang, S.; Wang, H.; Dai, X. Assessing the Environmental Impact of Municipal Waste on Energy Incineration Technology for Power Generation Using Life Cycle Assessment Methodology. Toxics 2024, 12, 786. [Google Scholar] [CrossRef]
  71. Kasiński, S.; Dębowski, M. Municipal Solid Waste as a Renewable Energy Source: Advances in Thermochemical Conversion Technologies and Environmental Impacts. Energies 2024, 17, 4704. [Google Scholar] [CrossRef]
  72. Kędzia, G.; Ocicka, B.; Pluta-Zaremba, A.; Raźniewska, M.; Turek, J.; Wieteska-Rosiak, B. Social Innovations for Improving Compostable Packaging Waste Management in CE: A Multi-Solution Perspective. Energies 2022, 15, 9119. [Google Scholar] [CrossRef]
  73. Kasiński, S.; Dębowski, M.; Olkowska, M.; Rudnicki, M. Analysis of the Long-Term Mass Balance and Efficiency of Waste Recovery in a Municipal Waste Biodrying Plant. Energies 2021, 14, 7711. [Google Scholar] [CrossRef]
  74. Malinauskaite, J.; Jouhara, H.; Spencer, N. Waste prevention and technologies in the context of the EU Waste Framework Directive: Lost in translation? Eur. Energy Environ. Law Rev. 2017, 26, 66–80. [Google Scholar]
  75. Zorpas, A.A. Strategy development in the framework of waste management. Sci. Total Environ. 2020, 716, 137088. [Google Scholar] [CrossRef] [PubMed]
  76. Tahiru, A.-W.; Cobbina, S.J.; Asare, W. Public perceptions of waste-to-energy technology in developing countries: A case study of tamale, Ghana. Clean. Waste Syst. 2024, 9, 100192. [Google Scholar] [CrossRef]
Figure 1. Conceptual model of waste flows in different scenarios.
Energies 18 02346 g001
Figure 2. Cumulative change in net electricity output (A) and consumption, production, and net electricity output (B) in different scenarios (GWh).
Energies 18 02346 g002
Figure 3. Cumulative change in net economic profit (A) and revenue, cost, and net economic profit (B) in different scenarios (million USD).
Energies 18 02346 g003
Figure 4. Cumulative change in net GHG emissions (A) and GHG emissions and avoided and net GHG emissions (B) in different scenarios (million tons).
Energies 18 02346 g004
Figure 5. Cumulative change in net environmental outcomes (A) and environmental cost, income, and outcomes (B) in different scenarios (million USD).
Energies 18 02346 g005
Figure 6. Cumulative change in sustainability index (A) and net environmental outcomes, net economic profit, and sustainability index (B) in different scenarios (million USD).
Energies 18 02346 g006
Table 1. Projected waste generation and waste-to-landfill in different scenarios (tons).
20252050Cumulative Amount from 2025 to 2050Percent
Total Waste 720,337726,19818,720,336100
Organic waste509,926514,07613,252,12671
Dry waste210,410212,1235,468,20929
Waste-to-landfill: LFG166,670165,9194,255,93878% dry waste
Waste-to-landfill: Py39,67039,3841,011,71919% dry waste
Waste-to-landfill: GSF67,81867,4271,730,74632% dry waste
Waste-to-landfill: INC37,53637,257957,19018% dry waste
Waste-to-landfill: BAU166,670165,9194,255,93878% dry waste
Table 2. Waste composition prediction over the simulation period (tons).
Year2020202520302035204020452050Percentage (%)
Organic Materials494,705509,926521,645538,271536,427532,493527,18670.8
Paper46,68248,11949,22450,79350,61950,24849,7476.7
Plastic84,83987,44989,45992,31091,99491,31990,40912.1
Metals73387564773779847957789878201.1
Textiles14,60615,05515,40115,89215,83715,72115,5652.1
Wood22362305235824332425240723830.3
Others48,42949,91951,06752,69452,51452,12951,6096.9
Disclaimer/Publisher’s Note: The statements, opinions and data contained in all publications are solely those of the individual author(s) and contributor(s) and not of MDPI and/or the editor(s). MDPI and/or the editor(s) disclaim responsibility for any injury to people or property resulting from any ideas, methods, instructions or products referred to in the content.

