1. Introduction
The global built environment is a critical frontier in the fight against climate change, responsible for approximately 40% of global CO
2 emissions [
1]. As nations strive to meet the Paris Agreement’s targets, limiting warming to 1.5 °C above pre-industrial levels, the decarbonisation of buildings has emerged as a priority [
2]. This urgency is compounded by the long lifespan of buildings, often exceeding 100 years, which necessitates designs resilient to evolving climatic conditions [
3]. Rising temperatures, shifting precipitation patterns, and extreme weather events are already altering the energy demands of buildings, with cooling needs projected to surge while heating requirements decline in many regions [
4]. These trends challenge conventional construction practices, which often rely on historical climate data, and underscore the need for forward-looking strategies that integrate climate adaptation into building design and retrofitting [
5].
Portugal is a compelling case study with its diverse climatic zones and vulnerability to Mediterranean climate extremes [
6]. The country’s building stock faces unique challenges: coastal regions contend with humidity and heat waves, while inland areas experience colder winters and temperature volatility [
7]. Furthermore, residential buildings, constituting 87% of Portugal’s housing stock, are susceptible to climatic shifts due to their reliance on passive thermal performance and occupant behaviour [
8]. Recent analyses by the Portuguese National Energy and Geology Laboratory (LNEG) suggest that current energy certification standards, based on historical climate files, may inadequately address future energy demands [
9]. This misalignment risks locking buildings into inefficient designs, undermining Portugal’s carbon neutrality goals by 2050 [
10].
1.1. Climate Files and Downscaling Methodologies
Accurate climate projections are foundational to energy-efficient building design. Global climate models (GCM), such as those developed by the Intergovernmental Panel on Climate Change (IPCC), provide broad-scale projections but lack the resolution for localised building simulations [
11]. Downscaling techniques bridge this gap, with dynamic and statistical methods dominating the field. Dynamic downscaling, employing regional climate models (RCM) like EURO-CORDEX, offers high spatial resolution but demands significant computational resources [
12]. In contrast, statistical methods, such as the morphing approach proposed by Belcher et al. [
13], adjust historical weather data using GCM-derived trends, balancing simplicity and practicality. Tools like CCWorldWeatherGen and WeatherShift™ have gained traction for generating future weather files (e.g., EPW format) compatible with energy simulation software [
14].
Recent studies highlight the limitations of static climate files, such as typical meteorological year (TMY) data, which fail to capture extreme weather events or long-term trends [
15]. For instance, Moazami et al. [
16] demonstrated that TMY-based simulations underestimate cooling demands in warmer futures by up to 30%. In Portugal, discrepancies between LNEG’s regulatory climate files, adjusted using RCP4.5 temperature trends and higher-resolution projections, further complicate energy assessments [
17]. These gaps emphasise the need for multi-scenario analyses that compare historical, regulatory, and dynamically adjusted climate data.
1.2. Building Energy Performance Under Climate Change
Dynamic energy simulations enable detailed assessments of building performance under varying climatic conditions [
18]. Such analyses often reveal stark regional disparities. Studies predict a 20–50% rise in cooling energy use by 2050 in temperate climates, offset partially by reduced heating needs [
19,
20,
21]. However, energy demand may increase disproportionately in Mediterranean regions like southern Portugal, where cooling already dominates [
22].
Building characteristics significantly influence climate resilience. Insulation thickness, window-to-wall ratios, glazing properties, and shading systems are critical variables [
23]. For example, Tootkaboni et al. [
24] found that optimised window orientations reduced cooling loads by 15% in Italian residences under future climates. Similarly, Dias et al. [
25] demonstrated that retrofitting insulation in Portuguese homes could mitigate heating demand declines by enhancing thermal inertia. Nevertheless, such measures must balance energy savings with occupant comfort, particularly when humidity and heat waves exacerbate indoor thermal stress [
26].
1.3. Research Gaps and Objectives
While existing studies provide valuable insights, critical gaps remain. First, few analyses focus on Portugal’s climatic diversity, particularly the contrast between coastal and interior regions. Second, the efficacy of LNEG’s climate files, the basis for national energy certifications, has not been systematically compared against alternative future projections. Third, occupant behaviour, reshaped by trends like post-pandemic teleworking, is rarely integrated into long-term energy models [
27].
This study addresses these gaps by evaluating the energy performance of residential buildings across five Portuguese regions, Bragança, Porto, Lisbon, Évora, and Faro, under three climate scenarios: present-day (TMY2021-EPW), regulatory (LNEG-EPW), and mid-century (CCW-EPW). Using dynamic energy simulations in EnergyPlus, the research quantifies shifts in heating and cooling demands, assesses the reliability of regulatory climate files, and explores adaptive measures such as enhanced insulation and glazing. The findings aim to inform Portugal’s building policies, ensuring alignment with climate resilience and carbon neutrality objectives. The results can be extrapolated to many South European regions with similar geographic and climatological conditions.
2. Methodology
This study employs a multi-stage methodology to evaluate the impact of climate change on residential building energy performance across Portugal’s climatic regions. The framework integrates dynamic energy simulations, comparative climate file analyses, and parametric sensitivity testing.
2.1. Dynamic Energy Simulation
EnergyPlus v23.1 was employed for hourly simulations under the three climate scenarios. The primary objective is to analyse the impact of climate change on energy demand, carbon emissions, and thermal comfort in residential buildings under various future climatic scenarios. To conduct this analysis, three different climatic datasets were used for each location:
Present Climate (TMY2021-EPW): Derived from the Typical Meteorological Year 2021 dataset, synthesising observed weather data (2007–2021) for Bragança, Porto, Lisbon, Évora, and Faro. These files, sourced from Climate.OneBuilding.Org, reflect recent climatic trends and extreme events.
Regulatory Climate (LNEG-EPW): Files provided by Portugal’s National Energy and Geology Laboratory (LNEG), adjusted using RCP4.5 temperature projections for 2050. Humidity and solar radiation data remain unmodified from historical averages (1971–2000).
Future Climate (CCW-EPW): Generated via the CCWorldWeatherGen tool, applying the morphing method to HadCM3 GCM outputs under the IPCC SRES A2 scenario. Historical IWEC/INETI-EPW files (1982–1999) served as baseline inputs. Monthly shifting and stretching algorithms adjusted temperature, humidity, and solar radiation to mid-century projections (2041–2070).
This multi-file approach allows for direct comparison between current and future climates and between regulatory assumptions and more realistic future projections.
The simulation outputs include three key indicators: annual energy demand, CO2 emissions, and thermal comfort levels. These are derived from input datasets that define the building’s geometry, construction materials, mechanical systems, occupancy schedules, and local climate. Inputs are categorised into three main groups: climate data, passive building components, and active systems.
The passive components include the building envelope, walls, roofs, windows, and shading systems, modelled to represent typical Portuguese residential construction.
The active components refer to energy-consuming devices, such as HVAC equipment, lighting, and household appliances. These systems were defined using standardised technical specifications and operation schedules, maintaining consistency across all case studies to ensure comparable results.
Two occupancy profiles were incorporated into the model to account for the influence of user behaviour on energy performance. The first represents a conventional pre-pandemic scenario, with primary occupancy levels during evenings and weekends. The second reflects a post-pandemic teleworking scenario, where occupants spend more time at home throughout the day due to the rise in remote work. These profiles affect occupancy-related heat gains and the operational intensity of lighting, appliances, and HVAC systems.
Although public health restrictions have eased, remote work remains prevalent in Portugal. For this reason, including both behavioural scenarios provides a more comprehensive understanding of how changes in daily routines interact with climatic conditions to impact building energy performance.
This methodology enables meaningful comparisons between present and projected future conditions, offering valuable insights for improving regulatory frameworks, guiding retrofitting strategies, and designing future-ready buildings.
The building used in the simulations is a simplified simulation cell representative of Portuguese residential construction. The geometry is symmetrical and quadrangular, minimising orientation bias. It includes a usable floor area of 106.1 m2 and a ceiling height of 2.7 m. The construction details were adjusted to comply with national residential building norms for each selected location.
To incorporate thermal inertia without modelling internal partitions, an internal thermal mass, consisting of 145 m2 of hollow brick walls finished with traditional plaster, was included. This element enables realistic heat storage and release, increasing the model’s sensitivity to temperature variation and improving the simulation of indoor thermal comfort.
Five Portuguese cities (Bragança, Évora, Faro, Lisbon, and Porto), representing distinct climatic zones and three climate files: current (TMY2021-EPW), regulatory (LNEG-EPW), and projected future (CCW-EPW), were used for each city, resulting in 15 different simulation conditions. This setup ensures regional diversity and enables detailed analysis of climate change impacts on building energy performance.
Each selected city brings unique climatic characteristics to the study. Bragança represents the cold interior, with sub-zero winter temperatures and occasional snowfall. Évora typifies a dry Mediterranean climate, with high summer temperatures and low humidity. Faro, in the Algarve region, features high solar exposure and warm temperatures year-round, combined with recent population growth. Lisbon, Portugal’s capital, has moderate temperatures and abundant sunlight, making it a key urban reference. Porto, located in the cooler, wetter north, is the second-largest metropolitan area, offering insights into coastal and humid conditions. Together, these cities capture mainland Portugal’s geographic and climatic diversity, enabling robust and regionally sensitive analysis of future building performance.
2.2. Comparative Climate File Analyses
To assess the impact of climate change on building energy performance, future climate files were generated using the morphing method, a widely used statistical approach for building simulations. Morphing modifies historical weather data by applying monthly climate deltas from global climate models (GCM), enabling the creation of future weather files that reflect projected climatic conditions with minimal computational effort.
This study used the CCWorldWeatherGen tool to generate future EPW (EnergyPlus Weather) files. This tool applies morphing based on the HadCM3 GCM and the A2 emissions scenario from the IPCC’s Third Assessment Report (AR3). Although the A2 scenario and HadCM3 model are dated, they remain common in building energy research due to their robustness and conservative projections. The A2 scenario assumes high population growth, regionalised development, and high emissions, making it suitable for testing building resilience under severe conditions.
The HadCM3 model is an atmosphere-ocean coupled GCM with a horizontal resolution of 2.5° latitude by 3.75° longitude, producing a global grid of 96 × 73 cells. This corresponds to a surface resolution of approximately 417 km × 278 km at the Equator, and about 295 km × 278 km at mid-latitudes. In the context of Portugal, the model divides the territory into three broad climatic regions, North, Centre, and South, allowing for regional differentiation in projected climate impacts.
The morphing method requires a base EPW file aligned with the GCM’s reference period to generate future weather files. Since HadCM3 uses 1961–1990 as its baseline, IWEC/INETI-EPW files were selected, as they cover 1951–1980 and 1982–1999, offering the closest match available for Portugal. Although not perfectly aligned, this approximation is acceptable given the lack of more accurate historical datasets.
The period from 2041 to 2070 has been chosen to assess the impacts of climate change on building performance. This mid-century horizon is widely adopted in building energy research due to its balanced approach, offering temporally relevant and reasonably reliable projections. Longer-term scenarios, although insightful, are subject to significantly higher uncertainty arising from climate variability and the increasing divergence of GCM projections over time [
28]. By focusing on this timeframe, the study ensures a robust, scientifically grounded and policy-relevant analysis.
Once the projection range, the base files, and the HadCM3 deltas were defined, CCWorldWeatherGen was applied to the morphing process. The resulting future climate files, CCW-EPW, were then used in the dynamic energy simulations conducted in this study to compare current and future climate conditions in Portugal.
2.3. Building Model Definition
The building envelope was modelled based on reference U-values and thermal bridge coefficients defined in the Manual SCE [
29] (see
Table 1). Portugal is divided into three winter zones, classified as I1, I2, and I3 (ranging from mild to harsh winters). Bragança was classified in winter zone I3, while the other cities fell into zone I1. Construction solutions were identical in design across all zones, with only the insulation thickness adjusted to meet regulatory requirements for each winter zone. External insulation was applied to minimise thermal bridging.
Double-glazed windows with aluminium frames were assumed, with U-values of 2.8 W/m2·°C (I1) and 2.2 W/m2·°C (I3) and a solar heat gain coefficient (SHGC) of 0.75. The window-to-wall ratio (WWR) was set at 19%, complying with the 20% limit defined in national regulation. Shading was modelled with light-coloured internal curtains activated automatically when indoor air temperature exceeded 24.5 °C, based on a temperature-dependent control logic. No external shading was considered to avoid undesired externalities.
The two occupancy profiles, pre- and post-pandemic, were incorporated to reflect varying occupant behaviour. Both profiles assume a household of three people and an occupancy density of 0.0283 persons/m2.
In the conventional profile, weekday occupancy is full (100%) during nighttime hours between 00:00 and 06:00. Starting at 06:00, presence gradually decreases, with a significant drop between 09:00 and 17:00, reaching values between 30% and 60%, to reflect the absence of occupants during typical working hours. Occupancy rises again after 18:00 and returns to 100% by 20:00. During weekends and holidays, occupancy remains consistently high, at or near 100%, for all 24 h.
In contrast, the post-pandemic profile assumes that occupants are present more consistently throughout the day. On weekdays, occupancy remains above 70% continuously from 08:00 to 18:00, in addition to full presence during the night and early morning hours (00:00–07:00 and 20:00–24:00). As with the conventional scenario, weekends and holidays maintain nearly full occupancy for the entire day.
These schedules were critical for defining internal heat gains and driving the operation of the HVAC systems in the simulation. The timing and intensity of occupancy directly influenced the system’s activation patterns, shaping the overall energy performance and thermal comfort outcomes modelled for each scenario.
The HVAC system was modelled as a unitary electric heat pump that meets heating, cooling, and domestic hot water requirements. To isolate climatic and technology effects, a fixed COP of 1.0 was used across all scenarios, meaning that the calculated energy consumption directly corresponds to energy needs, making the result independent of the technology used. The system is operated based on occupancy schedules: fully active during presence, in setback mode during partial occupancy, and off when unoccupied. It activates one hour before re-occupancy to ensure indoor comfort readiness.
Mechanical ventilation was included based on occupancy-driven control. It operates only during occupancy periods to maintain indoor air quality while minimising unnecessary energy use.
Finally, the building was assumed to benefit from prevailing winds, allowing for natural ventilation during occupancy. This passive approach reduced the need for mechanical ventilation, especially in mild weather conditions. Both ventilation systems were turned off during vacancy to preserve thermal stability and reduce energy demand.
2.4. Thermal Comfort Considerations in a Climate Change Context
This study evaluated thermal comfort according to ASHRAE Standard 55-2017 [
29]. The standard outlines acceptable combinations of indoor environmental and personal factors to ensure thermal satisfaction for most occupants. It defines thermal comfort as a state of mind that expresses satisfaction with the thermal environment and is globally referenced alongside ISO 7730 [
30]. European residential HVAC systems are typically not designed to handle high humidity, which is uncommon in most areas. Human thermal comfort is considered unattainable when absolute humidity exceeds 12 g of H
2O per kilogram of dry air, regardless of temperature. Consequently, this parameter is particularly significant in the context of climate change.
The hours are classified as discomfort when outdoor air conditions exceed this limit. This classification occurs because thermal comfort cannot be achieved due to the elevated levels of latent moisture in the air, regardless of temperature compliance. This approach improves the accuracy of assessing discomfort hours in dynamic energy systems. European residential HVAC systems are usually not specified to respond to high humidity levels, as they are uncommon. Human thermal comfort is considered unattainable if absolute humidity exceeds 12 g H2O/kg dry air, regardless of temperature; this is an important parameter to check in a climate change context. Values above this limit in outdoor air conditions are flagged as discomfort hours, as thermal comfort cannot be achieved due to high latent moisture levels in the air, regardless of temperature compliance.
This approach enhances the accuracy of discomfort hour assessment in dynamic energy simulations and supports a more precise evaluation of how future climatic conditions may affect indoor environmental quality.
3. Results
3.1. Climatic Variations and Model Validation
Understanding how climate parameters evolve, particularly temperature and humidity, is essential for assessing their impact on building energy performance and occupant comfort. This section analyses variations in dry bulb temperature and relative humidity across five Portuguese cities using three climate datasets: TMY2021-EPW (historical baseline), CCW-EPW (morphed future projection), and LNEG-EPW (regulatory standard). The goal is to evaluate the consistency of these datasets in representing mid-century climate conditions (circa 2050) and validate them against recent international climate projections.
The analysis of monthly dry bulb temperature trends reveals a non-uniform seasonal impact. Summer months (June to September) display the most significant temperature increases in the CCW-EPW file compared to TMY2021. For example, Porto shows relatively stable winter temperatures across all datasets but exhibits a marked summer increase under future scenarios. Annual averages confirm this disparity: Porto records the smallest increase (+1.1 °C), while Faro shows the most significant rise (+2.5 °C), reflecting its southern coastal exposure.
By contrast, the LNEG-EPW file reveals anomalies, particularly in Lisbon and Faro, where projected monthly temperatures are often lower than the present-day baseline. The annual temperature averages for these cities are −0.5 °C and −0.3 °C below TMY2021 values, respectively. These discrepancies raise concerns about the validity and updating cycle of the LNEG datasets, particularly in regions where the effects of climate change are expected to be more pronounced.
Relative humidity trends also diverge significantly. When comparing CCW-EPW with TMY2021, most locations exhibit a decline in humidity, except Porto, which sees a moderate +2.4% increase in the annual average. The most pronounced decrease occurs in Évora (−6.2%), while Bragança experiences a minimal change (−0.1%). In contrast, the LNEG-EPW file consistently indicates increases in relative humidity across nearly all locations and months, with annual averages rising from +2.6% in Faro to +9.0% in Bragança. This trend contradicts broader European projections of decreasing humidity due to rising temperatures and lower precipitation.
Their annual temperature and relative humidity values were compared against the CMIP6 projections for the year 2050 under the SSP3-7.0 scenario to validate the datasets. This validation employed the 10th (P10) and 90th (P90) percentiles from the CMIP6 range as acceptability thresholds. Values falling within this percentile interval were considered valid.
Table 2 outlines the results of this comparison. The CCW-EPW datasets demonstrated a notably stronger alignment with CMIP6 projections, while the LNEG-EPW datasets displayed significant deviations, particularly for Faro and Lisbon in both temperature and humidity parameters. These discrepancies are likely due to outdated baseline periods used in the global climate models or insufficient spatial resolution and downscaling within regulatory datasets.
Despite this, LNEG’s humidity projections in Lisbon and Faro coincidentally align with CMIP6 projections. However, their temperature values consistently fall below the 10th percentile, suggesting a systematic underestimation of future warming. This highlights the limitations of static regulatory climate files for long-term resilience planning.
This analysis demonstrates that morphed datasets like CCW-EPW offer a more credible representation of future climatic conditions, essential for reliable building performance simulations. Continued reliance on unvalidated regulatory files like LNEG-EPW may misrepresent future thermal loads, leading to suboptimal design decisions and regulatory inadequacies, especially in southern regions where climate change impacts are most severe. Rigorous data validation ensures that simulation outputs support effective energy policy, building code reform, and climate-resilient infrastructure development.
3.2. Heating and Cooling Energy Demand Under Climate Change Scenarios
This section explores how projected climate change affects energy demand in residential buildings. Using dynamic energy simulation, results were obtained for five Portuguese cities under three climate datasets: TMY2021-EPW (baseline), LNEG-EPW (regulatory), and CCW-EPW (morphed future scenario). The analysis focuses on heating and cooling loads, total energy use, seasonal variation, and the impact of different occupancy profiles.
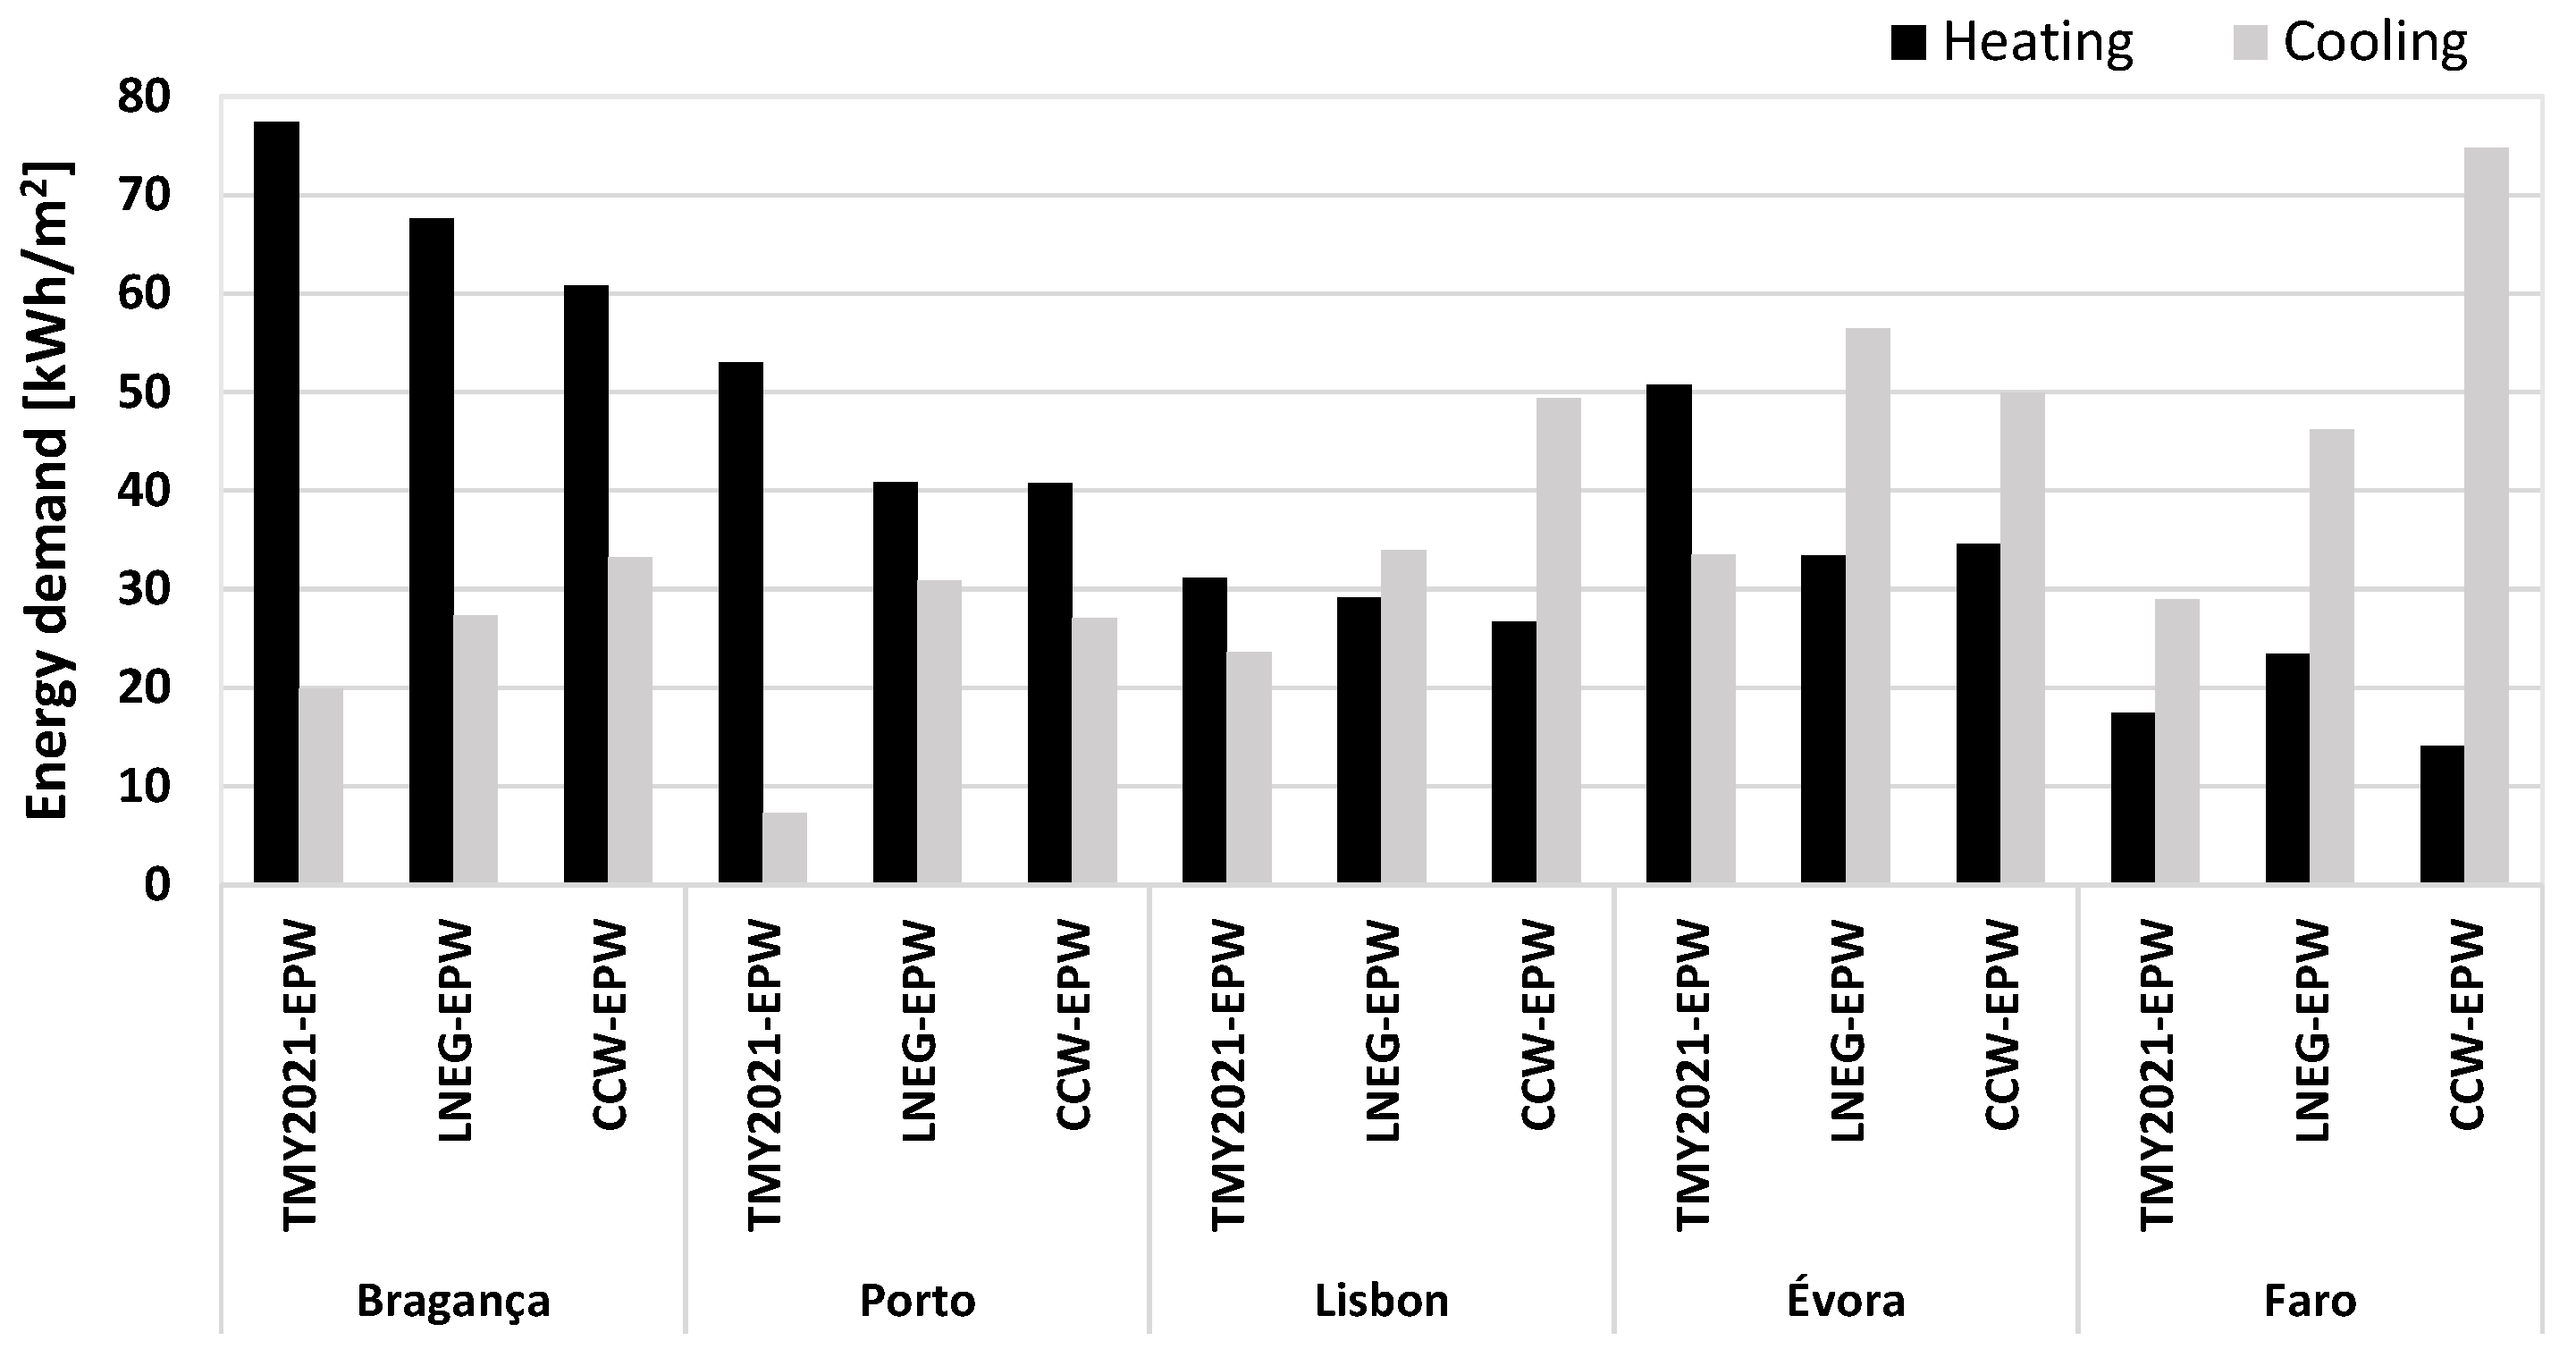
Figure 1 presents the annual energy demand per unit area associated with space conditioning across all studied locations. The figure compares the values obtained using the present-day climate file (TMY2021-EPW) with those derived from the two future-oriented datasets: LNEG-EPW, which represents the current regulatory standard, and CCW-EPW, generated via the morphing method. The comparison highlights both absolute and relative changes, enabling an assessment of how projected climate conditions may affect building energy performance at the regional level.
In general, both LNEG-EPW and CCW-EPW scenarios project a significant increase in cooling energy demand and a corresponding decrease in heating requirements compared to the present climate. This trend is consistent across most locations, aligning with expectations under warming scenarios. However, an exception arises in Faro under the LNEG-EPW scenario, where an unexpected increase is observed in both heating and cooling demands. This result deviates from expected climatic behaviour and suggests potential inconsistencies in the LNEG dataset for southern coastal regions.
A more detailed analysis of the CCW-EPW results, as presented in
Table 3, reveals that Porto experiences the most significant relative increase in cooling demand, reaching +269.5%. Regarding absolute values, Faro shows the most pronounced increase, with a rise of +45.84 kWh/m
2 annually. While substantial, this increase may be overestimated, as previous sections indicate that the projected temperatures for Faro in the CCW-EPW file exceed those predicted by current climate models. On the lower end of the spectrum, Évora records the smallest relative increase in cooling energy at +48.8%, while Bragança exhibits the lowest absolute increase at +13.40 kWh/m
2.
Concerning heating energy demand, Évora displays the most significant relative reduction, amounting to −31.9%, whereas Bragança again leads in absolute terms, showing a decrease of −16.55 kWh/m2. Conversely, Lisbon and Faro register only modest reductions of −14.2% and −3.35 kWh/m2, respectively. These values reflect the relatively warmer winter conditions projected for these southern cities, which inherently reduce the energy needed for indoor heating.
Overall, the results confirm the anticipated trend of shifting energy profiles in residential buildings under climate change: a move away from heating-dominated consumption toward an increased reliance on cooling systems. This has profound implications for building design, energy efficiency measures, and HVAC system sizing, particularly in southern regions of Portugal, where cooling demand is expected to rise most sharply.
3.2.1. Comparison of Climate Files and Total Energy Impacts
A comparative analysis of the two future-oriented climate datasets, CCW-EPW and LNEG-EPW, reveals substantial discrepancies in energy demand results, primarily due to differences in underlying climatic parameters. These inconsistencies can lead to significant design miscalculations if the regulatory LNEG-EPW files are used without critical evaluation.
Table 4 presents the relative differences in heating and cooling energy demand between the CCW-EPW and LNEG-EPW datasets for each studied location. The most critical case is observed in Faro, where the CCW-EPW file estimates cooling consumption to be 61.6% higher and heating to be 39.9% lower than values derived from the LNEG file. Although the CCW-EPW scenario for Faro contains known uncertainties, such as potentially overstated future temperatures, the magnitude of these discrepancies raises concerns about the representativeness of the LNEG files for southern coastal regions.
Significant differences are also evident in Bragança and Lisbon, with the most pronounced variations again related to cooling energy. In Lisbon, the discrepancy reaches approximately 13 kWh/m2 per year for space conditioning alone. In contrast, the results for Porto and Évora are notably more consistent across both datasets, especially for heating. However, even in Porto, the absolute difference in combined heating and cooling energy demand amounts to nearly 4 kWh/m2 per year.
Moving beyond heating and cooling,
Figure 2 presents the total annual energy demand variation across all climate files and locations. In Bragança, total energy use will decrease under both future climate scenarios. This decline is due to the dominant heating load, whose absolute reduction surpasses the increased cooling demand. Bragança is the only location where total energy use falls. Évora shows a minimal increase of 0.8% with the CCW-EPW file, compared to a 3.7% rise with LNEG-EPW.
Faro is projected to experience the largest increases in total energy demand in both scenarios, which is consistent with its substantial cooling requirements. Porto and Évora demonstrate more significant total energy variations when simulated with the LNEG-EPW file, although the differences are less pronounced than those observed in Faro or Lisbon.
Table 5 synthesises the absolute and relative variations in heating, cooling, and total energy demand across all climate scenarios. Negative values indicate reductions in energy use; positive values indicate increases. For instance, the total consumption in Faro increases by 35.9% under CCW-EPW, compared to 18.3% under LNEG-EPW. Conversely, Bragança shows a slight decline in total energy use under both files, highlighting the cooling-heating trade-off in northern regions.
These findings underscore that although both CCW-EPW and LNEG-EPW anticipate rising cooling needs and decreasing heating loads, the magnitude and direction of these shifts vary considerably. While the LNEG-EPW partially reflects the effects of climate change, it under-represents key regional dynamics, particularly in warmer climates. For example, in Faro, LNEG-EPW projects an increase in heating demand due to unrealistically low winter temperatures compared to current baselines, which contradicts established warming trends.
As a result, reliance on regulatory files like LNEG-EPW may lead to misrepresentation of future energy loads, under- or over-dimensioning of HVAC systems, and inappropriate selection of passive solutions. Given that performance under future climate conditions will dictate energy efficiency and comfort, the accuracy of climate input data becomes central to the reliability of simulation outcomes. Design strategies, such as insulation levels, shading systems, or glazing specifications, must be tailored using validated, future-proof climatic projections.
3.2.2. Monthly and Sectoral Energy Demand Trends
A complementary analysis of the annual energy projections involves examining the monthly variation in energy demand throughout the year. This approach highlights how climate change affects the seasonal distribution of energy loads across different regions.
Figure 3 presents the monthly variations in space conditioning and total energy use, comparing the baseline TMY2021-EPW dataset with the projected CCW-EPW climate file.
As expected, future scenarios indicate a reduction in energy use during the colder months, while cooling loads rise considerably in the warmer months. This seasonal inversion reflects the broader climatic shift towards hotter summers and milder winters. Despite the overall increase in cooling demand, Bragança and Porto continue to exhibit peak energy use during the winter, where heating remains the dominant load. In contrast, Lisbon, Évora, and Faro show a shift in peak demand to the summer months, primarily due to the heightened need for cooling.
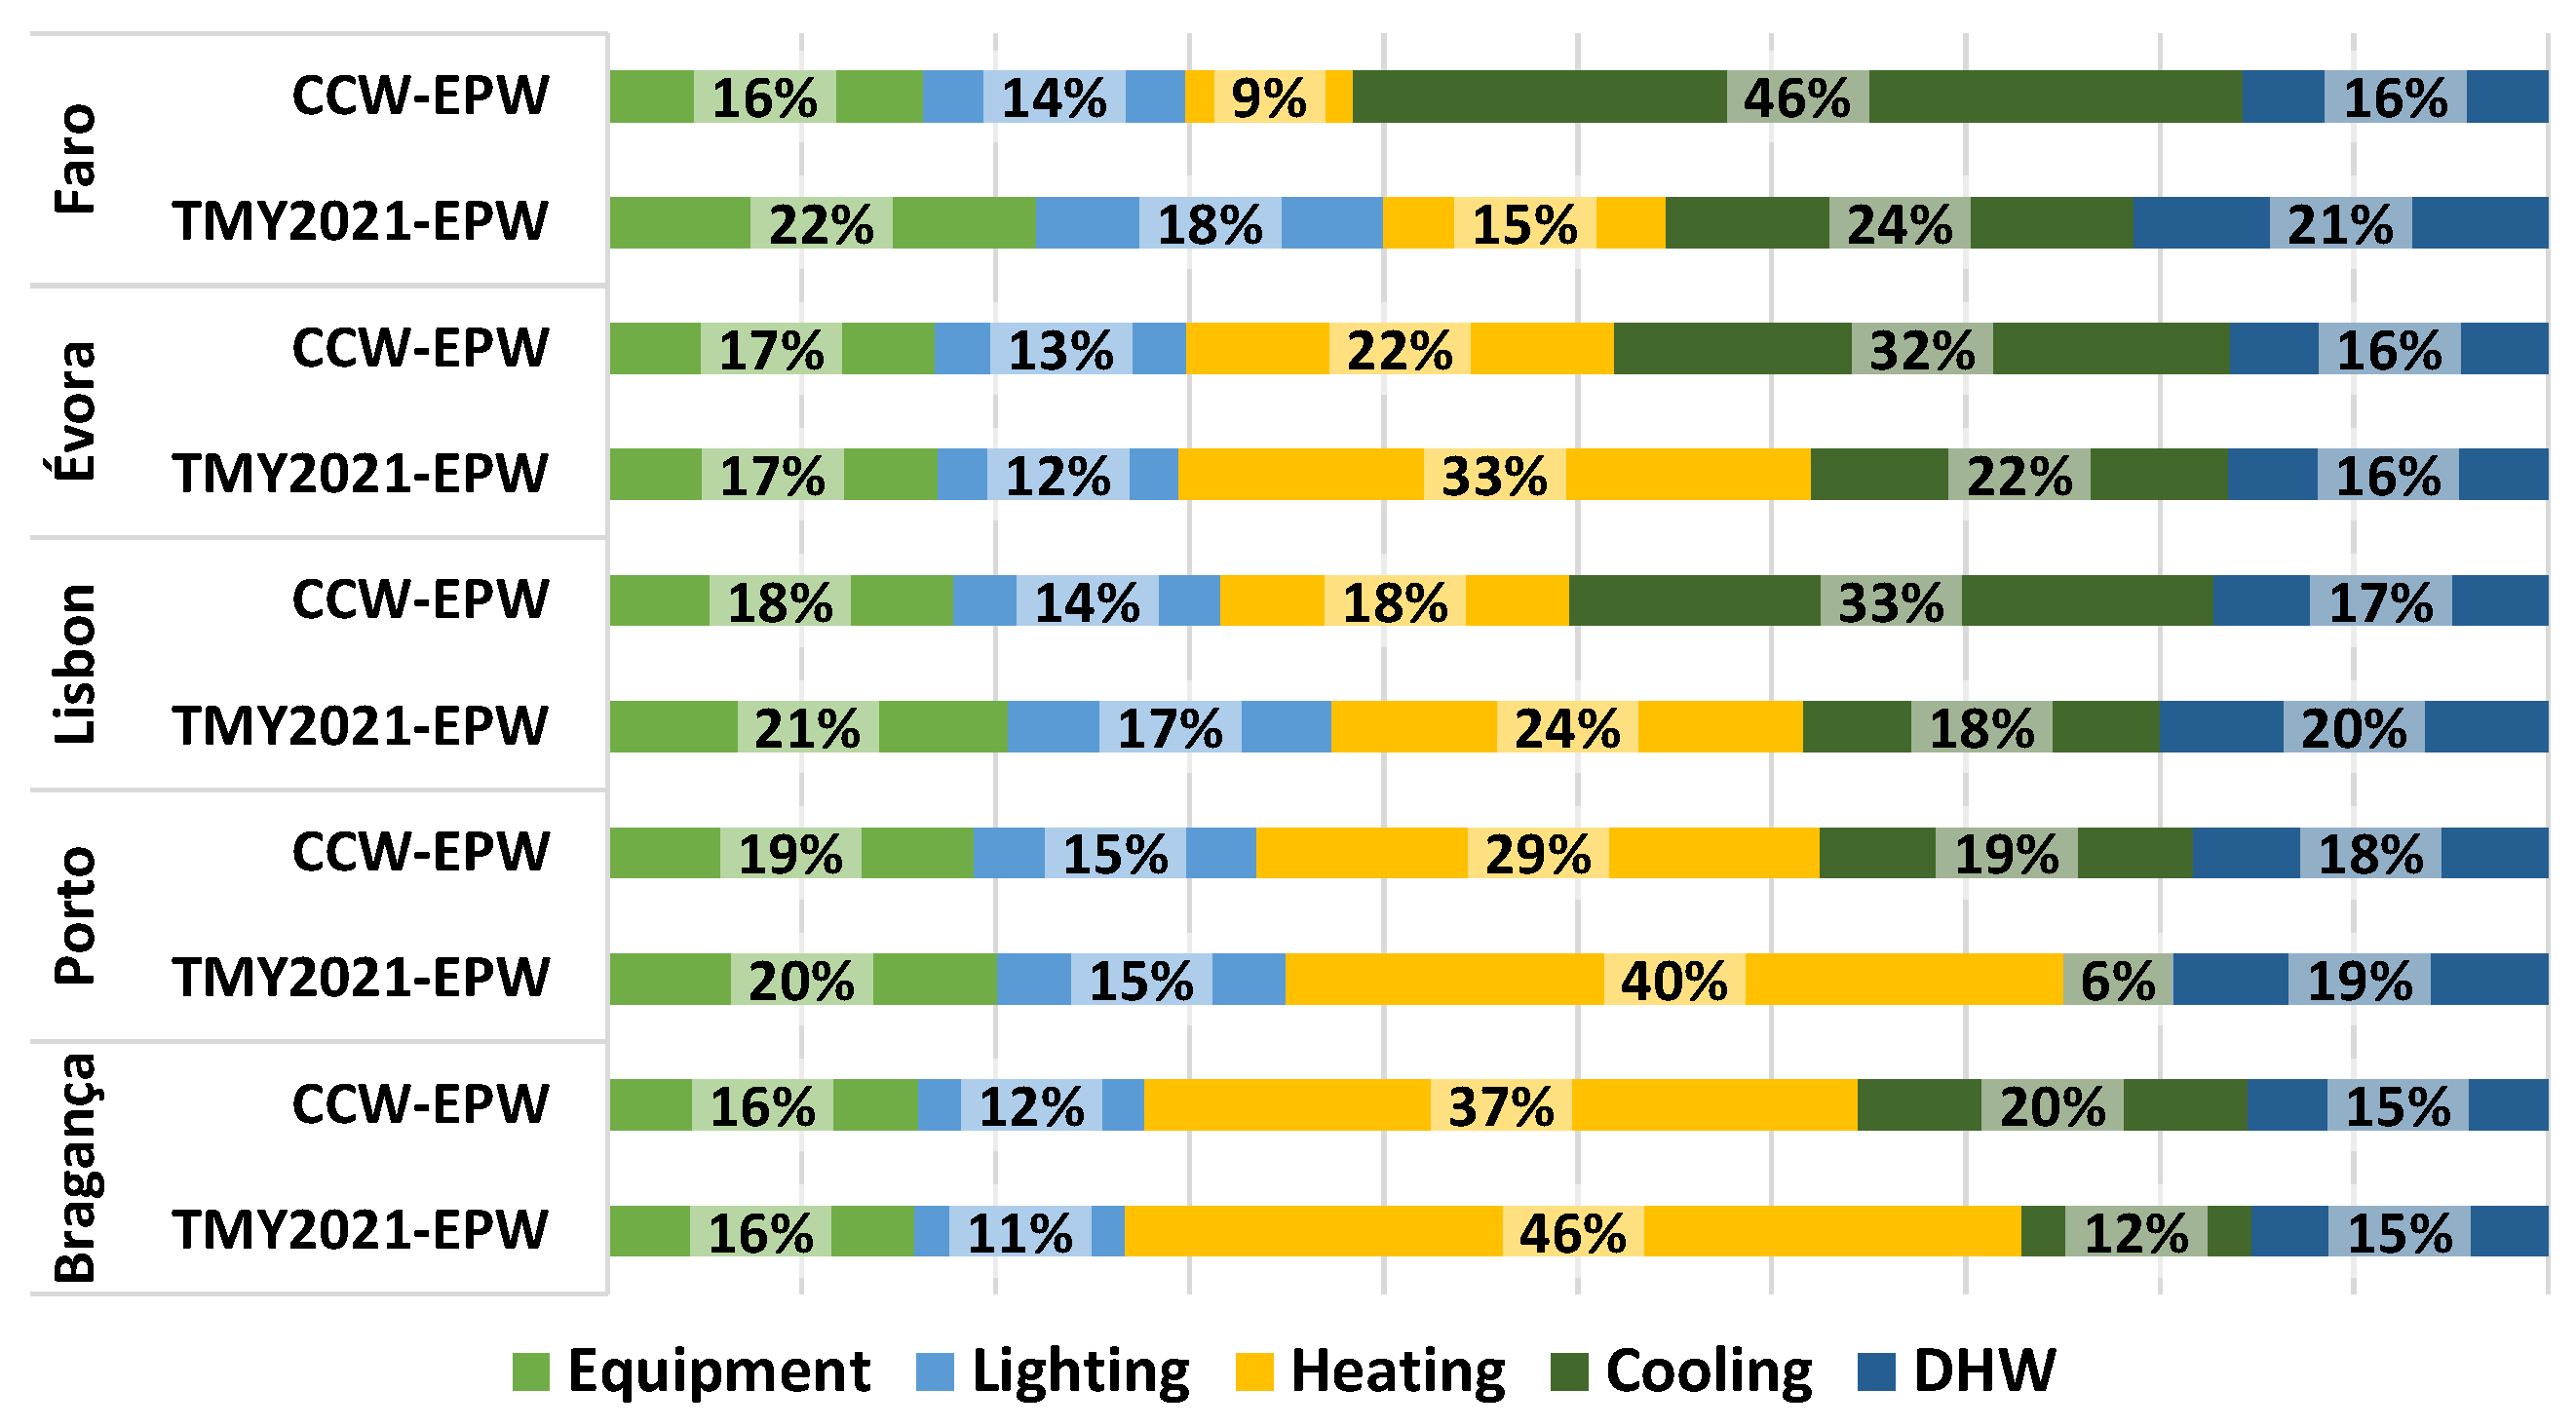
Beyond seasonal changes, it is also essential to evaluate the distribution of energy demand across different functional categories. Total building energy use can be divided into five end-use groups: equipment, lighting, heating, cooling, and domestic hot water (DHW). The relative importance of each category is influenced by regional climate conditions and shifts under projected scenarios, as shown in
Figure 4.
The equipment and DHW consumption share remain relatively stable or declines slightly across most regions. Lighting energy use shows more regional variability; for instance, its share decreases in Lisbon but increases in Bragança, though overall trends favour a general reduction in lighting’s proportional contribution. Consistent with previous findings, heating demand declines significantly under future conditions, while cooling emerges as a dominant energy end-use, particularly in southern cities.
An important insight from this breakdown is the increasing weight of climate control (heating and cooling) in total energy demand for most locations. Notably, Bragança and Évora are exceptions: in Bragança, heating continues to dominate due to its colder climate, while Évora shows a relatively stable HVAC share, reflecting a balance between reduced heating and rising cooling needs. For all other cities, especially Faro, the contribution of climate control systems to total energy use increases substantially, underscoring the importance of passive design strategies and efficient cooling technologies in future buildings.
3.2.3. Influence of Occupancy Profiles on Energy Demand
Two distinct usage profiles were evaluated to assess the combined effects of climate change and occupant behaviour on building energy performance: a standard pre-pandemic profile (PC) and a post-pandemic profile (PP). This analysis aims to understand how increased occupancy duration, extended equipment usage, and longer operation of HVAC systems influence energy demand under future climate conditions.
Table 6 presents the relative variations in total energy use between the two profiles, using the CCW-EPW climate scenario as a reference. The results indicate that changing the occupancy pattern has a limited impact on heating demand variation. In most cases, the post-pandemic profile results in a slightly greater reduction in heating consumption, except in Faro, where heating needs increase.
This behaviour can be explained by the fact that longer occupancy periods increase internal heat gains, reducing the building’s demand for heating. However, the HVAC system also operates for a longer duration to maintain comfort levels, especially during hours that would be inactive under the conventional profile. As a result, in certain locations and months, the extended system runtime can offset the gains from internal thermal loads, potentially increasing heating energy use despite higher internal temperatures.
The most significant differences between profiles occur regarding cooling energy demand, particularly in Porto, although the absolute increase is modest, approximately 2 kWh/m2 per year. As with heating, extended occupancy leads to more significant internal gains, but in this case, these contribute to increased cooling loads, especially during warmer months. The extended operational periods of cooling systems under the post-pandemic profile further amplify this effect.
Despite these variations, the influence of different occupancy profiles does not significantly alter the broader trends observed in climate-induced energy demand shifts. The fundamental pattern, decreasing heating and increasing cooling under future climatic scenarios, remains consistent across both profiles.
3.3. Thermal Comfort and Humidity Effects in Climate Change Scenarios
Ensuring thermal comfort for occupants is the primary objective of indoor climate control systems. To quantify comfort levels in building performance simulation, this study uses the discomfort hours metric, calculated according to the ASHRAE 55-2004 graphical method, which remains functionally comparable to the updated ASHRAE 55-2017 standard. Comfort is guaranteed when operative temperature and relative humidity fall within the defined comfort zone, with assumed clothing insulation levels of 0.5 Clo in summer and 1.0 Clo in winter. By the considered standards, thermal comfort can no longer be met if the absolute humidity exceeds 12 g of water per kilogram of dry air.
The outdoor discomfort hours were recorded for each location and climate file. Since EPW climate files do not directly contain absolute humidity values, these were derived using psychrometric equations from dry bulb temperature, relative humidity, and atmospheric pressure. The calculated values revealed a consistent increase in outdoor discomfort hours under future climate scenarios, correlating with an increased number of hours where humidity levels exceed comfort thresholds.
In all cases, simulations ensured that operative temperature remained within acceptable bounds. Consequently, excessive absolute humidity becomes the dominant factor driving thermal discomfort. As demonstrated in the psychrometric diagram, humidity increases may result from rising air temperatures without proportional decreases in relative humidity, or from minor reductions in RH accompanied by significant temperature increases.
In the LNEG-EPW file, despite temperature adjustments, relative humidity values were not modified to reflect future conditions. This led to inflated absolute humidity levels due to unchanged RH paired with warmer air. In contrast, the CCW-EPW file applied corrected RH values, leading to a general reduction compared to the present climate file (TMY2021-EPW). However, due to elevated temperatures in the CCW-EPW file, absolute humidity still rose. Comparing both future climate files, LNEG-EPW consistently produced more hours above the humidity threshold, except in Faro, where the extremely high temperatures in CCW-EPW resulted in the highest discomfort hours despite lower RH.
These findings expose a critical shortcoming in the LNEG dataset, the absence of RH projection adjustments, which results in unrealistic humidity levels under future climate conditions. This flaw may lead to overdesign of cooling systems or errors in passive design strategies, such as over-reliance on insulation or shading to counteract the effects of high humidity. Although the total number of hours of discomfort remains moderate, most occur during the cooling season when ambient temperatures are high. At constant RH, higher air temperatures directly increase absolute humidity and thus discomfort.
To assess the dynamic interaction between indoor and outdoor humidity, a year-long hourly analysis was performed using the CCW-EPW file for Lisbon. As shown in
Figure 5, indoor humidity often exceeds outdoor levels during periods when HVAC systems are inactive. This is due to internal latent heat sources, such as human respiration and appliance moisture. However, when cooling systems are active, air undergoes latent cooling and dehumidification as it reaches the dew point. The air is then reheated to achieve comfort, reducing its temperature and absolute humidity. During winter months, with the HVAC system in ventilation-only mode, indoor and outdoor humidity levels converge due to passive air exchange.
Despite this built-in dehumidification, cooling systems alone cannot maintain indoor humidity below the 12 g/kg threshold during all hours. Thus, dedicated dehumidification systems may be necessary.
4. Conclusions
Efficient building design and operation are crucial in mitigating greenhouse gas emissions and enhancing indoor comfort, particularly as climate change accelerates. This study assessed the importance of incorporating future climate conditions into the climatic files used in dynamic building energy simulations. Given buildings’ long operational lifespans, accounting for climate change in their design and regulation is no longer optional; it is essential.
The research concentrated on five representative Portuguese cities, Bragança, Porto, Lisbon, Évora, and Faro, illustrating the country’s regional climatic diversity, which can also reflect the representativeness of the southern European region. It combined two core methodological approaches: statistical morphing of historical weather data to generate future-oriented climate files, and dynamic energy simulations of a standardised residential building model compliant with current regulations and occupancy patterns.
Simulations were performed using climate data from TMY2021-EPW (present conditions), LNEG-EPW (regulatory standard), and CCW-EPW (future projections using CCWorldWeatherGen). The comparison showed that the morphing-based CCW-EPW files more accurately reflected expected mid-century climate conditions than the LNEG regulatory files, particularly in temperature and humidity trends.
Thermal comfort was evaluated using ASHRAE Standard 55-2017, with operative temperature as the HVAC control parameter. Results indicated a clear climatic shift: heating demand is projected to decline, while cooling demand rises significantly, especially in southern and coastal cities. This trend is most pronounced in Faro, which showed the highest projected increase in total energy use, followed by Porto and Lisbon. Conversely, Bragança may experience a slight decrease in total energy demand due to substantial heating reductions.
The findings highlight critical shortcomings in the LNEG-EPW files, particularly their failure to adjust humidity levels in line with rising temperatures. This resulted in inaccurate thermal comfort predictions, potentially compromising design decisions. In contrast, the CCW-EPW files, though limited by the absence of extreme event modelling, offered more realistic projections of average conditions and better aligned with recent climate scenarios such as CMIP6 SSP3-7.0.
Heating consumption is expected to decline by 14% to 32%, while cooling consumption may increase between 49% and 270%, depending on location. This shift underscores a future where cooling, rather than heating, becomes the dominant energy demand in residential buildings, especially in Faro, Évora, and Lisbon. Accordingly, national energy policies, HVAC design standards, and building codes must be updated to reflect this emerging reality.
Thermal comfort, particularly as affected by air humidity, is a growing concern. With warmer air carrying more moisture, discomfort hours will rise unless humidity control measures such as dehumidification are implemented. Thus, future-ready buildings must address temperature regulation and moisture management to ensure long-term comfort and efficiency.
In conclusion, this study demonstrates that integrating future climate scenarios into energy modelling is essential for accurate performance assessment. It calls for revising national regulatory files, increasing reliance on validated future climate data, and rebalancing design priorities toward cooling resilience and indoor environmental quality. By anticipating tomorrow’s climate, we can ensure that today’s buildings remain safe, efficient, and comfortable for decades. To expand the scope of this research, potential future directions may include examining extreme weather events, evaluating diverse occupant behaviour scenarios, increasing geographical coverage, and conducting long-term climate modelling using higher-resolution datasets such as CMIP6. Focusing on these aspects will further enhance the adaptability and resilience of residential buildings in response to impending climate challenges.


