1. Introduction
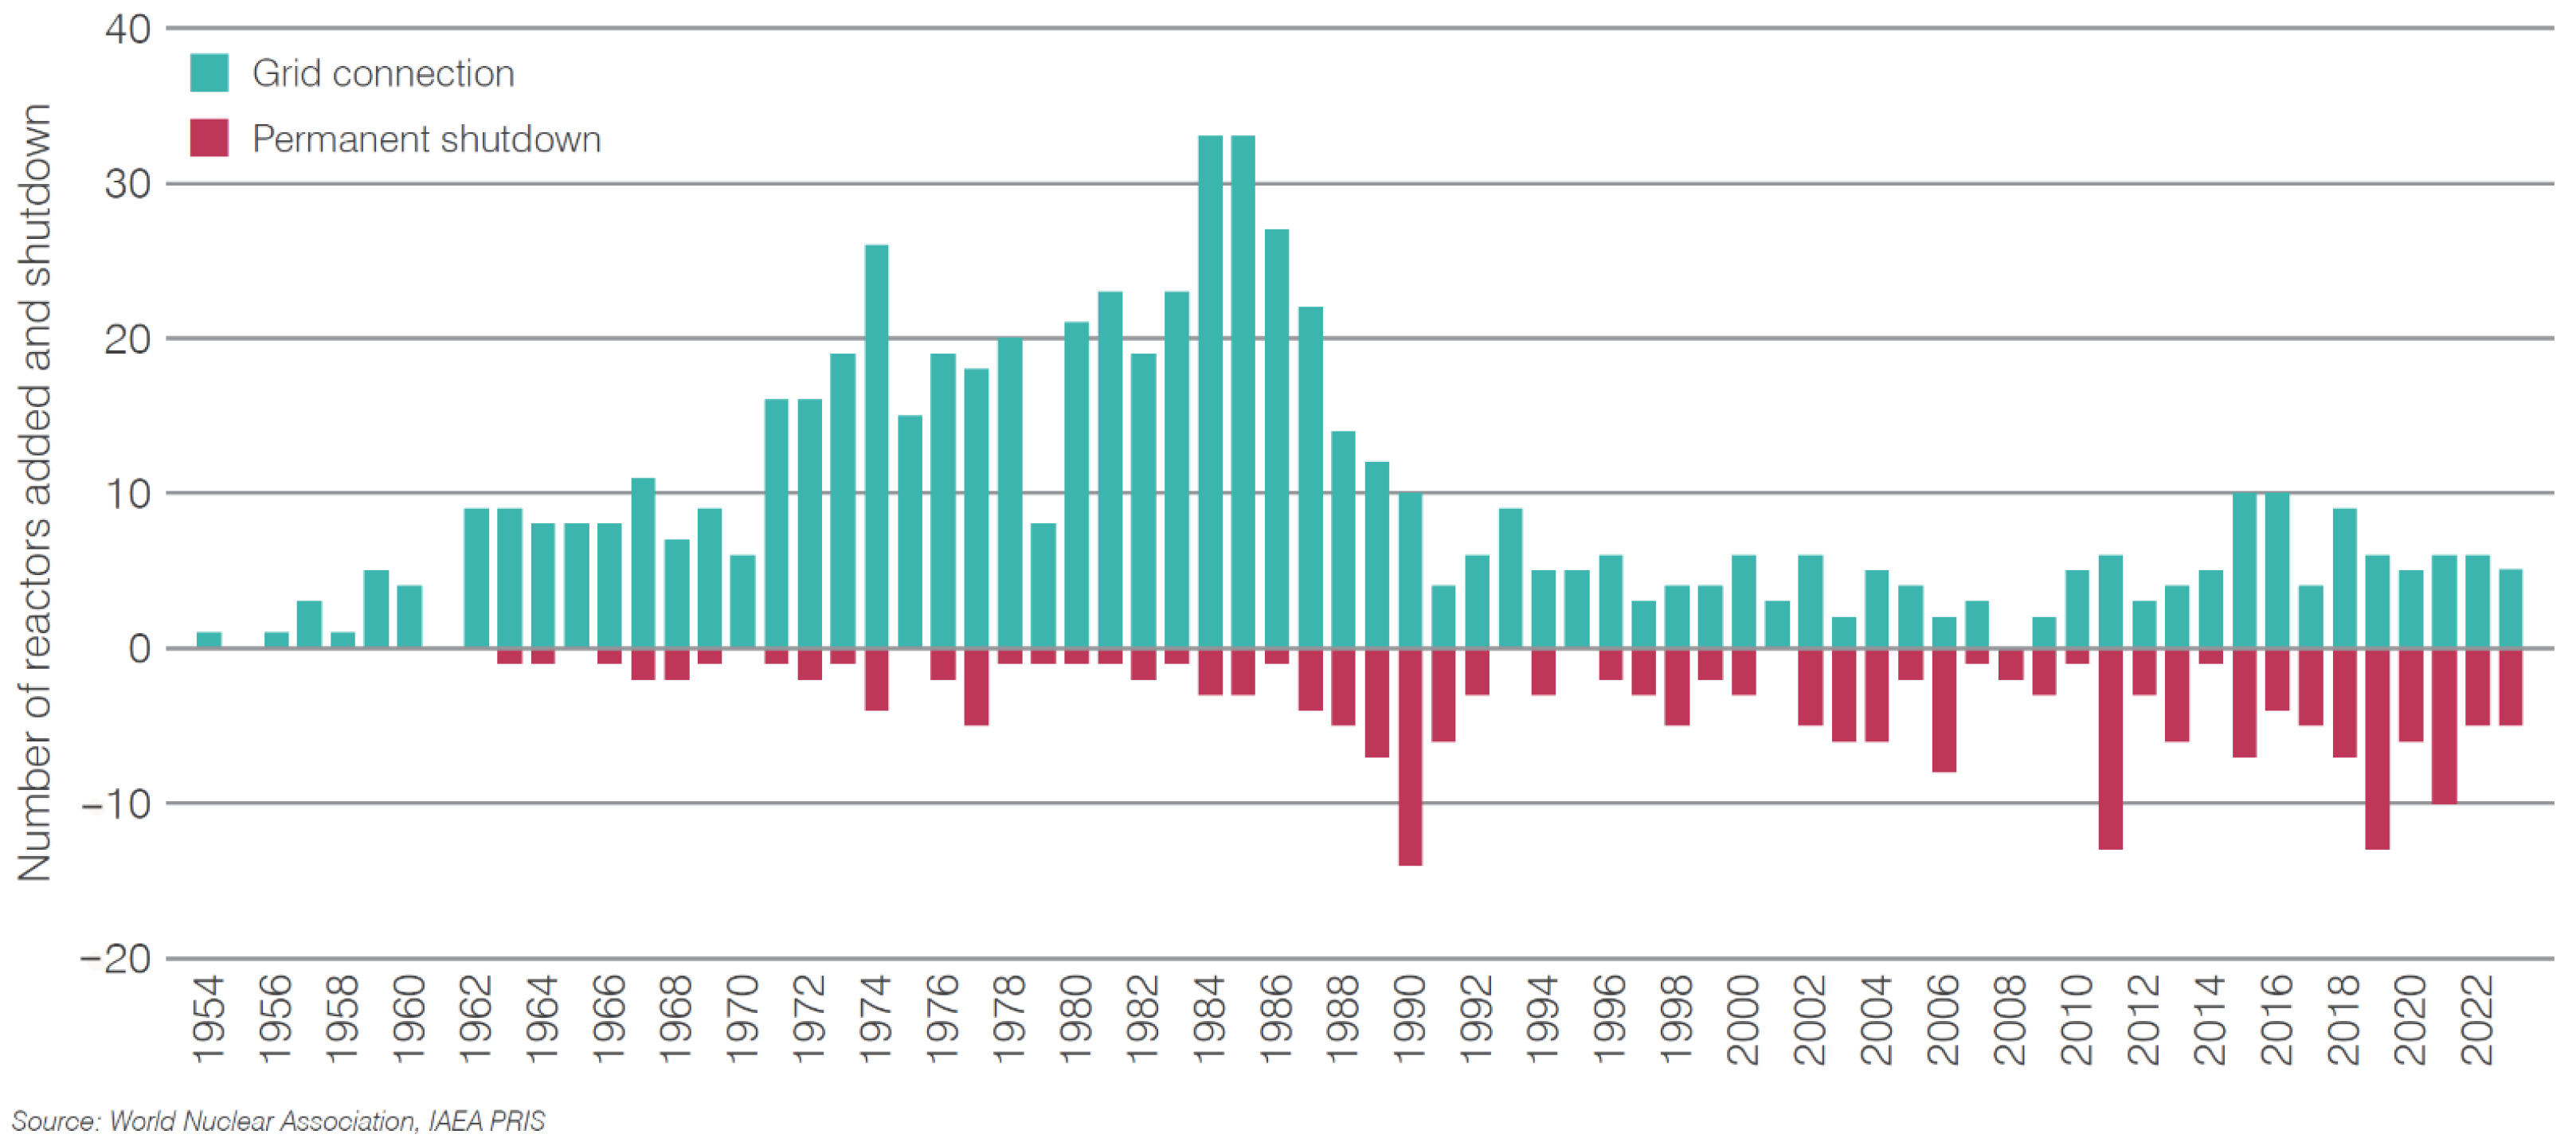
The global fleet of nuclear reactors has aged over the past few decades and a significant number of nuclear reactors are approaching their end-of-life phase and are slated for decommissioning. However, the decommissioning process is increasingly complicated due to the limited availability of non-carbon energy alternatives. According to the Nuclear Energy Agency (NEA), approximately 400 commercial nuclear power plants are expected to be decommissioned by 2050.
Figure 1 illustrates the trend of new reactor grid connections and shutdowns from 1954 to 2023 [
1].
Recent commitments at COP28 to triple nuclear energy production by 2050 have reignited interest in nuclear power, despite the relatively low number of reactors constructed in recent decades [
2]. The replacement of the existing generation of nuclear power plants (NPPs) is expected to span several decades. In the United States, the average age of an NPP is 42 years, nearing the operational lifespan for which they were originally designed [
3]. The decommissioning of these reactors poses challenges to climate goals, prompting many operators to consider refurbishment as a means of extending their service life.
Nuclear plant refurbishment is an extensive and costly process. However, as the existing nuclear fleet ages, plants are now looking to refurbishment to extend the operational life of the plants [
4]. Companies have also started looking into the potential to restart older reactors and repurpose them as energy sources for data centers [
5]. An important, costly, and time-consuming part of reactor refurbishment is verifying the health and integrity of electrical cables to determine if they need replacement. Insulation and jacket materials used for electrical cables are polymers with additives and fillers to improve aging resistance, dielectric, mechanical, and fire-retardant properties. In a nuclear power plant, cables may be subjected to environmental stressors such as high temperature, radiation, humidity, or vibrations during both normal and abnormal conditions that can cause deterioration and ultimately the failure of power, control, and instrumentation cables. While functional tests confirm operational status, they offer limited insight into insulation health or remaining service life, key concerns addressed through condition-based diagnostics. This research provides a timely and comprehensive literature review on both off-line electrical tests of the physical and chemical properties of cables, while they are de-energized and disconnected, and on-line electrical tests and diagnostic techniques while cables are energized and in service. Electrical tests are inherently more attractive, as they offer the potential of assessing an entire cable run rather than a predetermined, accessible area of a cable [
6]. This has resulted in on-line plant cable monitoring becoming a key area of interest for refurbishment and maintenance. If cables are monitored throughout plant operation, cable aging and faults can be simultaneously monitored as they form, allowing for any necessary replacements during routine plant outages.
The rest of this paper is organized as follows:
Section 2 provides background information for this research.
Section 3 focuses on off-line cable condition monitoring techniques. Following this, on-line cable assessment and testing techniques are discussed in
Section 4. Lastly, summary charts of current off-line and on-line cable testing and aging assessment techniques are developed and presented in
Section 5, together with discussions and insights with respect to cable testing in NPPs.
2. Background
Polymer insulated cables were first produced in the 1850s and vulcanized rubber was used for the first time as insulation for wires in 1860. The telegraph was the first device utilizing electrical energy to become of any commercial importance and its development required the use of underground construction. Reports of early cable failures in extruded dielectric systems began to be documented in many parts of the world during the mid-1970s [
7]. In the presence of water and voltage stress, small imperfections and flaws in insulation materials such as polyethylene (PE) and cross-linked polyethylene (XLPE) create large stress risers that cause insulation degradation and lead to failure. Nuclear power plants can contain more than one thousand kilometers of electrical cables.
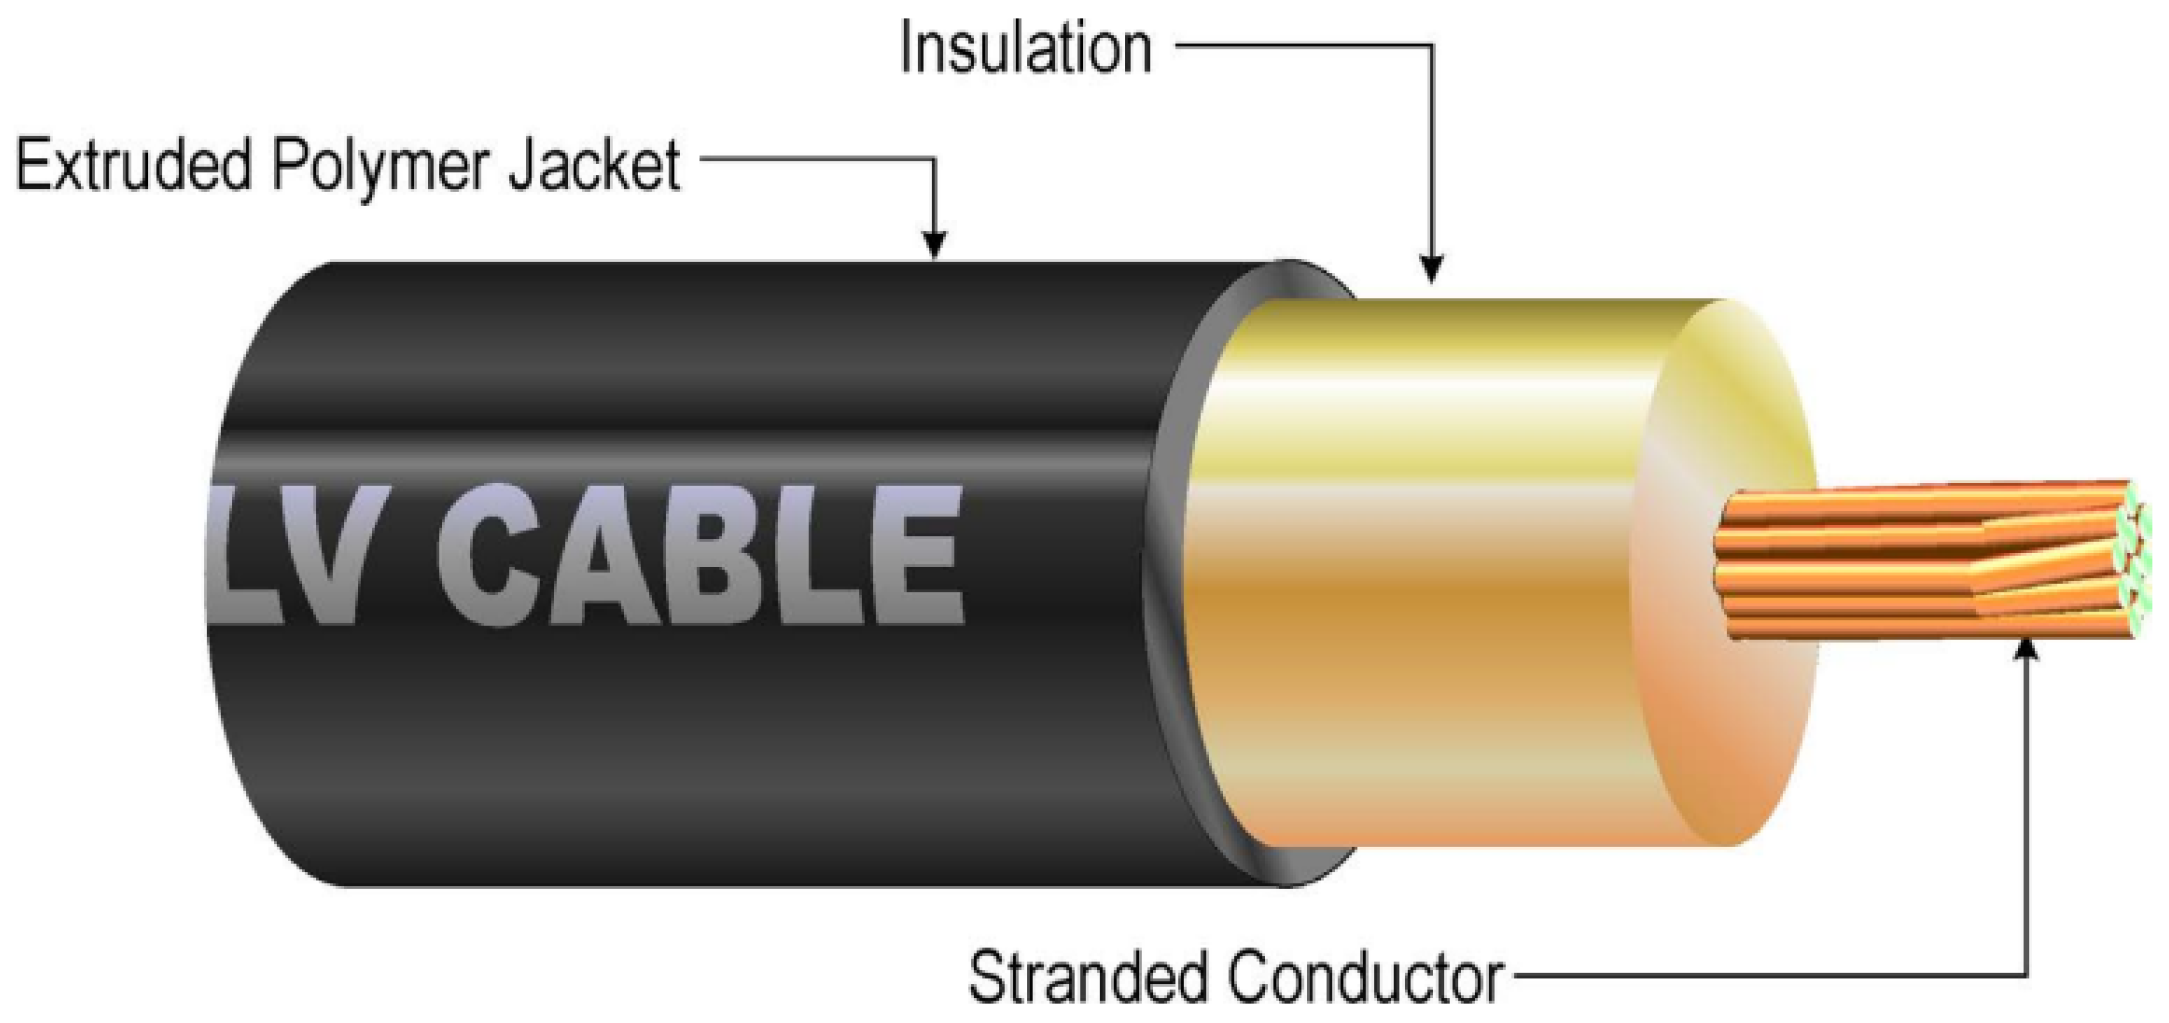
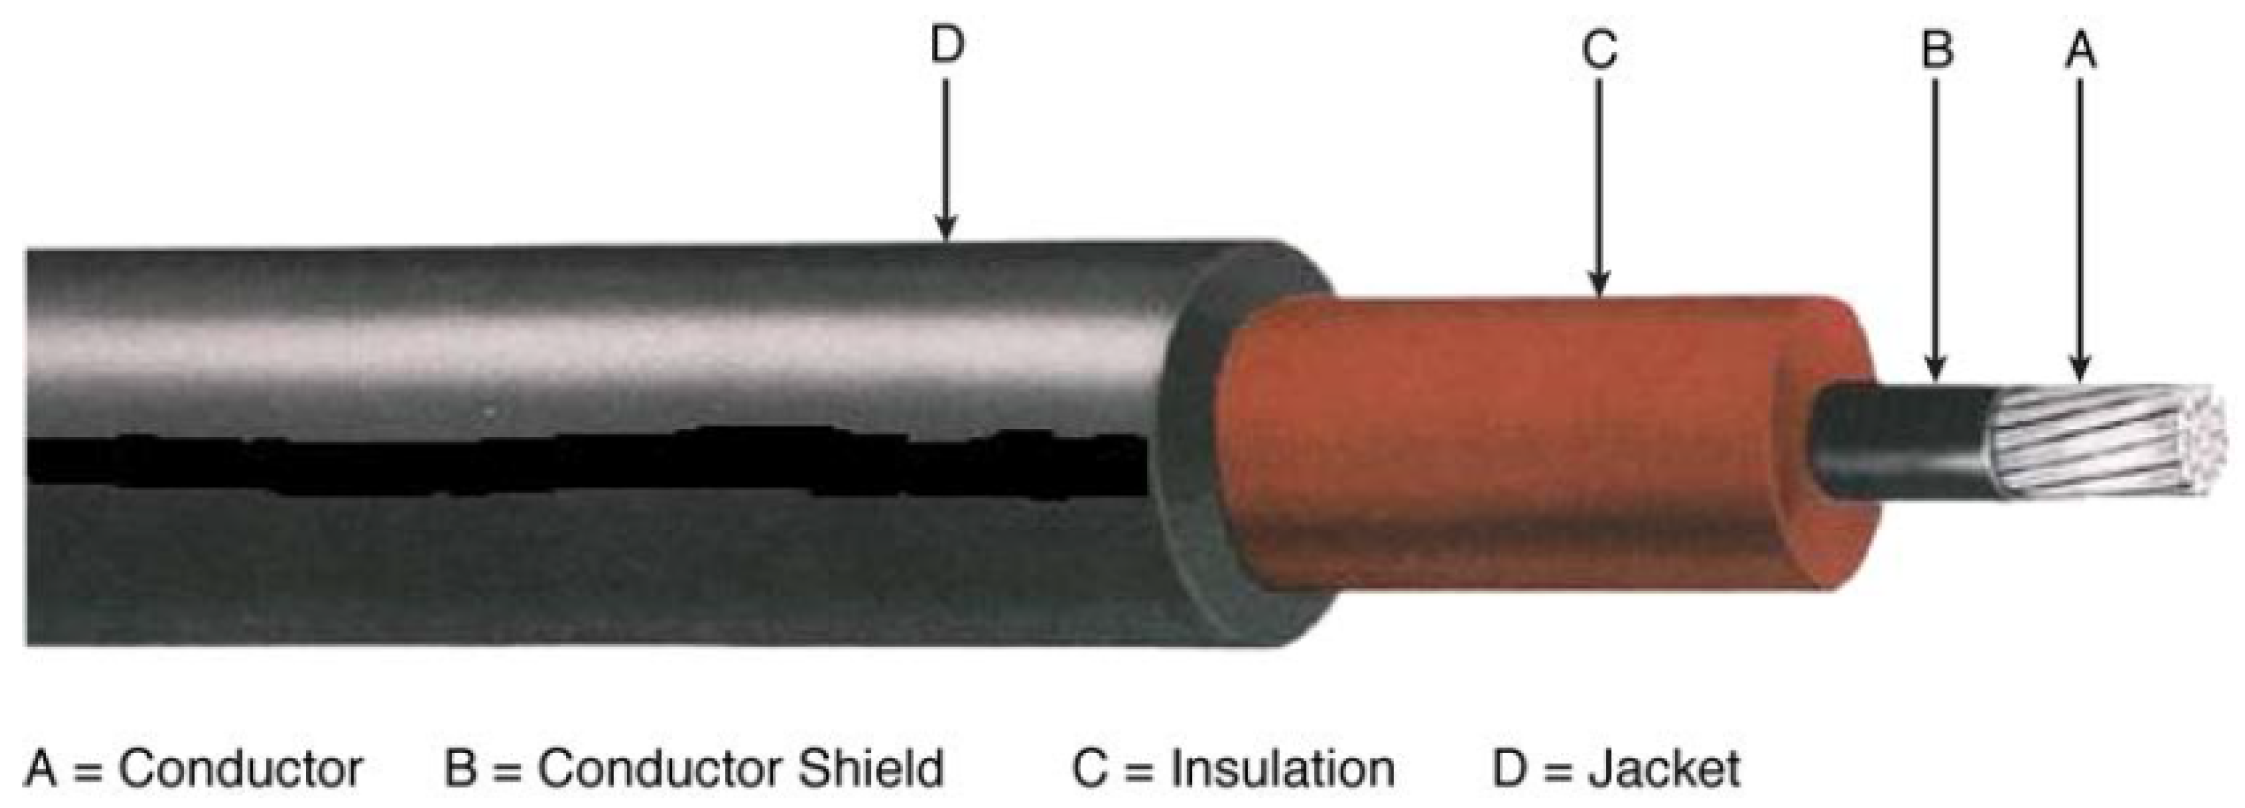
The basic components of a multi-conductor control cable, with jacketed, single-conductor, low-voltage power and medium-voltage (MV) unshielded power cable construction, are shown in
Figure 2,
Figure 3 and
Figure 4, respectively. A non-shielded cable may consist of one or several insulating layers and a jacket. A cable is not considered fully shielded until both conductor and insulation shields are present.
Non-shielded cables are common in the 0-to-2 kV voltage range, as shown in
Figure 3 and
Figure 4. Medium-voltage cables are generally fully shielded (with both conductor and insulation shields) cables in the 5 kV-through-35 kV voltage range, as shown in
Figure 5. The insulation shield for a medium voltage is made up of two components; a semiconducting or stress-relief layer (conductor screen) and a metallic layer of tape or tapes, drain wires, concentric neutral wires, or a metal tube. The purpose of the conductor shield, also called the conductor screen, over the conductor is to provide a smooth cylinder rather than the relatively rough surface of a stranded conductor in order to reduce the stress concentration at the interface with the insulation [
7].
Faults can occur in any section of an electrical cable. However, only certain materials experience aging, which affects the physical characteristics of the cable. This is the premise behind on-line cable condition monitoring programs. Cable testing is commonly found for medium-voltage (MV) power cables and high-voltage transmission lines, as sudden faults may result in excessive revenue losses or compromise the integrity of the grid [
9]. Due to the availability of measurements at substations, the desired monitoring method for insulation materials is simplified for power transmission cables, as no signal is being sent, and the primary purpose is to convey the electric current to the intended device or location. Cables used for nuclear instrumentation and control (I&C) transmit signals at a low voltage. The information contained in the signals cannot be distorted; therefore, many of the monitoring methods utilized by transmission cables are not applicable or do not work for lower-voltage, data-intensive cables.
The monitoring method used for a cable is dependent on which part of the cable is determined to provide a sufficient indication of cable health. Numerous cable condition monitoring techniques exist, each with inherent advantages and limitations. Consequently, no single method can serve as a universal solution for all cable monitoring needs. Off-line testing requires taking the circuit out of service (de-energizing), whereas on-line testing enables diagnostic measurements during normal operation [
7]. There are two fundamental errors in cable aging management: looking in the wrong place with the right inspection technique and looking in the right place with the wrong inspection technique. It takes two “rights” for an effective cable monitoring program, the “right spot” and the “right technique”. The “right spot” implies that the identification of the cables and the locations that are expected to age more rapidly will be singled out for cable condition monitoring. The “right technique” implies that the technology is available and appropriate cable monitoring techniques will be selected for the materials and the application.
3. Off-Line Cable Condition Monitoring Techniques
Fault detection in cables has historically been performed off-line and requires the cable to be de-energized. Cable condition monitoring techniques are used to trend or assess the condition of cable materials with respect to aging. They are capable of measuring the property changes that can be correlated with a known standardized amount of cable degradation that could be detected and trended. This allows comparisons with baseline data to quantify the remaining cable life and to determine if or when cables need to be replaced. Troubleshooting tests are performed only if there is a problem with the circuit. Off-line assessment and detection techniques encompass both laboratory measurement methods, such as elongation at break (EAB), Oxygen Induction time (OIt), Fourier Transform Infrared (FTIR) Spectroscopy, Thermal Gravimetric Analysis (TGA), and plasticizer content measurement (PCMT), and in situ cable assessment techniques such as those involving an EPRI Indenter, an AECL Portable Polymer Tester, near-infrared (NIR) spectroscopy, insulation resistance (IR), partial discharge (PD), and Tan Delta diagnostics.
3.1. Laboratory Measurement/Testing Techniques
Physical and chemical cable aging methods are primarily performed in the laboratory and require obtaining cable samples from the field while cabling systems are de-energized and disconnected from one or both ends.
3.1.1. Elongation-at-Break (EAB) Measurement Technique
Elongation at Break (EAB) is a widely accepted method for assessing polymer aging and serves as a reference baseline for evaluating other condition monitoring techniques. EAB and tensile strength (TS) are two common indicators that reflect the mechanical strength of insulating materials. EAB refers to the ratio of the displacement value of the sample at the break to the original length during the entire stretching process, expressed as a percentage. The principal formula is given as follows:
In Equation (
1),
L is the original length of the material and
L is the displacement length of the material after stretching [
10]. A conservative threshold of 50 percent or greater is typically used as an acceptance criterion [
11]. This technique is applicable to all polymer materials; however, it is a destructive test that requires a relatively large sample.
3.1.2. Oxygen Induction Time/Oxygen Induction Temperature (OIT) Technique
Depending on their practical application, polymer materials are stabilized against oxidation and other environmental influences. A simple method to check the activity of the stabilizer system is to determine the Oxidation Induction time (OIt) or Oxidation Induction Temperature (OIT) of the material [
12]. Oxygen Induction time (OIt) measures the time required for a polymer to initiate oxidation under controlled conditions. It also quantifies the level of antioxidants present in certain materials, such as polyethylene (PE), cross-linked polyethylene (XLPE), and ethylene propylene Rubber (EPR). OIt values correlate with elongation at break (EAB) measurements for specific materials. This technique requires micro-samples extracted from accessible locations. The important characteristics of OIt are as follows: (a) It measures the level of anti-oxidants present for XLPE and EPR cables only; (b) It correlates to elongation-at-break values for specific materials; (c) Microsamples are required for testing.
The limitations of OIt are as follows: (a) It is not easily applicable to PVC; (b) Microsamples are needed which may not be representative of the state of the bulk materials; (c) It requires a detailed procedure to obtain samples; (d) It is mainly used for insulation measurement.
3.1.3. Fourier Transform Infrared (FTIR) Spectroscopy Technique
FTIR Spectroscopy is a universal and widely used spectral methodology based on atomic vibration and rotation [
13]. Due to this principle, molecules with a dipole moment could be fingerprint detected by FTIR Spectroscopy, because all substances are different in either the type of atoms, the number of atoms, or the position of atoms, which could result in different FTIR spectrums. Fourier Transform Infrared (FTIR) Spectroscopy is commonly used to identify polymer types in cable insulation or jackets [
14]. However, its effectiveness in assessing aging-related degradation remains inconclusive. While FTIR results often exhibit a consistent trend with aging, the underlying technical justification for this correlation is uncertain.
3.1.4. Thermal Gravimetric Analysis (TGA) Technique
The Thermogravimetric Analysis (TGA) of polymers is conducted to measure weight changes as a function of temperature and time. The weight changes of polymeric materials can be caused by decomposition and oxidation reactions as well as physical processes such as sublimation, vaporization, and desorption [
15]. As materials are heated, they can lose weight from a simple process such as drying or from chemical reactions that liberate gasses. It is representative of the content of volatile molecules and is mainly suitable for PVC materials that lose their plasticizers. The test should be carried out at a constant temperature ramp rate, in a given atmosphere (usually oxygen, but nitrogen can be used). The plasticizer content can be correlated to elongation-at-break values when PVC is subjected to thermal aging. A sample of 8–10 mg is required for TGA.
3.1.5. Plasticizer Content Measurement Technique (PCMT)
Plasticizers are molecules that are commonly used as additives in polymeric materials to lower their glass transition temperature and improve their processability, mechanical flexibility, ductility, toughness, and rheological properties. Qualitative and quantitative analyses of plasticizers in polymers, or more specifically rubbers, typically require a step in which the plasticizers are extracted from the polymer matrix. The extracted additives can then be analyzed using, for example, thermogravimetric techniques, with or without combination with Fourier Transform Infrared (FTIR) Spectroscopy [
16]. Plasticizer content measurement is a useful technique for assessing the degradation of PVC material exposed to thermal aging. The plasticizer content of PVC insulation is generally between 20 and 30 percent by mass. A number below 15 percent indicates that the cable has undergone thermal degradation. For radiation exposure, there is no direct relationship between plasticizer content and physical degradation.
3.2. In Situ Cable Assessment Techniques
In situ cable aging methods are primarily performed in the field while cabling systems are de-energized and disconnected at one or both ends. Current nuclear plant cable inspections primarily rely on the direct visual examination of installed cables, supplemented by off-line electrical tests to assess the condition of medium- and low-voltage cables (especially during refurbishment outages).
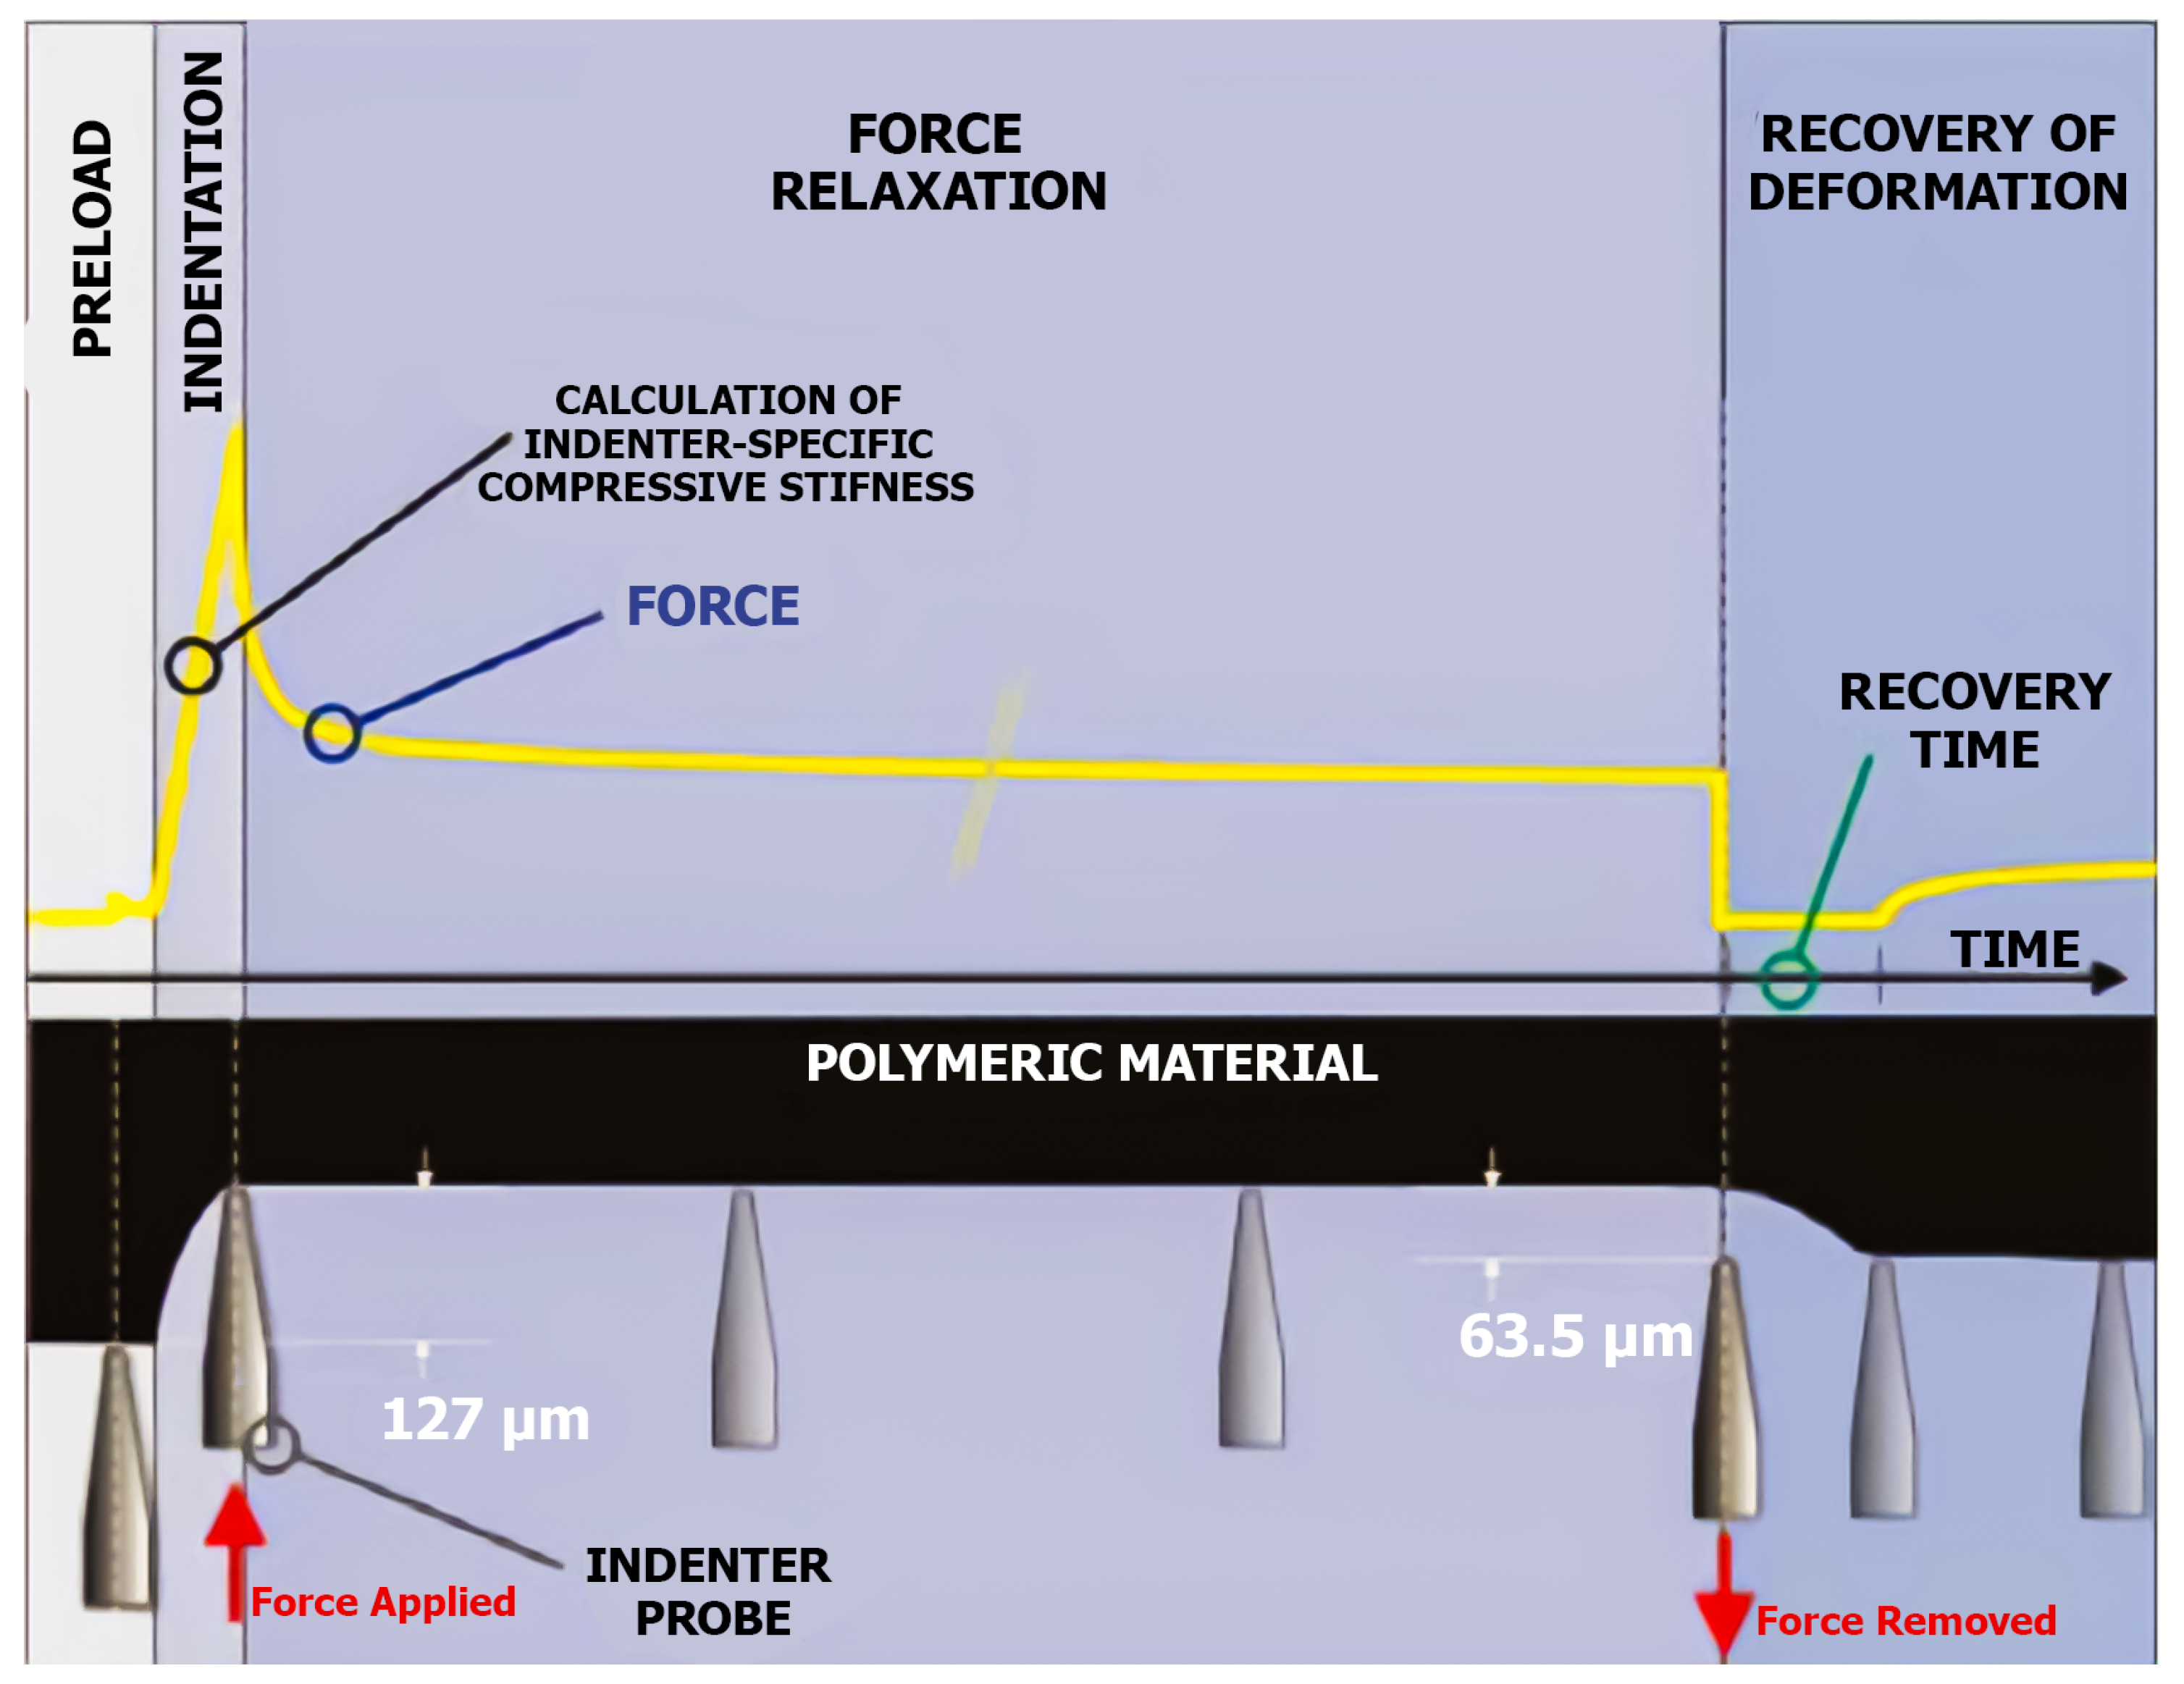
3.2.1. EPRI Indenter/Portable Polymer Tester (PPT) Technique
The EPRI Indenter is a self-contained, portable system suitable for both in situ and laboratory evaluations. This is a non-destructive, in situ method for monitoring the aging of in-service cables in harsh industrial environments. The evaluation of the severity of the jacket degradation may be performed through indenter modulus assessment, as shown in
Figure 6.
The use of indenter testing allows the quantification and trending of the hardening of the jacket to provide insights into the relative hardness and the degree of continued aging [
18]. The compressive modulus is a key mechanical property of insulation and jacket materials, used to monitor aging in materials that exhibit progressive changes in mechanical properties over time. As insulation hardens with age, the indenter modulus correspondingly increases. The indentation technique is a quantitative non-destructive cable condition monitoring technique that consists of driving a probe tip into the surface of the cable jacket or cable insulation material. During the indentation and post-indentation phases, the load and displacement are measured and combined to derive parameters related to the rheological properties of the material. The advantages of this technique are as follows:
Portable instruments are available;
The measurement is quick;
Data are simple to analyze.
An example of a new-generation indenter is the Portable Polymer Tester (PPT) developed by AECL [
19]. It has been demonstrated to effectively assess and profile cable damage caused by localized heat sources. The principle of operation of the PPT is shown in
Figure 7. Recovery time was shown to be highly sensitive to degradation occurring in jacket and insulation materials typically found in nuclear plants. As well as this, the change in recovery time observed between unaged and aged samples matched the change in EAB (reference destructive laboratory technique). Therefore, recovery time can be relied upon to assess, monitor, and trend the degradation of installed electrical cables [
19].
Important characteristics of the EPRI Indenter and PPT are as follows: (1) Using them is a mature technique; (2) They are portable devices; (3) They are limited to soft jacket materials such as PVC, Hypalon, and Neoprene; (4) They are limited to thermal aging; (5) They are less sensitive to XLPE material; (6) They are correlated with absolute elongation at break to predict the remaining life of a cable by comparing baseline test data; (7) They are limited when evaluating loose cable construction; non-even thickness in the jacket or insulation affect the test results; (8) Measuring the jacket and correlation with insulation properties are required to predict remaining insulation life; (9) Temperature compensation is applied; (10) Test temperature, probe speed, and calibration accuracy affect the test results.
3.2.2. Near-Infrared (NIR) Spectroscopy Technique
NIR spectroscopy applied in transmission, reflection, or transflection mode is a rapid and non-destructive method, which is gaining increasing acceptance in many fields for qualitative and quantitative analysis [
20]. NIR spectroscopy has been applied to the characterization of polymers resulting from light absorption in organic molecules. The chemical fingerprints of cable insulation are significantly altered due to degradation resulting from irradiation and thermal aging. These spectral changes are correlated with critical property changes (e.g., elongation change). The important characteristics of NIR are as follows: (1) The test device is portable and non-destructive; (2) It can confirm the qualification group; (3) It can predict absolute elongation at break by comparison to a database for the same cable formulation; (4) There are proprietary databases; (5) Using this technology for condition assessment is only available from one source; (6) No standards exist.
3.2.3. Insulation Resistance (IR) Technique
Insulation resistance (IR) measurements have historically been the only electrical testing method available for LV cables. Insulation resistance testing is a crucial technique used to evaluate the quality and safety of electrical equipment, including motors, generators, transformers, and cables. The process involves measuring the resistance of the insulation system to the flow of current. Insulation resistance testing can detect faults such as insulation degradation, moisture ingress, and contamination, any of which could lead to equipment failure or pose a safety hazard to personnel [
21]. The basic formula for a single conductor cable of cylindrical geometry is as follows:
where
IR = megohms for 1000 feet of cable;
K = the insulation resistance constant;
D = the diameter over the insulation (under the insulation shield); and
d = the diameter under the insulation (over the conductor shield). Note that both
D and
d must be expressed in the same units.
IR is expressed as a resistance value in megohms for 1000 feet of cable for a given conductor diameter and insulation thickness. This means that the longer the cable is, the lower the resistance value that is read on a meter is, since there are more parallel paths for current to flow to the ground [
7]. These measurements are not very sensitive to the deterioration mechanisms that impact LV cables and offer limited diagnostic capabilities.
3.2.4. Partial Discharge (PD) Diagnostic Technique
Partial discharge is due to decomposition of air in the voids within the insulation material wall or at the surface–shield interface. The discharges lead to the eventual degradation and failure of the polymer. This process, which involves electron and ion bombardment, is a major cause of insulation failure in cables. Partial discharge (PD) is gas discharge that occurs within the insulation media without bridging the system. PD is generally applied to medium-voltage power systems. Partial discharge testing is performed on newly manufactured cables precisely to prevent cables with voids of certain sizes (and quantities) to reach the user. The dielectric strength of air (in the void) must be understood. The greater the dielectric strength of the insulation material is, the greater the resistance to degradation under discharge conditions is. PD testing is a non-destructive test methodology that has the ability to detect/locate high-impedance defects such as voids, cuts, and electrical trees [
8]. However, it is limited to cables with continuous metallic shields and it may require a trained analyst to interpret measurements. There are three types of PD tests: (1) on-line PD testing, (2) on-line PD monitoring, and (3) off-line PD testing.
3.2.5. Tan Delta Diagnostic Technique
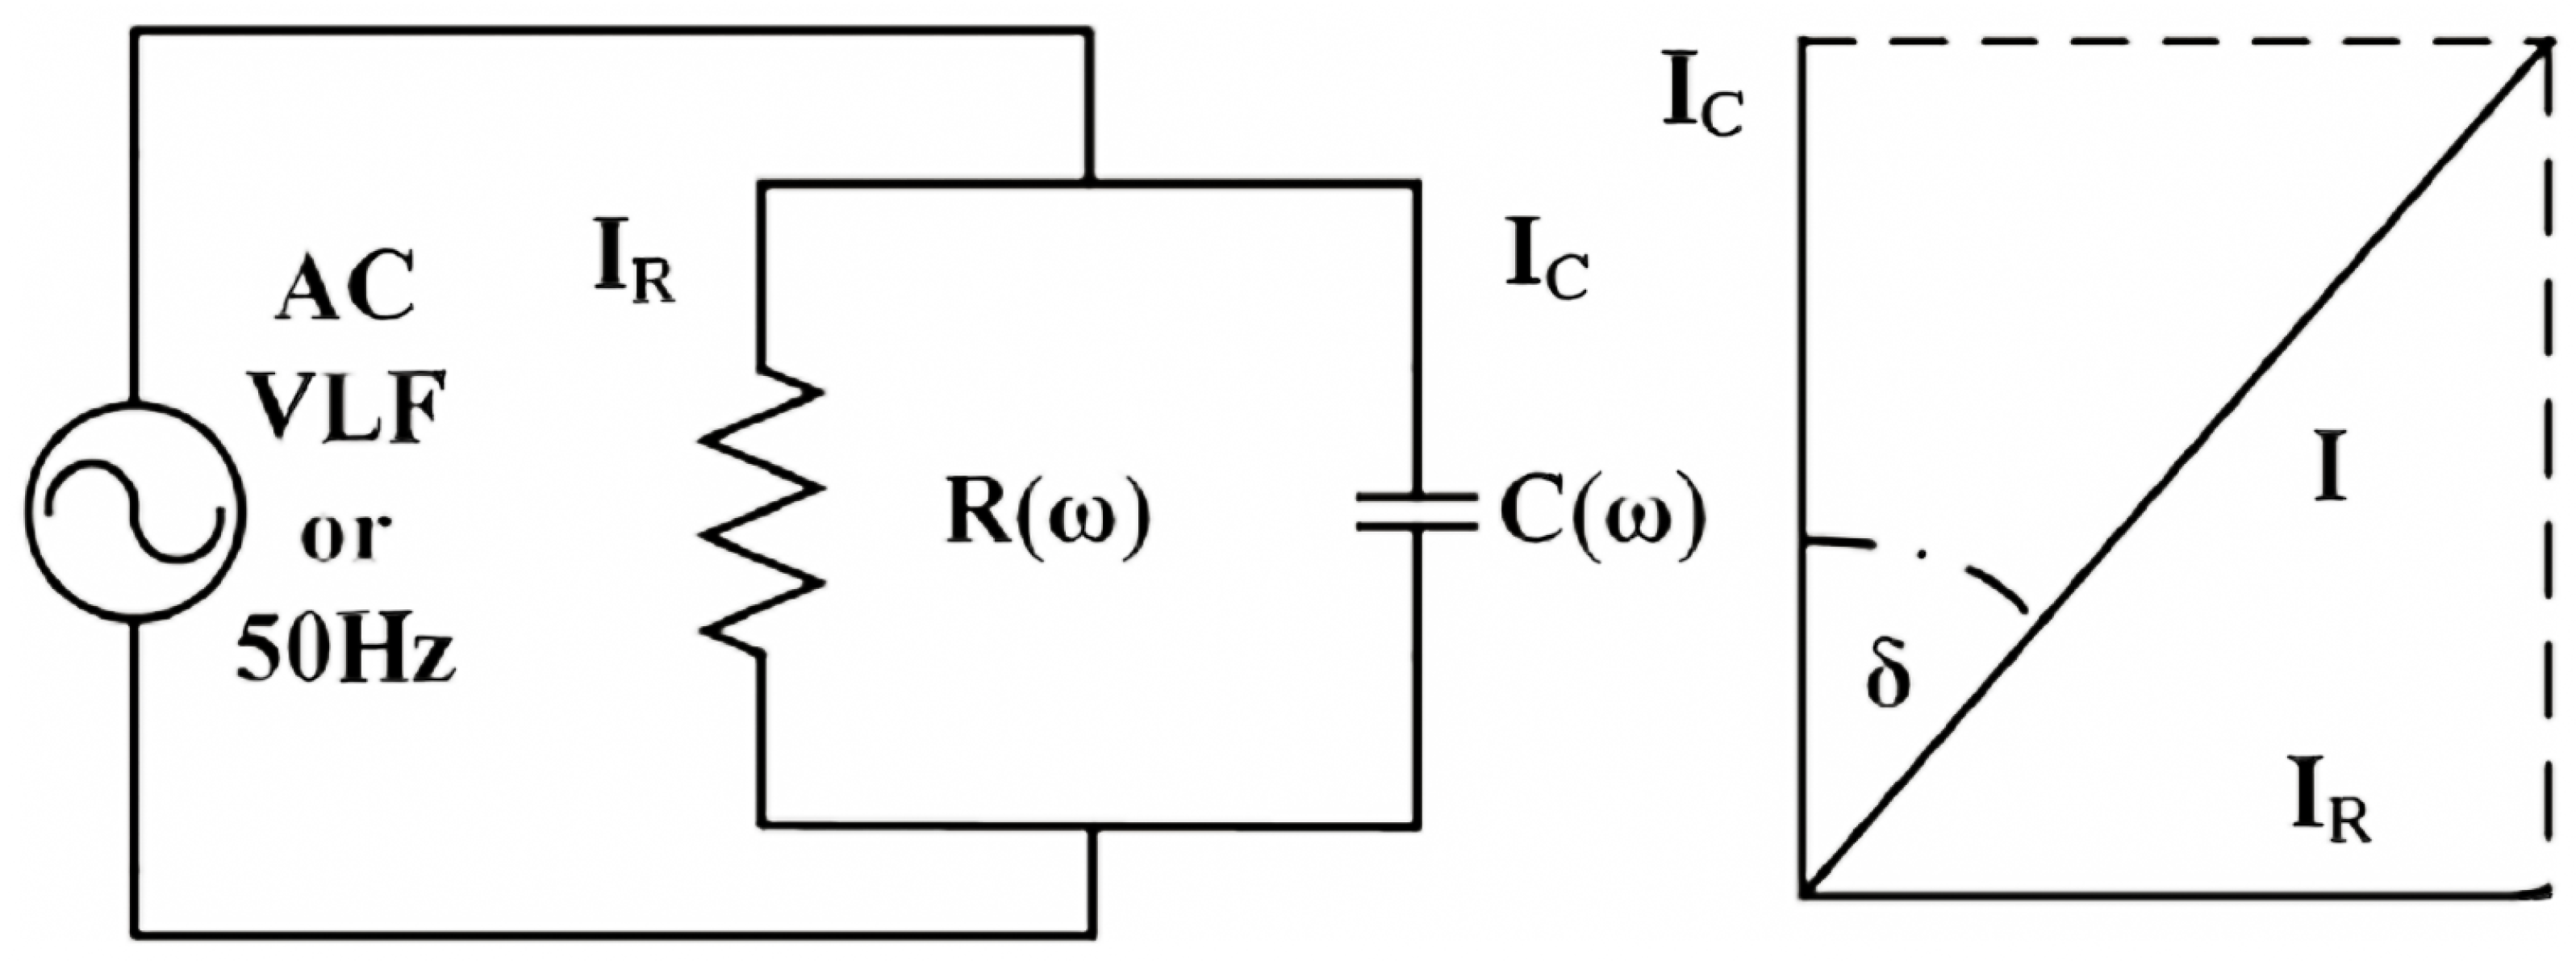
Tan Delta, also called loss angle or dissipation factor testing, is a diagnostic technique for testing cables to determine the quality of cable insulation. In the dielectric dissipation factor (DDF) method, cable insulation can be modeled by a resistor, R, and a parallel capacitor, C, and can be represented by an equivalent circuit, as shown in
Figure 8 [
8].
In
Figure 8, R represents the overall dielectric loss (conduction, polarization, and ionization losses) and C represents the lumped capacitance of the cable insulation. The dissipation factor can be defined as the ratio of the leakage current IR to the capacitive current IC, and their relationship can be derived from Equation (
3) [
22]:
There are irreversible increases in the cable insulation dissipation factor when the aging of the cable insulation occurs. If the insulation of a cable is free from defects, the cable approaches the properties of a perfect capacitor. In a perfect capacitor, the voltage and current are phase-shifted 90 degrees. If there are impurities in the insulation, it is no longer a perfect capacitor and the phase difference between voltage and current is less than 90 degrees. The extent to which the phase shift is less than 90 degrees is indicative of the level of insulation defects, such as water (or electrical) trees, moisture, air pockets, etc. A voltage source is required to energize the cable. What is typically used is a very-low-frequency (VLF) AC High Potential (HIPOT); it requires less power to test the same cable compared to 60 Hz. Using VLF AC HIPOT, the test voltage is applied to the cable while the Tan Delta controller takes measurements. Typically, the test voltage is raised in steps, and measurements are voltage-dependent if the cable is aged. This method measures the dielectric losses in the cable system. The important characteristics of the DDF method are as follows: (1) The test device is portable; (2) It is applicable to thermal and radiation aging; (3) Test results correlate with elongation change; (4) It is applicable to whole-cable evaluation; (5) Cables need to be disconnected for evaluation.
Most electrical tests (voltage testing, insulation resistance testing, etc.) are troubleshooting tests and they show functionality at the position measured but do not indicate the degree of aging in the insulating system.
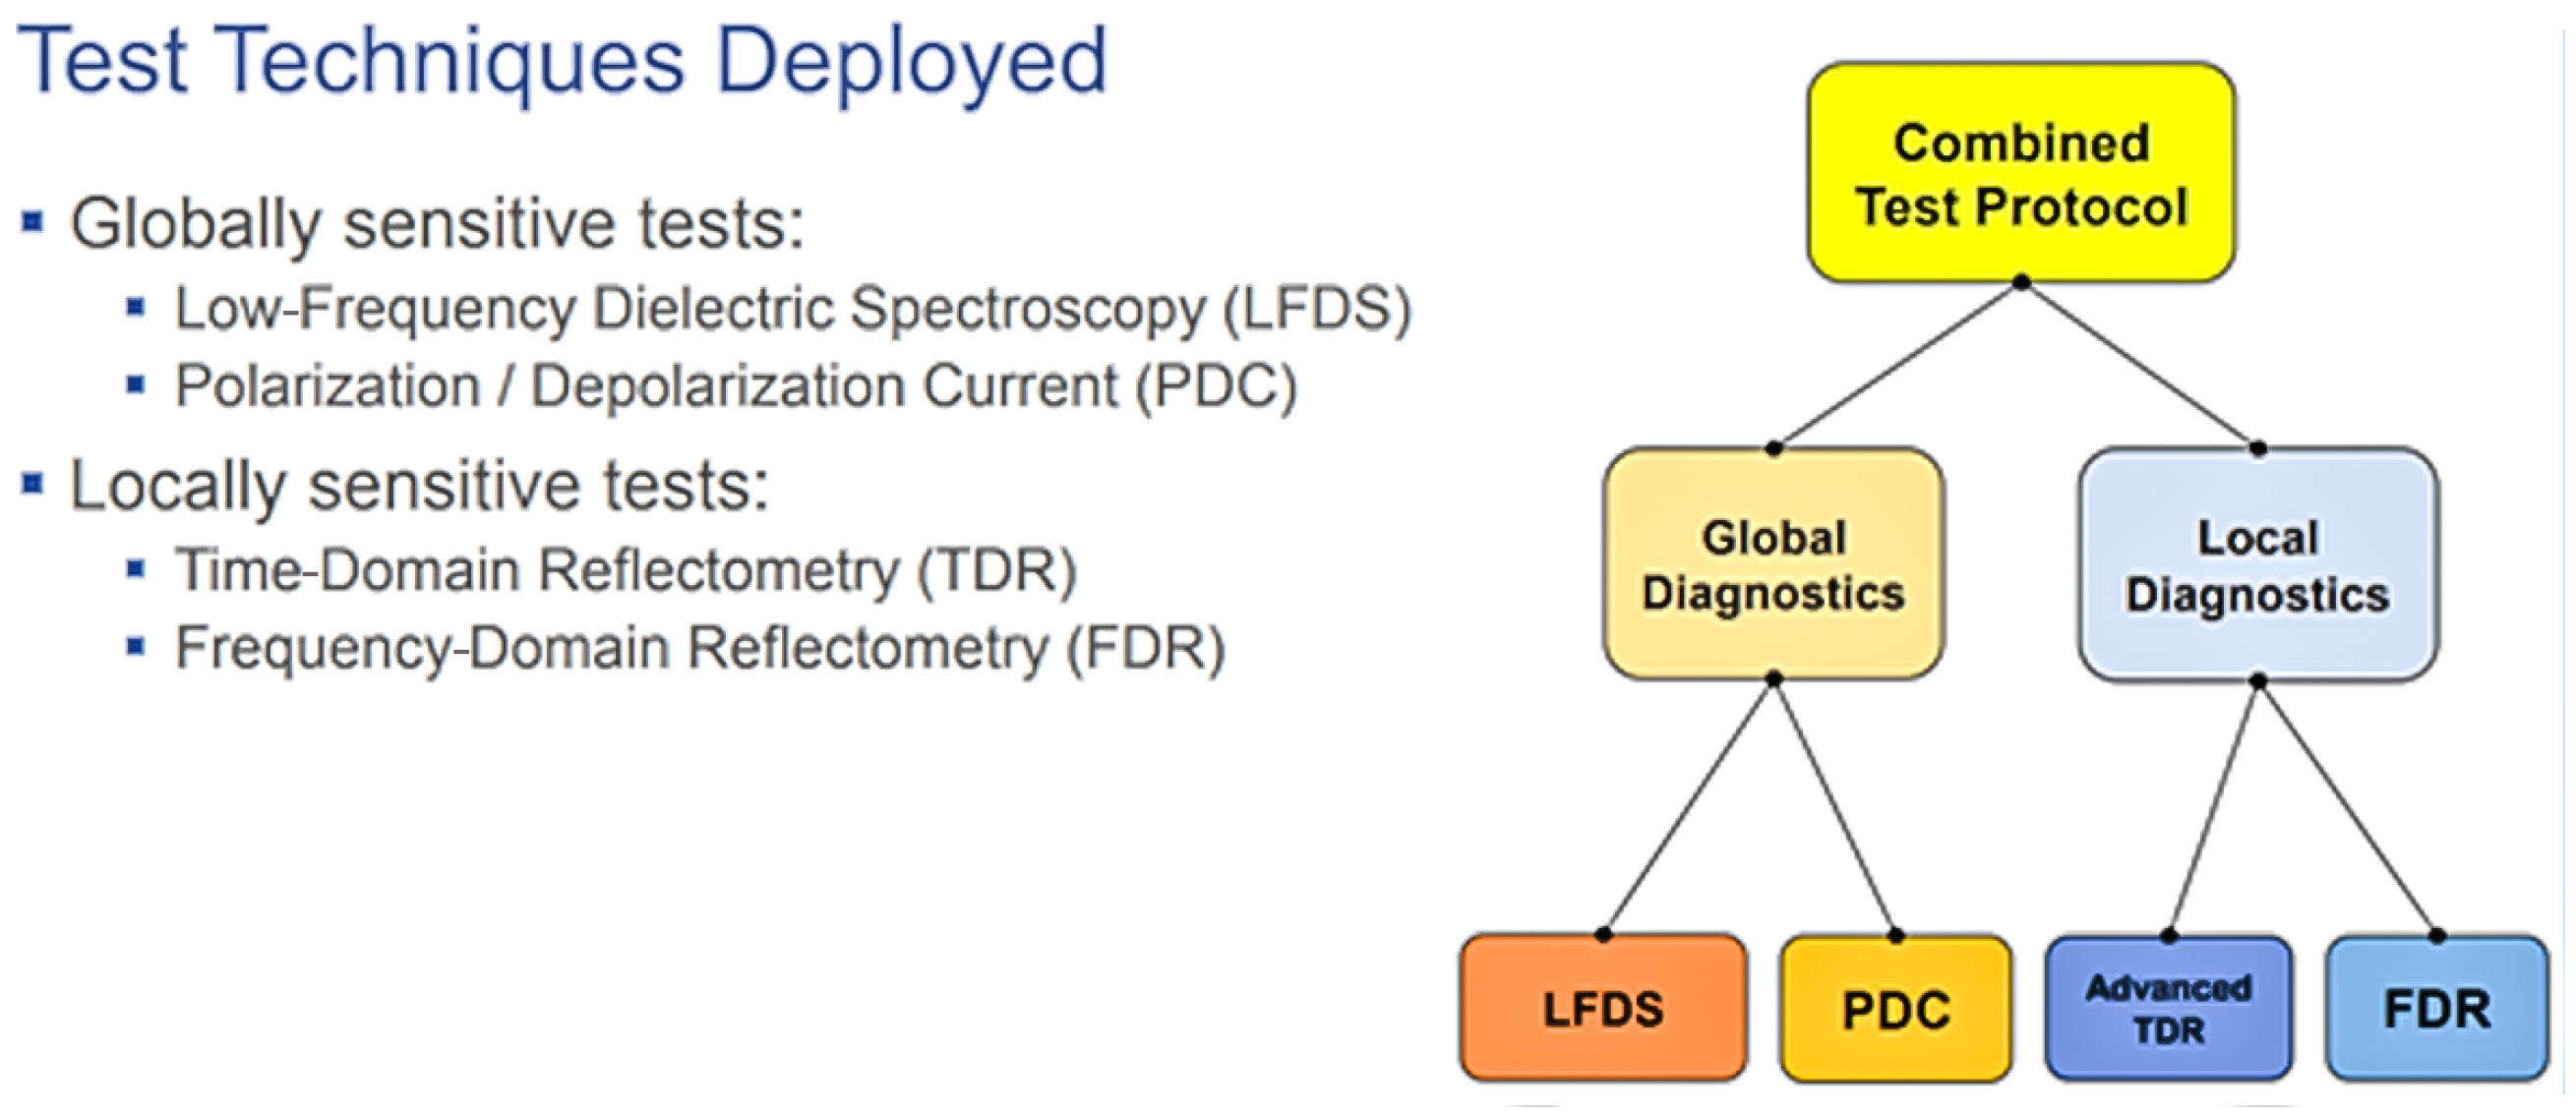
3.3. Performance Metrics of Off-Line Testing Technologies
It should be noted that some methodologies are suitable for localized fault detection (e.g., combined TDR and FDR diagnostics) and other technologies provide global cable condition assessment (e.g., polarization and depolarization current (PDC) measurements); therefore, cable condition monitoring technology require integration strategies to achieve multi-parameter collaborative diagnosis. This concept is shown in
Figure 9.
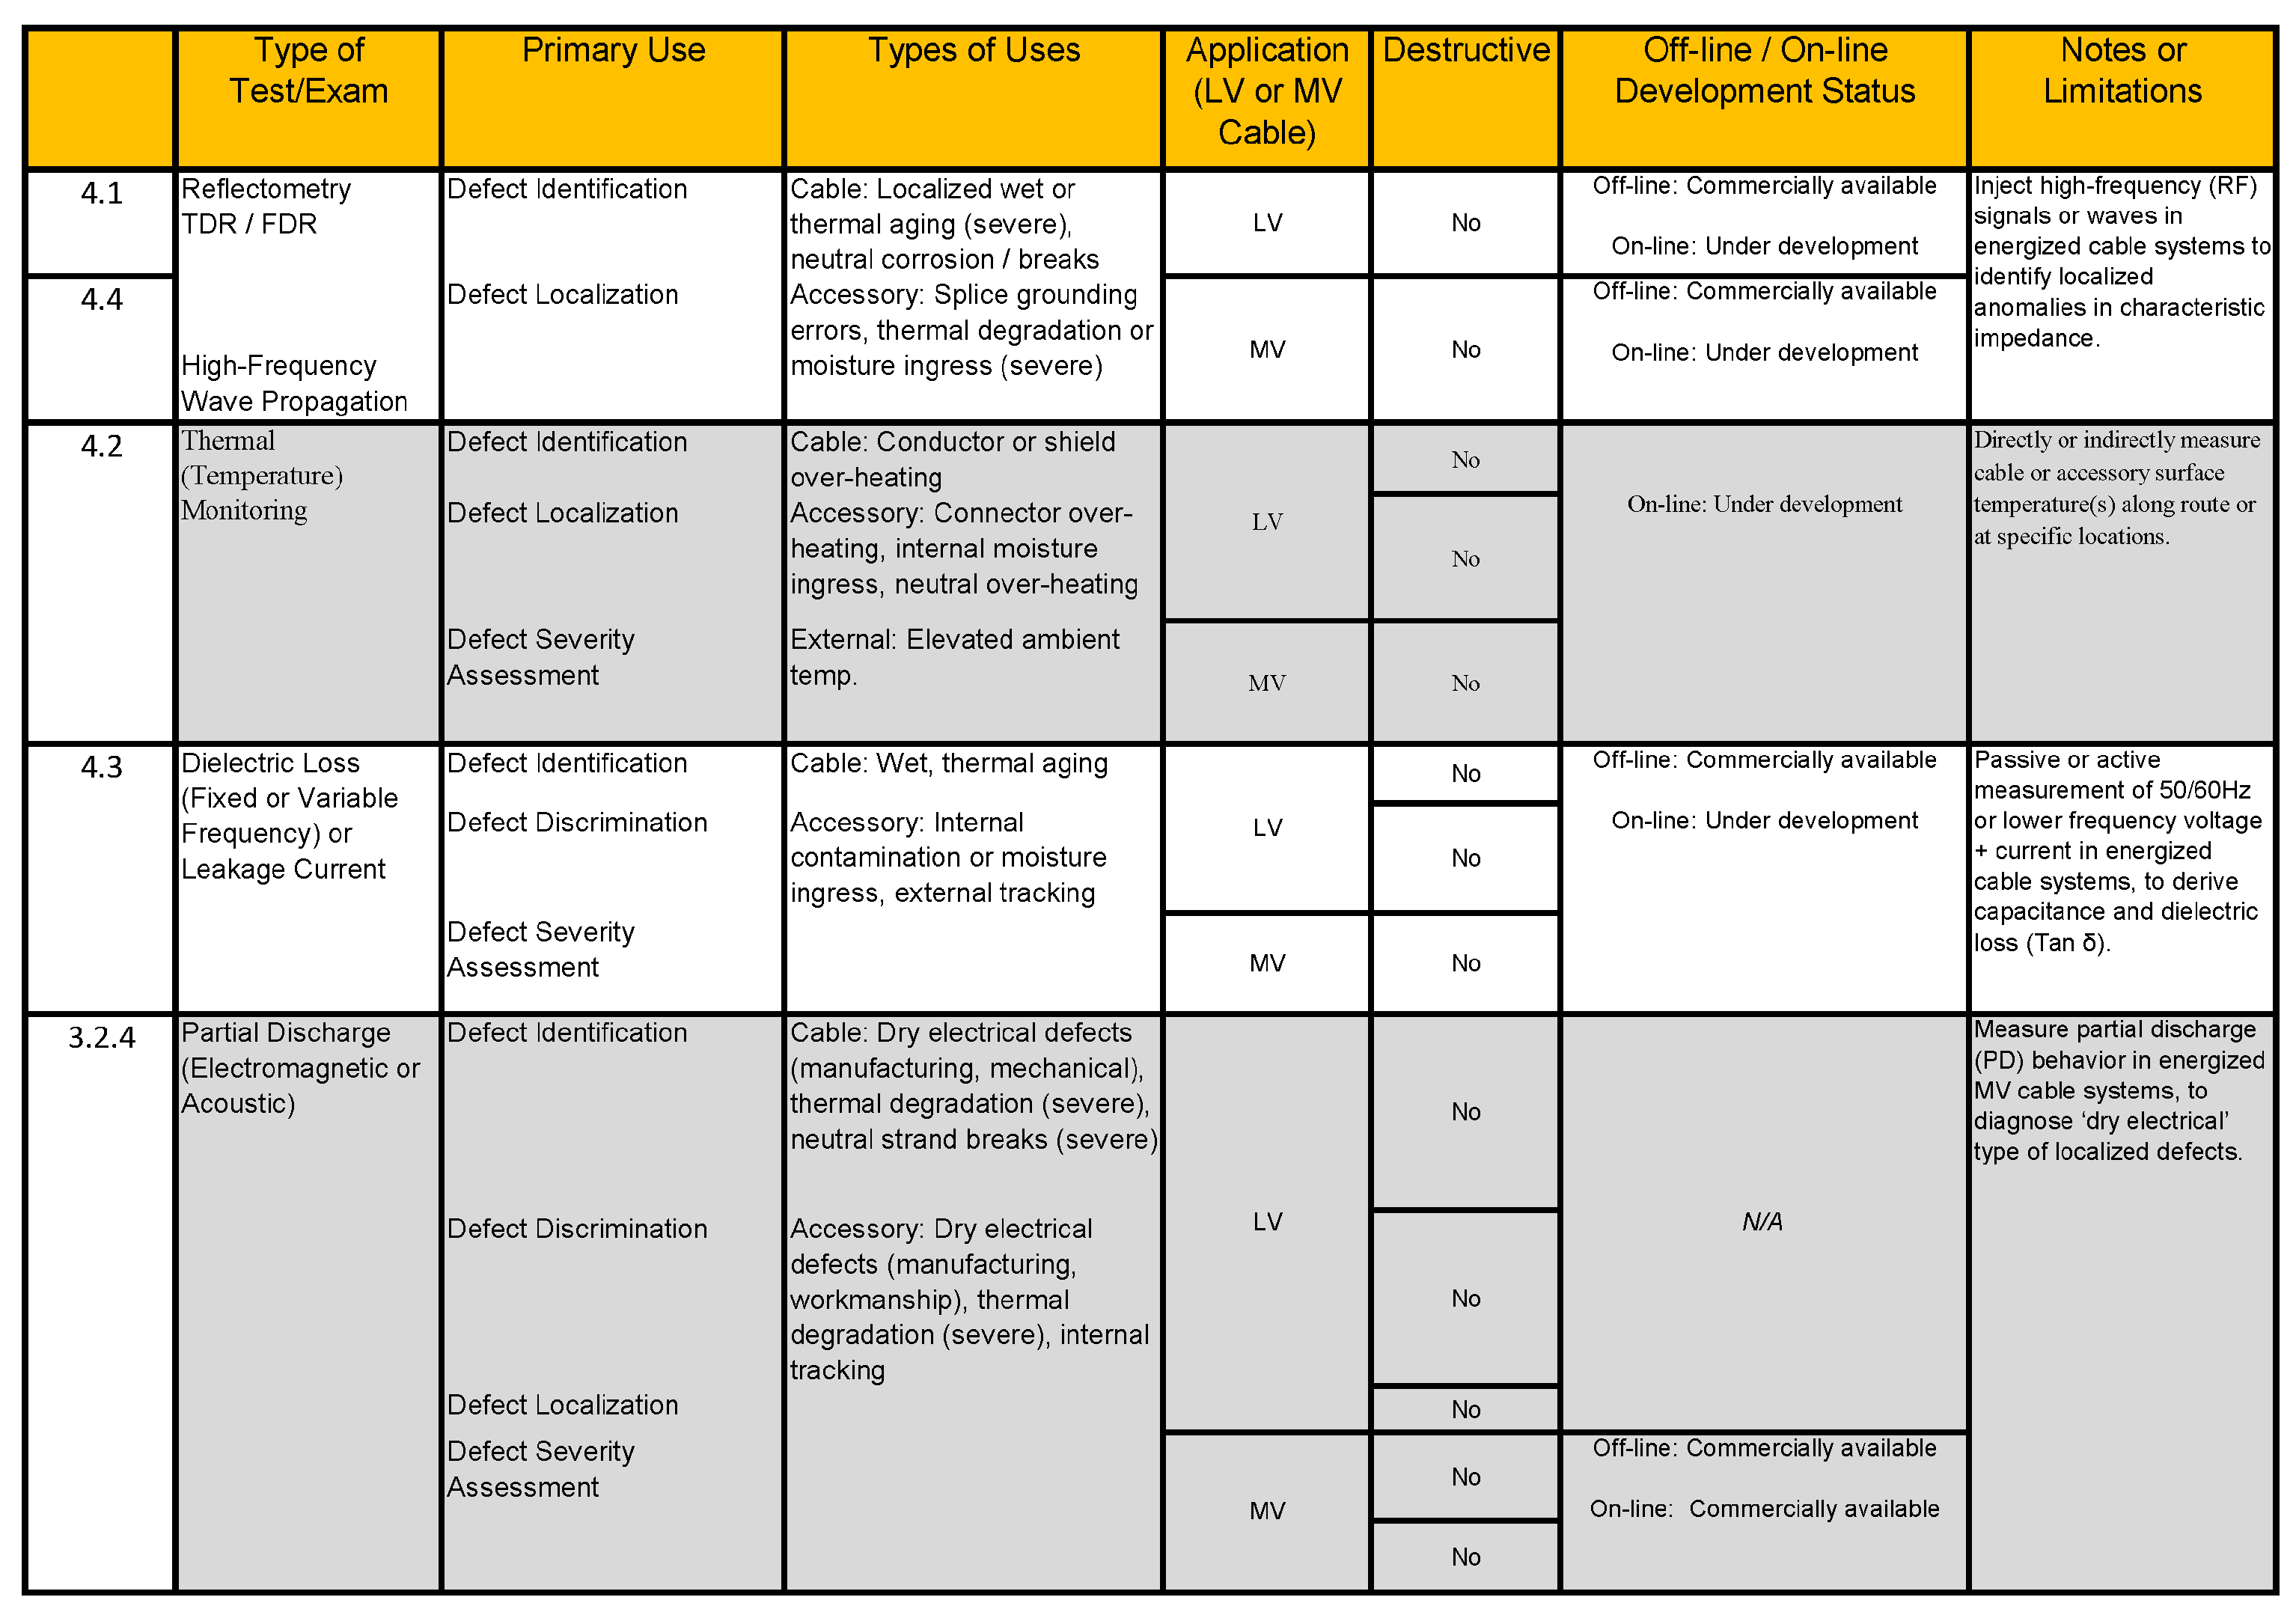
The performance metrics of the main off-line cable testing and condition assessment technologies (e.g., primary use, accuracy, application scope, destruction, or in situ use) are shown in
Figure 10.
A brief overview of on-line cable testing methods is explained in the next section.
4. On-Line Cable Assessment/Testing Techniques
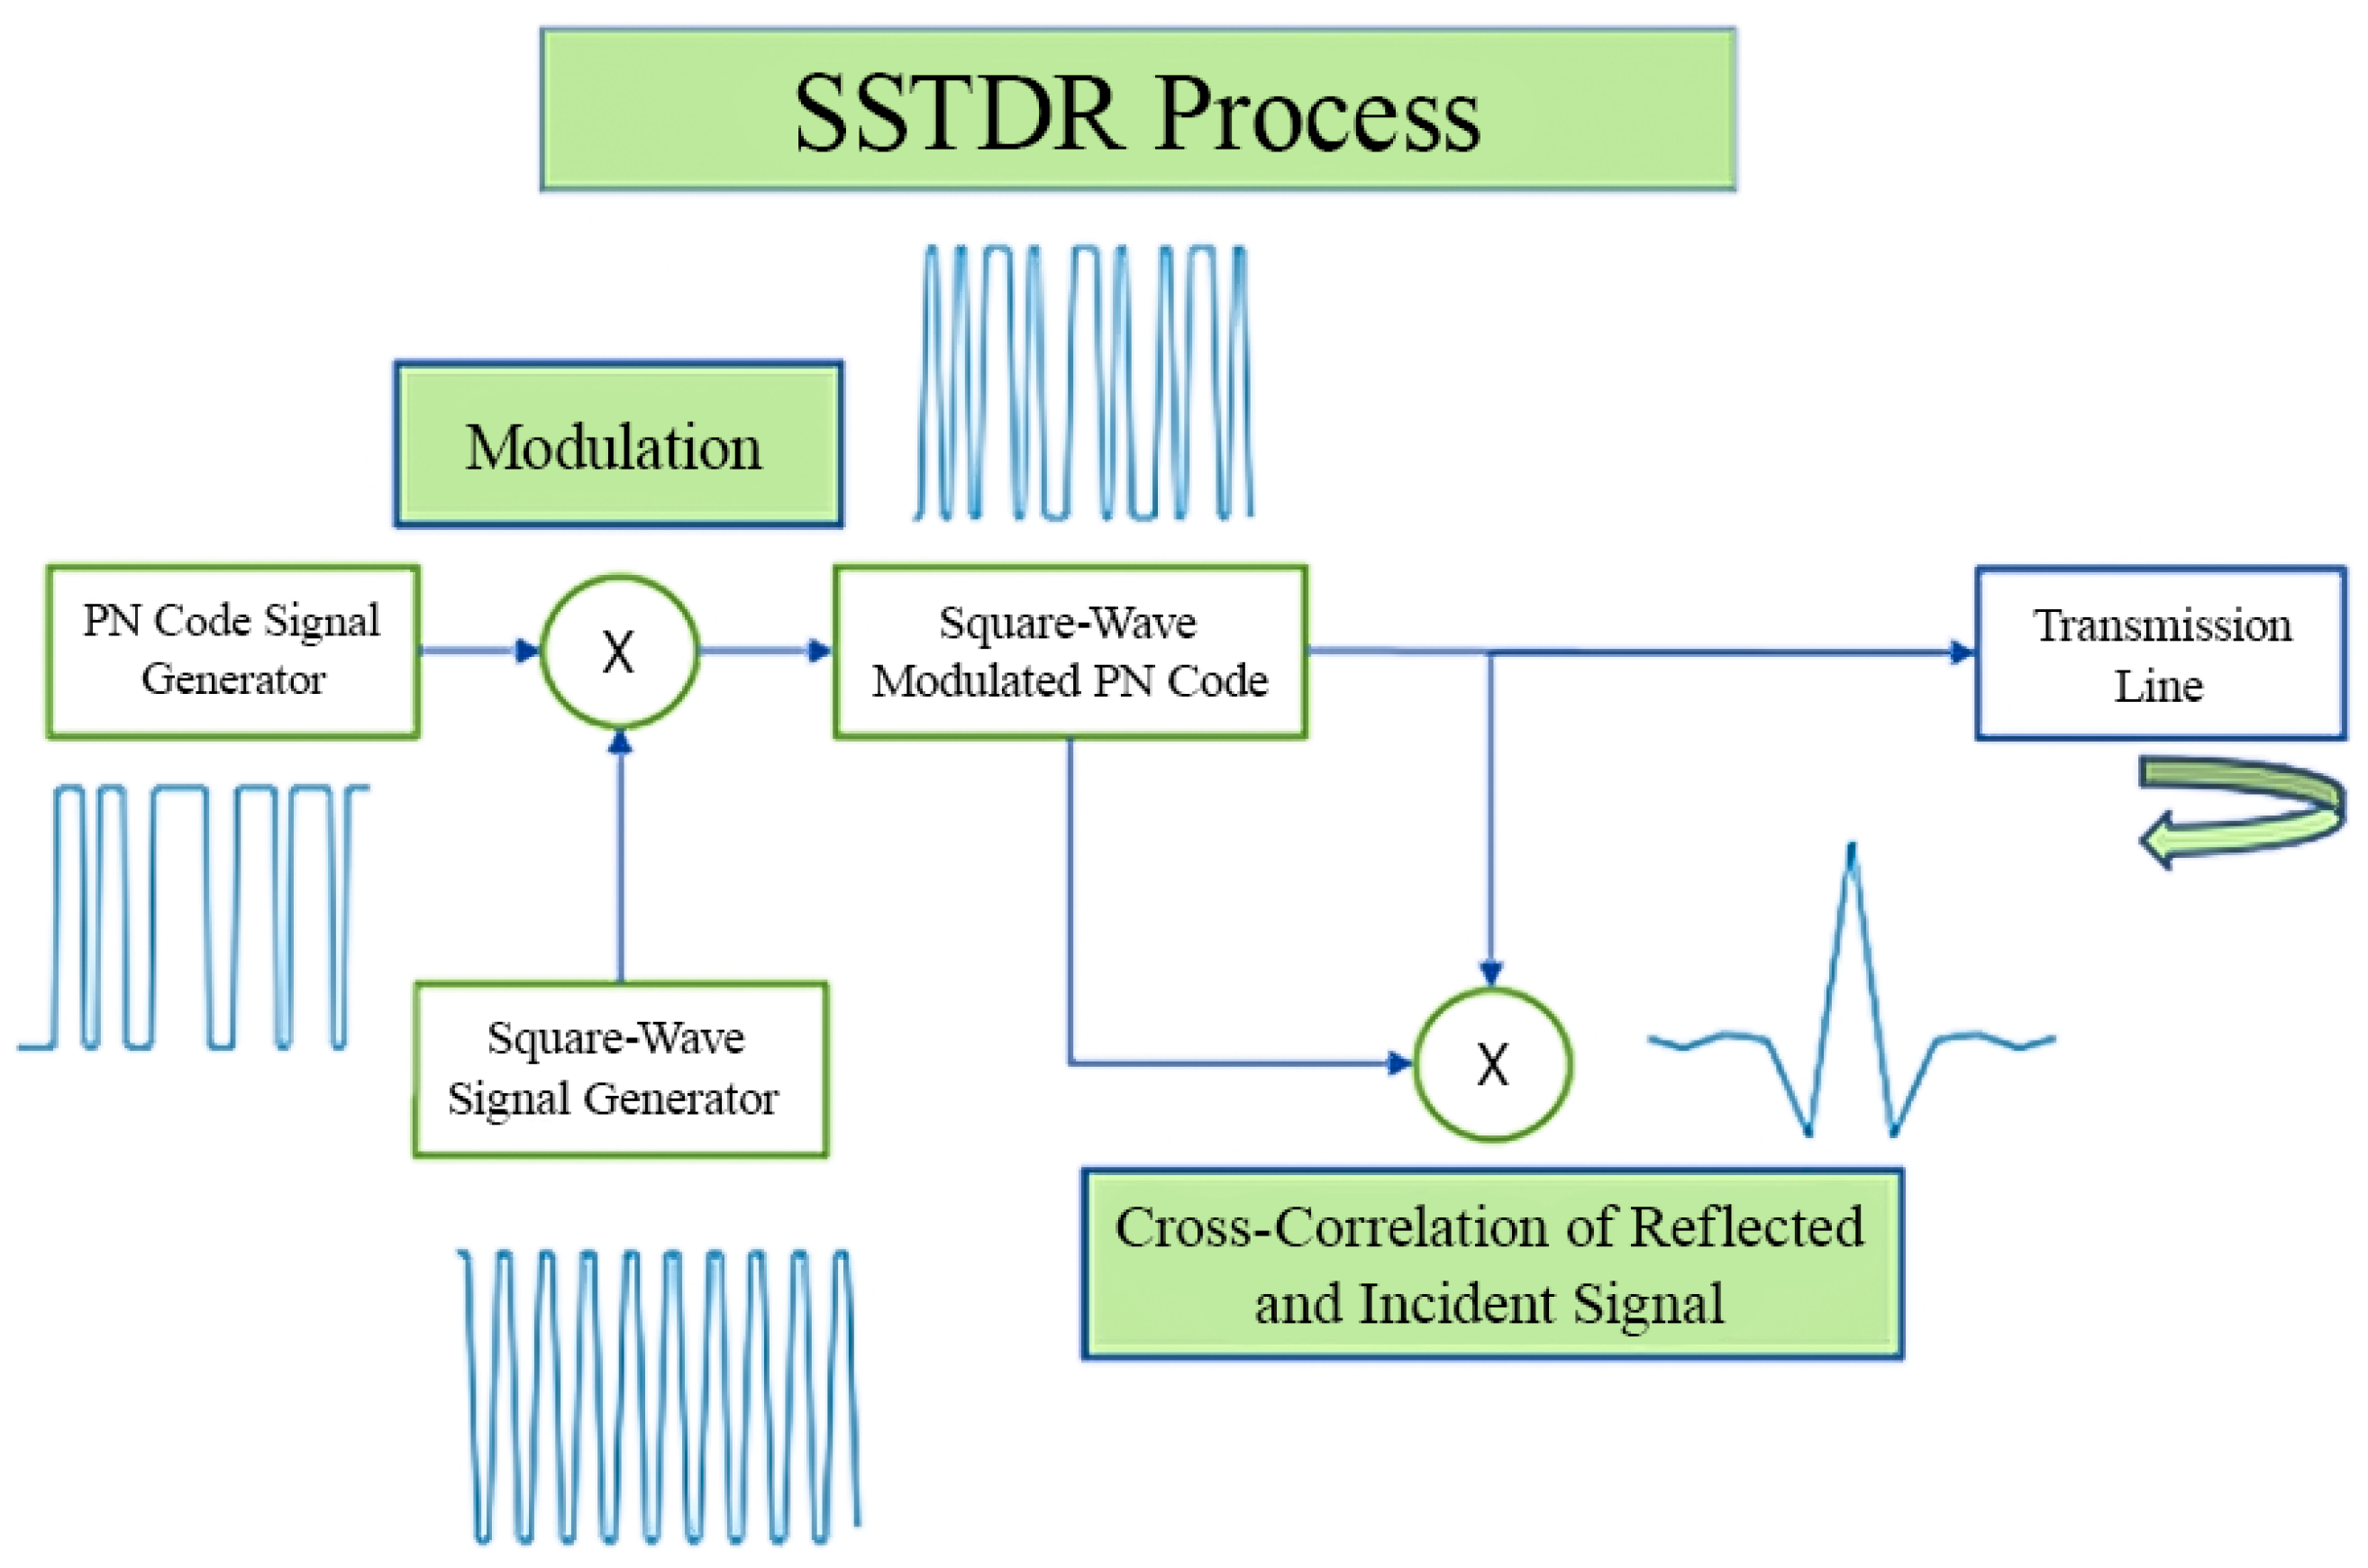
While off-line testing techniques provide precise diagnostics of LV/MV cable assets, they require cables to be disconnected at both ends and de-energized, making them impractical for certain plant applications due to time and access constraints. Consequently, on-line plant cable monitoring has gained significant interest, particularly in the refurbishment and maintenance of existing NPPs and the development of Small Modular Reactors (SMRs). Monitoring cable conditions in real time during active operation supports predictive maintenance, enabling timely replacement during scheduled outages. This section reviews commercially available technologies and recent research on the live-power testing of LV and MV cables, with a focus on their applicability to nuclear power plant environments. Recent advancements in high-frequency reflectometry-based measurement techniques for energized LV and MV cable systems, specifically for detecting localized impedance anomalies based on transmission line theory, are examined. Currently, few commercialized technologies exist for LV cable monitoring, as most were initially developed for non-nuclear industries such as aviation and railways. However, spread spectrum time-domain reflectometry (SSTDR) has recently garnered increased attention within the nuclear sector. The process overview of SSTDR is shown in
Figure 11.
4.1. Spread Spectrum Time-Domain Reflectometry (SSTDR)
An on-line SSTDR cable fault detection method was proposed for ARINC bus cables [
25]. The cables of interest were for low-speed, one-way ARINC 429 and high-speed ARINC 825 bus cables, both commonly used for transmitting data to an aircraft’s avionic system. Incident SSTDR signals were developed based on the cable characteristics at frequencies of 50 MHz and 100 MHz for both the 429 and 825 cables, respectively. The proposed method was validated in both the time and frequency domains using experimental tests on cables containing open- or short-circuit faults, with fault positioning accuracy being found to increase with distance to the fault.
A fault location and detection method was developed using FDR in HV submarine cables [
26]. The technique was compared with traditional TDR methods, and it was found that FDR had greater short-circuit detection performance, along with an ability to detect slight impedance changes within the cable such as slight changes at turn points and joints.
4.1.1. SSTDR and Back-Propagation (BP)
A SSTDR- and Back-Propagation (BP)-based fault detection and diagnosis method was proposed for on-line PV solar-array cable testing [
27]. SSTDR was first used to detect the faults, from which the BP network identified if the fault was either an open-circuit, short-circuit, or grounding cable fault. The benefit of this approach is that output and environmental parameters do not require additional sensors nor illumination to detect/diagnose the cable faults. Upon experimental testing, the BP neural network fault diagnosis overall showed adequate performance while accurately identifying up to 90% of the short-circuit faults and 70% of the open-circuit faults.
An inductive directional coupler for SSTDR was proposed to improve the detection accuracy of non-intrusive on-line cable diagnosis [
28]. A capacitive trapper and inductive coupling method was used to prevent the detection signal from transmitting to the power source. Two couplers along with an impedance matcher were required to produce a reflected signal large enough for detection. The directional coupler also required the mutual inductance and trapper capacitance to be higher than their individual limits, which was dependent on the type of signal used and the cable material. Extensive experimental tests were conducted to compare the inductive coupling technique to an existing capacitive coupling diagnosis method. The detection rate of the capacitive coupling method decreased with cable distance; however, the inductive coupling method remained within
for both open- and short-circuit cable faults.
4.1.2. Discrete-Time Chaotic SSTDR
An intrusive synchronous on-line multi-cable diagnosis method was proposed using discrete-time chaotic SSTDR for various intermittent fault types [
29]. Three chaotic sequences and the m-sequence were compared using simulations and experimental tests for synchronous multi-cable fault diagnosis. It was found that the intermittent arc fault coefficient could be increased by amplifying the signal source impedance. The chaotic sequence method also demonstrated good anti-interference capabilities, with the self-/cross-correlation characteristics able to be applied for both single- and multiple-cable intermittent fault diagnosis. The Logistic and Chebyshev sequences outperformed the Trent sequence in terms of self- and cross-correlation characteristics, with the Logistic sequence achieving up to 90% fault detection accuracy irrespective of distance.
An improved SSTDR fault detection method to reduce leaking transceiver signals and the impedance mismatch between a device and cable was proposed [
30]. It was found that an isolated transceiver circuit along with a trapper could reduce interference by 90%, control the transmitted signal direction, eliminate the impedance mismatch, or completely block the transmitted incident signal. The fault detection method operated within the high-frequency range, with experimental tests that showed a short-circuit fault detection ability of up to 200 m for a 5 MHz signal.
4.1.3. SSTDR and Quadratic Correlation Method
A combined on-line SSTDR and quadratic correlation method was proposed to detect and diagnose faults in aircraft cable systems [
31]. The method was simulated in MATLAB’s Simulink model for a low signal-to-noise environment with open- and short-circuit faults. It was found that the cable fault location could be determined with absolute accuracy, while correctly identifying the fault type; however, the data were not verified experimentally. A PV array arc prediction and detection method using SSTDR was proposed [
32]. Experimental tests demonstrated SSTDR’s ability to detect an increase in resistance for a particular location along the cable. These changes could be indicative of an area where a future arcing event may occur and were independent from the total number of cable faults. An autocorrelation algorithm was developed that can be applied for both ground and arcing faults to improve fault detection ability.
4.1.4. SSTDR Scale Transform (ST) and Dynamic Time Warping (DTW)
SSTDR Scale Transform (ST) and Dynamic Time Warping (DTW) algorithms were proposed and compared to account for propagation velocity changes in cables exposed to moisture [
33]. PV array cables exposed to varying amounts of moisture were tested to examine the algorithms’ fault detection capabilities. The ST showed slightly greater robustness to variability than DTW; however, both had comparable performance for a PV array with uniform exposure to moisture. Other environmental factors such as illumination and temperature were not considered. A method for determining the minimum detectable change of impedance and uncertainty window was proposed for SSTDR measurement devices [
34]. The paper provided a methodology on how to determine component variability for when new baseline measurements are needed for small fault detection.
By the same author as that of [
33,
34], reflection coefficients were derived for infinitesimally long impedances and asymmetric transmission lines [
35]. The reflection coefficient magnitude and phase were compared for both theoretical and experimental tests with symmetric, asymmetric, and parallel configurations. The results showed a 99% match for resistor and capacitor reflection magnitudes, while they showed roughly a 70% match for the reflection coefficient phase. This can be extended to evaluate sensors, underground cable networks, and PV arrays.
4.1.5. SSTDR Fault Detection Using Model Parameters
A new method is proposed for SSTDR fault detection and identification, using model parameters developed from experimental SSTDR data [
36]. The modelling method accurately simulated an SSTDR response, with comparisons on PV modules providing similar results to experimental tests. A zero-correlation zone (ZCZ) sequence is proposed to improve on-line SSTDR fault diagnosis in high SNR environments [
37]. Both simulated and experimental results were compared to m-sequencing, with ZCZ achieving higher reliability and more effective noise resistance. The ZCZ sequence kept a 2% false alarm rate and approximately 95% fault detection accuracy and were consistent above a SNR of −10 dB.
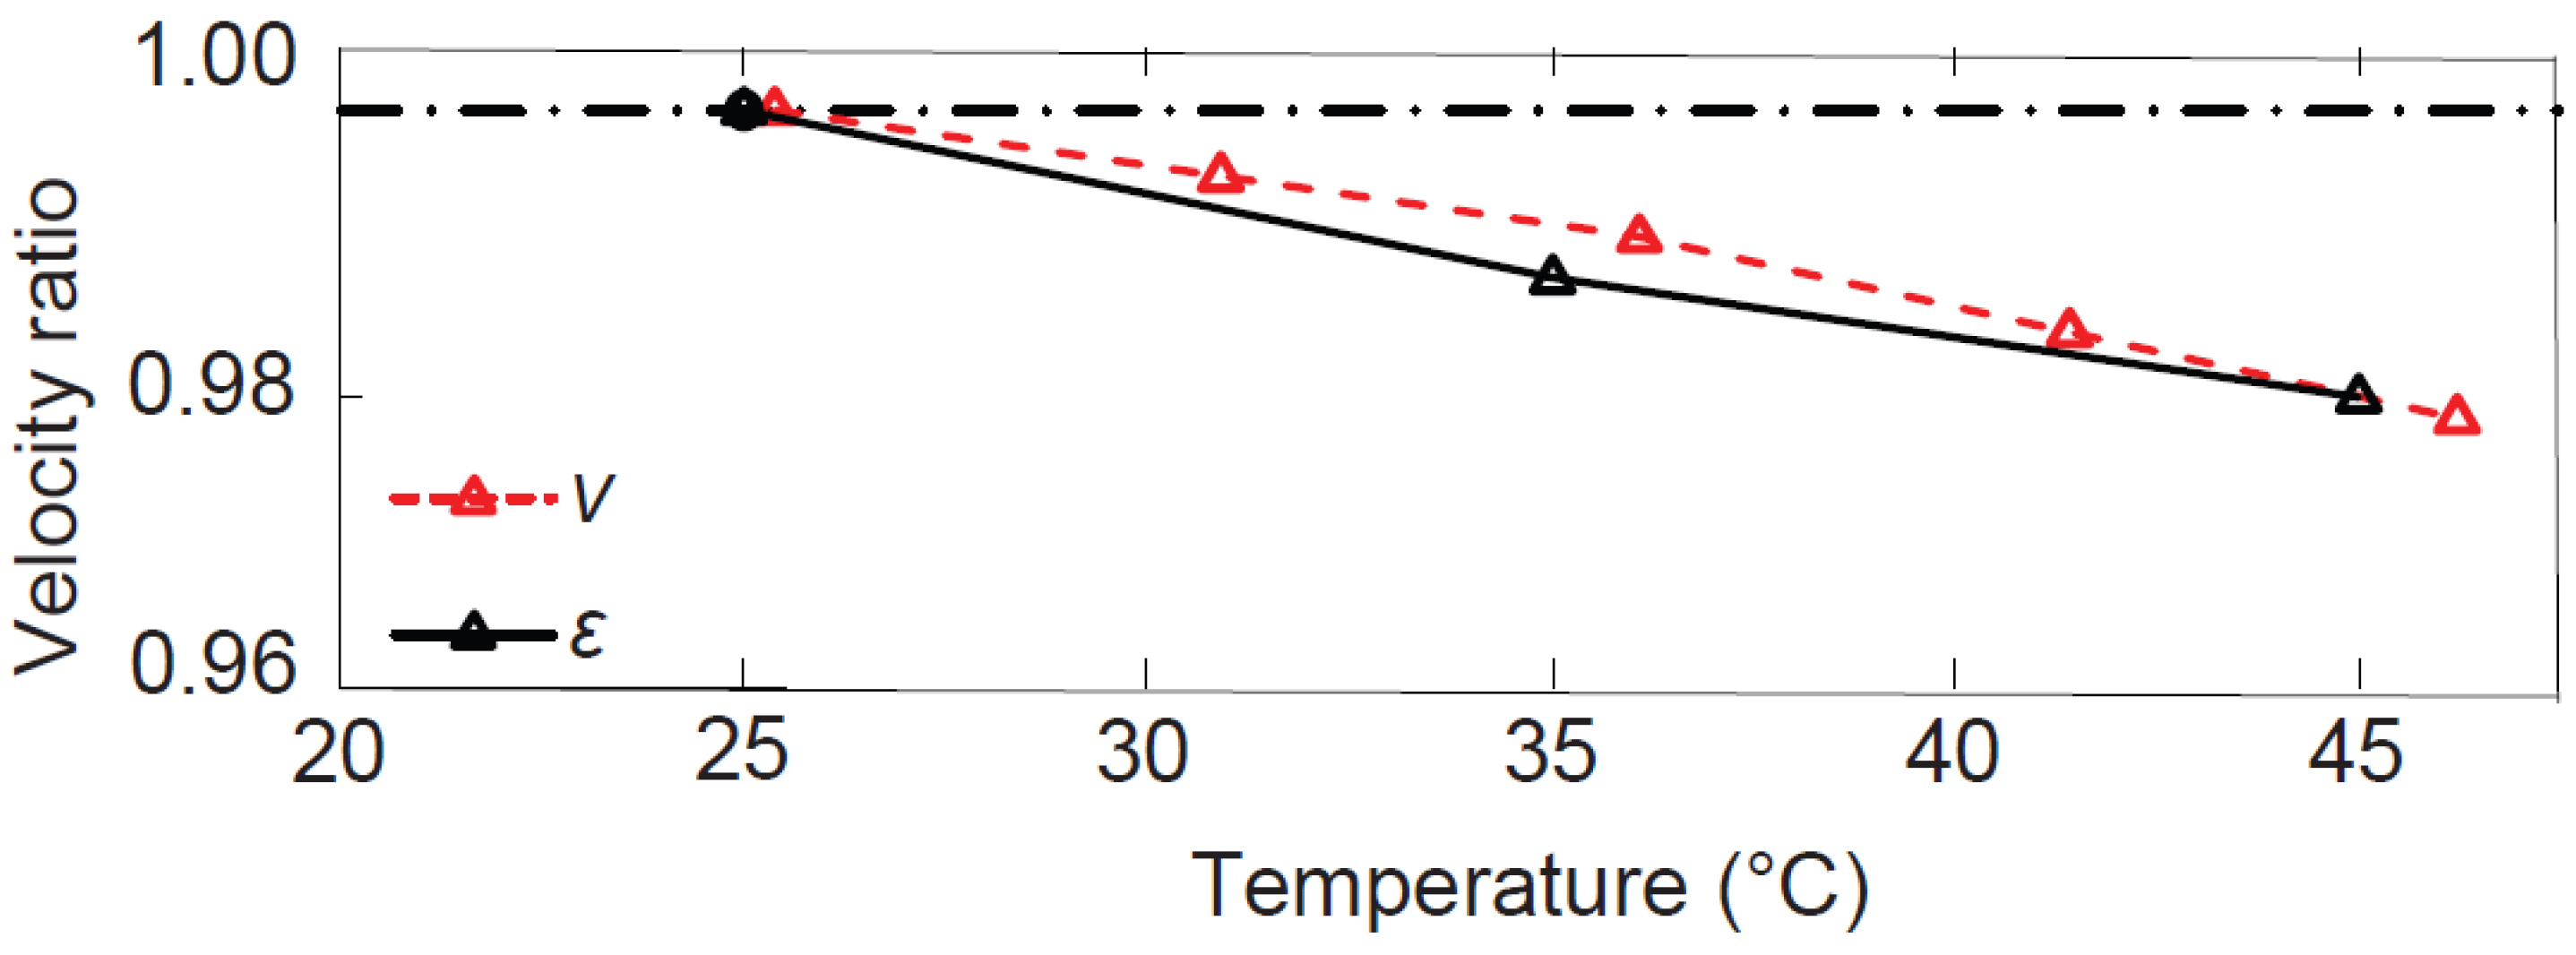
4.2. Temperature (Thermal) Monitoring
Thermal monitoring is intended to identify sources of internal ohmic over-heating in cable metallic components (conductors, splice connectors, metallic shields), severe moisture ingress in accessories (causing dielectric loss-induced heating), or external elevated ambient temperatures. Measurement methods can be direct and localized (e.g., measurement of cable or accessory component surface temperature(s)) or indirect and global (e.g., measurement of cable propagation velocity to estimate average conductor temperature). Equation (
4) shows the propagation velocity (v) of electromagnetic waves governed by the dielectric permittivity,
, and the magnetic permeability,
, of the medium [
38]. Variability in the signal propagation velocity can be employed to detect temperature variation, as shown in
Figure 12 [
38].
where
;
; and
The experiments show that the propagation velocity typically diminishes by 1 percent for every 10 °C temperature rise [
38].
4.2.1. Optical Time-Domain Analysis
A temperature–strain decoupling method was proposed for the on-line temperature measurement of underwater cables [
39]. Using BOTDA and ROTDR measuring devices at the same pulse-width, an interpolation method was used to decouple temperature and strain values. An experimental device was designed to separate temperature and strain simultaneously in order to verify the decoupling method. The loss factor TanDelta is proposed as a parameter for monitoring cable degradation due to it being dependent on frequency [
40]. An on-line conductor temperature monitoring method using BOTDA and a fiber-optical current transducer (FOCT) was proposed in [
41] for underwater HV cables. The FOCT is used to measure the current flow, with the BOTDR-based distributed temperature sensor (DTS) measuring cable surface temperature. An optical cable is in direct contact with the outer jacket of the submarine cable along its entire length, allowing for this method to be possible. The temperature monitoring method has high accuracy and reliability.
An on-line fiber Bragg grating (FBG) temperature measuring system was proposed for power transmission cables [
42]. Laboratory tests showed that the FBG temperature monitoring method could achieve high accuracy with low relative error. The primary benefit over systems such as BOTDR, however, comes from cost comparisons. An on-line monitoring method based on BOTDR was proposed for submarine HV power transmission cables [
43]. Experimental tests showed that strain measurements matched with topography changes where the cable was laid upon. Any Brillouin frequency shifts were primarily due to temperature, strain, and power consumption, with on-line monitoring of the cable being achieved.
4.2.2. Trusted Execution Environment Modeling
To provide thermal cable measurement inputs for TEE models, [
44] proposed an algorithm using end-to-end phasor measurement units (PMUs) for on-line cable resistance and temperature estimation. Current and voltage measurement bias errors were considered in the algorithm, with the proposed method being able to monitor cable temperature to an accuracy of
degrees Celsius. To achieve the thermal monitoring of MV power cables, Ref. [
45] proposed a method to calibrate a TEE model using the dielectric permittivity to estimate cable temperature. Wave velocity measurements were taken from pre-installed fault detection and PD instruments located at both ends of the power transmission cable. The proposed method was tested using XLPE and PILC cables, with temperature estimations using a combination of measured wave velocity data and TEE (thermal modeling). Locational temperature changes were not possible to detect, and there was an overall system accuracy of ±5 °C.
4.2.3. Non-Invasive Monitoring
A fault detection method based on DTS was proposed for the on-line insulation monitoring of MV XLPE cables using external optical fiber [
46]. The temperature distribution throughout the cable was simulated for different degrees of cable degradation. Cable faults would alter surface temperature rise characteristics and would be picked up by the direct-contact fiber-optical cable. The temperature monitoring method was able to detect and locate faults with a 15% error between the simulated and experimental results.
A non-invasive electromagnetic-thermal coupling method was proposed to calculate HV cable–conductor temperature [
47]. FEM software COMSOL [
48] was used to perform a simulated model of a cable. Unlike modeling approaches that use TEE, the effect of changing ambient temperature and load current were considered. These were also used for the development of a conductor temperature calculation method utilizing the temperature difference between the conductor and surface. Simulated conductor temperature results were experimentally verified using an RTDS system attached to the cable surface. The simulation results were comparable to the results calculated with the method, with the simulation having a maximum error of roughly 2 °C.
A distributed simultaneous temperature-and-strain measurement method was proposed based on chaotic BDG [
49]. To circumvent the power fluctuation problem that BGS systems face, as outlined in
Section 1, a birefringence frequency shift (BireFS) was used along with the temperature coefficient of the Brillouin frequency shift (BFS). Taking both of these as parameters, the simultaneous measurement of temperature and strain was achieved. The spatial resolution for a 100 m, polarization-maintaining optical cable was 2.3 cm, with a temperature and strain error of 0.3 °C and
, respectively.
4.3. Dielectric Loss Monitoring
There are no commercialized technologies in this area; hence, the focus of this review is on identifying the most promising technology options for development, validation, and benchmarking for potential use within an NPP cable monitoring context.
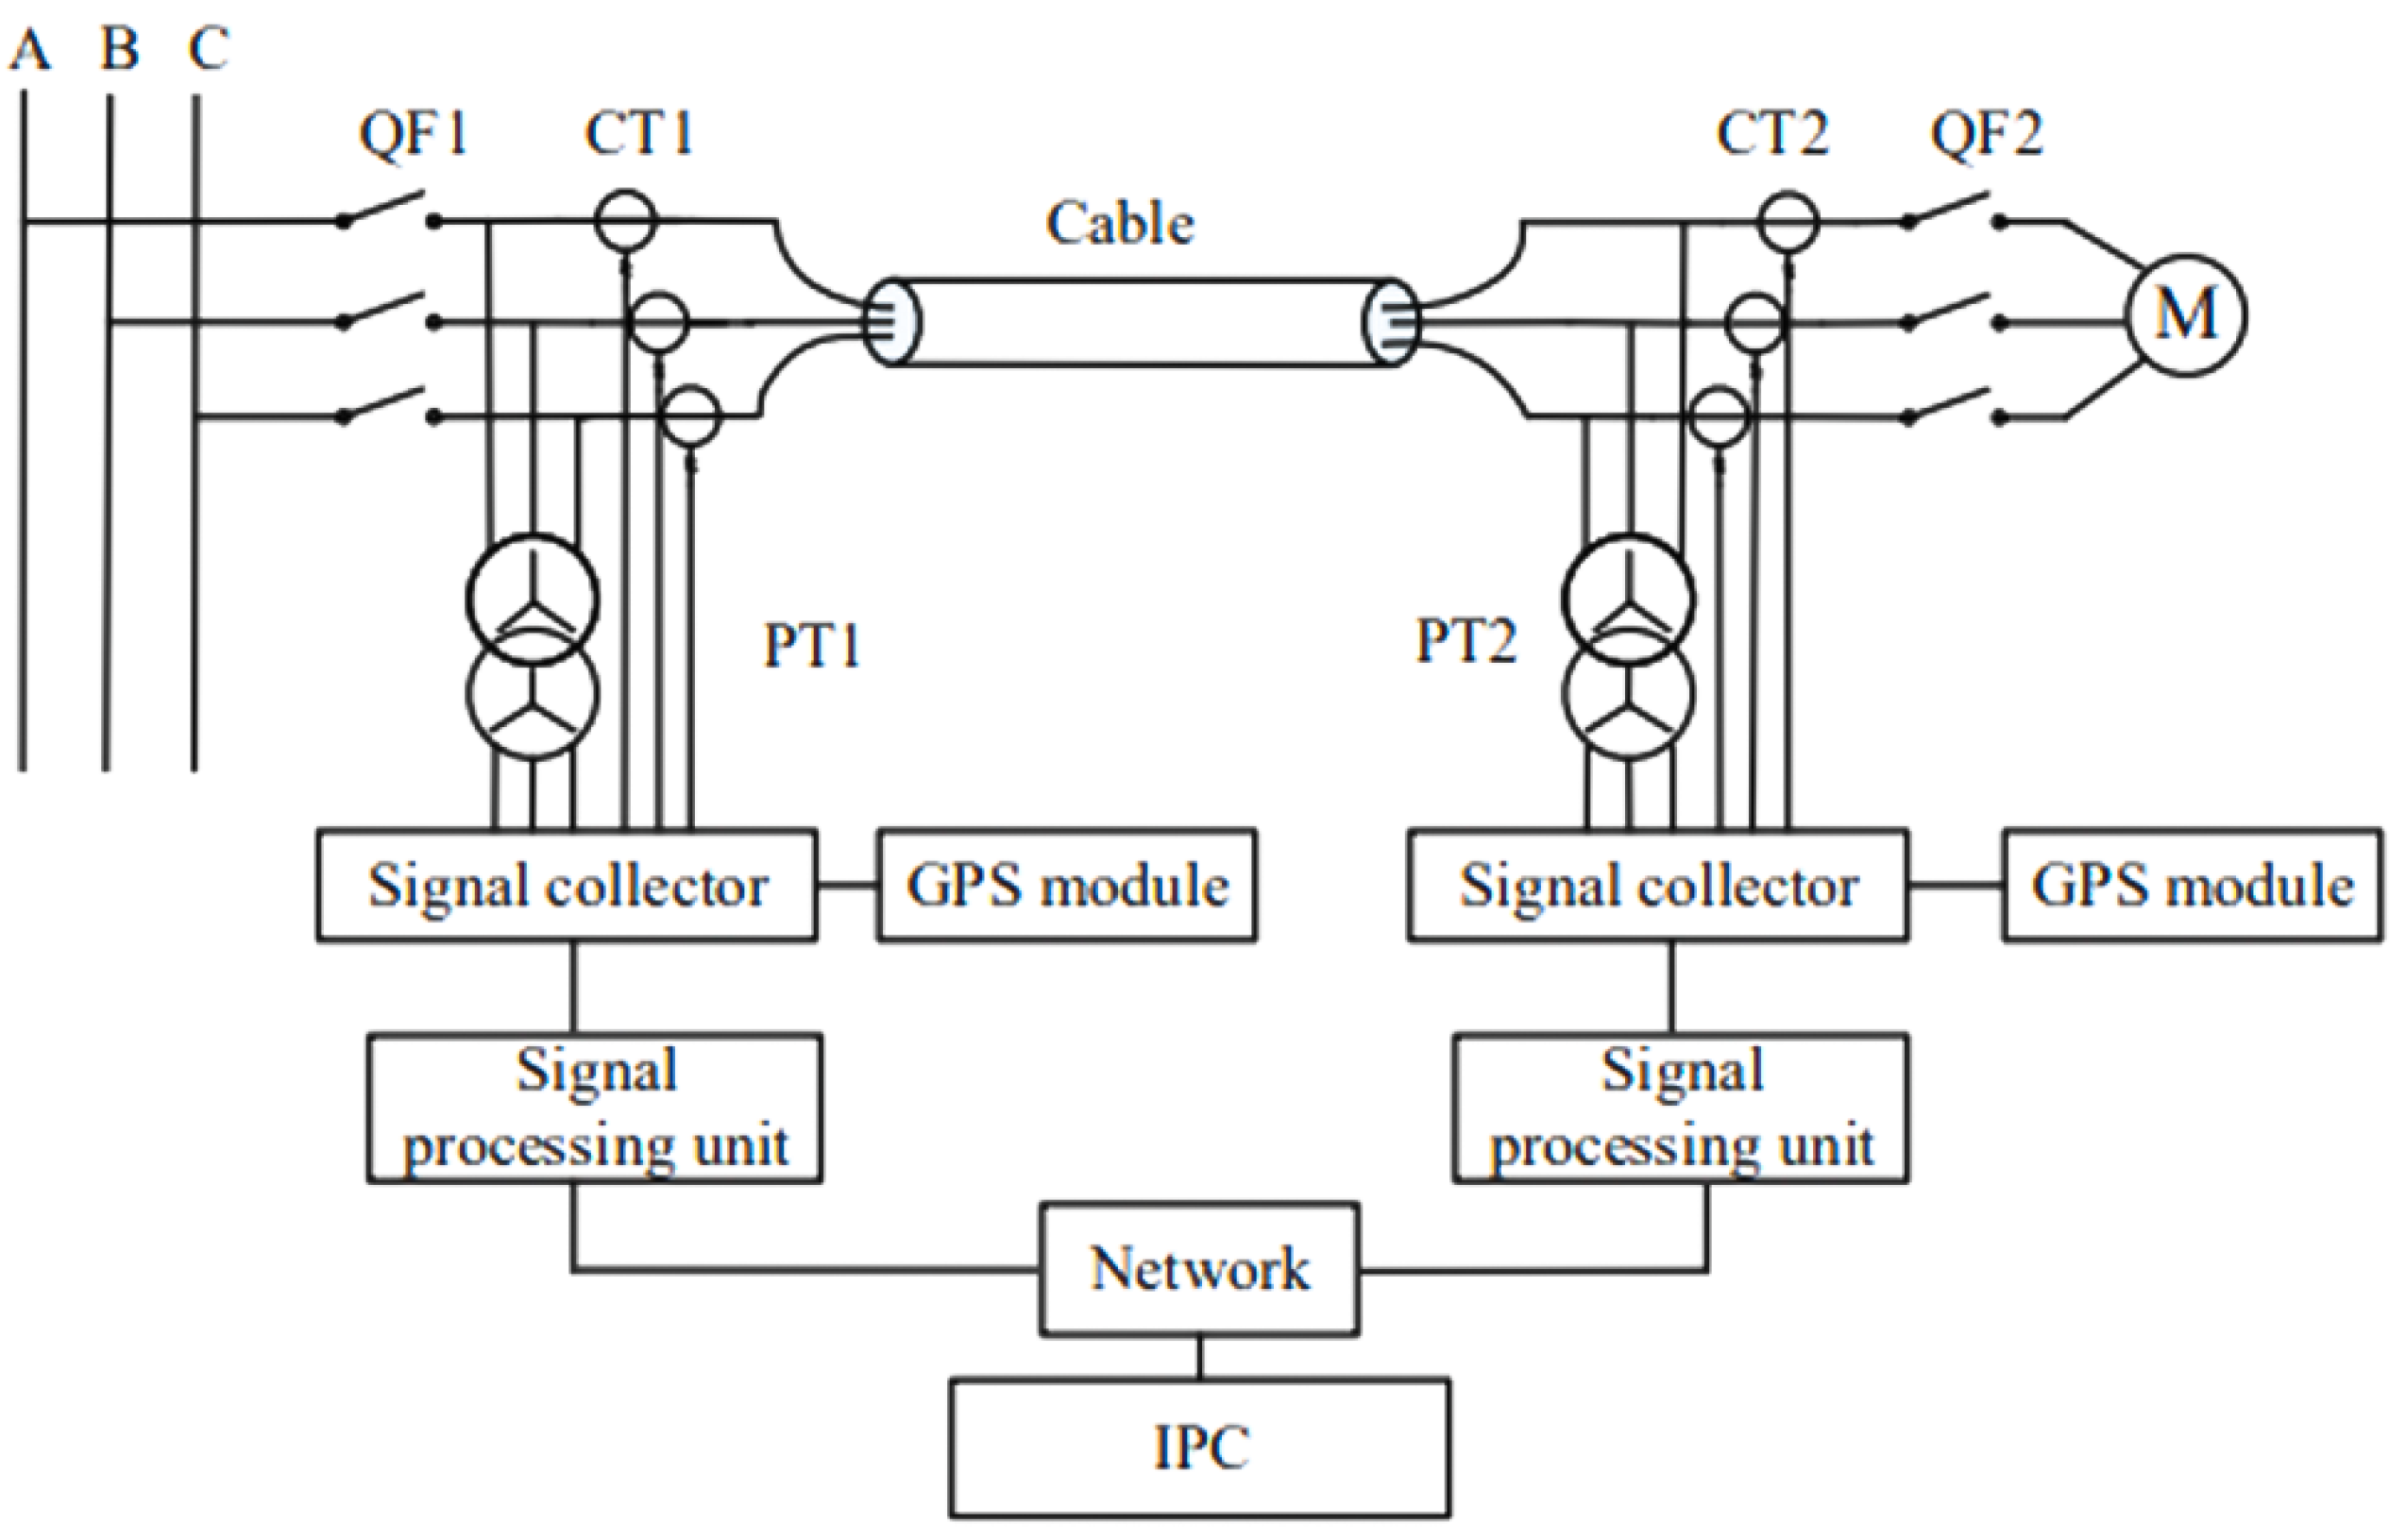
An on-line insulation monitoring method was proposed based on the active back-injection of a controllable, variable-voltage, variable-frequency excitation signal onto an energized line, using a multi-winding PT or alternative transformer-based arrangement [
50]. The result could constitute a low- (e.g., VLF) or variable- (e.g., dielectric spectroscopy) based capacitance and tangent delta measured using an energized MV cable segment, as depicted in
Figure 13.
4.3.1. Common-Mode Leakage
A novel on-line monitoring method based on resonance frequency analysis under chirp signal injection was proposed [
51]. By measuring the induced common-mode (CM) leakage current, the CM admittance could be calculated to provide the resonant frequency. The resonant frequency obtained from the chirp signal was used as the indicative parameter for the cable aging degree, as it can monitor—and not be influenced by—capacitance changes within the cable insulation. Theoretical and experimental tests were conducted to validate the method for different operating conditions.
A novel on-line segmented cable aging detection method using multi-frequency steady-state common-mode (CM) leakage currents was proposed [
52]. The paper developed a segmental aging algorithm based on support vector data description (VSDD), with the multi-frequency steady-state signal injection allowing for segmental decoupling from the normal system. Validation was performed using simulations in MATLAB along with case studies for underground cables of different lengths.
A novel on-line monitoring method for cable aging was proposed based on CM leakage currents [
53]. The authors designed an on-line neutral-point voltage injection and CM leakage current measuring method for quantitative underground cable insulation monitoring. Experimental tests along with PSCAD simulations were performed for validation. The designed sensor was able to detect CM leakage currents of less than 5 mA and was able to overcome an SNR of −72 dB, allowing for the accurate evaluation of aging severity. An on-line insulation monitoring method was proposed based on CM signal injection [
54]. The cable age was estimated from measuring leakage currents using principal component analysis (PCA). A variable-frequency CM monitoring signal injection device was developed to amplify the insulation capacitance to increase accuracy. Experimental and simulations performed using MATLAB [
55] for 10 kV underground cables showed that the on-line monitoring of the insulation could be achieved.
4.3.2. Impulse Impedance Spectrum (PSCAD/MATLAB) Simulation
An on-line monitoring method using an impulse impedance spectrum was proposed [
56]. Low-frequency regions of the impulse voltage and leakage currents were used for insulation performance monitoring. Simulations were conducted on a 10 kV power cable using PSCAD software [
57] along with experimental tests to determine the impulse impedance changes for varying cable degradation states. A comparison of time-varying impedance changes for the initial frequency band allowed cable degradation monitoring to be achieved.
An on-line dielectric loss angle monitoring method was proposed using a low-frequency signal injection method [
50]. By taking the reference phase as the sum of the voltage phasors at both cable ends, the dielectric loss measurement error was reduced. The method was simulated using MATLAB, where a water tree aging model was developed. Unsurprisingly, the loss angle increased with the water tree length, with the loss angle not being affected by grid harmonics. No experimental tests were performed.
A new method to calculate the dielectric constant for a three-core power cable was proposed for insulation health monitoring [
58]. Using a distributed frequency model of a 10 kV cable, the zero-sequence voltage at both ends of the cable was obtained. The cable’s dielectric constant was then determined with a least-squares parameter identification method. Simulated models were generated using PSCAD/EMTDC for validation; however, they were not tested experimentally. A modeling method for reflectometry response was proposed that used FEM to simulate electromagnetic field responses from different aged cable sections [
59]. Experimental data were used to verify the model.
A method to monitor cable insulation degradation was proposed [
60]. A transfer function (TF) was used to identify the degree of insulation degradation, which took monitored, transient-voltage, characteristic inputs from both ends of the cable. Simulations were performed using PSCAD to replicate aging characteristics by changing the insulation thickness and relative permittivity of the cable. Correlation coefficients were derived between different thicknesses and permittivities, and the method was then validated through experimental tests with aged cables.
An on-line cable insulation monitoring method was proposed by estimating cable permittivity from naturally generated signals [
61]. The natural signals were generated from disturbances such as capacitor switching, fault currents, short-circuit transients, etc. A 110 kV cable was used in the simulation, with monitors placed at different cable terminal positions. The cable parameter change was monitored over a period to estimate the degree of cable degradation. Performance increased with the degradation degree; however, disturbances with high-frequency components still resulted in false assessments.
An on-line fault diagnosis method combining time-reversal reflectometry and time–frequency-domain reflectometry (TFDR) was proposed [
62]. Faults were characterized either as low-impedance aging or high-impedance damage faults. Fault-diagnosis simulations were performed using impedance parameters calculated using FEM for a cable model containing defects. On-line testing was not conducted, but experimental verification showed performance superior to that of normal TFDR. A novel detection and location method for aged cable segments using wide-frequency-range TF measurement and deep learning was proposed [
63]. By combing a sparse autoencoder (SAE) and a convolutional neural network (CNN), the aged cable segments could be estimated using data from the TF measurement. Simulations in PSCAD were conducted for two CNN models of cables with varying degrees of aging showed high detection and location accuracy for both models, with estimations errors. However, all the models were trained using hyperparameters which were selected manually and determined by a grid search.
An on-line cable insulation degradation technique based on the harmonic monitoring of MV cables was proposed for moisture-affected cables [
64]. Simulations were performed using COMSOL software to simulate pores and water tree defects in the insulation layer from which the 2nd and 11th harmonics were obtained. A LASSO regression-based evaluation method was then developed to predict cable aging time, which then used the results in a defect recognition algorithm. The results successfully distinguished between water-immersed and normal cable states.
4.3.3. Measured Parameters
An on-line cable insulation monitoring method using measured harmonics was proposed [
65]. By minimizing the difference between the theoretical and measured harmonic amplification factor (HAF), a function was derived relating the HAF to the cable insulation state. The method was validated using data from 110 kV wind farm cables, with harmonic data obtained from both cable ends.
An on-line short-circuit cable fault diagnosis method was proposed by monitoring the magnetic pattern of three-core power cables [
66]. Single-axis tunneling magneto-resistive (TMR) sensors on the outside surface of the cables were used to detect faults, with characterization performed by observing the cables’ magnetic field pattern. Short-circuit faults were identified using a cumulative sum-based method and were validated through experiments and FEM simulations. Although this method could achieve on-line cable monitoring, it was only tested for short-circuit faults and was unable determine fault location.
An on-line cable degradation method was proposed using pulse-width modulation (PWM) switching oscillations generated from inverter-fed machine systems [
67]. An external coil-based HF oscillation sensor was developed to measure differential-mode switching currents. The relationship between the characteristic mode frequency of the switching oscillations and cable capacitance was used to classify degree of cable aging. Theoretical and experimental tests validated the on-line monitoring method and showed high sensitivity for different cable lengths.
A new open-loop digital magnetic modulator was proposed for a DC current sensor used for cable insulation monitoring [
68]. The novelty comes from the digital demodulation technique compared to common analog demodulation methods. The design can minimize measurement errors in the zero offset and variation in the excitation source. The results showed a sensor range of 5–1000 μA, with 0.5 μA absolute error.
A coupling equation was derived between the sheath and core–conductor currents of cross-bonded HV cables to achieve time synchronization and estimate the time delay without external reference [
69]. Using measured current sensor values in an iterative equation, the time delay could be determined by taking the residual value of the comparison between the expected and measured values, which could then be input into a recursive least-squares algorithm for complete time delay estimation. Experimental tests were conducted and successfully verified both the time synchronization and delay estimation.
A non-intrusive PD monitoring technique using Rogowski coils was developed, along with a sensor installation scheme to detect and locate PDs within an MV feeder cable [
70]. Optimal coil design considerations were discussed, and recommendations were detailed following the experimental testing of the Rogowski coil.
A partial discharge location detection method was developed using distributed optical fibre vibration sensors [
71]. The sensor was based on a Sagnac interferometer to detect and locate PDs, which could monitor the entire length of the cable with a single sensing system and was less complex than traditional distributed acoustic sensing systems. Experimental testing found that the sensitivity was dependent on mechanical stability of the interferometer, with stronger signals being generated when better vibration insulation was used.
4.4. Surface Wave-Based Reflectometry
The majority of cable NDE research has focused on the direct-contact reflectometry method to detect and locate various types of faults or damages. In terms of direct-contact NDE cable insulation damage detection, Fantoni et al. [
72] presented an FDR-based line resonance technique that could detect cuts or gouges on the jacket and insulation at a 24 m distance on two and three conductor wires. Ohki et al. [
73] applied a direct-contact FDR-based technique to detect removed insulation and polymer sheathing over a length of 10 cm at a 10 m distance in a duplex cable with 2 mm
2 cross-section conductors, 0.8 mm-thick insulation, and a 1.5 mm-thick jacket. S. Arman, W. Glass et al. [
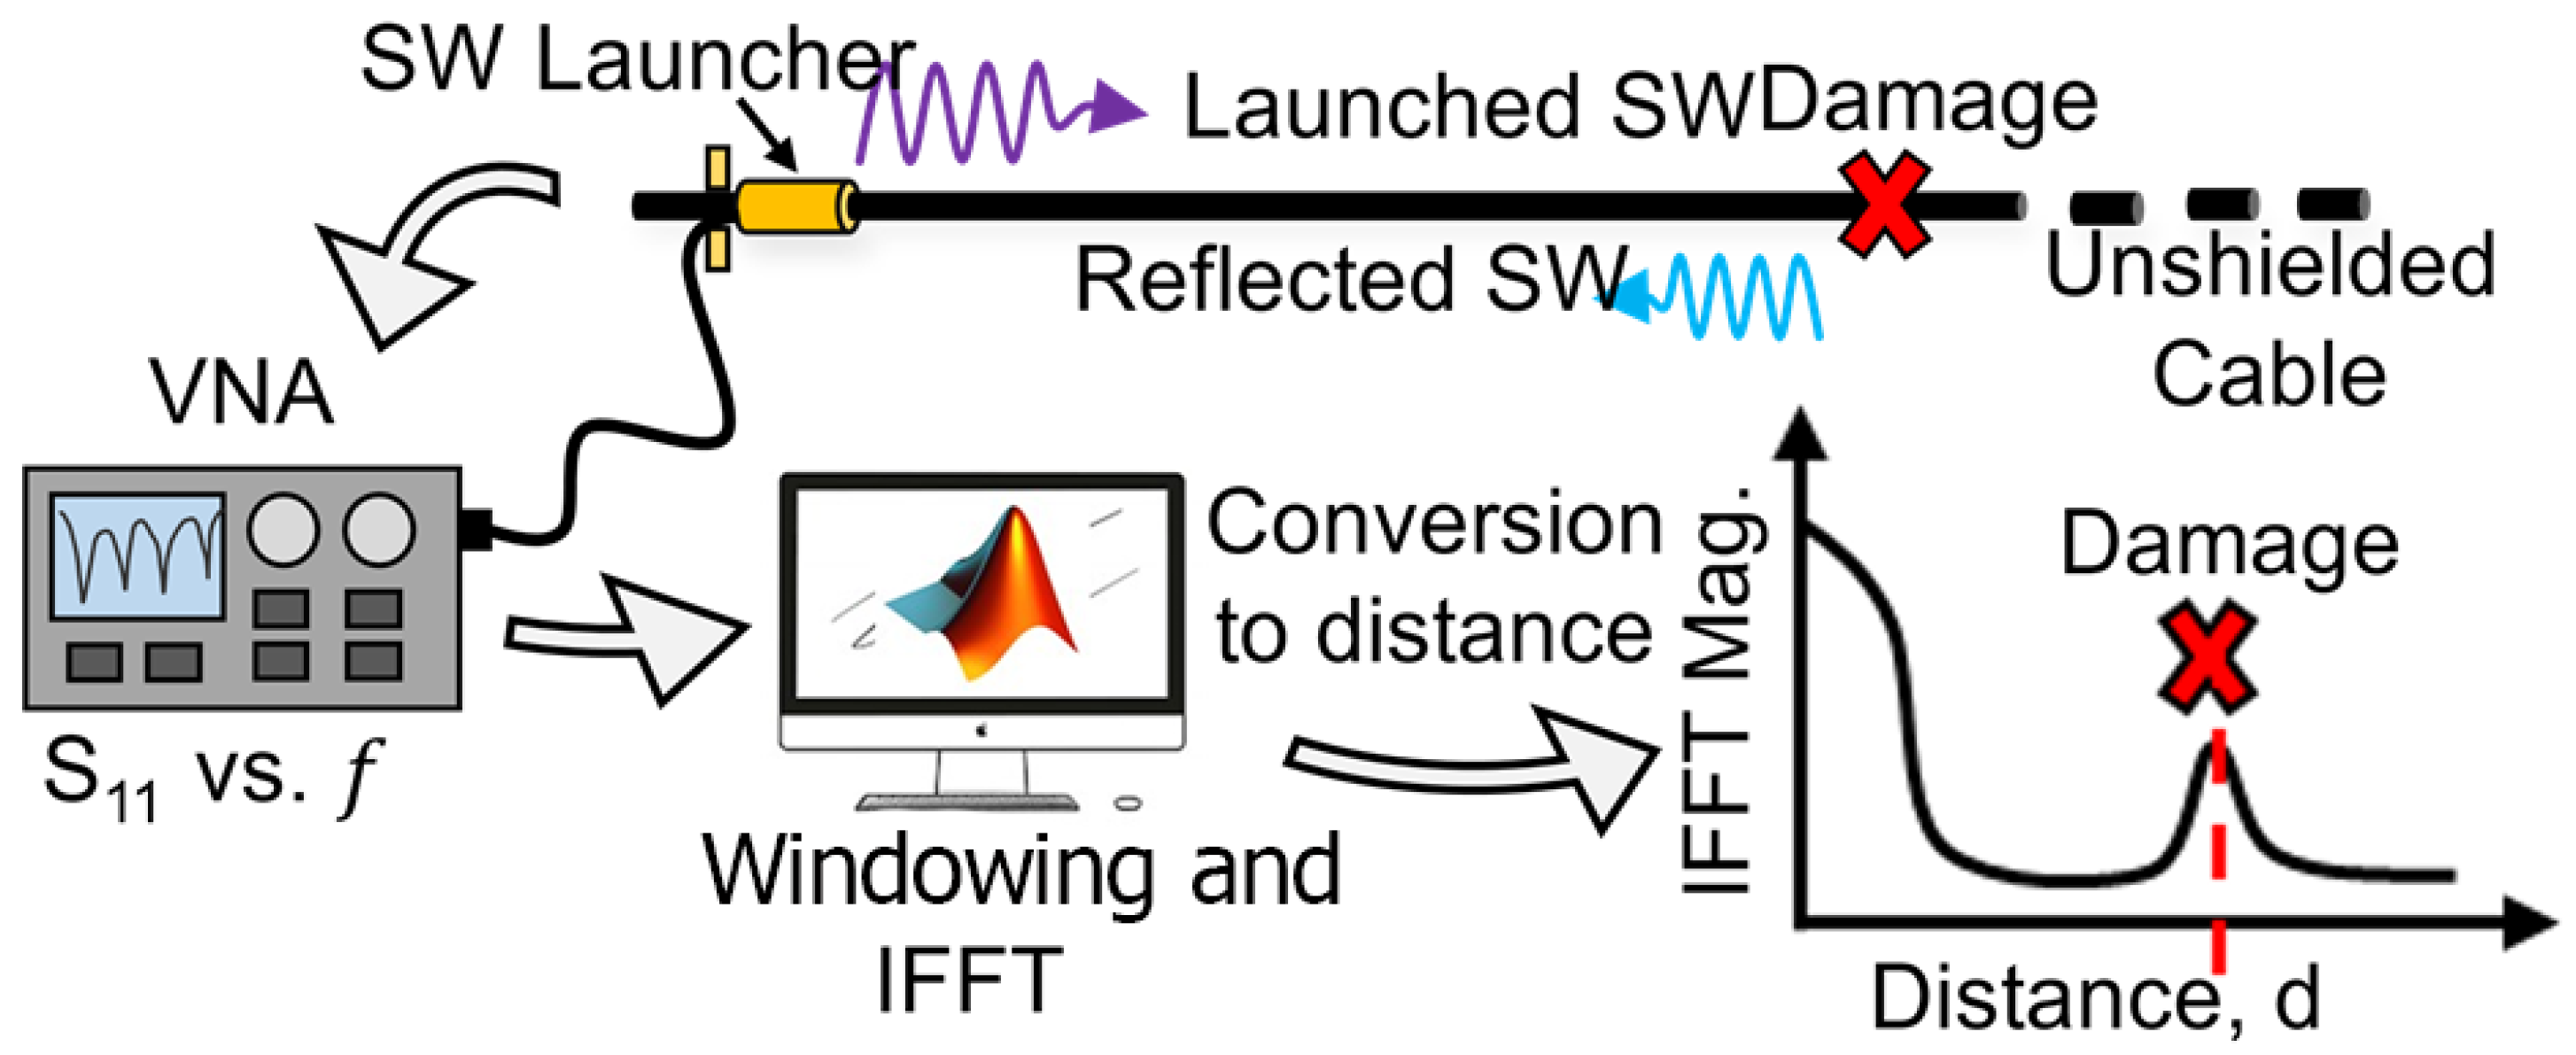
74] presented a non-conductor-contact surface wave-based reflectometry technique to detect and locate missing or damaged insulation and/or jacketing for electrical cables. Surface-wave launchers transfer electromagnetic energy in the form of ‘surface waves’ in the GHz range into a non-shielded cable, as depicted in
Figure 14.
In the case of the non-conductor-contact cable NDE technique, the magnitude of the reflection coefficient would be small and would largely depend on the damage size, damage location, cable insulation type, insulation thickness, and cable type. S. Arman, W. Glass et al. [
74] proposed both a 1 GHz and a 7 GHz cable that could be used to detect insulation damage in a thick and a thin cable, respectively. They demonstrated that higher frequencies allowed for the detection of damage with smaller resolution, while lower frequencies allowed detection over longer distances, especially for large-diameter cables. The instrumentation utilized a non-conductor-contact surface-wave launcher consisting of a cylindrical monopole, and a ground plane was connected to a vector network analyzer (VNA). A sinusoidal swept frequency broadband signal with an appropriate frequency range was excited between the monopole and the ground plane, which caused the generation of surface waves that propagated along the length of the cable. The surface waves, upon reaching the location of the damaged or missing insulation, were reflected and then subsequently picked up by the SWL technique, as shown in
Figure 15.
The results were measured by the VNA as complex S11 as function of frequency. After applying a specific window (Kaiser window) on the complex S11, the inverse Fast Fourier Transform (IFFT) was performed to determine the location of the insulation damage. The simulation results showed that the magnitude of the peak of the IFFT response that was obtained by postprocessing the complex reflection coefficient vs. the frequency characteristics measured by the launcher could identify the location of damage. This method is adaptable to thin, moderately thick, and thick cables. The launcher and its operating frequency need to be designed accordingly, e.g., for thin wires shorter launcher and higher frequency vs. for thick cables longer launcher and lower frequency will be needed. [
74].
4.5. Performance Metrics of On-Line Testing Technologies
The performance metrics of the main on-line cable testing and condition assessment technologies (e.g., primary use, accuracy, scope of application, development status) are shown in
Figure 16.
5. Discussion/Conclusions
The reviewed literature highlights substantial advancements in both on-line and off-line cable monitoring techniques. Current plant inspection techniques involve the physical inspection of plant cables, as shown in
Figure 17, related to different off-line cable assessment/testing techniques that are performed prior to and during NPP refurbishment activities.
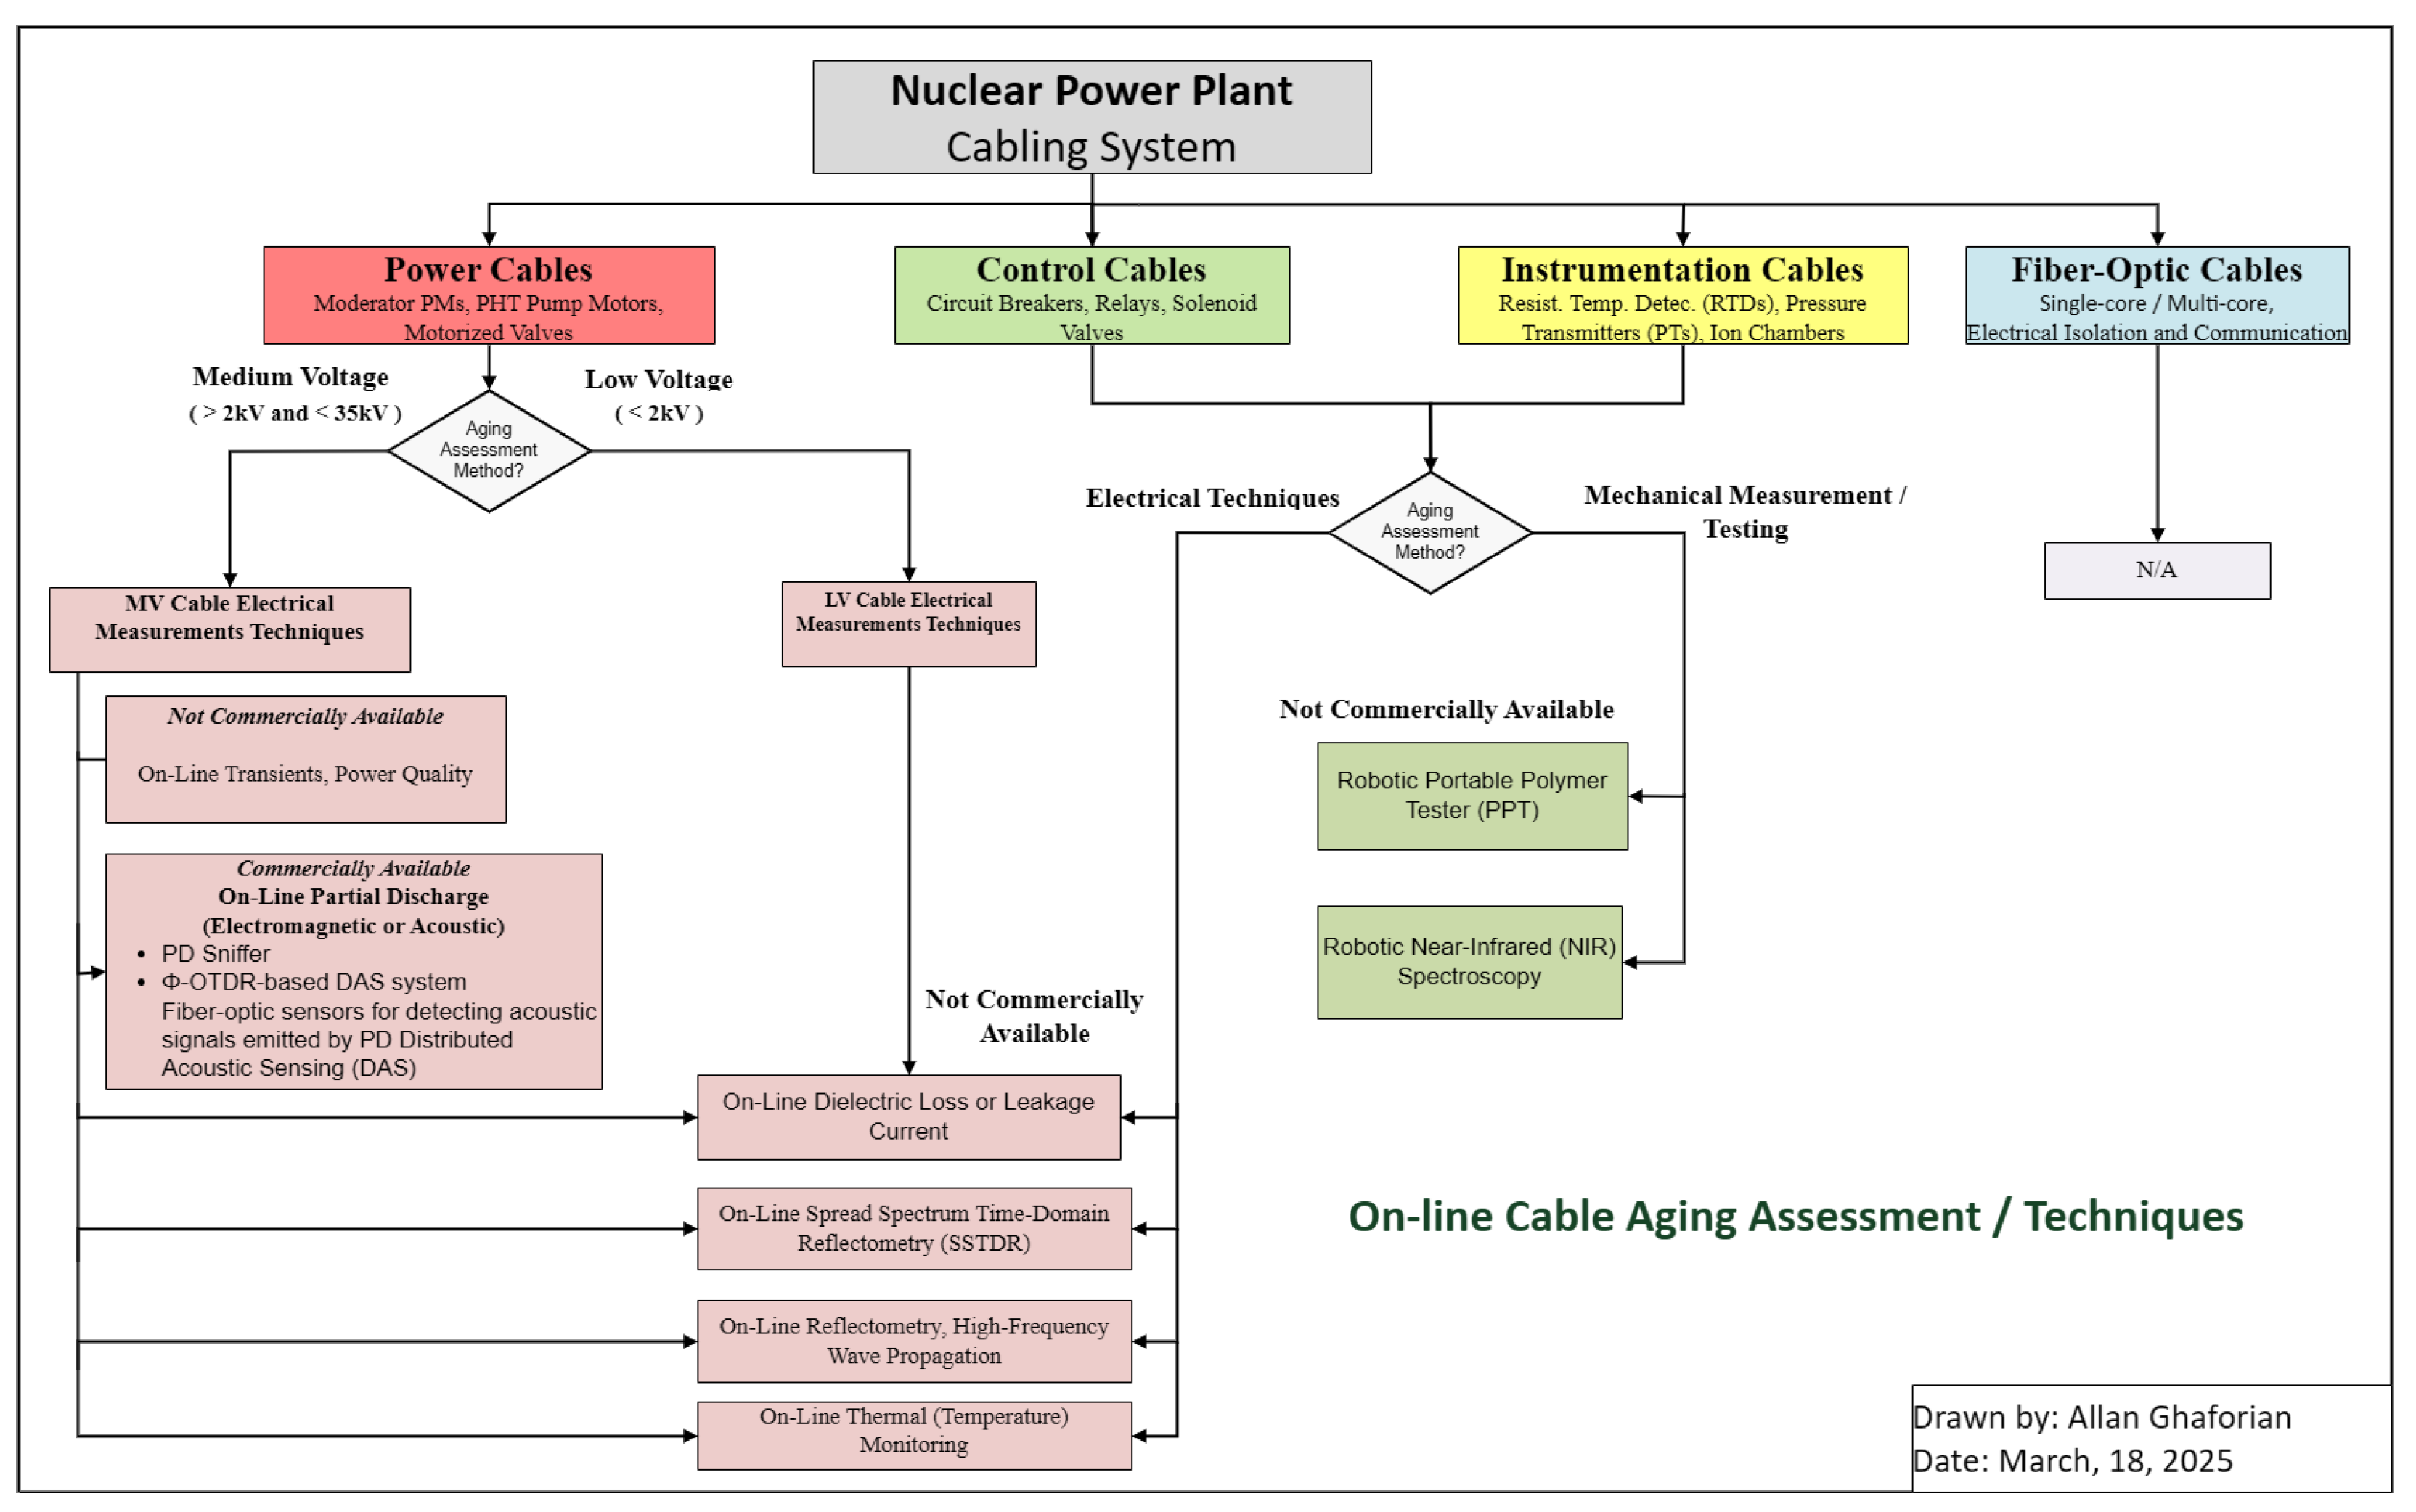
A summary of current on-line cable testing and aging assessment techniques is shown in
Figure 18. Some of these techniques may be applicable to LV cables only, some are for MV cables only, and some are for both.
Cable degradation rates vary across plant layouts due to diverse environmental exposures along routing paths. As a result, location-specific monitoring strategies are essential for comprehensive condition assessment. Because some cable segments are not readily accessible, on-line monitoring is generally more advantageous than off-line methods, as it eliminates the need to disconnect cables from service. However, the findings reveal that despite significant advancements, several limitations remain, particularly concerning non-intrusive monitoring in nuclear power plant environments.
Advanced on-line techniques (such as spread spectrum time-domain reflectometry and continuous dielectric loss monitoring) enable the real-time surveillance of cable condition during normal operation. This continuous monitoring provides a level of oversight not achievable with periodic off-line tests, allowing the earlier detection of degradation. More research is required to improve the accuracy and adaptability of these monitoring techniques to various types of cables and operating conditions. Furthermore, advances in AI-driven diagnostics offer promising paths for automating anomaly detection and improving long-term cable health predictions. Finally, fostering collaboration between industry and academia remains critical to driving innovation in cable condition monitoring and ensuring the development of robust, scalable, and more efficient cable monitoring solutions.
Author Contributions
A.G.: Background, Off-line Cable Condition Monitoring, Laboratory Measurement/Testing Techniques, In Situ Cable Assessment Techniques, Temperature (Thermal Monitoring), Surface Wave-based Reflectometry, Discussion/Conclusion; P.D.: Introduction, Spread Spectrum Time-Domain Reflectometry, Temperature (Thermal Monitoring), Dielectric Loss Monitoring; L.L.: Supervision, Review and Editing. All authors have read and agreed to the published version of the manuscript.
Funding
This research is funded by University Network of Excellence in Nuclear Engineering (UNENE) and Natural Sciences and Engineering Research Council of Canada (NSERC).
Data Availability Statement
No new data were created or analyzed in this study.
Conflicts of Interest
The authors declare no conflicts of interest.
References
- World Nuclear Association. Global Nuclear Industry Performance. World-Nuclear-Performance-Report. Placeholder Note Content. 2024. Available online: https://world-nuclear.org/our-association/publications/global-trends-reports/world-nuclear-performance-report-2024 (accessed on 8 January 2025).
- COP28. COP28: Declaration to Triple Nuclear Energy; Technical Report; Natural Resources Canada: Ottawa, ON, Canada, 2023. [Google Scholar]
- U.S. Energy Information Administration (EIA). Frequently Asked Questions; Technical Report; U.S. Energy Information Administration: Washington, DC, USA. Available online: https://www.eia.gov/tools/faqs/ (accessed on 11 March 2025).
- Ontario Power Generation. Pickering Nuclear Generating Station. Available online: https://www.opg.com (accessed on 8 January 2025).
- Sherman, N. Three Mile Island Nuclear Site to Reopen in Microsoft Deal; Technical report; BBC News: London, UK, 2024. [Google Scholar]
- Anadakumaran, K.; Braun, J.M.; DiPaul, J.A. Improved Conventional Testing of Power Plant Cables; Final Report, Technical Report; Electric Power Research Inst. (EPRI): Palo Alto, CA, USA; Ontario Hydro: Toronto, ON, Canada; AVO International: Blue Bell, PA, USA, 1995. [Google Scholar]
- Thue, W.A. Electrical Power Cable Engineering; CRC Press: Boca Raton, FL, USA, 2012; Chapter 1. [Google Scholar] [CrossRef]
- Mantey, A. Cable Polymer Material Handbook—Low Voltage Power and Control Cable; Technical report; EPRI: Palo Alto, CA, USA, 2017. [Google Scholar]
- Beauregard-Tellier, F.; Myers, L.C. The August 2003 Blackout; Library of Parliament: Ottawa, ON, Canada, 2004; Available online: https://publications.gc.ca/site/archivee-archived.html?url=https://publications.gc.ca/collections/Collection-R/LoPBdP/EB-e/prb0305-e.pdf (accessed on 11 March 2025).
- Wang, Q.; Sun, J.; Li, T.; Xiao, P. Study on the characteristics of elongation at break and tensile strength of photovoltaic insulating backsheets subjected to partial discharge degradation. AIP Adv. 2021, 11, 045305. [Google Scholar] [CrossRef]
- Abdulsalam, S. Alghamdi, R.K.D. A study of expected lifetime of XLPE insulation cables working at elevated temperatures by applying accelerated thermal ageing. Heliyon 2020, 6, e03120. [Google Scholar]
- Archodoulaki, V.M.; Lüftl, S.; Seidler, S. Oxidation induction time studies on the thermal degradation behaviour of polyoxymethylene. Polym. Test. 2006, 25, 83–90. [Google Scholar] [CrossRef]
- Hou, X.; Lv, S.; Chen, Z.; Xiao, F. Applications of Fourier transform infrared spectroscopy technologies on asphalt materials. Measurement 2018, 121, 304–316. [Google Scholar] [CrossRef]
- Gong, Y.; Chen, X.; Wu, W. Application of fourier transform infrared (FTIR) spectroscopy in sample preparation: Material characterization and mechanism investigation. Adv. Sample Prep. 2024, 11, 100122. [Google Scholar] [CrossRef]
- Ng, H.M.; Saidi, N.M.; Omar, F.S.; Ramesh, K.; Ramesh, S.; Bashir, S. Thermogravimetric Analysis of Polymers; Wiley: Hoboken, NJ, USA, 2018. [Google Scholar] [CrossRef]
- Levine, Y.; Chetrit, E.; Fishman, Y.; Siyum, Y.; Rabaev, M.; Fletcher, A.; Tartakovsky, K. A novel approach to plasticizer content calculation in an acrylonitrile-butadiene rubber real-time aging study (NBR). Polym. Test. 2023, 124, 108091. [Google Scholar] [CrossRef]
- Analysis and Measurement Services Corporation. Indenter for Cable Condition Monitoring. 2015. Available online: https://www.ams-corp.com/wp-content/uploads/2015/08/Indenter_with-spec-sheet.pdf (accessed on 10 March 2025).
- Toman, G.J.; Gazdzinski, R.F. Evaluation of Cable Polymer Aging Through Indenter Testing of in-Plant and Laboratory-Aged Specimens; Final Report. Technical Report; Electric Power Research Inst. (EPRI): Palo Alto, CA, USA; Ogden Environmental and Energy Services Co., Inc.: Blue Bell, PA, USA, 1996. [Google Scholar]
- Guerout, F.M.; Boor, R.G. Development of Indentation Techniques in Support of Cable Condition Monitoring Programs; PHWR Safety 2014; CANSAS-2014 Workshop: Ottawa, ON, Canada; Atomic Energy of Canada Limited: Chalk River, ON, Canada, 2014. [Google Scholar]
- Heigl, N.; Petter, C.H.; Rainer, M.; Najam-ul-Haq, M.; Vallant, R.M.; Bakry, R.; Bonn, G.K.; Huck, C.W. Near infrared spectroscopy for polymer research, quality control and reaction monitoring. J. Near Infrared Spectrosc. 2007, 15, 269–282. [Google Scholar] [CrossRef]
- Patel, P.; Sabane, S.; Atre, A.; Waghole, D. A Brief Review on Insulation Resistance Testing. 2023. Available online: https://www.researchgate.net/publication/371315822_A_brief_review_on_Insulation_Resistance_testing (accessed on 11 March 2025).
- Morsalin, S.; Phung, T. A comparative study of dielectric dissipation factor measurement under very low and power frequencies. In Proceedings of the 2017 3rd International Conference on Condition Assessment Techniques in Electrical Systems, Rupnagar, India, 16–18 November 2017; pp. 10–14. [Google Scholar] [CrossRef]
- Ghaforian, A.; Bornath, J. OPEX in Testing LV (Low Voltage) Ion Chamber Cables. EPRI Cable User Group & International Workshop on Age-Related Degradation of Cables, 12 June 2024. Available online: https://www.epri.com/events/8f985e7d-ad1d-4ba1-9d17-521946363726 (accessed on 11 March 2025).
- Glass, S.W.; Sriraman, A.; Prowant, M.S.; Spencer, M.P.; Fifield, L.S.; Kingston, S. Nondestructive Evaluation (NDE) of Cable Anomalies Using Frequency Domain Reflectometry (FDR) and Spread Spectrum Time Domain Reflectometry (SSTDR); Pacific Northwest National Laboratory: Richland, WA, USA, 2022. [Google Scholar]
- Shi, X.; Liu, Y.; Xu, X.; Jing, T. Online Detection of Aircraft ARINC Bus Cable Fault Based on SSTDR. IEEE Syst. J. 2021, 15, 2482–2491. [Google Scholar] [CrossRef]
- Huang, X.; Guo, Q.; Cai, C.; Chen, Y.; Ou, X.; He, C.; Ji, G. Fault Diagnosis and Location for Long Submarine Cable Based on Frequency Domain Refection. In Proceedings of the 2020 IEEE 4th Conference on Energy Internet and Energy System Integration (EI2), Wuhan, China, 30 October–1 November 2020; pp. 4047–4050. [Google Scholar]
- Li, Z.; Wu, K.; Yang, Z.; Wu, C.; Wang, F. Fault Diagnosis of Photovoltaic Array Based on BP Neural Network and SSTDR. In Proceedings of the 2023 IEEE PELS Students and Young Professionals Symposium (SYPS), Shanghai, China, 27–29 August 2023; pp. 1–6. [Google Scholar]
- Gao, C.; Wang, L.; Mao, J.; Hu, S.; Zhang, B.; Yang, S. Non-Intrusive Cable Fault Diagnosis Based on Inductive Directional Coupling. IEEE Trans. Power Deliv. 2019, 34, 1684–1694. [Google Scholar] [CrossRef]
- Hu, S.; Wang, L.; Mao, J.; Gao, C.; Zhang, B.; Yang, S. Synchronous Online Diagnosis of Multiple Cable Intermittent Faults Based on Chaotic Spread Spectrum Sequence. IEEE Trans. Ind. Electron. (1982) 2019, 66, 3217–3226. [Google Scholar] [CrossRef]
- Liu, D.; Feng, H.; Yang, H. A Novel Method Based on Spread-Spectrum Time-Domain Reflectometry for Improving the Distance of Cable Fault Detection. IEEE Sens. J. 2023, 23, 9440–9446. [Google Scholar] [CrossRef]
- Wu, P.; Ming, B.; Wang, Q. Online Aviation Cable Fault Detection based on Spread Spectrum Time Domain Reflectometry. In Proceedings of the 2019 IEEE 5th International Conference on Computer and Communications (ICCC), Chengdu, China, 6–9 December 2019; pp. 976–980. [Google Scholar]
- Alam, M.K.; Khan, F.H.; Johnson, J.; Flicker, J. PV arc-fault detection using spread spectrum time domain reflectometry (SSTDR). In Proceedings of the 2014 IEEE Energy Conversion Congress and Exposition (ECCE), Pittsburgh, PA, USA, 14–18 September 2014; pp. 3294–3300. [Google Scholar]
- Gazda, N.; Paulsen, B.; Edun, A.S.; Furse, C.M.; Harley, J.B. Reducing the Effects of Rain and Moisture on Spread Spectrum Time-Domain Reflectometry Monitoring of Photovoltaics. IEEE Sens. J. 2024, 24, 26181–26189. [Google Scholar] [CrossRef]
- Edun, A.S.; LaFlamme, C.; Kingston, S.R.; Furse, C.M.; Scarpulla, M.A.; Harley, J.B. Anomaly Detection of Disconnects Using SSTDR and Variational Autoencoders. IEEE Sens. J. 2022, 22, 3484–3492. [Google Scholar] [CrossRef]
- Edun, A.S.; Tumkur Jayakumar, N.K.; Kingston, S.R.; Furse, C.M.; Scarpulla, M.A.; Harley, J.B. Spread Spectrum Time Domain Reflectometry With Lumped Elements on Asymmetric Transmission Lines. IEEE Sens. J. 2021, 21, 921–929. [Google Scholar] [CrossRef]
- Kingston, S.R.; Flamme, C.L.; Saleh, M.U.; Ellis, H.; Benoit, E.; Edun, A.; Scarpulla, M.A.; Furse, C.M.; Harley, J.B. Spread Spectrum Time Domain Reflectometry (SSTDR) Digital Twin Simulation of Photovoltaic Systems for Fault Detection and Location. Prog. Electromagn. Res. Res. B 2021, 94, 105–126. [Google Scholar] [CrossRef]
- Xu, H.; Yang, S.; Wang, L.; Chen, H.; He, Z.; Chen, Y. Cable Online Fault Diagnosis Technology Based on ZCZ Spread Spectrum Sequence. In Proceedings of the 2024 Prognostics and System Health Management Conference (PHM), Stockholm, Sweden, 28–31 May 2024; pp. 287–292. [Google Scholar] [CrossRef]
- Steennis, F.; Wagenaars, P.; van der Wielen, P.; Wouters, P.; Li, Y.; Broersma, T.; Harmsen, D.; Bleeker, P. Guarding MV cables on-line: With travelling wave based temperature monitoring, fault location, PD location and PD related remaining life aspects. IEEE Trans. Dielectr. Electr. Insul. 2016, 23, 1562–1569. [Google Scholar] [CrossRef]
- Li, H.; Chen, Y.; Wang, X.; Wu, Y.; Zhang, J.; Xiong, W.; Xi, X.; Liang, F.; Wang, S. Temperature and Strain Decoupling Method Based on BOTDA and ROTDR. In Proceedings of the 2022 International Conference on Sensing, Measurement & Data Analytics in the era of Artificial Intelligence (ICSMD), Harbin, China, 30 November–2 December 2022; pp. 1–4. [Google Scholar]
- Doronin, M.; Dubitsky, S.; Greshnyakov, G.; Egupov, A. Increasing Reliability of XPLE-Insulated Cables: FEA-Based Ampacity Calculation and Online Monitoring of Insulation Degradation. In Proceedings of the 2021 IEEE Conference of Russian Young Researchers in Electrical and Electronic Engineering (ElConRus), St. Petersburg, Russia, 26–29 January 2021; pp. 1248–1251. [Google Scholar]
- Huang, X.; Li, Y.; Wu, C.; Lin, D.; Liu, Z.; Chen, Y.; Li, X.; Zhang, W.; Cai, C. Temperature Online Monitoring of Submarine Cable Based on BOTDA and FOCT. In Proceedings of the 2019 IEEE 3rd International Electrical and Energy Conference (CIEEC), Beijing, China, 7–9 September 2019; pp. 1229–1233. [Google Scholar]
- Shi, J. The research of power cable on-line measurement system based on fiber bragg grating sensor. Chem. Eng. Trans. 2016, 51, 1255–1260. [Google Scholar]
- Zhao, L.; Li, Y.; Xu, Z.; Yang, Z.; Lü, A. On-line monitoring system of 110kV submarine cable based on BOTDR. Sens. Actuators Phys. 2014, 216, 28–35. [Google Scholar] [CrossRef]
- Singh, R.S.; Cobben, S.; Ćuk, V. PMU-Based Cable Temperature Monitoring and Thermal Assessment for Dynamic Line Rating. IEEE Trans. Power Deliv. 2021, 36, 1859–1868. [Google Scholar] [CrossRef]
- de Clippelaar, S.; Kruizinga, B.; van der Wielen, P.C.J.M.; Wouters, P.A.A.F. Wave-Velocity Based Real-Time Thermal Monitoring of Medium-Voltage Underground Power Cables. IEEE Trans. Power Deliv. 2024, 39, 983–991. [Google Scholar] [CrossRef]
- Liu, Y.; Xiong, H.; Xiao, H. Detecting XLPE cable insulation damage based on distributed optical fiber temperature sensing. Opt. Fiber Technol. 2022, 68, 102806. [Google Scholar] [CrossRef]
- Zhang, Y.; Yu, F.; Ma, Z.; Li, J.; Qian, J.; Liang, X.; Zhang, J.; Zhang, M. Conductor Temperature Monitoring of High-Voltage Cables Based on Electromagnetic-Thermal Coupling Temperature Analysis. Energies 2022, 15, 525. [Google Scholar] [CrossRef]
- COMSOL Multiphysics Software. Available online: https://www.comsol.com (accessed on 11 March 2025).
- Wang, K.; Ma, Z.; Zhang, J.; Shuai, W.; Sun, B.; Zhang, M. High Spatial Resolution Sensing of Temperature and Strain Without Cross Sensitivity Based on Chaotic Brillouin Dynamic Grating. IEEE Sens. J. 2023, 23, 9317–9322. [Google Scholar] [CrossRef]
- Wang, Y.; Chen, P.; Feng, C.; Cao, J. An Online Monitoring Method for Low-Frequency Dielectric Loss Angle of Mining Cables. Sensors 2023, 23, 4273. [Google Scholar] [CrossRef]
- Wu, Y.; Yang, Y.; Lin, Q.; Zhang, Q.; Zhang, P. Online Monitoring for Underground Power Cable Insulation Based on Resonance Frequency Analysis Under Chirp Signal Injection. IEEE Trans. Ind. Electron. 2023, 70, 1961–1972. [Google Scholar] [CrossRef]
- Wu, Y.; Wei, Z.; Yang, Y.; Zheng, D.; Zhang, P. An Online Segmental Ageing Detection Method for Underground Power Cables Based on Common-Mode Leakage Current Measurements. In Proceedings of the IECON 2022—48th Annual Conference of the IEEE Industrial Electronics Society, Brussels, Belgium, 17–20 October 2022; pp. 1–6. [Google Scholar] [CrossRef]
- Wu, Y.; Zhang, P. A Novel Online Monitoring Scheme for Underground Power Cable Insulation Based on Common-Mode Leakage Current Measurement. IEEE Trans. Ind. Electron. 2022, 69, 13586–13596. [Google Scholar] [CrossRef]
- Wu, Y.; Yang, Y.; Wang, Z.; Zhang, P. Online Monitoring for Underground Power Cable Insulation Based on Common-Mode Signal Injection. IEEE Trans. Ind. Electron. 2022, 69, 7360–7371. [Google Scholar] [CrossRef]
- MATLAB Software. Available online: https://www.mathworks.com (accessed on 11 March 2025).
- Meng, P.; Li, T.; Zhou, K.; Zhu, G.; Tang, Z.; Fu, Y. Online Monitoring of the Cable Insulation State Based on the Impulse Impedance Spectrum. IEEE Trans. Instrum. Meas. 2024, 73, 3501111. [Google Scholar] [CrossRef]
- PSCAD Software. Available online: https://www.pscad.com (accessed on 11 March 2025).
- Xiaofeng, D.; Zhiyong, Y.; Jingru, H.; Hao, B.; Jianbin, H.; Wei, L. A New Method to Solve Relative Dielectric Constant of 10kV Three-Core Cables Based on Two-Terminal Zero Sequence Voltage. In Proceedings of the 2022 IEEE 6th Conference on Energy Internet and Energy System Integration (EI2), Chengdu, China, 11–13 November 2022; pp. 1518–1524. [Google Scholar] [CrossRef]
- Wang, X.; Arman, A.S.; Ali, M.; Zhang, B. Cable Insulation Aging Simulation. In Proceedings of the IECON 2021—47th Annual Conference of the IEEE Industrial Electronics Society, Toronto, ON, Canada, 13–16 October 2021; pp. 1–6. [Google Scholar] [CrossRef]
- Jie, Q.; Yang, Q.; Zhang, Y.; Cui, H. Diagnosis of overall 10kV cable insulation state based on transient voltage transfer characteristics. In Proceedings of the 2021 International Conference on Electrical Materials and Power Equipment (ICEMPE), Chongqing, China, 11–15 April 2021; pp. 1–5. [Google Scholar] [CrossRef]
- Li, L.; Yong, J.; Xu, W. On-Line Cable Condition Monitoring Using Natural Power Disturbances. IEEE Trans. Power Deliv. 2019, 34, 1242–1250. [Google Scholar] [CrossRef]
- Hua, X.; Wang, L.; Zhang, Y. Analysis and Diagnosis of Shielded Cable Faults Based on Finite-Element Method and Time-Reversal Time-Frequency Domain Reflectometry. IEEE Trans. Ind. Electron. (1982) 2022, 69, 4205–4214. [Google Scholar] [CrossRef]
- Wu, Y.; Zhang, P.; Lu, G. Detection and Location of Aged Cable Segment in Underground Power Distribution System Using Deep Learning Approach. IEEE Trans. Ind. Informat. 2021, 17, 7379–7389. [Google Scholar] [CrossRef]
- Hu, R.; Xu, H.; Lu, X.; Wang, A.; Xu, Z.; Wang, Y.; Zhang, D. Research on live detection technology of distribution network cable insulation deterioration state based on harmonic components. IET Gener. Transm. Distrib. 2024, 18, 2847–2859. [Google Scholar] [CrossRef]
- Xu, F.; Zheng, H.; Wang, C.; Guo, K.; Liu, J.; Fan, L.; Shu, Q.; Chen, L.; Fei, J.; Ma, Z. Online Cable Insulation Condition Evaluation Using Harmonic Measurement Data. IEEE Trans. Instrum. Meas. 2024, 73, 9004213. [Google Scholar] [CrossRef]
- Liu, J.; Lee, C.K.; Pong, P.W.T. Online Short-Circuit Fault Diagnosis in Three-Core Power Distribution Cable Based on Magnetic Pattern. IEEE Sens. J. 2023, 23, 21832–21841. [Google Scholar] [CrossRef]
- Xiang, D.; Zhu, S.; Li, H.; Gao, P.; Zheng, Y. Online Monitoring of Cable Insulation Degradation for Inverter-Fed Machine System Using PWM Switching Oscillations. IEEE Trans. Ind. Electron. (1982) 2023, 70, 11714–11724. [Google Scholar] [CrossRef]
- Zhou, L.; Chen, Q.; Li, H.; Yang, S.; Pang, D.; Deng, H. A Non-Contact Micro-Ampere DC Current Digital Sensor Based on the Open-Loop Structure. IEEE Sens. J. 2021, 21, 5923–5931. [Google Scholar] [CrossRef]
- Zhou, S.; Li, L.; Zhao, Z.; Tu, J.; Zeng, H.; Wang, H. Synchronization Method of Sheath and Load Current Distributed Online Monitoring in Cross-Bonded Cable Systems. In Proceedings of the 2023 3rd Power System and Green Energy Conference (PSGEC), Shanghai, China, 24–26 August 2023; pp. 1158–1162. [Google Scholar]
- Shafiq, M.; Kauhaniemi, K.; Robles, G.; Isa, M.; Kumpulainen, L. Online condition monitoring of MV cable feeders using Rogowski coil sensors for PD measurements. Electr. Power Syst. Res. 2019, 167, 150–162. [Google Scholar] [CrossRef]
- da Costa, I.B.V.; Weber, G.H.; Gomes, D.F.; Galvão, J.R.; da Silva, M.J.; Pipa, D.R.; Ozcáriz, A.; Zamarreño, C.R.; Martelli, C.; Cardozo da Silva, J.C. Electric discharge detection and localization using a distributed optical fiber vibration sensor. Opt. Fiber Technol. 2020, 58, 102266. [Google Scholar] [CrossRef]
- Toman, G.J.; Fantoni, P.F. Cable Aging Assessment and Condition Monitoring Using Line Resonance Analysis (LIRA). In Proceedings of the International Conference on Nuclear Engineering, Orlando, FL, USA, 11–15 May 2008; pp. 177–186. [Google Scholar] [CrossRef]
- Ohki, Y.; Hirai, N. Location feasibility of degradation in cable through Fourier transform analysis of broadband impedance spectra. Electr. Eng. Jpn. 2013, 183, 1–8. [Google Scholar] [CrossRef]
- Arman, A.S.; Glass, S.W.; Fifield, L.S.; Ali, M. Non-Conductor-Contact Surface Wave Reflectometry for Cable Insulation Damage Detection. IEEE Sens. J. 2022, 22, 11065–11074. [Google Scholar] [CrossRef]
| Disclaimer/Publisher’s Note: The statements, opinions and data contained in all publications are solely those of the individual author(s) and contributor(s) and not of MDPI and/or the editor(s). MDPI and/or the editor(s) disclaim responsibility for any injury to people or property resulting from any ideas, methods, instructions or products referred to in the content. |
© 2025 by the authors. Licensee MDPI, Basel, Switzerland. This article is an open access article distributed under the terms and conditions of the Creative Commons Attribution (CC BY) license (https://creativecommons.org/licenses/by/4.0/).


